1. Introduction
Object detection systems (ODS) based on artificial intelligence (AI) can perform various tasks, including locating, tracking, and counting objects, as well as detecting anomalies. They are thus finding numerous applications for computer vision (CV) in the real world [
1], ranging from facial recognition [
2] to animal monitoring [
3] to defect detection [
4]. However, despite recent progress in AI-based object detection systems, their integration into real-world safety-critical systems, such as autonomous cars or medical diagnosis, raises concerns about their reliability in practice. Indeed, deep learning models used in these systems have been shown to be sensitive not only to perturbations imperceptible to humans [
5], but also to natural or common perturbations that may occur during their real-world operation [
6,
7]. Robustness is, therefore, described as a key requirement for high-risk AI systems in the Artificial Intelligence Act (AI Act), the proposed European Union regulation on artificial intelligence.
To meet the need for robustness assessment, several methods have been proposed to test the robustness of image-based object detection models [
8,
9], usually by measuring their performance against perturbed input images, an instance of the so-called metamorphic testing technique [
10,
11]. However, while these methods are suitable for assessing the robustness of deep learning models, they can be difficult to apply in practice due to the lack of guidelines to adapt them to the specificities of the system under test. In previous work [
12], we tested the robustness of an industrial AI-based road object detection system through metamorphic testing and identified several challenges in the design and execution of the tests in practice, such as in the selection of relevant perturbations or appropriate metrics. Among other lessons, we learned that it may be necessary to adapt the test method through domain knowledge while remaining sufficiently generic to be able to compare the results from one system to another. Therefore, a method with clear guidelines is needed to ensure that the robustness assessment is relevant and rigorous and that the results are comparable.
Motivated by our previous industrial case study, we propose a method for the robustness assessment of AI-based 2D object detection systems from a practitioner’s perspective. It should allow image-based ODSs to be evaluated in a black-box setting, which is usually a strong constraint in an industrial context or in real-world scenarios. The method was developed and evaluated through two cycles of action research [
13] during which we assessed the robustness of two industrial AI-based object detection systems—a road monitoring system and a medical diagnosis system. In particular, these two industrial cases helped us to identify issues encountered when testing the robustness of AI-based systems, and to find ways of addressing them. The proposed method defines the overall robustness testing process based on metamorphic testing, which is currently one of the most popular techniques for testing machine learning-based systems [
14,
15]. Furthermore, it identifies a set of complementary steps and metrics to be used in order to support the application of metamorphic testing and overcome issues encountered in practice. Finally, a metamorphic relation for assessing robustness is defined, which reflects the acceptable trade-off between the distance between sets of circumstances and the difference in performance.
In summary, after giving an overview of AI-based object detection systems and metamorphic testing (
Section 2), and presenting the two industrial cases (
Section 3) as well as the research method followed (
Section 4), this paper makes the following original research and engineering contributions:
A metrics-driven method for the robustness testing of AI-based 2D object detection systems (
Section 5), including a combination of relevant metrics and the definition of a metamorphic relation for assessing robustness.
A prototype tool to assist practitioners in applying the proposed method and analyzing the results obtained (
Section 6).
An extensive evaluation of the proposed method on an industrial case (
Section 7).
Then, we address threats to validity in
Section 8.
Section 9 presents related work, from reference systems to other methods and frameworks for testing the robustness of AI-based systems. Finally, we present the conclusions and future work in
Section 10.
4. Research Method
The method presented in this paper was developed iteratively and evaluated through action research [
13]. Action research aims “to study a system and concurrently to collaborate with members of the system in changing it in what is together regarded as a desirable direction” [
26].
Susman [
27] developed a detailed model of the action research method. It is thus, an iterative process in which each research cycle has five stages: diagnosing, action planning, taking action, evaluating, and specifying learning. In the diagnosing stage, the problem is defined and the data required to carry out a detailed diagnosis are collected. During the action planning stage, possible solutions are identified to address the problem. Then, in the taking action stage, one of the solutions is selected and implemented. Data resulting from the application of the chosen solution are collected and analyzed during the evaluating stage. Finally, the specifying learning stage allows stakeholders to interpret the findings, with respect to the success or failure of the solution. At this point, a new cycle of the action research process begins and the problem is re-evaluated in the diagnosing stage. This process continues until the problem is solved and the stakeholders are satisfied with the result.
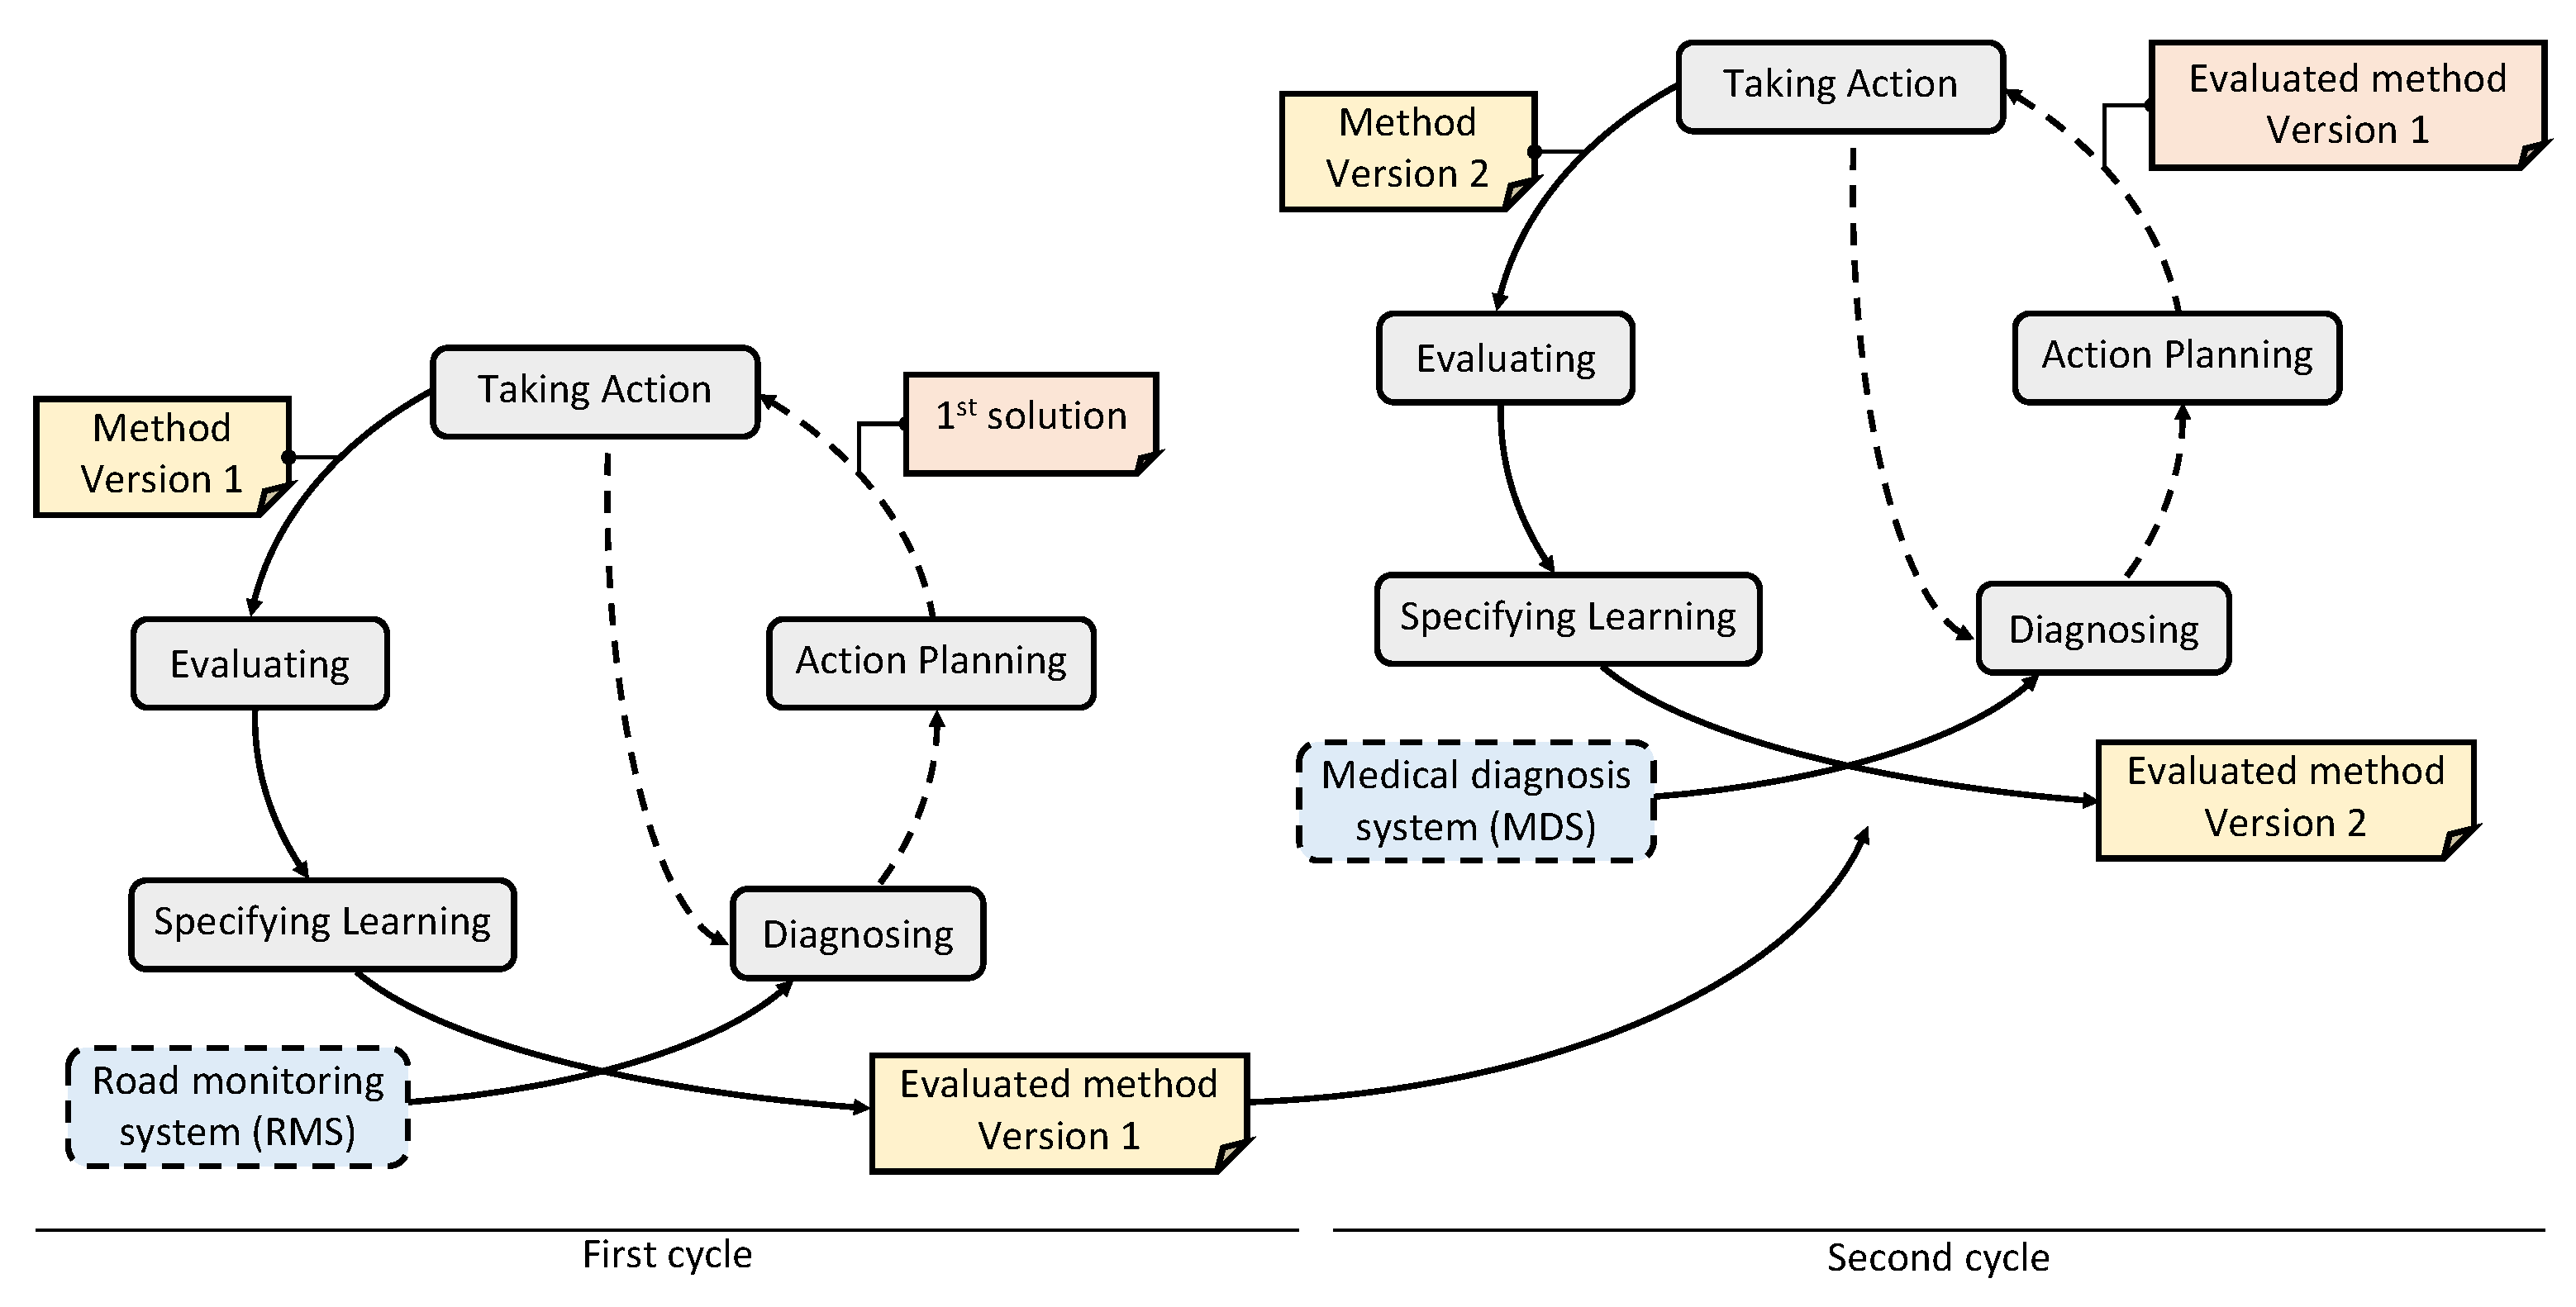
To build this method, we carried out two cycles of the action research method, as presented in
Figure 4. Each cycle corresponds to the evaluation of the robustness of a different industrial object detection system.
In the first cycle, we identified the metrics to be included in a method for the robustness assessment of AI-based object detection systems. As a starting point, we used the results of a previous study in which we performed the robustness assessment of the road monitoring system (RMS) using a state-of-the-art approach [
12]. This study allowed us to confirm the effectiveness of the metamorphic testing approach in that context, and to identify the shortcomings and gaps in the methodology regarding the metrics and domain knowledge. To address those issues and elaborate a first solution for the method, we used the Goal Question Metric (GQM) approach [
28,
29] during the taking action stage. The GQM method is a top-down approach to developing goal-oriented measurements. It defines a goal, refines this goal into questions, and defines metrics to answer these questions. An advantage of this approach is that it limits the measurements collected to what is strictly necessary since each metric is justified by an objective. Based on the questions defined in the GQM model, we also adapted and completed the test method derived from the case study. The resulting method was then evaluated and improved in the next cycle.
In the second cycle, we improved the overall robustness assessment process presented in this paper. To do so, we inspected the evaluated first version of the metrics-driven method by assessing the robustness of the medical diagnosis system (MDS). During the taking action stage, we further detailed the different steps in the testing process, incorporating new guidelines based on feedback from practitioners. This new use case also allowed us to validate that the method and the recommended metrics can be successfully applied to another domain.
5. The Method
In this section, we introduce a method for robustness assessment of ODS by presenting, in detail, the definition of the goal and questions of the GQM approach, the overall robustness testing process, and the choice of metrics at each step.
5.1. Overview
The aim of our method is to provide clear guidelines for the assessment of the robustness of AI-based 2D object detection systems during their life-cycle. In GQM terms, this translates to the following goal:
Following Solingen et al. [
29] guidelines, we define several questions to characterize this goal in a quantifiable way, summarized in
Table 1.
The first group of questions aims to characterize the object of the GQM model, i.e., an object detection model, with respect to the overall goal and the issue. To do so, we use the definition of robustness, which is, according to ISO/IEC TR 24029-1:2021 [
30], the “ability of an AI system to maintain its level of performance under any circumstances”. Thus, the object of our GQM model can be decomposed along two axes: the performance of the system on the one hand, and the circumstances of its use on the other. The first two questions, therefore, relate to the measurement of the system’s performance and the description of the circumstances (see Q1 and Q2 in
Table 1).
A second group of questions seeks to further characterize these attributes, i.e., performance and circumstances. To this end, Q3 aims to assess the significance or impact of a given circumstance on the functioning of the system. In addition, Q4 focuses on the differences between sets of circumstances, as comparing them can provide a good idea of their characteristics. Similarly, one way to characterize the performance of the system is to analyze its evolution by comparing performance measures under different sets of circumstances, and so this is the subject of Q5.
Finally, a question characterizes the relationship between performance and circumstances to establish the robustness of the system and achieve the overall goal of the GQM model (see Q6 in
Table 1).
Each of these questions is answered at a different stage of the robustness assessment process, for which several metrics are recommended.
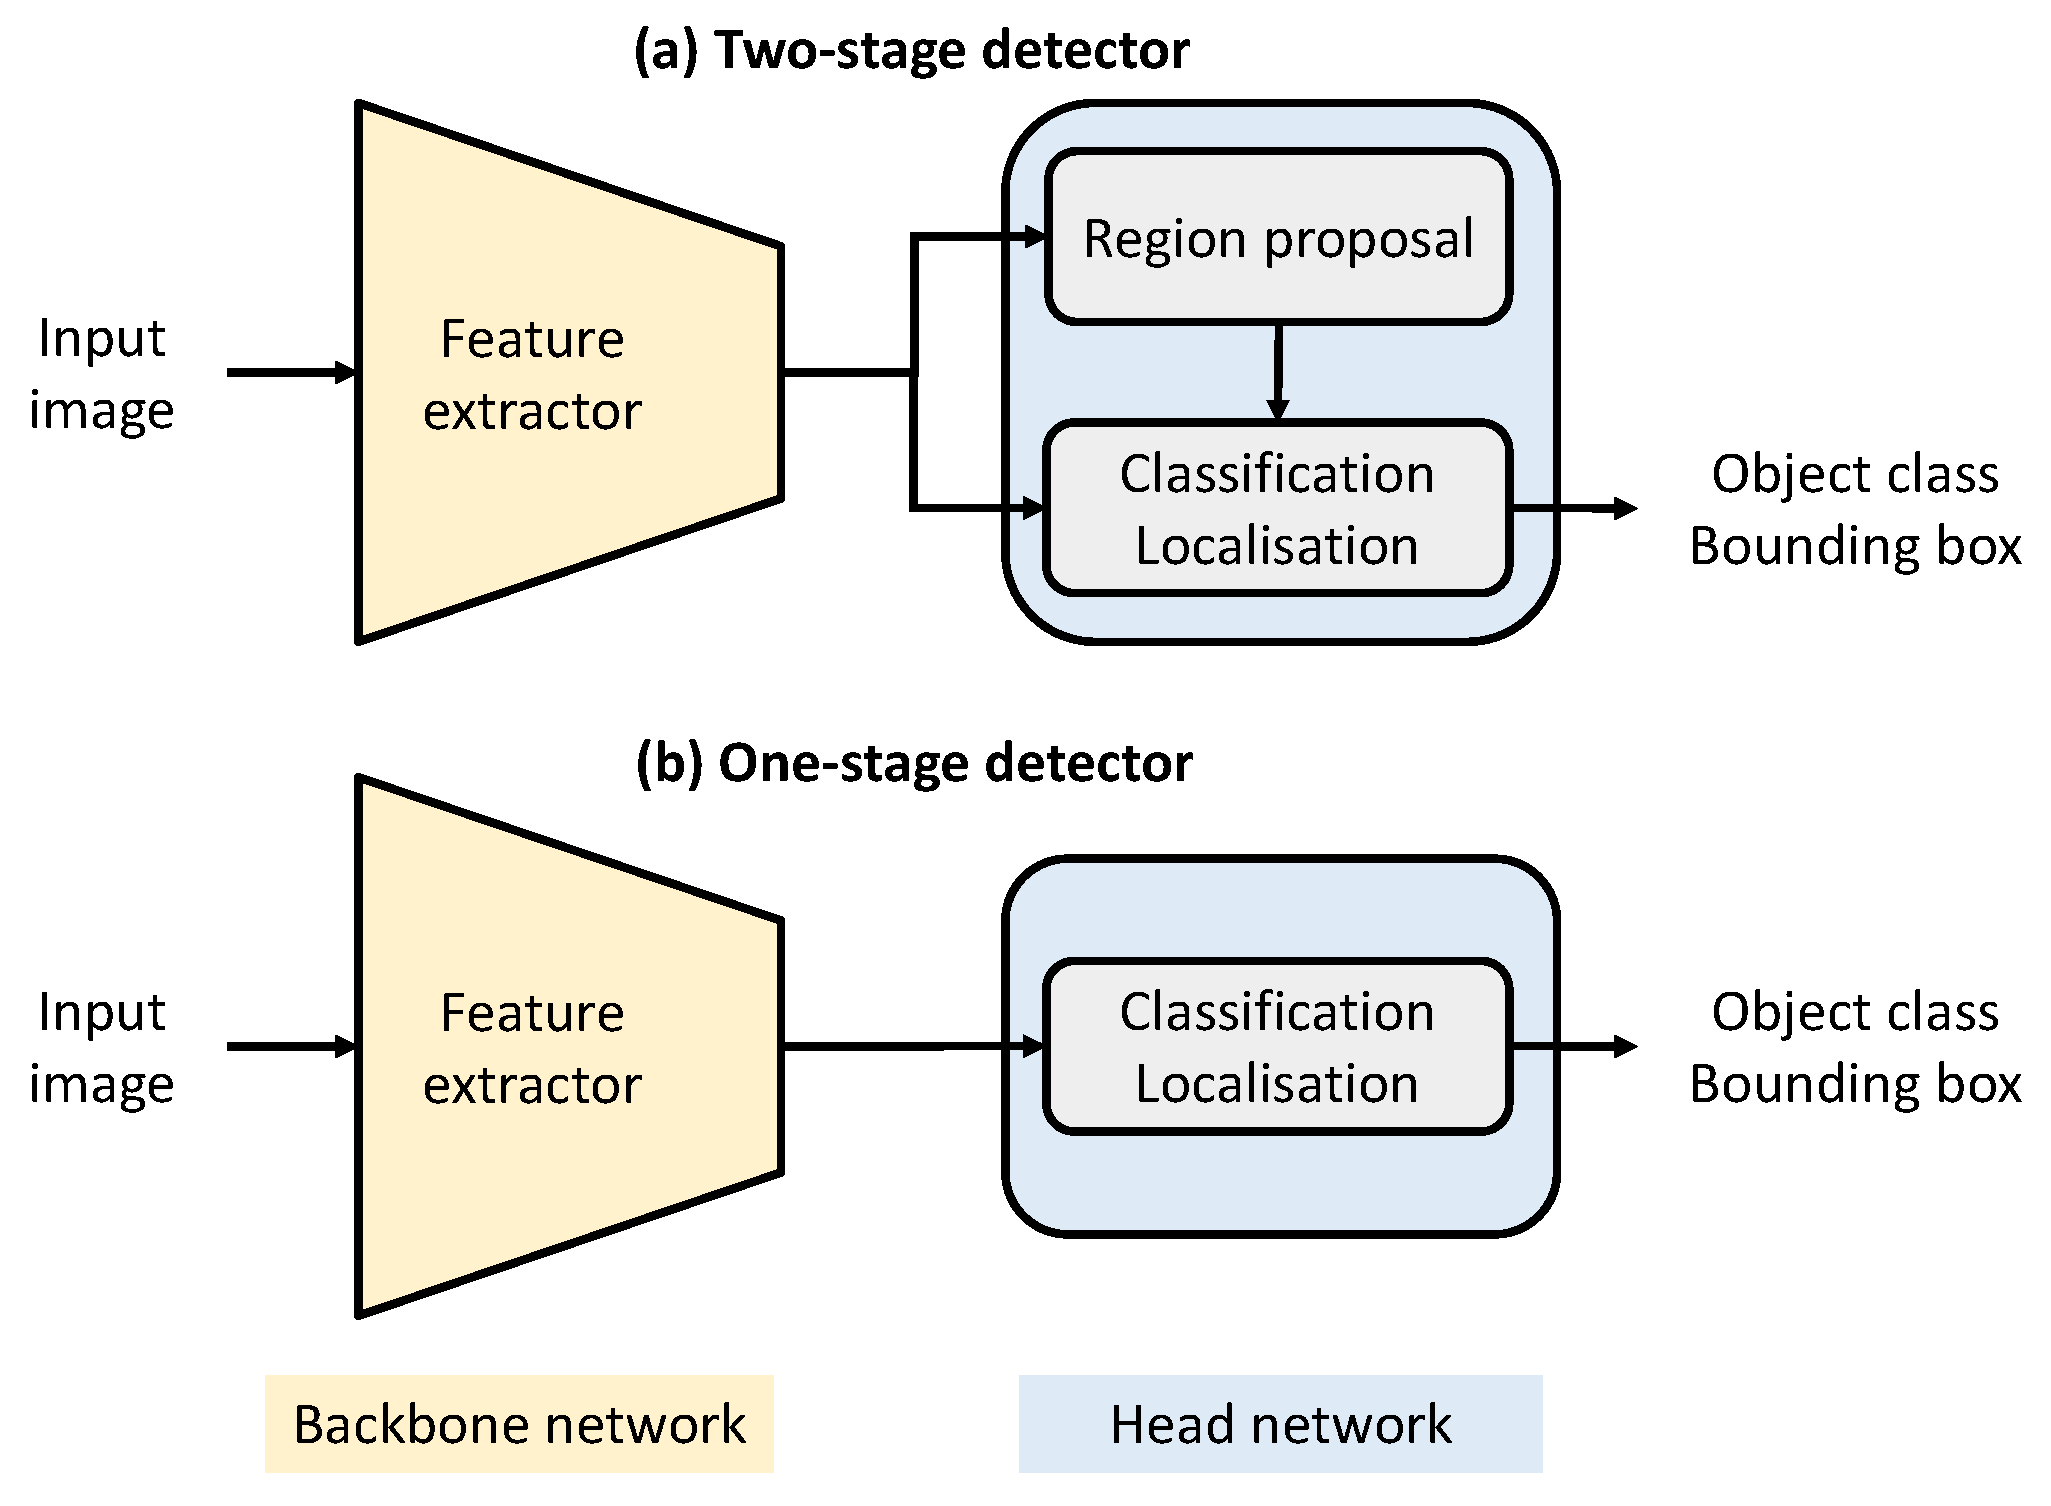
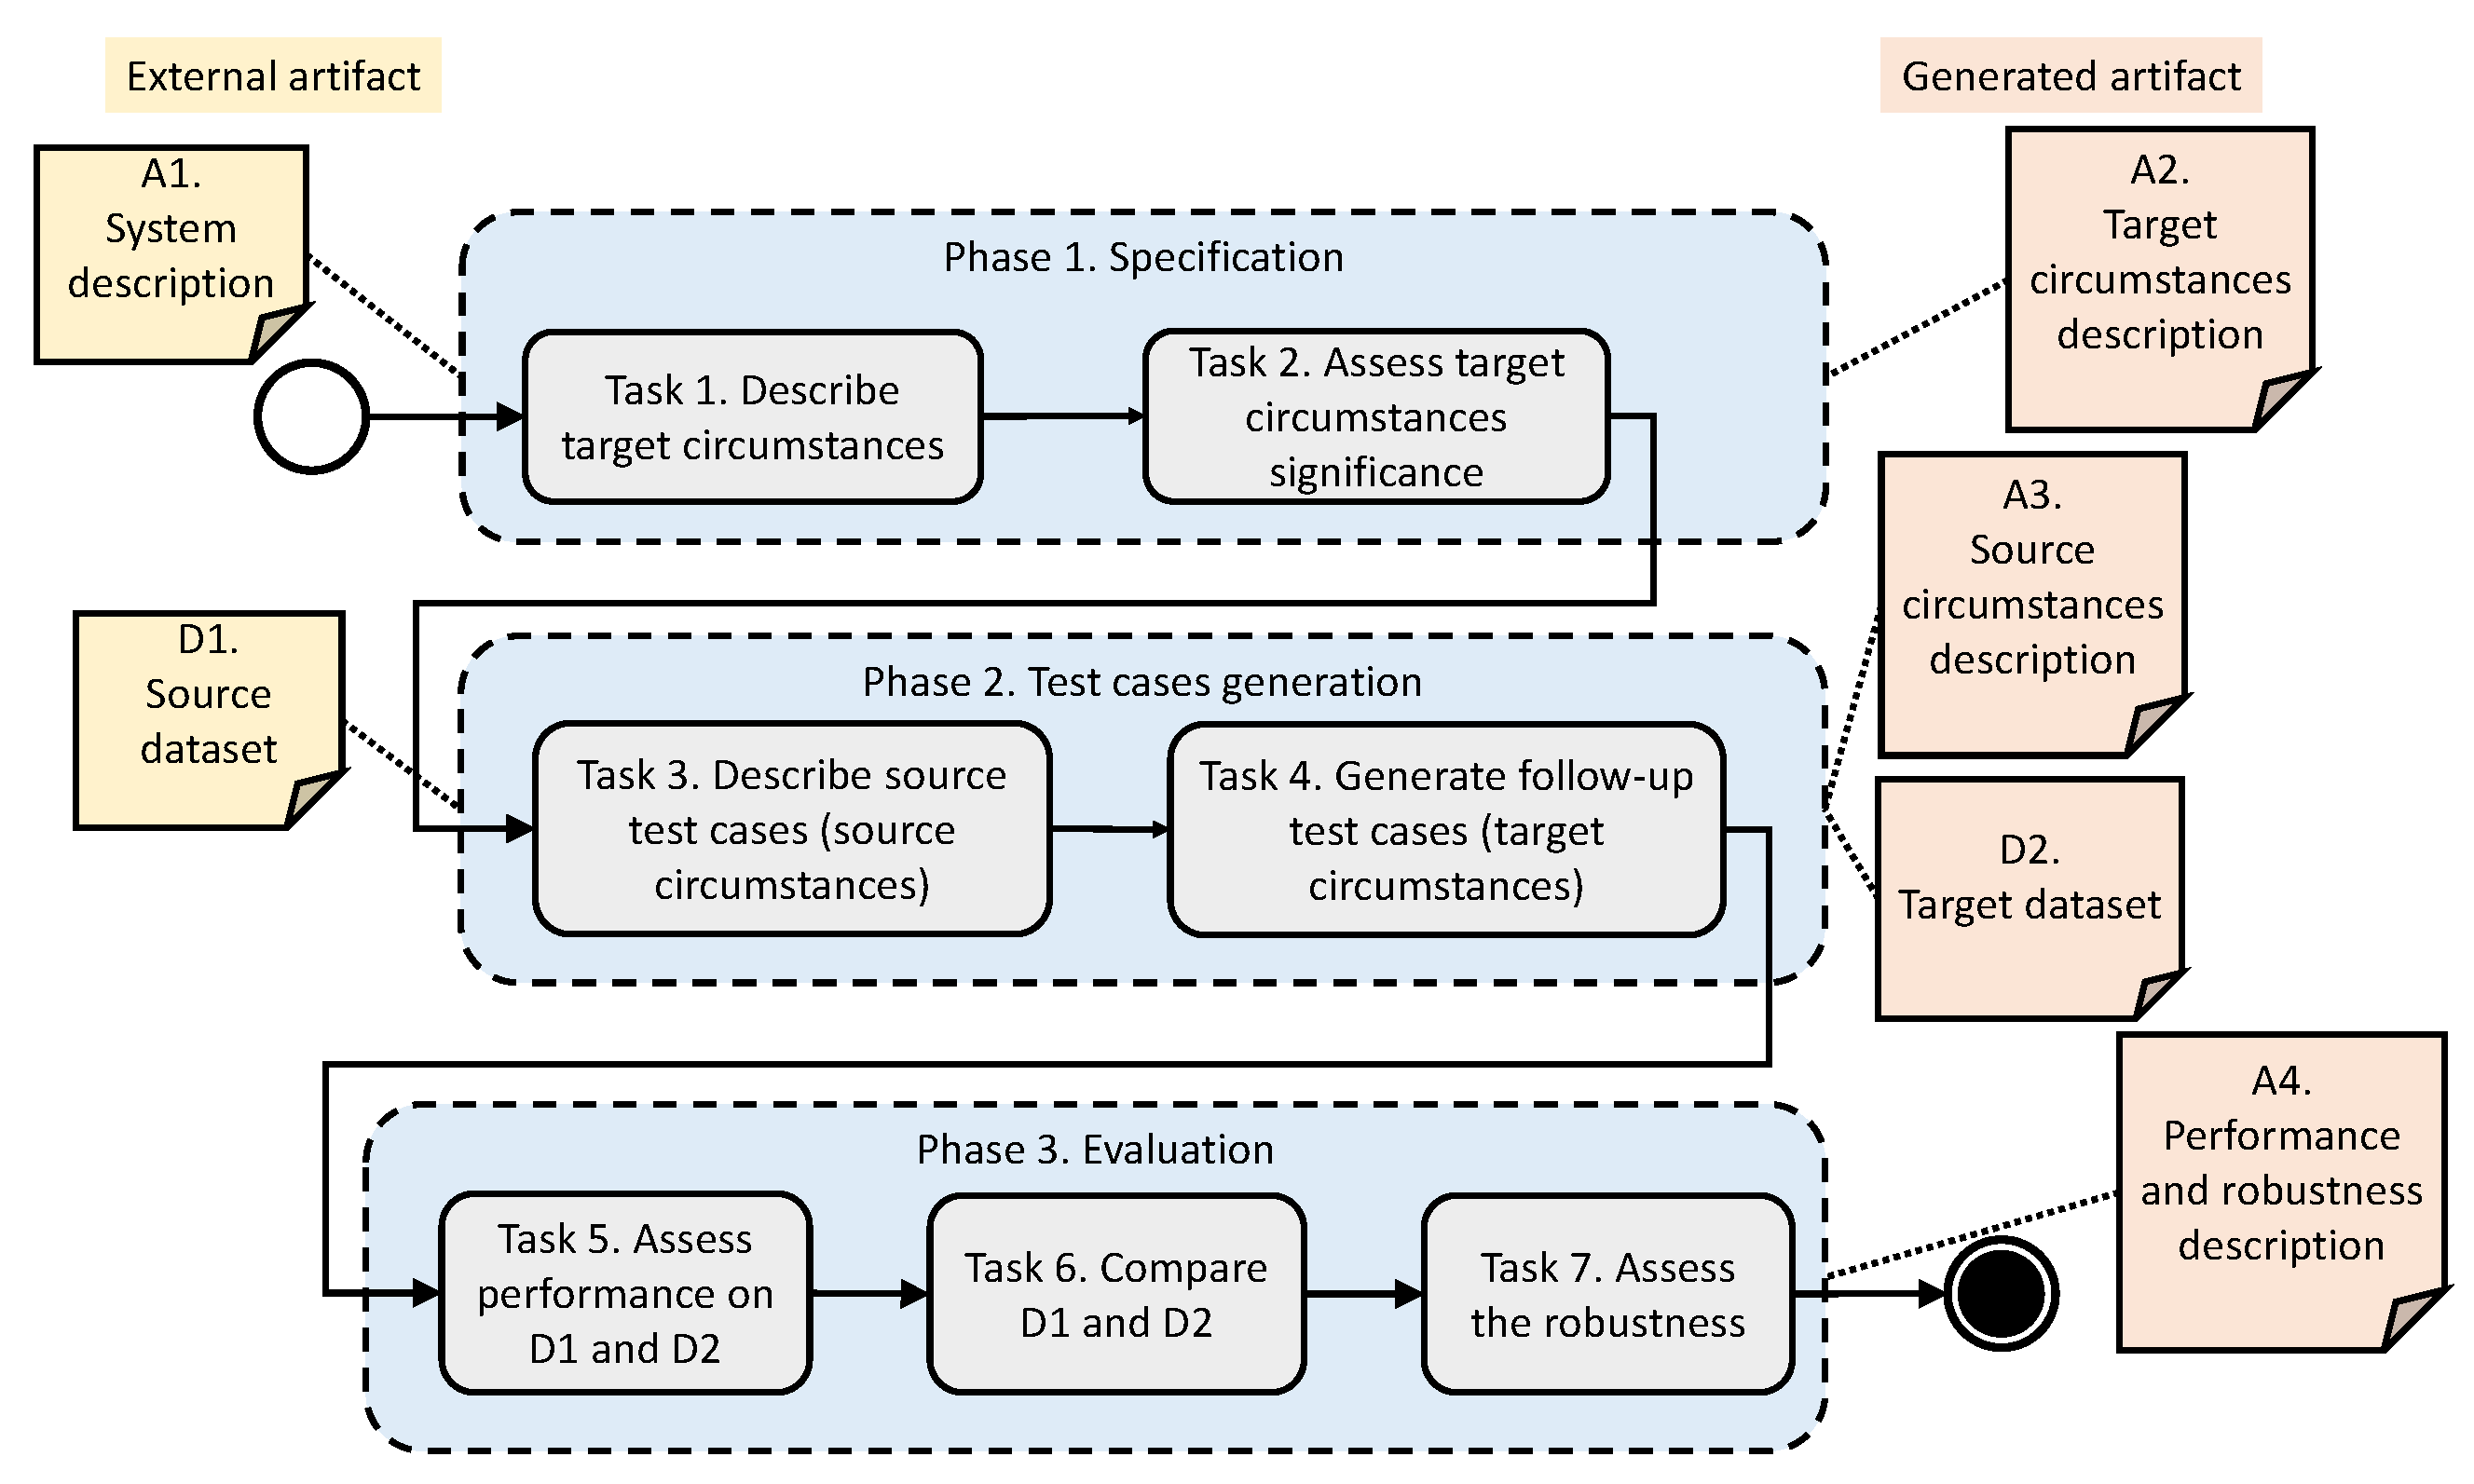
Figure 5 presents the overall process, based on metamorphic testing, which is currently one of the most effective techniques for testing machine learning-based systems [
14,
15]. The process has three main phases: the
specification phase establishes references for the tests (target circumstances and their significance for the system), the
test case generation phase allows the generation of test cases in target circumstances, and the
evaluation phase assesses the robustness by comparing the source circumstances (resp. performance) with the target circumstances (resp. performance).
In the following, we review each task of the process and associate each question of the GQM model with a set of appropriate metrics.
5.2. Task 1. Describe Target Circumstances
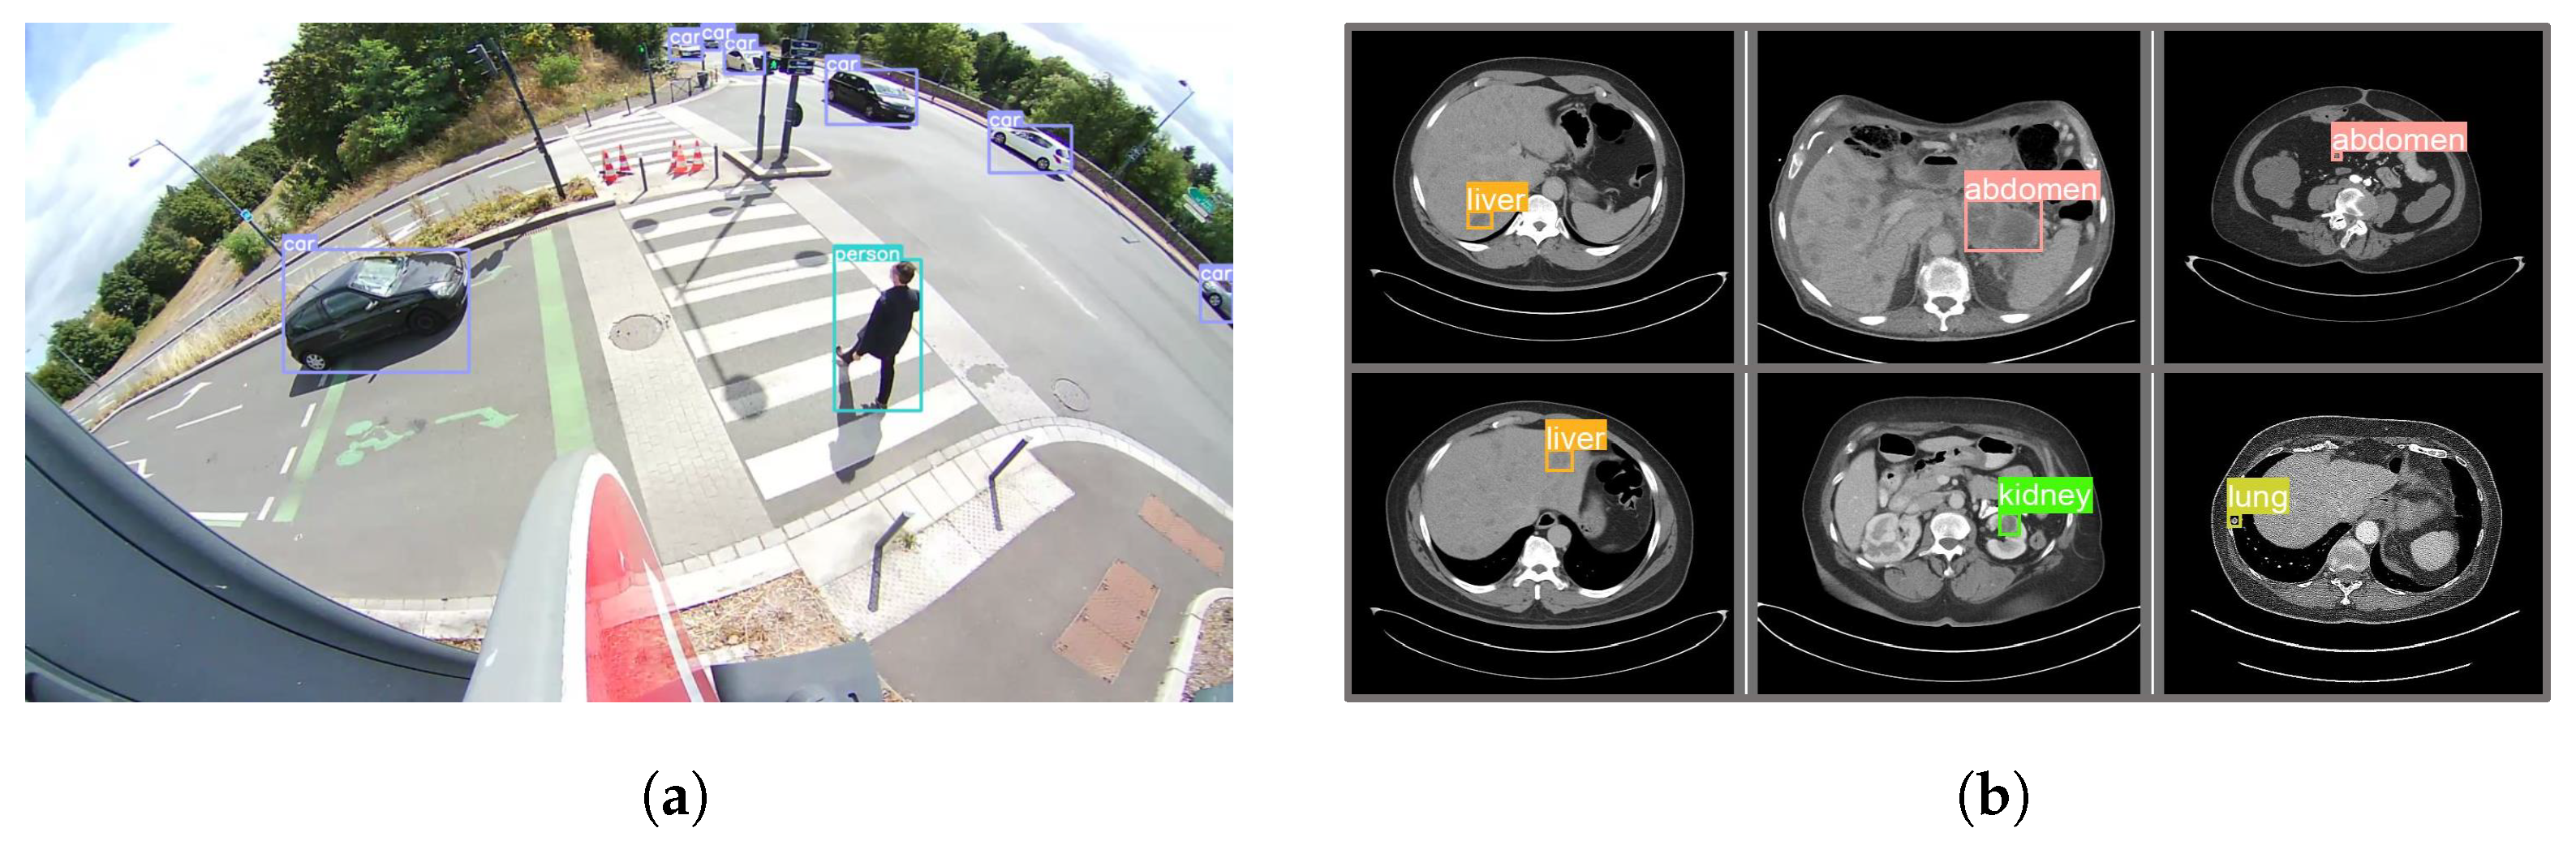
The aim of this task is to provide a statistical or probabilistic description of the target circumstances of use of the system, based on a description of the system and its environment. Target circumstances are the set of circumstances against which a practitioner wishes to assess the robustness of an AI-based system. For example, considering the MDS case, target circumstances could be misuses of the scanner, such as a patient moving during the scan.
In fact, according to ISO/IEC TR 24029-1:2021 [
30], the aim of robustness testing should be to evaluate the system’s performance against atypical data, different from that expected under operational conditions. Target circumstances should, therefore, be distinguished from the operational design domain (ODD) which is the set of operational conditions under which the system is designed to function [
31,
32]. In particular, the target circumstances must include potential hazards that the system may face during operation (e.g., change of input data domain or hardware failure). Several works address the issue of finding hazards in the field of computer vision (CV). For example, Zendel et al. [
33] built a checklist of more than a thousand potential hazards in CV systems, not only in the vision algorithm itself but also in the equipment with which it interacts and the environment observed by the system.
In practical terms, the description of the target circumstances serves as a reference during the robustness assessment for selecting and generating follow-up test cases. In this step, not only are the possible circumstances listed, but also their distribution is described, either by knowing their probability (M1) or by measuring their relative frequency (M2) within a real-world representative data sample (see
Table 2). It is important to note that the sum of the relative frequencies or probabilities of the circumstances does not necessarily have to be 1, especially when circumstances are not mutually exclusive and may occur simultaneously. For example, in the MDS case, a different scanner may be used, resulting in a different density contrast, while the patient may be incorrectly positioned, leading also to a rotated cross-sectional image. On the other hand, if the circumstances are mutually exclusive (i.e., cannot occur simultaneously), the sums are expected to equal 1. For example, this is the case when circumstances are defined in relation to the time of day.
Note, that the target circumstances can be defined at several levels, depending on the point of view adopted (e.g., the end user or the developer). We recommend that this step be carried out from different perspectives, as they are often complementary. As an example,
Table 3 shows target circumstances for the MDS case study from the point of view of a radiographer and from the point of view of the developer of the AI model that performs the object detection. In the first case, the circumstances relate to the way the image acquisition system is used, i.e., the scanner. In the second case, the circumstances relate to the directly observed impact on the images. In that case, each high-level circumstance defined by the radiographer can be associated with one or more circumstances defined by the developer, as in the above example (
Box 1).
Consider, for the MDS case, the following (hypothetical) context of use, based on discussions with a practitioner in the field.
MDS may be used on images from different scanners. This can have a visible impact on the images, which can be estimated experimentally. In our case, we estimate that in 15% of cases, the radiographic contrast varies significantly from the others, in 10% of cases the image contains salt and pepper noise, in 10% of cases the image is slightly blurred, and in 10% of cases the image is pixelated due to lower resolution. Another anomaly observed in scanner images (1 in 5 cases, for our system) is the presence of lines of horizontally shifted pixels, which can distort the analysis or make the image unusable by the AI model.
In addition to equipment configuration, variability can also arise from use and patient factors. For example, a large body habitus may lead to truncated cross-sections or images with truncation artifacts. It is estimated that this occurs in 3 out of 20 images. Similarly, it is estimated that 1 in 10 images are blurred due to patient movement during the scan and that 1 in 10 images include a slightly rotated view of the section because of the patient positioning.
Finally, the target circumstances of the MDS case study are as follows:
| Target Circumstances | Relative Freq. |
| Density contrast may vary significantly | 0.15 |
| Some pixel lines may be shifted | 0.2 |
| The cross-section may be truncated | 0.15 |
| Images may be blurred due to motion blur | 0.1 |
| Images may be blurred (Gaussian blur) | 0.1 |
| There may be salt and pepper noise in the images | 0.1 |
| The cross-sectional image can be rotated between −20° and 20° | 0.1 |
| Image resolution may be altered during preprocessing | 0.1 |
5.3. Task 2. Assess the Significance of the Target Circumstances
Test case selection and prioritization is a challenge in the field of AI-based object detection, as the input space can be very large [
34]. In software testing, the notion of risk is an integral part of the testing process, and the selection and prioritization of test cases based on risk, also known as risk-based testing, is a recommended practice [
35].
In this method, as target circumstances may be potential hazards, it is relevant to prioritize test cases based on the risk associated with a target circumstance. In addition, this information can also be reused and included in the definition of the metamorphic relation used to assess the robustness (see
Section 5.8).
In practical terms, the significance of a target circumstance is determined by the risk associated with a system failure in that circumstance, and the assessment of the significance of the target circumstances has two main objectives: to enable test cases to be prioritized and to enable the variables involved in the metamorphic relation to be weighted. Thus, the higher the significance of the circumstance, the higher the priority given to that circumstance. Similarly, the higher the significance of the circumstance, the smaller the variation in performance should be.
Based on the risk assessment model proposed by Kinney et al. [
36], we define significance as the product of three factors (see
Table 4): the exposure of the system to a circumstance, the likelihood of that circumstance occurring in practice, and the severity of a system failure in that circumstance (potential loss or consequences).
In order to facilitate the definition of significance scores, we recommend assigning a value to each target circumstance independently and using fixed scales, ranging from 1 to 5 to quantify each of the three factors (see
Table 5). An example in the case of RMS is given below (
Box 2).
Consider the following circumstance for the RMS case study: The camera has a very low shutter speed. This circumstance translates as blurred input images for the object detection model. Its significance can be defined as follows:
Exposure: the system is exposed to this circumstance each time the camera is changed, which should be rare. The exposure value is 1.
Likelihood: in practice, it is very unlikely that the camera will have a too-low shutter speed, as the camera will be tested and calibrated prior to its use. The likelihood value is 2.
Severity: a failure of the AI-based object detection system in this circumstance could be critical because it will have a continuous impact on the road actors (pedestrians and vehicles), potentially leading to accidents, until the camera is removed or calibrated. The severity value is 5.
Finally, the significance of the circumstance The camera has a very low shutter speed is 10.
At the end of this task and the specification phase, a document describing the target circumstances, including their distribution and significance is generated and saved for later use.
5.4. Task 3. Describe Source Test Cases (Source Circumstances)
Once the test objectives have been defined (i.e., target circumstances and their significance), the test case generation phase can begin. This phase takes as input the target circumstances description generated during the previous tasks and requires the use of a dataset, which may be the test dataset (as opposed to the training dataset), and which we will simply refer to as the source dataset.
As ML models are usually developed under the closed-world assumption, where training and test data are drawn from the same distribution, all the images in the source dataset should lie in the operational design domain (ODD), and therefore, contain no target circumstances. However, when data are acquired in a real environment, some images or parts of images may fall outside the ODD [
37]. For example, in the case of road monitoring, this could be the unexpected presence of wild animals on the road, whereas the training data only contain objects common in urban areas (e.g., cars, pedestrians, bicycles). These samples are commonly referred to as out-of-distribution (OOD) samples.
It is, therefore, necessary to check whether the source dataset includes the target circumstances. Thus, the objective of this step is to systematically identify and quantify the target circumstances that are present in the source dataset.
In practice, we recommend following the list of previously established target circumstances and measuring the relative frequency of each of them within the source dataset (see
Table 2 and
Box 3 for an example). However, in the absence of metadata or precise knowledge of the dataset, it can be difficult to perform this step, especially on large datasets. To overcome this difficulty, it is possible to perform this step on a representative sample of the source dataset and extrapolate to the entire dataset. In addition, determining whether an image is drawn from the same distribution as the training data is a complex problem, known as out-of-distribution detection. Several methods have been proposed to perform this task, but it is beyond the scope of this study [
38,
39].
In the following, this step is carried out from the point of view of the developer of the AI model in the MDS case study. The following table lists the relative frequencies of each target circumstance listed in
Section 5.2 within the test dataset.
Finally, the source circumstances of the MDS case study are as follows:
| Target Circumstances | Relative Freq. |
| Density contrast may vary significantly | 0.05 |
| Some pixel lines may be shifted | 0 |
| The cross-section may be truncated | 0.1 |
| Images may be blurred due to motion blur | 0.05 |
| Images may be blurred (Gaussian blur) | 0 |
| There may be salt and pepper noise in the images | 0 |
| The cross-sectional image can be rotated between −20° and 20° | 0 |
| Image resolution may be altered during preprocessing | 0 |
5.5. Task 4. Generate Follow-Up Test Cases (in Target Circumstances)
The objective of this task is to generate a dataset consisting solely of images in target circumstances (i.e., outside the operational design domain), in order to assess the robustness of the model in these circumstances. In the context of metamorphic testing, these images are called follow-up test cases, generated on the basis of transformations representative of the target circumstances. This task takes as input all the documents generated during the previous tasks (description of the source and target circumstances) and the source dataset.
The first step is to determine the transformations to be applied to the images in the source dataset to generate the follow-up test cases. These transformations are then randomly applied to images from the source dataset in order to generate the follow-up test cases in proportions similar to the frequency of the target circumstances. We call this newly generated dataset of follow-up test cases, the
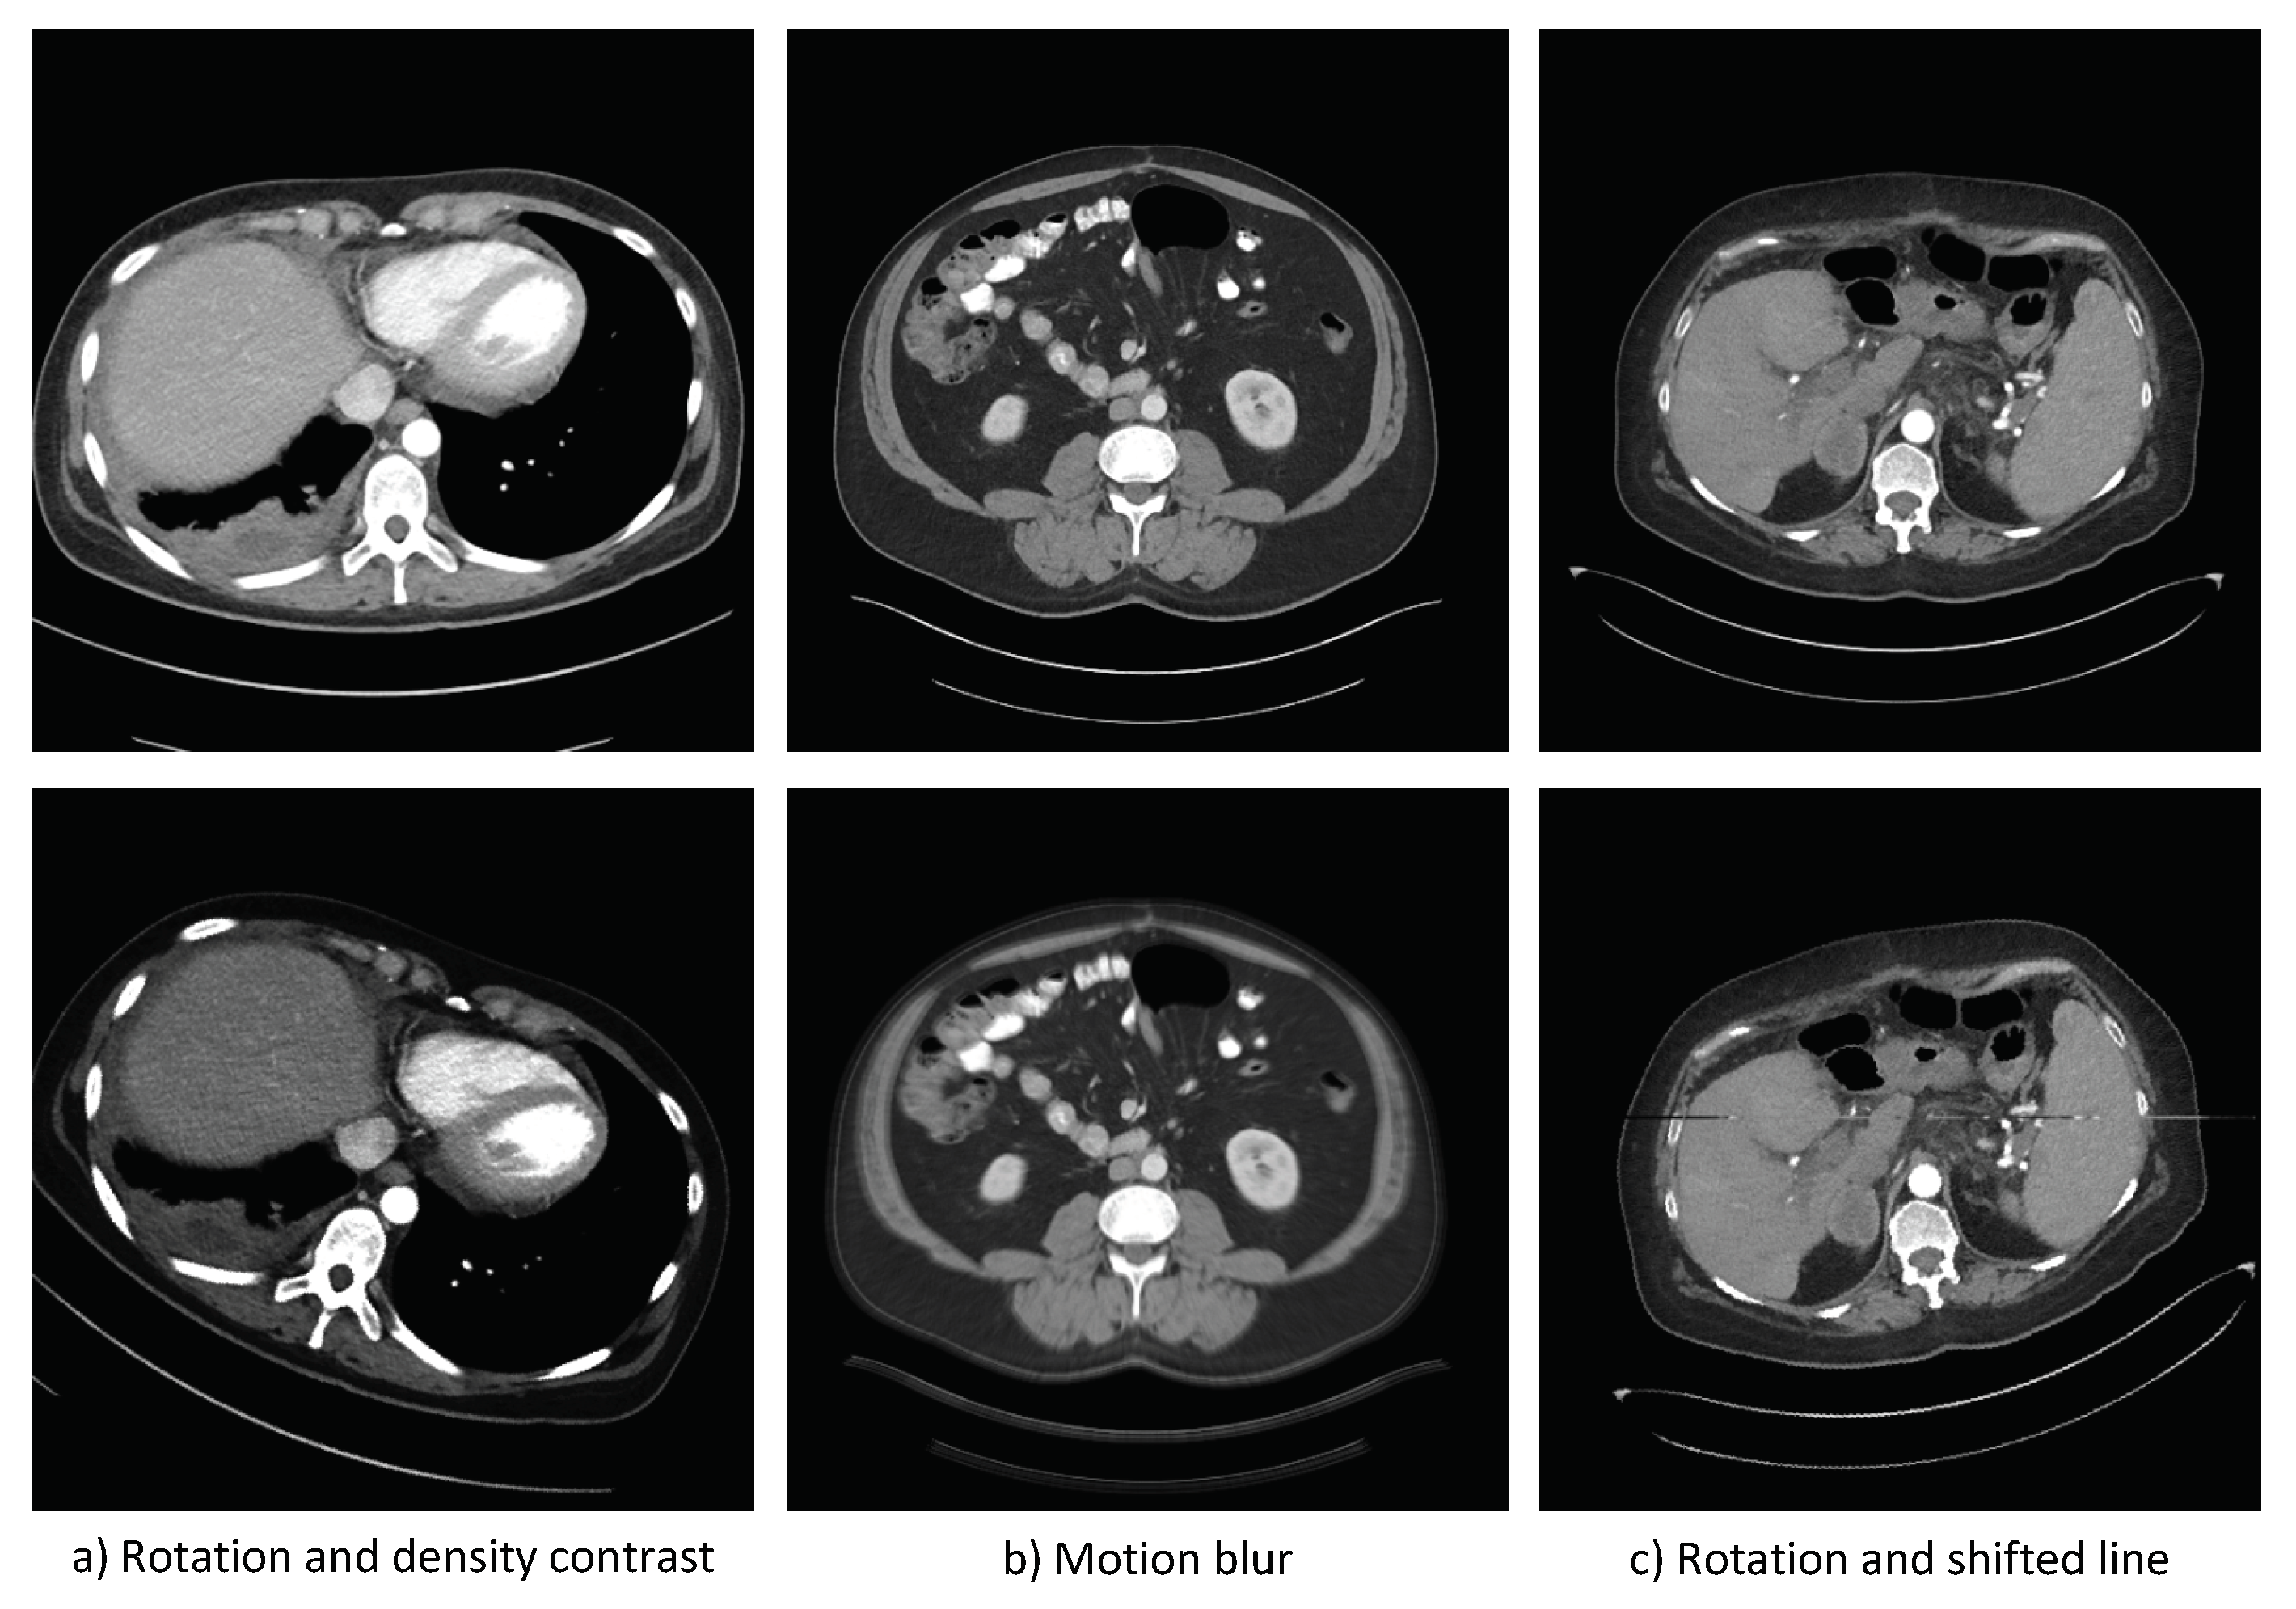
target dataset. See
Figure 6 for examples of source and follow-up test cases, for the MDS case.
Note, that if necessary, the significance value of each circumstance can be used to prioritize the transformations to be applied (e.g., if we do not wish to assess robustness to all the target circumstances at the same time, which may be the case for assessing situations independently of each other).
An example of the application of this task in the case of the RMS is given below (
Box 4).
In the RMS case study, we have defined a certain number of target circumstances related to changes in camera or image signal processor (ISP) parameters. These target circumstances can be translated into transformations that can be applied directly to the input images. For example, the circumstance The camera has a very low shutter speed results in blurred input images. We can, therefore, define a Motion Blur transformation to apply to the images in the source dataset to create follow-up test cases in this target circumstance.
See Wozniak et al. [
12] for more details and examples on the mapping between transformations and the real phenomena, as well as examples of source and follow-up test cases for this industrial case.
Task 3 allowed us to determine that none of the images in the source dataset contain the target circumstances. We thus, directly apply the Motion Blur transformation to the images in the dataset so that the relative frequency of the follow-up test cases matches the relative frequency of the corresponding target circumstance.
5.6. Task 5. Assess Performance on Source and Target Datasets
In accordance with the definition of robustness (see
Section 5.1), the performance assessment is a fundamental step in quantifying the robustness of an AI-based object detection system with respect to changes in the circumstances of use of the system. The objective of this task is to evaluate the performance of the AI-based system on both the source dataset and the newly generated target dataset(s) corresponding to the target circumstances. These two performance evaluations are similar in terms of process and metrics.
Table 6 lists the metrics used to evaluate the performance of object detection models.
According to Padilla et al. [
19], the most widely used metrics, whether in object detection challenges or by the scientific community, are those measuring the accuracy of detections. The overall performance of an object detection model is thus, usually given by the mean average precision (mAP) and the mean average recall (mAR).
These metrics are based on the notions of true positive (TP), false positive (FP) and false negative (FN). In the case of object detection, a true positive is defined with respect to a threshold on the Intersection over Union (IoU) and the top-1 class prediction. For instance, in some cases, TPs are detections with IoU above 0.5 and correct predicted class. If at least one of these two conditions is not met, it is then a false positive.
For each detected object, IoU is defined as follows:
Although these are the most commonly used metrics, not all of them are useful for all object detection systems. The choice of one or the other metric varies according to the application case and the objectives of the system. For example, in the case of the road monitoring system, one of the most important metrics is the number of false negatives, as it must be as close as possible to 0 to avoid potentially fatal incidents. On the other hand, in the case of the medical diagnosis system, the number of false negatives is not as important as in the case of the road monitoring system, because each CT scan image can be reviewed by a human expert at any time.
Box 5 summarises the results obtained for the MDS case.
The following table shows the performance of MDS on the source and target datasets.
| | Precision | Recall | AP0.5 | AP0.75 | AP |
| Source dataset | 0.564 | 0.51 | 0.526 | 0.396 | 0.34 |
| Target dataset | 0.498 | 0.384 | 0.414 | 0.264 | 0.246 |
5.7. Task 6. Compare Source to Target Datasets
As previously mentioned, assessing robustness requires comparing the performance of the system in different circumstances (i.e., against the source and target datasets). However, given the stochastic nature of the target dataset generation process, the difficulty that the target dataset represents for the system is not always the same from one run to another. For example, from one image to another, a change in contrast (with the same parameters) will not always have the same impact. Similarly, combinations of circumstances on the same image will not always be the same.
To overcome this issue it is, therefore, necessary to have a common scale that quantifies the difficulty of the target dataset, with respect to the source dataset. In practice, this can be conducted by comparing the two datasets and measuring a distance, either between the samples or between their features. In the first case, the metric is directly calculated sample by sample, by measuring the distance or similarity between the original and the follow-up images. It is averaged over all the samples from the datasets. In the second case, the characteristics of the datasets are compared, for example, by using feature extraction or clustering, and the metric measures the distance between feature vectors or clusters.
Table 7 lists several types of metrics that can be used in these two cases.
Note, that the choice of one metric or another highly depends on the use case and the types of circumstances being tested (see example below in
Box 6).
Table 7.
GQM model: Q4 related metrics.
Table 7.
GQM model: Q4 related metrics.
| Metric | Name | Definition |
|---|
| M14 | Distance between images | E.g., Mean Squared Error (MSE), Peak Signal-to-Noise Ratio (PSNR), and Structural Similarity Index (SSIM) and its variants [40]. |
| | | These metrics are used in the field of image quality. They are full-reference metrics, which means that they compare an original image with a distorted image (in our case, the generated follow-up image). |
| M15 | Distance between | E.g., Fréchet Inception Distance (FID) [41]. |
| | distributions | Rather than comparing images pixel by pixel, it is possible to compare other characteristics. This is the objective of metrics such as Fréchet Inception Distance (FID), which compares the distribution (mean and standard deviation) of images processed by an Inception-type neural network. It is currently a benchmark metric for assessing the quality of generative models. |
| M16 | Distance between | E.g., Euclidean distance, cosine similarity. |
| | feature vectors | After using a feature extraction algorithm for each of the images (source and follow-up), the distance separating the feature vectors is measured using a metric such as Euclidean distance or cosine similarity. |
| M17 | Inter-cluster | E.g., linkage distance [42]. |
| | distance | There are several ways of defining the distance between two clusters, depending on whether we are considering a single point (Single linkage), all the points (Complete linkage), the average of all points (Average linkage), or the centroid of the clusters (Centroid linkage). |
| | | Note: inter-cluster or linkage distances are usually calculated based on well-known distance measures, such as Euclidean, Manhattan, or Mahalanbois distances. |
For this use case, we used the structural similarity index (SSIM) [
43] to measure the distance between circumstances. SSIM is a full-reference metric that measures the similarity between a source image and its follow-up, in terms of luminance, contrast, and structure. Its value ranges from 0 to 1, where an SSIM of 1 indicates that the two images being compared are identical. The distance between circumstances is thus, given by
.
This choice was motivated by the fact that in this use case, the camera is fixed in time and the circumstances tested give rise to transformations applied uniformly to the image. For example, there are no changes to specific objects in the image. The only structural modifications are, therefore, those introduced by blur or noise transformations. A full-reference metric is thus relevant in this configuration.
In addition, we have chosen to use a metric that is close to the human perception of image quality (by comparison with MSE or PSNR, for example), because the transformations must be realistic and the system’s performance comparable to that of human vision.
In practice, SSIM is computed for each pair of images (source, follow-up) in the datasets, and then averaged over all the values. The distance between the datasets is given by . As an example, the following table shows the evolution of the averaged SSIM as a function of the parameter (amount of expansion and blurring) of the Chromatic aberration transformation, defined in the context of the circumstance: the camera is equipped with a poor quality lens.
| Parameter | 0 | 0.1 | 0.25 | 0.5 | 0.75 | 1 |
| SSIM | 1 | 0.904 | 0.777 | 0.733 | 0.711 | 0.697 |
| Distance | 0 | 0.096 | 0.223 | 0.267 | 0.289 | 0.303 |
5.8. Task 7. Assess the Robustness
The objective of the last task is to aggregate the information from the previous stages to assess the robustness of the system in the target circumstances. In the following, the metamorphic relation used in this testing method is introduced.
As previously mentioned, we base our approach on the definition of robustness in [
30], which considers an AI system to be robust if it is able to maintain its level of performance under any circumstances. In practice, we relax this definition by introducing the notion of distance between the circumstances: the smaller the distance between the source and target circumstances, the closer the performance of the model in these circumstances should be. In fact, as the tested circumstances lead to atypical data different from those expected in operational conditions, it is unlikely in practice, to have strictly equal performance. Furthermore, this relaxed definition includes the notion of global robustness as defined by other authors (i.e., whatever two points are contained in the same region, the model returns a similar prediction) [
15].
We can, therefore, express the difference in performance
(see
Table 8) as a function of the distance
d. Then, a metamorphic relation for a robust model is:
where
x and
are two sets of circumstances,
(resp.
) is the performance of the model under given circumstances
x (resp.
), and
is a piecewise linear function. It means that we can define several
for which the maximum threshold on
will be different. In practice, this function
depends on the use case and the choices made at the previous stages. It represents the acceptable trade-off between the distance between sets of circumstances and the change in performance. It can be determined experimentally. See the example below for more details (
Box 7).
Once the function is defined, all that remains is to use the previous results to check that the model is robust, i.e., that it verifies the metamorphic relation.
For the MDS use case, several performance metrics have been calculated (see
Section 5.6). The distance between the source and target datasets was measured with CW-SSIM [
44], a variant of SSIM which provides better results for images that have been rotated or truncated. The results are summarized in the table below.
In order to determine the function in the metamorphic relation, we first seek to identify one or more significant distance values d. In the previous task, the CW-SSIM metric was computed for each pair of images (source, follow-up) in the datasets, and it is, therefore, possible to determine the threshold at which it becomes significantly more difficult for the human eye to correctly process the image. In practice, we rely on a domain expert to define this threshold. In this use case, it is estimated at on average. This means that the performance of the model should remain more or less the same (e.g., ) for . Beyond this value, the difference in performance may increase linearly with d.
We thus, have the following metamorphic relation:
where
In this example, as shown in the table below, . Whatever the performance metric, the model does not verify the above relation and is, therefore, not globally robust.
| Performance | Distance d |
| AP | Precision | Recall | CW-SSIM |
| 0.094 | 0.066 | 0.126 | 0.154 |
6. Tooling
A prototype tool, available online (
https://drive.google.com/file/d/1i-kqAeABWZPYyJii3JDUHSbDHsPncmFq/view?usp=drive_link) (accessed on 1 April 2024), has been developed to assist practitioners in utilizing the method. This tool has been implemented as a three-tab spreadsheet and allows (i) the different phases of the testing process to be monitored, (ii) information about the system, such as measurements, to be kept throughout the process, and (iii) the robustness of the system to be checked (w.r.t. a metamorphic relation). The content of each of the three tabs is described below, and screenshots of the tool used for the MDS case are available in
Figure A1.
The first tab, Specification, is used to define the target circumstances (Task 1) and their significance (Task 2). In practice, the user fills in a table summarizing all the target circumstances of the system and their characteristics, including probability, exposure, likelihood, and severity. The tool then calculates significance scores and displays the distribution of circumstances according to the three factors to help identify the most critical circumstances for the system.
The second tab, Test cases generation, focuses on describing the source dataset (Task 3) and is used to define missing follow-up test cases in target circumstances (Task 4) for the robustness assessment. First, a pre-populated table based on the previous tasks is made available for the user to enter circumstances that are already in the source dataset used for testing the system. Users indicate their relative frequency in the dataset. Then, the tool automatically updates a list of circumstances to be tested as a priority. To do so, it uses the difference between the probability and the relative frequency to determine whether follow-up test cases should be generated. The list is prioritized according to the circumstance’s significance score.
Finally, the last tab, Evaluation, is used to perform all the remaining tasks for the robustness assessment: performance evaluation (Task 5), measurement of the distance between datasets (Task 6), and definition of the robustness property to be verified (Task 7).
7. Evaluation and Lessons Learned
Following the two cycles of action research, the proposed testing method was empirically evaluated through a case study [
45] whose goal was to assess the relevance and applicability of the method in an industrial context. The main research question was defined as follows:
How useful is the proposed method for practitioners to test the robustness of AI-based 2D object detection models? As mentioned in the introduction of this research (
Section 1), from our previous work we have learned that current state-of-the-art methods can be difficult to apply in practice as they often lack clear guidelines for adapting them to the systems under test while still allowing to compare the results from one system to another. We thus, focus on the usefulness of the proposed method for practitioners, in terms of its applicability and its ability to provide clear guidelines.
In the following, we report on the design, results and lessons learned from the study.
7.1. Design
We conducted the case study on the Medical Diagnosis System (MDS) developed by Kereval (see
Section 3.2), and the primary mean of data collection was a focus group involving practitioners from the company. Focus groups are an effective method for conducting qualitative assessments of new approaches and collecting potential problems and lessons learned based on feedback from practitioners [
46]. We followed the recommendations of Kontio et al. [
46] in designing and conducting the focus group session.
The point of view adopted in this evaluation is that of external testers. We, therefore, selected five participants from Kereval, all of whom are experienced engineers or testers with experience working on AI-based systems, but who were not involved in the development of the MDS.
The focus group session took the form of a structured discussion in which the following four main questions were addressed.
Q1: What problems did the company’s actors encounter in applying the state-of-art methods? In this study, we aim to assess the usefulness of the proposed method in relation to current practices and the issues that may be encountered in practice when testing robustness. Therefore, the goal of this question is to identify practical issues and shortcomings related to the methods commonly used by practitioners.
Q2: What difficulties do the company’s actors encounter in applying the proposed method? The goal of this question is to identify potential problems in using the method, as they may reveal unclear guidelines or unresolved practical issues.
Q3: What is the company’s actors perception on the benefits of the proposed method for the practitioners? We seek to identify the strengths of the proposed method, such as the practical issues it addresses.
Q4: What could prevent the use of the proposed method in other contexts? We seek to identify the limitations of the proposed method in terms of applicability, and potential areas of improvement.
During the session, one researcher acted as moderator to facilitate the discussion and probe deeper when necessary. An additional observer took part in the session, which was also video-recorded for data collection purposes. In total, the session lasted 2.5 h, divided into three parts. First, the moderator briefly recalled the purpose of the focus group and the principle of the proposed method. Then, the discussion focused on the application of the method to the MDS case in order to identify the potential difficulties for an external tester in this context. Finally, the participants were invited to discuss more broadly the usefulness of the method in relation to current practices and methods, the benefits it could bring and the potential limitations of its application in different contexts.
Data were analyzed from the video recording and the notes taken during the session, using the pattern matching technique [
47] in which the empirically observed patterns (findings from the focus group session) were compared with the expected patterns that we had formulated based on the outcomes of the action research.
7.2. Results
In this section, we synthesize the results for each main question addressed during the focus group session.
7.2.1. Current Practical Issues (Q1)
The most frequently cited problem during the discussion, and the one with which the majority of participants (three out of five) agreed was the difficulty of determining a threshold on the system’s performance that would enable testers to assess its robustness. This difficulty led some participants, during similar projects, not to explicitly define a metamorphic relation as presented in our proposed method (Task 7) but to use a method similar to load testing in which the transformations applied to the input images are increasingly severe.
The difficulty of defining relevant transformations on the data to test the system was also mentioned, together with the difficulty of applying transformations to the images, i.e., generating test cases from a source dataset in the case of systems where domain knowledge is required and the transformations to be applied are complex. The lack of a framework to guide the definition of the transformations has already led one participant to carry out the tests using an exploratory approach during one of his projects.
7.2.2. Difficulties in Using the Method (Q2)
The participants agreed that Task 1 (
Describe target circumstances) and Task 2 (
Assess the significance of the target circumstances) were the most difficult to carry out in practice as a tester, particularly the assignment of a value to certain factors involved in the significance score (exposure, likelihood, and severity). They also identified that this latter difficulty could arise from the sometimes subjective nature of these factors. On the other hand, two of the participants drew parallels with traditional software testing practices, such as risk assessment and the determination of safety integrity levels (SIL) as described in the IEC 61508 standard [
48], validating that these difficulties are common in the context of software testing and that the tester indeed usually discuss these issues with a domain expert.
To a lesser extent, the question of the choice of some metrics was raised as a difficulty in practice, particularly for measuring the distance between datasets or circumstances as it requires a good understanding of the system and its environment. However, the majority of participants (four out of five) felt that these choices were indeed a matter of the AI tester’s expertise. Thus, the tester can discuss with the domain expert to better understand the system but retains responsibility for the final decision.
7.2.3. Benefits (Q3)
In terms of the benefits perceived by the company’s practitioners, the most frequently cited response was clear, structured guidelines for the testing process. One participant highlighted the time saved by defining a clear process with ordered steps. Another participant felt that such a method can help in formulating the hypotheses under which the robustness of an AI-based system is validated. In addition, most of them (four out of five) agreed that the proposed method can help determine the threshold on system performance and the definition of relevant transformations, and two of the current practical issues previously mentioned (cf. Q1).
7.2.4. Limitations (Q4)
Overall, the participants felt that the proposed method would be difficult to apply to systems whose circumstances of use are complex to describe and strongly linked to the application domain. In practice, they consider that such “domain” circumstances cannot be easily expressed in terms of transformations to be applied to images and, if they are, may not be feasible. One of the participants gave the example of a transformation that would involve transforming a daytime image into a night-time image: such a transformation is very complex, difficult to automate, and therefore, very costly. Similar examples have been given in industrial cases where the tester alone cannot determine the visual effect of a given circumstance, and therefore, the associated transformation.
7.3. Conclusion and Lessons Learned
This study allowed us to determine how the proposed method could be useful to software testers in relation to the problems they currently encounter in practice. The focus group participants identified that the proposed method provides concrete answers to their practical issues from a software tester’s point of view, although certain questions remain unanswered. The lessons learned from this study are summarized below.
Lesson 1: Need for circumstances analysis when testing the robustness of AI-based systems. The current practical issues mentioned by software testers are related to the application domain of the system under test and require the tester to rely on documentation or discussions with the development team or domain experts to determine the relevant cases to test. This confirms that this activity must be an integral part of the testing process in the same way as risk analysis in traditional software testing for high-risk systems.
Lesson 2: The choice of metrics is a matter for the AI tester’s area of expertise. One of the lessons learned from this study is that AI testers need to be made aware of or trained in the choice of performance metrics for AI models and the measurement of distance between datasets. Indeed, the software testers interviewed believe that this should be part of an AI tester’s area of expertise.
Lesson 3: More needs to be conducted to address the issue of complex, domain-related circumstances. According to the practitioners interviewed, there is currently no practical and cost-effective solution for AI-based systems whose circumstances cannot be expressed in the form of simple or automatable transformations. A current alternative is to acquire a dataset specifically for these circumstances of use, but this solution is also very costly and often unfeasible.
8. Threats to Validity
In this section, we report on the possible threats to validity that we have identified in this research and discuss how we mitigated them, following the recommendations of Wohlin et al. [
49].
8.1. Construct Validity
In action research, the learning effect may be a threat to construct validity. We avoided the learning effect by using different cases and involving new practitioners in each cycle of the action research. To ensure the construct validity of the empirical evaluation, we have used an application case that we believe to be representative of a real situation of testing the robustness of an AI-based 2D object detection system. Measurement bias was also mitigated by using video recording and having an additional observer during the focus group session.
8.2. Internal Validity
To ensure that the results of the focus group session were representative of reality, we selected practitioners with different profiles in terms of experience and role within the company. In addition, to minimize the threat posed by the fact that one of the researchers and the team of practitioners interviewed worked in the same company, the latter was encouraged to criticize the proposed method, highlighting the difficulties and limitations encountered in its application and to detail their responses. Furthermore, none of the participants had previously contributed to the development of the method.
8.3. External Validity
In the action research, we used two different AI-based 2D object detection use cases that have two distinct application domains, and two different groups of people to apply the method, which allowed us to mitigate to some extent, the threat to external validity. Regarding the case study, the focus group adopted the viewpoint of an external tester to apply the proposed method and we do not intend to generalize the results beyond this scope.
8.4. Conclusion Validity
To improve the reliability of our research, we have used well-established research methods (e.g., action research and focus group method) and described in detail the procedures to conduct the research, following good practices.
9. Related Work
9.1. Standards, Guidelines and Methodologies for Testing AI Robustness
From best practices to emerging standards, several reference systems for the development and testing of AI-based systems have surged in recent years. At the international and European level, ISO/IEC, CEN-CENELEC and ETSI are among the standards organizations involved. In the following, we focus on the reference systems related to the robustness of AI-based systems.
The ISO/IEC JTC 1/SC 42 committee, which deals with standardization in the field of artificial intelligence, is developing the ISO/IEC 24029 family of standards on the robustness of systems using neural networks. This standard currently has three parts: ISO/IEC TR 24029-1:2021 [
30] on an overview of the subject, published in 2021 as a 31-page document, ISO/IEC 24029-2:2023 [
50] on the use of formal methods in this context, published in 2023 as a 23-page document, and ISO/IEC AWI 24029-3 [
51] on the use of statistical methods, which is still under development. At the same time, this committee has been assigned to review the ISO/IEC TR 29119-11:2020 [
52] standard in the field of software testing, which describes the test methods applicable to AI-based systems, the metrics that can be used, and which maps the various test stages to those of the life cycle of an AI-based system.
CEN and CENELEC have established the CEN-CENELEC JTC 21 in response to the European Commission White Paper [
53] on AI. This committee is responsible for the development and adoption of standards for AI and related data, as well as providing guidance to other Technical Committees concerned with AI. In particular, it identifies and adopts international standards already available or under development from other organizations such as the ISO/IEC JTC 1/SC 42 committee.
For its part, the International Software Testing Qualifications Board (ISTQB) published a Syllabus [
54] that serves as a basis for certification in AI testing. Among the topics covered in the syllabus are the various quality characteristics to be verified in AI-based systems, including robustness, and the methods, techniques, and environments for testing these systems.
AMLAS [
55] is a methodology for the safety assurance of machine learning components in autonomous systems. It supports the development of safety cases in a systematic way. However, this high-level framework does not provide practical guidance on the choice of test methods during the model verification stage or on the appropriate metrics to be used for the robustness assessment of a given system.
Although such reference systems help to structure progress in the field of AI testing and guide the development of new methods and tools, they often lack practical applications. Built to be applicable to different types of AI-based systems, they often result in high-level and generic guidelines. Furthermore, their complexity and inertia in the face of the emergence of new, more relevant methods make them difficult to use when selecting a suitable testing approach in practice.
9.2. Robustness Testing of AI-Based Object Detection Systems
Several methods have been proposed in the literature to test the robustness of AI-based models [
14,
15]. In computer vision, these methods usually involve measuring the performance of the model against perturbed input images that reflect uncertainties in its operational environment. Input images can be classified into two categories [
15]: adversarial inputs and natural inputs. Adversarial inputs are crafted from perturbations that are imperceptible to humans but can cause AI models to make incorrect predictions [
5]. Alternatively, natural inputs can be generated by applying common perturbations that simulate real-world scenarios, such as sensor failures or changes in the environment [
6,
7].
Given their nature and implications for the security of AI-based systems, the topic of adversarial input generation has received considerable attention in recent years, as highlighted by Akhtar et al. in two successive surveys [
56,
57]. This trend has also been observed in the field of AI-based 2D object detection systems, where numerous techniques have been proposed in the literature for generating adversarial inputs [
9].
Regarding natural inputs, several methods have been proposed for defining perturbations and generating perturbed input images, guided by knowledge of the application domain [
58], coverage metrics [
59,
60], or properties that the system must satisfy, such as metamorphic relations [
22,
61]. In addition, several perturbation benchmarks have been proposed in the literature to assess robustness [
7,
62,
63,
64]. However, few of these methods have been developed and evaluated in the context of 2D object detection systems. As mentioned in
Section 2.2, Wang et al. [
22] developed MetaOD, a tool based on metamorphic testing. It aims to verify that inserting objects into the background of an image does not change the results for the other objects. For their part, Zhao et al. [
63] proposed a natural perturbation benchmark for testing models in the field of computer vision, including object detection models.
In contrast to related work, we do not aim for a specific application domain (e.g., autonomous vehicles) or a specific set of perturbations. Instead, we aim to fill the gap between academia and the industry, providing practitioners and researchers with practical guidance on the application of effective state-of-the-art methods and a set of relevant metrics to overcome issues encountered in practice, such as the elicitation of relevant perturbations.
10. Conclusions and Future Work
In this paper, we have presented the development of a method for assessing the robustness of AI-based 2D object detection systems. The goal of this method is to meet the need for clear guidelines identified in practice in previous work [
12]. It was developed using action research, based on two industrial cases and feedback from practitioners. As a result of these experiments, we identified key steps in a testing process based on the metamorphic testing technique and a set of metrics to be used at each step.
An initial qualitative evaluation of the proposed method was conducted to assess its usefulness for practitioners and its ability to provide clear guidelines. The lessons learned from this study will also help to guide future work. In particular, we identified that more efforts should be concentrated on AI-based systems whose circumstances of use are difficult to translate into a set of simple, automatable transformations. Thus, further industrial case studies should be conducted to further improve the proposed method and complement the guidelines in this context.
In addition to the above, future work will involve the further implementation of a software tool to assist practitioners in using the method. An initial prototype has been developed to help with case studies, and initial feedback will enable us to continue our work on the subject. Other future work will also concern the specification phase in line with current risk analysis practices for critical software systems in order to deepen the analysis of target circumstances. In particular, we will study how they can be formulated at several levels of detail and address the question of the testability of circumstances.


