Article

A Hardware-Based Orientation Detection System Using Dendritic Computation

1
Faculty of Engineering, University of Toyama, Toyama-shi 930-8555, Toyama, Japan
2
Division of Electrical Engineering and Computer Science, Kanazawa University, Kanazawa-shi 920-1192, Ishikawa, Japan
3
Faculty of Information Science and Electrical Engineering, Kyushu University, Fukuoka-shi 819-0395, Fukuoka, Japan
*
Authors to whom correspondence should be addressed.
Electronics 2024, 13(7), 1367; https://doi.org/10.3390/electronics13071367
Submission received: 12 February 2024 / Revised: 29 March 2024 / Accepted: 1 April 2024 / Published: 4 April 2024
(This article belongs to the Special Issue New Advances in Visual Object Detection and Tracking)

Abstract

:
Studying how objects are positioned is vital for improving technologies like robots, cameras, and virtual reality. In our earlier papers, we introduced a bio-inspired artificial visual system for orientation detection, demonstrating its superiority over traditional systems with higher recognition rates, greater biological resemblance, and increased resistance to noise. In this paper, we propose a hardware-based orientation detection system (ODS). The ODS is implemented by a multiple dendritic neuron model (DNM), and a neuronal pruning scheme for the DNM is proposed. After performing the neuronal pruning, only the synapses in the direct and inverse connections states are retained. The former can be realized by a comparator, and the latter can be replaced by a combination of a comparator and a logic NOT gate. For the dendritic function, the connection of synapses on dendrites can be realized with logic AND gates. Then, the output of the neuron is equivalent to a logic OR gate. Compared with other machine learning methods, this logic circuit circumvents floating-point arithmetic and therefore requires very little computing resources to perform complex classification. Furthermore, the ODS can be designed based on experience, so no learning process is required. The superiority of ODS is verified by experiments on binary, grayscale, and color image datasets. The ability to process data rapidly owing to advantages such as parallel computation and simple hardware implementation allows the ODS to be desirable in the era of big data. It is worth mentioning that the experimental results are corroborated with anatomical, physiological, and neuroscientific studies, which may provide us with a new insight for understanding the complex functions in the human brain.

1. Introduction

Understanding and detecting object orientation is fundamental in various technological domains, including robotics, camera systems, and virtual reality. The traditional approaches were to model the direction of a neighborhood in terms of the direction of the gradient of the image [1] or to take the axis with the lowest eigenvalue in the Fourier domain of the n-dimensional neighborhood [2]. A bio-inspired artificial visual system may provide a powerful new approach to orientation detection. Neuroscience aims to explain how the sensory inputs such as sight, smell, taste, hearing, and touch combine with our perception of the world to generate behavior [3,4]. The visual system supplies approximately ninety percent of the external information to the brain [5]. About fifty percent of the nerve fibers are connected to the retina, and two-thirds of all electrical activities in the brain are caused by the visual system when we open our eyes [6]. Therefore, vision is more important than all other senses in our sensory system [7]. Visual information undergoes a series of transformations in expression as it is transmitted through the visual system, which relies on the receptive field properties of neurons [8]. The light entering the eye projects an inverted image onto the retina as it passes through the composite lens, which is the combination of the cornea and lens. The visual information from the retina is transmitted along the optic nerve to the visual cortex. The lateral geniculate nucleus (LGN) is connected to approximately ninety percent of the axons in the optic nerve [9]. The LGN neurons then transmit the visual image to the primary visual cortex (also called area V1, area 17, or the s t r i a t e c o r t e x ), which is an important area for processing visual information. Different from retinal ganglion cells and LGN neurons, which respond indiscriminately to virtually all stimuli within the receptive field, neurons in the V1 area are more sensitive to complex visual information, such as orientation and motion [10]. In addition, the processing of color information is also performed in the V1 area, where the shape and color of the image acquired from the retina has been radically altered [11]. Anatomical and physiological research elucidates that the combination of circularly symmetric inputs lead to the emergence of orientation selectivity, and color selectivity is obtained from the transformation of cone-opponent inputs [12,13]. These landmark contributions have led to crucial speculations and controversies about how neurons in the V1 area perform computation in our sensory system [14]. The mechanism underlying the generation of orientation selectivity has been an important issue and has been critically examined over the past decades [15].
Hubel and Wiesel proposed a simple and long-lasting orientation selective feedforward model for the first time to explain neuronal computation in area V1 [10]. In this model, simple cells in area V1 directly receive LGN inputs for specific orientation selectivity. Due to the requirement for experimental identification of LGN cells and corresponding neurons in area V1, this prediction was not examined and confirmed until about three decades later, when the emergence of orientation selectivity in area V1 was corroborated [16,17,18]. However, the function of neurons in area V1 remains the major unresolved issue concerning the processing of visual information owing to the lack of explicit data [11,19]. With the advancement of artificial neural networks, many researchers have applied the convolutional neural network (CNN), which has the most powerful performance in image recognition, to orientation detection in recent years. Nagata et al. designed a CNN based on the transfer learning of AlexNet, which is regarded as one of the most influential techniques in computer vision [20,21,22,23]. Yang et al. proposed an embedded implementation of an estimation algorithm based on CNN for hand detection and orientation [24]. Joshi et al. applied CNN to automatically detect photo orientation [25]. In addition, a CNN-based approach to detection and orientation estimation was designed for modeling traffic scenarios with intelligent vehicles [26]. Jiang et al. proposed a rotational region CNN for the detection of text orientation in images [27]. A 3D CNN-based workflow was designed to detect faults and estimate orientation properties from seismic data [28]. Although the CNNs and their variants have been successfully applied in numerous tasks, they contribute little to the understanding of the principle of neuronal computation because they are black-box models [29,30]. It is worth mentioning that the impressive results of CNNs are highly dependent on intensive pools of data, which indicates that their major strength is contributed by the availability of massive datasets [31]. However, the cost of accessing and annotating data is undoubtedly high due to the need for a large amount of data to increase the reliability of the computational results. Therefore, it is of great interest to develop an efficient model for orientation detection, which may also aid in the understanding of neuronal computation.
Neuronal cell bodies and connections are integrated into various networks in the brain, with more than 10 4 dendritic neurons per cubic millimeter. The emergence of orientation selectivity is necessarily associated with interactions among dendritic neurons. In the prior studies, we have proposed a dendritic neuron model (DNM) to cope with the lack of neuroplasticity in a wide range of artificial neural networks [32,33]. The DNM can be trained to prune useless dendrites and redundant synapses, thereby generating a unique topology for each specific task [34]. This implies that the DNMs with different topologies can simulate various neuronal functions [35]. In addition, the simplified topology can be implemented by the logic circuits, which demonstrates that the DNM can obtain excellent performance by consuming only little computing resources, with easy hardware implementation [36]. The efficiency of the DNM is certainly promising in the era of big data, which brings to a climax the studies on improvement [37,38,39,40]. The performance of the DNMs has been proven in various fields, such as computer-aided diagnosis [41], bankruptcy prediction [42], wind speed forecasting [43], and PM2.5 concentration prediction [44]. Only a simple DNM is required to accomplish these tasks, which is clearly inadequate for the task of dealing with more complex image data.
In this work, we propose a novel hardware-based orientation detection system (ODS) using dendritic computation and employ a combination of multiple DNMs to implement it. In the local receptive fields, numerous dendritic neurons cooperate to detect local orientation information. The emergence of orientation selectivity relies on the summarization of local orientation information. The orientation of the neurons with the highest activation intensity determines the orientation of the object in the image. The ODSs achieve excellent performance on binary, grayscale, and color datasets. The results demonstrate that the ODSs can make correct judgments regardless of the shape, size, and location of the objects because only the information of the positional relationship among objects is utilized, and the size of the image has no effect on the results. Moreover, the ODSs maintain perfect accuracy in experiments with actual photographs, which suggests a promising practicality. The comparison experiments with CNNs and corresponding statistical results indicate that the ODSs almost overwhelm CNNs in all aspects. It is worth noting that our system corroborates the finding that inhibition in the visual cortex is important in orientation selectivity, which is obtained from the physiological experiments. The introduction of the inhibition scheme successfully enhanced the anti-noise ability of the ODS. Furthermore, a slightly more refined ODS has yielded even more impressive results. Subsequently, the ODSs are also implemented by logic circuits, which can drastically accelerate the computation without sacrificing accuracy. These results lead us to believe that the ODS is a hopeful orientation detection system and may be instructive for understanding human brain functions. In our past research, a theoretical framework demonstrated that the ODS has the capacity to effectively address orientation problems, laying a solid foundation for our practical implementation [45]. In addition, empirical evidence showed that by simply modifying the inputs of the model, the ODS can also excel in motion direction detection tasks, further expanding the versatility of DNMs [46]. More exploration into the extensive possibilities offered by DNMs provided valuable insights into the potential applications and capabilities of these models.
The rest of this paper is organized as follows: Section 2 provides a detailed introduction to the ODS. Section 3 describes the experimental setup and datasets. In addition, the results of simulation are also presented. Finally, the conclusions are drawn in Section 4.

2. Materials and Methods

It is well known that the visual system of mammals starts with the eyes [47]. The visual system is described in Figure 1A. At the bottom of the eye is the retina, which can be divided into three functionally distinct parts, called photoreceptors, horizontal cells, and bipolar cells, which are presented in Figure 1B. In the retina, photoreceptors are specifically responsible for converting light information into neural activity, and other cells directly or indirectly connected to them to produce visual information [19]. As shown in Figure 1A, the preliminary processed and integrated visual information is transmitted to the V1 through the optic nerve, optic chiasm, lateral geniculate nucleus, and optic radiation [11]. The visual field map undergoes many distortions, transformations, and reorganizations in the process of uploading it to the brain, which is also termed retinal mapping [48,49]. For example, images on the retina are inverted [50]. Retinotopic mapping can be found in the brains of various mammals, regardless of huge differences in the size and spatial arrangement of the brains and the number of neurons of the species [51,52]. The retinotopic organization was confirmed in the human brain by functional magnetic resonance imaging (MRI) [53,54,55]. Therefore, the shape and size of the image change drastically while the positional relationship among objects is maintained in the process of transmitting visual information. In other words, the adjacent spots on the retinal image are still adjacent on the retinally mapped image [56,57]. Significantly different from the retina and lateral geniculate nucleus, a receptive field with orientation selectivity was first discovered in the visual cortex of cats [58]. Subsequently, this discovery was further confirmed in the V1 of monkeys [59]. Therefore, we believe that information of the positional relationship among objects and dendritic neurons plays an indispensable role in the generation of orientation selectivity, and we propose a novel orientation detection mechanism based on dendritic computation. A typical dendritic neuron mainly contains dendrites, cell body (soma), nucleus, axon, and axon terminal, and dendritic neurons transmit signals through synapses, which is described in Figure 1C. Based on the dendritic neuron, we propose a combination of multiple DNMs to realize the orientation detection mechanism.

2.1. Dendritic Neuron Model

As shown in Figure 2A, the DNM consists of synapses, dendrites, a membrane, and a cell body [60]. The DNM receives input signals from neighbor neurons, and the transmission of information starts from the synapses and then moves to the dendrites, membrane, and finally to the cell body. The detailed definitions of the DNM and its unique schemes are introduced in this section.

2.1.1. Model Structure

Sandford Palay proved that existence of synapses in an epoch-making study [61]. The connection between two neurons is named the synapse; this special area allows the presynaptic neuron to send electrical or chemical signals to the postsynaptic neuron [62]. In the DNM, a neuron receives a signal across a synapse, and the synapse is defined as a sigmoid function. The postsynaptic potential S i , m of presynaptic potential x i to the mth dendrite can be described as follows:
S i , m = 1 1 + e k ( w i , m x i q i , m ) ,
where i [ 1 , 2 , , I ] , and I represents the number of presynaptic neurons; m [ 1 , 2 , , M ] , where M is the number of dendrites; k denotes a distance parameter; and w i , m [ 1.0 , 1.0 ] and q i , m [ 1.5 , 1.5 ] represent the weight and bias, respectively, which can be modified by learning or designed based on experience. In this paper, they are designed based on our knowledge of ODM and local orientation detective neurons. In this work, the backpropagation algorithm is employed as the learning algorithm. It is worth noting that not all stimuli can trigger an action potential [63]. The postsynaptic potential is only caused when the presynaptic potential exceeds the threshold potential [64]. The threshold potential θ i , m corresponding to each synapse is given as follows:
θ i , m = q i , m w i , m .
According to the relationship between signal strength x i and threshold θ i , m , the signals can be grouped into the subthreshold signal ( x i < θ i , m ), threshold signal ( x i = θ i , m ), and suprathreshold signal ( x i > θ i , m ).
In the brain, the dendrites extend from the cell body and receive electrical or chemical signals from synapses [65]. As related research in neuroscience shows that multiplication plays an important role in auditory spatial receptive field and visual neurons [66,67], multiplication is employed in the dendrite, which is the simplest nonlinear operation. The dendritic function D m can be mathematically defined as follows:
D m = i = 1 I S i , m .
This can be regarded as the product of the outputs of the synapses. The positive and negative ions drive the electrical potential away from the resting potential through ion channels in the cell membrane to activate neurons [68]. Therefore, all electrical or chemical signals from dendrites collectively affect the membrane potential V. The membrane function is interpreted as an accumulation process, which is implemented by linear summation in the DNM. This process is determined by:
V = m = 1 M D m .
Although the terminals of both the dendrites and axon are extremely complex, each neuron has only one cell body, which is the central processing unit. Similar to the synapses, a key nonlinear processing operation is also performed in the cell body, which means that the neurons triggers a response only when the total signal reaching the cell body exceeds a certain threshold potential θ s o m a [69]. Thus, the cell body is also defined as a sigmoid function, which can be mathematically expressed as follows:
O = 1 1 + e k ( V θ s o m a ) .
where O is the output of the cell body. Then, the neuron response is taken over by the axon, which is the output unit of the neuron and responsible for transmitting signals to other neurons through the axon terminal [70].

2.1.2. Synapse Evolution Scheme
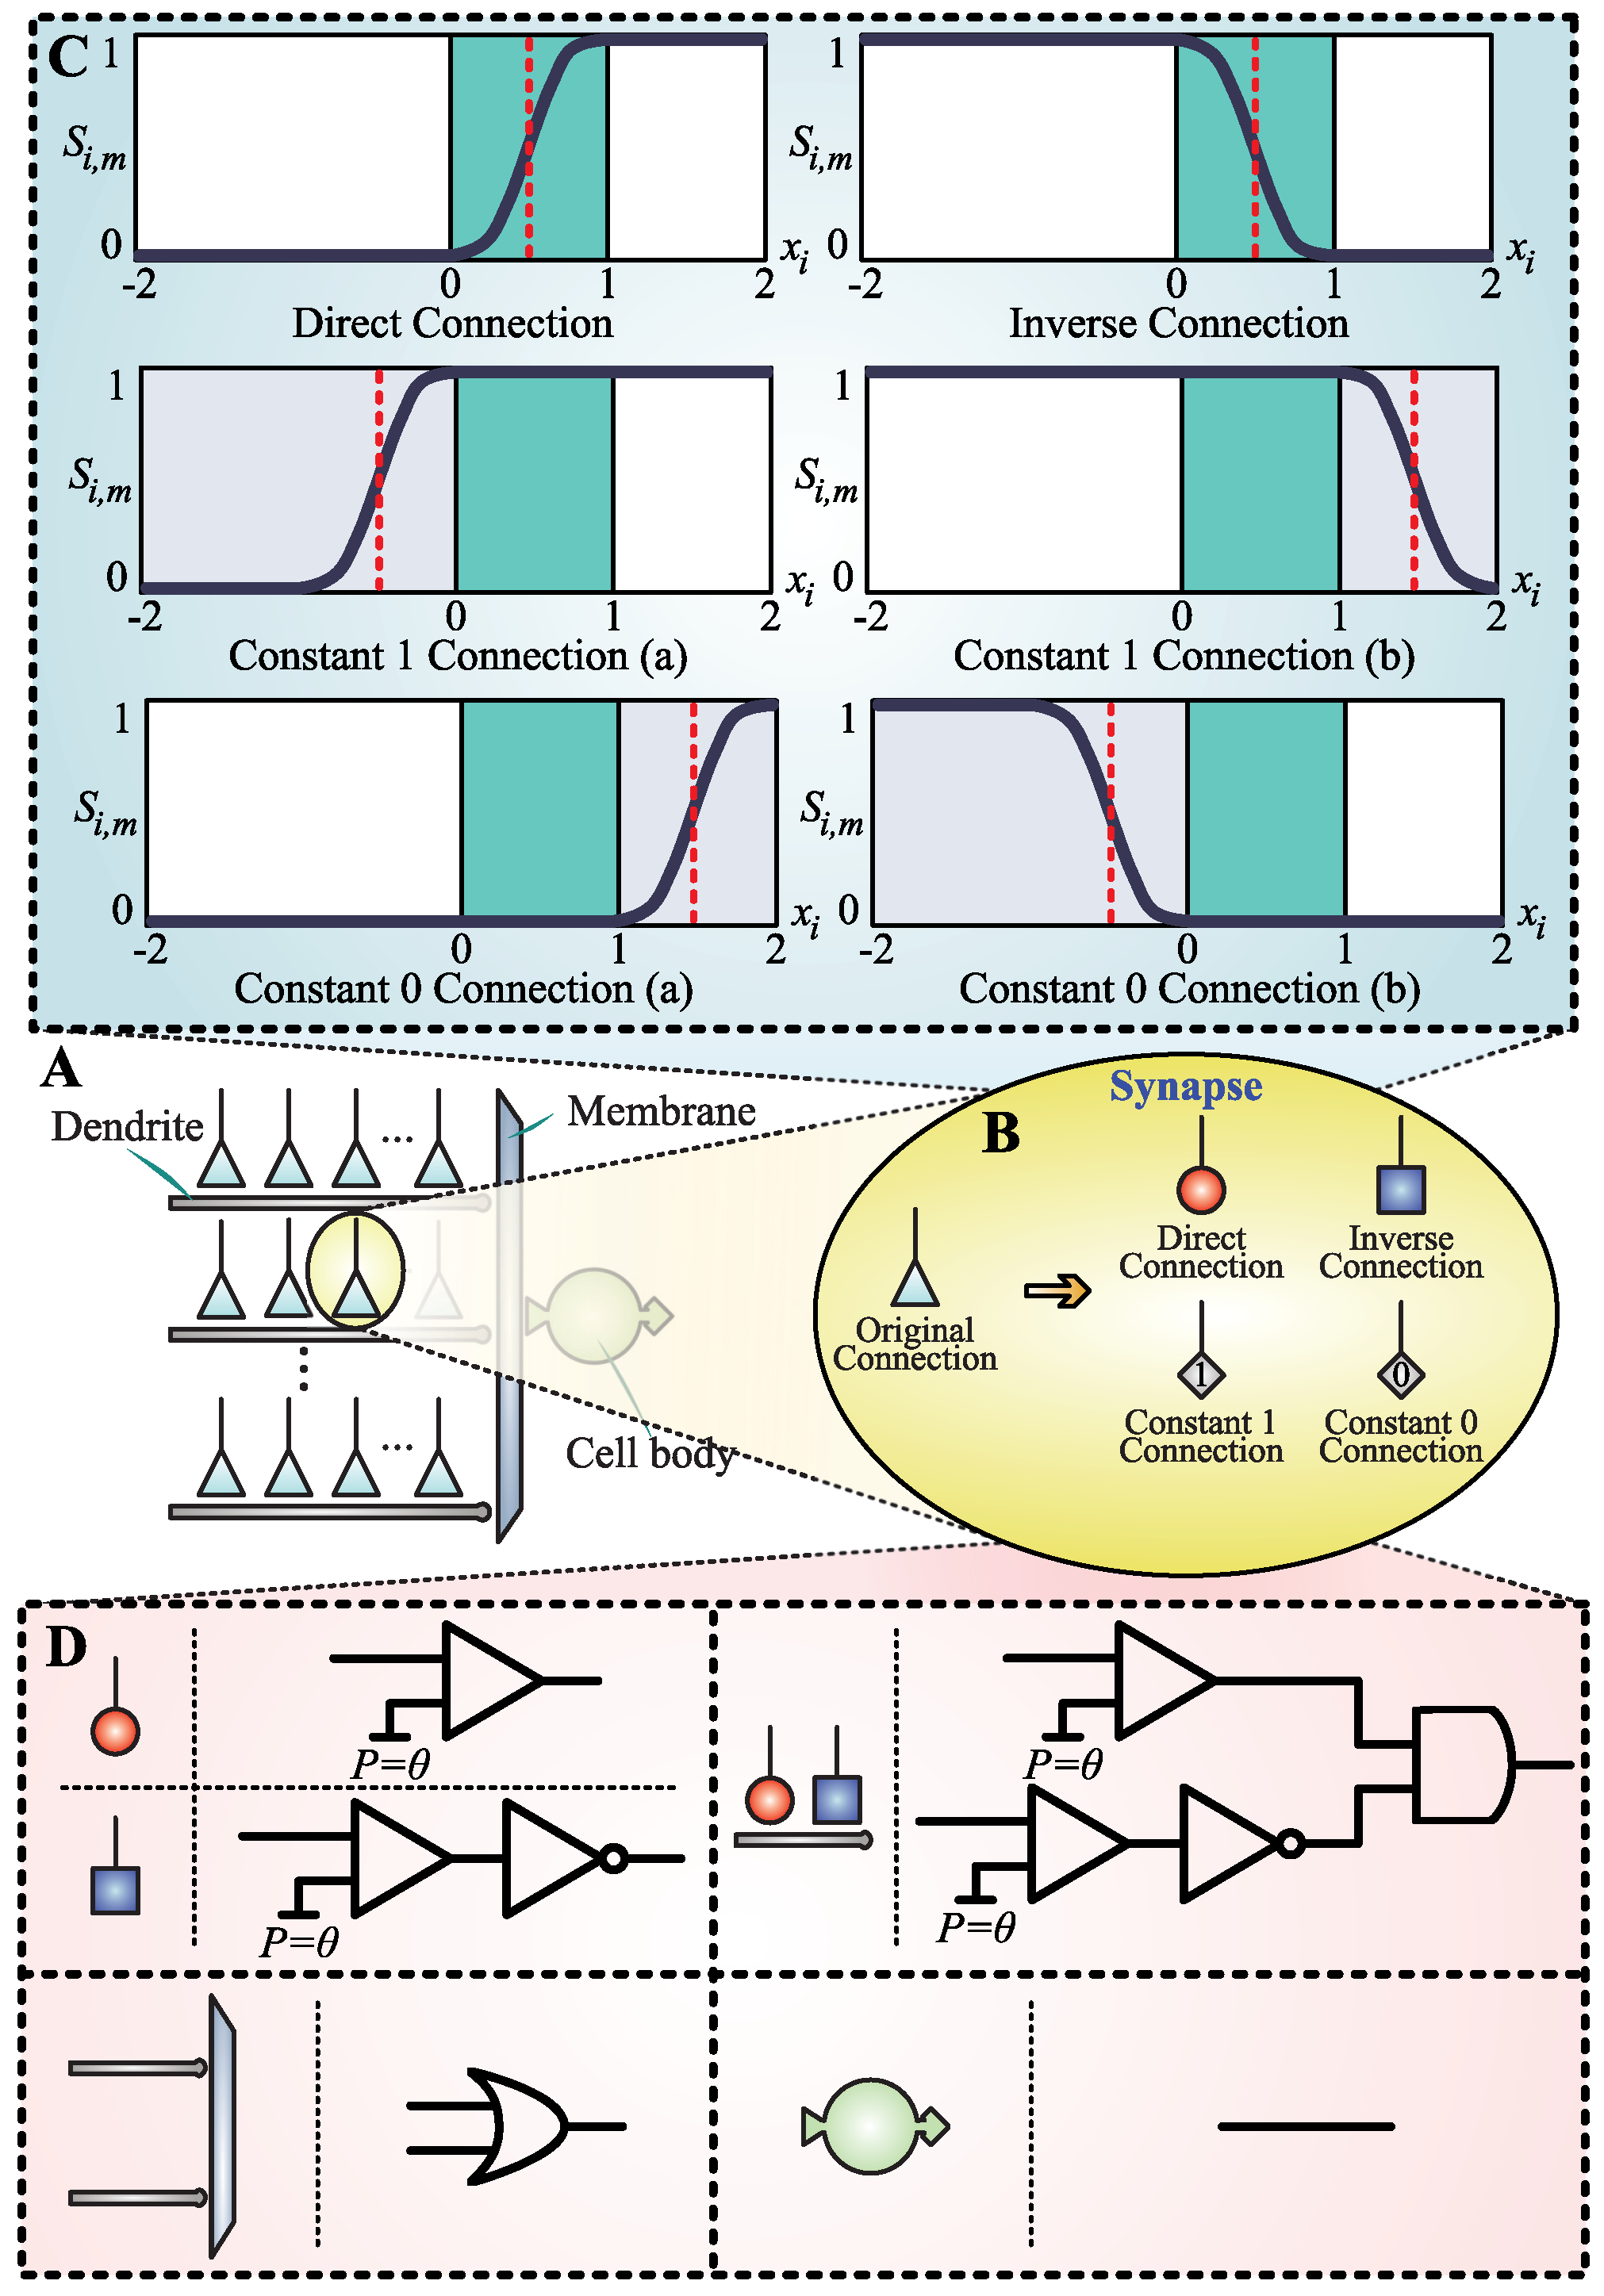
As mentioned above, the synapse is a neuronal junction between a neuron and its target neuron [71]. Neurons transmit nerve signals from axons to target neurons through neurotransmitters. Depending on the role played by the neurotransmitters in stimulating the target neurons, they can be divided into excitation or inhibition neurotransmitters [72]. In other words, if the potential change caused by the neurotransmitters stimulates the target neuron to an action, then it is an excitatory postsynaptic potential (EPSP). On the other hand, if it inhibits the target neuron, it is an inhibitory postsynaptic potential (IPSP) [73].
In the DNM, the synapses can evolve through learning and eventually form four types of connections: direct connection, inverse connection, constant 1 connection, and constant 0 connection, which are illustrated in Figure 2B. As shown in Figure 2C, six cases of connection states are presented, and each special connection state is described in detail as follows:
  • Direct connection ( 0 < q i , m < w i , m , with w i , m = 1.0 and q i , m = 0.5 .): In the case of a direct connection, the threshold signal and suprathreshold signal can cause an excitatory action potential. An EPSP is generated and delivered to the dendrite of the target neuron, which is approximately 1. Otherwise, the subthreshold signal is represented as an IPSP, and the synapse approximately outputs 0.
  • Inverse connection ( w i , m < q i , m < 0 , with w i , m = 1.0 and q i , m = 0.5 .): Contrary to the direct connection, an inhibitory action potential is caused by the threshold signal and suprathreshold signal in an inverse connection. It means that the synapse produces an IPSP, and its output is approximately 0. Conversely, the subthreshold causes an excitatory synapse, and an EPSP is triggered. The output of this synapse is close to 1.
  • Constant 1 connection ( q i , m < 0 < w i , m , with w i , m = 1.0 and q i , m = 0.5 ; q i , m < w i , m < 0 , with w i , m = 1.0 and q i , m = 1.5 .): There are two cases for constant 1 connection. In both cases, the synapse can only output an EPSP regardless of the input signal. It means that the synapse ignores the input and consistently outputs 1.
  • Constant 0 connection ( 0 < w i , m < q i , m , with w i , m = 1.0 and q i , m = 1.5 ; w i , m < 0 < q i , m , with w i , m = 1.0 and q i , m = 0.5 .): This is the same as the constant 1 connection in that there are also two cases for the constant 0 connection. However, contrary to the constant 1 connection, the subthreshold, threshold, and suprathreshold signals can all cause an IPSP in a constant 0 connection. In other words, no matter what the input signal is, the synapse remains at approximately 0 output.

2.1.3. Neural Pruning Scheme

During the normal growth of the nervous system, the synapses and dendrites can be selectively pruned without losing the neurons [74]. This pruning phenomenon is widely described and provides an important neuroplasticity mechanism in neurodevelopment [75,76]. In the DNM, the neuronal pruning scheme can be divided into two stages: the synaptic pruning stage and the dendritic pruning stage.
  • Synaptic pruning stage: In the dendritic function, the multiplication operation is used and any value multiplied by 1 is equal to itself. The output of the synapse in the constant 1 connection state is always 1, which suggests that these synapses do not contribute to dendritic function. Therefore, these synapses can be eliminated without affecting the results.
  • Dendritic pruning stage: Similar to the synaptic pruning stage, any value multiplied by 0 is equal to 0, and the output of the synapse in the constant 0 connection always remains 0. Thus, even if there is only one synapse in a constant 0 connection state on a dendrite, the other synapses in the entire dendrite can be ignored. The linear summation operation is adopted in the membranous function, which indicates that the entire dendrites have no effect on the membrane. Those dendrites that contain synapses with a constant 0 connection state can be pruned completely.

2.1.4. Hardware Scheme

After synaptic pruning and dendritic pruning, only the synapses in the direct and inverse connections states are retained, and a unique neuron topology is formed for the task. Furthermore, a simplified neuron topology structure can be implemented through logic circuits, which is shown in Figure 2D. Specifically, the synapse in a direct connection can be simulated by a comparator, and the synapse in an inverse connection can be replaced by a combination of a comparator and a logic NOT gate. The corresponding action potential θ in each synapse refers to Equation (2). For the dendritic function, the connection of synapses on dendrites can be realized with logic AND gates. Then, the outputs of the dendrites are collected and transmitted to the membrane, and the linear summation operation in the membrane is equivalent to a logic OR gate. Finally, the cell body can be implemented with a wire. Compared with other machine learning methods, this logic circuit circumvents floating-point arithmetic and therefore requires very little computing resources to perform complex classification.

2.2. Orientation Detection Mechanism

Recent advances in morphology, physiology, and developmental biology have demonstrated that the microcircuit plays a crucial role in the activity of cortical neurons, such as the generation of direction selectivity [77,78]. Studies have confirmed that the interaction between synapses and dendrites can only perform simple logical operations [79,80,81,82]. The active electrical property of a dendrite lays the foundation for neural computation, which is also the basis of the brain [83]. As shown in Figure 3A, the human layer 2/3 cortical neurons can implement logical AND, OR, and AND operations, and a related model has been proposed [84]. It is worth mentioning that the DNM can perfectly realize this biological model, and the corresponding models are presented in Figure 3B.
Studies have shown that the brain is similar to a digital computer [85,86,87]. To be specific, they both transmit information through electrical signals and contain a large number of base units that can only perform simple operations [88,89]. The limited medium in the sensory space in which physiological stimuli can elicit sensory neuronal responses is called the receptive field [90]. As seen in Figure 3C, an individual neuron is not capable of generating orientation selectivity, and the neurons in the receptive field cooperate to produce local orientation information. When the edge of the dark or bright bar in the receptive field is horizontal, the local orientation is judged to be 0 . In the same way, the edges of the dark or bright bars that are vertical will be regarded as 90 . Similarly, when the dark or bright bars are placed diagonally or anti-diagonally, the local orientation information of 135 and 45 will be generated respectively. Note that, when the projection in the receptive field is chaotic or pure, in other words, when there is no orientation information in image, the neurons are in a state of mutual inhibition or collective rest. Based on this, we propose a relatively simple possible solution to the interaction of neurons in the receptive field. The preliminary orientation detection mechanism (ODS-01) is implemented by the DNM, which only contains the simplest logical XOR operations, which can be observed in Figure 3D. After the collaboration of six neurons, three binary code outputs ( N 2 , N 1 , and N 0 ) can be obtained, which indicate that the corresponding neurons are in an active or resting state. As shown in Table 1, N 2 , N 1 , and N 0 suggest the local orientation information of the receptive field. Finally, all the local orientation information is aggregated. The orientation of the object in the image is judged based on the stimulation degree of all neurons, which is consistent with the orientation of the neuron with the highest activation intensity.
However, the results of the noise experiments show that although ODS-01 is simple, its anti-noise ability is very poor. In addition, we found that ODS-01 is not foolproof. To be specific, when the object in the image has only a single pixel, there is no doubt that it has no orientation information, which is shown in Figure 4A. From Figure 4B, we can observe that ODS-01 shows the same response in 45 and 135 orientations, which is undoubtedly inconsistent with the facts. We further hypothesize that neurons inhibited each other in response to neurons with supplementary angles and propose the second-generation orientation detection mechanism (ODS-02) [91,92,93]. It can be found that the responses of ODS-02 in 45 and 135 orientations counteracted each other, which is shown in Figure 4C. Finally, differences in intercortical connections can lead to a diversity of circuits [94,95]. Considering the diversity of colors in color images, we refine and propose the third-generation orientation detection mechanism (ODS-03), which is presented in Figure 4D.

3. Experiment and Discussion

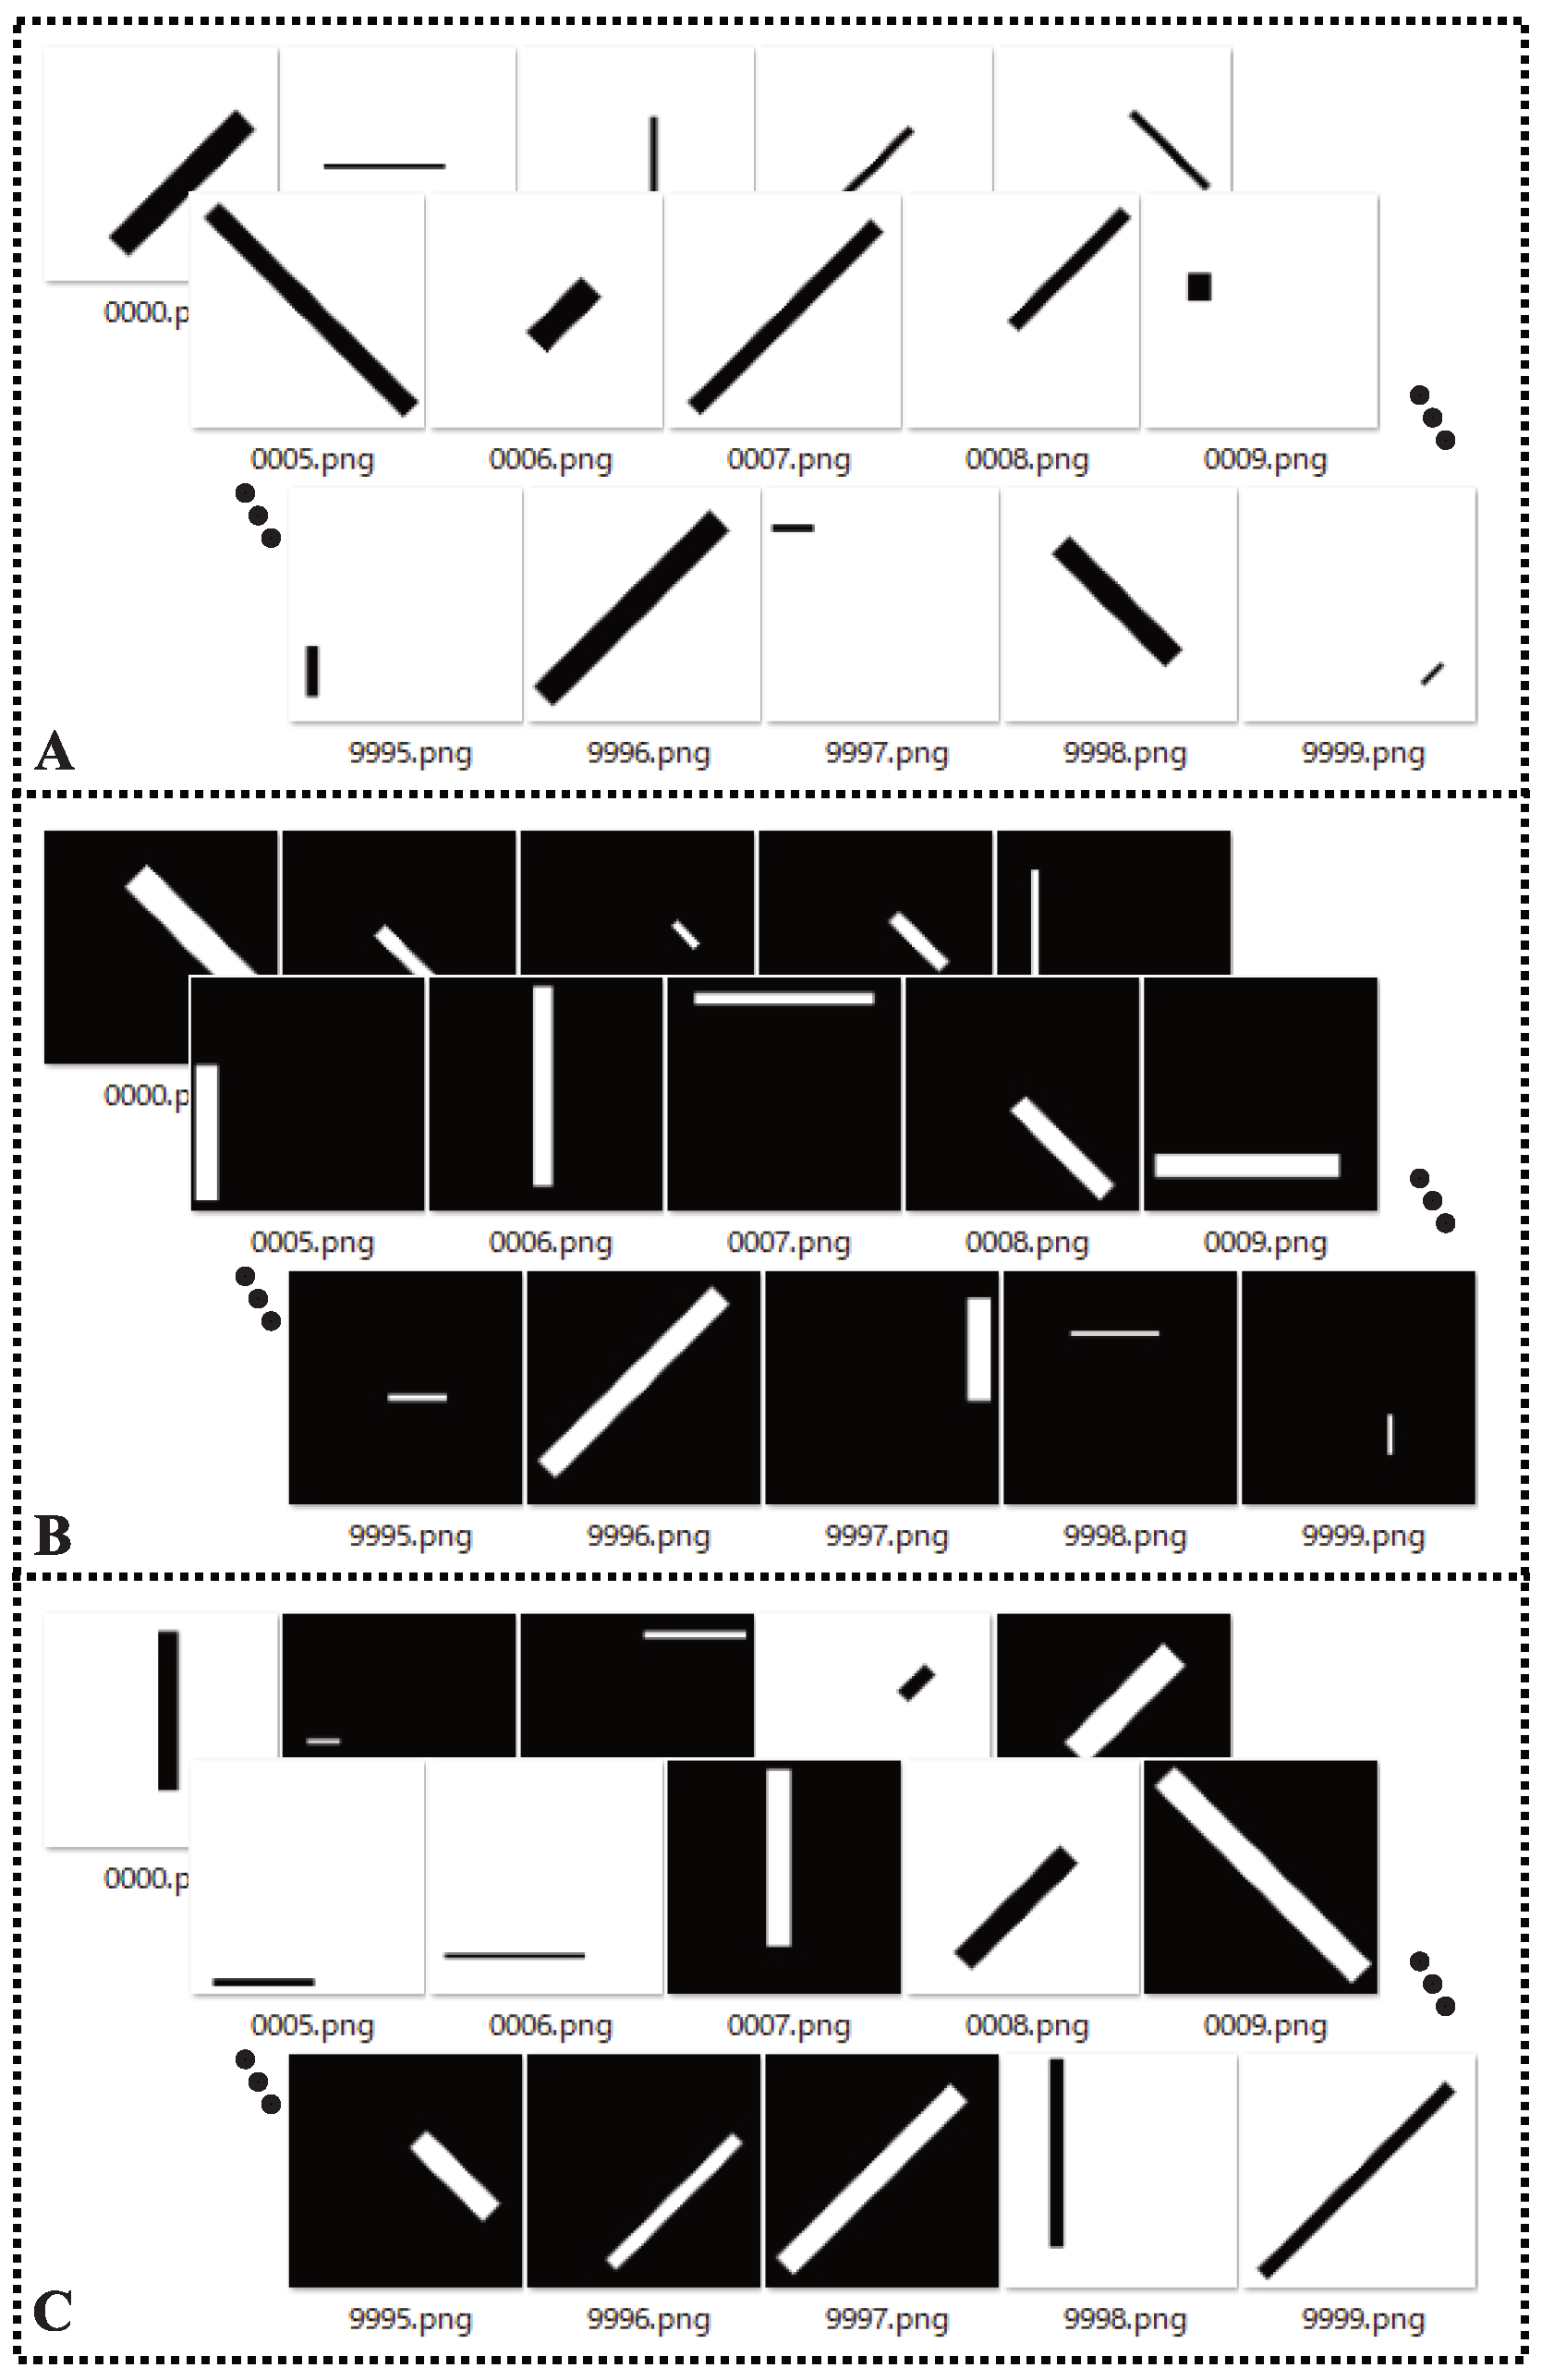
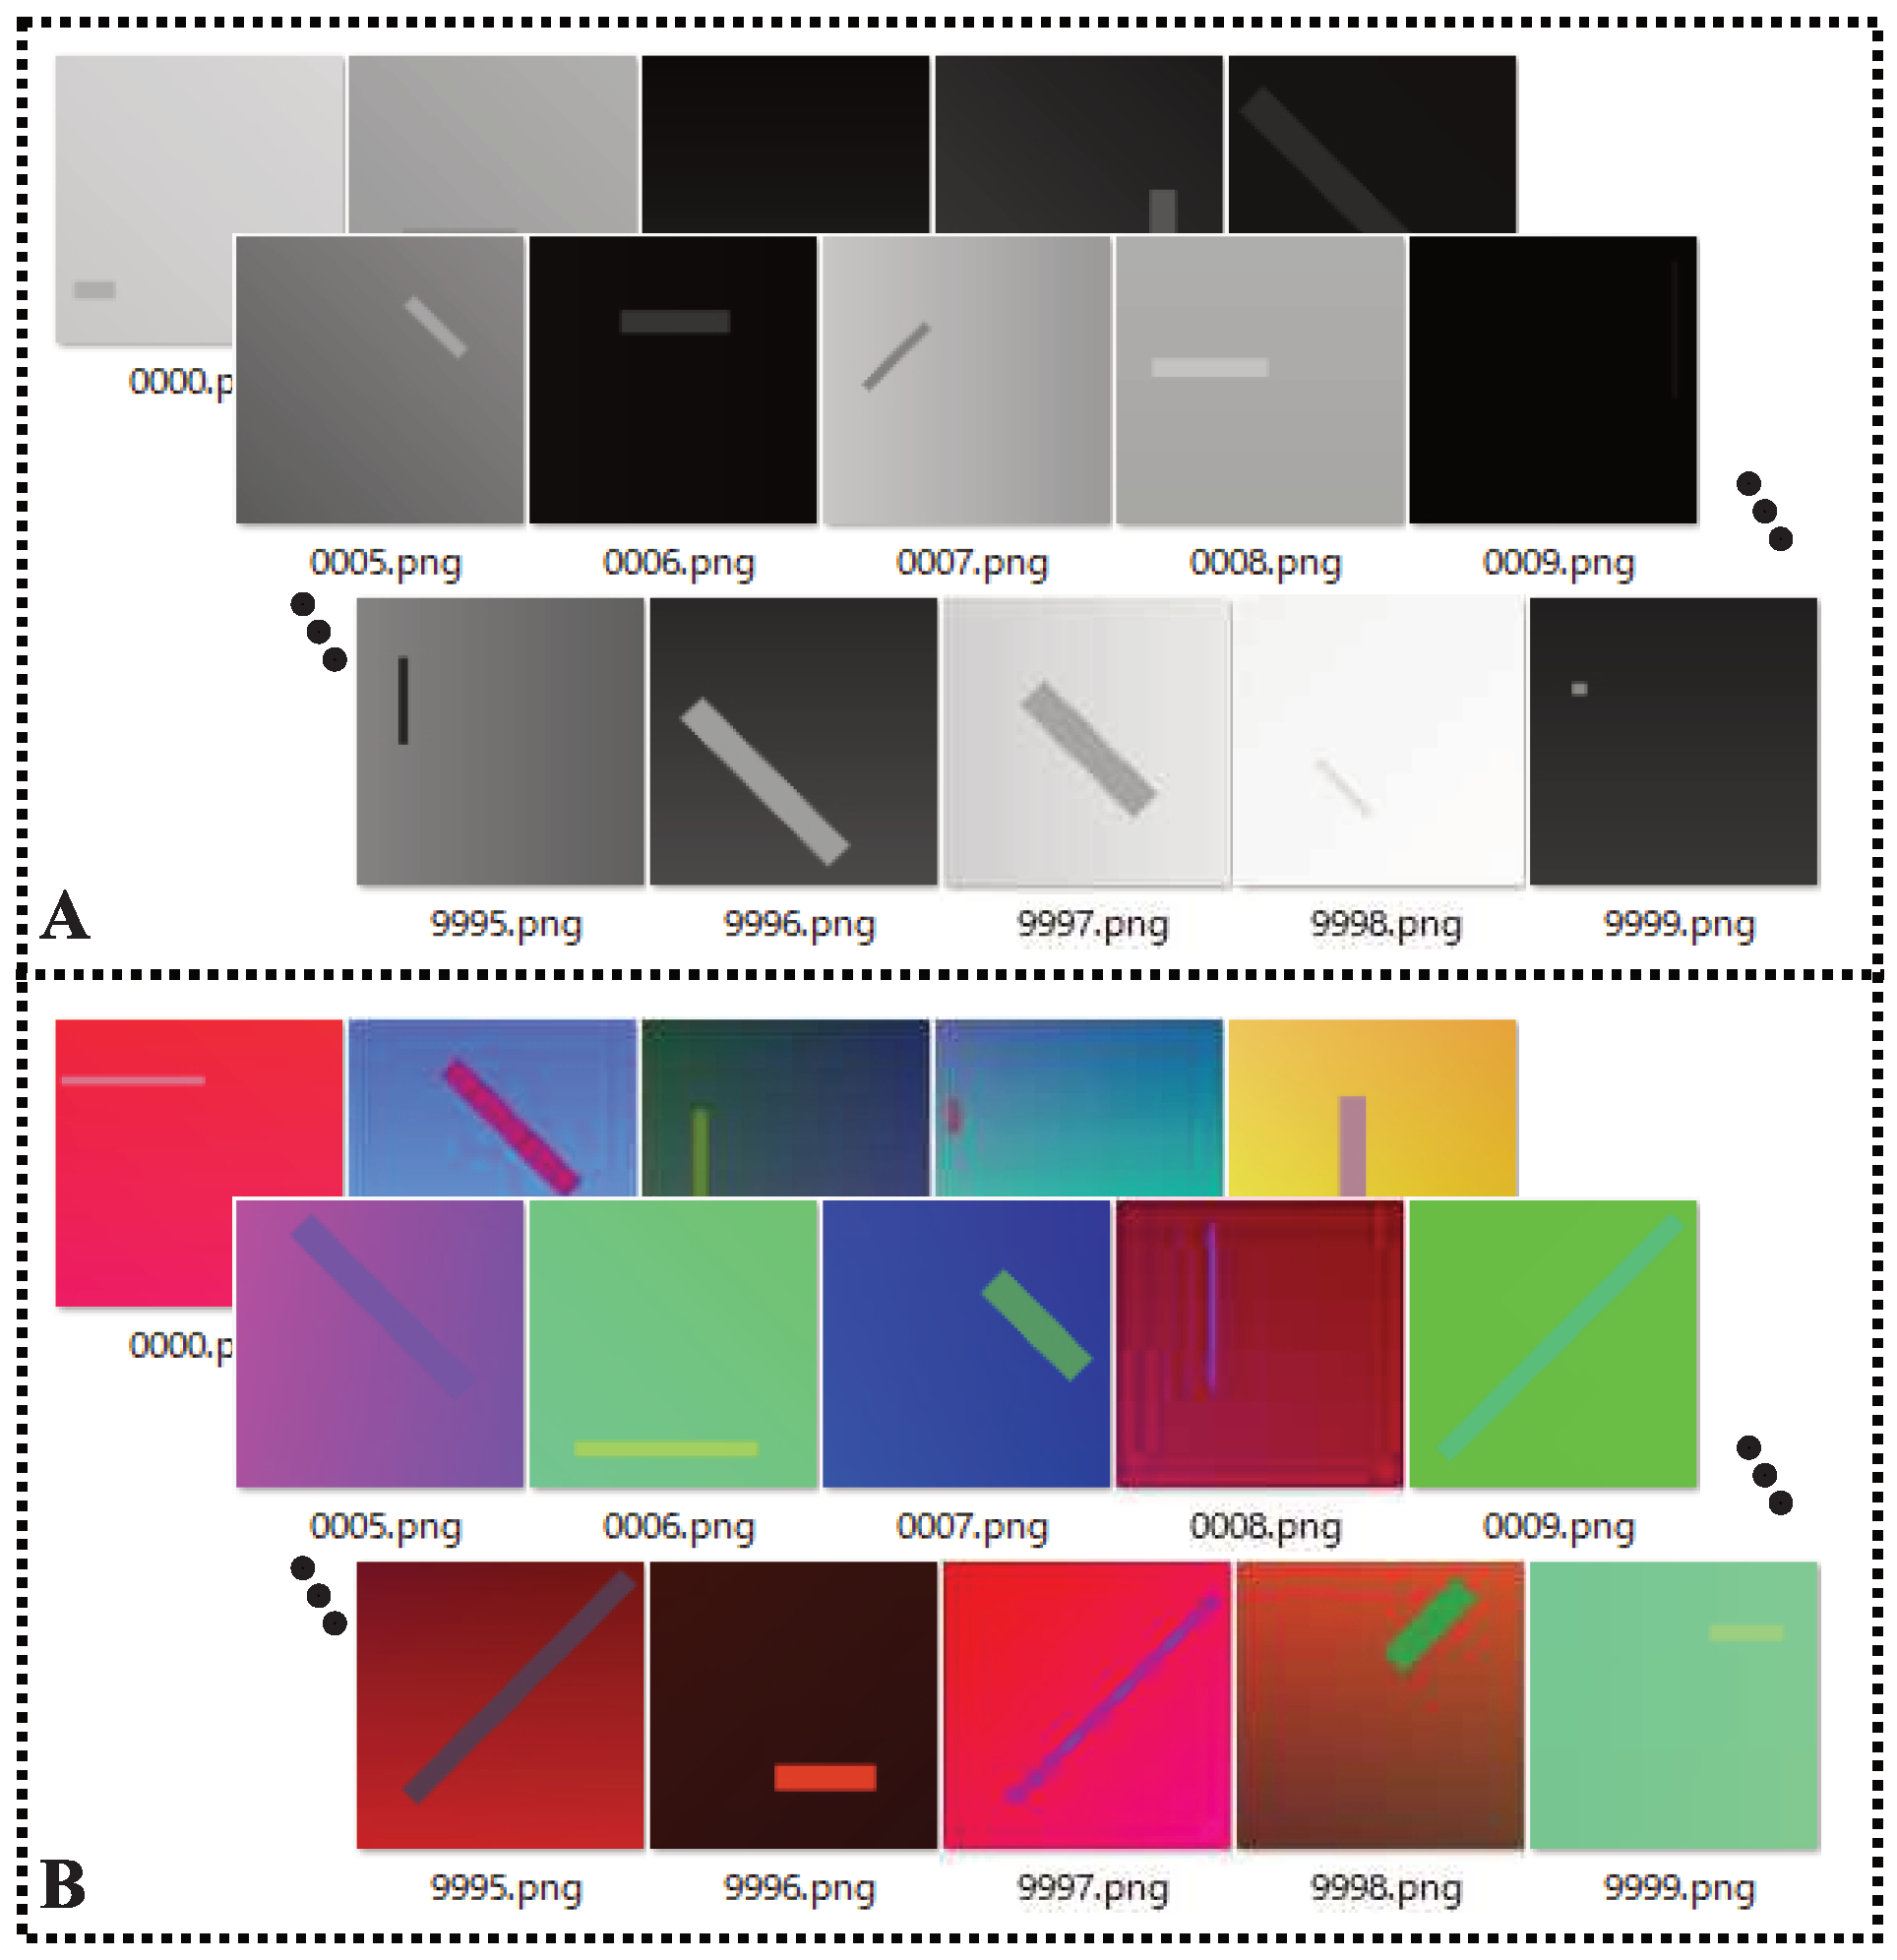
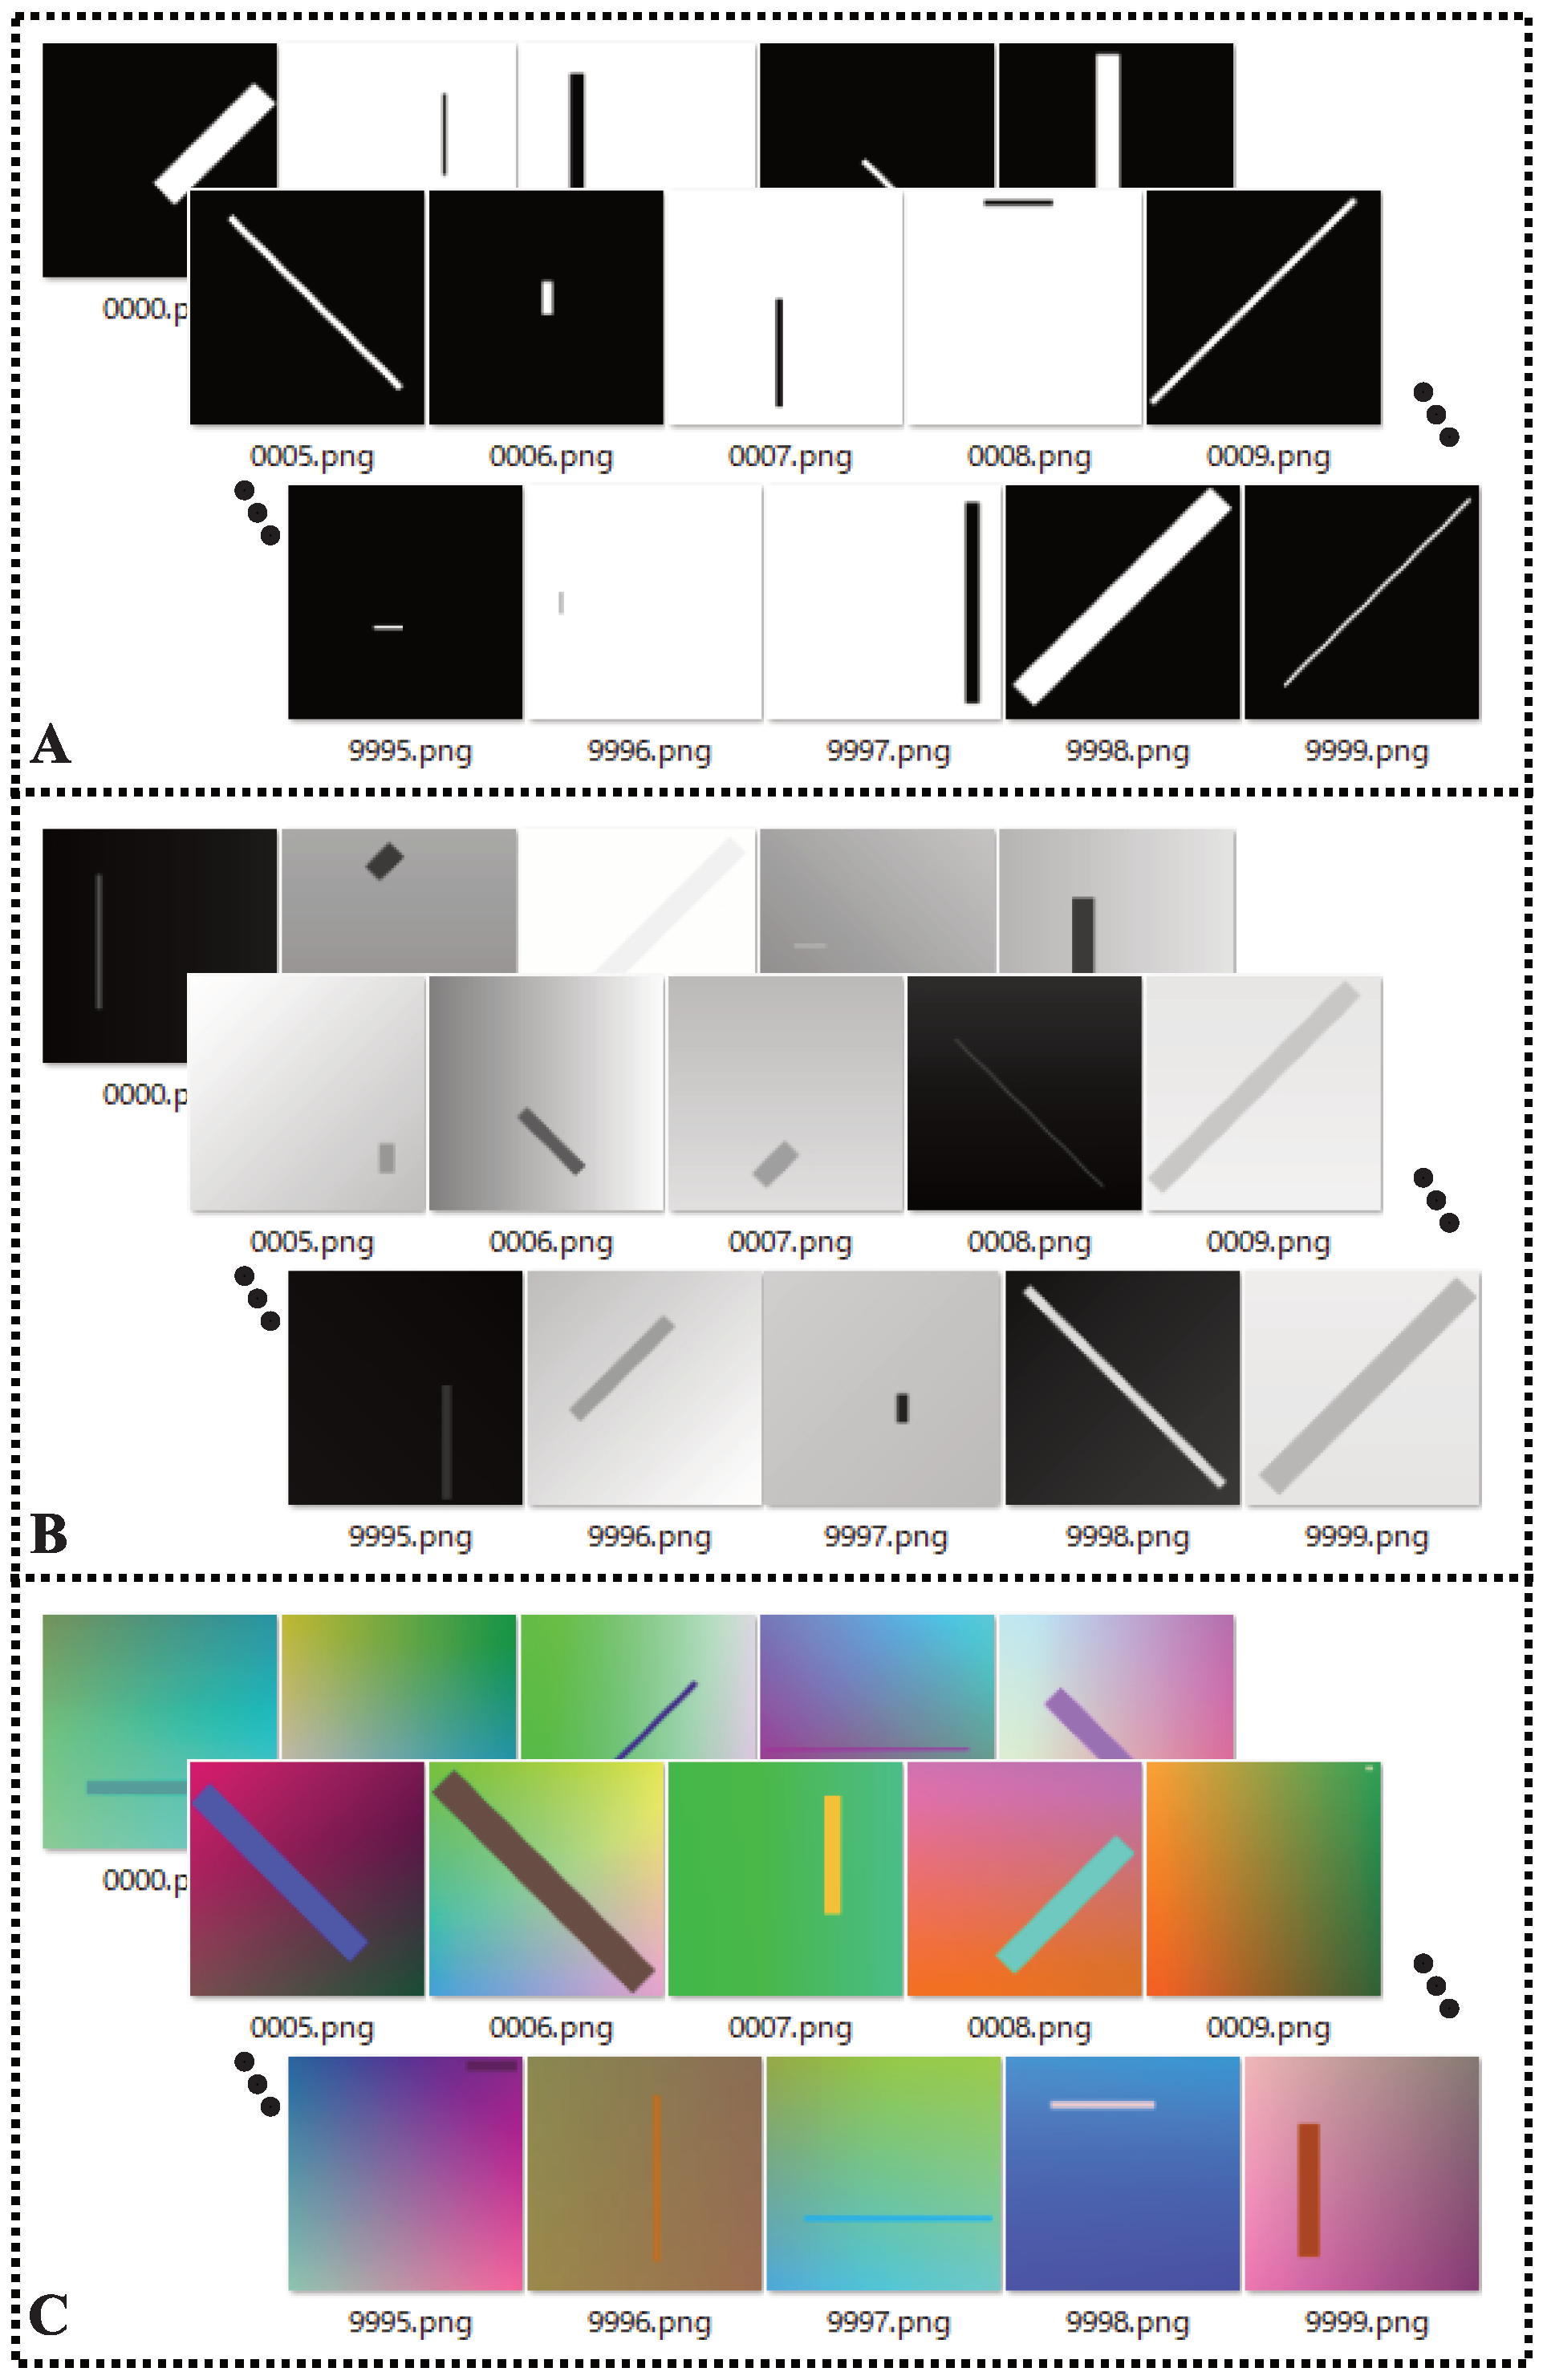
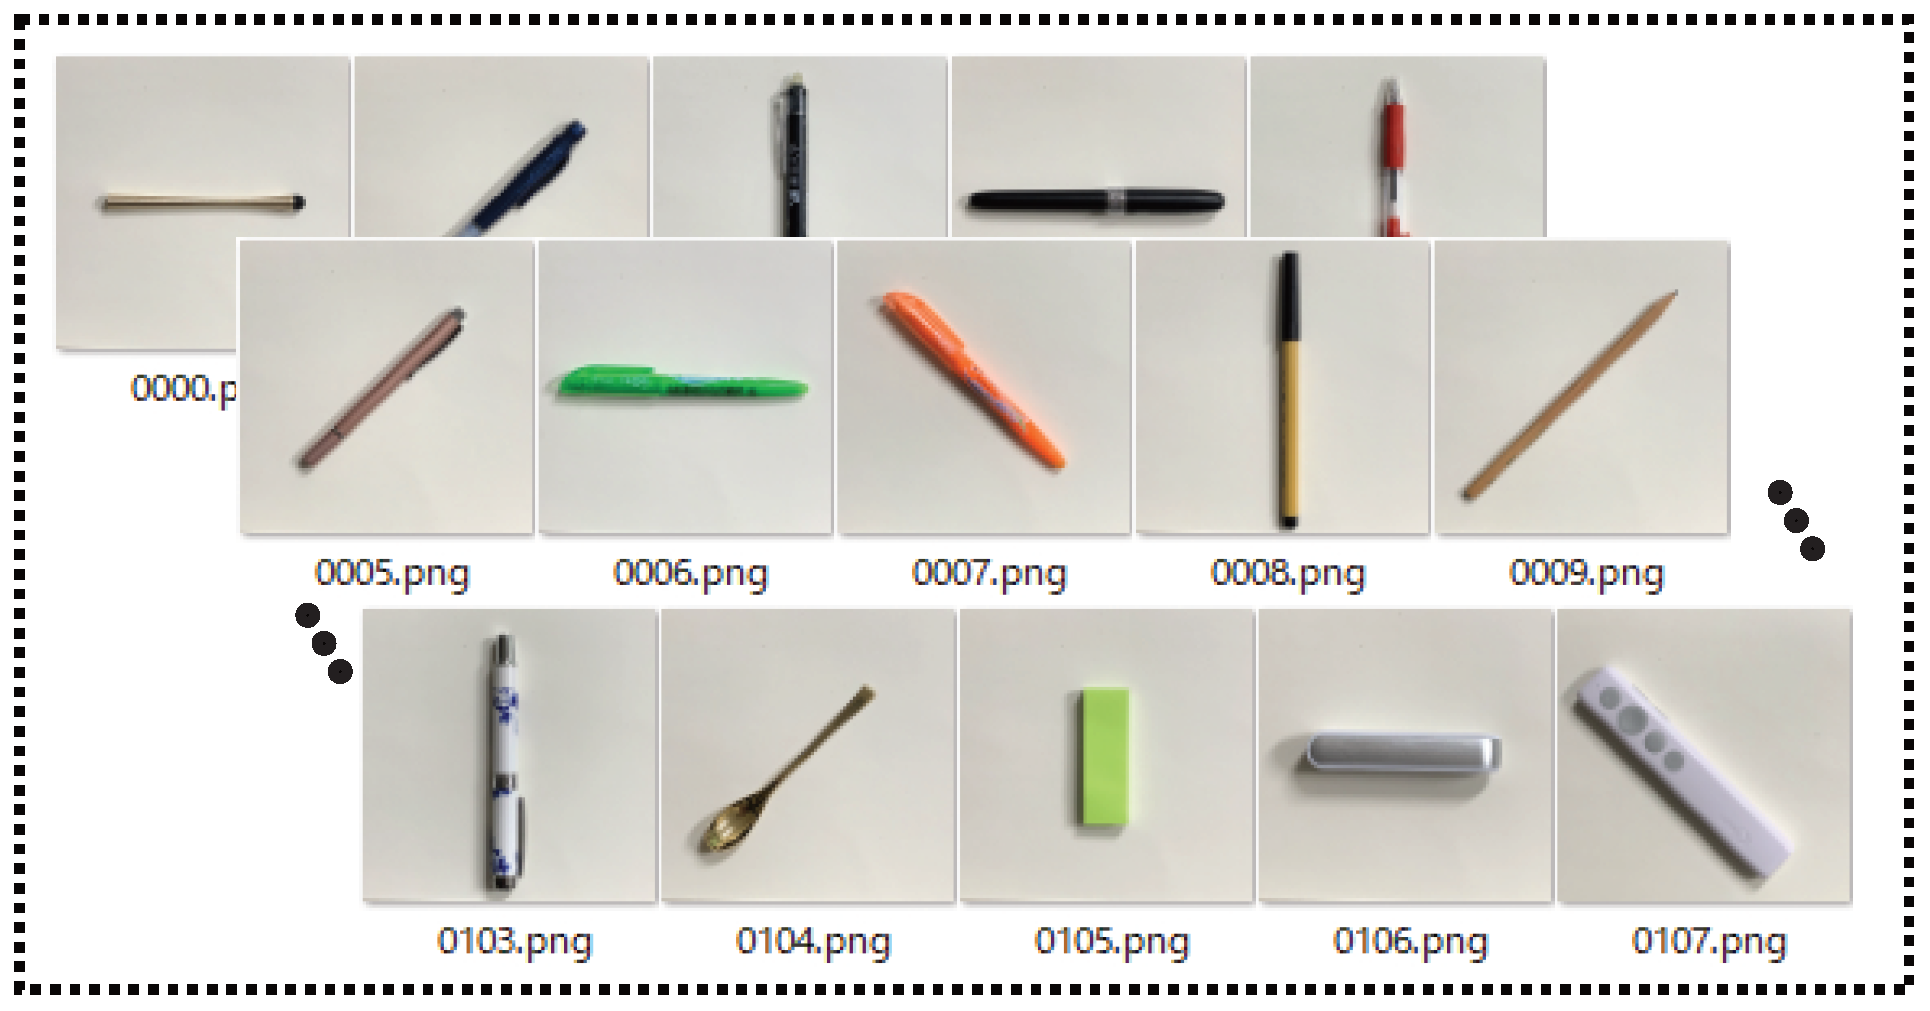
3.1. Experimental Setup

In our experiments, nine image datasets are used to estimate the performance of ODSs and a randomly positioned bar with arbitrary size and orientation in each image, which are described in Figure 5, Figure 6, Figure 7 and Figure 8. Each of the first eight datasets contains 10,000 images. In the first five datasets, the image size is 100 × 100 pixels, which are generated randomly. In our generating process, the shapes are fixed in order to define the orientation more easily, and the specific labels of their own orientations are given by observation. In the first dataset, the background of the image is set to be white and the object is black. On the contrary, the object is white and the background is black in the second dataset. In the third dataset, the colors of the background and objects are generated randomly. Grayscale images are considered in the fourth dataset, which is also determined randomly. To further examine the effectiveness of the mechanism, color images are utilized in the fifth dataset. The colors of the background and objects in the color dataset are also randomly generated. With the advancement of technology, the capacity of photographs to cover the fine structures of the actual world has been improved [96]. In the last decade, large-scale visual recognition has become a challenge and has attracted the attention of many researchers [97]. Therefore, large-scale binary, grayscale, and color images (1000 × 1000 pixels) are adopted in the next three datasets. Finally, the actual photographs (3024 × 3024 pixels) are selected to estimate the utility of the mechanism. We use different long objects that can be found in our daily life such as pencil, remote controller, sticky notepad, spoon, and so on as the subjects of this study. All experiments are independently performed 30 times to avoid statistical randomness.

3.2. Performance Evalution Criteria

The following two criteria are adopted to evaluate the performance of the mechanisms:
  • Accuracy: This indicates the rate at which the orientations judged by the mechanism match the corresponding target orientations in the datasets. The mean and standard deviation (mean ± std) of the accuracy rates are provided to compare these mechanisms.
  • Nonparametric statistical method: Wilcoxon signed rank test is employed as a nonparametric statistical method to determine whether there are significant differences between the mechanisms [26,98]. The p values computed for all the pairwise comparisons are provided, and the level of significance is set to be 0.05.

3.3. Comparisons of ODSs

First, the ODSs are applied to detect the orientation of objects in 10,000-pixel (100 × 100) image datasets. It can be seen in Table 2 that all ODSs are perfectly qualified for these tasks. In addition to the experiments on small-scale images, the performance of the ODSs on large-scale (1000 × 1000 pixels) images is also impressive. Therefore, we can conclude that regardless of whether the image is binary or grayscale, or even color, the ODSs are proven to be excellent orientation detection mechanisms in ideal datasets.
Furthermore, the performance of the ODSs on actual photographs aroused our interest. The performance of ODS-01 and ODS-02 on actual photographs has declined to 73.21 and 75.00, respectively, due to the complexity of the actual photographs. We can also clearly observe that the accuracy of ODS-02 with an inhibition mechanism is improved compared to conventional ODS-01, and ODS-03 with a relatively refined mechanism can still maintain 100.

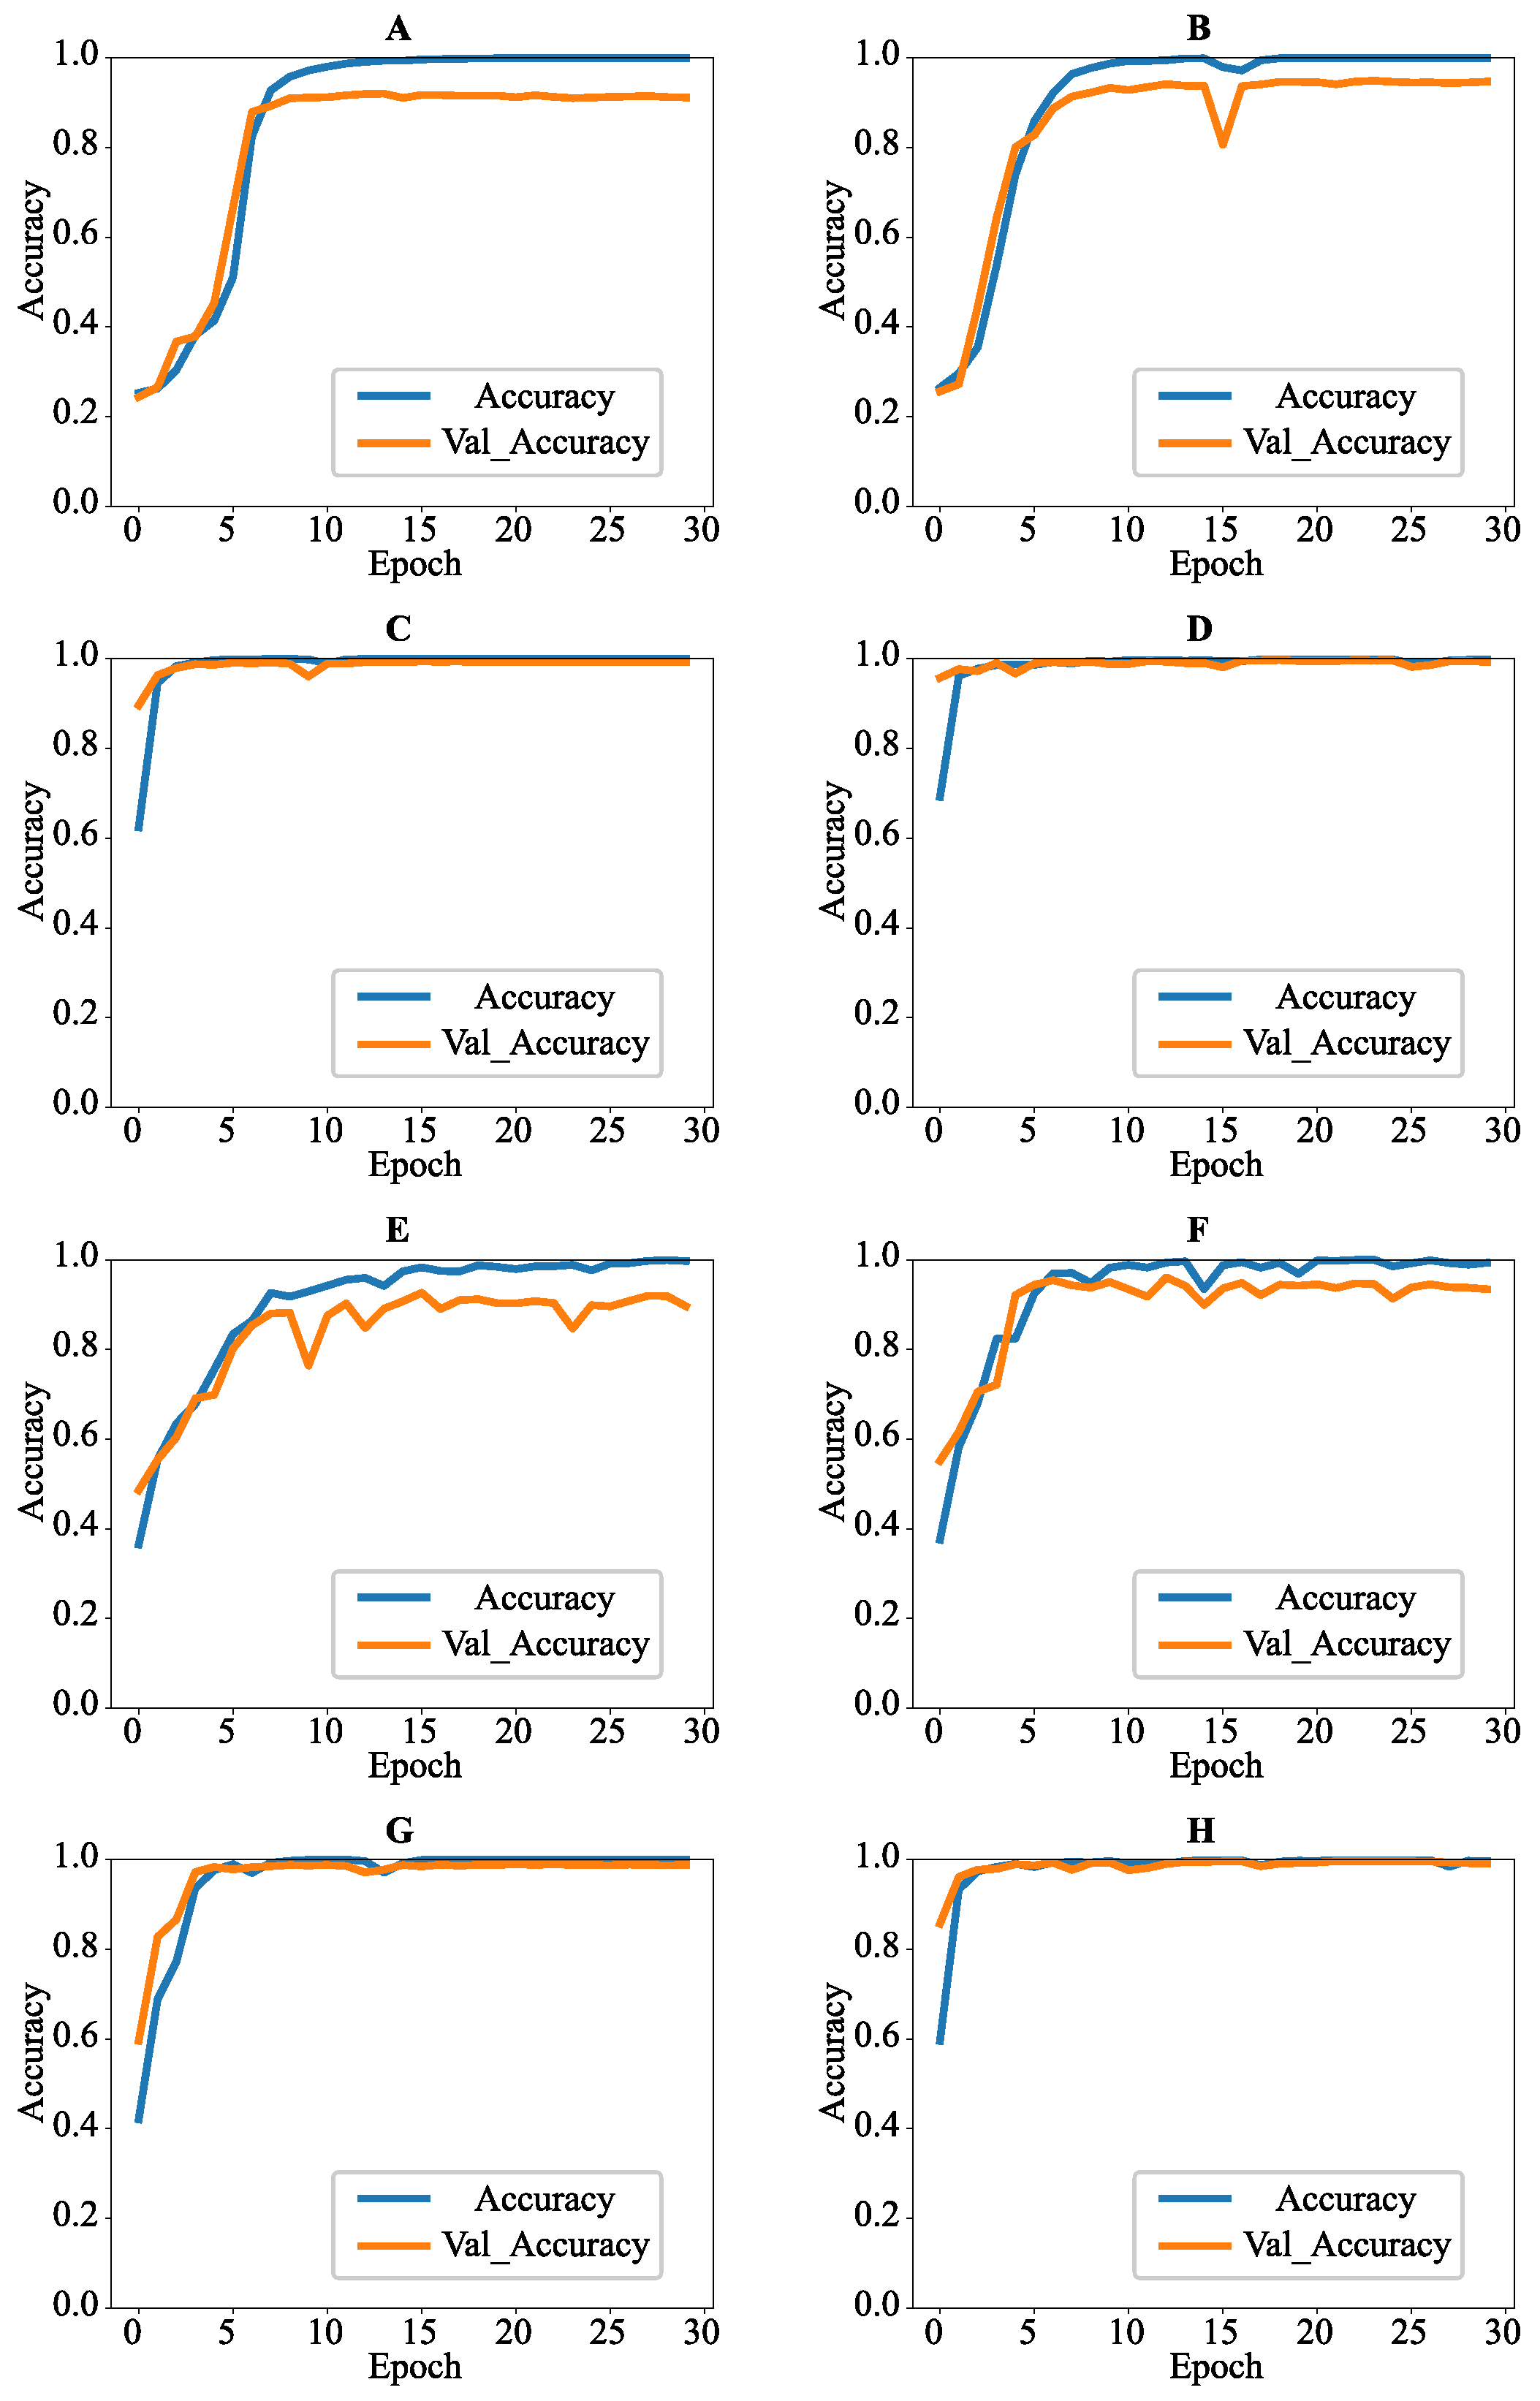
3.4. Comparisons of ODSs and CNNs

In this section, we compare the ODSs with the CNNs in 10,000-pixel (100 × 100) image datasets to further verify the detection performance of the ODSs, which are provided in Table 3. Each image is scanned only four times in the ODSs. Therefore, considering fairness of comparison, the number of convolutional layers is set to be 1, and the number of convolution kernels in the CNN-04 is set to be 4. In addition, the CNN-30 with 30 convolution kernels has also been adopted as a competitor for the ODSs. The tiling size of the convolutional layers is set to be 3 × 3. The pooling layer using a 2 × 2 tiling region reduces the dimensionality of the features. Sixty-four fully connected neurons are used in the fully connected layer. A method for stochastic optimization (ADAM) is employed as the learning algorithm. In order to ensure that the CNNs achieve the best results, the number of epochs is set to be 30. The training curves of CNNs are also provided in Figure 9. The CNNs are trained by 75% of the entire images, and their degree of learning is estimated on 25% of the images.
We find that as the dataset becomes complex, the performance of CNNs declines. The higher s t d values indicate that the performance of CNNs is unstable. It is obvious that all p values are less than the level of significance, which means that ODS-03 is significantly better than all CNNs. Moreover, we increase the convolutional layers of CNNs to improve their performance. The added convolutional layers contain sixty-four convolution kernels with 3 × 3 tiling regions. These experiments are conducted on the color images (100 × 100) dataset. As the consumption of computing resources increases, the accuracy has indeed improved. However, the accuracy and the corresponding statistical results still show that ODS-03 significantly outperforms the CNNs. Moreover, it is not worth the gain to consume huge computing resources in exchange for a small increase in the accuracy rate. In contrast, ODS-03 does not require learning and can be hardwareized by simple logic circuits. As logic operations rather than floating-point operations are used in the logic circuits, this undoubtedly increases the speed of data processing of ODS-03. Therefore, we can conclude that ODS-03 is able to achieve outstanding performance and satisfactory efficiency simultaneously in orientation detection when compared with the CNNs. Moreover, in orientation detection systems, running speed is also a crucial performance evaluation criterion. We conducted corresponding experiments with ODS, one-channel CNN, four-layer CNN, and EfN, comparing them in terms of speed. Table 4 displays the running speeds of the four systems. It is evident that ODS runs much faster than the other three systems.

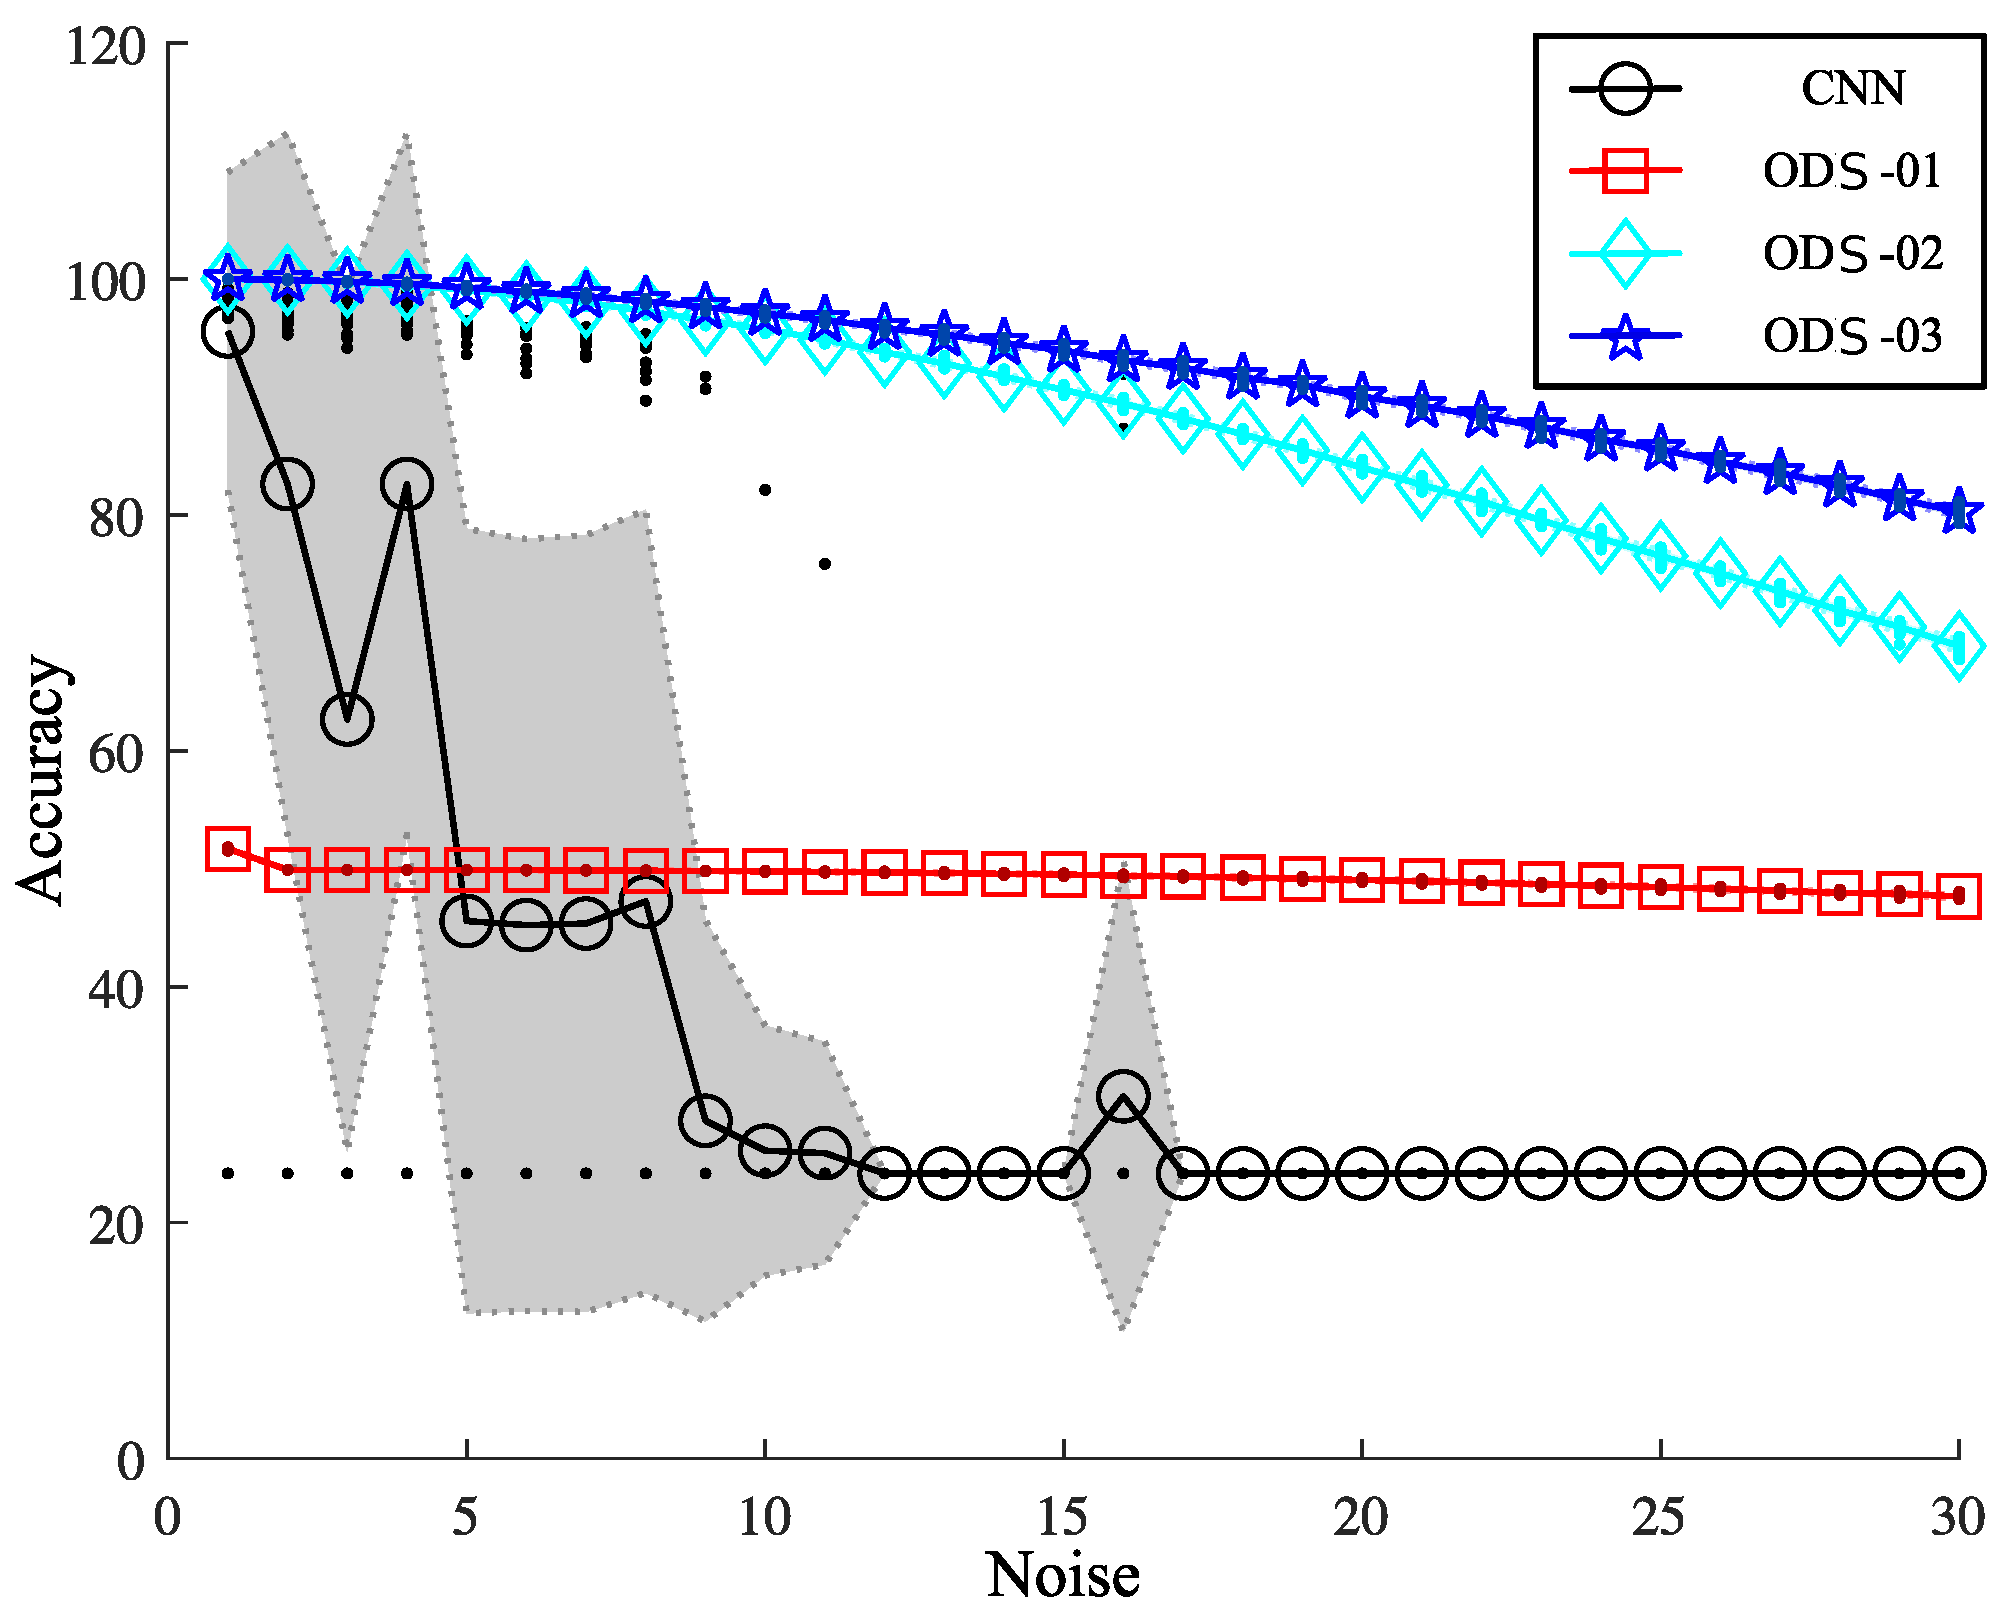
3.5. Performance of ODSs and CNN on Images with Noise

In this section, in order to further verify the ability of the ODSs to resist noise, salt-and-pepper noise is added to the color images (100 × 100) dataset to evaluate the performance of the mechanisms. The experiments are carried out on a wide range of noise densities, which are set within a range of 1% to 30%. In addition, the best performing CNN-30 in the previous section is employed as a competitor, which has four convolutional layers. It can be clearly observed in Table 5 that the accuracy of all mechanisms has declined even if the noise is only increased by 1% (100 pixels). Noise causes the accuracy of the CNN to decrease, and the large S t d values indicate that the CNN is extremely unstable. The CNN has completely lost its detection ability once the noise density reaches 12%. The accuracy of ODS-01 suggests that ODS-01 basically has no anti-noise ability. We speculate that this is due to the lack of inhibition mechanism, which is proved in the experiments with ODS-02. Compared with ODS-01, the accuracy of ODS-02 has been significantly improved. The accuracy of ODS-02 can still be maintained at 93.78% when the noise density reaches 12%. Even if the noise density is increased to 30%, the accuracy of ODS-02 can still reach 68.87%. The performance of the more refined ODS-03 has been further improved when compared to ODS-02 and maintains accuracy at 80.25%. The statistical results show that ODS-03 significantly outperforms CNN and ODS-01 in all cases of added noise density. Compared with ODS-02, ODS-03 can achieve comparable performance at 1% and 2% of the added noise density. As the noise density increases, the advantages of ODS-03 gradually emerge, enabling it to perform significantly better than ODS-02. Shaded error bars are also provided in Figure 10, which contains continuous shaded error regions around the accuracy lines rather than discrete bars. We can observe that the std value of the CNN is very large, while those of the ODSs are hardly noticeable. ODS-03 always produces the best results and has the slowest decline in its accuracy curve. Therefore, it can be concluded that ODS-03 not only has an excellent performance in orientation detection but also outstanding anti-noise capability.

4. Conclusions

In this work, we proposed a novel hardware-based orientation detection system (ODS) using dendritic computation and employed a combination of multiple DNMs to implement it. The ODS proposed in this study has the following advantages:
  • It is precise: The ODSs can make completely correct judgements for all tests without adding noise.
  • It is fast: Very little prior knowledge is used to design the mechanism and no iterative learning is required.
  • It is flexible: It has no limitation on the size of the image, and the shape, size, and location of the object in the image has no effect on the accuracy.
  • It has a simple structure: The ODSs combine several simple DNMs to complete complex tasks. Only the information of the positional relationship among objects in the image is considered.
  • Its structure allows parallel computation: All neurons at the same level can operate in parallel, making detection faster by parallel computation.
  • Its anti-noise capability is very powerful: The inhibition scheme bestows the ODSs with the ability to resist noise.
  • It can be further enhanced: The slightly more refined structural design in this study significantly improved the accuracy of the mechanism. We can foresee that further refinement will make the mechanism even stronger.
  • It can be further extended: In this study, a 2 × 2 receptive field is employed to detect four orientations of the objects. More complex interactions among receptive fields or wider receptive fields are considered to extract orientation information at more angles, which will be investigated in our future works.
  • It can be easily implemented by hardware: Benefiting from the easy hardware implementation property of the DNM, the ODSs can also be realized on simple devices such as field programmable gate arrays (FPGA). Being free from floating-point computation can further speed up the processing of data.
  • It is suitable for big data: The advantages mentioned above enable the ODS to handle explosive high-dimensional data with ease in the era of big data.
  • It is highly interpretable: Different from most black-box models in machine learning, the ODS is designed based on prior knowledge and corroborated with studies in physiology, anatomy, and neuroscience. Hence, we encourage researchers from relevant fields to conduct biological experiments to examine the proposed mechanism. When testing with a tiny light spot, the neurons in the corresponding receptive field show mutual inhibition or no response, as assumed, which can further verify the inhibition scheme in the ODSs. Therefore, we believe that the proposed system may provide a new perspective for understanding the relevant brain functions.
It is worth pointing out that the proposed method is only capable of identifying the orientation of simple objects and also needs to be compared with other neural identification techniques, such as the dedicated YOLO v.5 system.

Author Contributions

Conceptualization, Z.T. and Y.T.; methodology, M.N.; software, M.N. and B.L.; validation, T.C., C.T. and M.N.; formal analysis, R.S.; investigation, M.N.; resources, M.N.; data curation, B.L.; writing—original draft preparation, M.N.; writing—review and editing, T.C. and Z.T.; visualization, M.N.; supervision, Y.T.; project administration, Z.T.; funding acquisition, Z.T. All authors have read and agreed to the published version of the manuscript.

Funding

This work was supported by JSPS KAKENHI Grant No.23K11261.

Data Availability Statement

The data used in this study are limited access but available for reasonable requirement. Interested parties may request access by contacting corresponding author.

Conflicts of Interest

The authors declare no conflicts of interest.

References

  1. Knutsson, H. Filtering and Reconstruction in Image Processing. Ph.D. Thesis, Linköping University, Linköping, Sweden, 1982. [Google Scholar]
  2. Bigun, J. Optimal Orientation Detection of Linear Symmetry; Linköping University Electronic Press: Linköping, Sweden, 1987. [Google Scholar]
  3. Schwartz, J.H.; Jessell, T.M.; Kandel, E.R. Principles of Neural Science; Elsevier: New York, NY, USA, 1991. [Google Scholar]
  4. Squire, L.; Berg, D.; Bloom, F.E.; Du Lac, S.; Ghosh, A.; Spitzer, N.C. Fundamental Neuroscience; Academic Press: Cambridge, MA, USA, 2012. [Google Scholar]
  5. Fiske, S.T.; Taylor, S.E. Social Cognition; Mcgraw-Hill Book Company: New York, NY, USA, 1991. [Google Scholar]
  6. Sells, S.B.; Fixott, R.S. Evaluation of research on effects of visual training on visual functions. Am. J. Ophthalmol. 1957, 44, 230–236. [Google Scholar] [CrossRef] [PubMed]
  7. Medina, J. Brain Rules; Pear Press: Seattle, WA, USA, 2016. [Google Scholar]
  8. Priebe, N.J. Mechanisms of orientation selectivity in the primary visual cortex. Annu. Rev. Vis. Sci. 2016, 2, 85–107. [Google Scholar] [CrossRef] [PubMed]
  9. Perry, V.; Oehler, R.; Cowey, A. Retinal ganglion cells that project to the dorsal lateral geniculate nucleus in the macaque monkey. Neuroscience 1984, 12, 1101–1123. [Google Scholar] [CrossRef] [PubMed]
  10. Hubel, D.H.; Wiesel, T.N. Receptive fields, binocular interaction and functional architecture in the cat’s visual cortex. J. Physiol. 1962, 160, 106–154. [Google Scholar] [CrossRef]
  11. Kandel, E.R.; Schwartz, J.H.; Jessell, T.M.; Siegelbaum, S.; Hudspeth, A.J.; Mack, S. Principles of Neural Science; McGraw-Hill: New York, NY, USA, 2000; Volume 4. [Google Scholar]
  12. Solomon, S.G.; Lennie, P. The machinery of colour vision. Nat. Rev. Neurosci. 2007, 8, 276–286. [Google Scholar] [CrossRef] [PubMed]
  13. Shapley, R.; Hawken, M.J. Color in the cortex: Single-and double-opponent cells. Vis. Res. 2011, 51, 701–717. [Google Scholar] [CrossRef] [PubMed]
  14. Garg, A.K.; Li, P.; Rashid, M.S.; Callaway, E.M. Color and orientation are jointly coded and spatially organized in primate primary visual cortex. Science 2019, 364, 1275–1279. [Google Scholar] [CrossRef] [PubMed]
  15. Nath, A.; Schwartz, G.W. Electrical synapses convey orientation selectivity in the mouse retina. Nat. Commun. 2017, 8, 2025. [Google Scholar] [CrossRef]
  16. Tanaka, K. Cross-correlation analysis of geniculostriate neuronal relationships in cats. J. Neurophysiol. 1983, 49, 1303–1318. [Google Scholar] [CrossRef]
  17. Tanaka, K. Organization of geniculate inputs to visual cortical cells in the cat. Vis. Res. 1985, 25, 357–364. [Google Scholar] [CrossRef]
  18. Reid, R.C.; Alonso, J.M. Specificity of monosynaptic connections from thalamus to visual cortex. Nature 1995, 378, 281–284. [Google Scholar] [CrossRef] [PubMed]
  19. Bear, M.; Connors, B.; Paradiso, M.A. Neuroscience: Exploring the Brain; Jones & Bartlett Learning LLC: Burlington, MA, USA, 2020. [Google Scholar]
  20. Nagata, F.; Miki, K.; Imahashi, Y.; Nakashima, K.; Tokuno, K.; Otsuka, A.; Watanabe, K.; Habib, M. Orientation Detection Using a CNN Designed by Transfer Learning of AlexNet. In Proceedings of the 8th IIAE International Conference on Industrial Application Engineering 2020, Matsue, Japan, 26–30 March 2020; Volume 5, pp. 26–30. [Google Scholar]
  21. Gershgorn, D. The data that transformed AI research—And possibly the world. Quartz 2017, 26, 2013–2017. [Google Scholar]
  22. Krizhevsky, A.; Sutskever, I.; Hinton, G.E. Imagenet classification with deep convolutional neural networks. Adv. Neural Inf. Process. Syst. 2012, 25, 1097–1105. [Google Scholar] [CrossRef]
  23. Deshpande, A. The 9 Deep Learning Papers You Need to Know about (Understanding CNNs Part 3); University of California (UCLA): Los Angeles, CA, USA, 2018; p. 12–04. [Google Scholar]
  24. Yang, L.; Qi, Z.; Liu, Z.; Liu, H.; Ling, M.; Shi, L.; Liu, X. An embedded implementation of CNN-based hand detection and orientation estimation algorithm. Mach. Vis. Appl. 2019, 30, 1071–1082. [Google Scholar] [CrossRef]
  25. Joshi, U.; Guerzhoy, M. Automatic photo orientation detection with convolutional neural networks. In Proceedings of the 2017 14th Conference on Computer and Robot Vision (CRV), Edmonton, AB, Canada, 16–19 May 2017; pp. 103–108. [Google Scholar]
  26. Hollander, M.; Wolfe, D.A.; Chicken, E. Nonparametric Statistical Methods; John Wiley & Sons: Hoboken, NJ, USA, 2013; Volume 751. [Google Scholar]
  27. Jiang, Y.; Zhu, X.; Wang, X.; Yang, S.; Li, W.; Wang, H.; Fu, P.; Luo, Z. R2cnn: Rotational region cnn for orientation robust scene text detection. arXiv 2017, arXiv:1706.09579. [Google Scholar]
  28. Zhao, T. 3D convolutional neural networks for efficient fault detection and orientation estimation. In SEG Technical Program Expanded Abstracts 2019; Society of Exploration Geophysicists: Houston, TX, USA, 2019; pp. 2418–2422. [Google Scholar]
  29. Guidotti, R.; Monreale, A.; Ruggieri, S.; Turini, F.; Giannotti, F.; Pedreschi, D. A survey of methods for explaining black box models. ACM Comput. Surv. CSUR 2018, 51, 1–42. [Google Scholar] [CrossRef]
  30. Bilbrey, J.A.; Heindel, J.P.; Schram, M.; Bandyopadhyay, P.; Xantheas, S.S.; Choudhury, S. A look inside the black box: Using graph-theoretical descriptors to interpret a Continuous-Filter Convolutional Neural Network (CF-CNN) trained on the global and local minimum energy structures of neutral water clusters. J. Chem. Phys. 2020, 153, 024302. [Google Scholar] [CrossRef]
  31. Correia-Silva, J.R.; Berriel, R.F.; Badue, C.; De Souza, A.F.; Oliveira-Santos, T. Copycat CNN: Are random non-Labeled data enough to steal knowledge from black-box models? Pattern Recognit. 2021, 113, 107830. [Google Scholar] [CrossRef]
  32. Tang, Z.; Tamura, H.; Kuratu, M.; Ishizuka, O.; Tanno, K. A model of the neuron based on dendrite mechanisms. Electron. Commun. Jpn. Part III Fundam. Electron. Sci. 2001, 84, 11–24. [Google Scholar] [CrossRef]
  33. Tang, Z.; Tamura, H.; Ishizuka, O.; Tanno, K. A neuron model with interaction among synapses. IEEJ Trans. Electron. Inf. Syst. 2000, 120, 1012–1019. [Google Scholar]
  34. Todo, Y.; Tamura, H.; Yamashita, K.; Tang, Z. Unsupervised learnable neuron model with nonlinear interaction on dendrites. Neural Netw. 2014, 60, 96–103. [Google Scholar] [CrossRef] [PubMed]
  35. Ji, J.; Gao, S.; Cheng, J.; Tang, Z.; Todo, Y. An approximate logic neuron model with a dendritic structure. Neurocomputing 2016, 173, 1775–1783. [Google Scholar] [CrossRef]
  36. Todo, Y.; Tang, Z.; Todo, H.; Ji, J.; Yamashita, K. Neurons with multiplicative interactions of nonlinear synapses. Int. J. Neural Syst. 2019, 29, 1950012. [Google Scholar] [CrossRef] [PubMed]
  37. Ji, J.; Song, S.; Tang, Y.; Gao, S.; Tang, Z.; Todo, Y. Approximate logic neuron model trained by states of matter search algorithm. Knowl.-Based Syst. 2019, 163, 120–130. [Google Scholar] [CrossRef]
  38. Qian, X.; Tang, C.; Todo, Y.; Lin, Q.; Ji, J. Evolutionary Dendritic Neural Model for Classification Problems. Complexity 2020, 2020, 6296209. [Google Scholar] [CrossRef]
  39. Song, S.; Chen, X.; Tang, C.; Song, S.; Tang, Z.; Todo, Y. Training an approximate logic dendritic neuron model using social learning particle swarm optimization algorithm. IEEE Access 2019, 7, 141947–141959. [Google Scholar] [CrossRef]
  40. Ji, J.; Tang, Y.; Ma, L.; Li, J.; Lin, Q.; Tang, Z.; Todo, Y. Accuracy Versus Simplification in an Approximate Logic Neural Model. IEEE Trans. Neural Netw. Learn. Syst. 2020, 32, 5194–5207. [Google Scholar] [CrossRef] [PubMed]
  41. Tang, C.; Ji, J.; Tang, Y.; Gao, S.; Tang, Z.; Todo, Y. A novel machine learning technique for computer-aided diagnosis. Eng. Appl. Artif. Intell. 2020, 92, 103627. [Google Scholar] [CrossRef]
  42. Tang, Y.; Ji, J.; Zhu, Y.; Gao, S.; Tang, Z.; Todo, Y. A differential evolution-oriented pruning neural network model for bankruptcy prediction. Complexity 2019, 2019. [Google Scholar] [CrossRef]
  43. Song, Z.; Tang, Y.; Ji, J.; Todo, Y. Evaluating a dendritic neuron model for wind speed forecasting. Knowl.-Based Syst. 2020, 201, 106052. [Google Scholar] [CrossRef]
  44. Song, Z.; Tang, C.; Ji, J.; Todo, Y.; Tang, Z. A Simple Dendritic Neural Network Model-Based Approach for Daily PM2. 5 Concentration Prediction. Electronics 2021, 10, 373. [Google Scholar] [CrossRef]
  45. Li, B.; Todo, Y.; Tang, Z. Artificial Visual System for Orientation Detection Based on Hubel–Wiesel Model. Brain Sci. 2022, 12, 470. [Google Scholar] [CrossRef] [PubMed]
  46. Yan, C.; Todo, Y.; Kobayashi, Y.; Tang, Z.; Li, B. An Artificial Visual System for Motion Direction Detection Based on the Hassenstein–Reichardt Correlator Model. Electronics 2022, 11, 1423. [Google Scholar] [CrossRef]
  47. Chalupa, L.M.; Williams, R.W. Eye, Retina, and Visual System of the Mouse; Mit Press: Cambridge, MA, USA, 2008. [Google Scholar]
  48. Brewer, A.A.; Liu, J.; Wade, A.R.; Wandell, B.A. Visual field maps and stimulus selectivity in human ventral occipital cortex. Nat. Neurosci. 2005, 8, 1102–1109. [Google Scholar] [CrossRef] [PubMed]
  49. Larsson, J.; Heeger, D.J. Two retinotopic visual areas in human lateral occipital cortex. J. Neurosci. 2006, 26, 13128–13142. [Google Scholar] [CrossRef] [PubMed]
  50. Harris, C.S. Perceptual adaptation to inverted, reversed, and displaced vision. Psychol. Rev. 1965, 72, 419. [Google Scholar] [CrossRef] [PubMed]
  51. Tootell, R.B.; Mendola, J.D.; Hadjikhani, N.K.; Ledden, P.J.; Liu, A.K.; Reppas, J.B.; Sereno, M.I.; Dale, A.M. Functional analysis of V3A and related areas in human visual cortex. J. Neurosci. 1997, 17, 7060–7078. [Google Scholar] [CrossRef] [PubMed]
  52. Rosa, M.G. Visual maps in the adult primate cerebral cortex: Some implications for brain development and evolution. Braz. J. Med. Biol. Res. 2002, 35, 1485–1498. [Google Scholar] [CrossRef]
  53. DeYoe, E.A.; Carman, G.J.; Bandettini, P.; Glickman, S.; Wieser, J.; Cox, R.; Miller, D.; Neitz, J. Mapping striate and extrastriate visual areas in human cerebral cortex. Proc. Natl. Acad. Sci. USA 1996, 93, 2382–2386. [Google Scholar] [CrossRef]
  54. Engel, S.A.; Glover, G.H.; Wandell, B.A. Retinotopic organization in human visual cortex and the spatial precision of functional MRI. Cereb. Cortex 1997, 7, 181–192. [Google Scholar] [CrossRef]
  55. Bridge, H. Mapping the visual brain: How and why. Eye 2011, 25, 291–296. [Google Scholar] [CrossRef] [PubMed]
  56. Wandell, B.A.; Brewer, A.A.; Dougherty, R.F. Visual field map clusters in human cortex. Philos. Trans. R. Soc. Biol. Sci. 2005, 360, 693–707. [Google Scholar] [CrossRef] [PubMed]
  57. Rajimehr, R.; Tootell, R.B. Does retinotopy influence cortical folding in primate visual cortex? J. Neurosci. 2009, 29, 11149–11152. [Google Scholar] [CrossRef] [PubMed]
  58. Hubel, D.H.; Wiesel, T.N. Receptive fields of single neurones in the cat’s striate cortex. In Brain Physiology and Psychology; University of California Press: Berkeley, CA, USA, 2020; pp. 129–150. [Google Scholar]
  59. Hubel, D.H.; Wiesel, T.N. Receptive fields and functional architecture of monkey striate cortex. J. Physiol. 1968, 195, 215–243. [Google Scholar] [CrossRef] [PubMed]
  60. Beaudet, A.; Descarries, L. The monoamine innervation of rat cerebral cortex: Synaptic and nonsynaptic axon terminals. Neuroscience 1978, 3, 851–860. [Google Scholar] [CrossRef] [PubMed]
  61. Palay, S.L.; Chan-Palay, V. Cerebellar Cortex: Cytology and Organization; Springer Science & Business Media: Berlin/Heidelberg, Germany, 2012. [Google Scholar]
  62. Scimemi, A.; Beato, M. Determining the neurotransmitter concentration profile at active synapses. Mol. Neurobiol. 2009, 40, 289–306. [Google Scholar] [CrossRef] [PubMed]
  63. Azouz, R.; Gray, C.M. Dynamic spike threshold reveals a mechanism for synaptic coincidence detection in cortical neurons in vivo. Proc. Natl. Acad. Sci. USA 2000, 97, 8110–8115. [Google Scholar] [CrossRef] [PubMed]
  64. Evans, D.A.; Stempel, A.V.; Vale, R.; Ruehle, S.; Lefler, Y.; Branco, T. A synaptic threshold mechanism for computing escape decisions. Nature 2018, 558, 590–594. [Google Scholar] [CrossRef] [PubMed]
  65. Johnston, D.; Narayanan, R. Active dendrites: Colorful wings of the mysterious butterflies. Trends Neurosci. 2008, 31, 309–316. [Google Scholar] [CrossRef]
  66. Peña, J.L.; Konishi, M. Auditory spatial receptive fields created by multiplication. Science 2001, 292, 249–252. [Google Scholar] [CrossRef]
  67. Gabbiani, F.; Krapp, H.G.; Koch, C.; Laurent, G. Multiplicative computation in a visual neuron sensitive to looming. Nature 2002, 420, 320–324. [Google Scholar] [CrossRef]
  68. Kurowski, P.; Gawlak, M.; Szulczyk, P. Muscarinic receptor control of pyramidal neuron membrane potential in the medial prefrontal cortex (mPFC) in rats. Neuroscience 2015, 303, 474–488. [Google Scholar] [CrossRef] [PubMed]
  69. Bean, B.P. The action potential in mammalian central neurons. Nat. Rev. Neurosci. 2007, 8, 451–465. [Google Scholar] [CrossRef]
  70. Chakraborty, D.; Truong, D.Q.; Bikson, M.; Kaphzan, H. Neuromodulation of axon terminals. Cereb. Cortex 2018, 28, 2786–2794. [Google Scholar] [CrossRef] [PubMed]
  71. Choquet, D.; Triller, A. The dynamic synapse. Neuron 2013, 80, 691–703. [Google Scholar] [CrossRef]
  72. Koch, C. Biophysics of Computation: Information Processing in Single Neurons; Oxford University Press: Oxford, UK, 2004. [Google Scholar]
  73. Spruston, N. Pyramidal neurons: Dendritic structure and synaptic integration. Nat. Rev. Neurosci. 2008, 9, 206–221. [Google Scholar] [CrossRef] [PubMed]
  74. Luo, L.; O’Leary, D.D. Axon retraction and degeneration in development and disease. Annu. Rev. Neurosci. 2005, 28, 127–156. [Google Scholar] [CrossRef] [PubMed]
  75. Zollo, M.; Ahmed, M.; Ferrucci, V.; Salpietro, V.; Asadzadeh, F.; Carotenuto, M.; Maroofian, R.; Al-Amri, A.; Singh, R.; Scognamiglio, I.; et al. PRUNE is crucial for normal brain development and mutated in microcephaly with neurodevelopmental impairment. Brain 2017, 140, 940–952. [Google Scholar] [CrossRef]
  76. Neniskyte, U.; Gross, C.T. Errant gardeners: Glial-cell-dependent synaptic pruning and neurodevelopmental disorders. Nat. Rev. Neurosci. 2017, 18, 658. [Google Scholar] [CrossRef]
  77. Ecker, A.S.; Berens, P.; Keliris, G.A.; Bethge, M.; Logothetis, N.K.; Tolias, A.S. Decorrelated neuronal firing in cortical microcircuits. Science 2010, 327, 584–587. [Google Scholar] [CrossRef]
  78. Vaney, D.I.; Sivyer, B.; Taylor, W.R. Direction selectivity in the retina: Symmetry and asymmetry in structure and function. Nat. Rev. Neurosci. 2012, 13, 194–208. [Google Scholar] [CrossRef] [PubMed]
  79. Shepherd, G.M.; Brayton, R.K. Logic operations are properties of computer-simulated interactions between excitable dendritic spines. Neuroscience 1987, 21, 151–165. [Google Scholar] [CrossRef] [PubMed]
  80. Shadlen, M.N.; Newsome, W.T. The variable discharge of cortical neurons: Implications for connectivity, computation, and information coding. J. Neurosci. 1998, 18, 3870–3896. [Google Scholar] [CrossRef] [PubMed]
  81. Chklovskii, D.B.; Mel, B.; Svoboda, K. Cortical rewiring and information storage. Nature 2004, 431, 782–788. [Google Scholar] [CrossRef] [PubMed]
  82. Polsky, A.; Mel, B.W.; Schiller, J. Computational subunits in thin dendrites of pyramidal cells. Nat. Neurosci. 2004, 7, 621–627. [Google Scholar] [CrossRef] [PubMed]
  83. Eyal, G.; Verhoog, M.B.; Testa-Silva, G.; Deitcher, Y.; Benavides-Piccione, R.; DeFelipe, J.; De Kock, C.P.; Mansvelder, H.D.; Segev, I. Human cortical pyramidal neurons: From spines to spikes via models. Front. Cell. Neurosci. 2018, 12, 181. [Google Scholar] [CrossRef] [PubMed]
  84. Gidon, A.; Zolnik, T.A.; Fidzinski, P.; Bolduan, F.; Papoutsi, A.; Poirazi, P.; Holtkamp, M.; Vida, I.; Larkum, M.E. Dendritic action potentials and computation in human layer 2/3 cortical neurons. Science 2020, 367, 83–87. [Google Scholar] [CrossRef] [PubMed]
  85. Wasserman, P.D. Neural Computing: Theory and Practice; Van Nostrand Reinhold Co.: New York, NY, USA, 1989. [Google Scholar]
  86. Beale, R.; Jackson, T. Neural Computing—An Introduction; CRC Press: Boca Raton, FL, USA, 1990. [Google Scholar]
  87. Wasserman, P.D. Advanced Methods in Neural Computing; John Wiley & Sons, Inc.: Hoboken, NJ, USA, 1993. [Google Scholar]
  88. Deco, G.; Obradovic, D. An Information-Theoretic Approach to Neural Computing; Springer Science & Business Media: Berlin/Heidelberg, Germany, 2012. [Google Scholar]
  89. Maren, A.J.; Harston, C.T.; Pap, R.M. Handbook of Neural Computing Applications; Academic Press: Cambridge, MA, USA, 2014. [Google Scholar]
  90. Alonso, J.M.; Chen, Y. Receptive field. Scholarpedia 2009, 4, 5393. [Google Scholar] [CrossRef]
  91. Finn, I.M.; Priebe, N.J.; Ferster, D. The emergence of contrast-invariant orientation tuning in simple cells of cat visual cortex. Neuron 2007, 54, 137–152. [Google Scholar] [CrossRef]
  92. Hansel, D.; van Vreeswijk, C. The mechanism of orientation selectivity in primary visual cortex without a functional map. J. Neurosci. 2012, 32, 4049–4064. [Google Scholar] [CrossRef]
  93. Koch, E.; Jin, J.; Wang, Y.; Kremkow, J.; Alonso, J.M.; Zaidi, Q. Cross-orientation suppression and the topography of orientation preferences. J. Vis. 2015, 15, 1000. [Google Scholar] [CrossRef]
  94. Martinez, L.M.; Wang, Q.; Reid, R.C.; Pillai, C.; Alonso, J.M.; Sommer, F.T.; Hirsch, J.A. Receptive field structure varies with layer in the primary visual cortex. Nat. Neurosci. 2005, 8, 372–379. [Google Scholar] [CrossRef] [PubMed]
  95. Frégnac, Y.; Bathellier, B. Cortical correlates of low-level perception: From neural circuits to percepts. Neuron 2015, 88, 110–126. [Google Scholar] [CrossRef] [PubMed]
  96. Sattler, T.; Leibe, B.; Kobbelt, L. Efficient & effective prioritized matching for large-scale image-based localization. IEEE Trans. Pattern Anal. Mach. Intell. 2016, 39, 1744–1756. [Google Scholar] [PubMed]
  97. Russakovsky, O.; Deng, J.; Su, H.; Krause, J.; Satheesh, S.; Ma, S.; Huang, Z.; Karpathy, A.; Khosla, A.; Bernstein, M.; et al. Imagenet large scale visual recognition challenge. Int. J. Comput. Vis. 2015, 115, 211–252. [Google Scholar] [CrossRef]
  98. Derrac, J.; García, S.; Molina, D.; Herrera, F. A practical tutorial on the use of nonparametric statistical tests as a methodology for comparing evolutionary and swarm intelligence algorithms. Swarm Evol. Comput. 2011, 1, 3–18. [Google Scholar] [CrossRef]
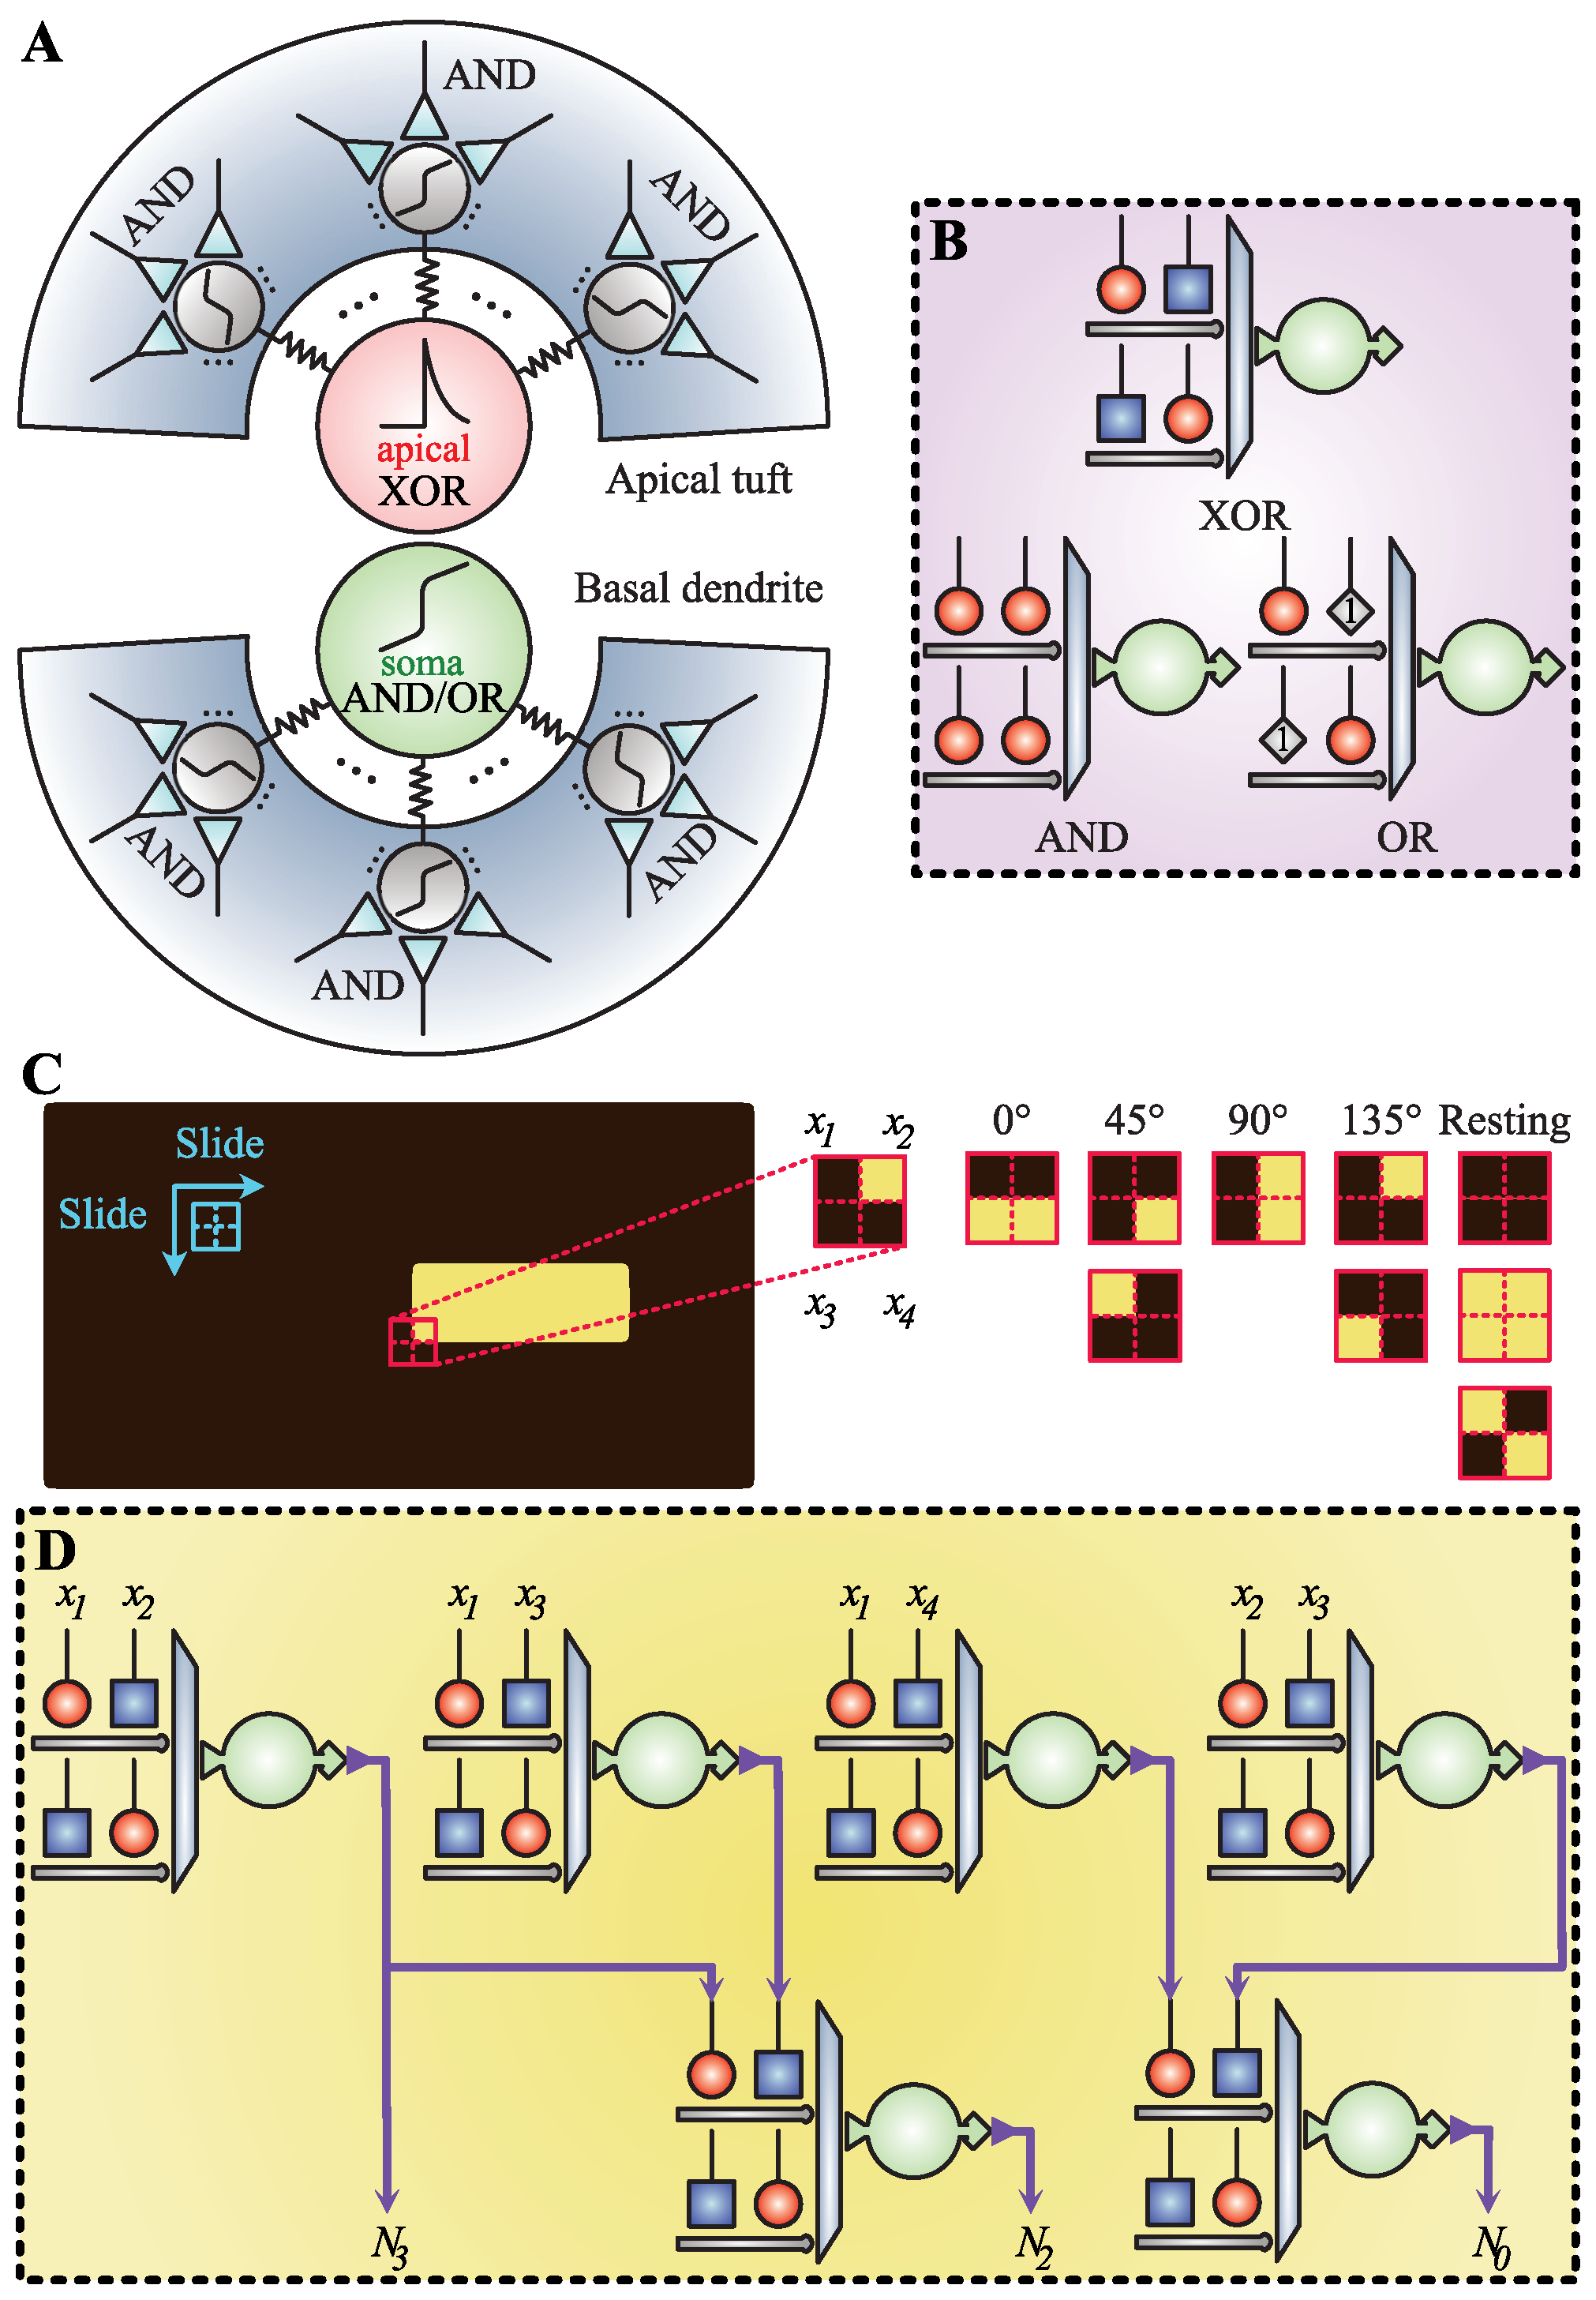
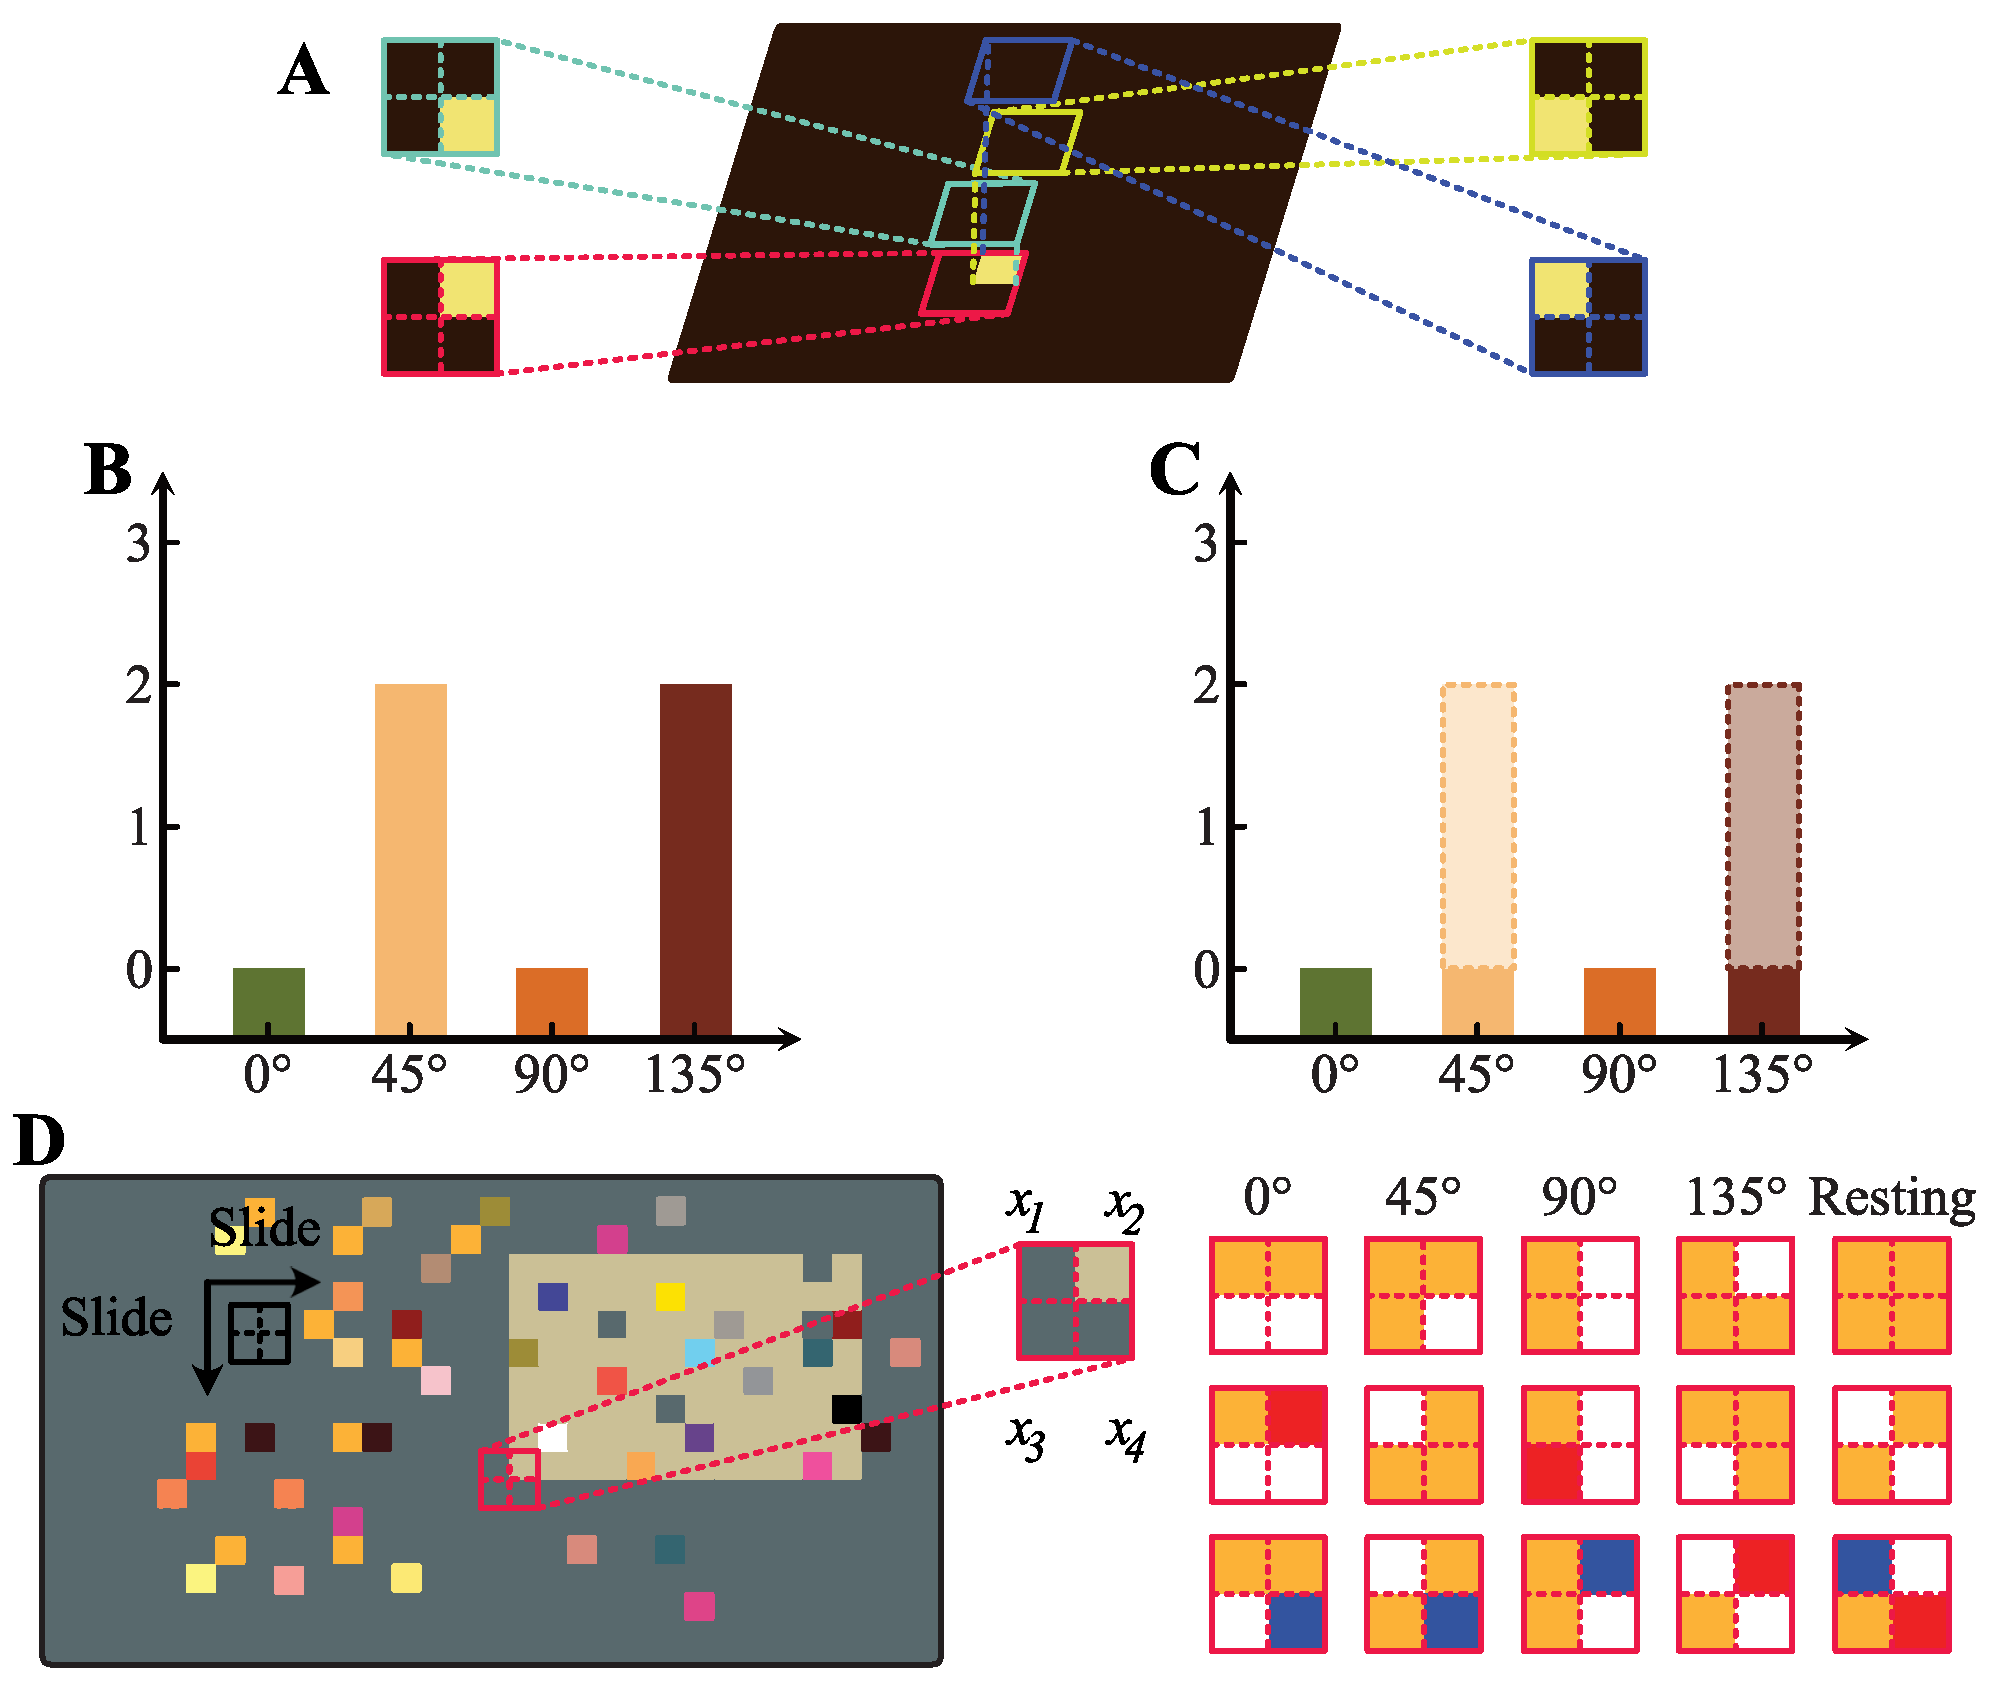
Figure 1. Visual system: (A) flowchart of visual system; (B) organization of the retina; (C) dendritic neuron.
Electronics 13 01367 g001
Figure 2. Main components of the DNM: (A) architectural description of the DNM; (B) four kinds of synapses; (C) six cases of connection states; (D) the logic circuit gate represented by each connection state.
Electronics 13 01367 g002
Figure 3. Hardware implementation of the ODS-01: (A) schematic model of a L2/3 pyramidal neuron [84]; (B) hardware implementation of the DNM; (C) flowchart of the ODS-01; (D) hardware implementation of the ODS-01.
Electronics 13 01367 g003
Figure 4. Inhibition scheme and ODS-03: (A) an example of receptive fields scanning; (B) activation intensity of neurons without inhibition scheme (ODS-01); (C) activation intensity of neurons with inhibition scheme (ODS-02); (D) flowchart of ODS-03.
Electronics 13 01367 g004
Figure 5. Description of (A) dataset-01, (B) dataset-02, and (C) dataset-03.
Electronics 13 01367 g005
Figure 6. Description of (A) dataset-04 and (B) dataset-05.
Electronics 13 01367 g006
Figure 7. Description of (A) dataset-06, (B) dataset-07, and (C) dataset-08.
Electronics 13 01367 g007
Figure 8. Description of dataset-09.
Electronics 13 01367 g008
Figure 9. Training curves of CNNs. (A) Training curve of CNN-04 with one convolutional layer. (B) Training curve of CNN-04 with two convolutional layers. (C) Training curve of CNN-04 with three convolutional layers. (D) Training curve of CNN-04 with four convolutional layers. (E) Training curve of CNN-30 with one convolutional layer. (F) Training curve of CNN-30 with two convolutional layers. (G) Training curve of CNN-30 with three convolutional layers. (H) Training curve of CNN-30 with four convolutional layers.
Electronics 13 01367 g009
Figure 10. Comparison of shaded error bars on the datasets with noise.
Electronics 13 01367 g010
Table 1. Five states of receptive fields.
Orientation N 2 N 1 N 0
0 010
45 110
90 0/101
135 0/111
Resting0/100
Table 2. Orientation detection performance of ODSs.
100 × 100 pixels
DatasetsODS-01ODS-02ODS-03
Binary-WB100.00100.00100.00
Binary-BW100.00100.00100.00
Binary-Mix100.00100.00100.00
Grey100.00100.00100.00
Color100.00100.00100.00
1000 × 1000 pixels
DatasetsODS-01ODS-02ODS-03
Binary-Mix100.00100.00100.00
Grey100.00100.00100.00
Color100.00100.00100.00
3024 × 3024 pixels
DatasetsODS-01ODS-02ODS-03
Real73.2175.00100.00
Table 3. Orientation detection performance of ODSs and CNNs.
DatasetsCNN-04CNN-30ODS-01ODS-02ODS-03
Mean ± Std p Mean ± Std p Mean ± Std p Mean ± Std p Mean ± Std
Binary-WB93.46 ± 0.699.07 × 10 7 95.23 ± 0.459.07 × 10 7 100.00 ± 0.001.00100.00 ± 0.001.00100.00 ± 0.00
Binary-BW91.89 ± 12.879.11 × 10 7 96.33 ± 0.409.02 × 10 7 100.00 ± 0.001.00100.00 ± 0.001.00100.00 ± 0.00
Binary-Mix94.21 ± 2.839.09 × 10 7 94.08 ± 9.179.08 × 10 7 100.00 ± 0.001.00100.00 ± 0.001.00100.00 ± 0.00
Grey90.87 ± 1.669.09 × 10 7 90.53 ± 2.259.12 × 10 7 100.00 ± 0.001.00100.00 ± 0.001.00100.00 ± 0.00
Color89.17 ± 12.259.10 × 10 7 89.17 ± 12.259.10 × 10 7 100.00 ± 0.001.00100.00 ± 0.001.00100.00 ± 0.00
CNNs with different convolutional layers on color image dataset
Layers-0294.67 ± 13.119.08 × 10 7 95.05 ± 13.169.04 × 10 7 -----
Layers-0398.55 ± 1.369.05 × 10 7 98.08 ± 0.939.06 × 10 7 -----
Layers-0493.44 ± 15.479.09 × 10 7 98.47 ± 1.199.04 × 10 7 -----
Table 4. Device and duration of orientation detection system.
Orientation Detection SystemDeviceTypeDuration
ODSGPUNVIDIA Tesla P1003 min 2 s
1-Channel CNNGPUNVIDIA Tesla P1004 min 47 s
4-Layer CNNGPUNVIDIA Tesla P1005 min 58 s
EfNGPUNVIDIA Tesla P10029 min 14 s
Table 5. Accuracy comparison on datasets with noise.
NoiseCNNODS-01ODS-02ODS-03
Mean ± Std p Mean ± Std p Mean ± Std p Mean ± Std
0195.55 ± 13.509.11 × 10 7 51.69 ± 0.089.04 × 10 7 99.99 ± 0.013.00 × 10 1 99.99 ± 0.01
0282.61 ± 29.739.12 × 10 7 49.90 ± 0.008.52 × 10 7 99.92 ± 0.022.18 × 10 1 99.92 ± 0.03
0362.65 ± 36.639.01 × 10 7 49.90 ± 0.008.70 × 10 7 99.73 ± 0.046.84 × 10 5 99.78 ± 0.04
0482.61 ± 29.739.12 × 10 7 49.89 ± 0.018.93 × 10 7 99.44 ± 0.051.10 × 10 6 99.59 ± 0.05
0545.56 ± 33.259.08 × 10 7 49.89 ± 0.019.05 × 10 7 99.06 ± 0.081.58 × 10 6 99.28 ± 0.08
0645.22 ± 32.729.04 × 10 7 49.87 ± 0.019.01 × 10 7 98.54 ± 0.119.09 × 10 7 98.92 ± 0.08
0745.35 ± 32.929.12 × 10 7 49.86 ± 0.029.06 × 10 7 97.99 ± 0.119.06 × 10 7 98.54 ± 0.13
0847.23 ± 33.199.09 × 10 7 49.83 ± 0.039.05 × 10 7 97.28 ± 0.139.09 × 10 7 98.11 ± 0.10
0928.63 ± 17.019.08 × 10 7 49.81 ± 0.029.06 × 10 7 96.49 ± 0.159.09 × 10 7 97.61 ± 0.13
1026.09 ± 10.589.09 × 10 7 49.77 ± 0.039.10 × 10 7 95.73 ± 0.159.09 × 10 7 97.06 ± 0.15
1125.88 ± 9.449.11 × 10 7 49.73 ± 0.049.09 × 10 7 94.85 ± 0.179.08 × 10 7 96.53 ± 0.16
1224.16 ± 0.009.05 × 10 7 49.68 ± 0.049.05 × 10 7 93.78 ± 0.189.09 × 10 7 95.85 ± 0.15
1324.16 ± 0.009.09 × 10 7 49.64 ± 0.059.08 × 10 7 92.84 ± 0.239.12 × 10 7 95.30 ± 0.20
1424.16 ± 0.009.10 × 10 7 49.56 ± 0.059.01 × 10 7 91.72 ± 0.229.10 × 10 7 94.58 ± 0.21
1524.16 ± 0.009.10 × 10 7 49.51 ± 0.059.00 × 10 7 90.59 ± 0.209.10 × 10 7 93.94 ± 0.21
1630.70 ± 19.989.12 × 10 7 49.40 ± 0.079.12 × 10 7 89.43 ± 0.319.09 × 10 7 93.11 ± 0.23
1724.16 ± 0.009.11 × 10 7 49.35 ± 0.069.10 × 10 7 88.17 ± 0.269.12 × 10 7 92.47 ± 0.25
1824.16 ± 0.009.08 × 10 7 49.25 ± 0.089.11 × 10 7 86.83 ± 0.259.09 × 10 7 91.65 ± 0.27
1924.16 ± 0.009.02 × 10 7 49.15 ± 0.099.04 × 10 7 85.46 ± 0.309.10 × 10 7 91.00 ± 0.20
2024.16 ± 0.009.08 × 10 7 49.04 ± 0.079.10 × 10 7 84.01 ± 0.289.10 × 10 7 90.04 ± 0.28
2124.16 ± 0.009.09 × 10 7 48.94 ± 0.109.09 × 10 7 82.54 ± 0.349.10 × 10 7 89.23 ± 0.23
2224.16 ± 0.009.10 × 10 7 48.82 ± 0.109.08 × 10 7 81.13 ± 0.359.12 × 10 7 88.39 ± 0.24
2324.16 ± 0.009.12 × 10 7 48.68 ± 0.099.11 × 10 7 79.53 ± 0.289.11 × 10 7 87.45 ± 0.29
2424.16 ± 0.009.10 × 10 7 48.56 ± 0.109.10 × 10 7 77.99 ± 0.399.11 × 10 7 86.39 ± 0.29
2524.16 ± 0.009.11 × 10 7 48.45 ± 0.139.09 × 10 7 76.52 ± 0.449.10 × 10 7 85.55 ± 0.30
2624.16 ± 0.009.12 × 10 7 48.28 ± 0.119.09 × 10 7 75.05 ± 0.309.08 × 10 7 84.49 ± 0.25
2724.16 ± 0.009.12 × 10 7 48.13 ± 0.129.12 × 10 7 73.51 ± 0.389.12 × 10 7 83.54 ± 0.37
2824.16 ± 0.009.12 × 10 7 47.95 ± 0.119.11 × 10 7 71.90 ± 0.459.12 × 10 7 82.49 ± 0.33
2924.16 ± 0.009.10 × 10 7 47.87 ± 0.129.08 × 10 7 70.50 ± 0.399.06 × 10 7 81.32 ± 0.27
3024.16 ± 0.009.12 × 10 7 47.65 ± 0.149.12 × 10 7 68.87 ± 0.479.11 × 10 7 80.25 ± 0.38
Disclaimer/Publisher’s Note: The statements, opinions and data contained in all publications are solely those of the individual author(s) and contributor(s) and not of MDPI and/or the editor(s). MDPI and/or the editor(s) disclaim responsibility for any injury to people or property resulting from any ideas, methods, instructions or products referred to in the content.

