

SOD-YOLO: A High-Precision Detection of Small Targets on High-Voltage Transmission Lines


Abstract
1. Introduction
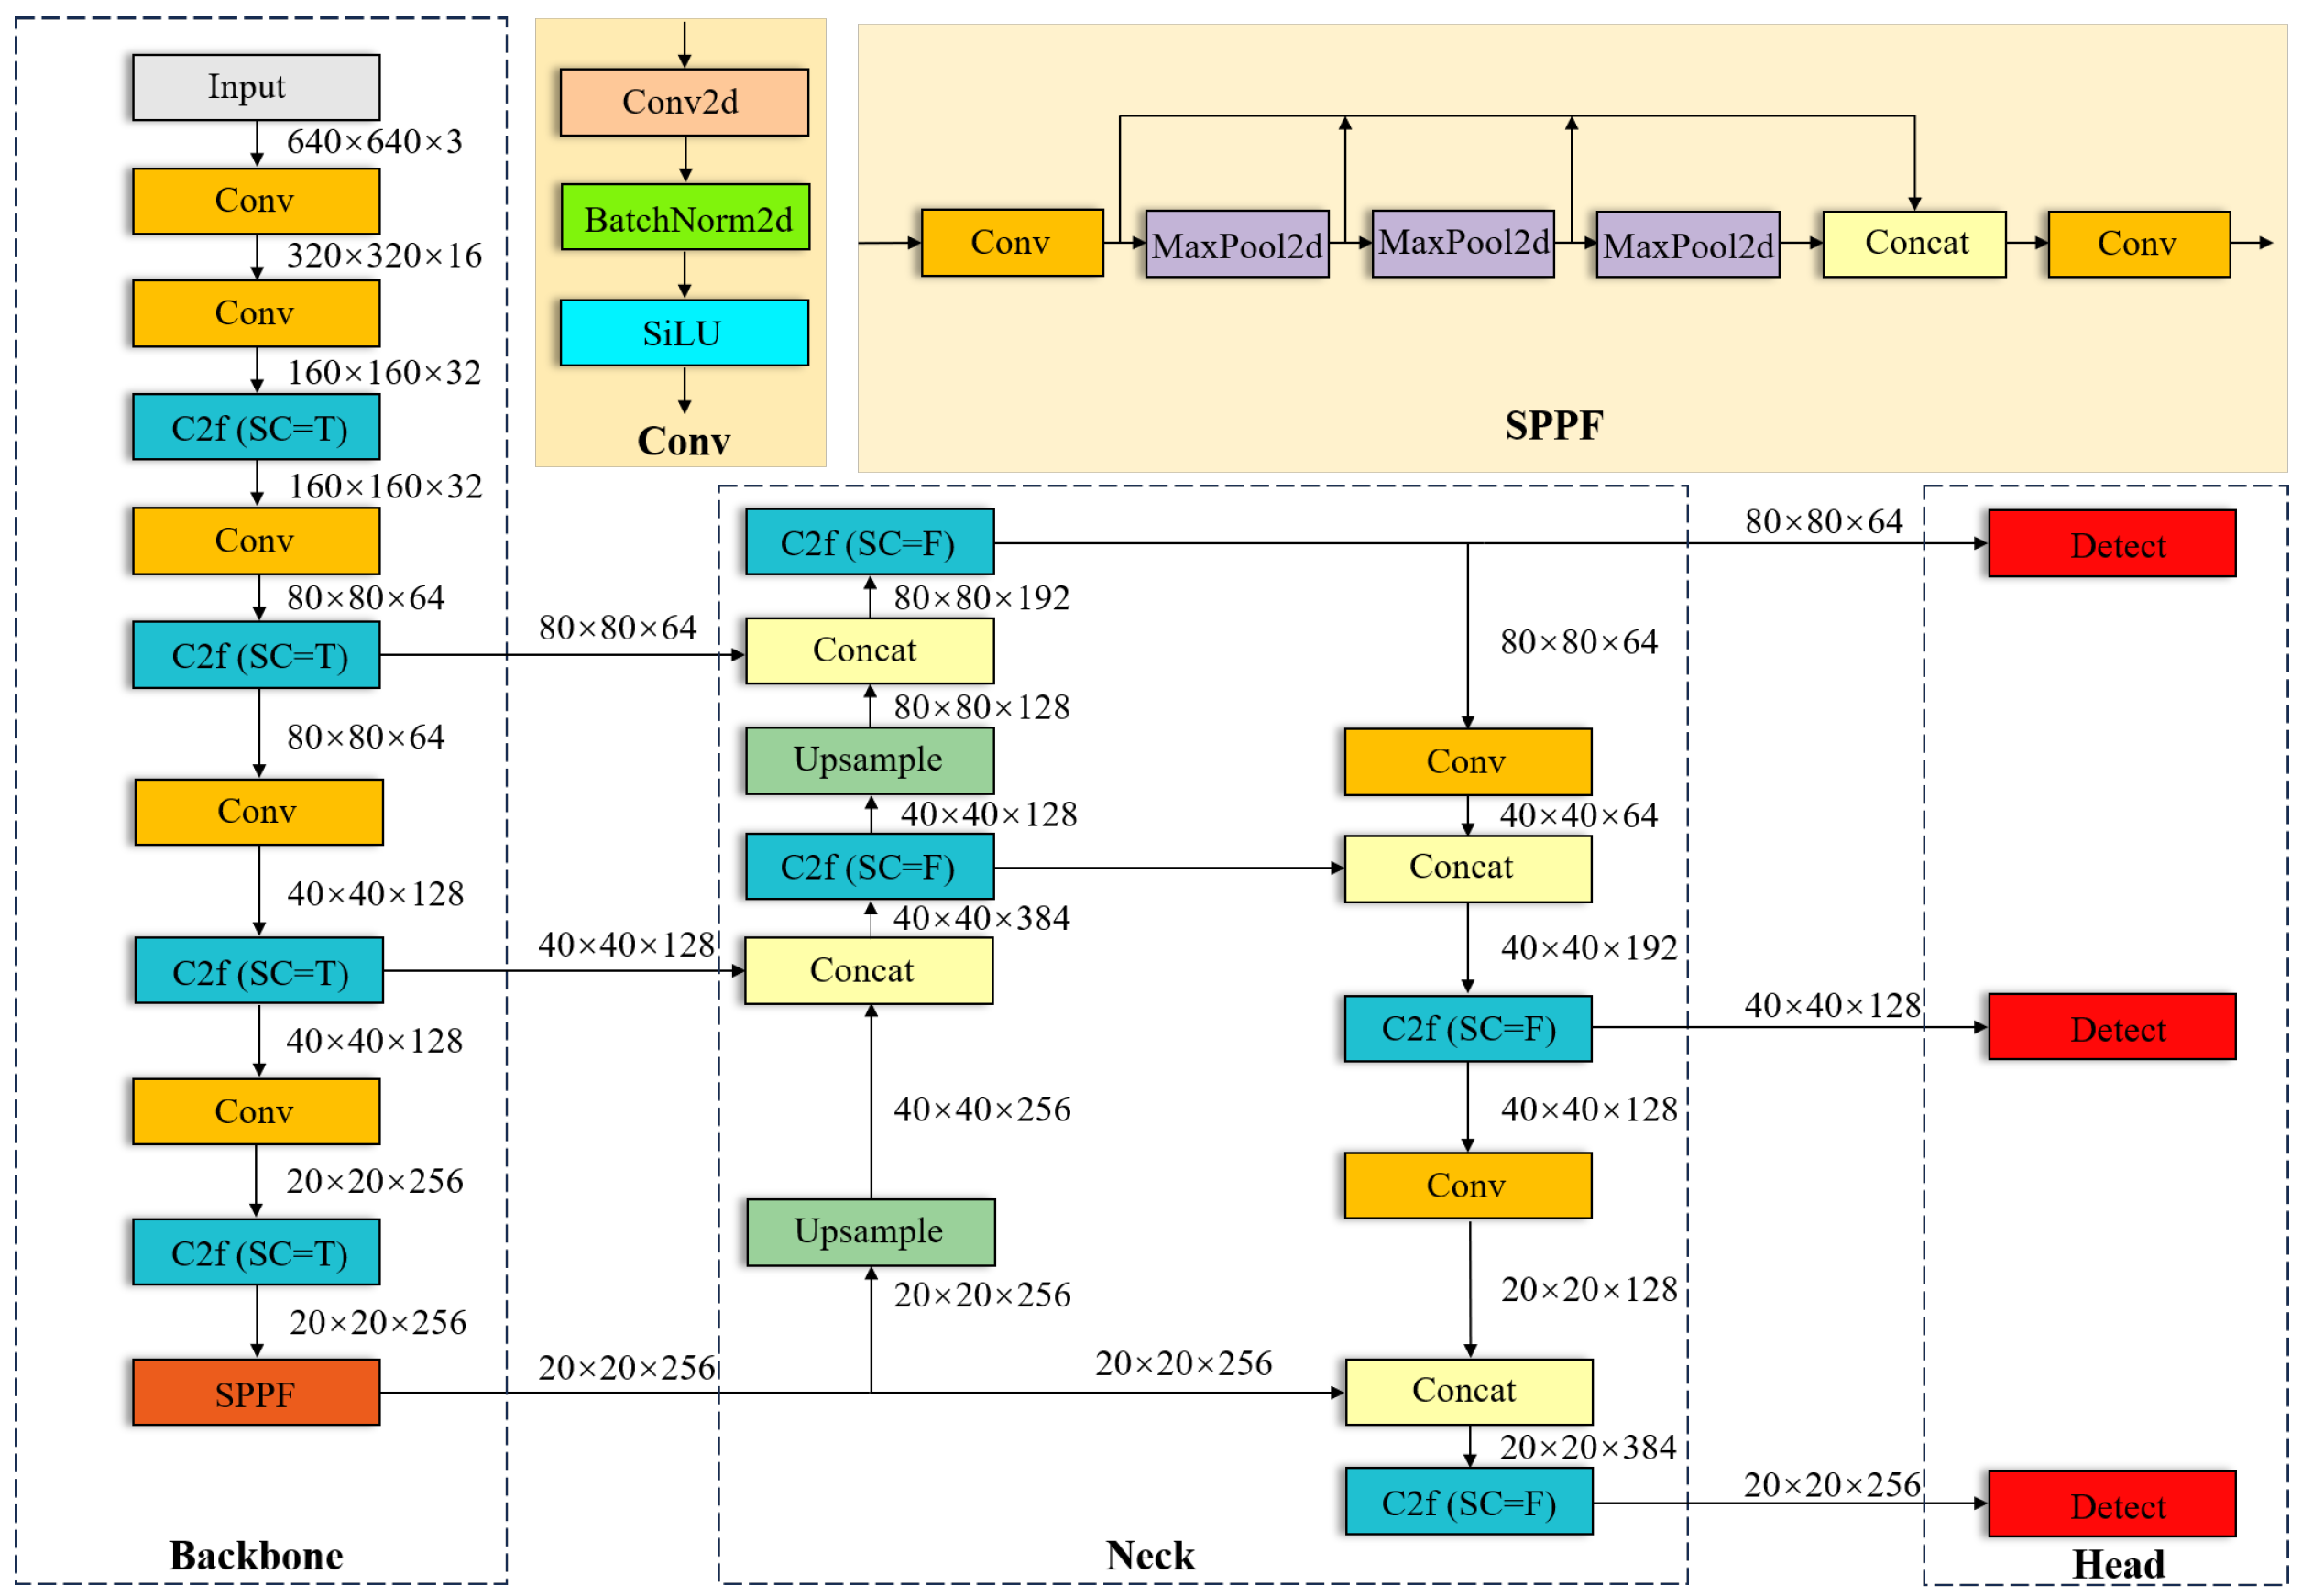
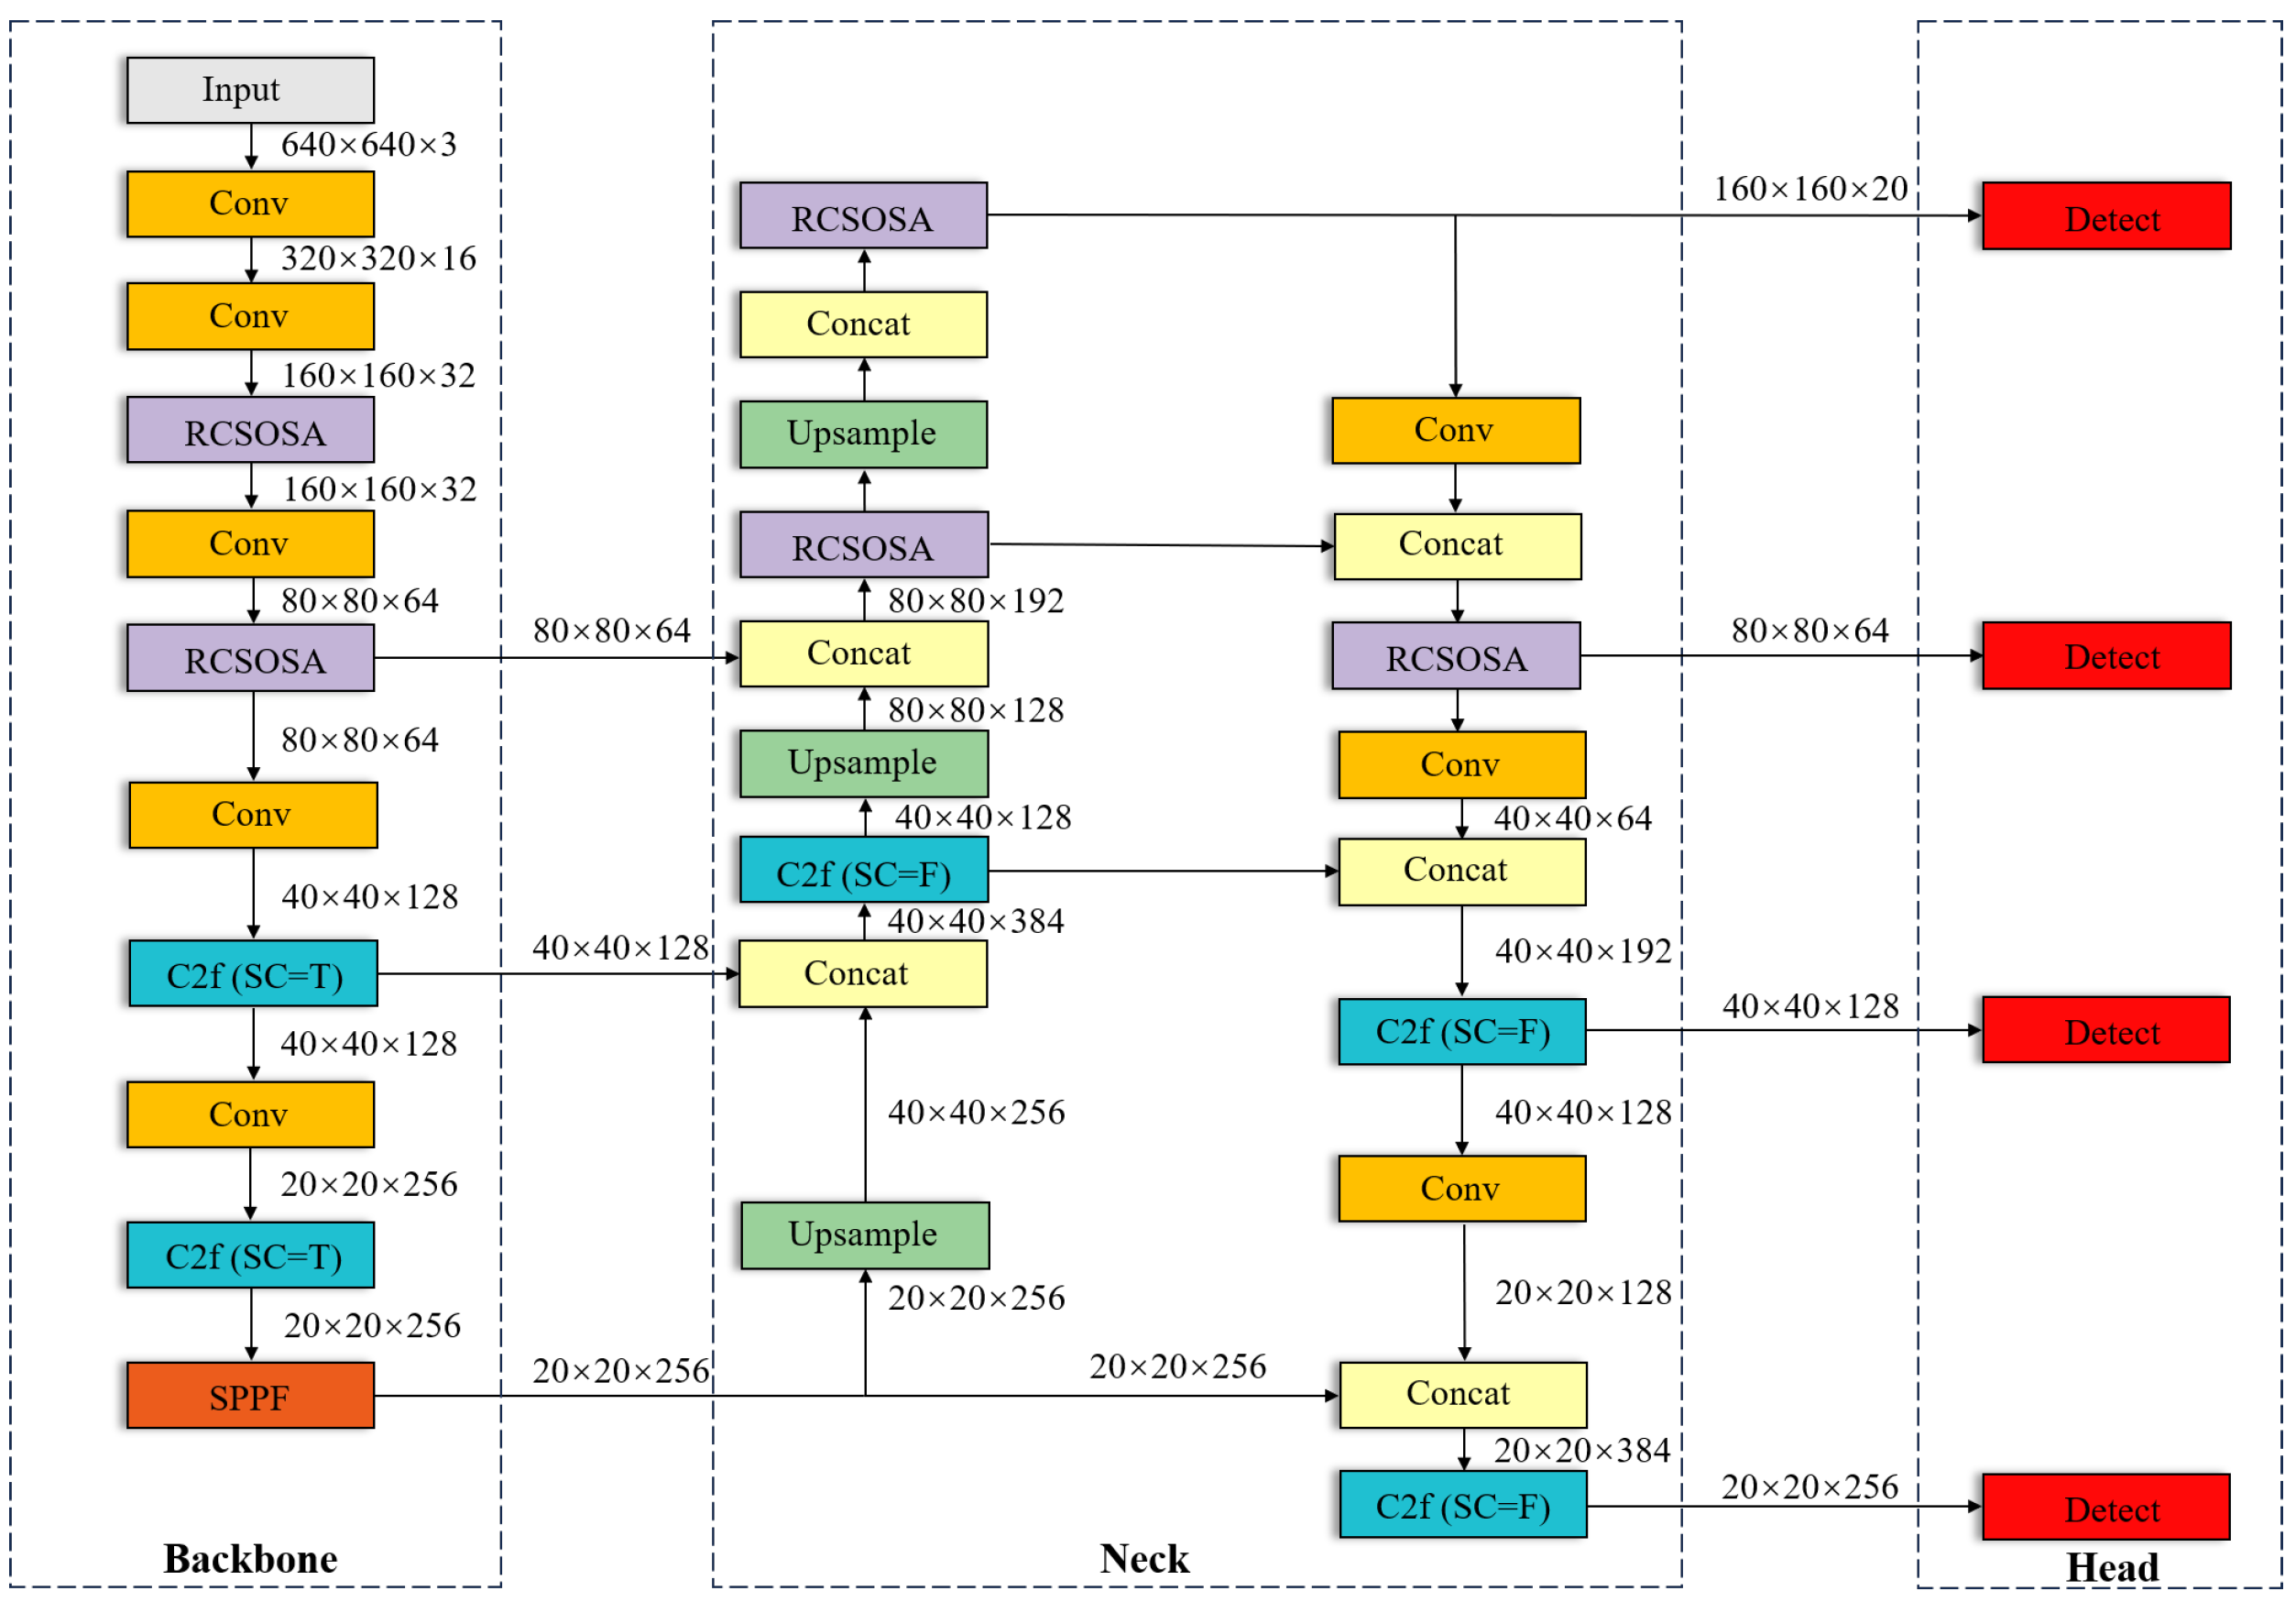
- To enhance the detection ability of the model for small targets, the small object detection layer (SODL) was incorporated into YOLOv8n, feature maps of different scales were acquired, and multi-scale feature extraction and fusion were performed. The detection head was designed after large-scale feature mapping to optimize the detection performance for small targets.
- By integrating the RCSOSA module into the backbone and neck shallow layers of the SOD-YOLO model, this approach significantly improved the accuracy and speed of model identification.
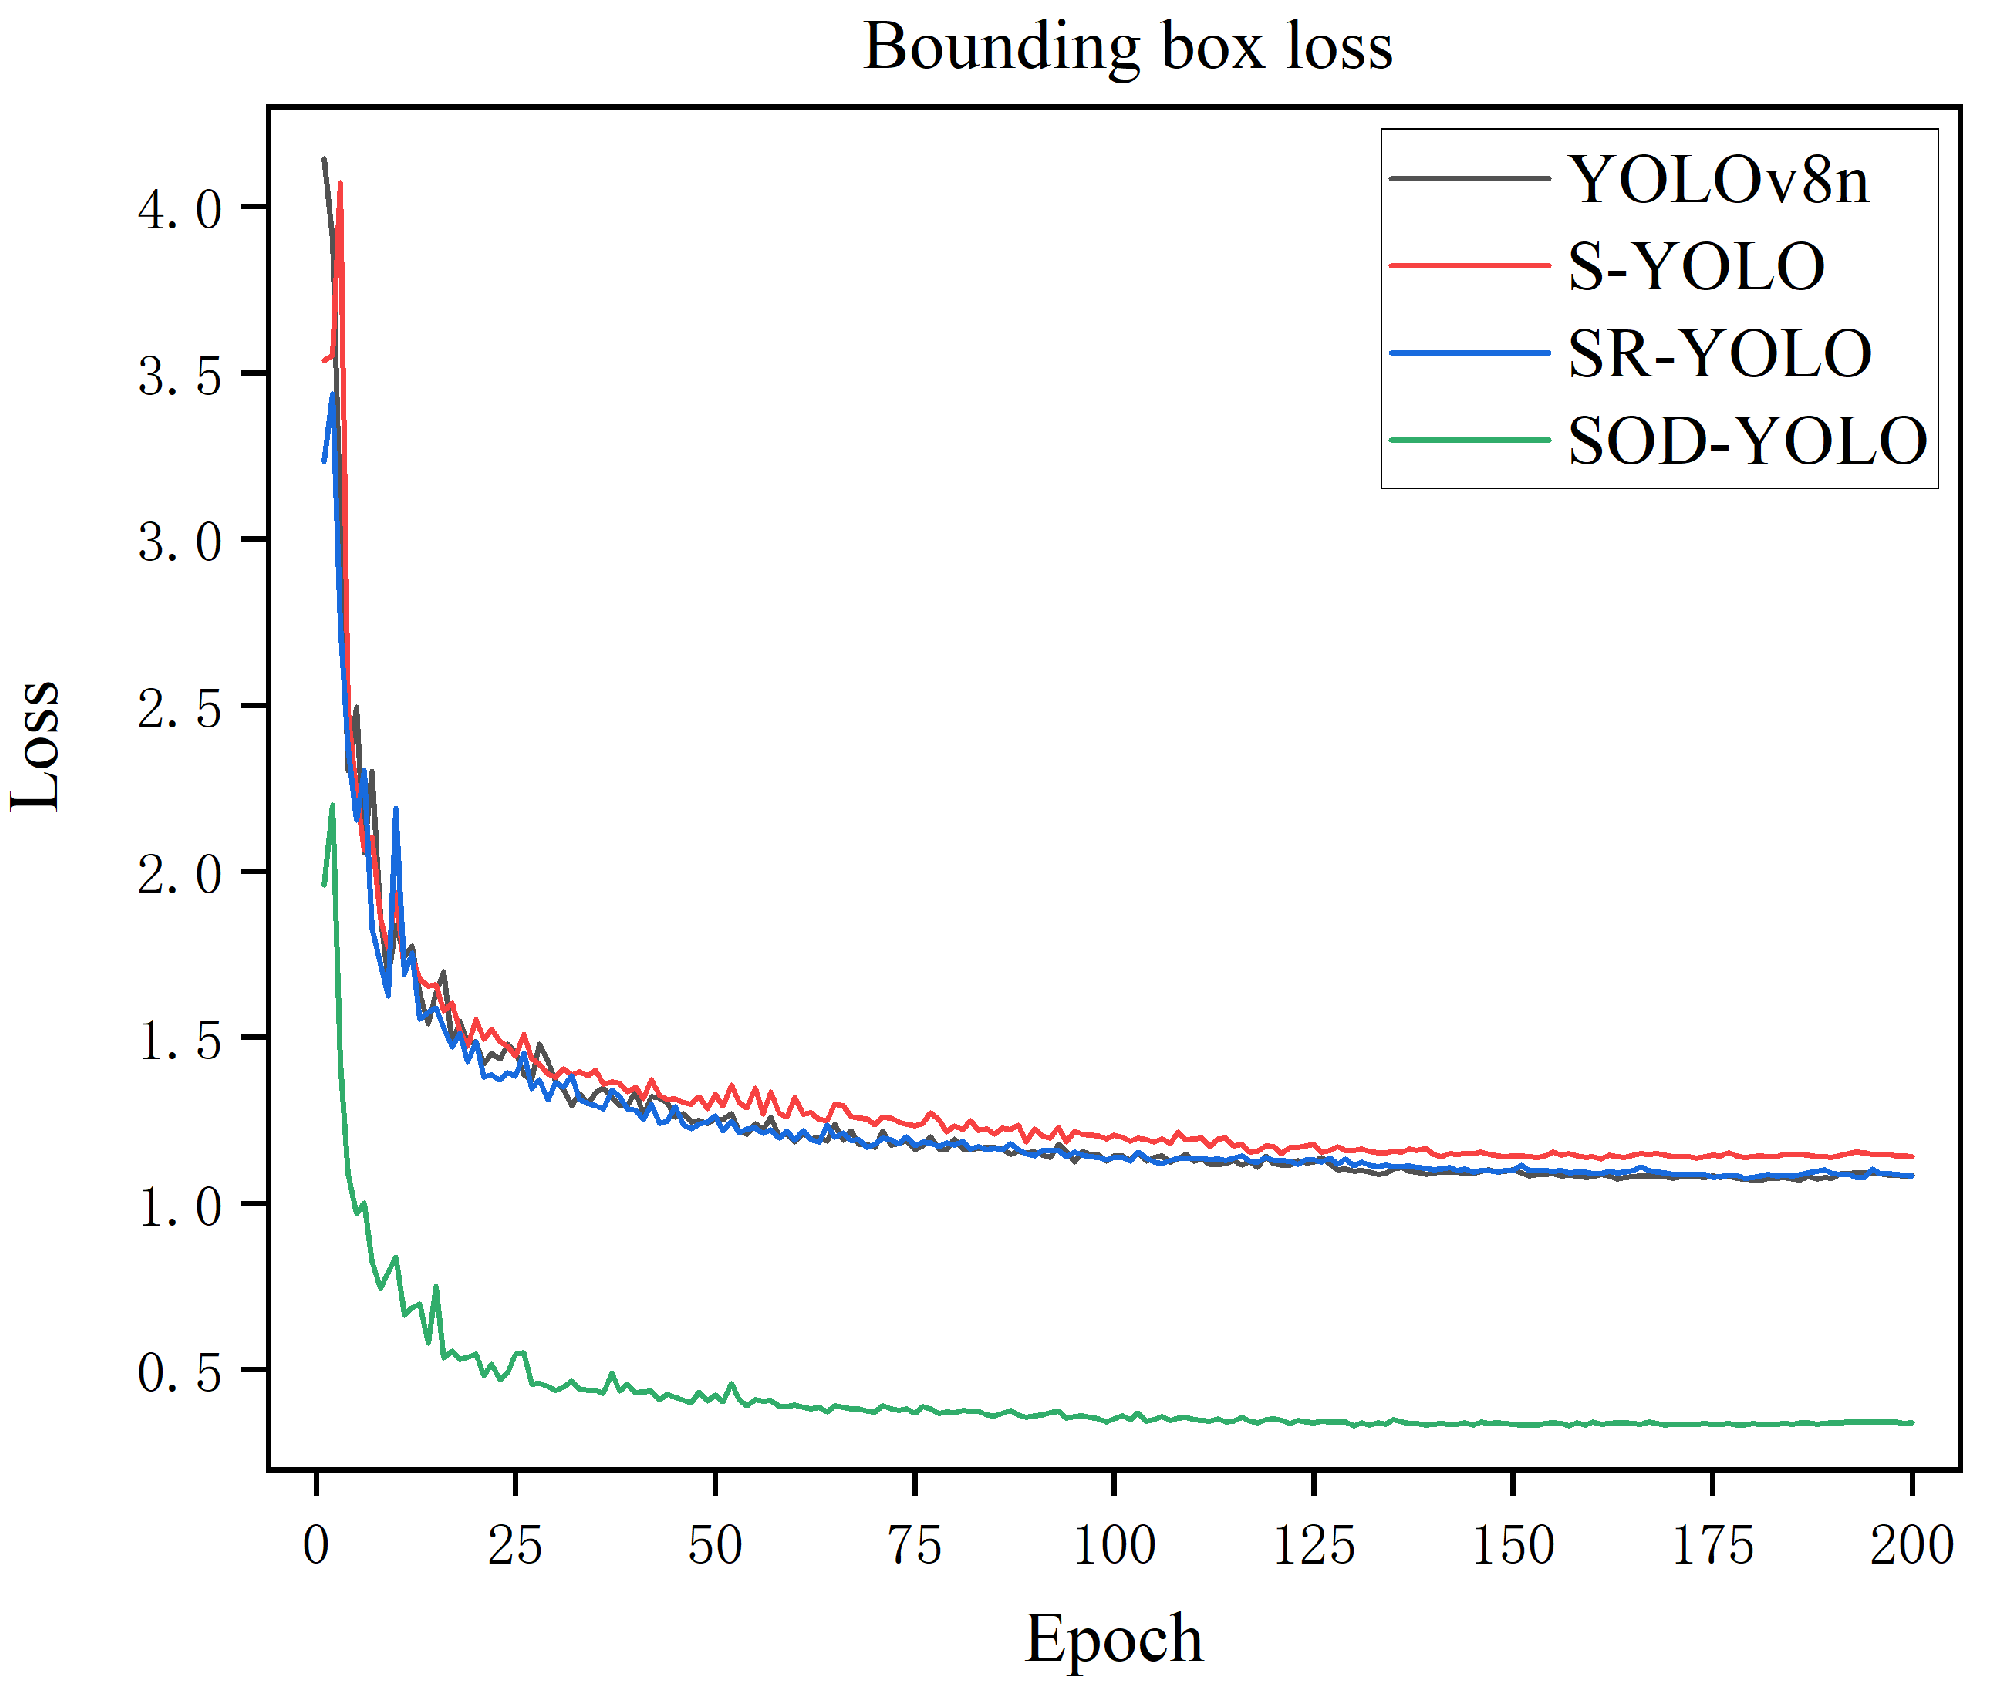
- To balance the strength of the bounding box regression and punishment for low-quality data during model training, we designed the Wise Intersection over Union–Complete Intersection over Union (WIoU-CIoU) loss as the bounding box regression loss function. It effectively reduces the harmful gradient of low-quality samples and improves the detection accuracy of the SOD-YOLO model with the same inference speed and number of model parameters.
2. Related Work
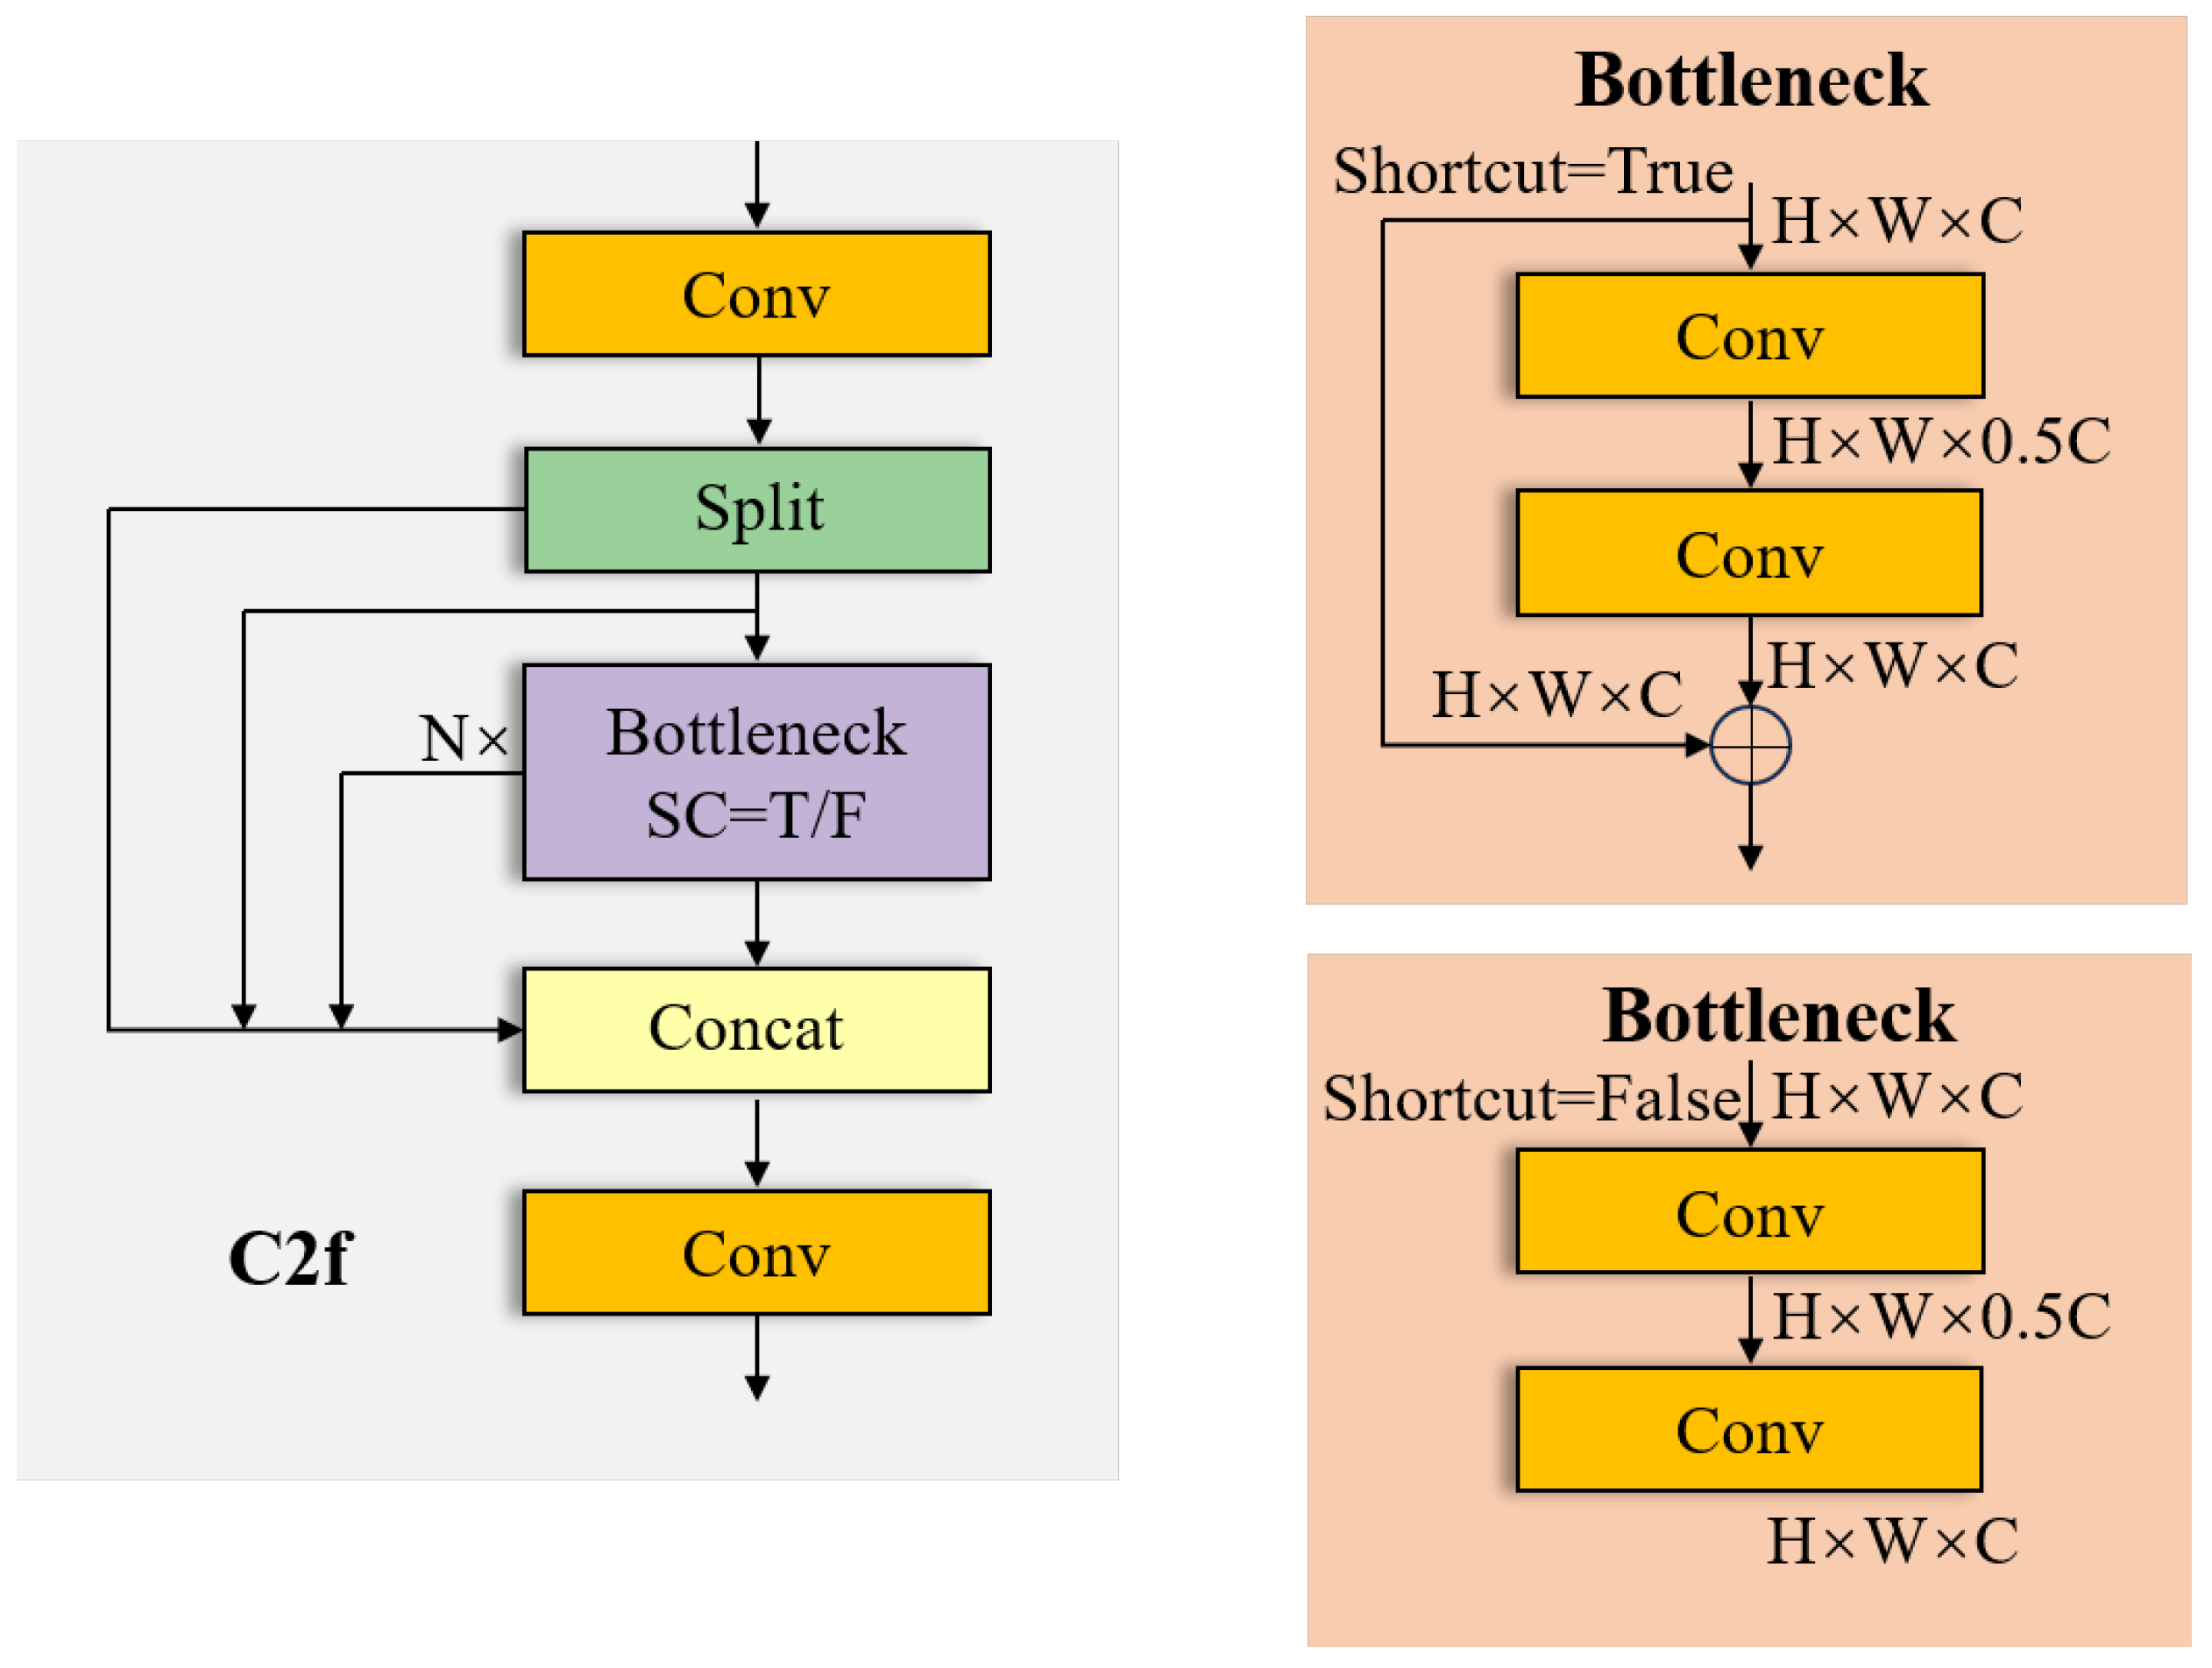
2.1. YOLOv8 Algorithm
2.2. Small Object Detection Layer (SODL)
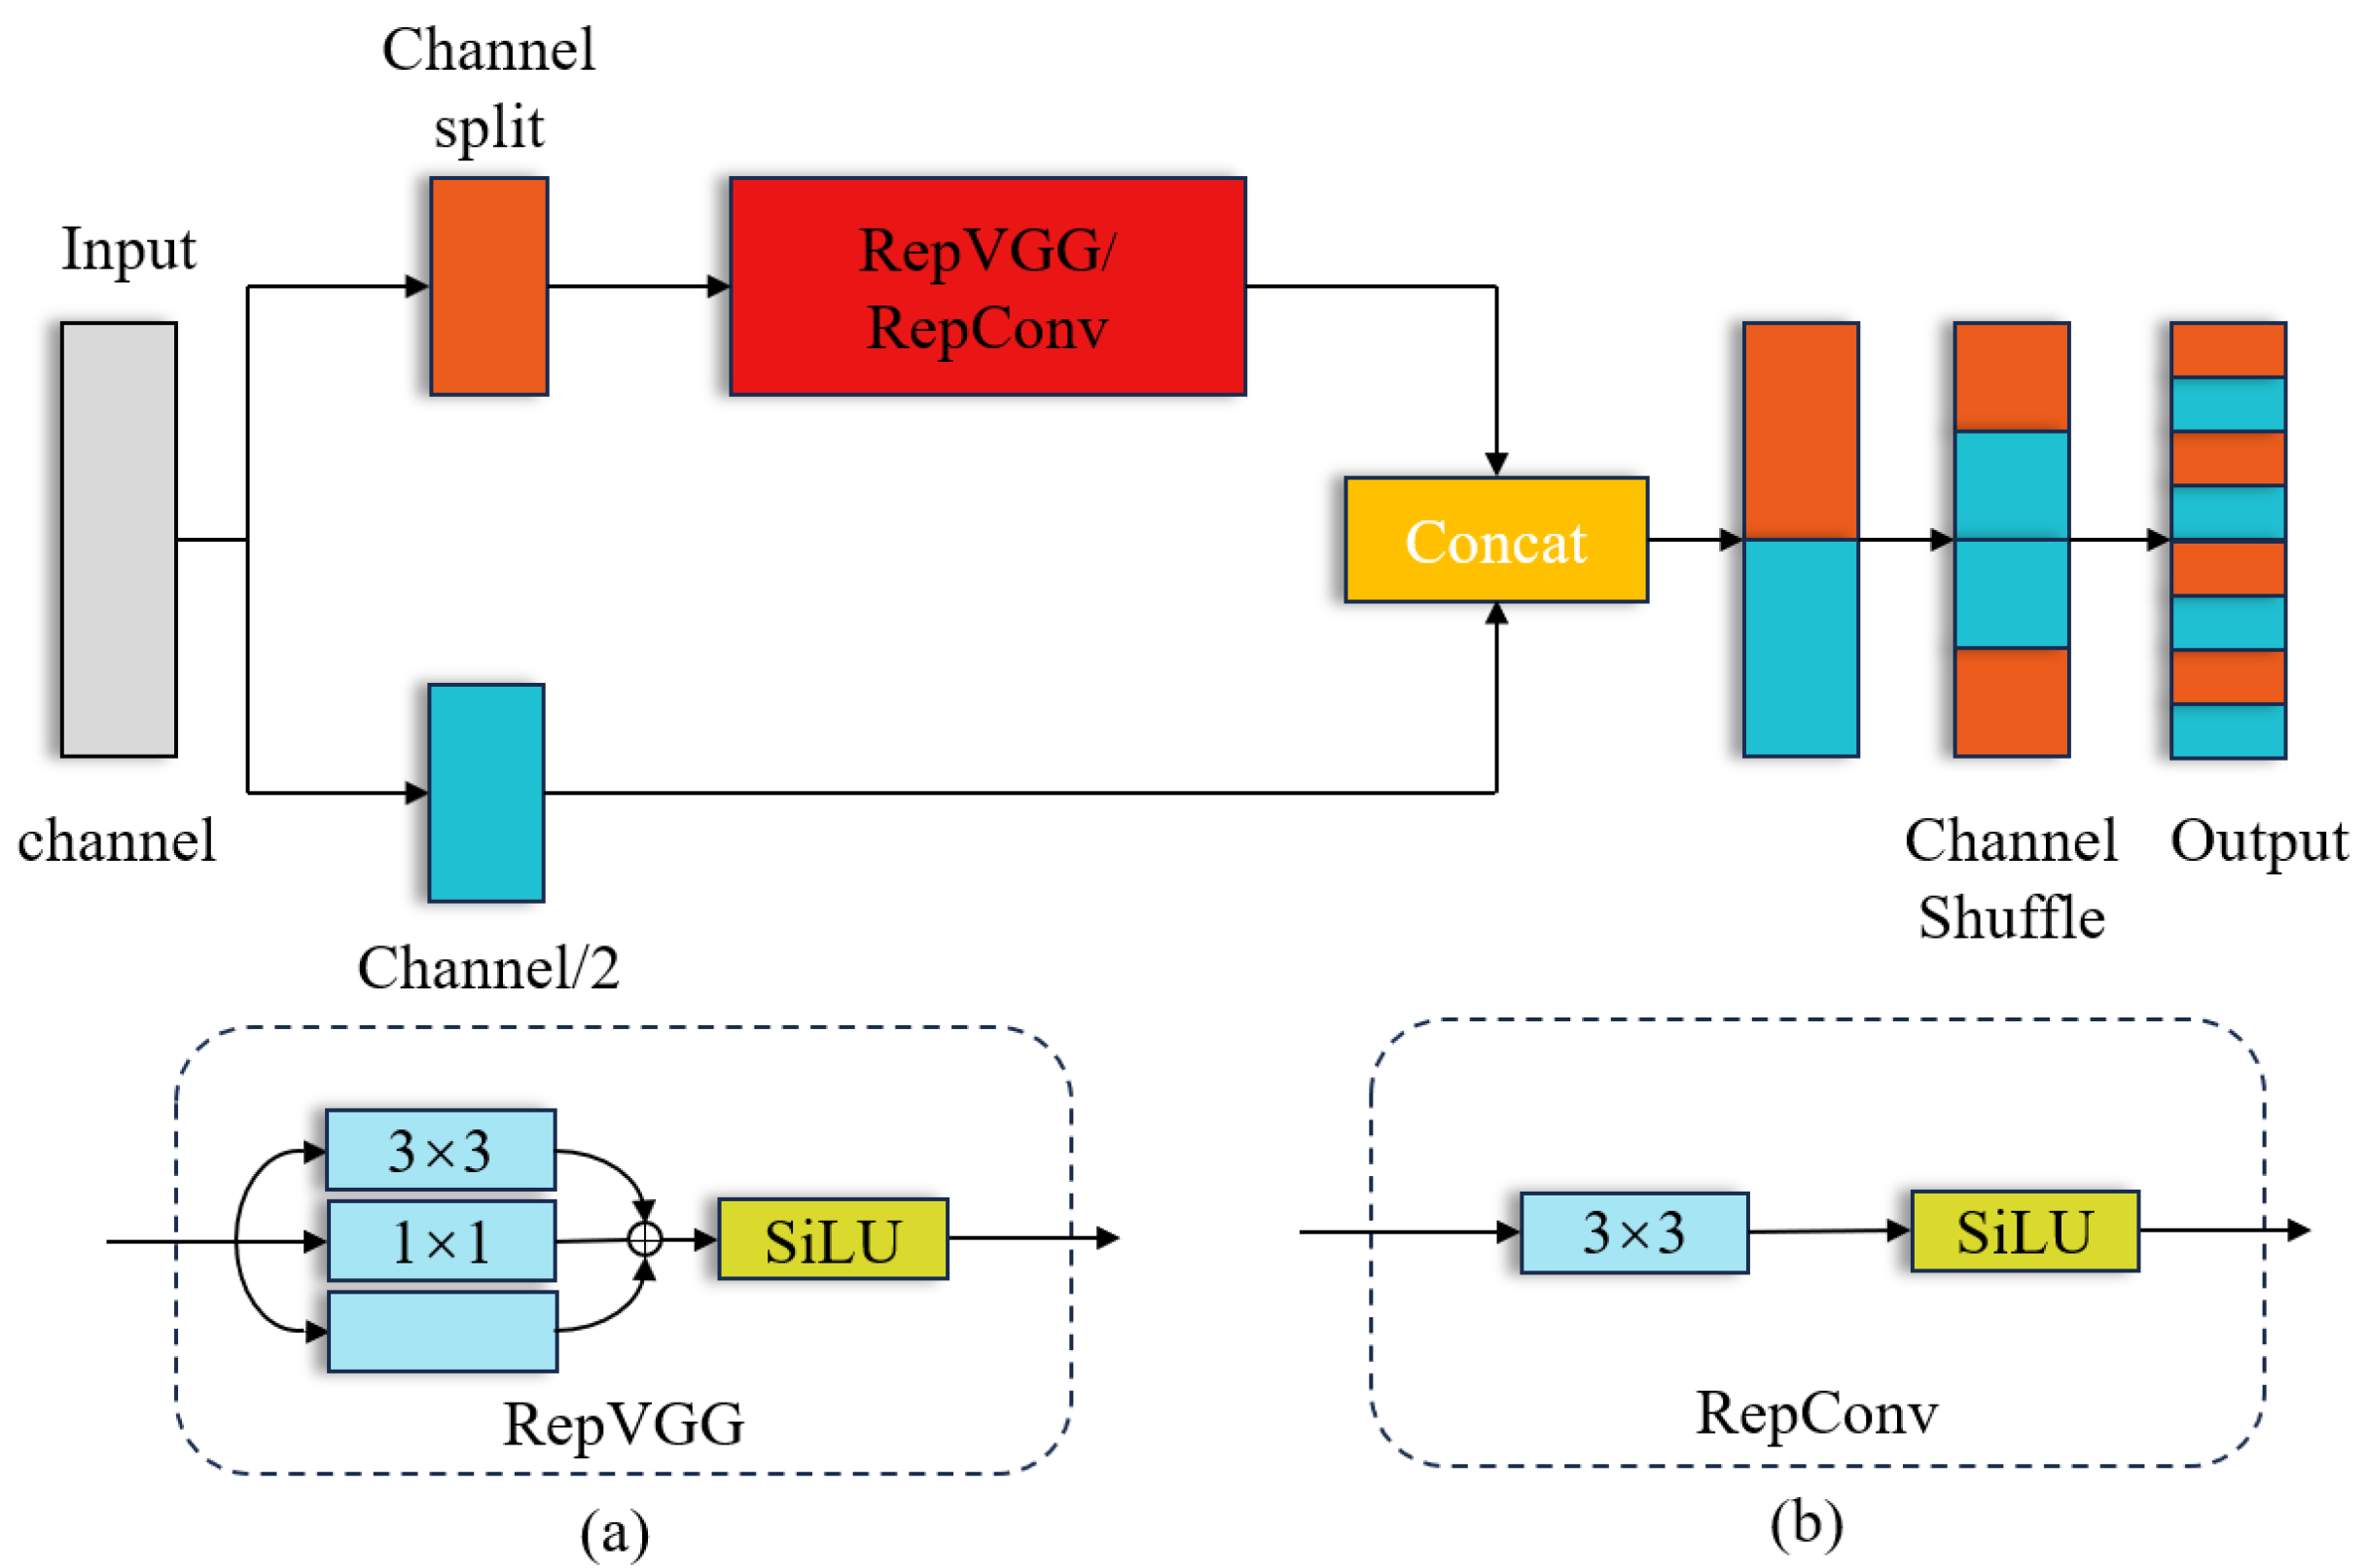
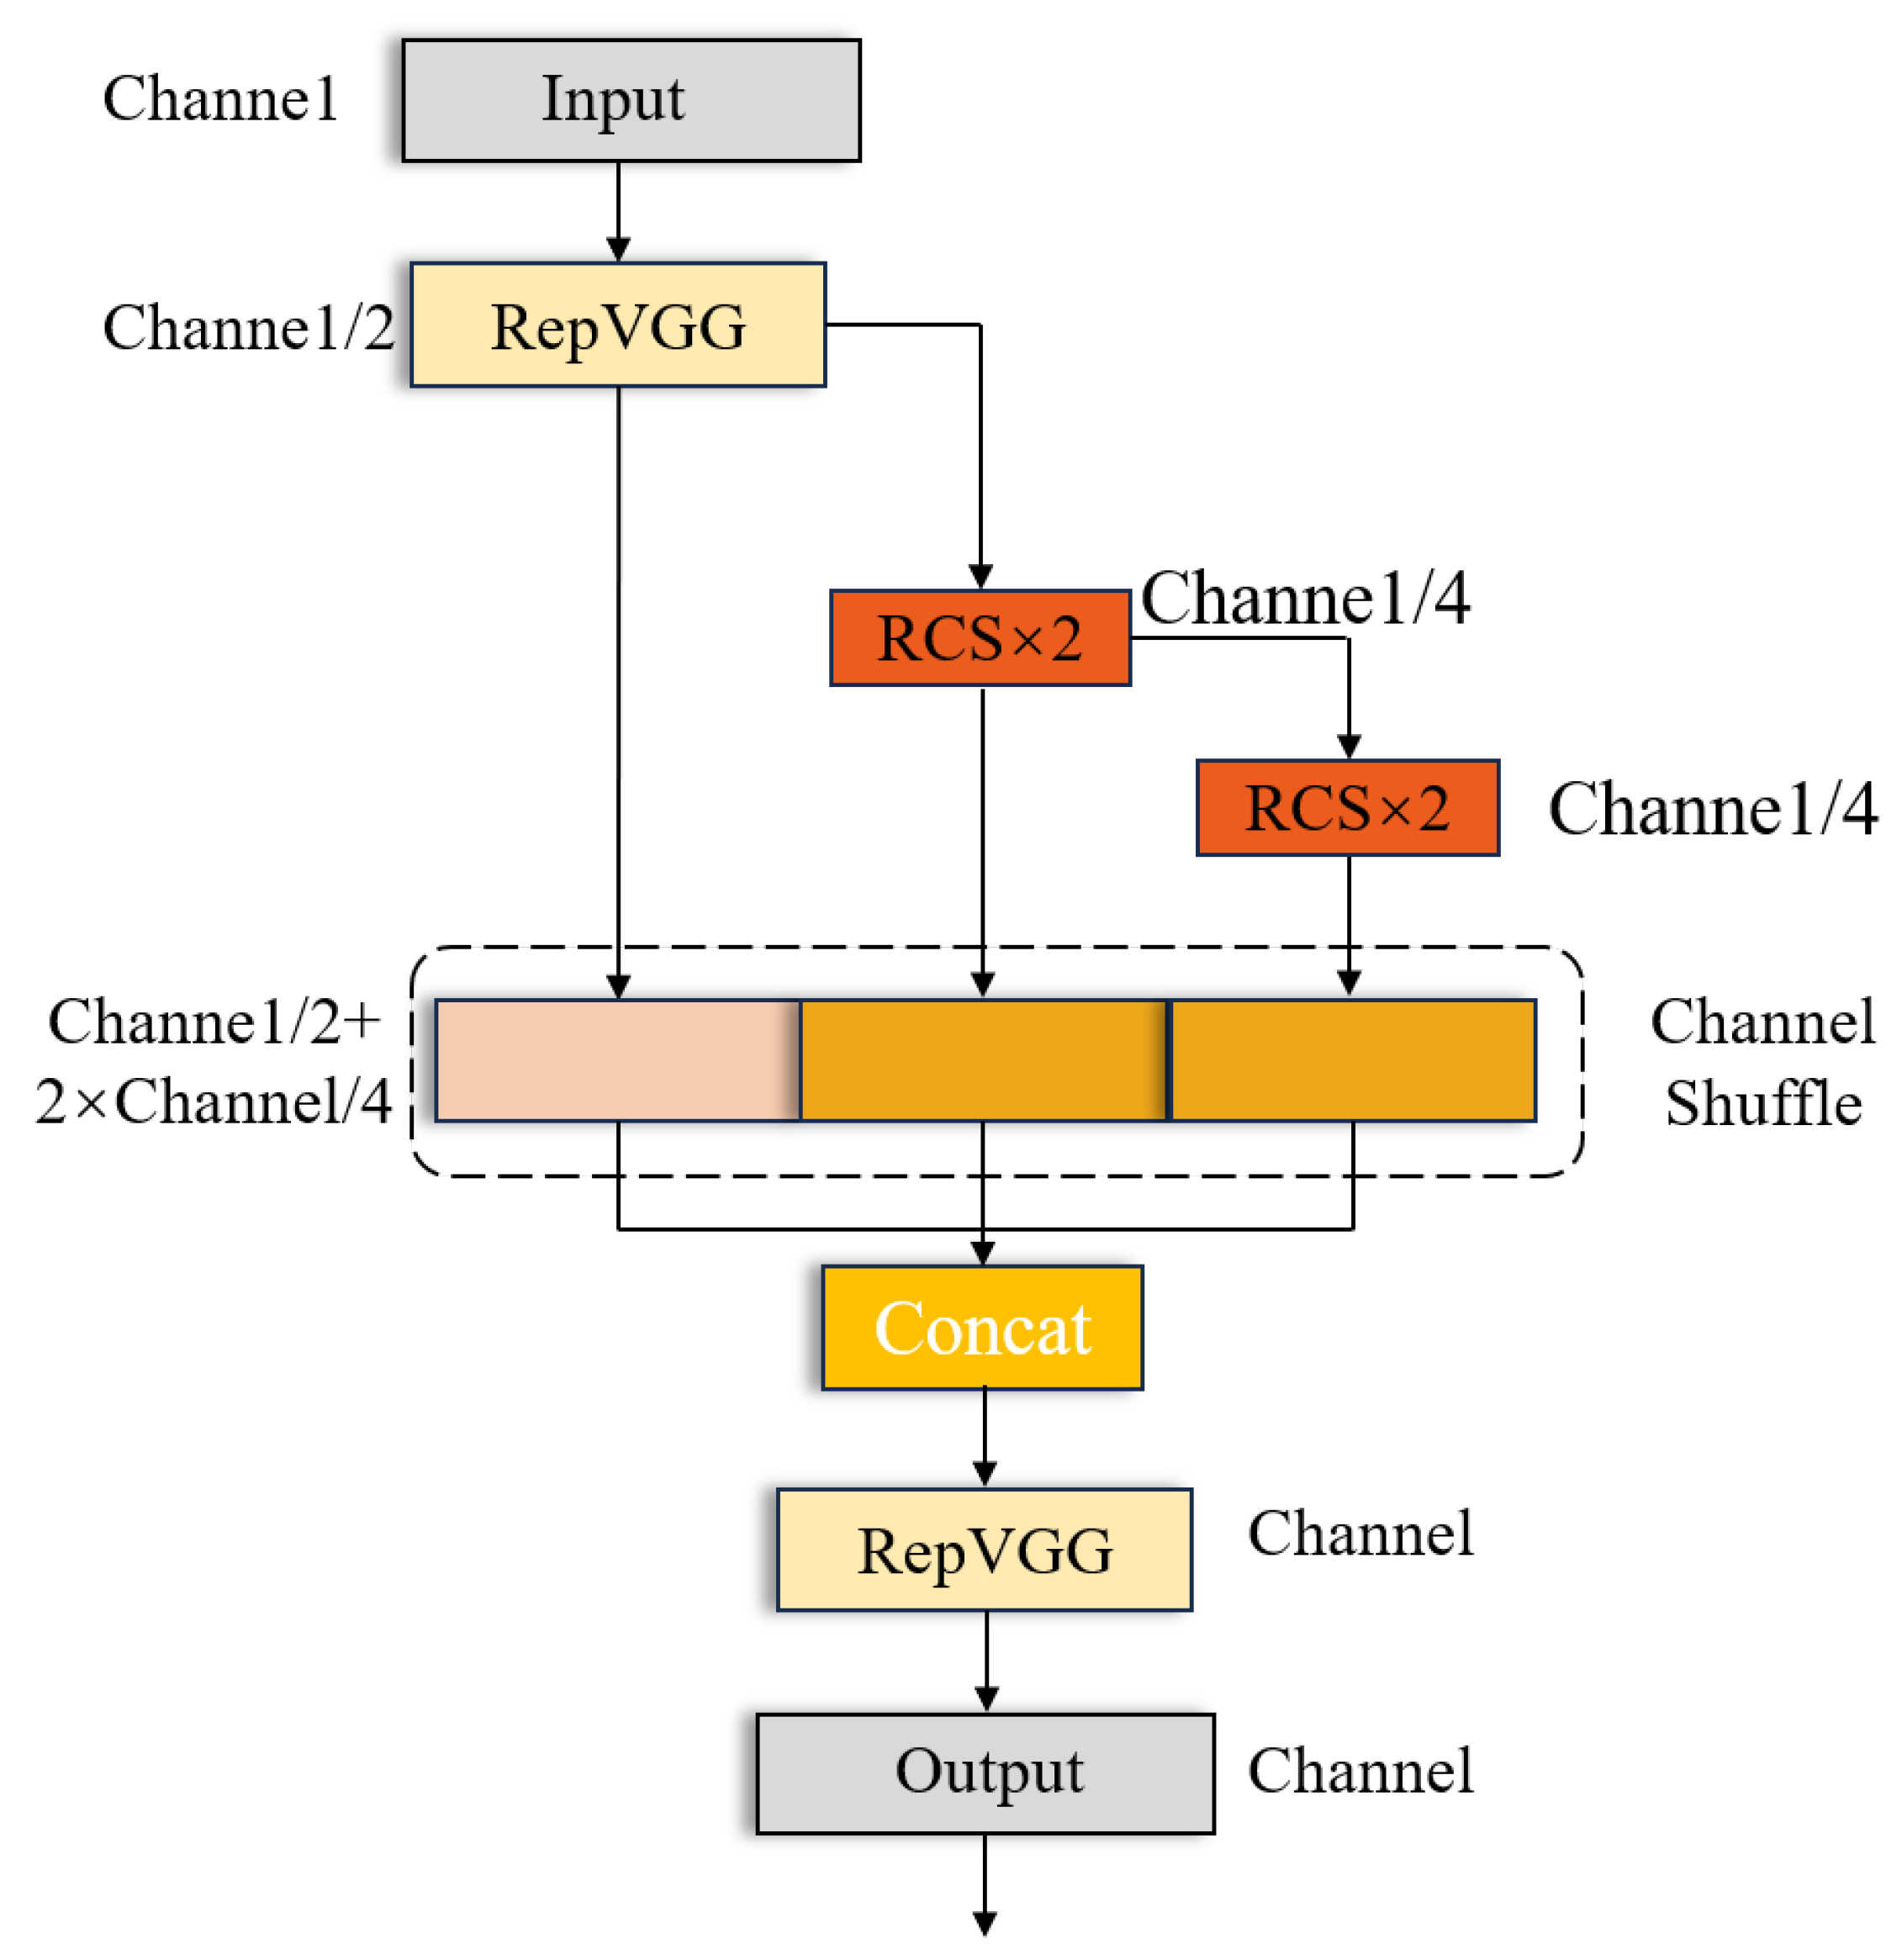
2.3. RCSOSA
3. Methods
- Penalty term . The penalty term is employed to facilitate the alignment of the predicted box with the real box. The formula for this is given below.where b and are denoted as the centroids of the prediction box and the real box, respectively, and denotes the computation of the Euclidean distance between the two centroids, and c denotes the diagonal distance of the smallest enclosing region that can contain both the prediction box and the real box. In addition, and v denote the weight parameter and the bounding box aspect ratio similarity, respectively.
- Weight parameter . The formula of it is as follows:
- Prediction of the overlap ratio between bounding boxes and real bounding boxes . The formula is shown below.A denotes the prediction box and B denotes the ground-truth box.
- Similarity of bounding box aspect ratio v. The formula of it is as follows:where w and h represent the width and height of the predicted bounding box, while and correspond to the width and height of the ground-truth bounding box.
4. Experiments
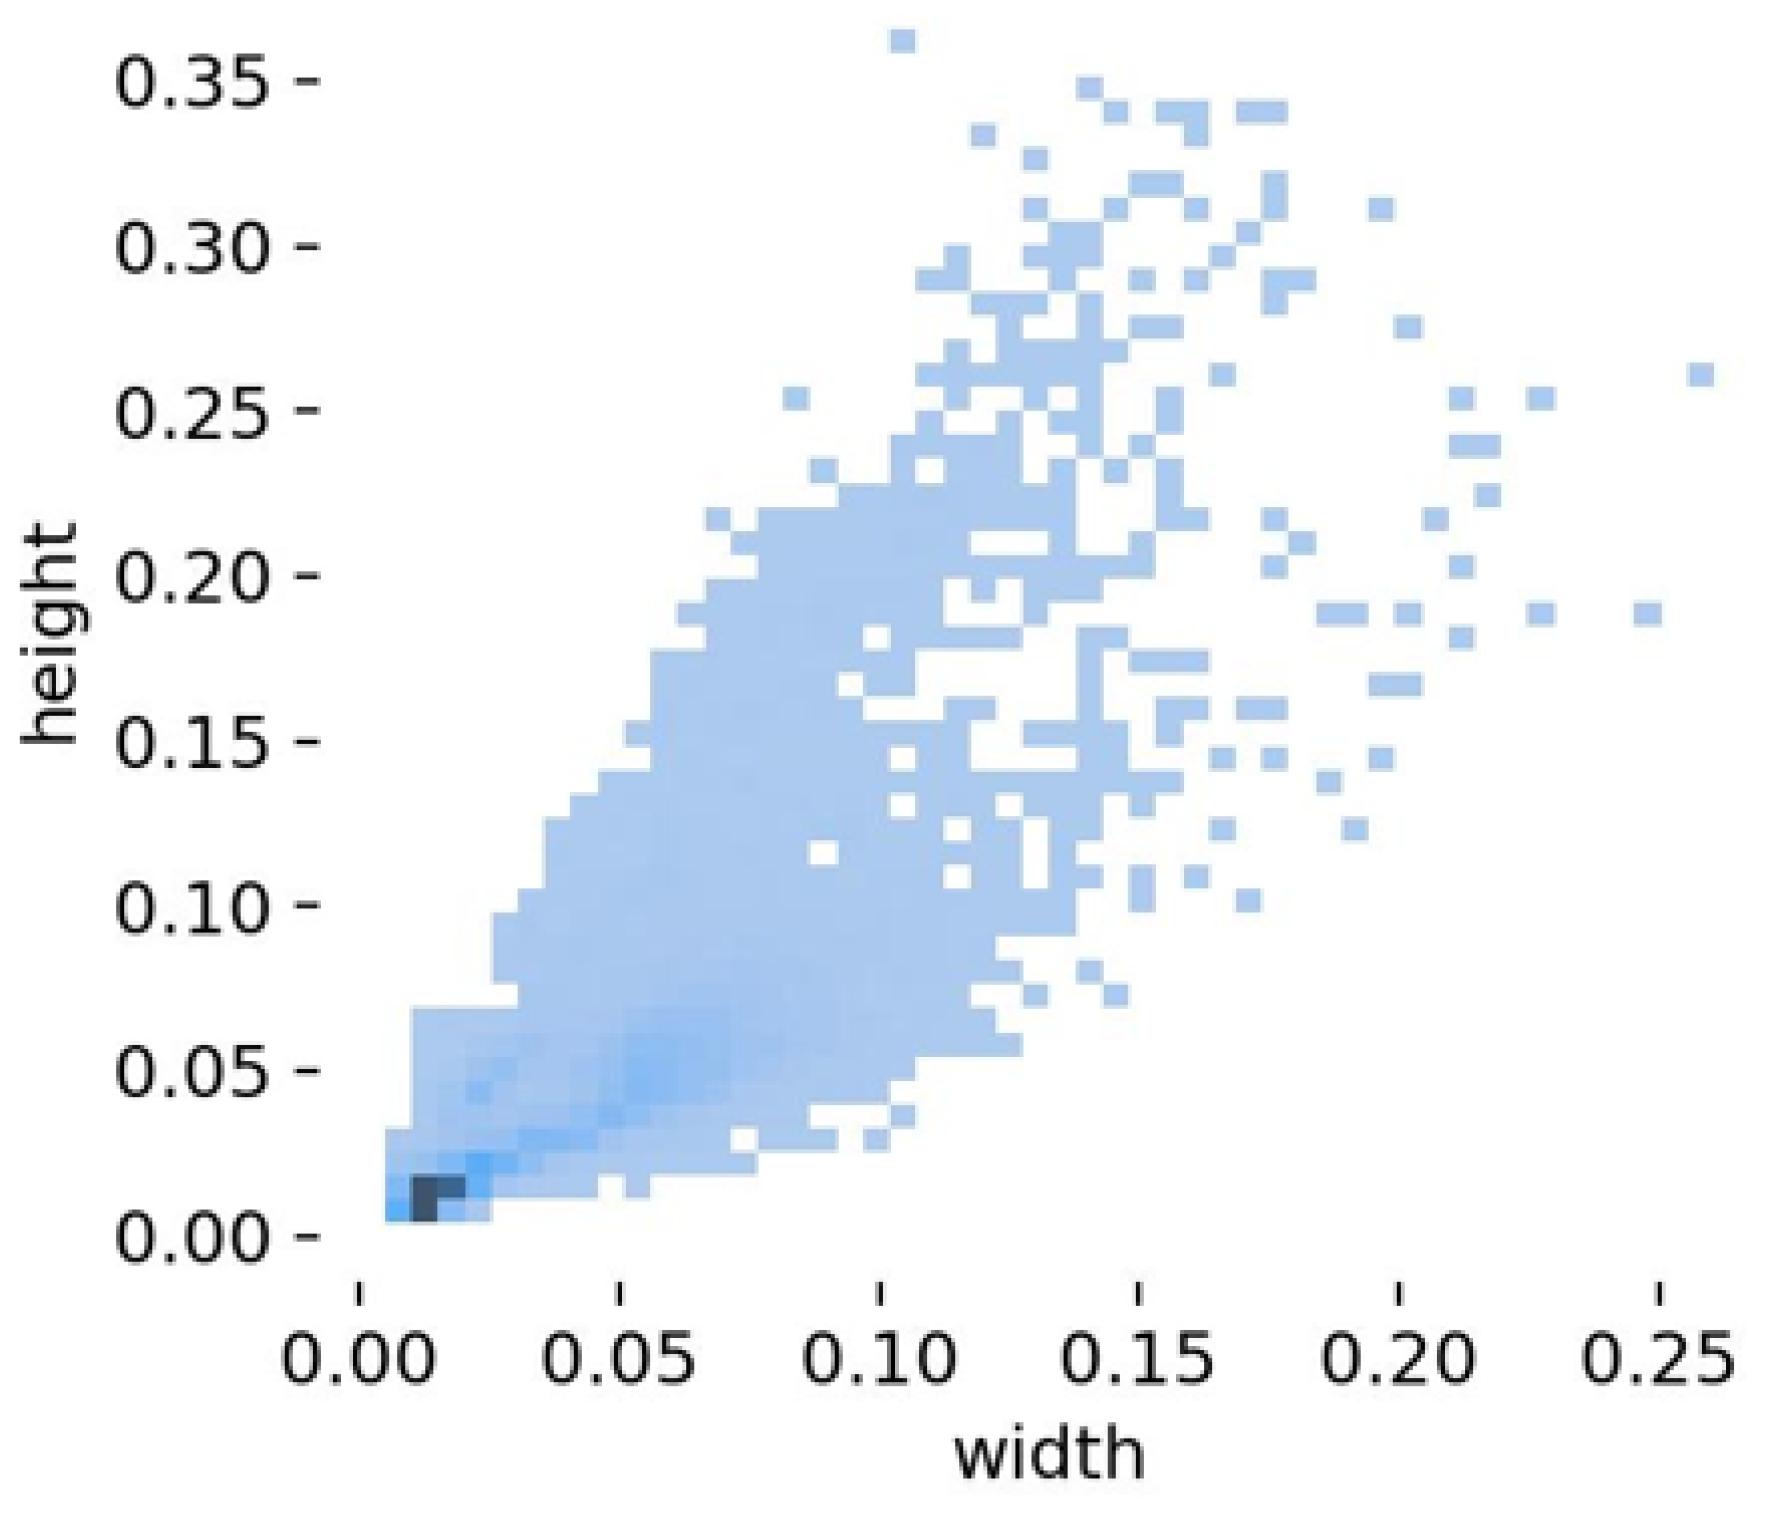
4.1. Dataset
4.2. Experimental Platform and Hyperparameter Settings
4.3. Evaluation Metrics
4.4. Experimental Results
5. Conclusions
Author Contributions
Funding
Data Availability Statement
Acknowledgments
Conflicts of Interest
References
- Luo, Y.; Yu, X.; Yang, D.; Zhou, B. A survey of intelligent transmission line inspection based on unmanned aerial vehicle. Artif. Intell. Rev. 2023, 56, 173–201. [Google Scholar] [CrossRef]
- Ballard, D.H. Generalizing the Hough transform to detect arbitrary shapes. Pattern Recognit. 1981, 13, 111–122. [Google Scholar] [CrossRef]
- Satpathy, A.; Jiang, X.; Eng, H.L. LBP-based edge-texture features for object recognition. IEEE Trans. Image Process. 2014, 23, 1953–1964. [Google Scholar] [CrossRef] [PubMed]
- Ding, L.; Goshtasby, A. On the Canny edge detector. Pattern Recognit. 2001, 34, 721–725. [Google Scholar] [CrossRef]
- Bi, Z.; Jing, L.; Sun, C.; Shan, M. YOLOX++ for transmission line abnormal target detection. IEEE Access 2023, 11, 38157–38167. [Google Scholar] [CrossRef]
- Chen, C.; Liu, M.Y.; Tuzel, O.; Xiao, J. R-CNN for small object detection. In Proceedings of the Computer Vision–ACCV 2016: 13th Asian Conference on Computer Vision, Taipei, Taiwan, 20–24 November 2016; Revised Selected Papers, Part V 13. Springer: Berlin/Heidelberg, Germany, 2017; pp. 214–230. [Google Scholar]
- Girshick, R. Fast r-cnn. In Proceedings of the IEEE International Conference on Computer Vision, Santiago, Chile, 7–13 December 2015; pp. 1440–1448. [Google Scholar]
- Ren, S.; He, K.; Girshick, R.; Sun, J. Faster r-cnn: Towards real-time object detection with region proposal networks. Adv. Neural Inf. Process. Syst. 2015, 28, 1–9. [Google Scholar] [CrossRef] [PubMed]
- Zhang, K.; Huang, W. Defect detection of anti-vibration hammer based on improved faster R-CNN. In Proceedings of the 2020 7th International Forum on Electrical Engineering and Automation (IFEEA), Hefei, China, 25–27 September 2020; pp. 889–893. [Google Scholar]
- Wenxia, B.; Yangxun, R.; Dong, L.; Xianjun, Y.; Qiuju, X. Defect detection algorithm of anti-vibration hammer based on improved cascade R-CNN. In Proceedings of the 2020 International Conference on Intelligent Computing and Human–Computer Interaction (ICHCI), Sanya, China, 4–6 December 2020; pp. 294–297. [Google Scholar]
- Zhai, Y.; Yang, K.; Zhao, Z.; Wang, Q.; Bai, K. Geometric characteristic learning R-CNN for shockproof hammer defect detection. Eng. Appl. Artif. Intell. 2022, 116, 105429. [Google Scholar] [CrossRef]
- Zhou, F.; Wen, G.; Qian, G.; Ma, Y.; Pan, H.; Liu, J.; Li, J. A high-efficiency deep-learning-based antivibration hammer defect detection model for energy-efficient transmission line inspection systems. Int. J. Antennas Propag. 2022, 2022, 3867581. [Google Scholar] [CrossRef]
- Liu, W.; Anguelov, D.; Erhan, D.; Szegedy, C.; Reed, S.; Fu, C.Y.; Berg, A.C. Ssd: Single shot multibox detector. In Proceedings of the Computer Vision–ECCV 2016: 14th European Conference, Amsterdam, The Netherlands, 11–14 October 2016; Proceedings, Part I 14. Springer: Berlin/Heidelberg, Germany, 2016; pp. 21–37. [Google Scholar]
- Redmon, J.; Farhadi, A. Yolov3: An incremental improvement. arXiv 2018, arXiv:1804.02767. [Google Scholar]
- Wang, C.Y.; Bochkovskiy, A.; Liao, H.Y.M. YOLOv7: Trainable bag-of-freebies sets new state-of-the-art for real-time object detectors. In Proceedings of the IEEE/CVF Conference on Computer Vision and Pattern Recognition, Vancouver, BC, Canada, 17–24 June 2023; pp. 7464–7475. [Google Scholar]
- Renwei, T.; Zhongjie, Z.; Yongqiang, B.; Ming, G.; Zhifeng, G. Key parts of transmission line detection using improved YOLO v3. Int. Arab J. Inf. Technol. 2021, 18, 747–754. [Google Scholar] [CrossRef]
- Guo, J.; Xie, J.; Yuan, J.; Jiang, Y.; Lu, S. Fault Identification of Transmission Line Shockproof Hammer Based on Improved YOLO V4. In Proceedings of the 2021 International Conference on Intelligent Computing, Automation and Applications (ICAA), Nanjing, China, 25–27 June 2021; pp. 826–833. [Google Scholar]
- Yuan, J.; Zheng, X.; Peng, L.; Qu, K.; Luo, H.; Wei, L.; Jin, J.; Tan, F. Identification method of typical defects in transmission lines based on YOLOv5 object detection algorithm. Energy Rep. 2023, 9, 323–332. [Google Scholar] [CrossRef]
- Di, T.; Feng, L.; Guo, H. Research on Real-Time Power Line Damage Detection Method Based on YOLO Algorithm. In Proceedings of the 2023 IEEE 3rd International Conference on Electronic Technology, Communication and Information (ICETCI), Changchun, China, 26–28 May 2023; pp. 671–676. [Google Scholar]
- Ding, L.; Rao, Z.Q.; Ding, B.; Li, S.J. Research on defect detection method of railway transmission line insulators based on GC-YOLO. IEEE Access 2023, 11, 102635–102642. [Google Scholar] [CrossRef]
- Yu, C.; Liu, Y.; Zhang, W.; Zhang, X.; Zhang, Y.; Jiang, X. Foreign Objects Identification of Transmission Line Based on Improved YOLOv7. IEEE Access 2023, 11, 51997–52008. [Google Scholar] [CrossRef]
- Li, M.; Ding, L. DF-YOLO: Highly Accurate Transmission Line Foreign Object Detection Algorithm. IEEE Access 2023, 11, 108398–108406. [Google Scholar] [CrossRef]
- Lin, T.Y.; Dollár, P.; Girshick, R.; He, K.; Hariharan, B.; Belongie, S. Feature pyramid networks for object detection. In Proceedings of the IEEE Conference on Computer Vision and Pattern Recognition, Honolulu, HI, USA, 21–26 July 2017; pp. 2117–2125. [Google Scholar]
- Wang, W.; Xie, E.; Song, X.; Zang, Y.; Wang, W.; Lu, T.; Yu, G.; Shen, C. Efficient and accurate arbitrary-shaped text detection with pixel aggregation network. In Proceedings of the IEEE/CVF International Conference on Computer Vision, Seoul, Republic of Korea, 27 October–2 November 2019; pp. 8440–8449. [Google Scholar]
- He, K.; Zhang, X.; Ren, S.; Sun, J. Deep residual learning for image recognition. In Proceedings of the IEEE Conference on Computer Vision and Pattern Recognition, Las Vegas, NV, USA, 27–30 June 2016; pp. 770–778. [Google Scholar]
- Liu, Z.; Mao, H.; Wu, C.Y.; Feichtenhofer, C.; Darrell, T.; Xie, S. A convnet for the 2020s. In Proceedings of the IEEE/CVF Conference on Computer Vision and Pattern Recognition, New Orleans, LA, USA, 18–24 June 2022; pp. 11976–11986. [Google Scholar]
- Liu, Z.; Lin, Y.; Cao, Y.; Hu, H.; Wei, Y.; Zhang, Z.; Lin, S.; Guo, B. Swin transformer: Hierarchical vision transformer using shifted windows. In Proceedings of the IEEE/CVF International Conference on Computer Vision, Montreal, BC, Canada, 11–17 October 2021; pp. 10012–10022. [Google Scholar]
- Howard, A.; Sandler, M.; Chu, G.; Chen, L.C.; Chen, B.; Tan, M.; Wang, W.; Zhu, Y.; Pang, R.; Vasudevan, V.; et al. Searching for mobilenetv3. In Proceedings of the IEEE/CVF International Conference on Computer Vision, Seoul, Republic of Korea, 27 October–2 November 2019; pp. 1314–1324. [Google Scholar]
- Kang, M.; Ting, C.M.; Ting, F.F.; Phan, R.C.W. RCS-YOLO: A fast and high-accuracy object detector for brain tumor detection. In Proceedings of the International Conference on Medical Image Computing and Computer-Assisted Intervention; Springer: Berlin/Heidelberg, Germany, 2023; pp. 600–610. [Google Scholar]
- Zhang, X.; Zhou, X.; Lin, M.; Sun, J. Shufflenet: An extremely efficient convolutional neural network for mobile devices. In Proceedings of the IEEE Conference on Computer Vision and Pattern Recognition, Salt Lake City, UT, USA, 18–23 June 2018; pp. 6848–6856. [Google Scholar]
- Tong, Z.; Chen, Y.; Xu, Z.; Yu, R. Wise-IoU: Bounding Box Regression Loss with Dynamic Focusing Mechanism. arXiv 2023, arXiv:2301.10051. [Google Scholar]
- Zheng, Z.; Wang, P.; Liu, W.; Li, J.; Ye, R.; Ren, D. Distance-IoU loss: Faster and better learning for bounding box regression. In Proceedings of the AAAI Conference on Artificial Intelligence, New York, NY, USA, 7–12 February 2020; Volume 34, pp. 12993–13000. [Google Scholar]
- Redmon, J.; Divvala, S.; Girshick, R.; Farhadi, A. You only look once: Unified, real-time object detection. In Proceedings of the IEEE Conference on Computer Vision and Pattern Recognition, Las Vegas, NV, USA, 27–30 June 2016; pp. 779–788. [Google Scholar]
- Li, C.; Li, L.; Jiang, H.; Weng, K.; Geng, Y.; Li, L.; Ke, Z.; Li, Q.; Cheng, M.; Nie, W.; et al. YOLOv6: A single-stage object detection framework for industrial applications. arXiv 2022, arXiv:2209.02976. [Google Scholar]
- Aktaş, M.; Ateş, H.F. Small object detection and tracking from aerial imagery. In Proceedings of the 2021 6th International Conference on Computer Science and Engineering (UBMK), Ankara, Turkey, 15–17 September 2021; pp. 688–693. [Google Scholar]
- Cai, Z.; Vasconcelos, N. Cascade r-cnn: Delving into high quality object detection. In Proceedings of the IEEE Conference on Computer Vision and Pattern Recognition, Salt Lake City, UT, USA, 18–23 June 2018; pp. 6154–6162. [Google Scholar]
- Su, Z.; Yu, J.; Tan, H.; Wan, X.; Qi, K. MSA-YOLO: A Remote Sensing Object Detection Model Based on Multi-Scale Strip Attention. Sensors 2023, 23, 6811. [Google Scholar] [CrossRef]


| Category | Training Set | Validation Set | Test Set |
|---|---|---|---|
| suspension clamp | 1401 | 419 | 188 |
| strain clamp | 3114 | 874 | 461 |
| shockproof hammer | 6265 | 1859 | 921 |
| Model | P (%) | R (%) | mAP@0.5 (%) | Parameters (M) | GFLOPs | FPS |
|---|---|---|---|---|---|---|
| YOLOv3 [14] | 91.3 | 83.8 | 88.2 | 103.7 | 282.2 | 24.4 |
| YOLOv3-tiny | 88.9 | 68.4 | 74.2 | 12.1 | 18.9 | 120.1 |
| YOLOv5n [33] | 88.2 | 75.2 | 80.6 | 2.5 | 7.1 | 71.7 |
| YOLOv6n [34] | 90.3 | 64.6 | 80.7 | 4.3 | 11.8 | 81.1 |
| YOLOv8n | 90.0 | 76.1 | 82.6 | 3.0 | 8.1 | 93.2 |
| YOLOv8s | 88.9 | 80.1 | 84.8 | 11.1 | 28.4 | 78.6 |
| SOD-YOLO | 92.7 | 84.2 | 90.1 | 3.4 | 21.9 | 88.7 |
| Model | SODL | RCSOSA | Wise-CIoU | mAP@0.5 (%) | Parameters (M) | GFLOPs | FPS |
|---|---|---|---|---|---|---|---|
| YOLO v8n | ✕ | ✕ | ✕ | 82.6 | 3.0 | 8.1 | 93.2 |
| S-YOLO | ✓ | ✕ | ✕ | 87.9 | 2.9 | 12.2 | 77.0 |
| SR-YOLO | ✓ | ✓ | ✕ | 89.0 | 3.4 | 21.9 | 88.6 |
| SOD-YOLO | ✓ | ✓ | ✓ | 90.1 | 3.4 | 21.8 | 88.7 |
| Model | Target Class (AP/%) | mAP @0.5(%) | |||||||||
|---|---|---|---|---|---|---|---|---|---|---|---|
| Pedestrian | Person | Bicycle | Car | Van | Truck | Tricycle | A-t | Bus | Motor | ||
| Faster R-CNN [8] | 21.4 | 15.6 | 6.7 | 51.7 | 29.5 | 19.0 | 13.1 | 7.7 | 31.4 | 20.7 | 21.7 |
| Cascade R-CNN [36] | 22.2 | 14.8 | 7.6 | 54.6 | 31.5 | 21.6 | 14.8 | 8.6 | 34.9 | 21.4 | 23.2 |
| YOLO v3 [14] | 18.1 | 9.9 | 2.0 | 56.6 | 17.5 | 17.6 | 6.7 | 2.9 | 32.4 | 17.0 | 17.6 |
| YOLO v5s [33] | 40.8 | 32.6 | 13.6 | 74.6 | 37.6 | 32.8 | 21.9 | 12.5 | 44.9 | 40.0 | 35.1 |
| MSA- YOLO [37] | 33.4 | 17.3 | 11.2 | 76.8 | 41.5 | 41.4 | 14.8 | 18.4 | 60.9 | 31.0 | 34.7 |
| YOLO v7-tiny | 39.6 | 36.2 | 9.6 | 77.5 | 38.3 | 30.3 | 19.4 | 10.2 | 49.6 | 44.5 | 35.5 |
| YOLO v8n | 34.4 | 27.3 | 7.2 | 75.8 | 38.8 | 28.1 | 21.2 | 11.1 | 46.6 | 35.6 | 32.6 |
| SOD -YOLO | 44.1 | 27.4 | 11.8 | 80.5 | 41.1 | 31.0 | 23.9 | 14.7 | 49.5 | 45.0 | 37.9 |
Disclaimer/Publisher’s Note: The statements, opinions and data contained in all publications are solely those of the individual author(s) and contributor(s) and not of MDPI and/or the editor(s). MDPI and/or the editor(s) disclaim responsibility for any injury to people or property resulting from any ideas, methods, instructions or products referred to in the content. |
© 2024 by the authors. Licensee MDPI, Basel, Switzerland. This article is an open access article distributed under the terms and conditions of the Creative Commons Attribution (CC BY) license (https://creativecommons.org/licenses/by/4.0/).
Share and Cite
Wu, K.; Chen, Y.; Lu, Y.; Yang, Z.; Yuan, J.; Zheng, E. SOD-YOLO: A High-Precision Detection of Small Targets on High-Voltage Transmission Lines. Electronics 2024, 13, 1371. https://doi.org/10.3390/electronics13071371
Wu K, Chen Y, Lu Y, Yang Z, Yuan J, Zheng E. SOD-YOLO: A High-Precision Detection of Small Targets on High-Voltage Transmission Lines. Electronics. 2024; 13(7):1371. https://doi.org/10.3390/electronics13071371
Chicago/Turabian StyleWu, Kaijun, Yifu Chen, Yaolin Lu, Zhonghao Yang, Jiayu Yuan, and Enhui Zheng. 2024. "SOD-YOLO: A High-Precision Detection of Small Targets on High-Voltage Transmission Lines" Electronics 13, no. 7: 1371. https://doi.org/10.3390/electronics13071371
APA StyleWu, K., Chen, Y., Lu, Y., Yang, Z., Yuan, J., & Zheng, E. (2024). SOD-YOLO: A High-Precision Detection of Small Targets on High-Voltage Transmission Lines. Electronics, 13(7), 1371. https://doi.org/10.3390/electronics13071371