
Performance Test, Index System Establishment, and Comprehensive Evaluation of Earthquake Rescue Robots

Abstract
:1. Introduction
- (1)
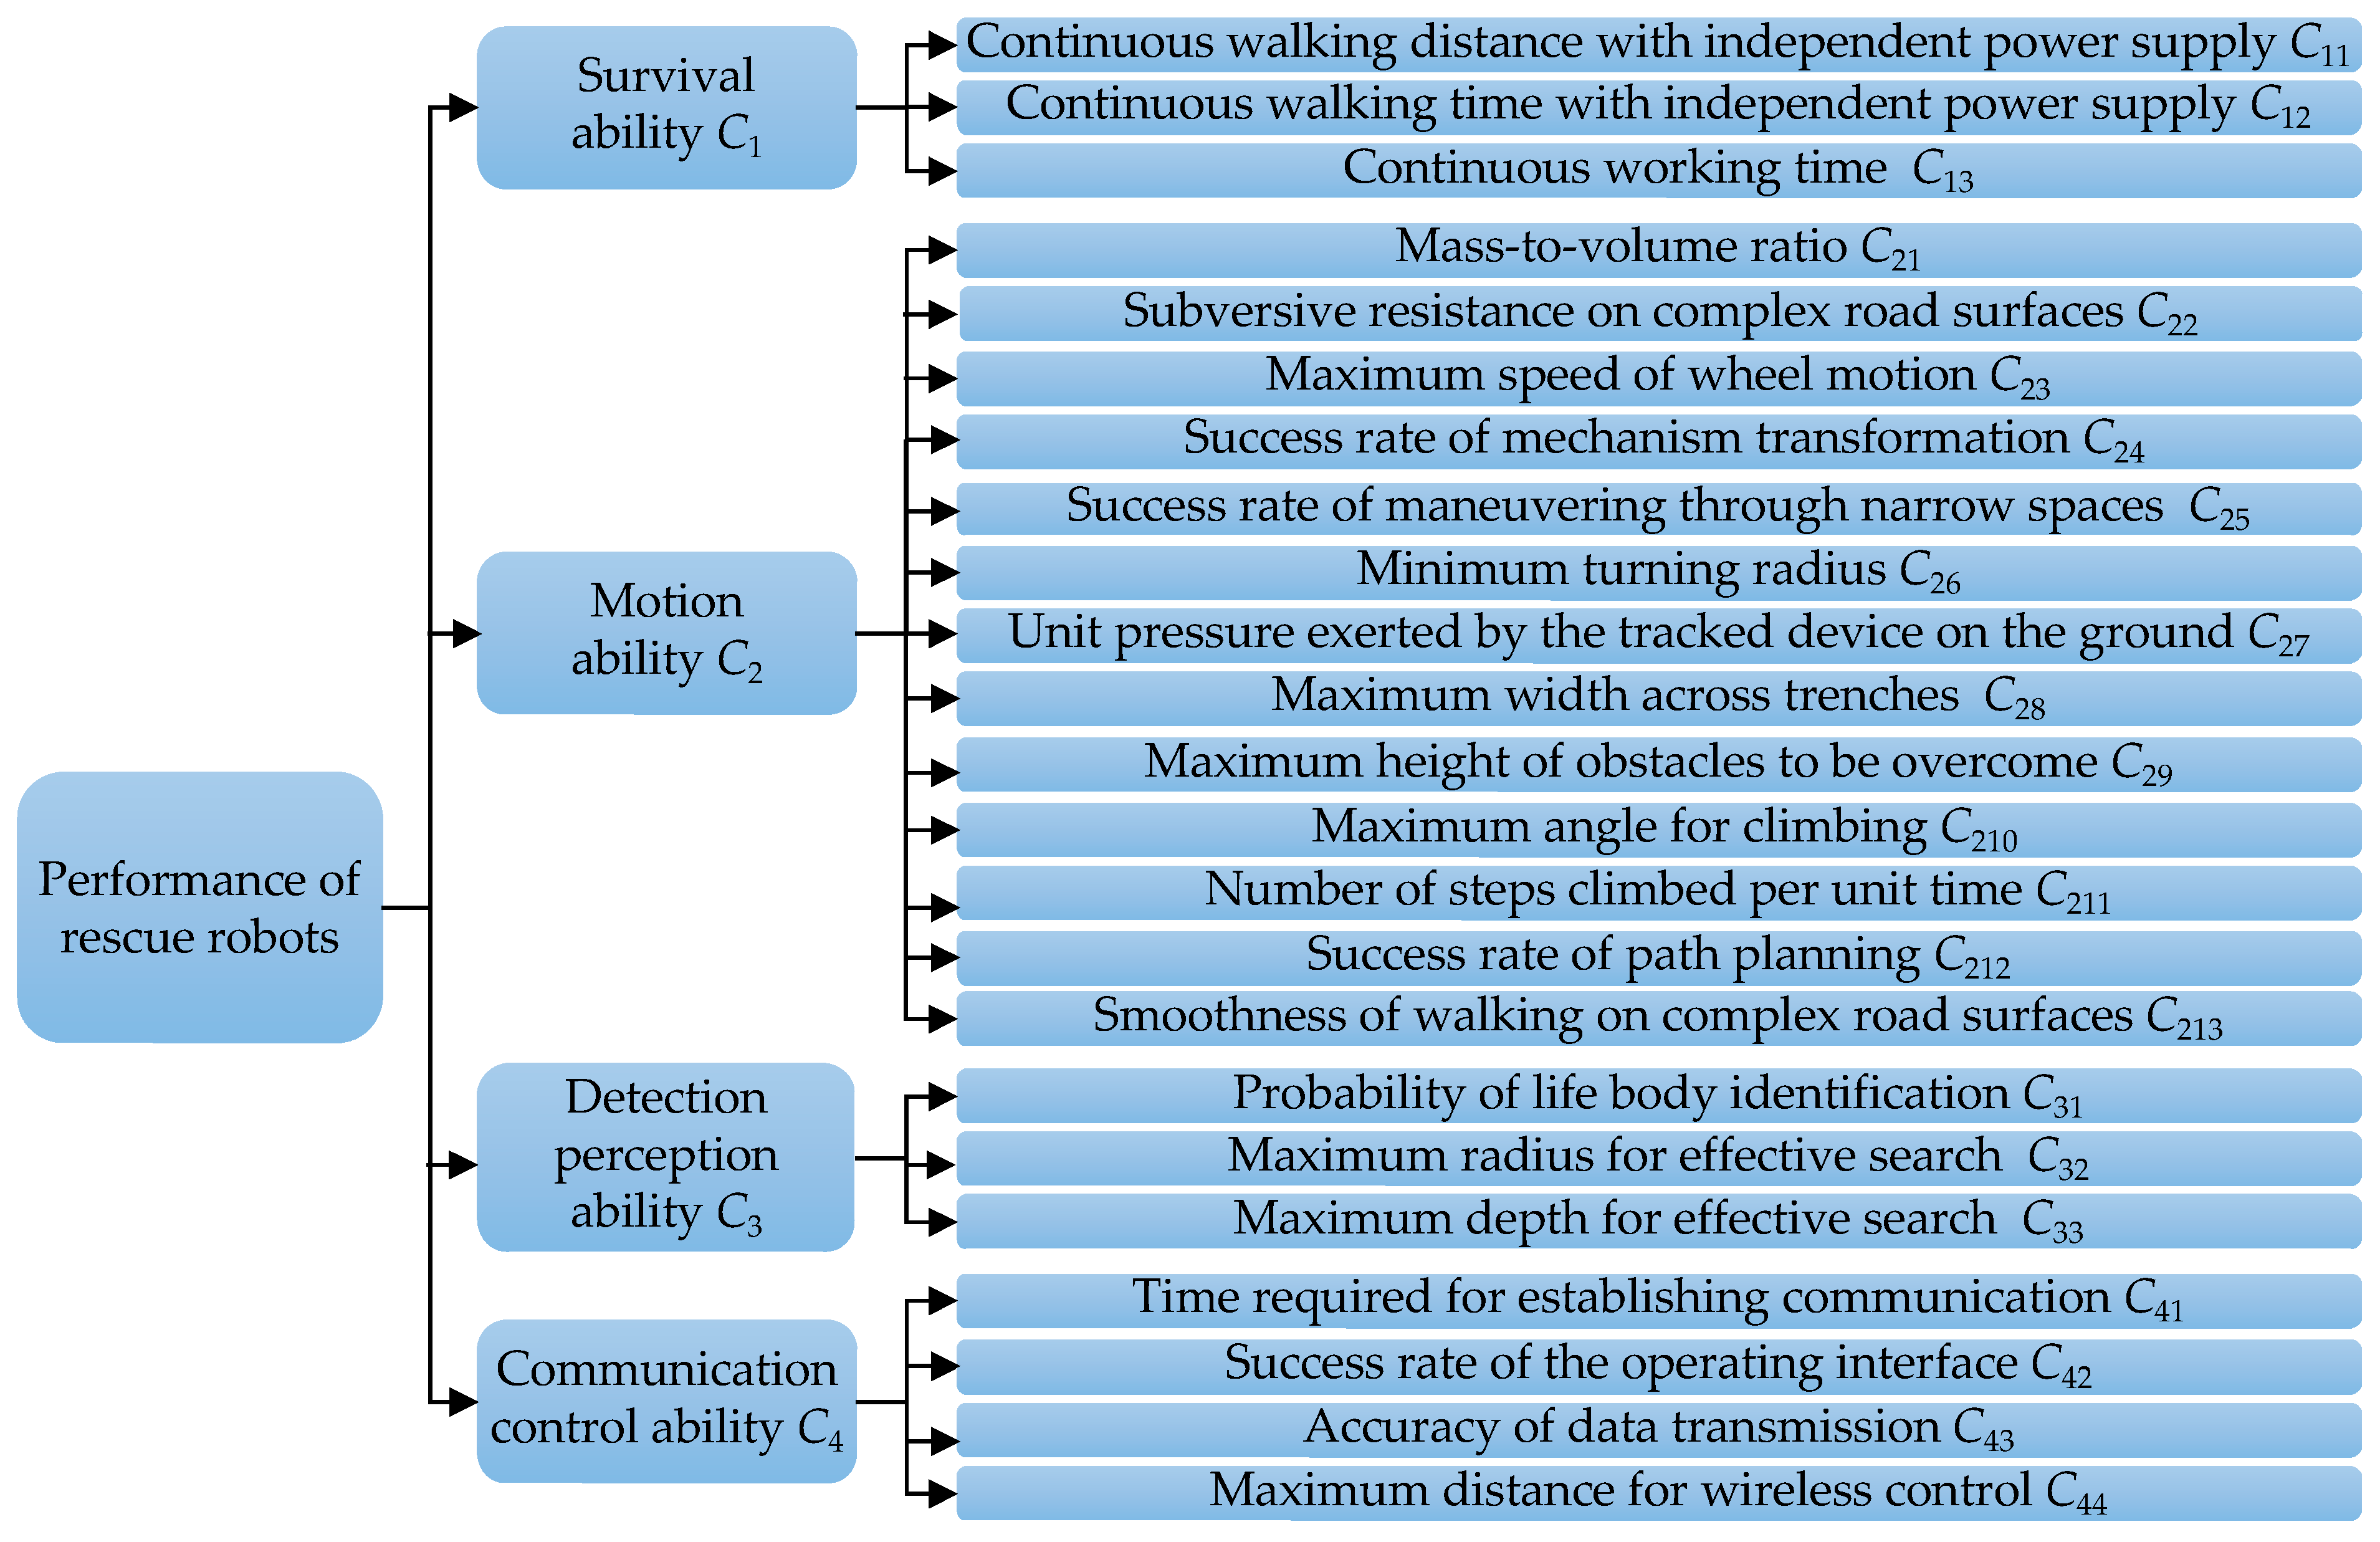
- The objective is achieved by establishing a hierarchical structure of performance evaluation, which proposes four main criteria and twenty-three sub-criteria indexes. Subsequently, three types of alternatives for earthquake rescue robots are evaluated through performance tests to obtain a comprehensive evaluation set for the corresponding criteria.
- (2)
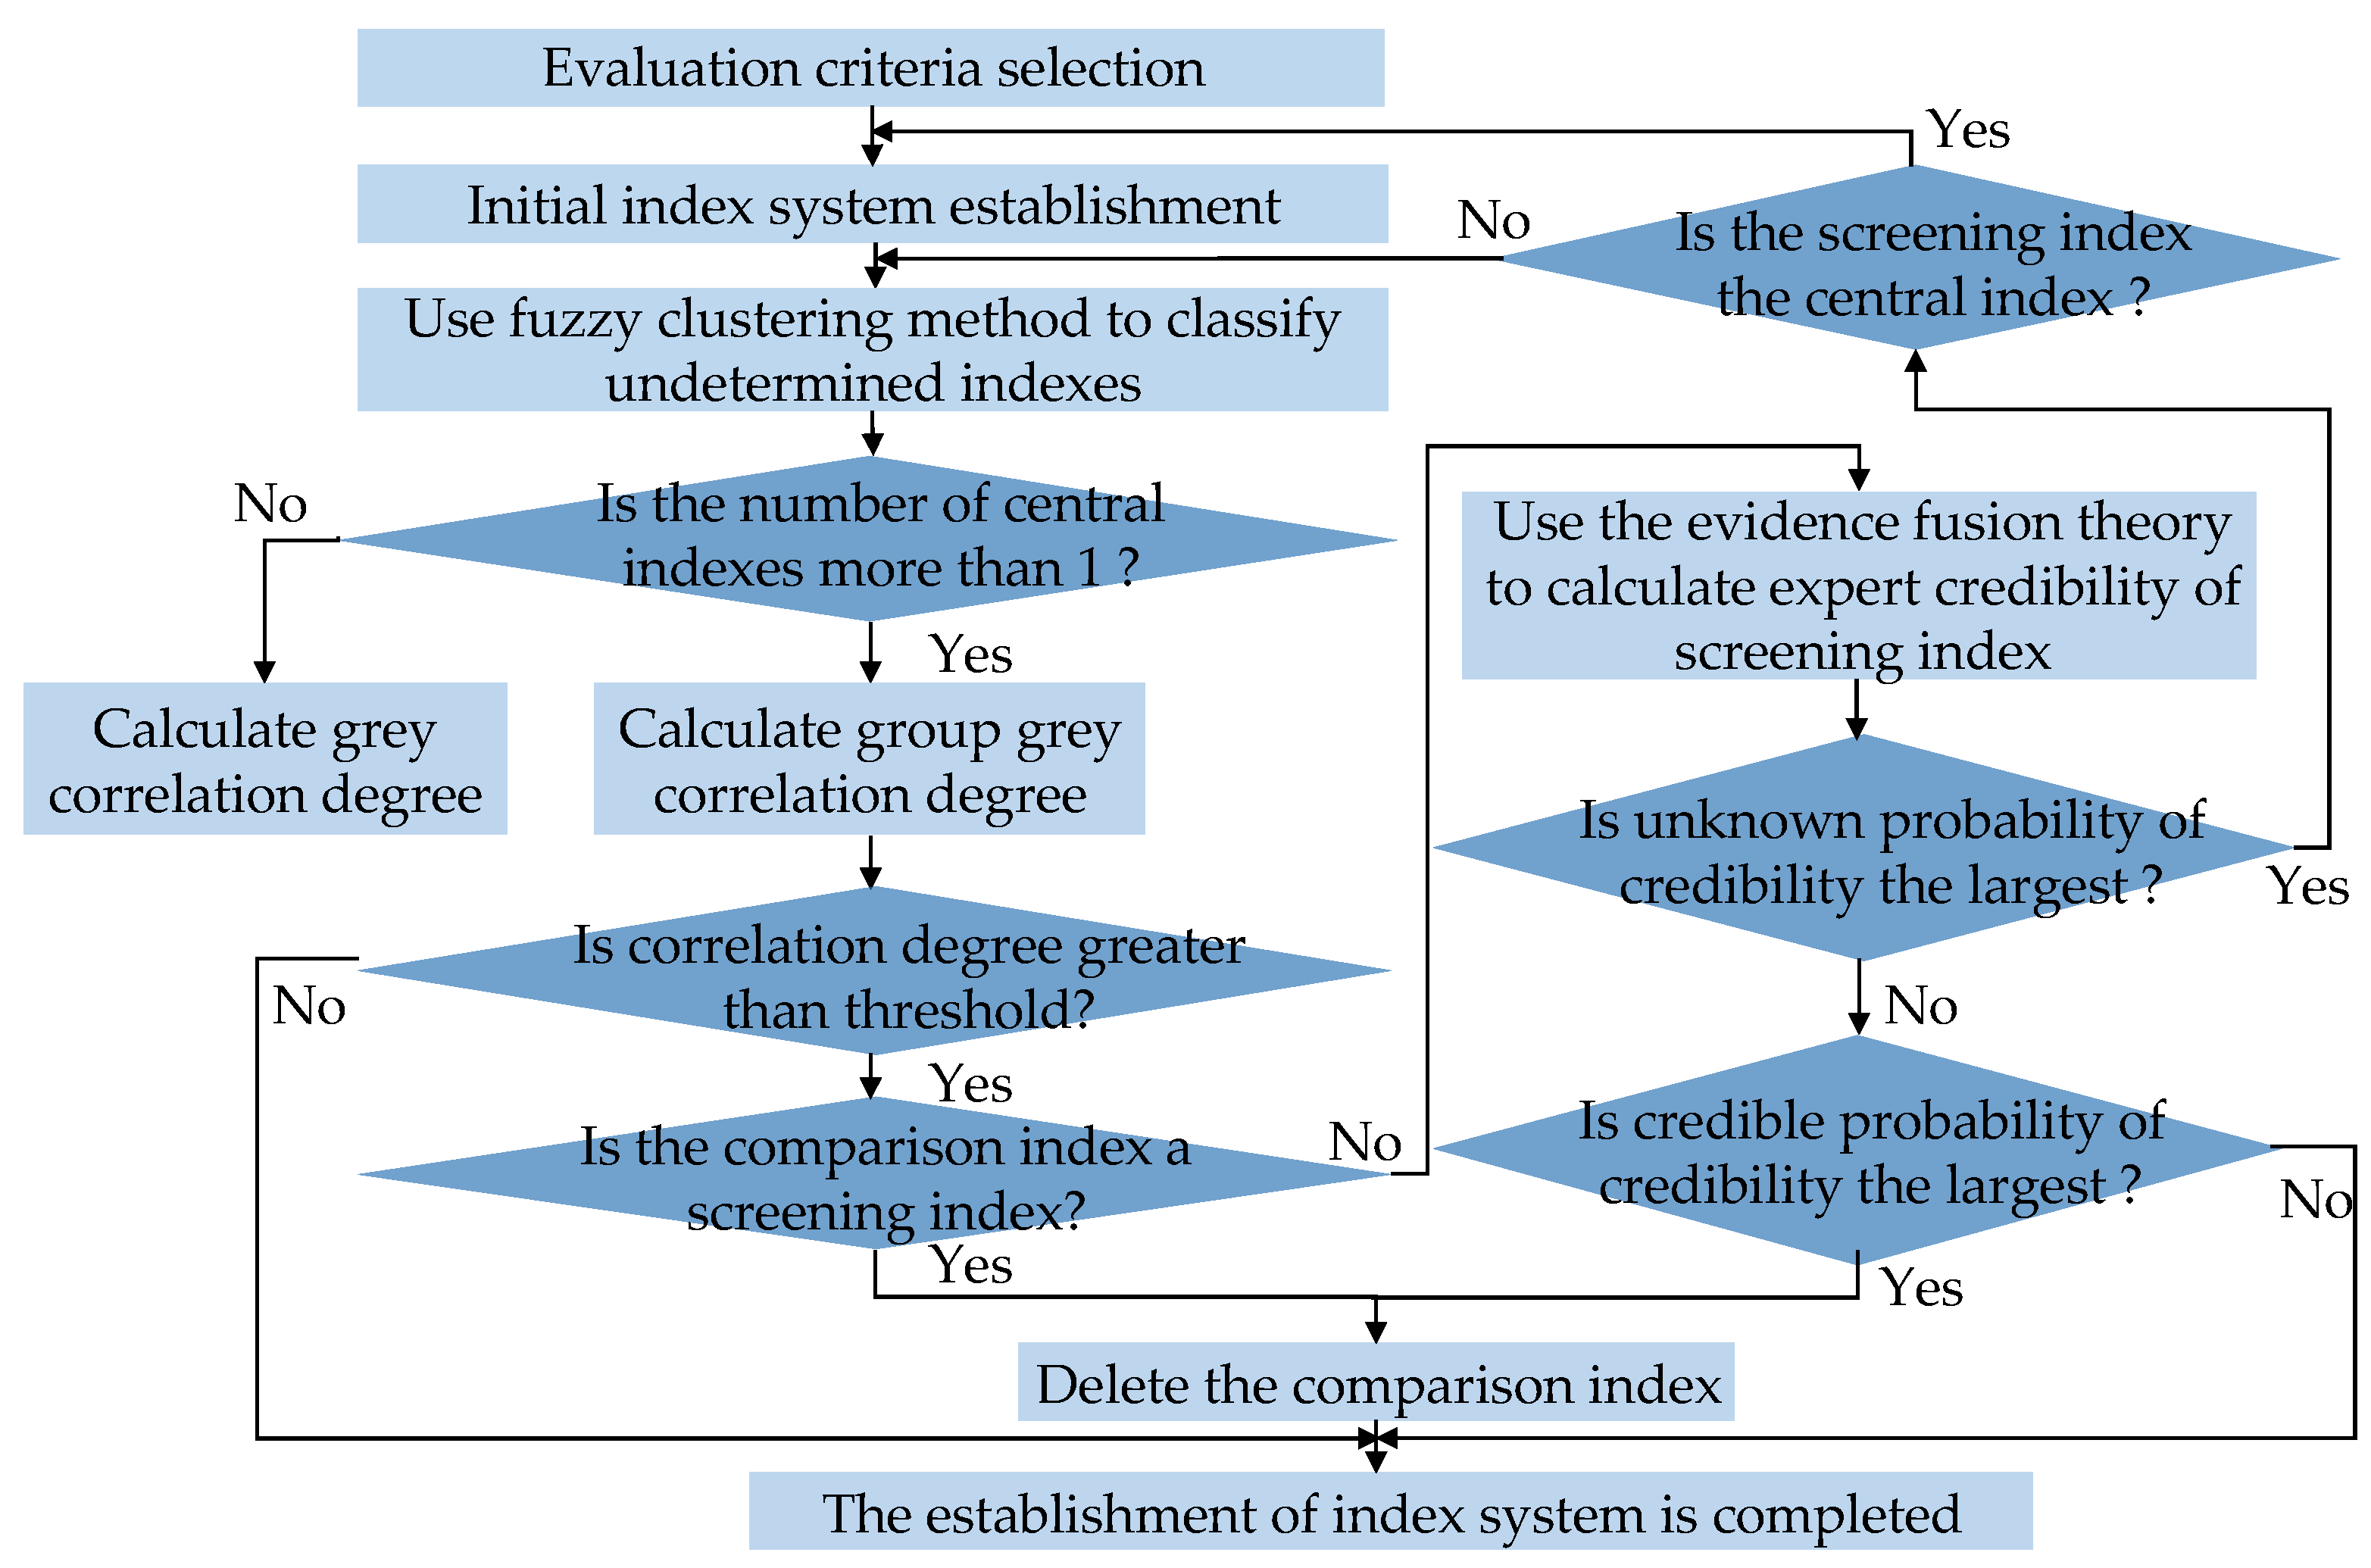
- The present paper proposes a method for establishing an evaluation index system of earthquake rescue robots. Firstly, experts construct the initial subjective evaluation index system and define the determined, undetermined, and central indexes. Subsequently, the fuzzy clustering method is employed to classify the undetermined indexes. Then, the group grey correlation degree method is utilized to determine which indexes should be screened, while employing evidence theory to fuse expert credibility regarding these screened indexes. Finally, closed-loop adjustments are made to eliminate redundancy in the screened indexes based on the results of credibility fusion.
- (3)
- The present paper proposes an evaluation method for earthquake rescue robots. Firstly, the DEMATEL model is used to analyze the correlation and causality between the indexes in the established system. Based on this analysis, an input–output evaluation index system is established. Subsequently, the performance criteria in this index system are analyzed, followed by a comparative assessment of different types of such robots using a super efficiency DEA model. According to the results of this research, rescuers can accurately select the earthquake rescue robot with the best overall performance to improve the rescue effect. Considering the wide variety of robots with different performance characteristics, this research provides guidance for practical application.
2. Evaluation Criteria Selection and Initial Index System Establishment
2.1. Survival Ability
2.2. Motion Ability
2.3. Detection Perception Ability
2.4. Communication Control Ability
2.5. Initial Index System Establishment
3. Performance Testing
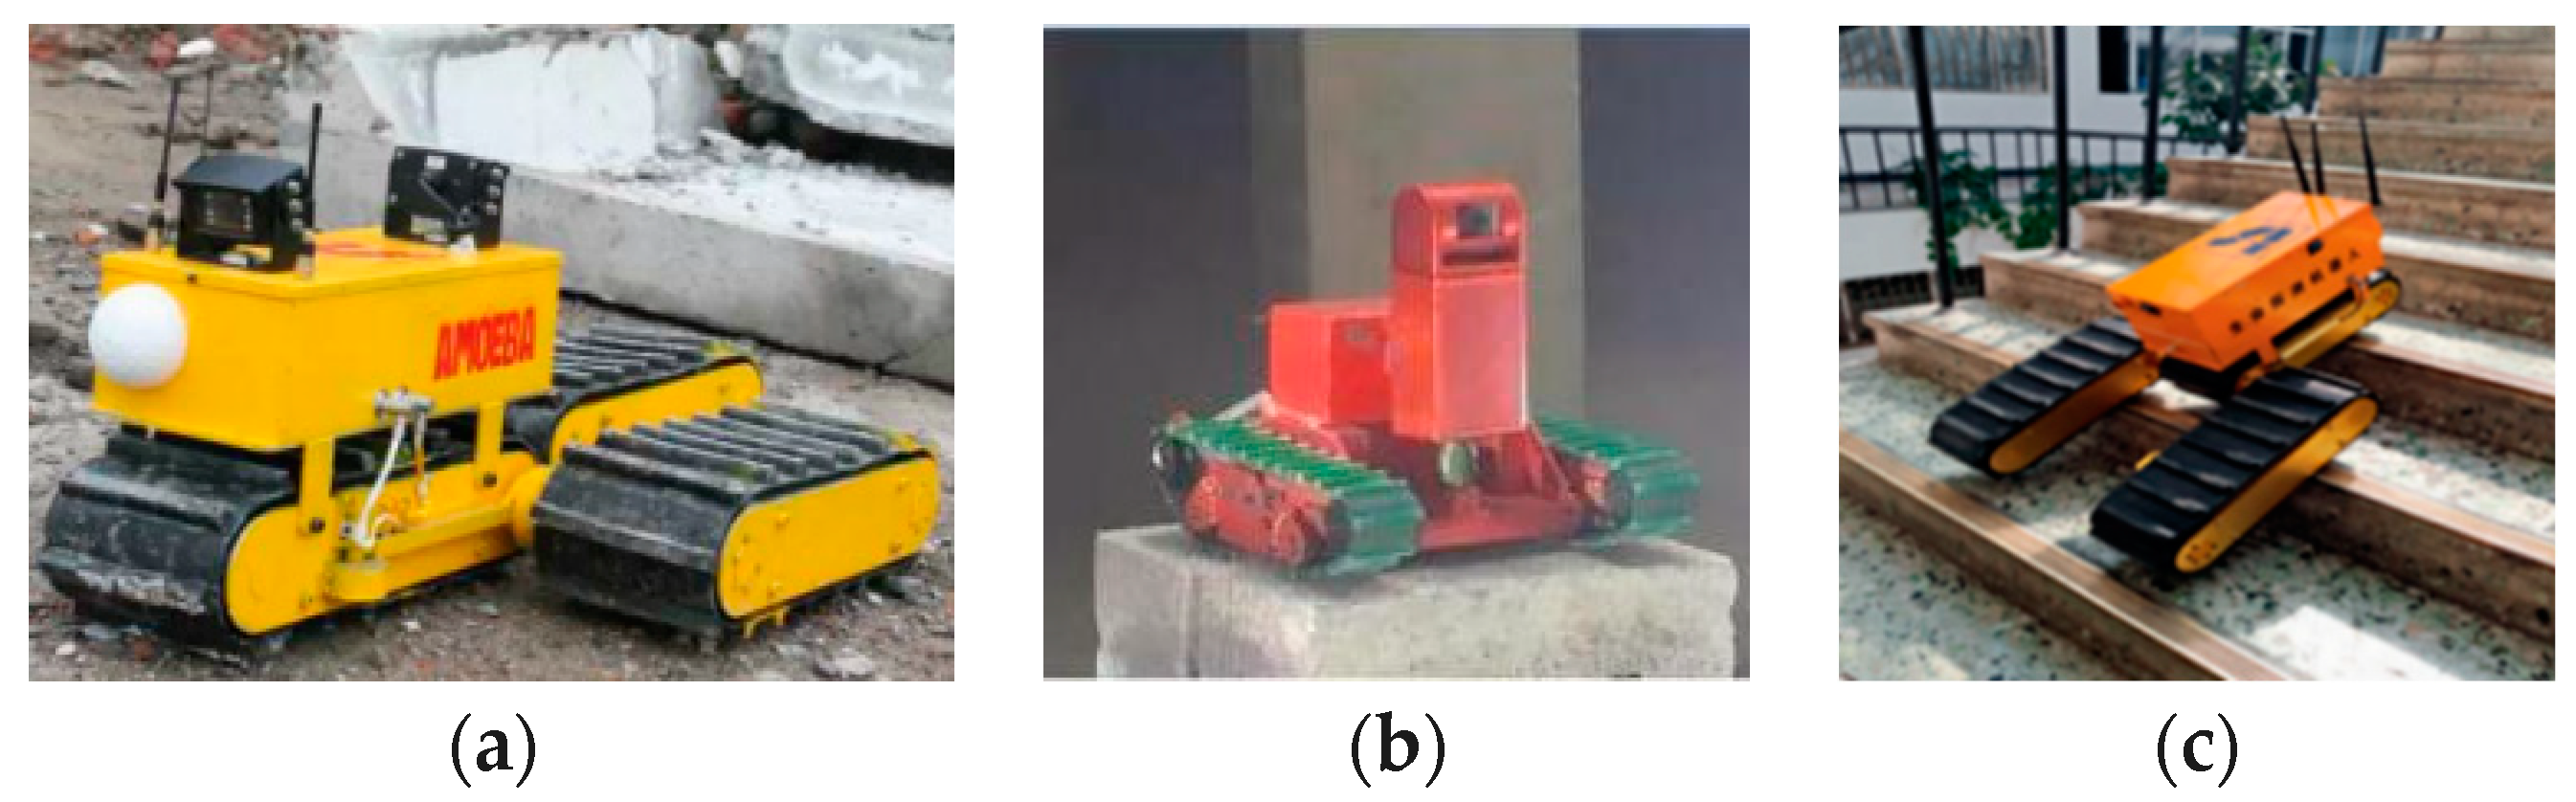
- Sample A: This is a deformable robot for searching ruins with the mass of 20 kg and the volume of 520 mm 420 mm 250 mm. The robot is designed for exploring ruins and features three independently driven tracks. The position of these tracks can be adjusted to suit various rescue environments and tasks, allowing the robot to transform into linear, triangular, or side-by-side configurations. Meanwhile, the robot can penetrate into the ruins and utilize its own infrared camera and sound sensor to transmit real-time image and voice information from inside the ruins back to the console, enabling rescuers to promptly identify survivors’ locations and assess their surrounding environment.
- Sample B: This is a wheel-track composite exploration robot with the mass of 15 kg and the volume of 360 mm 320 mm 280 mm. According to the terrain characteristics in rescue environments, the robot’s track geometry can be adjusted to enable it to switch between wheeled and tracked motion modes. Meanwhile, the robot is capable of entering hazardous situations and conducting survivor search and environmental detection tasks using its own camera, temperature and humidity sensor, as well as toxic and harmful gas sampling device. Additionally, the cloud platform can be deployed vertically alongside the robot into elevator shafts and caves to enhance rescuer’ visibility range.
- Sample C: This is a intelligent life detection robot with the mass of 25 kg and the volume of 520 mm 420 mm 250 mm. The mobile mechanism adopts a modular chain structure to ensure its capability to navigate complex terrains. Depending on different rescue environments and tasks, the robot can transform into three distinct configurations: triangular, D-shaped, and side-by-side. Meanwhile, the robot integrates life detection technology with life detection radar, video, and audio information. Additionally, it is capable of penetrating non-metallic materials to effectively detect the vital signs of survivors using this life-detection technology.
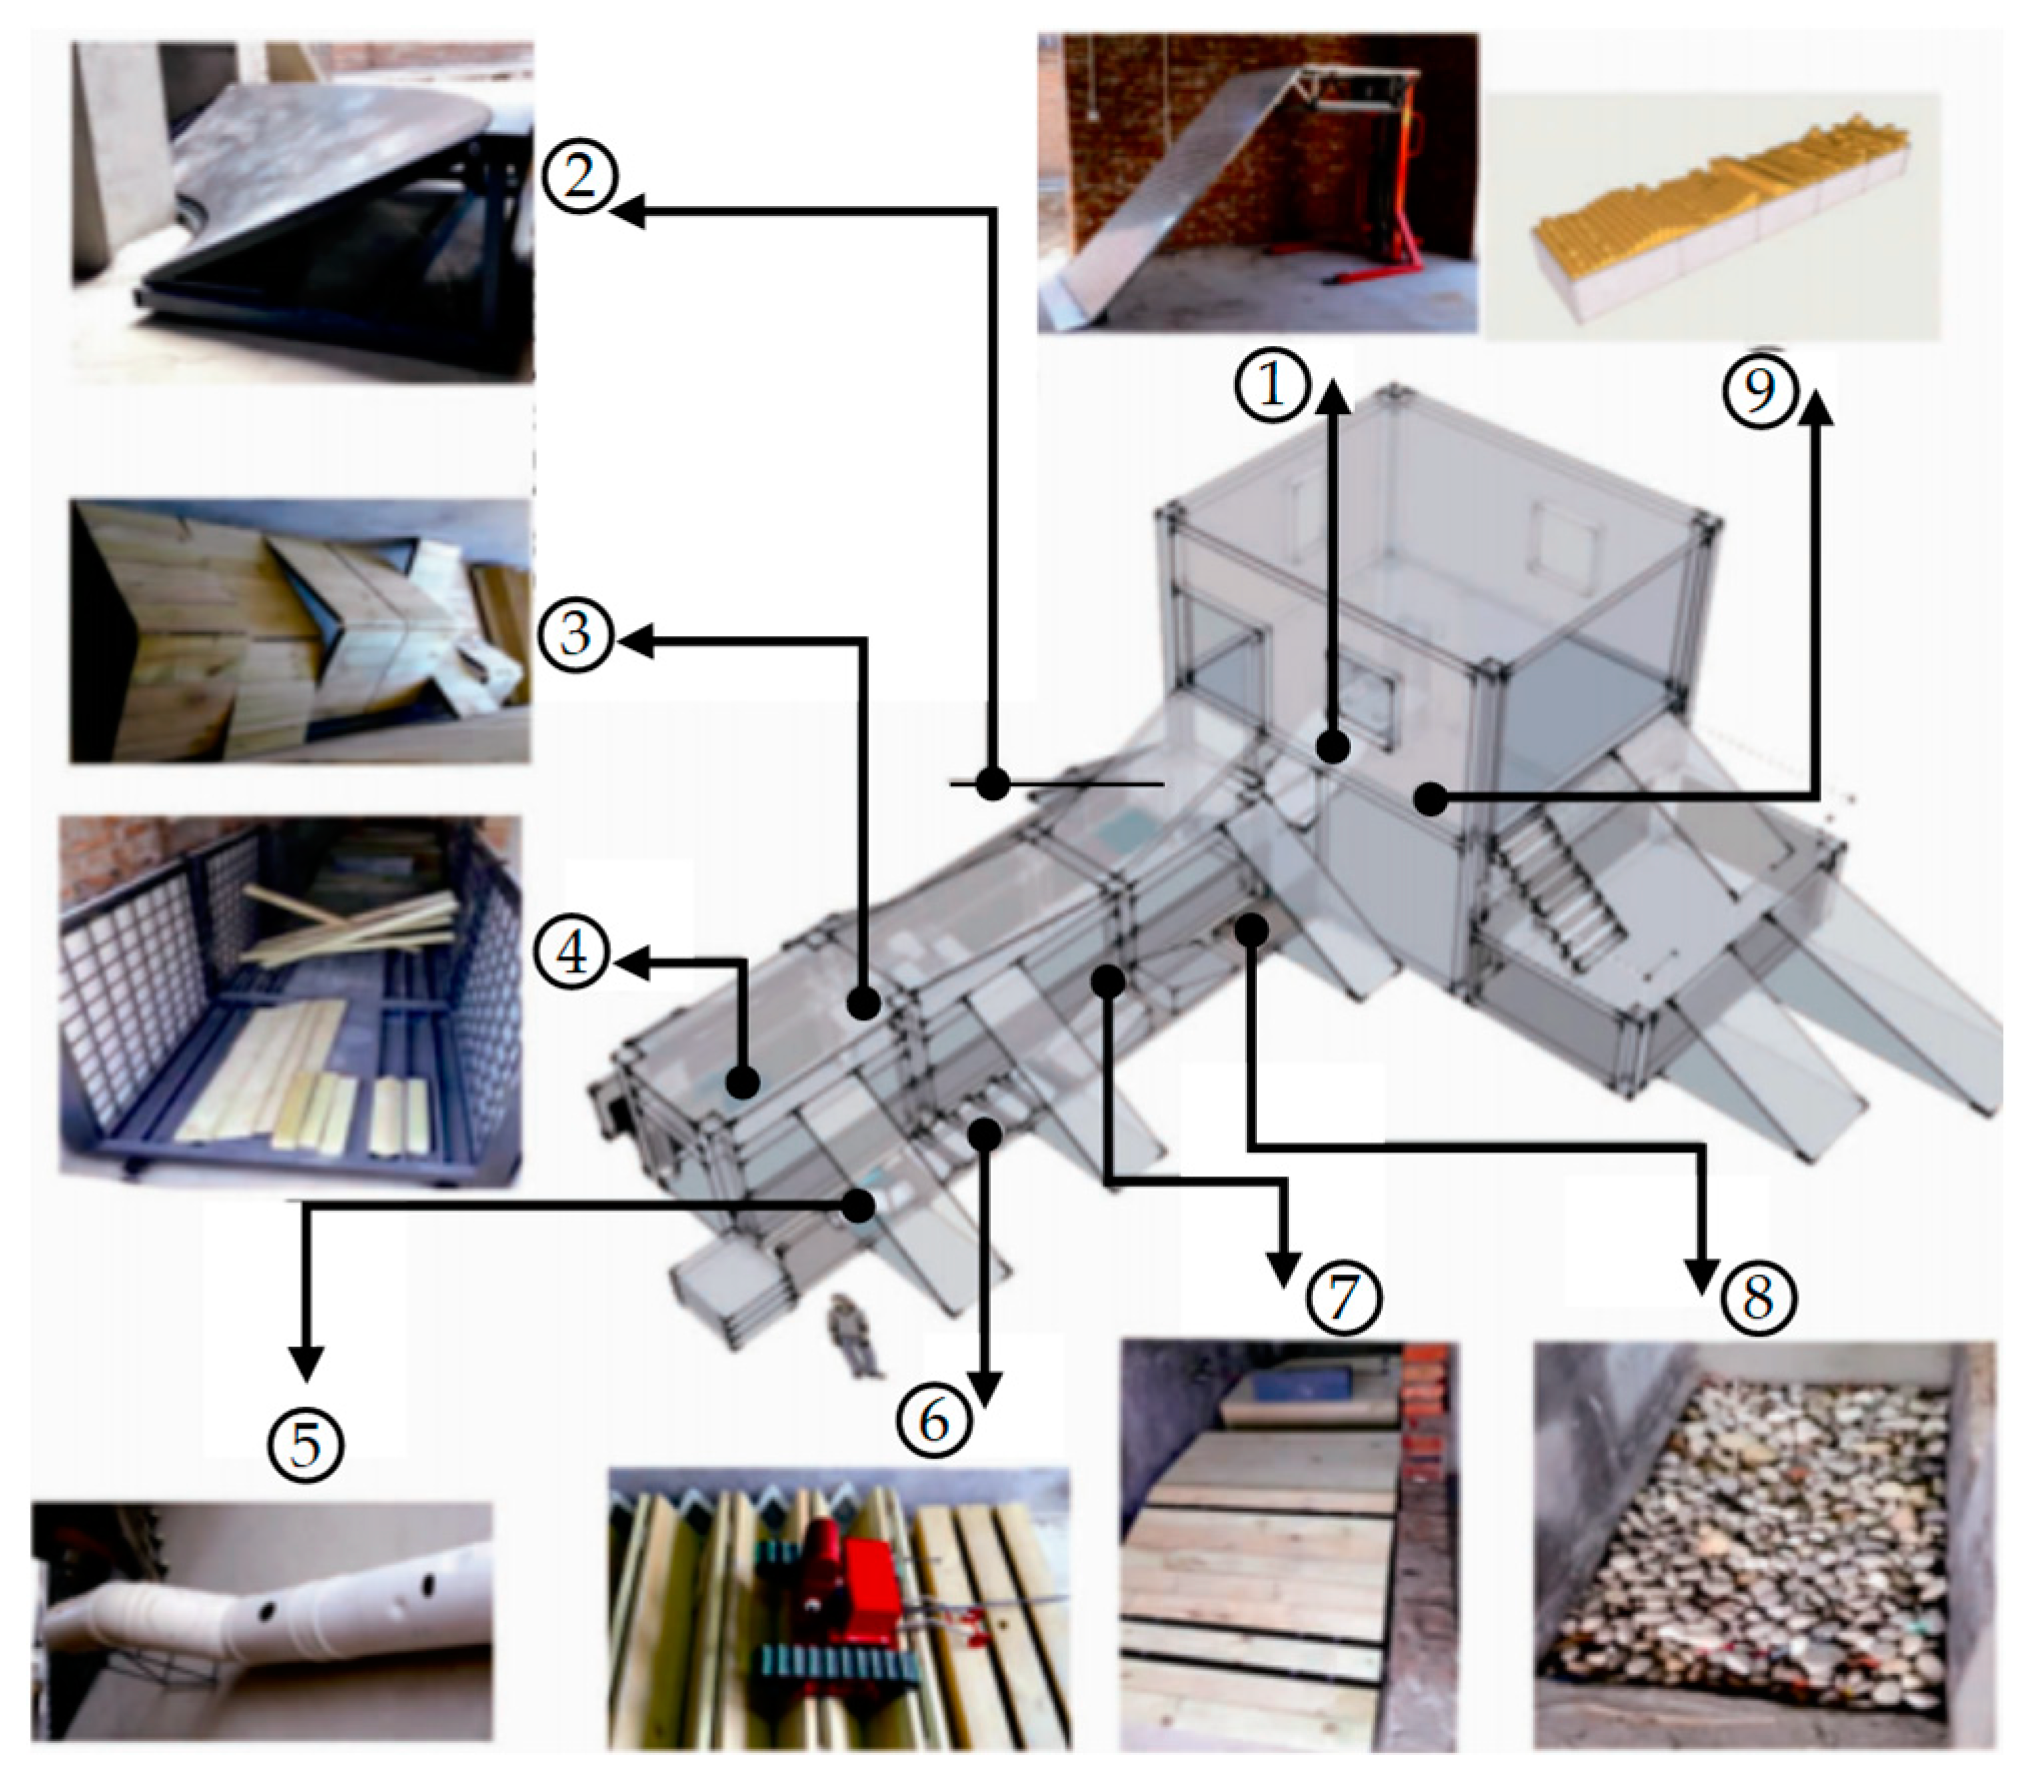
- The dynamic slope test module is a linkage mechanism consisting of a hydraulic lifting platform and a slope device, featuring an adjustable continuous slope ranging from 15° to 60°. Additionally, the module allows for variation in the slope material to assess the climbing ability under different friction conditions.
- The adjustable cross-cone turning module is designed with a 90° turning angle, allowing for adjustable cone slope and automatic twisting of the guide frame on both sides to adapt to the cone. The flexibility of turning and lateral balance ability at different speeds can be tested.
- The adjustable ridge side slope module consists of multiple plates joined together by twisted plates. The slope can be adjusted, and the complexity of the side slope can be modified by altering the direction in which the plates are joined, allowing for testing of both passing ability and balance capability.
- The complex pavement interspersed construction module consists of a grid and multiple wooden piles. By adjusting the interspersed positions of wooden piles, it is possible to simulate intricate terrains and assess flexibility and passing capacity.
- The test module of the pipeline consists of torsional splicing techniques. By rotating the entire pipeline, it simulates complex pipelines and tests their ability to pass through narrow spaces by adjusting the vertical position.
- The adjustable wave pavement module is constructed by combining multiple plate strands to form a collapsible fan shape. The handle allows for modification of the wave spacing, while one end of the simulated staircase can be elevated to assess the performance on uneven road surfaces and steps.
- The adjustable slope-crossing module consists of two sets of independent slopes connected face to face, and the spacing can be adjusted according to the need to test the ability to cross the gully.
- The test module consists of multiple depressions that can be filled with various materials (such as sand, stone columns) to simulate different road conditions.
- The re-configurable terrain test module consists of a vertical arrangement of hundreds of wooden cubes, forming a rectangular square matrix. Each individual cube is equipped with an independent lifting and locking device, enabling adjustable height settings. This design allows for the simulation of various complex terrain structures and facilitates testing of irregular pavement traversal capabilities.
- Testing the values of continuous walking distance with independent power supply. The robot walks in the constructed ruins environment. Whether the robot can pass through the gravel road, wave road, slope road, and climb over the obstacle in the ruins environment is visually observed. The walking distance can be measured by using a measuring ruler with the CMC. Manual intervention is not allowed during the testing process. The recorded distance can be taken as the continuous walking distance with independent power supply.
- Testing the values of continuous working time with independent power supply. When the battery is fully charged, turn on the power switch and operate the robot at low speed (one third of its the maximum speed of wheeled motion) until the robot automatically shuts down due to low power. When the robot starts moving, the stopwatch starts, and when the robot stops moving, the stopwatch stops. The recorded time can be taken as the value of continuous working time with independent power supply.
- Testing the success rate of continuous start, working, stop. The robot is initiated on a level concrete surface and subsequently maneuvered in various directions, including forward, backward, left, right, and rotational movements at different velocities. Eventually, the robot comes to a halt. This is measured ten times, and the probability of success is calculated as the success rate of continuous start, working, stop.
- Testing the values of continuous working time. When there is no external power supply and the battery is fully charged, the robot continues to perform tasks in the constructed ruins environment. When the robot enters the working state, start timing with a stopwatch, and when the control unit or terminal stops working, stop timing. The robot is not allowed to supplement energy during the testing process. The recorded time can be taken as the continuous working time.
- Testing the values of mass–volume ratio. When weighing the robot, remove any accessories and place it horizontally on a platform scale with a weight exceeding 50% of its nominal weight. For measuring volume, determine the maximum dimensions of length, width, and height during movement, considering the outer edge of the wheel as the boundary. Both mass and volume are measured three times to obtain average values. The ratio of mass to maximum volume can be taken as the mass–volume ratio.
- Testing the values of subversive resistance on complex road surface. The complex bumpy rubble road surface with a length of 50 m is set up. Two acceleration sensor are installed on the body device, one in the left–right direction and the other in the front–rear direction. The robot travels at a uniform speed at 50% of its maximum wheel motion speed. After movement, the acceleration curves in the left–right direction and front–rear direction are output, and the average values of each peak of curves in the two directions, which are represented as and , are calculated. The value of can be taken as the subversive resistance on complex road surface.
- Testing the values of maximum speed of wheel motion. On a flat cement ground, the robot walks in a straight line at maximum wheel speed. Begin measurement after the robot walks for 2 m, the time and distance of movement are recorded, and the speed value can be calculated. This is measured three times, and the average speed value is taken as the maximum speed of wheel motion.
- Testing the values of success rate of mechanism transformation. The robot walks in the constructed ruins environment, the robot continuously passes through the gravel road, wave road, slope road, and climb over the obstacle, and then the different types of the robot are transformed. If the motion type transformation can be achieved, it is considered successful; otherwise, it is considered unsuccessful. This is measured five times, and the probability of successful transformation is calculated as the success rate of mechanism transformation.
- Testing the values of success rate through narrow space. The robot enters the interior of the ruins stably and safely from the entrance in the constructed ruins environment. Whether This is measured ten times, and the probability of successful passing is calculated as the success rate through narrow space.
- Testing the values of minimum turning radius. The minimum turning radius is an index used to measure the ability of the robot to turn in narrow space. The robot is placed on a horizontal cement ground, and the robot rotates 360° in both the left and right directions. The distance between the center of the circular trajectory of a robot during rotational motion and the center of mass of the robot is measured. This is measured three times in both the left and right directions, and the average distance value is taken as the minimum turning radius.
- Testing the values of unit pressure exerted by the tracked device on the ground. The unit pressure of the tracked walking device on the ground can be expressed as , where Fa is the weight of the robot, L is the length of the track in contact with the ground, and b is the width of the track. When the robot moves on the soft ground, the lower the unit pressure on the ground, the smaller the amount of ground subsidence, and the easier it is for the robot to pass through.
- Testing the values of maximum width across trenches. Taking 15 cm as the starting value, the trenches’ width is measured three times. If at least one of the three times passes, the trenches’ width is increased by 2 cm. If none of the three times passes, the trenches’ width is reduced by 2 cm. Then, the measurement is continued for three times, and the maximum value is recorded until the trenches’ width cannot be further increased or the trenches’ width does not need to be further reduced. The maximum value is recorded as the maximum width across trenches.
- Testing the values of maximum height of obstacles to be overcome. Taking 10 cm as the starting value, the obstacle height is measured three times when the obstacle width is 5 cm. If at least one measurement passes, the height is increased by 2 cm; otherwise, it is reduced by 2 cm. The measurements are then repeated three more times, and the maximum value is recorded until the height cannot be further increased or reduced. The maximum value is recorded as the maximum height of obstacles to be overcome.
- Testing the values of maximum angle for climbing. Taking 30° as the starting value, the angle is measured three times when the slope length is 5 m. If at least one of the three times passes, the angle is increased by 5°. If none of the three times passes, the angle is reduced by 5°. Then, the measurement is continued for three times, and the maximum value is recorded until the angle cannot be further increased or the angle does not need to be further reduced. The maximum value is recorded as the maximum angle for climbing.
- Testing the values of number of steps climbed per unit time. A continuous step with 70% of the maximum obstacle crossing height and 70% of the maximum climbing angle is selected, and the number of steps climbed by the robot per unit time (30 s) is recorded as the number of steps climbed per unit time.
- Testing the values of success rate of path planning. The robot continues to perform tasks in the constructed ruins environment. Whether the robot can effectively plan its path and search a designated ruins space completely can be inspected, and whether the walking trajectory is reasonable can be inspected. This is measured ten times, and the probability of successful inspection results is calculated as the success rate of path planning.
- Testing the values of probability of live body identification. The living organisms are placed at 70% of the maximum effective search radius and 70% of the maximum effective search depth. This is measured five times, and the probability of successful perception is calculated as the probability of live body identification.
- Testing the values of maximum radius for effective search. Taking 10 m as the starting value, the search radius is measured three times. If at least one of the three times passes, the search radius is increased by 1 m. If none of the three times passes, the search radius is reduced by 1 m. Then, the measurement is continued for three times, and the maximum value is recorded until the search radius cannot be further increased or the search radius does not need to be further reduced. The maximum value is recorded as the maximum radius for effective search.
- Testing the values of maximum depth for effective search. Taking 5 m as the starting value, the search depth is measured three times. If at least one of the three times passes, the search depth is increased by 1 m. If none of the three times passes, the search depth is reduced by 1 m. Then, the measurement is continued for three times, and the maximum value is recorded until the search depth cannot be further increased or the search depth does not need to be further reduced. The maximum value is recorded as the maximum depth for effective search.
- Testing the values of time required for establishing communication. The time it takes for the control unit to establish successful communication with the robot. This is measured ten times, and average value is taken as the time required for establishing communication.
- Testing the values of success rate of the operating interface. The robot continues to perform tasks in the constructed ruins environment. Whether the interface is clear, easy to operate, and aesthetically pleasing in design is visually inspected. This is measured ten times, and the probability of successful inspection results is calculated as the success rate of the operating interface.
- Testing the values of accuracy of data transmission. The robot continues to perform tasks in the constructed ruins environment. The robot is manipulated at 70% of maximum wireless control distance. This is measured ten times, and the probability of effective data transmission is calculated as the accuracy of data transmission.
- Testing the values of maximum distance for wireless control. Taking 10 m as the starting value, the wireless control distance is measured three times. If at least one of the three times passes, the wireless control distance is increased by 1 m. If none of the three times passes, the wireless control distance is reduced by 1 m. Then, the measurement is continued for three times, and the maximum value is recorded until the wireless control distance cannot be further increased or the wireless control distance does not need to be further reduced. The maximum value is recorded as the maximum distance for wireless control.
- Testing the values of smoothness of walking on complex road surfaces. A complex bumpy rubble road surface with a length of 50 m is set up. An acceleration sensor is installed on the robot body device in the vertical direction. The robot travels at a uniform speed at 50% of its maximum wheel motion speed. After the movement, the acceleration curves in the vertical direction is output, and the average value of peak of curve which is represented as is calculated. The value of can be taken as the smoothness of walking on complex road surfaces.
- Testing the values of motion speed under standard load. If the technical specification provides a standard load value, it shall be adhered to accordingly; in the absence of such provision, 80% of maximum load will serve as the standard. On a level cement surface, the robot will travel at maximum speed with standard load while moving in a straight line. Timing begins when the robot has walked 2 m, and distance traveled within one minute is recorded. Three tests are conducted, and the average speed can be calculated as the motion speed under standard load.
4. Establishment Method of Index System
4.1. Using Fuzzy Clustering Method to Classify the Undetermined Indexes
- Determine the number of fuzzy clusters, the cluster center, and classified index. The fuzzy cluster number corresponds to the number of the first-grade indexes in Table 1, while the cluster center represents the central index, and the classified index denotes the undetermined index. X is an dimensional matrix comprising the original data of classified indexes, where refers to an element within X. Here, m signifies the number of classified indexes and n indicates the number of features associated with these indexes. Y is a dimensional matrix composed of original data from central indexes, where represents an element within Y. In this case, b stands for the number of central indexes and n also denotes their feature number.
- Standardize the indexes’ data in matrix X and matrix Y.where is the data of after standardization; ; ; is the data of after standardization; ; .
- Calculate the fuzzy similarity matrix r. is the element in r, and the absolute value subtraction method is used to calculate the similarity between the classified index j and the central index i.where c is the coefficient, and c = 0.1 in this paper.
- Classify the classified indexes. According to the fuzzy similarity matrix calculated by Equation (3), the central index with the highest fuzzy similarity to the classified index can be identified. Consequently, the classified index (undetermined index) can be assigned to the first-grate index that encompasses the central index.
4.2. Using Group Grey Correlation Method to Determine Screening Indexes
- Construct reference index group. The central index in each first-grate index are formed into a reference index group in this paper. The central index reference matrix is Y. is the reference vector of the central index . The comparison indexes are the remaining indexes that do not include the central indexes in each first-grate index. The reference matrix of the comparison indexes is as follows:where is the reference vector of the comparison index and N is the number of comparison indexes in the first-grate index, and the feature number of the comparison index is also n.
- Calculate the correlation coefficient and correlation degree. The correlation coefficient of and at the k-th feature is as follows:The correlation degree between comparison index j and central index i is as follows:
- Calculate the group grey correlation degree.where is group grey correlation degree between the j-th index and all the central indexes in the corresponding first-grate index, p is the coefficient, and p = 2.
- Determine the screening indexes based on the group grey correlation degree. The principle of determining the screening indexes is: if , is the group grey correlation threshold, then the j-th index is the screening indexes; otherwise it is not. Assuming that the threshold of the general grey relational degree is , the threshold value of the group grey relational degree can be obtained according to Equation (7), as follows:
4.3. Using Evidence Theory to Fuse Expert Credibility to Process Screening Indexes
- Establish experts’ trust distribution table for a certain screening index. The trust distribution of two experts is shown in Table 7. and are basic probability assignment functions of two experts.
- Calculate the distance between and .where N is the number of experts, M is the number of possible cases, and M = 3 in this paper. is any subset in an identification framework consisting of M pairwise different propositions.
- Calculate the credibility of experts.The similarity between and is as follows:The support of evidence is as follows:The credibility of the experts is as follows:
- The combination rule of credibility of the experts.
- When the credible probability is highest, indicating that experts consider the event to be credible, delete the corresponding screening index.
- When the incredibility probability is highest, indicating that experts consider the event to be incredible, retain and do not delete the corresponding screening index.
- When the unknown probability is highest, closed-loop adjustment is required.
4.4. The Closed-Loop Adjustment of Index System
5. Construction of a Evaluation Method Based on DEMATEL Super Efficiency DEA
5.1. The DEMATEL Model
- Establish a direct influence matrix. The expert group consists of L experts, denoted as . Each expert independently constructs a semantic direct influence matrix based on the direction and magnitude of mutual influence between criteria. The total direct influence matrix is obtained by aggregating the weights assigned by each expert.where represents the assessment value of expert k on the direct influence of index i on index j, n denotes the total number of indexes, and signifies the weight assigned to expert k, .
- Calculate the normalized direct influence matrix. Firstly, the elements in the total direct influence matrix are defuzzified based on Equation (16), yielding the defuzzified direct influence matrix E. Subsequently, E is standardized using Equations (20) and (21), resulting in the standard direct influence matrix X.
- Calculate the comprehensive influence matrix T as follows:where I represents the n-order identity matrix.
- Calculate the influence and influenced degree. The calculation of the influence degree P and the influenced degree Q of index i can be expressed as shown in Equations (24) and (25), respectively.
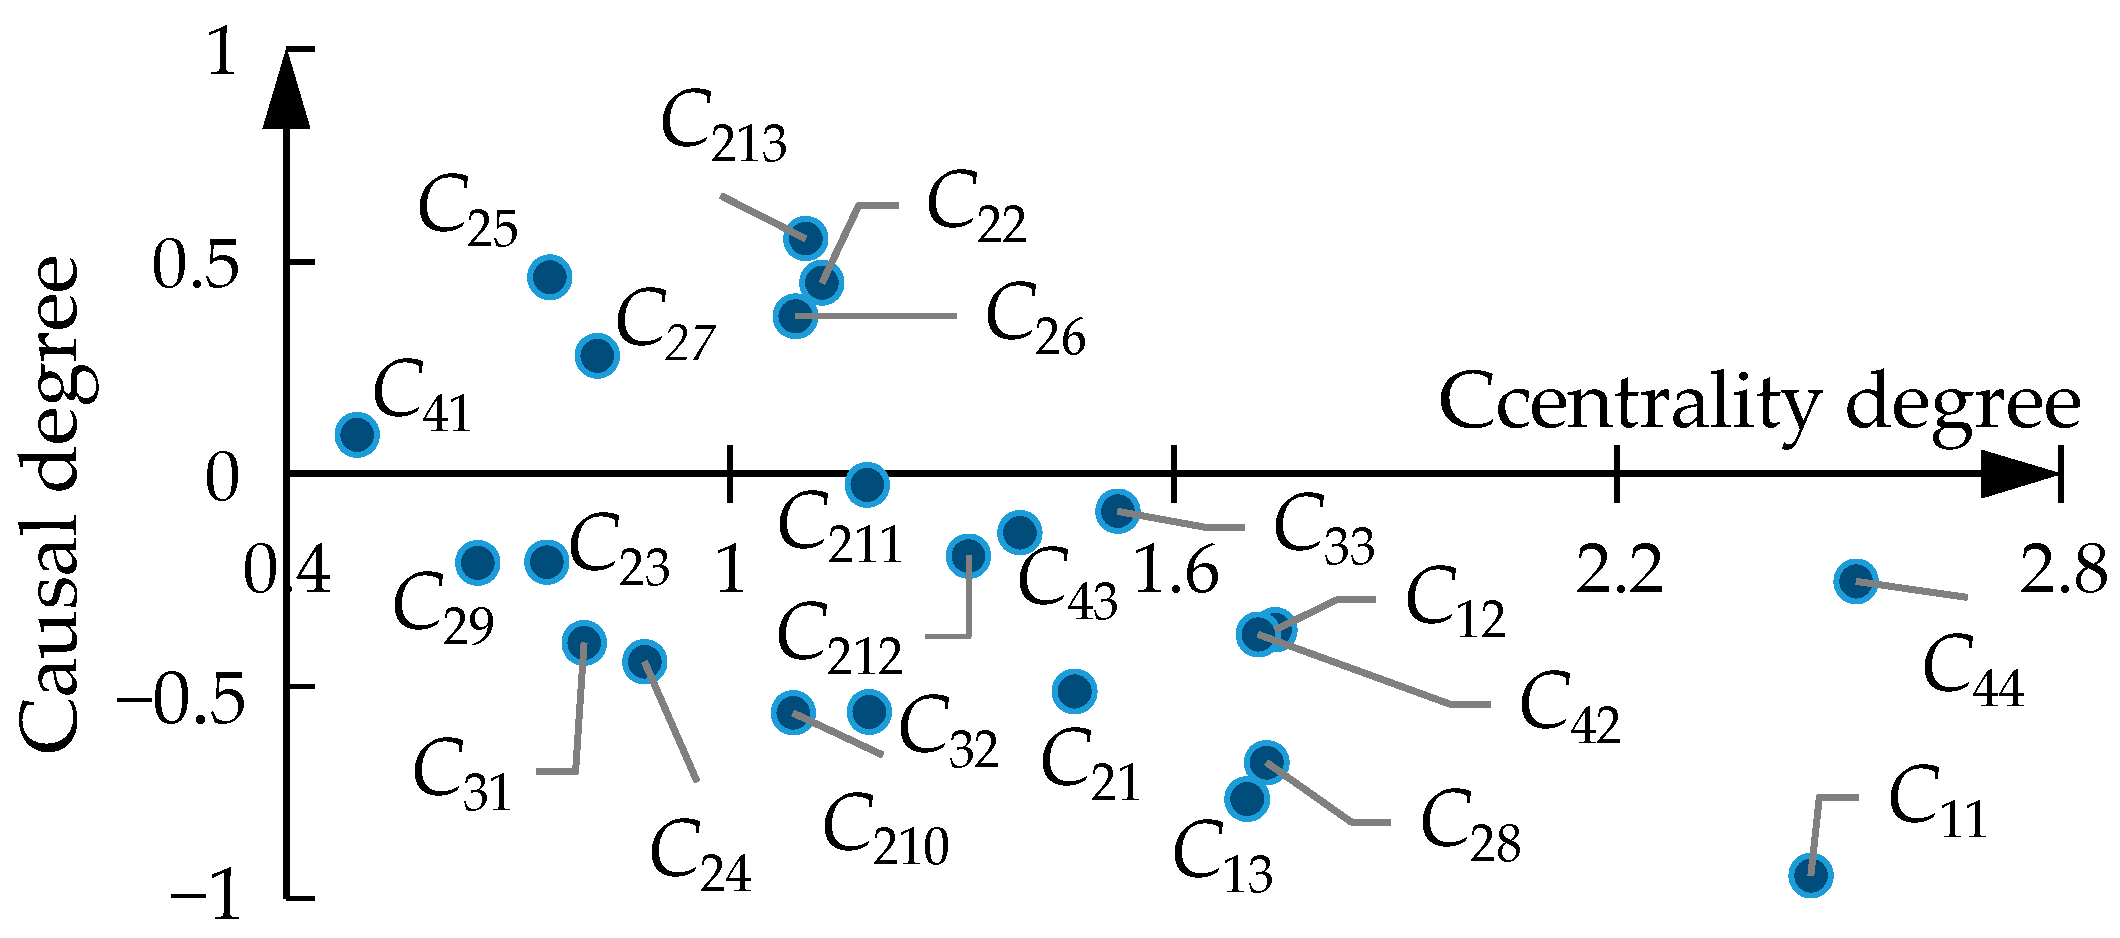
- Calculate the centrality and causal degree. The calculation of centrality and causal degree of index i are expressed as shown in Equations (26) and (27), respectively.
5.2. The Super Efficiency DEA Model
- When , , and , DMUo is considered to be DEA efficient, indicating that the system has achieved optimal output Yo given input Xo.
- When , , and , DMUo is considered to be weakly DEA efficient.
- When , DMUo is considered to be DEA invalid.
6. Practical Application
6.1. Establishment of Index System for Earthquake Rescue Robot
6.2. Comprehensive Performance Evaluation for Earthquake Rescue Robot
7. Comparison of Different Evaluation Methods
8. Discussion
- After obtaining the fuzzy similarity of undetermined indexes in Table 8 and Table 9, the classification of undetermined indexes is realized. While completing the correction of the subjective index system, the fuzzy similarity between the central indexes in Table 8 and Table 9 is small, and the rationality of the subjective classification of experts can be verified.
- The screening indexes can be determined by the group grey correlation degree of each index in Table 10, and the clarity of the index stratification can be proved by the correlation degree between the other indexes and the central index.
- The motion speed under the standard load is redefined as an undetermined index in the closed-loop adjustment, the correctness of the initial judgment of the expert is proved again.
9. Conclusions
- (1)
- The evaluation criteria for the indexes of rescue robots are identified, resulting in the establishment of a comprehensive and hierarchical structure. This structure considers four aspects, namely survival ability, motion ability, detection perception ability, as well as communication control ability. The structure serves as a foundation for establishing the initial index system of the earthquake rescue robot.
- (2)
- A index system establishment method for earthquake rescue robots is proposed. Based on the concept of hierarchical classification, this study incorporates the fuzzy clustering method, group grey correlation method, and evidence fusion theory into the process of establishing an index system for earthquake rescue robots. The proposed approach effectively addresses issues related to subjectivity, redundancy, and unclear stratification in the indexes. Moreover, it enables intelligent and practical modification of indexes by earthquake rescue robots while constantly updating the index system to better meet actual rescue application requirements. Additionally, this established index system serves as a valuable reference for comprehensive performance evaluation of earthquake rescue robots.
- (3)
- Based on the established index system, this paper proposes a comprehensive evaluation method based on DEMATEL super efficiency DEA. This method eliminates the need for weight assignment calculation, thereby enhancing stability and objectivity compared to traditional weight calculation methods. Furthermore, by analyzing the rates of redundant inputs and insufficient outputs, different earthquake rescue robot schemes can be assessed, providing theoretical foundations and data support for optimizing and improving suboptimal earthquake rescue robot designs.
10. Recommendations and Future Work
- (1)
- The performance indexes presented in this paper are exclusively represented by precise numerical values. Further research is needed to incorporate qualitative variables or interval numbers for a comprehensive description of the language, and fuzzy theory can be used to make the comparability between different types of indexes.
- (2)
- Further research is needed to comprehensively update the index system by considering the removal or addition of performance indexes (such as safety performance, economic performance, etc.) within the first-grate indexes.
- (3)
- In order to enhance the credibility of our findings, we plan to conduct additional investigations and empirical studies for future research. Furthermore, incorporating alternative outranking MCDM techniques would be advantageous in broadening the scope of this issue.
Author Contributions
Funding
Data Availability Statement
Acknowledgments
Conflicts of Interest
References
- Zaremohzzabieh, Z.; Samah, A.A.; Roslan, S.; Shaffril, H.A.M.; D’Silva, J.L.; Kamarudin, S.; Ahrari, S. Household preparedness for future earthquake disaster risk using an extended theory of planned behavior. Int. J. Disaster Risk Reduct. 2021, 65, 102533. [Google Scholar] [CrossRef]
- Li, Y.; Li, M.; Zhu, H.; Hu, E.; Tang, C.; Li, P.; You, S. Development and applications of rescue robots for explosion accidents in coal mines. J. Field Robot. 2020, 37, 466–489. [Google Scholar] [CrossRef]
- Zhang, D.; Shiguematsu, Y.M.; Lin, J.Y.; Ma, Y.H.; Al Maamari, M.S.; Takanishi, A. Development of a hybrid locomotion robot for earthquake search and rescue in partially collapsed building. In Proceedings of the 2019 IEEE International Conference on Mechatronics and Automation (ICMA), Tianjin, China, 4–7 August 2019; pp. 2559–2564. [Google Scholar]
- Li, L.; Zhao, J.; Hu, W. Quadruped robot's efficiency comprehensive evaluation based on modified projection pursuit. In Proceedings of the IEEE International Conference on Robotics and Biomimetics (ROBIO), Macau, Macao, 5–8 December 2017; pp. 2433–2438. [Google Scholar]
- Baek, J.H.; Choi, J.H.; Kim, S.M.; Park, H.J.; Kuc, T.Y. A Mobile Robot Framework in Industrial Disaster for Human Rescue. In Proceedings of the 22nd International Conference on Control, Automation and Systems (ICCAS), Busan, Republic of Korea, 27–30 November 2022; pp. 623–628. [Google Scholar]
- Kahraman, C.; Kaya, İ.; Cebi, S. A comparative analysis for multiattribute selection among renewable energy alternatives using fuzzy axiomatic design and fuzzy analytic hierarchy process. Energy 2009, 34, 1603–1616. [Google Scholar] [CrossRef]
- Wątróbski, J.; Jankowski, J.; Ziemba, P.; Karczmarczyk, A.; Zioło, M. Generalised framework for multi-criteria method selection. Omega 2019, 86, 107–124. [Google Scholar] [CrossRef]
- Mosadeghi, R.; Warnken, J.; Tomlinson, R.; Mirfenderesk, H. Comparison of Fuzzy-AHP and AHP in a spatial multi-criteria decision making model for urban land-use planning. Comput. Environ. Urban Syst. 2015, 49, 54–65. [Google Scholar] [CrossRef]
- Fangfang, Z.; Zhen, H.; Huilai, S. The Application of Fuzzy Evaluation Method on Design Quality Evaluation of Mine Disaster Rescue Vehicle Detection. In Proceedings of the ISECS International Colloquium on Computing, Communication, Control, and Management, Guangzhou, China, 3–4 August 2008; pp. 185–188. [Google Scholar]
- Chi, Y.; Li, Y.; Li, D.; Ye, J.; Yu, H.; Yu, X.; Yuan, Q. Study on Implementation Plan for Conformity Assessment of Substation Inspection Robot. In Proceedings of the 7th Asia Conference on Power and Electrical Engineering (ACPEE), Hangzhou, China, 15–17 April 2022; pp. 890–894. [Google Scholar]
- Wei, Y.; Jiang, H.; Yang, W. Evaluation method for key index system of transmission tower based on self-adaptive analytic hierarchy process and variable weight theory. Sci. Technol. Eng. 2022, 22, 3144–3151. (In Chinese) [Google Scholar]
- Yang, J.; Zhang, G.; Nie, D. Optimization method of evaluation index and engineering application searching in the whole process of distribution network planning. Yunnan Electr. Power 2021, 49, 40–44. (In Chinese) [Google Scholar]
- Ge, S.; Li, L.; Jiang, R. Construction and application of distribution network operational status evaluation index system based on hierarchical dynamic grey correlation analysis. Sci. Technol. Eng. 2020, 20, 9393–9399. (In Chinese) [Google Scholar]
- Tzeng, C.J.; Lin, Y.H.; Yang, Y.K.; Jeng, M.C. Optimization of turning operations with multiple performance characteristics using the Taguchi method and Grey relational analysis. J. Mater. Process. Technol. 2009, 209, 2753–2759. [Google Scholar] [CrossRef]
- Guo, J.; Yin, H.; Xu, Y. Fuzzy Cluster Analysis of Assessment Index of Equipment Maintenance Support Ability. J. Ordnance Equip. Eng. 2020, 41, 76–80. (In Chinese) [Google Scholar]
- Koulouriotis, D.E.; Ketipi, M. K A fuzzy digraph method for robot evaluation and selection. Expert Syst. Appl. 2011, 38, 11901–11910. [Google Scholar] [CrossRef]
- Su, P.Y.; Zhao, Z.Y.; Shao, Q.G.; Lin, P.Y.; Li, Z. The Construction of an Evaluation Index System for Assistive Teaching Robots Aimed at Sustainable Learning. Sustainability 2023, 15, 13196. [Google Scholar] [CrossRef]
- Wang, W.; Zhang, Y. On fuzzy cluster validity indices. Fuzzy Sets Syst. 2007, 158, 2095–2117. [Google Scholar] [CrossRef]
- Peng, X.; Li, X.; Yang, X. Analysis of circular economy of E-commerce market based on grey model under the background of big data. J. Enterp. Inf. Manag. 2022, 35, 1148–1167. [Google Scholar] [CrossRef]
- Athawale, V.M.; Chakraborty, S. A comparative study on the ranking performance of some multi-criteria decision-making methods for industrial robot selection. Int. J. Ind. Eng. Comput. 2011, 2, 831–850. [Google Scholar] [CrossRef]
- Datta, S.; Sahu, N.; Mahapatra, S. Robot selection based on grey–Multimoora approach. Grey Syst. Theory Appl. 2013, 3, 201–232. [Google Scholar] [CrossRef]
- Ayan, B.; Abacıoğlu, S.; Basilio, M.P. A Comprehensive Review of the Novel Weighting Methods for Multi-Criteria Decision-Making. Information 2023, 14, 285. [Google Scholar] [CrossRef]
- Lai, Y.J.; Liu, T.Y.; Hwang, C.L. Topsis for MODM. Eur. J. Oper. Res. 1994, 76, 486–500. [Google Scholar] [CrossRef]
- Devi, K. Extension of VIKOR method in intuitionistic fuzzy environment for robot selection. Expert Syst. Appl. 2011, 38, 14163–14168. [Google Scholar] [CrossRef]
- Liu, W.; Qi, J.; Jin, Y.; Zhou, Z.; Zhang, X. Application of fuzzy analytic hierarchy process–multi-layer fuzzy inference system in product design evaluation. J. Intell. Fuzzy Syst. 2023, 45, 1–24. [Google Scholar] [CrossRef]
- Chodha, V.; Dubey, R.; Kumar, R.; Singh, S.; Kaur, S. Selection of industrial arc welding robot with TOPSIS and Entropy MCDM techniques. Mater. Today Proc. 2022, 50, 709–715. [Google Scholar] [CrossRef]
- Kao, C.; Liu, S.T. A slacks-based measure model for calculating cross efficiency in data envelopment analysis. Omega 2020, 95, 102192. [Google Scholar] [CrossRef]
- Kao, C.; Liu, S.T. Group decision making in data envelopment analysis: A robot selection application. Eur. J. Oper. Res. 2022, 297, 592–599. [Google Scholar] [CrossRef]
- Sun, Y. Cloud edge computing for socialization robot based on intelligent data envelopment. Comput. Electr. Eng. 2021, 92, 107136. [Google Scholar] [CrossRef]
- Karsak, E.E.; Ahiska, S.S. Practical common weight multi-criteria decision-making approach with an improved discriminating power for technology selection. Int. J. Prod. Res. 2005, 43, 1537–1554. [Google Scholar] [CrossRef]
- Toloo, M.; Tavana, M. A novel method for selecting a single efficient unit in data envelopment analysis without explicit inputs/outputs. Ann. Oper. Res. 2017, 253, 657–681. [Google Scholar] [CrossRef]
- Wang, Z.; Mathiyazhagan, K.; Xu, L.; Diabat, A. A decision making trial and evaluation laboratory approach to analyze the barriers to Green Supply Chain Management adoption in a food packaging company. J. Clean. Prod. 2016, 117, 19–28. [Google Scholar] [CrossRef]
- Liu, J.; Wang, Y.; Li, B.; Ma, S. Current research, key performances and future development of search and rescue robots. Front. Mech. Eng. China 2007, 2, 404–416. [Google Scholar] [CrossRef]
- Tran, J.; Ferworn, A.; Gerdzhev, M.; Ostrom, D. Canine assisted robot deployment for urban search and rescue. In Proceedings of the IEEE Safety Security and Rescue Robotics, Bremen, Germany, 1–6 July 2010. [Google Scholar]
- Zhao, J.; Gao, J.; Zhao, F.; Liu, Y. A search-and-rescue robot system for remotely sensing the underground coal mine environment. Sensors 2017, 17, 2426. [Google Scholar] [CrossRef]
- Pfotzer, L.; Ruehl, S.; Heppner, G.; Roennau, A.; Dillmann, R. KAIRO 3: A modular reconfigurable robot for search and rescue field missions. In Proceedings of the IEEE International Conference on Robotics and Biomimetics (ROBIO 2014), Bali, Indonesia, 5–10 December 2014; pp. 205–210. [Google Scholar]
- Kececi, E.F. Design and prototype of mobile robots for rescue operations. Robotica 2009, 27, 729–737. [Google Scholar] [CrossRef]
- Nagatani, K.; Kiribayashi, S.; Okada, Y.; Tadokoro, S.; Nishimura, T.; Yoshida, T.; Hada, Y. Redesign of rescue mobile robot Quince. In Proceedings of the IEEE International Symposium on Safety, Security, and Rescue Robotics, Kyoto, Japan, 13–18 November 2011. [Google Scholar]
- Enshasy, H.; Al-saleh, M.; Bu-shalf, A. A comprehensive design of unmanned ground search and rescue robot. J. Inf. Comput. Sci. 2019, 14, 52–80. [Google Scholar]
- Kaur, P.; Kaur, R.; Singh, G. Pipeline inspection and borewell rescue robot. Int. J. Res. Eng. Technol. 2014, 3, 726–729. [Google Scholar]
- Murphy, R.; Casper, J.; Hyams, J.; Micire, M.; Minten, B. Mobility and sensing demands in USAR. In Proceedings of the 26th Annual Conference of the IEEE Industrial Electronics Society, IECON IEEE International Conference on Industrial Electronics, Control and Instrumentation. 21st Century Technologies, Nagoya, Japan, 22–28 October 2000; pp. 138–142. [Google Scholar]
- Singh, A.; Yang, L.; Hartikainen, K.; Finn, C.; Levine, S. End-to-end robotic reinforcement learning without reward engineering. arXiv 2019, arXiv:1904.07854. [Google Scholar]
- Niu, J.; Wang, H.; Shi, H.; Pop, N.; Li, D.; Li, S.; Wu, S. Study on structural modeling and kinematics analysis of a novel wheel-legged rescue robot. Int. J. Adv. Robot. Syst. 2018, 15, 1729881417752758. [Google Scholar] [CrossRef]
- Nguyen, L. Legged-wheel control and optimized jumping forward for Five-star wheel robot. Ph.D. Thesis, University of Nevada, Reno, NV, USA, 2020; pp. 125–128. [Google Scholar]
- Fattah, S.A.; Abedin, F.; Ansary, M.N.; Rokib, M.A.; Saha, N.; Shahnaz, C. R3Diver: Remote robotic rescue diver for rapid underwater search and rescue operation. In Proceedings of the IEEE Region 10 Conference (TENCON), Singapore, 22–25 November 2016; pp. 3280–3283. [Google Scholar]
- Bai, L.; Guan, J.; Chen, X.; Hou, J.; Duan, W. An optional passive/active transformable wheel-legged mobility concept for search and rescue robots. Robot. Auton. Syst. 2018, 107, 145–155. [Google Scholar] [CrossRef]
- Qiao, G.; Song, G.; Zhang, J.; Sun, H.; Wang, W.; Song, A. Design of transmote: A modular self-reconfigurable robot with versatile transformation capabilities. In Proceedings of the IEEE International Conference on Robotics and Biomimetics (ROBIO), Guangzhou, China, 11–14 December 2012; pp. 1331–1336. [Google Scholar]
- Shang, L.; Wang, H.; Si, H.; Li, Y.; Pan, T. Investigating the obstacle climbing ability of a coal mine search-and-rescue robot with a hydraulic mechanism. Appl. Sci. 2022, 12, 10485. [Google Scholar] [CrossRef]
- Tanaka, M.; Nakajima, M.; Suzuki, Y.; Tanaka, K. Development and control of articulated mobile robot for climbing steep stairs. IEEE/ASME Trans. Mechatron. 2018, 23, 531–541. [Google Scholar] [CrossRef]
- Macwan, A.; Vilela, J.; Nejat, G.; Benhabib, B. A multirobot path-planning strategy for autonomous wilderness search and rescue. IEEE Trans. Cybern. 2014, 45, 1784–1797. [Google Scholar] [CrossRef]
- Shi, Y.M.; Zhang, Z. Research on Path Planning Strategy of Rescue Robot Based on Reinforcement Learning. J. Comput. 2022, 33, 187–194. [Google Scholar]
- Narang, Y.S.; Aktaş, B.; Ornellas, S.; Vlassak, J.J.; Howe, R.D. Lightweight highly tunable jamming-based composites. Soft Robot. 2020, 7, 724–735. [Google Scholar] [CrossRef]
- Syam, R.; Piarah, W.H. Design of wheeled mobile robot with tri-star wheel as rescue robot. Int. J. Smart Mater. Mechatron. 2014, 1, 28–32. [Google Scholar]
- Sun, T.; Xiang, X.; Su, W.; Wu, H.; Song, Y. A transformable wheel-legged mobile robot: Design, analysis and experiment. Robot. Auton. Syst. 2017, 98, 30–41. [Google Scholar] [CrossRef]
- Enayati, N.; Najafi, F. Design and manufacturing of a tele-operative rescue robot with a novel track arrangement. Ind. Robot. Int. J. 2011, 38, 476–485. [Google Scholar] [CrossRef]
- Meghdari, A.; Mahboobi, S.H.; Gaskarimahalle, A.L. Dynamics modeling of “cedra” rescue robot on uneven terrains. ASME Int. Mech. Eng. Congr. Expo. 2008, 47063, 991–1001. [Google Scholar]
- Brodeur, T.; Regis, P.; Feil-Seifer, D.; Sengupta, S. Search and rescue operations with mesh networked robots. In Proceedings of the 9th IEEE Annual Ubiquitous Computing, Electronics & Mobile Communication Conference (UEMCON), New York, NY, USA, 6–12 November 2018. [Google Scholar]
- Dong, P.; Wang, X.; Xing, H.; Liu, Y.; Zhang, M. Design and control of a tracked robot for search and rescue in nuclear power plant. In Proceedings of the International Conference on Advanced Robotics and Mechatronics (ICARM), Macau, China, 5–8 August 2016; pp. 330–335. [Google Scholar]
- Bai, Y.; Sun, L.; Zhang, M. Terramechanics modeling and grouser optimization for multistage adaptive lateral deformation tracked robot. IEEE Access 2020, 8, 171387–171396. [Google Scholar] [CrossRef]
- Serón, J.; Martinez, J.L.; Mandow, A.; Reina, A.J.; Morales, J.; García-Cerezo, A.J. Automation of the arm-aided climbing maneuver for tracked mobile manipulators. IEEE Trans. Ind. Electron. 2013, 61, 3638–3647. [Google Scholar] [CrossRef]
- Gao, X.A.; Guan, X.; Yang, Y.; Zhang, J. Design and Ground Performance Evaluation of a Multi-Joint Wheel-Track Composite Mobile Robot for Enhanced Terrain Adaptability. Appl. Sci. 2023, 13, 7270. [Google Scholar] [CrossRef]
- Li, Y.; Zang, L.; Shi, T.; Lv, T.; Lin, F. Design and dynamic simulation analysis of a wheel—track composite chassis based on RecurDyn. World Electr. Veh. J. 2021, 13, 12. [Google Scholar] [CrossRef]
- Xu, X.; Wang, W.; Su, G.; Liu, C.; Cai, W.; Zhang, H.; Luo, M. Obstacle Modeling and Structural Optimization of Four-Track Twin-Rocker Rescue Robot. Machines 2022, 10, 365. [Google Scholar] [CrossRef]
- Wang, W.; Du, Z.; Sun, L. Kinematics analysis for obstacle-climbing performance of a rescue robot. In Proceedings of the IEEE International Conference on Robotics and biomimetics (ROBIO), Sanya, China, 15–28 December 2007; pp. 1612–1617. [Google Scholar]
- Lim, S.K.; Park, D.I.; Kwak, Y.K. A new driving mechanism to allow a rescue robot to climb stairs. Int. J. Precis. Eng. Manuf. 2007, 8, 3–7. [Google Scholar]
- Patle, B.K.; Pandey, A.; Parhi, D.R.K.; Jagadeesh, A.J.D.T. A review: On path planning strategies for navigation of mobile robot. Def. Technol. 2019, 15, 582–606. [Google Scholar] [CrossRef]
- Morin, M.; Abi-Zeid, I.; Quimper, C.G. Ant colony optimization for path planning in search and rescue operations. Eur. J. Oper. Res. 2023, 305, 53–63. [Google Scholar] [CrossRef]
- Lee, W.; Lee, Y.; Park, G.; Hong, S.; Kang, Y. A whole-body rescue motion control with task-priority strategy for a rescue robot. Auton. Robot. 2017, 41, 243–258. [Google Scholar] [CrossRef]
- Louie, W.Y.G.; Nejat, G. A victim identification methodology for rescue robots operating in cluttered USAR environments. Adv. Robot. 2013, 27, 373–384. [Google Scholar] [CrossRef]
- Dang, T.; Mascarich, F.; Khattak, S.; Nguyen, H.; Nguyen, H.; Hirsh, S.; Alexis, K. Autonomous search for underground mine rescue using aerial robots. In Proceedings of the IEEE Aerospace Conference, Big Sky, MT, USA, 1–8 March 2020. [Google Scholar]
- Chatziparaschis, D.; Lagoudakis, M.G.; Partsinevelos, P. Aerial and ground robot collaboration for autonomous mapping in search and rescue missions. Drones 2020, 4, 79. [Google Scholar] [CrossRef]
- Sampedro, C.; Rodriguez-Ramos, A.; Bavle, H.; Carrio, A.; de la Puente, P.; Campoy, P. A fully-autonomous aerial robot for search and rescue applications in indoor environments using learning-based techniques. J. Intell. Robot. Syst. 2019, 95, 601–627. [Google Scholar] [CrossRef]
- Lindqvist, B.; Kanellakis, C.; Mansouri, S.S.; Agha-mohammadi, A.A.; Nikolakopoulos, G. Compra: A compact reactive autonomy framework for subterranean mav based search-and-rescue operations. J. Intell. Robot. Syst. 2020, 105, 49. [Google Scholar] [CrossRef]
- Birk, A.; Kenn, H. A rescue robot control architecture ensuring safe semi-autonomous operation. In RoboCup 2002: Robot Soccer World Cup VI 6; Springer: Berlin/Heidelberg, Germany, 2003; pp. 254–262. [Google Scholar]
- Fink, J.; Ribeiro, A.; Kumar, V. Robust control for mobility and wireless communication in cyber-physical systems with application to robot teams. Proc. IEEE 2011, 100, 164–178. [Google Scholar] [CrossRef]
- Murphy, R.R. Human-robot interaction in rescue robotics. IEEE Trans. Syst. Man Cybern. C Appl. Rev. 2004, 34, 138–153. [Google Scholar] [CrossRef]
- Dey, G.K.; Hossen, R.; Noor, M.S.; Ahmmed, K.T. Distance controlled rescue and security mobile robot. In Proceedings of the International Conference on Informatics, Electronics and Vision (ICIEV), Dhaka, Bangladesh, 1–6 May 2013. [Google Scholar]
- Lanying, Z.; Junli, Y.; Weijian, H.U.; Xiaoxia, D.U.; Jing, L.I.; Hong, S. The design and application of the comprehensive capacity evaluation environment for the ruins search and rescue robots. J. Nat. Disasters 2019, 28, 191–198. (In Chinese) [Google Scholar]
- GB/T 37703-201; General Specifications of Ground Robots for Search and Rescue In Ruins. Chinese Academy of Sciences (CAS): Beijing, China, 2019.
- Hu, W.; Yu, J.; Zhao, J. Performance comprehensive evaluation of the ruins search and rescue robots. Sci. Technol. Eng. 2017, 17, 247–254. [Google Scholar]
- Liu, Y.; Li, X.; Zhu, X. Grey fuzzy clustering method for regional classification in distribution network construction scale evaluation. Autom. Electr. Power Syst. 2006, 30, 79–84. [Google Scholar]
- Liu, D.; Wang, S.; Tomovic, M.M.; Zhang, C. An evidence theory based model fusion method for degradation modeling and statistical analysis. Inf. Sci. 2020, 532, 33–60. [Google Scholar] [CrossRef]
- Du, Y.W.; Li, X.X. Hierarchical DEMATEL method for complex systems. Expert Syst. Appl. 2021, 167, 113871. [Google Scholar] [CrossRef]
- Cong, D.; Liang, L.; Jing, S.; Han, Y.; Geng, Z.; Chu, C. Energy supply efficiency evaluation of integrated energy systems using novel SBM-DEA integrating Monte Carlo. Energy 2021, 231, 120834. [Google Scholar] [CrossRef]
- Charnes, A.; Cooper, W.W.; Rhodes, E. Measuring the efficiency of decision making units. Eur. J. Oper. Res. 1978, 2, 429–444. [Google Scholar] [CrossRef]
- Sojoodi, S.; Dastmalchi, L.; Neshat, H. Efficiency ranking of different types of power plants in Iran using super efficiency method. Energy 2021, 233, 121104. [Google Scholar] [CrossRef]


| Main Criteria | Corresponding Criteria | Literature Sources |
|---|---|---|
| Survival ability | Continuous walking distance with an independent power supply | [34,35,36,37,40] |
| Continuous walking time with an independent power supply | [34,35,36,37,39] | |
| Success rate of continuous start, working, stop | [38,41,42] | |
| Continuous working time | [36,37,39] |
| Main Criteria | Corresponding Criteria | Literature Sources |
|---|---|---|
| Motion ability | Mass-to-volume ratio | [43,44,45,52] |
| Subversive resistance on complex road surfaces | [37,43,44,45,53] | |
| Maximum speed of wheel motion | [37,43,48,49,53] | |
| Success rate of mechanism transformation | [46,47,54] | |
| Success rate of maneuvering through narrow spaces | [43,46,49] | |
| Minimum turning radius | [55,56,57,58] | |
| Unit pressure exerted by the tracked device on the ground | [2,39,59,60] | |
| Maximum width across trenches | [43,48,49,61,62] | |
| Maximum height of obstacles to be overcome | [43,48,49,61,63] | |
| Maximum angle for climbing | [43,48,49,61,64] | |
| Number of steps climbed per unit time | [43,48,49,61,65] | |
| Success rate of path planning | [50,51,66,67,68] |
| Main Criteria | Corresponding Criteria | Literature Sources |
|---|---|---|
| Detection perception ability | Probability of live body identification | [69,70,71,72,73] |
| Maximum radius for effective search | [69,70,71,72,73] | |
| Maximum depth for effective search | [69,70,71,73] |
| Main Criteria | Corresponding Criteria | Literature Sources |
|---|---|---|
| Communication control ability | Time required for establishing communication | [35,40,74,75] |
| Success rate of the operating interface | [72,74,75,76] | |
| Accuracy of data transmission | [70,71,74,75] | |
| Maximum distance for wireless control | [74,75,77] |
| Total Aim | First-Grade Index | Second-Grade Index | Test Results of the Samples | ||
|---|---|---|---|---|---|
| Sample A | Sample B | Sample C | |||
| Performance of rescue robots | Survival Ability X1 | X11 Continuous walking distance with independent power supply/(m) | 3000 | 6000 | 4000 |
| X12 Continuous walking time with independent power supply/(h) | 3.13 | 20 | 4.35 | ||
| X13 Success rate of continuous start, working, stop/(%) | 100 | 90 | 90 | ||
| X14 Continuous working time/(h) | 5.23 | 22 | 6.85 | ||
| Motion Ability X2 | X21 Mass-to-volume ratio/(kg/m3) | 1083 | 1442 | 980 | |
| X22 Subversive resistance on complex road surfaces (mm/s2) | 2 | 7 | 2 | ||
| X23 Maximum speed of wheel motion/(m/s) | 328 | 100 | 350 | ||
| X24 Success rate of mechanism transformation/(%) | 90 | 100 | 90 | ||
| X25 Success rate through narrow space/(%) | 100 | 100 | 100 | ||
| X26 Minimum turning radius/(mm) | 30 | 15 | 20 | ||
| X27 Unit pressure exerted by the tracked device on the ground/(Pa) | 2200 | 4688 | 2500 | ||
| X28 Maximum width across trenches/(mm) | 300 | 250 | 300 | ||
| X29 Maximum height of obstacles to be overcome/(mm) | 250 | 200 | 250 | ||
| X210 Maximum angle for climbing/(deg) | 34 | 30 | 34 | ||
| X211 Number of steps climbed per unit time/(pc) | 20 | 16 | 20 | ||
| X212 Success rate of path planning/(%) | 90 | 70 | 90 | ||
| Detection perception Ability X3 | X31 Probability of live body identification/(%) | 70 | 70 | 80 | |
| X32 Maximum radius for effective search/(m) | 18 | 15 | 20 | ||
| X33 Maximum depth for effective search/(m) | 9 | 7 | 12 | ||
| Communication control ability X4 | X41 Time required for establishing communication/(s) | 40 | 60 | 50 | |
| X42 Success rate of the operating interface/(%) | 90 | 80 | 90 | ||
| X43 Accuracy of data transmission/(%) | 90 | 80 | 90 | ||
| X44 Maximum distance for wireless control/(m) | 500 | 600 | 800 | ||
| Undetermined index 1 | Smoothness of walking on complex road surfaces/ (mm/s2) | 4 | 5 | 4 | |
| Undetermined index 2 | Motion speed under standard load/(m/s) | 286 | 95 | 310 | |
| First-Grade Index | Central Indexes |
|---|---|
| X1 Survival ability | X14 Continuous working time |
| X2 Motion ability | X23 Maximum speed of wheel motion |
| X210 Maximum angle for climbing | |
| X3 Detection perception ability | X31 Probability of live body identification |
| X4 Communication control ability | X43 Accuracy of data transmission |
| Title 1 | Credible | Incredible | Unknown |
|---|---|---|---|
| 0.98 | 0.01 | 0.01 | |
| 0 | 0.01 | 0.99 |
| Index | X14 | X23 1 | X31 | X43 | Undetermined Index 1 |
|---|---|---|---|---|---|
| X14 | 1.0000 | 0.4178 | 0.4943 | 0.5612 | 0.4083 |
| X23 | 0.4178 | 1.0000 | 0.2433 | 0.4569 | 0.4609 |
| X31 | 0.4943 | 0.2433 | 1.0000 | 0.4469 | 0.3971 |
| X43 | 0.5612 | 0.4569 | 0.4469 | 1.0000 | 0.4308 |
| Undetermined index 1 | 0.4083 | 0.4609 | 0.3971 | 0.4308 | 1.0000 |
| Index | X14 | X23 1 | X31 | X43 | Undetermined Index 2 |
|---|---|---|---|---|---|
| X14 | 1.0000 | 0.4178 | 0.4943 | 0.5612 | 0.4439 |
| X23 | 0.4178 | 1.0000 | 0.2433 | 0.4569 | 0.5911 |
| X31 | 0.4943 | 0.2433 | 1.0000 | 0.4469 | 0.5947 |
| X43 | 0.5612 | 0.4569 | 0.4469 | 1.0000 | 0.3526 |
| Undetermined index 2 | 0.4439 | 0.5911 | 0.5947 | 0.3526 | 1.0000 |
| Index Number | (Group) Grey Relational Degree | Threshold | Central Index |
|---|---|---|---|
| X11 | 0.8460 | 0.8 | X14 |
| X12 | 0.7212 | 0.8 | X14 |
| X13 | 0.7450 | 0.8 | X14 |
| X21 | 0.6589 | 0.8 | X23, X210 |
| X22 | 0.8354 | 0.8 | X23, X210 |
| X24 | 0.5849 | 0.8 | X23, X210 |
| X25 | 0.6254 | 0.8 | X23, X210 |
| X26 | 0.6667 | 0.8 | X23, X210 |
| X27 | 0.6398 | 0.8 | X23, X210 |
| X28 | 0.6238 | 0.8 | X23, X210 |
| X29 | 0.7567 | 0.8 | X23, X210 |
| X211 | 0.7533 | 0.8 | X23, X210 |
| X212 | 0.6028 | 0.8 | X23, X210 |
| X213 | 0.7359 | 0.8 | X23, X210 |
| X32 | 0.4213 | 0.5656 | X31 |
| X33 | 0.3596 | 0.5656 | X31 |
| X34 | 0.6426 | 0.5656 | X31 |
| X41 | 0.4123 | 0.5656 | X43 |
| X42 | 0.4896 | 0.5656 | X43 |
| X44 | 0.4356 | 0.5656 | X43 |
| Expert | The Reliability Probability of Each Expert for the Screening Indexes. | ||
|---|---|---|---|
| Credible Probability | Incredibility Probability | Unknown Probability | |
| 1 | 0.4/0.5/0.4 | 0.5/0.5/0.4 | 0.1/0/0.2 |
| 2 | 0.6/0.7/0.3 | 0.4/0.2/0.6 | 0/0.1/0.1 |
| 3 | 0.1/0.8/0.8 | 0.8/0.1/0.1 | 0.1/0.1/0.1 |
| 4 | 0.5/0.9/0.1 | 0.5/0/0 | 0/0.1/0.9 |
| Index | Credible Probability | Incredibility Probability | Unknown Probability |
|---|---|---|---|
| X11 | 0.7300 | 0.2507 | 0.0194 |
| X22 | 0.3547 | 0.6447 | 0.0006 |
| X34 | 0.3338 | 0.1035 | 0.5627 |
| Index | Influence Degree | Influenced Degree | Centrality Degree | Causal Degree |
|---|---|---|---|---|
| C11 | 1.7038 | 0.7523 | 2.4623 | −0.9456 |
| C12 | 1.0512 | 0.6862 | 1.7372 | −0.3666 |
| C13 | 0.4638 | 1.2336 | 1.6995 | −0.7656 |
| C21 | 0.9911 | 0.4768 | 1.4662 | −0.5123 |
| C22 | 0.3364 | 0.7873 | 1.1242 | 0.4503 |
| C23 | 0.4825 | 0.2748 | 0.7523 | −0.2075 |
| C24 | 0.6621 | 0.2215 | 0.8845 | −0.4420 |
| C25 | 0.3095 | 0.1468 | 0.7562 | 0.4631 |
| C26 | 0.3576 | 0.7311 | 1.0886 | 0.3715 |
| C27 | 0.2878 | 0.5482 | 0.8205 | 0.2785 |
| C28 | 1.2031 | 0.5232 | 1.7260 | −0.6798 |
| C29 | 0.4834 | 0.2748 | 0.6586 | −0.2095 |
| C210 | 0.8256 | 0.2645 | 1.0856 | −0.5623 |
| C211 | 0.6042 | 0.5792 | 1.1856 | −0.0256 |
| C212 | 0.5643 | 0.7579 | 1.3225 | −0.1932 |
| C213 | 0.2726 | 0.8276 | 1.1023 | 0.5545 |
| C31 | 0.6001 | 0.2113 | 0.8026 | −0.3976 |
| C32 | 0.8256 | 0.2645 | 1.1882 | −0.5605 |
| C33 | 0.8062 | 0.7185 | 1.5245 | −0.0876 |
| C41 | 0.2015 | 0.2956 | 0.4956 | 0.0925 |
| C42 | 1.0423 | 0.6683 | 1.7146 | −0.3781 |
| C43 | 0.6273 | 0.7662 | 1.3921 | −0.1382 |
| C44 | 1.3920 | 1.1402 | 2.5232 | −0.2532 |
| Index | Influence Degree | Sample A | Sample B | Sample C |
|---|---|---|---|---|
| Efficiency value | 0.5678 | 0.3256 | 1 | |
| Super efficiency value | 0.5678 | 0.3256 | 1.2978 | |
| C11 | s1+ | 0 | 0 | 0 |
| C12 | s2+ | 0 | 0 | 0 |
| C13 | s3+ | 0 | 0.01 | 0 |
| C21 | s4+ | 0 | 34.591 | 0 |
| C22 | s1− | 0.086 | 281.399 | 0 |
| C23 | s5+ | 0.003 | 0.001 | 0 |
| C24 | s6+ | 0 | 0.028 | 0 |
| C25 | s2− | 0 | 0 | 0 |
| C26 | s3− | 3.502 | 0 | 0 |
| C27 | s4− | 0 | 0.072 | 0 |
| C28 | s7+ | 0 | 0 | 0 |
| C29 | s8+ | 0.005 | 0 | 0 |
| C210 | s9+ | 0 | 0 | 0 |
| C211 | s10+ | 0 | 341.762 | 0 |
| C212 | s11+ | 0.11 | 0.001 | 0 |
| C213 | s5− | 0 | 107.546 | 0 |
| C31 | s12+ | 0.082 | 0.01 | 0 |
| C32 | s13+ | 30.218 | 41.186 | 0 |
| C33 | s14+ | 141.189 | 235.286 | 0 |
| C41 | s6− | 0.001 | 0 | 0 |
| C42 | s15+ | 0 | 0 | 0 |
| C43 | s16+ | 0 | 0 | 0 |
| C44 | s17+ | 0.012 | 0.01 | 0 |
| Index | S− | S+ | RE% | NE% |
|---|---|---|---|---|
| C11 | - | 0 | - | 0 |
| C12 | - | 0.01 | - | 1.255 |
| C13 | - | 0 | - | 0 |
| C21 | - | 0.95 | - | 3.123 |
| C22 | 0.086 | - | 11.11 | - |
| C23 | - | 0.003 | - | 3.132 |
| C24 | - | 0 | - | 0 |
| C25 | 0 | - | 0 | - |
| C26 | 3.502 | - | 5.265 | - |
| C27 | 0 | - | 0 | - |
| C28 | - | 0 | - | 0 |
| C29 | - | 0.005 | - | 1.315 |
| C210 | - | 0 | - | 0 |
| C211 | - | 0 | - | 0 |
| C212 | - | 0.11 | - | 5.289 |
| C213 | 0 | - | 0 | - |
| C31 | - | 0.082 | - | 25.000 |
| C32 | - | 30.218 | - | 67.079 |
| C33 | - | 141.189 | - | 53.846 |
| C41 | 0.001 | - | 1.256 | - |
| C42 | - | 0 | - | 0 |
| C43 | - | 0 | - | 0 |
| C44 | - | 0.012 | - | 15.321 |
| Index | S− | S+ | RE% | NE% |
|---|---|---|---|---|
| C11 | - | 0 | - | 0 |
| C12 | - | 0 | - | 0 |
| C13 | - | 0.01 | - | 0 |
| C21 | - | 0 | - | 0 |
| C22 | 281.399 | - | 41.995 | - |
| C23 | - | 0.001 | - | 3.132 |
| C24 | - | 0.028 | - | 1.212 |
| C25 | 0.072 | - | 2.158 | - |
| C26 | 0 | - | 0 | - |
| C27 | 0 | - | 0 | - |
| C28 | - | 0.06 | - | 20.256 |
| C29 | - | 0 | - | 0 |
| C210 | - | 0 | - | 0 |
| C211 | - | 341.762 | - | 56.945 |
| C212 | - | 0.1 | - | 7.215 |
| C213 | 107.546 | - | 26.142 | - |
| C31 | - | 0.01 | - | 15.013 |
| C32 | - | 41.186 | - | 82.075 |
| C33 | - | 235.286 | - | 63.596 |
| C41 | 0 | - | 0 | - |
| C42 | - | 0 | - | 0 |
| C43 | - | 0 | - | 0 |
| C44 | - | 0.01 | - | 12.325 |
| Evaluation Method | Ranking Results |
|---|---|
| Traditional DEMATEL super efficiency DEA | SA > SC > SB |
| DEMATEL super-efficiency DEA | SC > SA > SB |
| Entropy weight method | SB > SC > SA |
| VIKOR (Weights calculated using the AHP method) | SC > SB > SA |
| VIKOR (Weights calculated using coefficient of variation) | SB > SC > SA |
| Index | Weight Values of Entropy Weight Method |
|---|---|
| C11 | 0.0521 |
| C12 | 0.0610 |
| C13 | 0.0481 |
| C21 | 0.0581 |
| C22 | 0.0360 |
| C23 | 0.0247 |
| C24 | 0.1086 |
| C25 | 0.0255 |
| C26 | 0.0317 |
| C27 | 0.0726 |
| C28 | 0.0131 |
| C29 | 0.0147 |
| C210 | 0.0798 |
| C211 | 0.0258 |
| C212 | 0.0114 |
| C213 | 0.0315 |
| C31 | 0.0105 |
| C32 | 0.0553 |
| C33 | 0.0209 |
| C41 | 0.0557 |
| C42 | 0.0439 |
| C43 | 0.0120 |
| C44 | 0.0119 |
Disclaimer/Publisher’s Note: The statements, opinions and data contained in all publications are solely those of the individual author(s) and contributor(s) and not of MDPI and/or the editor(s). MDPI and/or the editor(s) disclaim responsibility for any injury to people or property resulting from any ideas, methods, instructions or products referred to in the content. |
© 2024 by the authors. Licensee MDPI, Basel, Switzerland. This article is an open access article distributed under the terms and conditions of the Creative Commons Attribution (CC BY) license (https://creativecommons.org/licenses/by/4.0/).
Share and Cite
Li, L.; Zhao, Z. Performance Test, Index System Establishment, and Comprehensive Evaluation of Earthquake Rescue Robots. Electronics 2024, 13, 1401. https://doi.org/10.3390/electronics13071401
Li L, Zhao Z. Performance Test, Index System Establishment, and Comprehensive Evaluation of Earthquake Rescue Robots. Electronics. 2024; 13(7):1401. https://doi.org/10.3390/electronics13071401
Chicago/Turabian StyleLi, Liming, and Zeang Zhao. 2024. "Performance Test, Index System Establishment, and Comprehensive Evaluation of Earthquake Rescue Robots" Electronics 13, no. 7: 1401. https://doi.org/10.3390/electronics13071401