
USES-Net: An Infrared Dim and Small Target Detection Network with Embedded Knowledge Priors

School of Science, Mathematical Science Research Center, Chongqing University of Technology, Chongqing 400054, China
*
Author to whom correspondence should be addressed.
Electronics 2024, 13(7), 1400; https://doi.org/10.3390/electronics13071400
Submission received: 7 February 2024
/
Revised: 28 March 2024
/
Accepted: 6 April 2024
/
Published: 8 April 2024
(This article belongs to the Special Issue Object Detection, Segmentation and Categorization in Artificial Intelligence)
Abstract
:Detecting and identifying small infrared targets has always been a crucial technology for many applications. To address the low accuracy, high false-alarm rate, and poor environmental adaptability that commonly exist in infrared target detection methods, this paper proposes a composite infrared dim and small target detection model called USES-Net, which combines the target prior knowledge and conventional data-driven deep learning networks to make use of both labeled data and the domain knowledge. Based on the typical encoder–decoder structure, USES-Net firstly introduces the self-attention mechanism of Swin Transformer to replace the universal convolution kernel at the encoder end. This helps to extract potential features related to dim, small targets in a larger receptive field. In addition, USES-Net includes an embedded patch-based contrast learning module (EPCLM) to integrate the spatial distribution of the target as a knowledge prior in the training network model. This guides the training process of the constrained network model with clear physical interpretability. Finally, USES-Net also designs a bottom-up cross-layer feature fusion module (AFM) as the decoder of the network, and a data-slicing-aided enhancement and inference method based on Slicing Aided Hyper Inference (SAHI) is utilized to further improve the model’s detection accuracy. An experimental comparative analysis shows that USES-Net achieves the best results on three typical infrared weak-target datasets: NUAA-SIRST, NUDT-SIRST, and IRSTD-1K. The results of the target segmentation are complete and sufficient, which demonstrates the validity and practicality of the proposed method in comparison to others.
1. Introduction
The identification and tracking of infrared targets is a crucial technology that relies on the characteristic difference between a target and the background thermal radiation in an infrared imaging system [1]. This technology has the advantages of all-weather and passive operation, a strong anti-interference ability, a simple structure, and ease of carrying and concealment [2]. Infrared target detection and recognition technology is widely used in various fields of applications. A detection and recognition algorithm for infrared targets must have a high detection rate, a low false-alarm rate, and a fast response time. This is a crucial requirement for infrared target detection and has significant research and application values. However, in the case of remote sensing infrared imaging systems, the sensor is often located far from the target to be detected. Additionally, external factors, such as scattering, diffraction, and atmospheric disturbance can affect the imaging process. As a result, the target may appear to have a small scale and weak energy imaging characteristics in the image plane [3], and the target may occupy only a small number of pixels in the image and lack discernible texture, shape, color, and structural features. Furthermore, detecting and recognizing weak and small infrared targets in complex scenarios, such as sea surfaces, buildings, and continuous cloud scenes, can be challenging, due to low signal-to-noise ratios and significant structural noise interference in the background. The imaging characteristics and complex backgrounds of infrared weak and small targets pose significant challenges to infrared detection and recognition. Therefore, accurately, quickly, and stably detecting dim, small infrared targets and matching them remains a crucial technical problem in detection.
For the detection and recognition of dim and small infrared targets, the current common methods can be divided into two categories: traditional image processing methods based on physical models and data-driven methods based on deep learning. Among them, traditional methods can only obtain the local spatial characteristics of the targets and lack semantic identifiability between the targets and other interfering backgrounds, which leads to the poor detection performance of such methods in the presence of complex backgrounds, low signal-to-noise ratios, and other scenes [4]. At the same time, traditional methods often rely on the manual selection and debugging of parameters, which also makes such methods prone to failure in rapidly changing test environments [5]. In recent years, with the great success of various deep learning network models represented by convolutional neural networks (CNNs) in the fields of computer vision and pattern recognition, more and more researchers have begun to apply the data-driven deep learning method to the detection and recognition of small infrared targets [6]. Currently, methods based on deep learning can also be divided into two categories. The first is based on target segmentation, such as FCN [7], UNet [8], and so on. The segmentation results of the target and background are obtained through network model training, and then target detection and matching are realized. The second is to use some mature two-stage or single-stage target detection general backbone networks, such as Fast RCNN [9], YOLO [10], SSD [11], and other deep network models, to obtain the category information and boundary box position of the target through a sample data training regression and complete the detection and recognition process for specific targets. However, since dim, small infrared targets are smaller than small targets in the general sense, it is often difficult to accurately extract the semantic information of dim, small infrared targets when the above general deep learning network model is directly used, and with the deepening of the number of network layers, the target information is easily submerged in the background and noise [12]. In addition, training samples for the detection and recognition of weak and small infrared targets are often difficult to obtain, and the dataset size is limited, which also greatly limits the performance and effect of various types of deep learning network models.
In this paper, we propose an infrared dim and small target detection model called USES-Net, which combines target knowledge priors, the Swin Transformer self-attention mechanism, and new data enhancement methods. First, the USES-Net network based on an encoding and decoding architecture is used as the backbone of the model, and the local contrast distribution of dim and small infrared targets is embedded into the deep neural network structure as a physical prior called EPCLM, which is an intermediate module and is used to constrain and guide the training process of the network model. Then, the moving window attention module of Swin Transformer is introduced to replace the traditional multilayer convolutional structure to fully obtain the semantic feature formation of the input target at different scales and in larger receptive fields. Then, a bottom-up cross-layer feature fusion module (AFM) combined with the attention mechanism is used to organically combine the low-level local location information and high-level global semantic association information of weak and small infrared targets. Finally, the significant features of the target area are greatly enhanced using the slice-assisted enhancement and reasoning method based on SAHI so as to achieve a more accurate detection and recognition effect for dim and small infrared targets. The main contributions of this paper are summarized as follows:
- (1)
- An infrared dim and small target detection and recognition method based on the joint drives of knowledge and data is designed and implemented. By embedding the local contrast distribution of the dim, small infrared target into the network model as a physical prior, the original purely data-driven deep learning method is extended, which makes the network training process more targeted and improves the generalization and interpretability of the network model.
- (2)
- Innovatively introducing the Swin Transformer attention module into the UNet network structure to replace traditional convolutional kernels for target feature extraction can effectively overcome the receptive field limitation problem of convolutional kernels. Supervised learning methods are used to extract richer global semantic features of targets during training, fully exploiting the intrinsic information of dim, small infrared targets.
- (3)
- A bottom-up cross-layer feature fusion module (AFM) is designed as the decoder of the proposed network, which can reconstruct the target feature information obtained at different scales and can fully retain the low-level local spatial features and high-level global semantic features of small infrared targets. In addition, the slice-assisted enhancement and inference method based on SAHI can further enhance the feature saliency of dim and small infrared targets and ultimately achieves a more accurate detection and recognition effect.
2. Related Work
According to the number of images available, the traditional infrared dim, small target detection and recognition algorithms can be divided into two categories: single-frame target detection and frame-sequence target detection. The former is mainly based on the prior characteristics of the model, which can be roughly divided into three types: filtering-based [13], human visual system-based [14], and image data structure-based characteristics [15]. For example, Cai [16] proposed an infrared small-target detection algorithm based on a visual contrast mechanism. The algorithm uses a local contrast (LCM) operator to obtain the significant region and uses multi-scale contrast to further improve the robustness and detection ability of the algorithm. Yang [17] proposed an infrared dim, small target detection algorithm based on a local block contrast mechanism (PCM). The algorithm only needs to calculate multiple contrasts in the local neighborhood of the target and takes the maximum value as the discrimination basis to realize the detection of small targets, resulting in better robustness. Zhang [18] proposed a nonconvex rank approximation minimization joint algorithm (NRAM) to separate small infrared targets from the background. Zhou [19] applied the effective integration of Schatten-1/2 quasi-norm regularization and reweighted sparse enhancement to further improve target detection performance. Generally, the methods based on a single frame have low design complexity and are easy to deploy on hardware. However, these algorithms are typically only suitable for detecting targets in a single scene. Since they do not use temporal information about the target, it is difficult to improve the detection accuracy and recall rate simultaneously. This limitation can have a significant impact on subsequent recognition and matching.
The algorithm for detecting and recognizing dim and small infrared targets based on multi-frame images can be divided into two specific methods: the detect before track (DBT) algorithm [20] and the track before detect (TBD) algorithm [21]. Both methods assist detection through the recognition and association of images at different times to obtain the historical trajectory information of the target. The DBT algorithm utilizes the gray gradient and optical flow characteristics of the target in a single-frame infrared image to suppress image background clutter. This improves the local signal-to-clutter ratio of the target and reduces the false-alarm probability. Then, an appropriate threshold is selected to segment the target and background. The real target position in the image is determined by eliminating the false target based on the continuity of the target motion. For the TBD algorithm, the primary objective is to assess the potential targets’ degree of suspicion based on the energy accumulation process of the infrared targets in the sequence of images [22]. This detection experience knowledge is then used to carry out target recognition. During the recognition process, false target trajectories are gradually eliminated while the real target trajectory is retained until it meets the preset conditions and is confirmed as the target. Although the algorithm’s detection accuracy and recall rate will improve, this often requires a large amount of calculation and high continuity in the image scene, making it difficult to widely apply in practical fields.
Due to the limitations of traditional infrared dim, small target detection and recognition methods, an increasing number of researchers have turned to pure data-driven methods, such as deep learning, in recent years. These methods have resulted in many innovative approaches being proposed. Lee [23] proposed an infrared feature learning algorithm based on the LSTM neural network. The algorithm combines the LSTM prediction network with the DuCNN classification network to accurately classify targets from clutter. Yang [24] proposed an algorithm for detecting the trajectories of dim, small infrared targets based on the attention mechanism convolution of the long and short memory neural network. The algorithm uses the convolution of the long and short memory network to extract the long-term space–time information of the infrared sequence. Additionally, the attention mechanism is used to focus on the trajectory of the dim, small target, enabling the network to achieve an end-to-end prediction output. Zhao [25] proposed a lightweight network called TBC-Net for detecting infrared small targets. The model’s feature extraction ability is improved by adding high-level semantic constraint information to the training network. Wang [26] incorporated the generative countermeasure network (GAN) into the process of detecting dim, small infrared targets. By designing two different generator modes, it is possible to better balance the problems of missed detection and false alarms in infrared dim and small target detection. Huang [27] proposed a multi-scale infrared dim, small target segmentation method that uses a local similarity pyramid module and an attention mechanism to fuse depth gradient features. These methods achieved good results on an open training dataset. However, the infrared dim- and small-target detection methods based on deep learning mentioned above are often sensitive to hyperparameters due to the lack of physical priors for the target energy distribution. In this respect, Dai [28] proposed an attentional local contrast network (ALC-Net) for infrared small-target detection which combines the data-driven networks and conventional model-driven methods to make use of both labeled data and the domain knowledge. Zhang [29] proposed a novel infrared shape network named ISNet, where Taylor finite difference (TFD)-inspired edge blocks and two-orientation attention aggregation (TOAA) blocks are devised to precisely detect the shape of infrared targets. Li [30] proposed a dense nested attention network named DNA-Net to achieve progressive interaction among high-level and low-level features. Moreover, Sun [31], Hou [32], and Wu [33] also proposed their respective improved deep learning algorithms aimed at further extracting the intrinsic feature of infrared small targets. However, these improved models above mainly extract the feature information of the target through conventional convolution kernels, resulting in limited target receptive fields at different scales and making it difficult to deeply mine the deep semantic information of the target. Therefore, it is necessary to further improve the accuracy and generalization ability of infrared dim- and small-target detection and recognition methods.
According to the above analysis, the USES-Net designed in this paper tries to further improve the existing advanced methods in some aspects. Firstly, USES-Net introduces the self-attention mechanism of Swin Transformer to replace the convolution kernel commonly used in the literature [29,30,31,32,33], which helps to extract infrared small and dim targets in a larger receptive field. In addition, based on the end-to-end structure of ALC-Net [28], USES-Net introduces an embedded patch-based contrast learning module (EPCLM) as an improved knowledge prior to guide the model’s training process. Finally, USES-Net also uses a data-slicing-aided enhancement and inference method based on Slicing Aided Hyper Inference (SAHI) [34], which can effectively increase the sample data and improve the model’s detection accuracy. This article will then introduce the details of the proposed method in detail.
3. Proposed Method
3.1. Overview
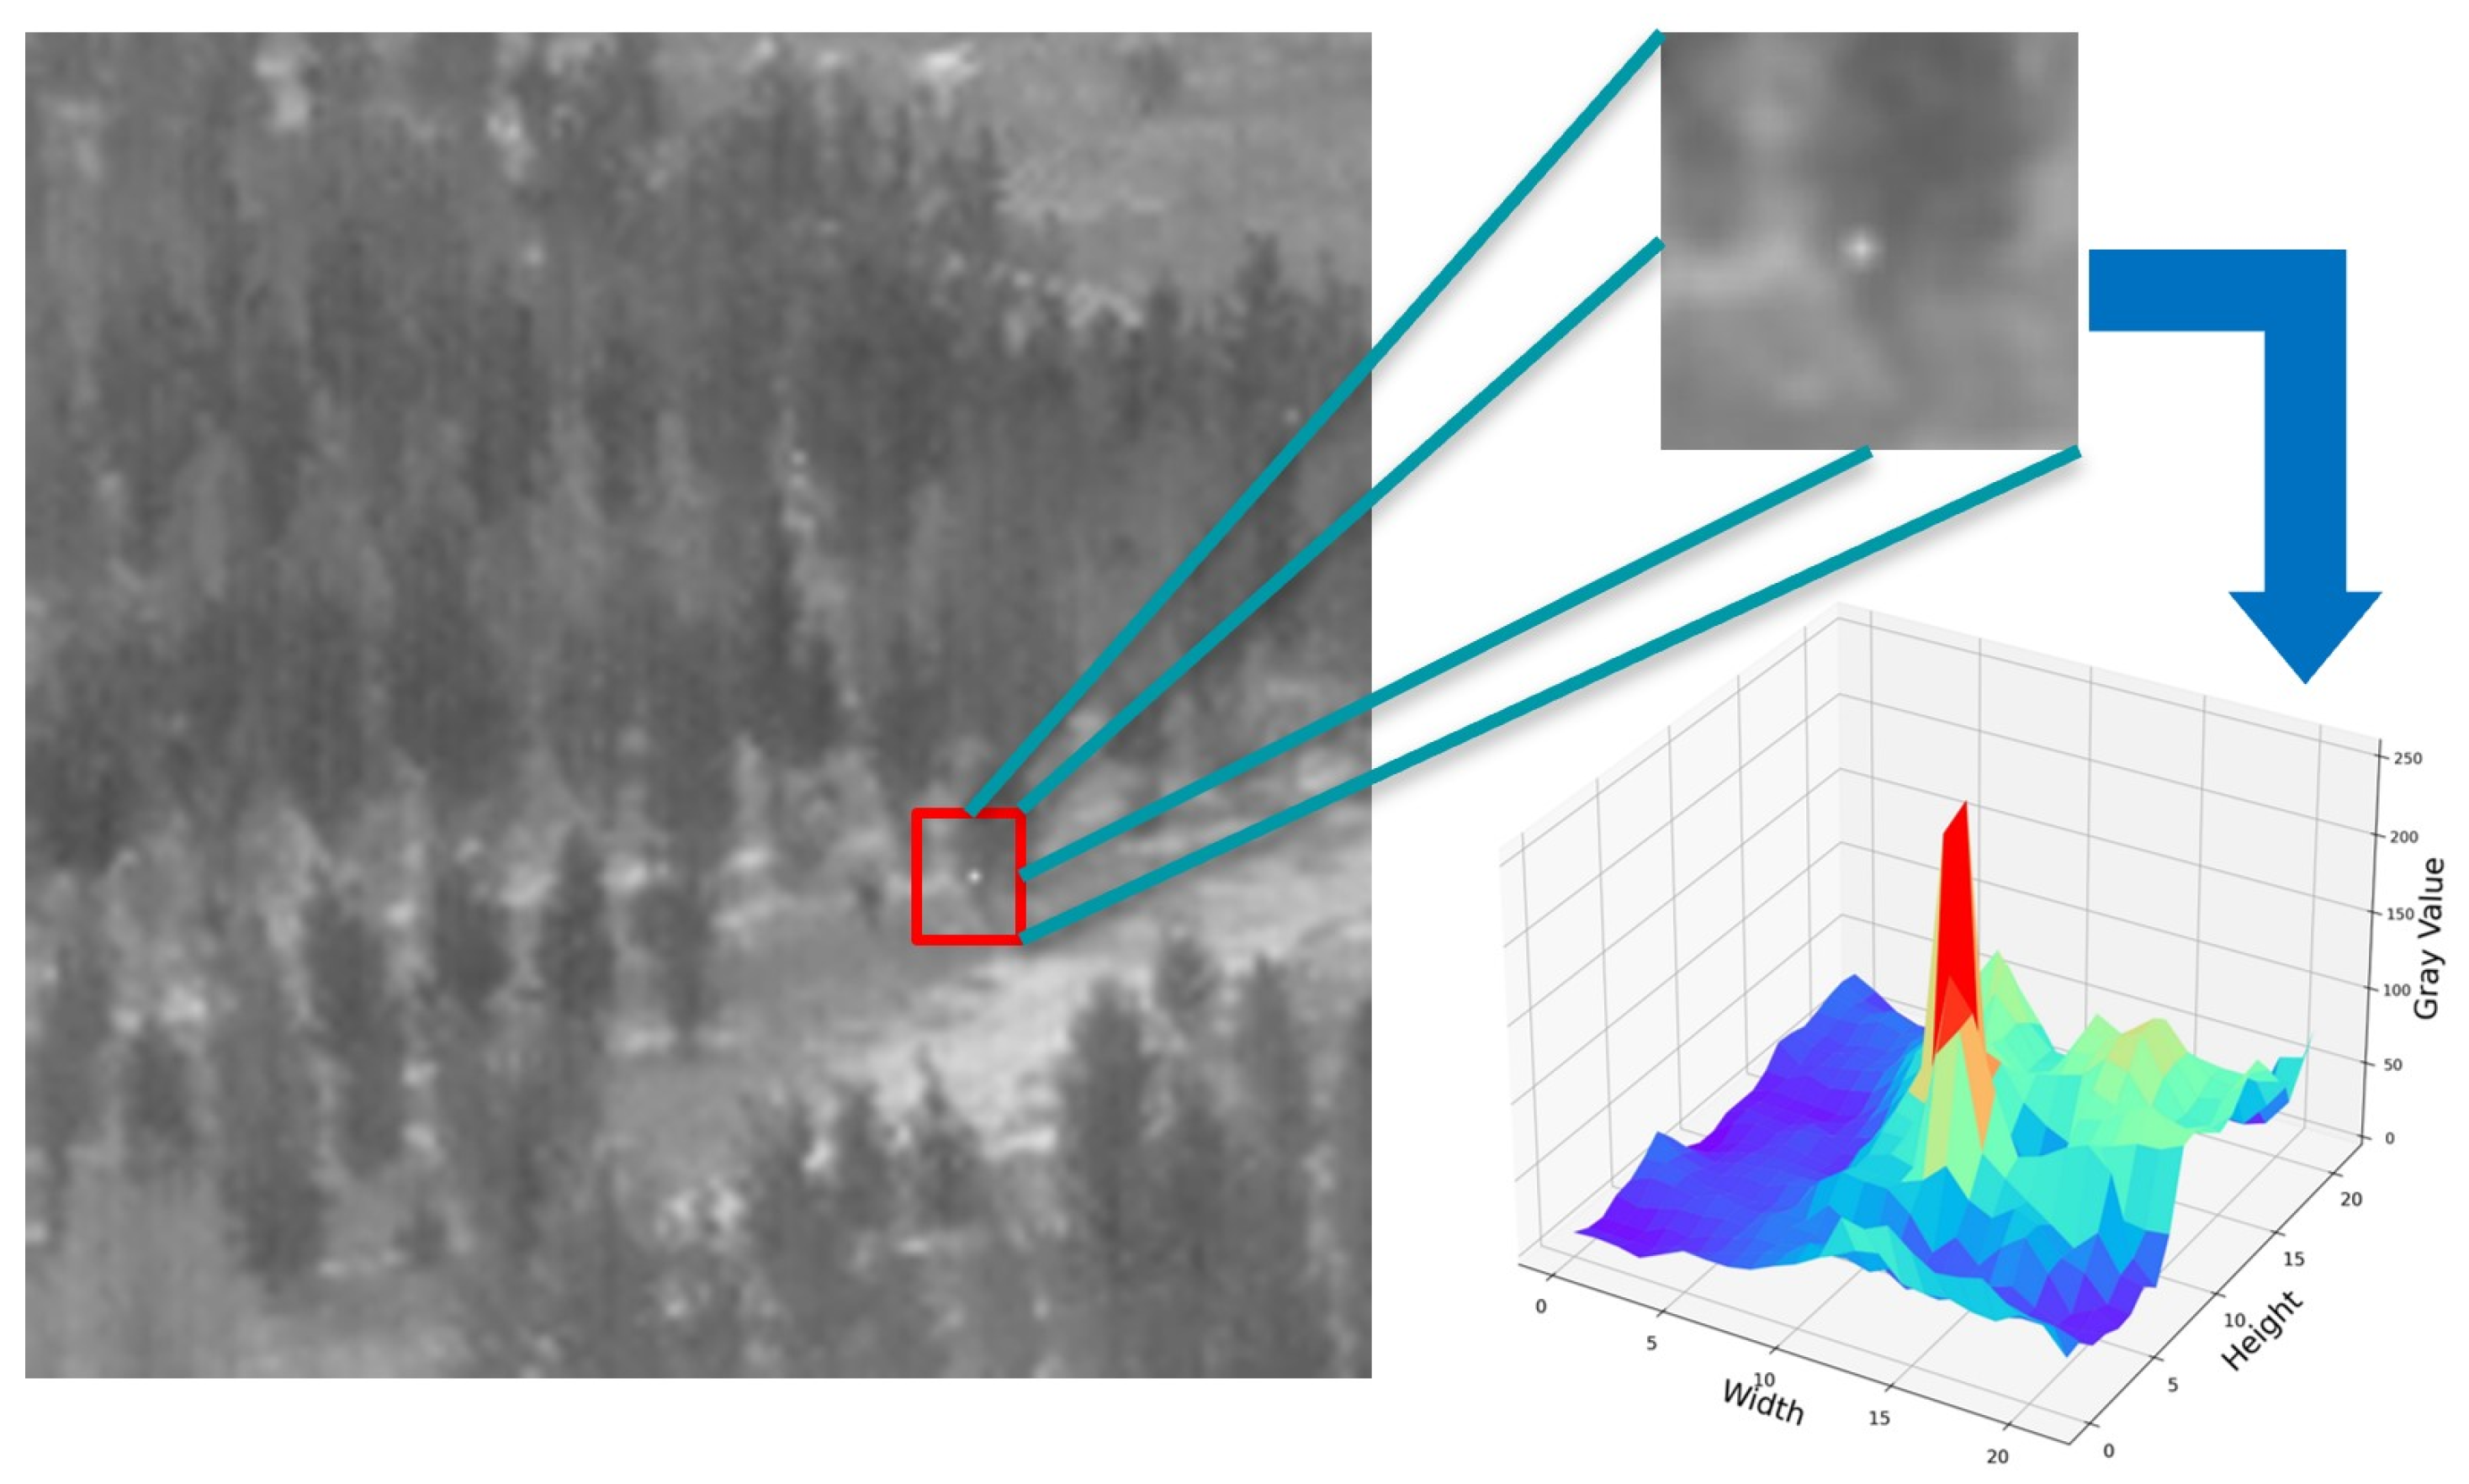
According to the International Institute of Optical Engineering’s definition of dim and small infrared targets [35], targets with a size of 9 × 9 or less in an image are classified as small targets or micro targets. Figure 1 shows infrared targets that are dispersed and difficult to identify with the naked eye. The energy distribution can be approximated as a two-dimensional Gaussian distribution. For the small-target detection task in computer vision, due to the smaller size and weaker energy intensity, the general target-detection network model based on deep learning cannot be directly applied. Relevant research [36] indicates that when the depth of the target-detection network is too deep, dim and small targets often lose high-level semantic information, resulting in missed detections. Conversely, if the depth of the target-detection network is too shallow, it is difficult to fully extract high-level semantic features of dim and small targets, leading to an increase in false detections. Therefore, we believe that selecting the appropriate depth for the target-detection network is crucial to achieving better results of dim and small infrared targets. By maximizing the high-level semantic information of targets within the limited number of network layers, we can fully extract the potential features of dim and small infrared targets.
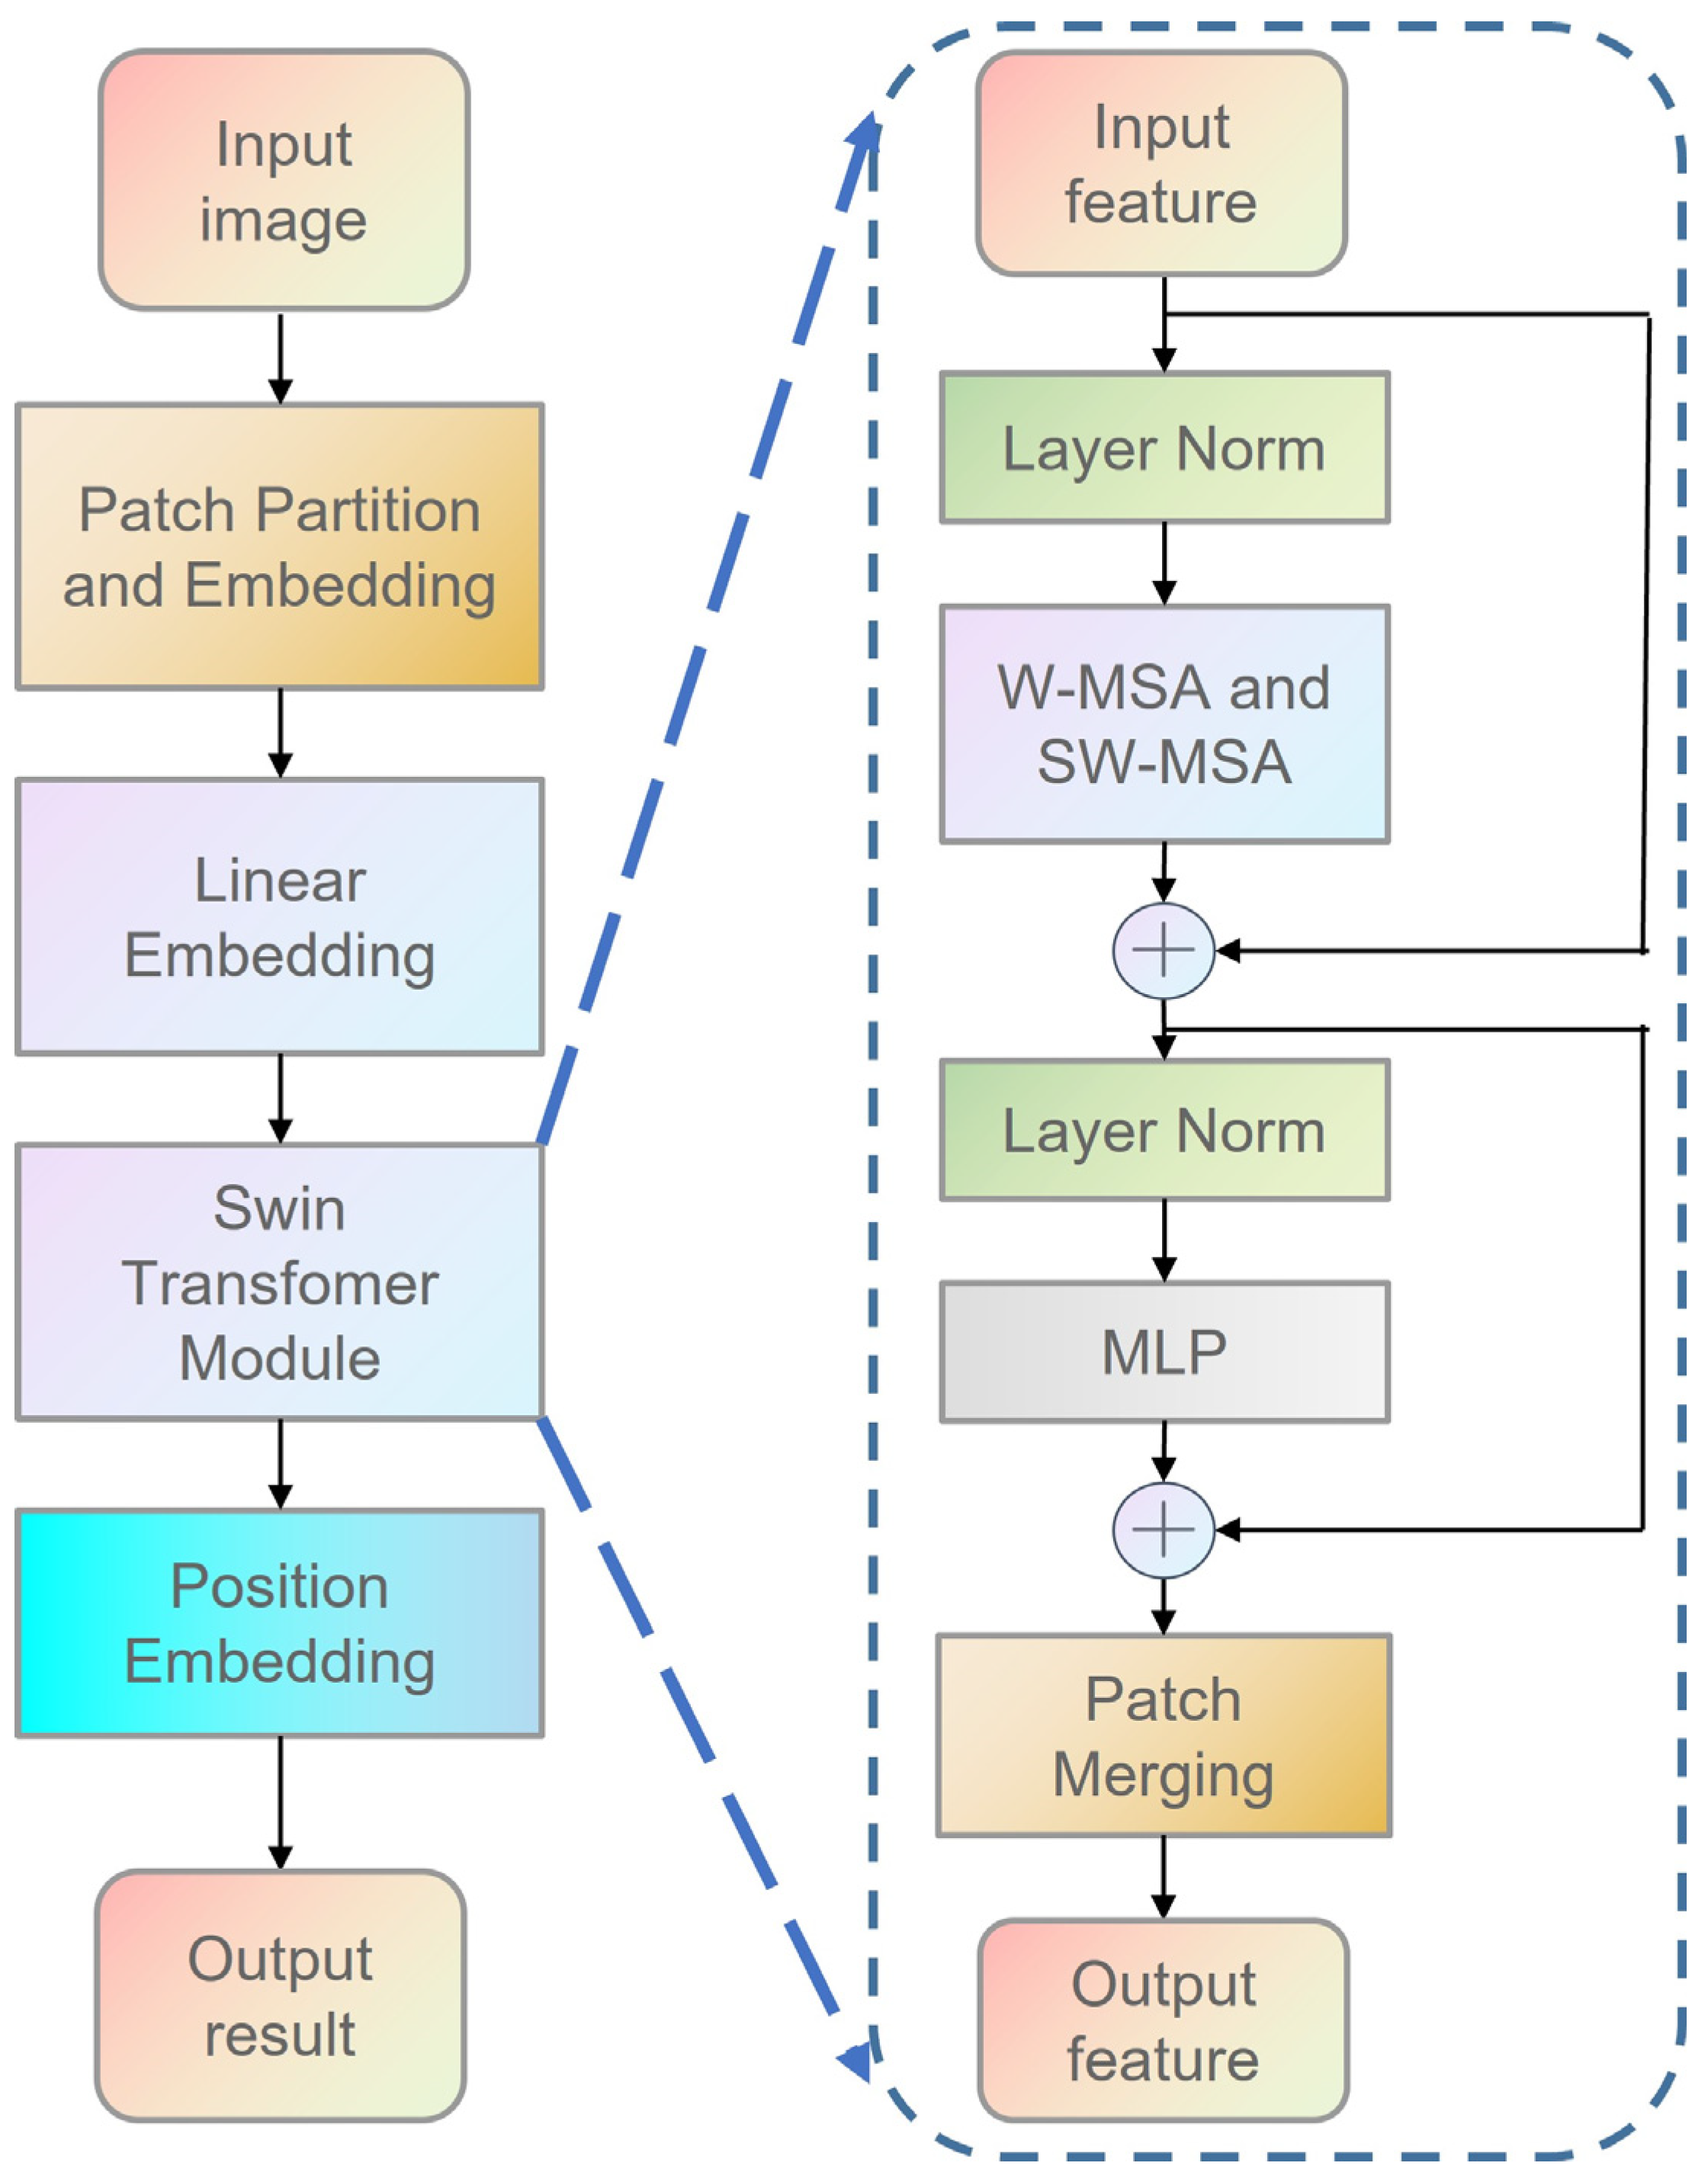
In addition, we also found that the existing deep learning training network for infrared dim- and small-target detection, as described in the literature [37], basically achieves the target feature extraction, fusion, and final detection process through a full convolution operation. Considering the efficiency of model training optimization, the convolution kernel size designed in the model is usually very limited [38]. Therefore, the above model often leads to a smaller receptive field for a target at the same scale, which is not conducive to the extraction of the global semantic information of the target, and reduces the accuracy of target detection. To expand the receptive field of a target within the constraints of limited network depth, we propose incorporating the transformer attention mechanism, which is widely used in NLP and CV, into the network structure. Additionally, we suggest replacing the traditional depth convolution module with the improved Swin Transformer module [39], which utilizes a variable moving window to extract and fuse multi-scale features of the input image while enabling information interaction between image blocks. This approach allows us to obtain target feature information within a larger receptive field. The specific structure of the Swin Transformer is shown in Figure 2.
As previously stated, a challenge in the application of infrared small target detection is that the number of infrared target samples that can be used for network model training is often limited due to the high cost of experimental testing, which leads to the problem of over-fitting in the training of conventional deep learning networks and poor generalization ability. To address this issue, this paper proposes two technical solutions: (1) To enhance the generalization ability of the model and reduce its dependence on sample data, we embed the spatial distribution characteristics of dim and small infrared targets into the depth network structure as prior knowledge for guidance and constraint. (2) During the training stage, we enhance the original sample data using the slicing-aided enhancement and inference method, based on SAHI, to increase the training sample size, and the final detection result is obtained after filtering in the inference stage. The next section will provide a detailed introduction to the two technical methods mentioned above.
3.2. The Proposed Network Structure
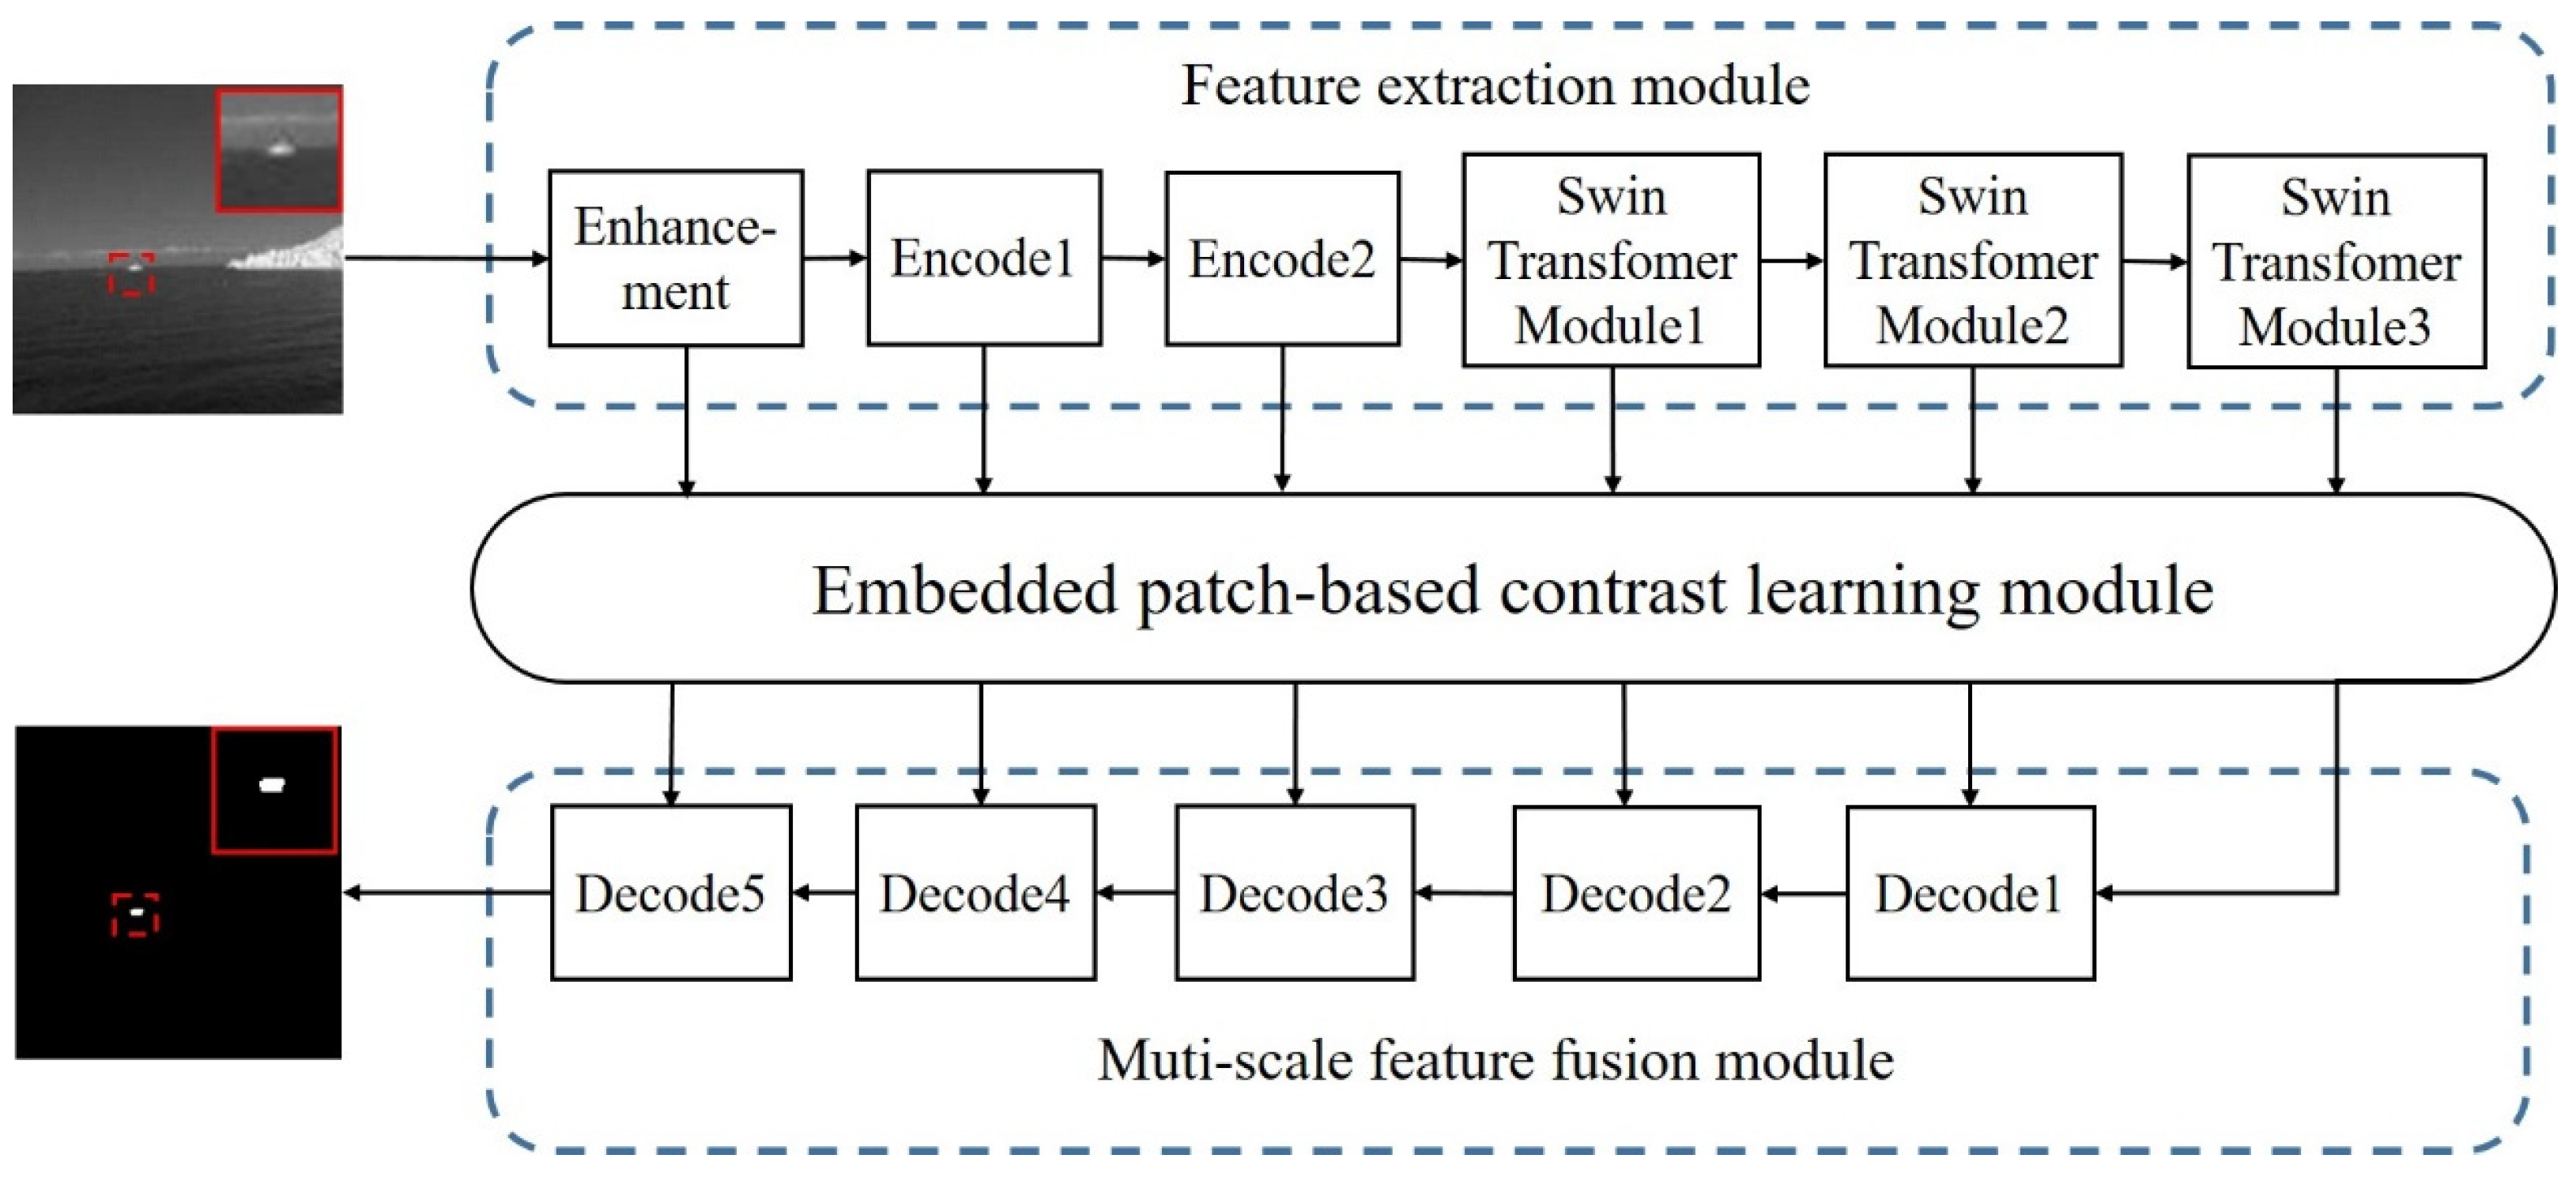
As described in the previous section, this paper uses the Swin Transformer module to replace the traditional convolution kernel feature extraction operation and integrates it as the backbone structure of infrared dim and small target feature extraction into an encoder–decoder network architecture while embedding the spatial distribution of dim, small infrared targets into the network structure as a guidance and constraint module. Finally, a multi-scale infrared dim- and small-target feature extraction network using knowledge and a data-driven network is designed and implemented. USES-Net can effectively extract intrinsic features of small infrared targets at various scales within a limited depth. Additionally, to address the lack of strong semantic context-related information for dim, small infrared targets, this paper proposes a bottom-up cross-layer feature fusion module called AFM. This module can integrate features of dim, small infrared targets at different scales more effectively, thereby improving the target prediction accuracy. Figure 3 and Table 1 below illustrate the USES-Net model’s framework and data flow, respectively, and the default image size is 256 × 256.
Figure 3 above illustrates that USES-Net comprises three main components: a feature extraction module, an embedded image block local contrast learning module, and a multi-scale feature fusion module. In the feature extraction module, the target of the input training sample data is first enhanced through slice-assisted enhancement technology. Then, the feature information of the input image is extracted layer by layer using the Swin Transformer module. Similar to the CNN model, the resolution of the feature map continuously decreases with the increase in network depth, and the number of feature channels increases layer by layer to obtain the multi-scale feature information of the target. Compared to convolution kernels, Swin Transformer has better feature extraction abilities for small infrared targets. It can fully extract the potential feature information of targets in a larger receptive field. A deeper network can provide better semantic features and an understanding of scene context, which helps to solve the ambiguity caused by target and background interference. Based on this approach, the initial target feature information for each scale is fed into an embedded local contrast learning module, known as EPCLM. This module incorporates the prior knowledge of the local spatial contrast of the target into the deep learning network structure, which can then refine and restrict the extracted target features, thereby enhancing the robustness and interpretability of the detection network. However, as the network deepens, there is an increasing risk of losing spatial details of the target. To address this issue, we designed and implemented a cross-layer feature fusion module called AFM in the multi-scale feature fusion module. This module serves as the decoder structure of the entire U-shaped network structure. It re-fuses the target feature information obtained at each scale and predicts the output of the fused feature map after passing through the final classifier. Finally, we utilize slice-assisted inference technology to continuously update and optimize the model parameters through the error reverse transmission process of the network model based on the sample label and model output results. This process continues until the final trained target detection model converges.
3.2.1. Feature Extraction Module
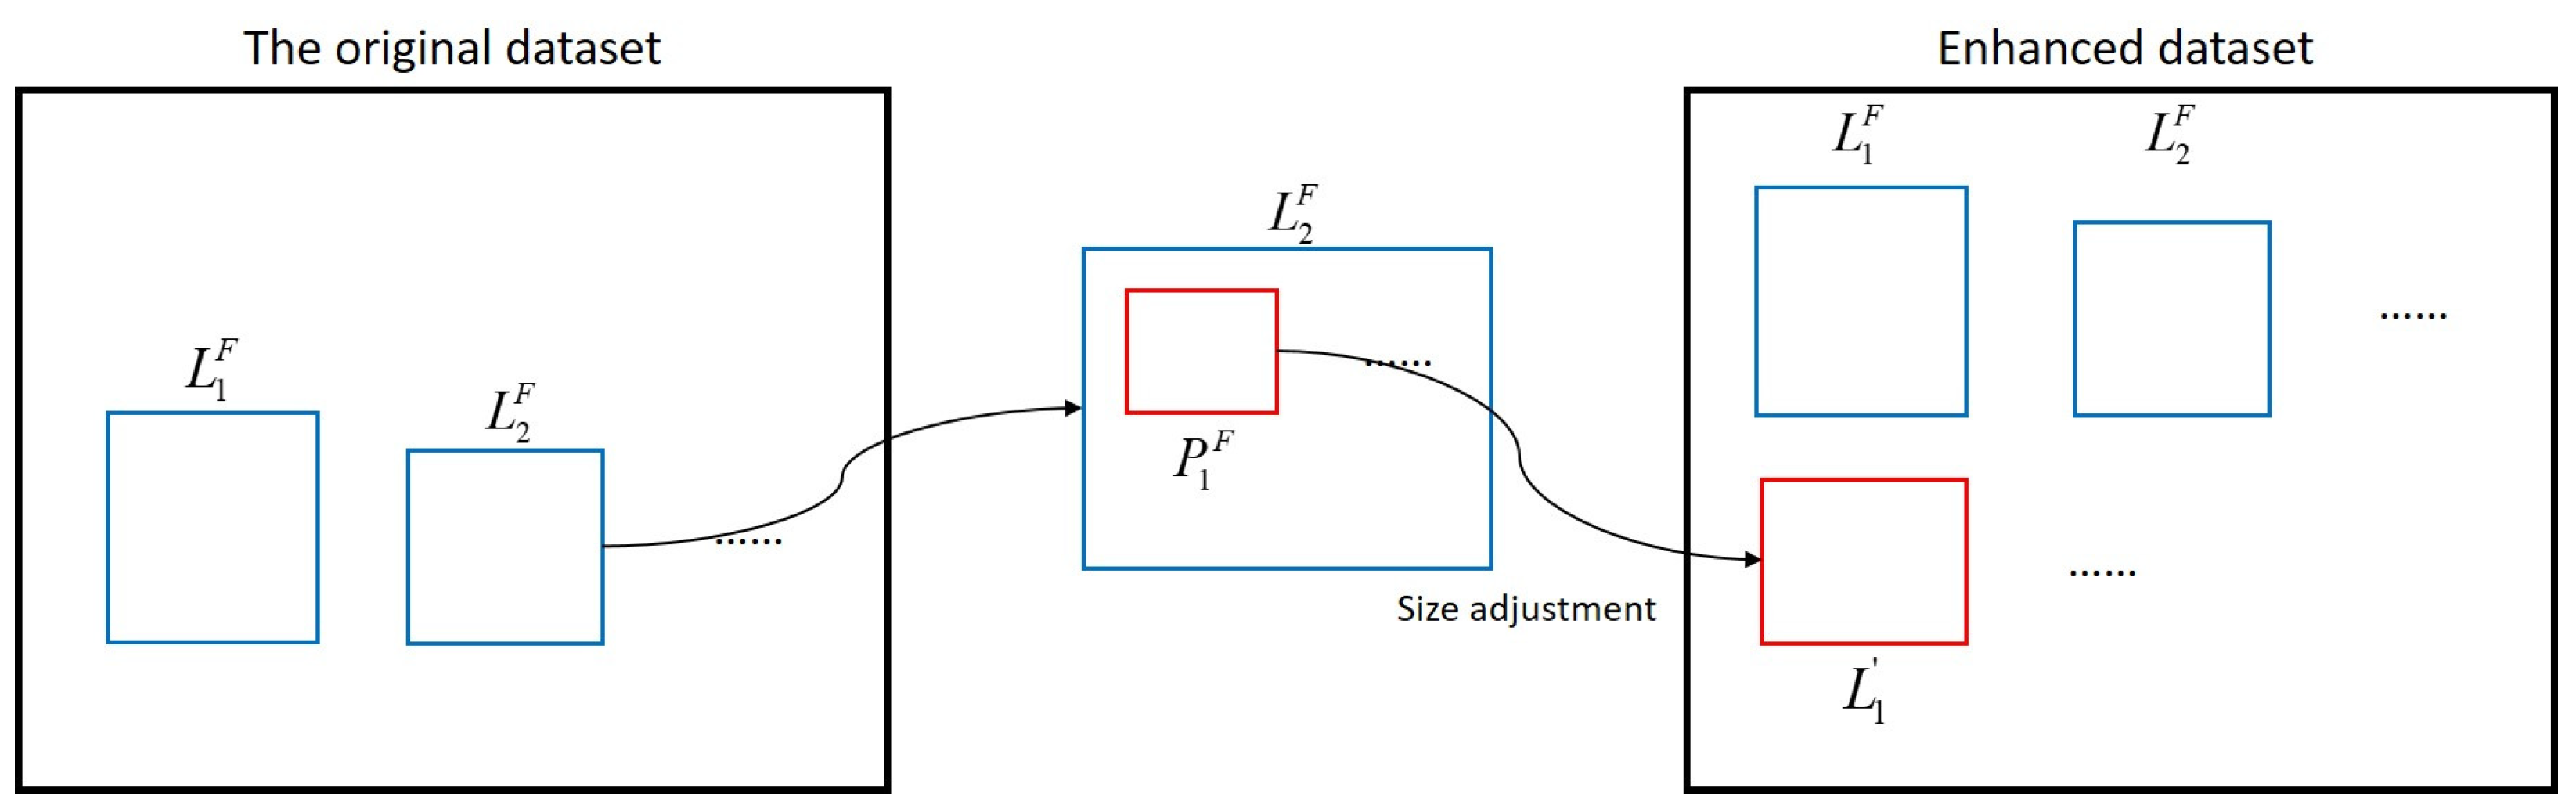
The feature extraction module begins by using the data enhancement method based on SAHI technology [34] to select original sample images from the dataset. Next, image blocks are extracted from the original sample images, and the local details in the image blocks are enlarged to generate new sample images. These new sample images are then added to the dataset, effectively expanding the number of images of dim, small infrared targets. The specific process is shown in Figure 4 below.
In Figure 4 above, each data sample () in the original dataset is divided into overlapping image blocks (), and the size of each image block is chosen from the range [Mmin; Mmax] and [Nmin; Nmax], where M and N are adjustable hyperparameters. During model training, the size of each segmented image block is adjusted by fixing the length–width ratio of block P. This ensures that the block is scaled back to the same size as the original sample data, resulting in new enhanced sample data (). The model’s parameter optimization process involves both the enhanced and original sample data to increase the sample size and improve performance.
After improving the sample data, the next step is to extract information on dim and small infrared targets at different scales. This can be achieved using the two encoding modules and the three Swin Transformer modules. The encoding modules utilize a conventional 3 × 3 convolution kernel to rapidly decompose the input image at a small scale and increase the number of channels in the feature image. Additionally, the convolution calculation can smooth the noise in the input image to some extent, reducing the risk of small infrared targets being submerged in the background when input to the Swin Transformers. On the other hand, the Swin Transformer modules perform in-depth feature extraction on the input image to extract semantic features of dim and small infrared targets at large scales. This paper outlines the main steps of feature extraction using a Swin Transformer for feature map I with an input size of M × N and C channels as follows:
- (1)
- First, a layer norm (LN) operation is performed on input feature map I, and the data are standardized in the channel dimension. The output result is ILN. The corresponding formula is
- (2)
- For feature map ILN, after layer regularization, the feature weight based on the multi-head self-attention (MSA) mechanism is calculated to obtain IAttention. The corresponding formula is
The MSA calculation involves three weight matrices: , , and . These matrices are consistent with the size of input feature map . The calculation methods for each matrix are as follows:
The formulas above use the shared weight matrices , , and , which are parameters that can be learned and vary under different local windows. After calculating the weight matrices for , , and , can be determined using the attention mechanism of the transformer as follows:
The formula above uses d to represent the size of the input feature and b as a position coding parameter that can be learned.
- (3)
- To obtain the intermediate feature (F), the original input feature map (I) is connected with the IAttention value calculated via MSA in its residual form, and the corresponding formula is
- (4)
- To obtain the output (S), the intermediate feature (F) is regularized using a layer norm (LN) operation and adjusted with a multilayer perceptron (MLP). The adjusted result is then connected with F through the residual network. The corresponding formula is
- (5)
- Finally, the output result (S) is subjected to image block merging operations, which reduce its size by half and double its number of channels. This is achieved through image block stitching, layer regularization, and channel linear mapping operations. The final output feature map (Z) has a size of and a number of channels of 2C.
Based on the calculation process described above, the output feature map (Z) will have a reduced size and an increased number of channels after passing through three Swin Transformer modules. Table 1 shows the specific shape changes. Thus, the extraction of infrared dim- and small-target feature maps on a large scale is complete. This is helpful for the further exploration of global semantic information related to targets.
3.2.2. Local Contrast Learning Module
To introduce the concept of traditional local contrast feature extraction into the training network model and guide the training optimization direction of the constraint model more pertinently, this paper implements an embedded patch-based contrast learning module (EPCLM) based on the PCM method [17] and other related research [28,40]. The EPCLM can further choose the extracted target features based on the idea of PCM, which combines the spatial distribution prior of the target with the deep learning model architecture, forming a composite infrared dim- and small-target detection network based on both knowledge and data-driven approaches. This approach is more targeted, which can further extract the deep semantic information from infrared dim and small targets, and has good interpretability. Figure 5 below shows a structural relationship diagram for the PCM and EPCLM.
As shown in Figure 5, the traditional PCM method compares the contrast difference between the central target point and the surrounding neighborhood pixels. It traverses the entire image using a local sliding window to find the area with the largest contrast difference between the central target and the surrounding pixels. Finally, it locks the position of the target point to be detected. The spatial calculation process described above can be replaced by dilated convolution. By setting different dilation coefficients, the PCM method’s local contrast calculation process can be embedded into the end-to-end training network structure. This integration achieves the effect of incorporating the prior knowledge distribution of the target in the deep learning network model. For any feature map (Z) extracted in Section 3.2.1, its channel number and size are C, H, and W, respectively. Given the position of any point and the dilation coefficient (d), the local contrast difference in each direction of the PCM can be written as follows:
where is the local contrast change in each direction and is the index in four directions. That is, . According to the PCM theory, a smaller value of results in a greater contrast between the pixels representing the center point and a certain direction in the neighborhood, thereby increasing the probability of the center point being the target. Therefore, the PCM characteristics of any center point can be expressed as follows:
When calculating , the dilation coefficient (d) is typically taken as a fixed value to simplify the calculation process and reduce the number of calculations. It is generally set as d = 3. The calculation process for Equations (7) and (8) can be achieved through two separate convolution operations. The first step involves using a conventional 3 × 3 convolution kernel with a stride of 1 to perform a convolution operation on the feature map. This operation approximates the smoothing process of the PCM for each region block, eliminating some of the noise in the image. In the second step, a dilated convolution with a size of 3 × 3 and a dilation coefficient of 3 is used to further process the smoothed feature map. This process can approximate the metric method in the PCM by calculating the grayscale difference value between the target region and the neighboring region, and it plays a further role in extracting target features.
3.2.3. Multi-Scale Feature Fusion Module
After passing through the feature extraction and local contrast learning modules, the training network has acquired the target feature information of the input small and dim infrared target at different scales. At the decoder of the network model, a cross-layer feature fusion module (AFM) is designed and implemented to integrate feature information at various scales and prevent the loss of target feature information as the number of network layers increases. The AFM module can organically integrate target feature information at various scales and can predict the output of the final classifier. The specific structure of the AFM module is shown in Figure 6 below.
Figure 6 above shows the local contrast features obtained at different scales during the encoding process. The high-level feature is denoted as , the low-level feature is denoted as , and the feature fusion result is denoted as T. The decoding calculation process based on the AFM module can be expressed as follows:
where PWConv is a pointwise convolution operation, Up is an upsampling operation, Sig is a sigmoid activation function, ⊕ represents a pointwise addition operation for feature maps with the same channel, and ⊗ represents a pointwise multiplication operation for feature maps with the same channel.
It can be seen that, when the AFM module performs multi-scale feature fusion, it first upsamples and then adjusts its feature channel count through pointwise convolution operations. On the other hand, is divided into two paths, one of which also performs a pointwise convolutional operation to adjust the channel number to be consistent with and then uses the sigmoid activation function for normalization. After that, it is multiplied by after upsampling and pointwise convolution as a weight coefficient, and finally, the result is added to the original to obtain the feature fusion result (T). The AFM module serves as the decoder structure for the infrared dim- and small-target detection network. It can repeatedly embed the low-level local spatial information of the target into the high-level global semantic information during network decoding. This allows for the embedding of smaller-scale detailed features into the high-level coarse feature map, allowing the detection network to dynamically perceive the subtle details of dim, small infrared targets.
3.2.4. Loss Function and Slicing-Aided Inference
In the task of infrared dim and small target detection, there is a significant imbalance between positive and negative samples. Therefore, simply using the loss function of traditional target detection algorithms, such as cross entropy (CE) and MSE, often results in a small value for the loss function, making it difficult to update the weight coefficients of the network model. In order to better handle the class imbalance between dim, small infrared targets and the background, this paper constructs a loss function based on the Soft-IoU metric to handle this highly imbalanced segmentation task. The corresponding formula for Soft-IoU is the following:
where (i, j) represents any coordinate position in the corresponding image, p represents the final prediction result of the trained network model, and m represents the label of the corresponding sample image. During training, it is desirable to have a larger Soft-IoU value. To ensure a unified optimization form, the loss function expression is defined as follows:
where f is the target loss function, whose value will be continuously optimized during the training process and will eventually converge to 0. The parameters of the network model will also be updated throughout the training process to ensure better detection and segmentation results.
Additionally, to further enhance the accuracy of the detection and recognition abilities of the trained model, this paper also introduces slicing-aided inference during the model inference stage [34]. When testing the trained model, the infrared image is first segmented into multiple image blocks. These blocks are then predicted separately to obtain multiple target prediction results. Finally, the non-maximum suppression (NMS) strategy is used to uniformly screen the multiple target prediction results and retain the most likely one. The specific process is shown in Figure 7 below.
According to Figure 7, first, the image to be detected is segmented into several image blocks (). Then, the size of each block is adjusted to maintain a fixed aspect ratio and scaling proportional to the original image. Next, the trained network model is used to detect targets in each block, resulting in predictions for targets at multiple locations. Finally, the NMS strategy is used to post-process the results and filter target predictions at overlapping locations. This retains only the most likely prediction result at a given location, improving the final effect of target detection.
To summarize this process, Algorithm 1 below shows the algorithm flow of the USES-Net model during both training and testing.
| Algorithm 1. The work process of USES-Net |
| USES-Net Training and Testing (One Image as a Batch) |
| The Training Process: 1. Initialize: Input the infrared image I, label m, set the learning rate , model detection function (Including encode convolution , decode convolution , Swin-Transformer fitting function and EPCLM fitting function ). 2. Step 1: Perform slicing-aided enhancement on training set to enhance the images and extract different hierarchical feature maps from to on I. 3. 4. Step 2: Perform EPCLM operation on features maps to calculate embedded patch-based local contrast feature maps from to . 5. 6. Step 3: Perform AFM operation on sequentially from top to bottom according to Equation (9), and output a multi-scale contrast feature fusion map . 7. Step 4: Perform on and output the predicted mask through sigmoid activation function. 8. 9. Step 5: Calculate the loss value with and according to Equation (11) 10. Step 6: Iteratively update the model detection function according to the gradient descent. 11. |
| 12. Return the final parameters of . The Testing Process: |
| 1. Step 1: Input the test infrared image set , perform slicing-aided hyper inference on to divide it into some overlapping patches . 2. Step 2: Resize each patch while preserving the aspect ratio, and then apply the detection model from the training process independently to each overlapping patch. 3. Step 3: Merge the overlapping predictions and full hyper inference results into original size using NMS. According to Equation (10), pixels having a higher Soft-IoU ratio than a predefined matching threshold are matched, and for each match, while detections with a detection probability lower than the threshold are removed. 4. Step 4: Finally, output the infrared small target results. |
4. Experimental Analysis
4.1. Dataset Description
To assess the performance of the USES-Net model for infrared small-target detection, we used the NUAA-SIRST, NUDT-SIRST, and IRSTD-1K [29] datasets for training and testing. Each dataset is described below.
NUAA-SIRST: This dataset is designed for detecting small targets in single-frame infrared images. It includes 427 representative images from various real-world scenarios and 480 instances of different scenarios selected from hundreds of different infrared sequences in remote sensing scenarios. This dataset is particularly useful for detecting dim, small infrared targets that are often buried within complex backgrounds with severe clutter. It is worth noting that only 35% of the targets in this dataset contain the brightest pixels in the images.
NUDT-SIRST: This is a synthetic infrared dataset containing 1327 images with a resolution of 256 × 256. Compared to an actual dataset, synthetic datasets have three outstanding advantages: accurate labeling, low cost, and rich target-scene types.
IRSTD-1K: This dataset comprises 1001 manually labeled real-world infrared scene images with various target shapes, sizes, and cluttered backgrounds from different scenes. It is the largest real-world infrared small-target detection dataset, and it provides a comprehensive evaluation for infrared small-target detection algorithms.
4.2. Experimental Setup
In this paper, the overall experimental setup is shown in Table 2 below. The experimental environment for the algorithm was Ubuntu 20.04. The PyTorch framework was used, and the GPU was an NVIDIA GeForce GTX 3080 Ti 12G. The Adam optimizer was used to train the model, with an initial learning rate of 1 × 10⁻³, a batch size of 16, and a training epoch of 400. For ease of comparison, the training image size was uniformly fixed at a resolution of 256 × 256. For data augmentation, this paper utilized the SAHI technique, as well as flip transformation, contrast adjustment, aspect ratio distortion, and Gaussian noise addition, to improve the generalization of the training samples.
Because this paper employed a target-segmentation-based approach to predict the locations of dim and small infrared targets, to ensure an objective evaluation of the network model’s performance, four commonly used metrics for target segmentation evaluation were selected: pixel accuracy (PA), mean intersection over union (mIOU), detection rate (Pd), and false-alarm rate (Fa). The expressions used to calculate these metrics are provided below:
where Equations (12) and (13) define k as the number of pixels in each category, i as the true value, and j as the predicted value; represents the correctly predicted pixels, while and represent the incorrectly predicted pixels. Equation (14) defines TP as the number of correctly detected targets, FP as the number of undetected targets, and TN as the number of correctly detected non-targets. To enable quantitative evaluation and comparison using the same parameters, the threshold values of the four metrics were set to 0.5.
4.3. Comparison with Some State-of-the-Art Methods on the NUAA-SIRST Dataset
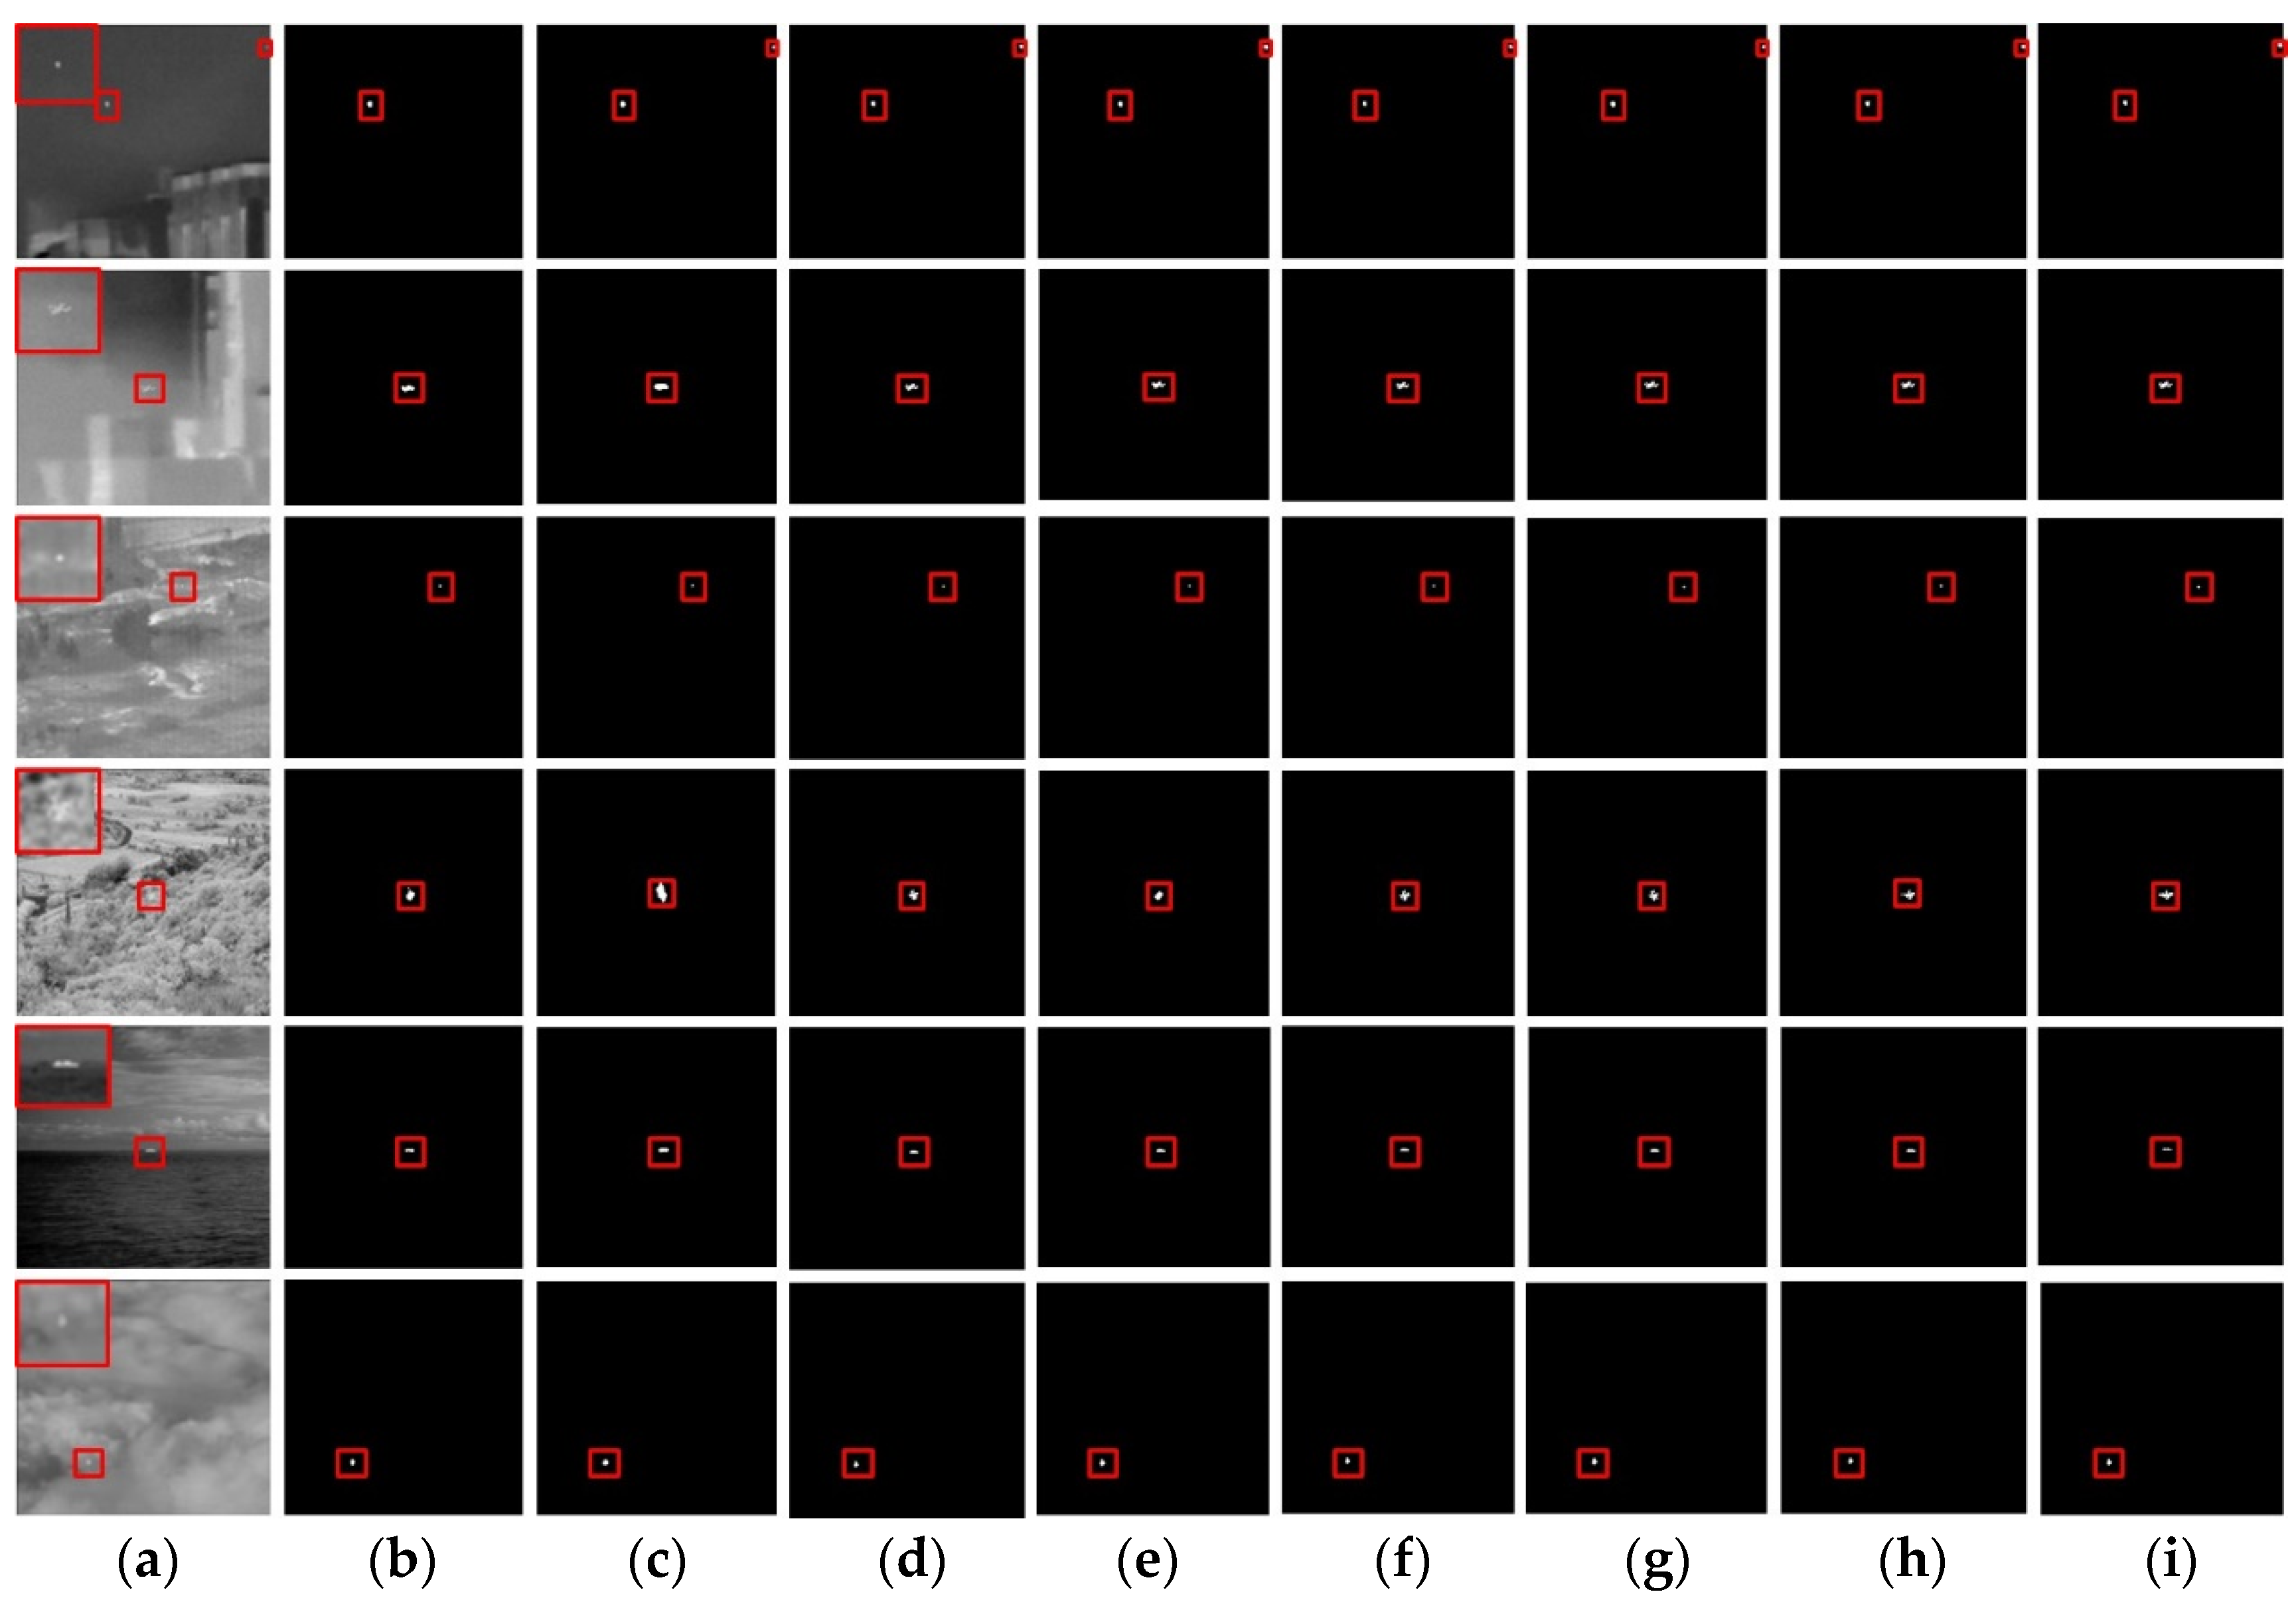
When training and testing using the NUAA-SIRST dataset, the dataset was first divided into two equal parts, where 213 groups of images were used for training and 214 images were used for testing. Then, this paper’s algorithm and seven other comparative algorithms were evaluated using the PA, mIOU, Pd, and Fa indexes. The seven selected comparative algorithms were the typical and latest infrared dim target detection methods, including ACM [6], ALCNet [28], ISNet [29], RDIAN [31], DNA-Net [30], ISTDU-Net [32], and UIU-Net [33]. The target detection and segmentation results are shown below.
Figure 8 above displays six sets of test images selected for algorithm testing. It is evident that some conventional convolutional neural network models, such as ACM, ISNet, RDIAN, and UIU-Net, produced significant false positives or false negatives in the detection results. This could decrease the detection accuracy and increase the false-alarm rate. For deep learning training networks such as ALC-Net and DNA-Net, the final detection results showed few false positives or false negatives. However, the detection and segmentation results of the targets were not precise enough due to interference from image noise or background highlights. This could cause some local parts of the targets on the segmentation map to be fragmented or incomplete. In comparison, the results of USES-Net demonstrate that the proposed method accurately reflected the overall dispersion characteristics of the dim, small infrared targets. The detection and segmentation targets were more comprehensive and continuous. Further, the performance indicators for each type of detection in the figure above were calculated using Equations (12)–(14), and the average of the results for all test sets was obtained. The evaluation results for the performance indicators are presented in Table 3 below, where the red boxes are the region of the dim small targets.
Table 3 above shows that, compared to the other methods, the proposed USES-Net model achieved better results for the various performance indicators, especially the three indicators of PA, Pd, and Fa. Specifically, the PA index improved by 19.5% (from 0.755 to 0.902), the Pd index improved by 10.8% (from 0.871 to 0.965), and the Fa index improved by 87.2% (from 6.798 × 10⁻⁵ to 8.724 × 10⁻⁶). Although USES-Net was not the best in terms of mIOU, its results were still superior to most other methods, which illustrates the superior performance of this method on the NUAA-SIRST dataset.
4.4. Comparison with Some State-of-the-Art Methods on the NUDT-SIRST Dataset
Similarly, when training and testing using the NUDT-SIRST dataset, the entire dataset was divided equally into a training set and a test set. The training set contained 663 images, and the test set contained 664 images. The proposed method and the seven previously compared methods were evaluated using the PA, mIOU, Pd, and Fa metrics. The resulting target detection and segmentation results are shown below.
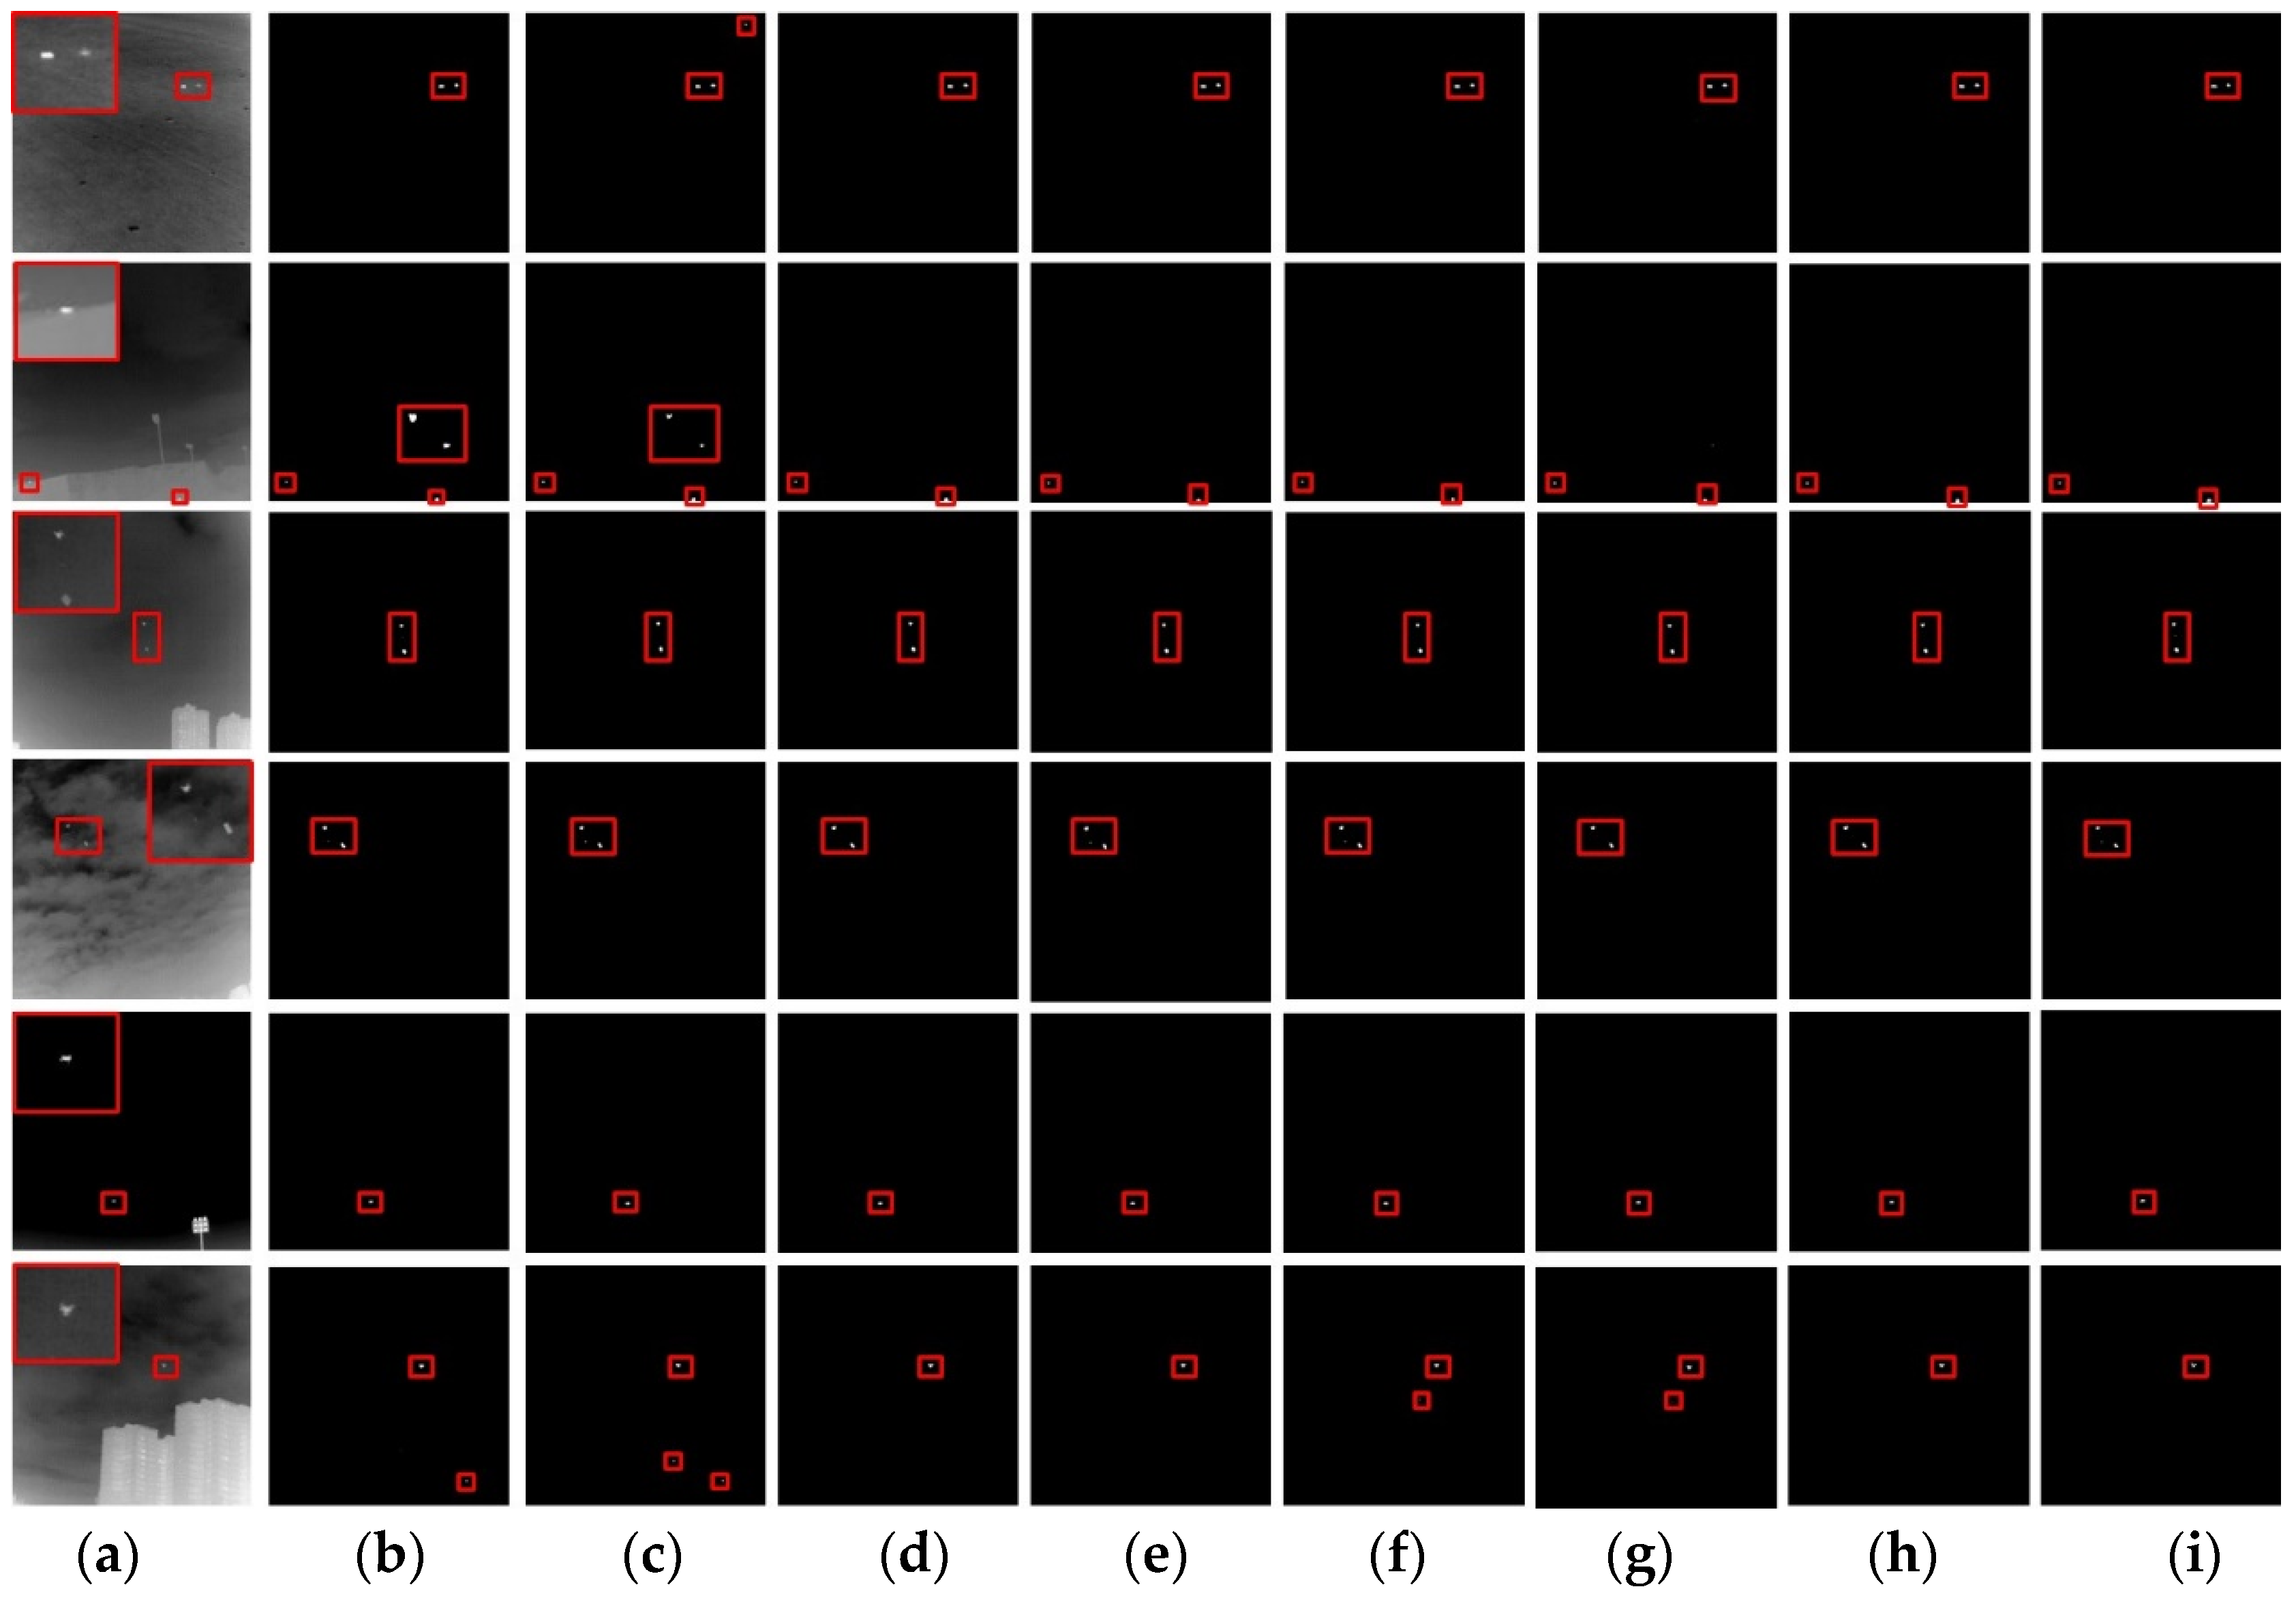
Figure 9 shows six different sets of scene images selected for algorithm testing. The segmentation results show the false positives and false negatives in the detection results for ACM, RDIAN, and UIU-Net, which could reduce detection accuracy and increase the false-alarm rate. For network structures such as ALC-Net, DNA-Net, and ISTDU-Net, the detection results were relatively complete, but careful observation revealed that parts of the results were still fragmented and incomplete. However, the USES-Net model proposed in this paper could fully capture the overall distribution characteristics of the small and dim infrared targets in different scenes, and the segmentation results were more complete and continuous.
In the same way, the performance indicators for each type of detection in Figure 9 could be calculated using Equations (12)–(14), and the average of the results for all test sets was obtained. The evaluation results for the performance indicators are presented in Table 4 below.
In Table 4, it can be seen that, compared with the other methods, the USES-Net model designed in this paper also achieved good results for the various performance indicators, especially the three indicators of PA, mIOU, and Fa. Specifically, it achieved a maximum improvement of 12.4% (from 0.864 to 0.971) for the PA indicator, a maximum improvement of 55.2% (from 0.611 to 0.948) for the mIOU indicator, and an increase of more than one order of magnitude (from 2.859 × 10⁻⁵ to 2.146 × 10⁻⁶) for the Fa indicator. Although USES-Net did not achieve the highest value for the Pd indicator, it still performed well, with a score above 0.99. This was better than most of the other methods, indicating its superior performance on the NUDT-SIRST dataset.
4.5. Comparison with Some State-of-the-Art Methods on the IRSTD-1K Dataset
The IRSTD-1K dataset has a larger data capacity, consisting of 1001 images. To enhance the effectiveness of model training, the dataset was divided into a training set and a testing set in an 8:2 ratio, with 800 training images and 201 testing images. The proposed method and the seven other comparative methods were evaluated using four indicators: PA, mIOU, Pd, and Fa. The results of target detection and segmentation can be seen in Figure 10 below.
Figure 10 shows six sets of infrared dim- and small-target images with different scenes that were selected for testing. The segmentation results suggest that some methods, such as ACM, ALC-Net, ISTDU-Net, and RDIAN, had obvious false detection phenomena in the detection results. These algorithms mistakenly identified light signs and streetlamps in the images as targets, which reduced the detection accuracy and increased the false-alarm rate. Other methods, such as DNA-Net, IS-Net, and UIU-Net, had no obvious false detection or missing detection phenomena in their detection results, but careful observation revealed that the target detection and segmentation results were still not precise enough. Some small target segmentation results were incomplete and failed to accurately represent the original shape characteristics. The USES-Net model proposed in this paper could more accurately and completely distinguish the shape characteristics of dim, small infrared targets in different scenes from the comparison results, and the detection and segmentation content was more complete and continuous.
Additionally, the performance indicators for each type of detection could be calculated using Equations (12)–(14), and the average of the results for all test sets was obtained. The evaluation results for the performance indicators are presented in Table 5 below.
Table 5 above shows that the USES-Net model designed in this paper achieved the best results for the various performance indicators compared to the other methods. Specifically, it improved the PA indicator by up to 18.8% (from 0.735 to 0.873), it improved the mIOU indicator by up to 19.1% (from 0.581 to 0.692), it improved the Pd indicator by up to 9.1% (from 0.872 to 0.951), and it improved the Fa indicator by up to 84.5% (from 7.411 × 10⁻⁵ to 1.148 × 10⁻⁵). Therefore, this method demonstrated better accuracy and performance on the IRSTD-1K dataset.
4.6. Ablation Study
To further verify the effectiveness of the USES-Net model proposed in this paper, ablation experiments were designed, as shown in Table 6, Table 7 and Table 8. The experiments and comparisons were conducted on the respective effects of the Swin Transformer, the local contrast learning module (EPCLM), and the slice-assisted data augmentation and hyper inference (SAHI) in the USES-Net model. In addition, the same three datasets, NUAA-SIRST, NUDT-SIRST, and IRSTD-1K, were selected for testing. Table 6, Table 7 and Table 8 display the experimental results. ‘Y’ indicates that the current model includes the aforementioned modules or improved techniques, while ‘N’ indicates that the current model does not include them.
As shown in Table 6, Table 7 and Table 8, initially, USES-Net was comparable to a traditional UNet model in the absence of the Swin Transformer module, local contrast learning module (EPCLM), and slice-assisted data augmentation and hyper inference (SAHI). As a result, its performance indicators were limited. After introducing the Swin Transformer module, the self-attention mechanism enabled the generation of richer feature maps that contained dim, small target information in higher-level semantic features. This resulted in significant improvements in the PA and mIOU indicators, with average increases of 8.6% and 22.4%, respectively. Furthermore, after introducing the EPCLM module, the model used the prior knowledge as a constraint to more accurately extract the spatial distribution of the targets, resulting in further improvements in the model’s overall accuracy (Pd and Fa indicators). The average Pd value increased from 0.931 to 0.956, and the average Fa value decreased from 4.086 × 10⁻⁵ to 2.368 × 10⁻⁵. Finally, this method could be further enhanced with data augmentation and target selection through SAHI technology to improve the target detection capability of the entire model. As demonstrated in Exp 4, all indicators could achieve optimal results, proving that USES-Net could better detect and extract dim, small targets in infrared images.
4.7. Computational Efficiency Analysis
In addition to comparing the detection accuracy of the algorithm proposed in this paper, this section further analyzes the practical application potential of USET-Net using model parameter amount (unit million), algorithm complexity FLOPs (unit giga), and frame rate of model inference FPS as main indices. The computing efficiency of these algorithms on the same server platform equipped with GTX 3080TI is analyzed, and the results are presented in Table 9. As shown in the table, among these algorithms, it is observed that the ACM and ALC-Net models have smaller scales and complexities, which results in faster frame rates. In contrast, UIU-Net has a large parameter size and complexity, which led to the slowest inference speeds that could not meet real-time data processing requirements. However, the USET-Net proposed in this paper introduces a new Swin Transformer structure and an embedded patch-contrast learning module (EPCLM), while improving upon the ALC-Net network structure optimization. While the model’s parameters are more complex than those of ALC-Net, resulting in slower inference speeds compared to ACM and ALC-Net, it still achieves a frame rate of 60–70 FPS. This result is sufficient for real-time detection of infrared small targets, and it is faster than other reference methods. Therefore, it demonstrates its value by balancing algorithm accuracy with computing speed.
4.8. Error Diagnosis and Limitations
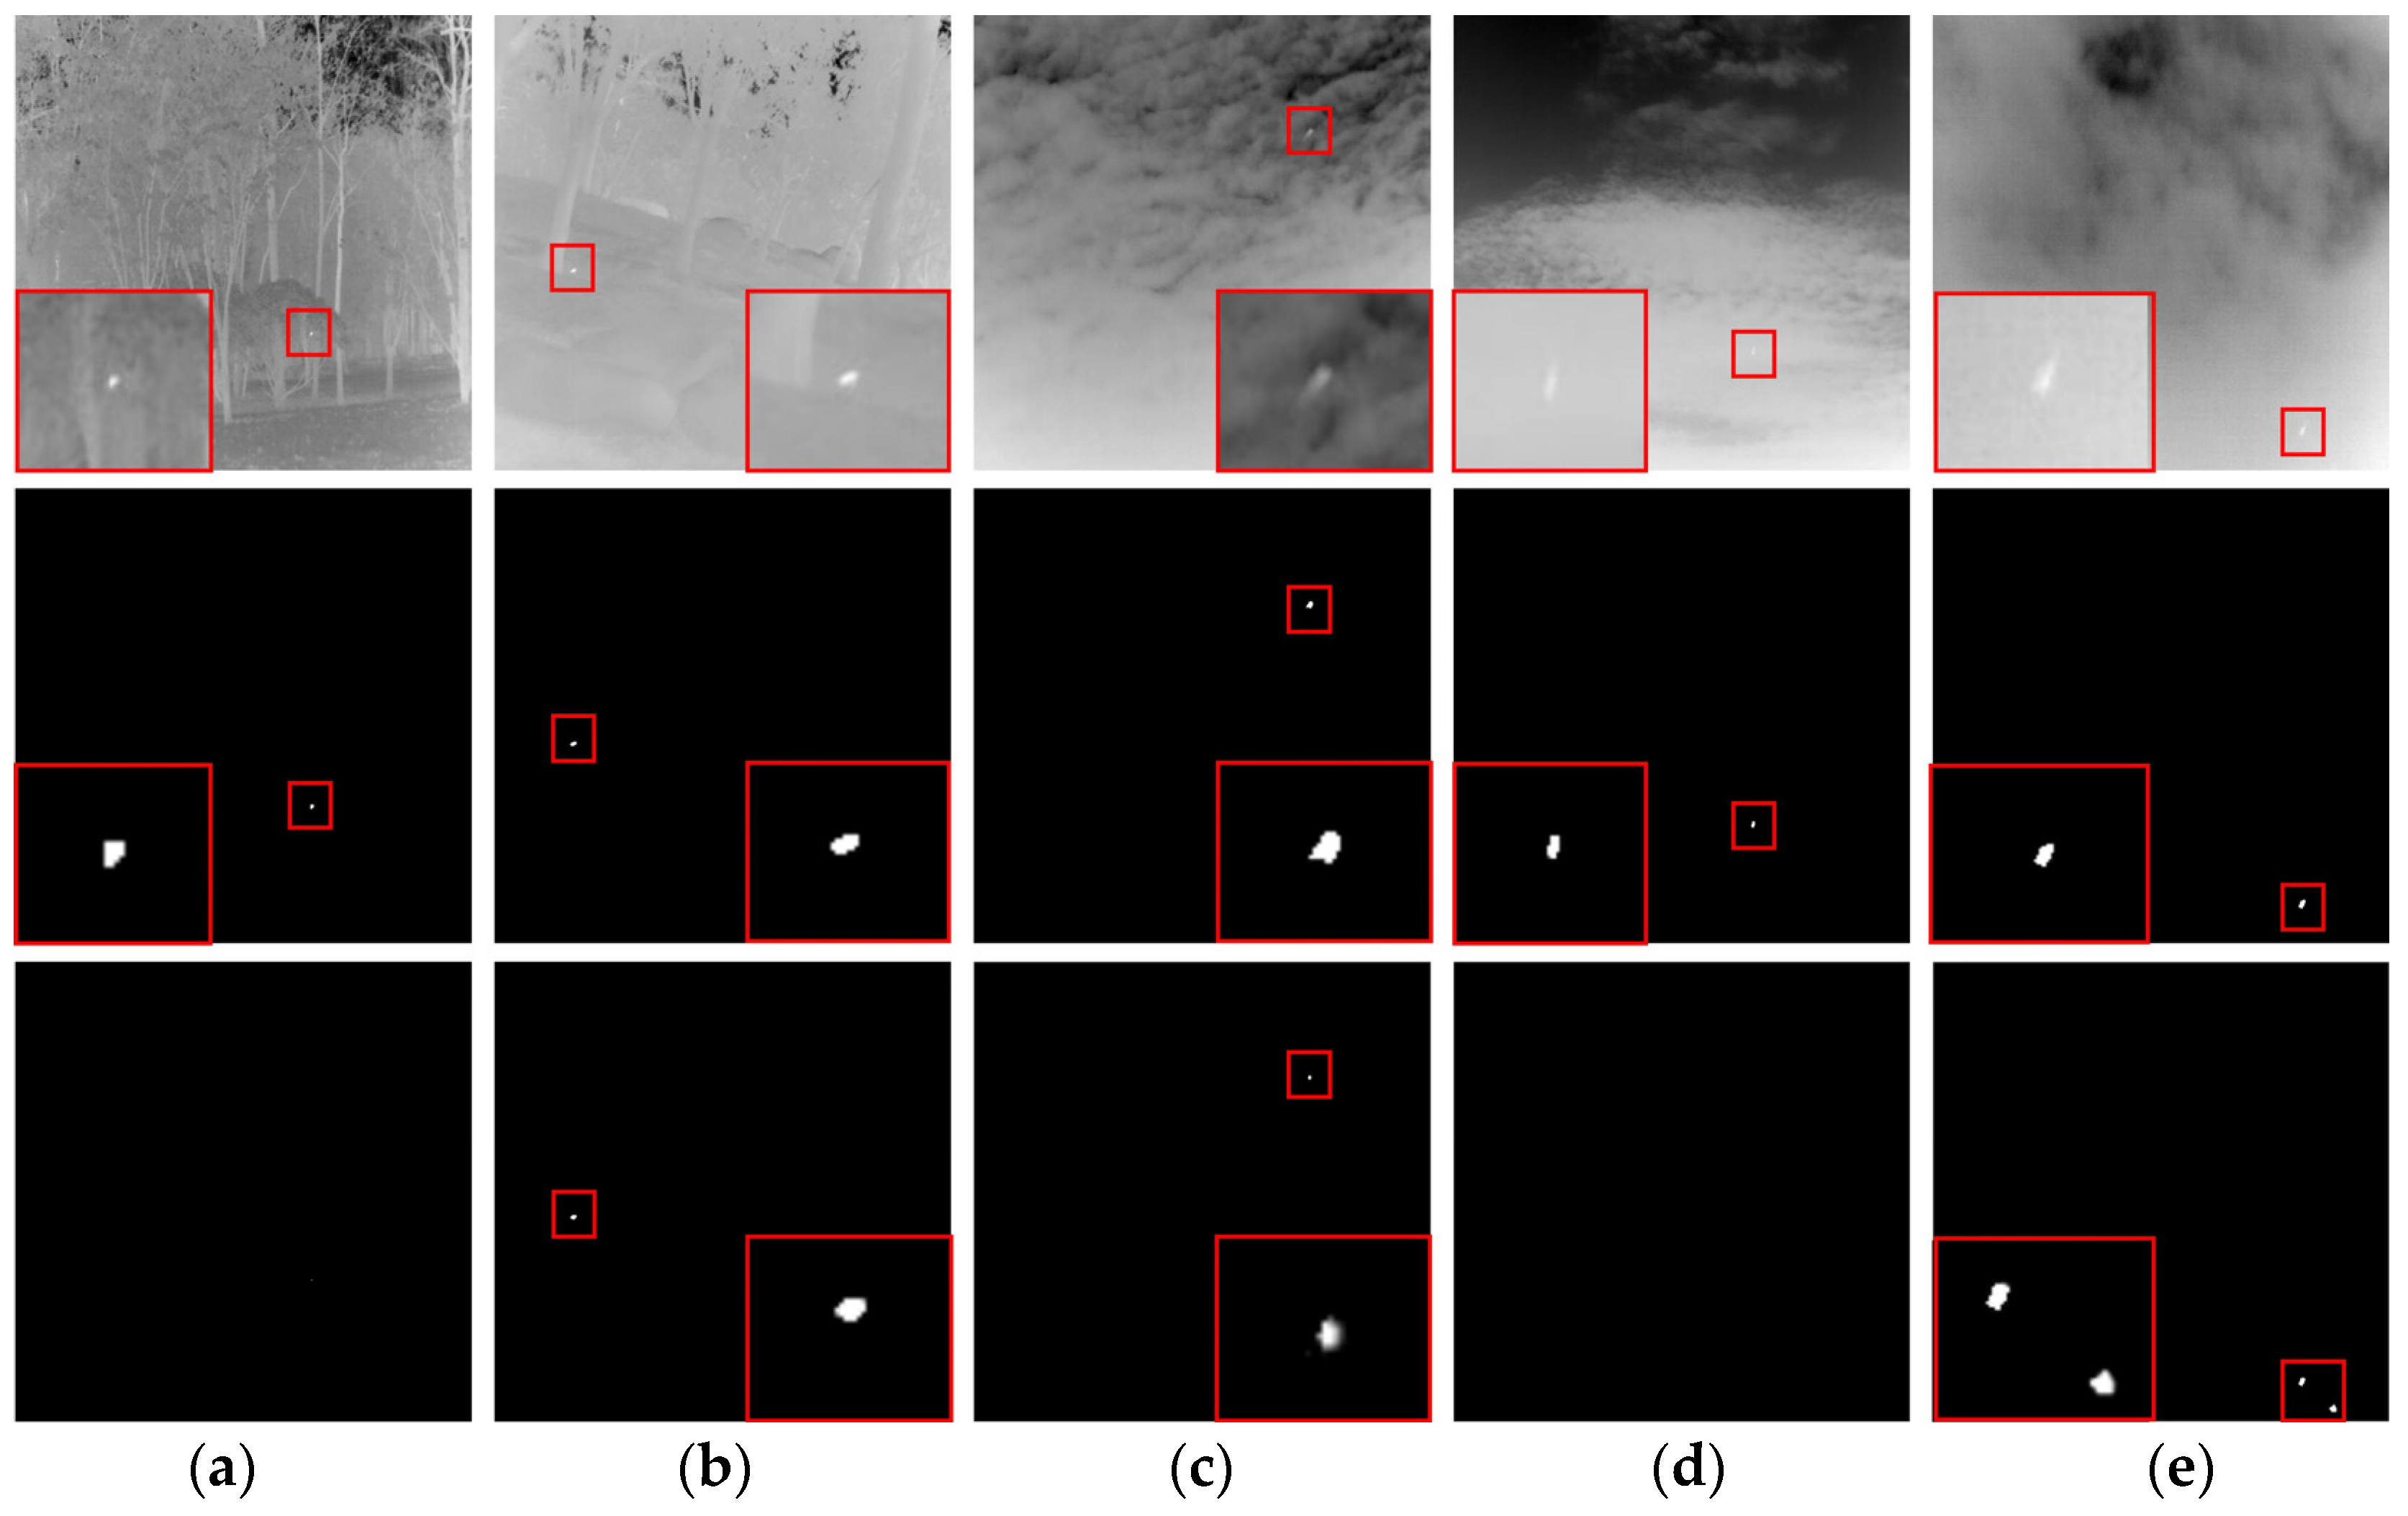
Although the USET-Net proposed in this paper achieves good results overall on various datasets, it may encounter issues, such as missed detection, virtual detection, and incomplete segmentation of infrared dim and small targets in specific scenarios. The images on which the proposed USET-Net cannot perform very well are shown in Figure 11 below. For Figure 11a,d, the USET-Net fails to detect the target due to a low signal-to-clutter ratio caused by minimal gray differences between the target and its surroundings. Additionally, smaller targets are assigned less weight in the loss function, which implies that boundary errors during training can have a greater impact on them. For Figure 11b,c, although USET-Net can detect the target, its segmentation results are noticeably impaired or absent when compared to the label masks. This is attributed to the incorrect classification of individual pixel positions along boundaries and the interference from background clutter, which in turn reduces IOU/nIOU indexes. For Figure 11e, the false detection results of USET-Net can be attributed to the target being positioned at the boundary with a highlighted background. This caused the USET-Net to mistake the highlighted background for other targets, resulting in a decrease in model accuracy. Finally, both Figure 11c,e exhibit diffuse energy distribution of the target and blurry imaging results, which further restricts USET-Net’s ability to detect targets accurately and precisely.
Furthermore, it is worth noting that the USET-Net model in this paper, similar to other reference methods, treats infrared dim- and small-target detection as a segmentation task. However, it should be acknowledged that detecting infrared dim and small targets through target segmentation often encounters inherent limitations. Due to the tiny size of the objects, the IoU threshold is frequently set much lower than the default value for conventional segmentation tasks. This can pose significant challenges in terms of duplicate object detection and introduce an alternative form of localization error. Therefore, the accurate description of the infrared small target is still an ongoing challenge, as it requires evaluation metrics that can effectively capture the real performance of target detection without being influenced by any boundary and background errors.
5. Conclusions
To enhance the accuracy of detecting and recognizing dim and small infrared targets, this paper proposes a new network model called USES-Net. Firstly, the traditional encoder–decoder network structure is improved, and a feature extraction module based on Swin Transformer is introduced to replace the ordinary convolution kernel, which can extract target features at different scales in a larger receptive field, and effectively retain the high-level semantic information of dim and small targets. Simultaneously, to fully utilize the inherent prior of infrared dim and small targets, a local contrastive learning module (EPCLM) is introduced, which embeds the spatial distribution of the target into the network as knowledge prior, forming a composite infrared dim- and small-target detection network driven by joint knowledge and data. The algorithm’s detection accuracy can be enhanced, making the model more pertinent and interpretable. Finally, this paper also utilizes a slice-assisted data augmentation and inference technique based on SAHI, which can further optimize and adjust the model in the training and testing process, respectively, ensuring that the method can obtain effective information about the target. Through ablation experiments and comparison with other state-of-the-art methods on different datasets, it can be concluded that USET-Net achieves superior target segmentation effects under the same conditions, which can prove that the combination of Swin Transformer and deep network with embedded knowledge prior has great potential for infrared dim and small target detection.
However, the speed of USET-Net is not fast enough, and the real-time performance at present is worse than that of ACM and ALC-Net. In the future, we will further study and optimize a more stable and efficient algorithmic model structure, design a more lightweight infrared dim-target-oriented fast detection and identification method, and deploy and test it on relevant edge-computing devices.
Author Contributions
Conceptualization, L.L. (Lingxiao Li); methodology, L.L. (Lingxiao Li); software, L.L. (Lingxiao Li); validation, L.L. (Lingxiao Li); formal analysis, L.L. (Lingxiao Li); investigation, L.L. (Linlin Liu); resources, L.L. (Linlin Liu) and Y.H.; data curation, Z.Z.; writing—original draft preparation, L.L. (Lingxiao Li); writing—review and editing, L.L. (Linlin Liu) and Y.H.; visualization, Z.Z.; supervision, L.L. (Linlin Liu); project administration, L.L. (Lingxiao Li) and Y.H.; funding acquisition, L.L. (Lingxiao Li), Y.H. and Z.Z. All authors have read and agreed to the published version of the manuscript.
Funding
This research was supported in part by the Natural Science Foundation of Chongqing. under Grant CSTB2022NSCQ-BHX0693, the Science and Technology Research Program of Chongqing Municipal Education Commission under Grant KJQN202101108, the Scientific Research Foundation of Chongqing University of Technology under Grant 2021ZDZ008, the National Natural Science Foundation of China under Grants 62205040, 62265016, and in part by the Shiji Elite Talent Program and the Research and Innovation Team Cultivation Program Foundation of Chongqing University of Technology under Grant 2023TDZ0073.
Data Availability Statement
The data generated and used in this study are available from the corresponding author by request.
Acknowledgments
The authors would like to thank the College of Electronic and Information Engineering, Nanjing University of Aeronautics and Astronautics (NUAA), the College of Electronic Science and Technology, National University of Defense Technology (NUDT), and the State Key Laboratory of Integrated Services Networks, Xidian University, for providing the experimental datasets.
Conflicts of Interest
The authors declare no conflicts of interest.
References
- Zhao, M.; Li, W.; Li, L.; Hu, J.; Ma, P.; Tao, R. Single-frame infrared small-target detection: A survey. IEEE Geosci. Remote Sens. Mag. 2022, 10, 87–119. [Google Scholar] [CrossRef]
- Wu, L.; Fang, S.; Ma, Y.; Fan, F.; Huang, J. Infrared small target detection based on gray intensity descent and local gradient watershed. Infrared Phys. Technol. 2022, 123, 104171. [Google Scholar] [CrossRef]
- Rawat, S.S.; Verma, S.K.; Kumar, Y. Review on recent development in infrared small target detection algorithms. Procedia Comput. Sci. 2020, 167, 2496–2505. [Google Scholar] [CrossRef]
- Zhao, B.; Wang, C.; Fu, Q.; Han, Z. A novel pattern for infrared small target detection with generative adversarial network. IEEE Trans. Geosci. Remote Sens. 2020, 59, 4481–4492. [Google Scholar] [CrossRef]
- Han, J.; Liang, K.; Zhou, B.; Zhu, X.; Zhao, J.; Zhao, L. Infrared small target detection utilizing the multiscale relative local contrast measure. IEEE Geosci. Remote Sens. Lett. 2018, 15, 612–616. [Google Scholar] [CrossRef]
- Dai, Y.; Wu, Y.; Zhou, F.; Barnard, K. Asymmetric contextual modulation for infrared small target detection. In Proceedings of the IEEE/CVF Winter Conference on Applications of Computer Vision, Waikoloa, HI, USA, 3–7 January 2021; pp. 950–959. [Google Scholar]
- Long, J.; Shelhamer, E.; Darrell, T. Fully Convolutional Networks for Semantic Segmentation. In Proceedings of the IEEE Conference on Computer Vision and Pattern Recognition, Boston, MA, USA, 7–12 June 2015; pp. 3431–3440. [Google Scholar]
- Ronneberger, O.; Fischer, P.; Brox, T. U-net: Convolutional networks for biomedical image segmentation. In Proceedings of the Medical Image Computing and Computer-Assisted Intervention–MICCAI 2015: 18th International Conference, Munich, Germany, 5–9 October 2015; pp. 234–241. [Google Scholar]
- Ren, S.; He, K.; Girshick, R.; Sun, J. Faster r-cnn: Towards real-time object detection with region proposal networks. In Proceedings of the Advances in Neural Information Processing Systems, Montreal, QC, Canada, 7–12 December 2015; Volume 28. [Google Scholar]
- Redmon, J.; Divvala, S.; Girshick, R.; Farhadi, A. You only look once: Unified, real-time object detection. In Proceedings of the IEEE Conference on Computer Vision and Pattern Recognition, Las Vegas, NV, USA, 27–30 June 2016; pp. 779–788. [Google Scholar]
- Liu, W.; Anguelov, D.; Erhan, D.; Szegedy, C.; Reed, S.; Fu, C.-Y.; Berg, A.C. Ssd: Single shot multibox detector. In Proceedings of the Computer Vision–ECCV 2016: 14th European Conference, Amsterdam, The Netherlands, 11–14 October 2016; pp. 21–37. [Google Scholar]
- Fan, Z.; Bi, D.; Xiong, L.; Ma, S.; He, L.; Ding, W. Dim infrared image enhancement based on convolutional neural network. Neurocomputing 2018, 272, 396–404. [Google Scholar] [CrossRef]
- Zhang, S.; Huang, X.; Wang, M. Background suppression algorithm for infrared images based on Robinson guard filter. In Proceedings of the 2017 2nd International Conference on Multimedia and Image Processing (ICMIP), Wuhan, China, 17–19 March 2017; pp. 250–254. [Google Scholar]
- Pan, S.; Zhang, S.; Zhao, M.; An, B. Infrared small target detection based on double-layer local contrast measure. Acta Photonica Sin. 2020, 49, 0110003. [Google Scholar]
- Zhang, X.; Ding, Q.; Luo, H.; Hui, B.; Chang, Z.; Zhang, J. Infrared small target detection based on an image-patch tensor model. Infrared Phys. Technol. 2019, 99, 55–63. [Google Scholar] [CrossRef]
- Jun, C.; Yuanyuan, H.; Pengze, L. Infrared small target detection algorithm using visual contrast mechanism. Syst. Eng. Electron. 2019, 41, 2416–2423. [Google Scholar]
- Wei, Y.; You, X.; Li, H. Multiscale patch-based contrast measure for small infrared target detection. Pattern Recognit. 2016, 58, 216–226. [Google Scholar] [CrossRef]
- Zhang, L.; Peng, L.; Zhang, T.; Cao, S.; Peng, Z. Infrared small target detection via non-convex rank approximation minimization joint l 2, 1 norm. Remote Sens. 2018, 10, 1821. [Google Scholar] [CrossRef]
- Zhou, F.; Wu, Y.; Dai, Y.; Wang, P. Detection of small target using schatten 1/2 quasi-norm regularization with reweighted sparse enhancement in complex infrared scenes. Remote Sens. 2019, 11, 2058. [Google Scholar] [CrossRef]
- Vaishnavi, R.; Unnikrishnan, G.; Raj, A.B. Implementation of algorithms for Point target detection and tracking in Infrared image sequences. In Proceedings of the 2019 4th International Conference on Recent Trends on Electronics, Information, Communication & Technology (RTEICT), Bangalore, India, 17–18 May 2019; pp. 904–909. [Google Scholar]
- Yi, W.; Fang, Z.; Li, W.; Hoseinnezhad, R.; Kong, L. Multi-frame track-before-detect algorithm for maneuvering target tracking. IEEE Trans. Veh. Technol. 2020, 69, 4104–4118. [Google Scholar] [CrossRef]
- Wang, J.; Yi, W.; Kirubarajan, T.; Kong, L. An efficient recursive multiframe track-before-detect algorithm. IEEE Trans. Aerosp. Electron. Syst. 2017, 54, 190–204. [Google Scholar] [CrossRef]
- Lee, J.-Y. A Study of CR-DuNN based on the LSTM and Du-CNN to Predict Infrared Target Feature and Classify Targets from the Clutters. Trans. Korean Inst. Electr. Eng. 2019, 68, 153–158. [Google Scholar]
- Qili, Y.; Binghong, Z.; Wei, Z. Trajectory detection of small targets based on convolutional long short-term memory with attention mechanisms. Opt. Precis. Eng. 2020, 28, 2535–2548. [Google Scholar]
- Zhao, M.; Cheng, L.; Yang, X.; Feng, P.; Liu, L.; Wu, N. TBC-Net: A real-time detector for infrared small target detection using semantic constraint. arXiv 2019, arXiv:2001.05852. [Google Scholar]
- Wang, H.; Zhou, L.; Wang, L. Miss detection vs. false alarm: Adversarial learning for small object segmentation in infrared images. In Proceedings of the IEEE/CVF International Conference on Computer Vision, Seoul, Republic of Korea, 27 October–2 November 2019; pp. 8509–8518. [Google Scholar]
- Huang, L.; Dai, S.; Huang, T.; Huang, X.; Wang, H. Infrared small target segmentation with multiscale feature representation. Infrared Phys. Technol. 2021, 116, 103755. [Google Scholar] [CrossRef]
- Dai, Y.; Wu, Y.; Zhou, F.; Barnard, K. Attentional local contrast networks for infrared small target detection. IEEE Trans. Geosci. Remote Sens. 2021, 59, 9813–9824. [Google Scholar] [CrossRef]
- Zhang, M.; Zhang, R.; Yang, Y.; Bai, H.; Zhang, J.; Guo, J. ISNet: Shape matters for infrared small target detection. In Proceedings of the IEEE/CVF Conference on Computer Vision and Pattern Recognition, New Orleans, LA, USA, 18–24 June 2022; pp. 877–886. [Google Scholar]
- Li, B.; Xiao, C.; Wang, L.; Wang, Y.; Lin, Z.; Li, M.; An, W.; Guo, Y. Dense nested attention network for infrared small target detection. IEEE Trans. Image Process. 2022, 32, 1745–1758. [Google Scholar] [CrossRef]
- Sun, H.; Bai, J.; Yang, F.; Bai, X. Receptive-Field and Direction Induced Attention Network for Infrared Dim Small Target Detection With a Large-Scale Dataset IRDST. IEEE Trans. Geosci. Remote Sens. 2023, 61, 1–13. [Google Scholar] [CrossRef]
- Hou, Q.; Zhang, L.; Tan, F.; Xi, Y.; Zheng, H.; Li, N. ISTDU-Net: Infrared Small-Target Detection U-Net. IEEE Geosci. Remote Sens. Lett. 2022, 19, 7506205. [Google Scholar] [CrossRef]
- Wu, X.; Hong, D.; Chanussot, J. UIU-Net: U-Net in U-Net for infrared small object detection. IEEE Trans. Image Process. 2022, 32, 364–376. [Google Scholar] [CrossRef] [PubMed]
- Akyon, F.C.; Altinuc, S.O.; Temizel, A. Slicing aided hyper inference and fine-tuning for small object detection. In Proceedings of the 2022 IEEE International Conference on Image Processing (ICIP), Bordeaux, France, 16–19 October 2022; pp. 966–970. [Google Scholar]
- Lin, J.; Zhang, K.; Yang, X.; Cheng, X.; Li, C. Infrared dim and small target detection based on U-Transformer. J. Vis. Commun. Image Represent. 2022, 89, 103684. [Google Scholar] [CrossRef]
- Ju, M.; Luo, J.; Liu, G.; Luo, H. ISTDet: An efficient end-to-end neural network for infrared small target detection. Infrared Phys. Technol. 2021, 114, 103659. [Google Scholar] [CrossRef]
- Ryu, J.; Kim, S. Small infrared target detection by data-driven proposal and deep learning-based classification. In Proceedings of the Infrared Technology and Applications XLIV, Orlando, FL, USA, 16–19 April 2018; pp. 134–143. [Google Scholar]
- Fan, M.; Tian, S.; Liu, K.; Zhao, J.; Li, Y. Infrared small target detection based on region proposal and CNN classifier. Signal Image Video Process. 2021, 15, 1927–1936. [Google Scholar] [CrossRef]
- Liu, Z.; Lin, Y.; Cao, Y.; Hu, H.; Wei, Y.; Zhang, Z.; Lin, S.; Guo, B. Swin transformer: Hierarchical vision transformer using shifted windows. In Proceedings of the IEEE/CVF International Conference on Computer Vision, Virtual, 11–17 October 2021; pp. 10012–10022. [Google Scholar]
- Yu, C.; Liu, Y.; Wu, S.; Hu, Z.; Xia, X.; Lan, D.; Liu, X. Infrared small target detection based on multiscale local contrast learning networks. Infrared Phys. Technol. 2022, 123, 104107. [Google Scholar] [CrossRef]
Figure 1.
Infrared dim- and small-target image and its 3D grayscale distribution. Whereas the left side shows the original infrared image, the upper right side is the magnified infrared small target, and the lower right side is the energy distribution of the infrared small target.
Figure 1.
Infrared dim- and small-target image and its 3D grayscale distribution. Whereas the left side shows the original infrared image, the upper right side is the magnified infrared small target, and the lower right side is the energy distribution of the infrared small target.

Figure 2.
General structure of Swin Transformer. On the left is the feature extraction process of the Swin Transformer; on the right are the inner elements of the Swin Transformer module.
Figure 2.
General structure of Swin Transformer. On the left is the feature extraction process of the Swin Transformer; on the right are the inner elements of the Swin Transformer module.

Figure 3.
Framework structure of USES-Net.

Figure 4.
Slicing-aided enhancement process of SAHI.

Figure 5.
PCM and EPCLM structure. (a) The center area with the letter “T” denotes the target, the areas with words from B1 to B8 are the neighboring areas closed to the target, and the red arrows denote the local contrast metric of PCM. (b) The EPCLM structure, which uses the dilation convolution with rate d to calculate the local contrast of image patch.

Figure 6.
The structure of AFM.

Figure 7.
The process of slicing-aided hyper inference methods.

Figure 8.
The NUAA-SIRST dataset detection results of different methods. (a) Input image, (b) ACM, (c) ALC-Net, (d) DNA-Net, (e) ISNet, (f) ISTDU-Net, (g) RDIAN, (h) UIU-Net, (i) proposed method.
Figure 8.
The NUAA-SIRST dataset detection results of different methods. (a) Input image, (b) ACM, (c) ALC-Net, (d) DNA-Net, (e) ISNet, (f) ISTDU-Net, (g) RDIAN, (h) UIU-Net, (i) proposed method.

Figure 9.
The NUDT-SIRST dataset detection results of different methods. (a) Input image, (b) ACM, (c) ALC-Net, (d) DNA-Net, (e) ISNet, (f) ISTDU-Net, (g) RDIAN, (h) UIU-Net, (i) proposed method.
Figure 9.
The NUDT-SIRST dataset detection results of different methods. (a) Input image, (b) ACM, (c) ALC-Net, (d) DNA-Net, (e) ISNet, (f) ISTDU-Net, (g) RDIAN, (h) UIU-Net, (i) proposed method.

Figure 10.
The IRSTD-1K dataset detection results of different methods. (a) Input image, (b) ACM, (c) ALC-Net, (d) DNA-Net, (e) ISNet, (f) ISTDU-Net, (g) RDIAN, (h) UIU-Net, (i) proposed method.
Figure 10.
The IRSTD-1K dataset detection results of different methods. (a) Input image, (b) ACM, (c) ALC-Net, (d) DNA-Net, (e) ISNet, (f) ISTDU-Net, (g) RDIAN, (h) UIU-Net, (i) proposed method.

Figure 11.
Illustrations of the results where the USET-Net cannot perform very well. (a–e) Each row corresponds to an input image, label mask, and the USET-Net result.
Figure 11.
Illustrations of the results where the USET-Net cannot perform very well. (a–e) Each row corresponds to an input image, label mask, and the USET-Net result.


Table 1.
Data flow of USES-Net.
| Structure | Input Shape | Output Shape |
|---|---|---|
| Enhancement | (256, 256, 3) | (256, 256, 1) |
| Encode1 | (256, 256, 1) | (128, 128, 32) |
| Encode2 | (128, 128, 32) | (64, 64, 64) |
| Swin Transfomer Module1 | (64, 64, 64) | (32, 32, 128) |
| Swin Transfomer Module2 | (32, 32, 128) | (16, 16, 256) |
| Swin Transfomer Module3 | (16, 16, 256) | (8, 8, 512) |
| Decode1 | (8, 8, 512) | (16, 16, 256) |
| Decode2 | (16, 16, 256) | (32, 32, 128) |
| Decode3 | (32, 32, 128) | (64, 64, 64) |
| Decode4 | (64, 64, 64) | (128, 128, 32) |
| Decode5 | (128, 128, 32) | (256, 256, 1) |
Table 2.
Configuration of the experimental environment.
| Types and Hyperparameters | Details and Values |
|---|---|
| CPU | 12th Gen Intel(R) Core (TM) i5-12600K |
| GPU | NVIDIA GeForce RTX 3080 Ti |
| Memory Size | 12 GB |
| PyTorch Version | 1.10.0 |
| Acceleration Environment | Cuda11.3 |
| Learning Rate | 1 × 10⁻³ |
| Batch Size | 16 |
| Epoch | 400 |
| Optimizer | Adam |
Table 3.
Comparison of different methods in the NUAA-SIRST dataset.
| Methods | PA | mIOU | Pd | Fa |
|---|---|---|---|---|
| ACM | 0.835 | 0.694 | 0.920 | 2.271 × 10⁻⁵ |
| ALC-Net | 0.755 | 0.610 | 0.871 | 5.600 × 10⁻⁵ |
| DNA-Net | 0.833 | 0.748 | 0.935 | 3.828 × 10⁻⁵ |
| ISNet | 0.891 | 0.705 | 0.951 | 6.798 × 10⁻⁵ |
| ISTDU-Net | 0.866 | 0.759 | 0.962 | 3.890 × 10⁻⁵ |
| RDIAN | 0.832 | 0.707 | 0.951 | 4.733 × 10⁻⁵ |
| UIU-Net | 0.840 | 0.775 | 0.924 | 9.330 × 10⁻⁶ |
| Proposed method | 0.902 | 0.763 | 0.965 | 8.724 × 10⁻⁶ |
Table 4.
Comparison of different methods in the NUDT-SIRST dataset.
| Methods | PA | mIOU | Pd | Fa |
|---|---|---|---|---|
| ACM | 0.864 | 0.649 | 0.967 | 2.859 × 10⁻⁵ |
| ALC-Net | 0.926 | 0.611 | 0.972 | 2.909 × 10⁻⁵ |
| DNA-Net | 0.963 | 0.942 | 0.993 | 2.390 × 10⁻⁶ |
| ISNet | 0.922 | 0.812 | 0.978 | 6.343 × 10⁻⁶ |
| ISTDU-Net | 0.945 | 0.918 | 0.985 | 3.769 × 10⁻⁶ |
| RDIAN | 0.908 | 0.824 | 0.988 | 1.360 × 10⁻⁵ |
| UIU-Net | 0.948 | 0.905 | 0.988 | 8.342 × 10⁻⁶ |
| Proposed method | 0.971 | 0.948 | 0.991 | 2.146 × 10⁻⁶ |
Table 5.
Comparison of different methods in the IRSTD-1K dataset.
| Methods | PA | mIOU | Pd | Fa |
|---|---|---|---|---|
| ACM | 0.852 | 0.603 | 0.933 | 6.802 × 10⁻⁵ |
| ALC-Net | 0.796 | 0.581 | 0.929 | 7.411 × 10⁻⁵ |
| DNA-Net | 0.766 | 0.657 | 0.896 | 1.234 × 10⁻⁵ |
| ISNet | 0.776 | 0.619 | 0.902 | 3.156 × 10⁻⁵ |
| ISTDU-Net | 0.802 | 0.650 | 0.939 | 2.644 × 10⁻⁵ |
| RDIAN | 0.735 | 0.599 | 0.872 | 3.321 × 10⁻⁵ |
| UIU-Net | 0.779 | 0.657 | 0.912 | 1.342 × 10⁻⁵ |
| Proposed method | 0.873 | 0.692 | 0.951 | 1.148 × 10⁻⁵ |
Table 6.
Ablation experiment of the NUAA-SIRST dataset.
| Experiment | Swin-Transformer | EPCLM | SAHI | PA | mIOU | Pd | Fa |
|---|---|---|---|---|---|---|---|
| Exp1 | N | N | N | 0.723 | 0.516 | 0.862 | 8.963 × 10⁻⁵ |
| Exp2 | Y | N | N | 0.808 | 0.663 | 0.903 | 5.288 × 10⁻⁵ |
| Exp3 | Y | Y | N | 0.864 | 0.712 | 0.951 | 2.075 × 10⁻⁵ |
| Exp4 | Y | Y | Y | 0.902 | 0.763 | 0.965 | 8.724 × 10⁻⁶ |
Table 7.
Ablation experiment of the NUDT-SIRST dataset.
| Experiment | Swin-Transformer | EPCLM | SAHI | PA | mIOU | Pd | Fa |
|---|---|---|---|---|---|---|---|
| Exp1 | N | N | N | 0.851 | 0.624 | 0.942 | 1.323 × 10⁻⁵ |
| Exp2 | Y | N | N | 0.903 | 0.787 | 0.975 | 8.753 × 10⁻⁶ |
| Exp3 | Y | Y | N | 0.946 | 0.859 | 0.988 | 6.582 × 10⁻⁶ |
| Exp4 | Y | Y | Y | 0.971 | 0.948 | 0.991 | 2.146 × 10⁻⁶ |
Table 8.
Ablation experiment of the IRSTD-1K dataset.
| Experiment | Swin-Transformer | EPCLM | SAHI | PA | mIOU | Pd | Fa |
|---|---|---|---|---|---|---|---|
| Exp1 | N | N | N | 0.757 | 0.527 | 0.861 | 8.352 × 10⁻⁵ |
| Exp2 | Y | N | N | 0.823 | 0.604 | 0.913 | 6.096 × 10⁻⁵ |
| Exp3 | Y | Y | N | 0.844 | 0.657 | 0.929 | 4.358 × 10⁻⁵ |
| Exp4 | Y | Y | Y | 0.873 | 0.692 | 0.951 | 1.148 × 10⁻⁵ |
Table 9.
Computational efficiency comparison of different methods.
| Methods | Parameters(M) | FLOPs(G) | FPS | Platform |
|---|---|---|---|---|
| ACM | 0.398 | 0.402 | 113 | GTX 3080TI |
| ALC-Net | 0.427 | 0.378 | 85 | GTX 3080TI |
| DNA-Net | 4.697 | 14.261 | 32 | GTX 3080TI |
| ISNet | 0.966 | 30.618 | 49 | GTX 3080TI |
| ISTDU-Net | 2.752 | 7.944 | 37 | GTX 3080TI |
| RDIAN | 0.217 | 3.718 | 56 | GTX 3080TI |
| UIU-Net | 50.540 | 54.425 | 21 | GTX 3080TI |
| Proposed method | 0.872 | 1.155 | 67 | GTX 3080TI |
Disclaimer/Publisher’s Note: The statements, opinions and data contained in all publications are solely those of the individual author(s) and contributor(s) and not of MDPI and/or the editor(s). MDPI and/or the editor(s) disclaim responsibility for any injury to people or property resulting from any ideas, methods, instructions or products referred to in the content. |
© 2024 by the authors. Licensee MDPI, Basel, Switzerland. This article is an open access article distributed under the terms and conditions of the Creative Commons Attribution (CC BY) license (https://creativecommons.org/licenses/by/4.0/).
Share and Cite
MDPI and ACS Style
Li, L.; Liu, L.; He, Y.; Zhong, Z. USES-Net: An Infrared Dim and Small Target Detection Network with Embedded Knowledge Priors. Electronics 2024, 13, 1400. https://doi.org/10.3390/electronics13071400
AMA Style
Li L, Liu L, He Y, Zhong Z. USES-Net: An Infrared Dim and Small Target Detection Network with Embedded Knowledge Priors. Electronics. 2024; 13(7):1400. https://doi.org/10.3390/electronics13071400
Chicago/Turabian StyleLi, Lingxiao, Linlin Liu, Yunan He, and Zhuqiang Zhong. 2024. "USES-Net: An Infrared Dim and Small Target Detection Network with Embedded Knowledge Priors" Electronics 13, no. 7: 1400. https://doi.org/10.3390/electronics13071400
Note that from the first issue of 2016, this journal uses article numbers instead of page numbers. See further details here.