


Digital Twin-Enabled Modelling of a Multivariable Temperature Uniformity Control System


Abstract
:1. Introduction
- The development of a digital twin for multivariable temperature uniformity control systems based on Peltier thermoelectric heating elements using a discrete lumped elements approach and multiphysics behavior based on the DT development framework, which can be used for developing reduced-order models of the physical assets for its real-time execution on embedded devices.
- The use of the digital twin development framework to perform a series of behavioral matching algorithms to find the real values of the digital twin system’s parameters using optimization tools.
- A sensitivity analysis is performed to determine the most influential parameters on the digital twin model based on its real behavior.
2. Digital Twin Development Framework
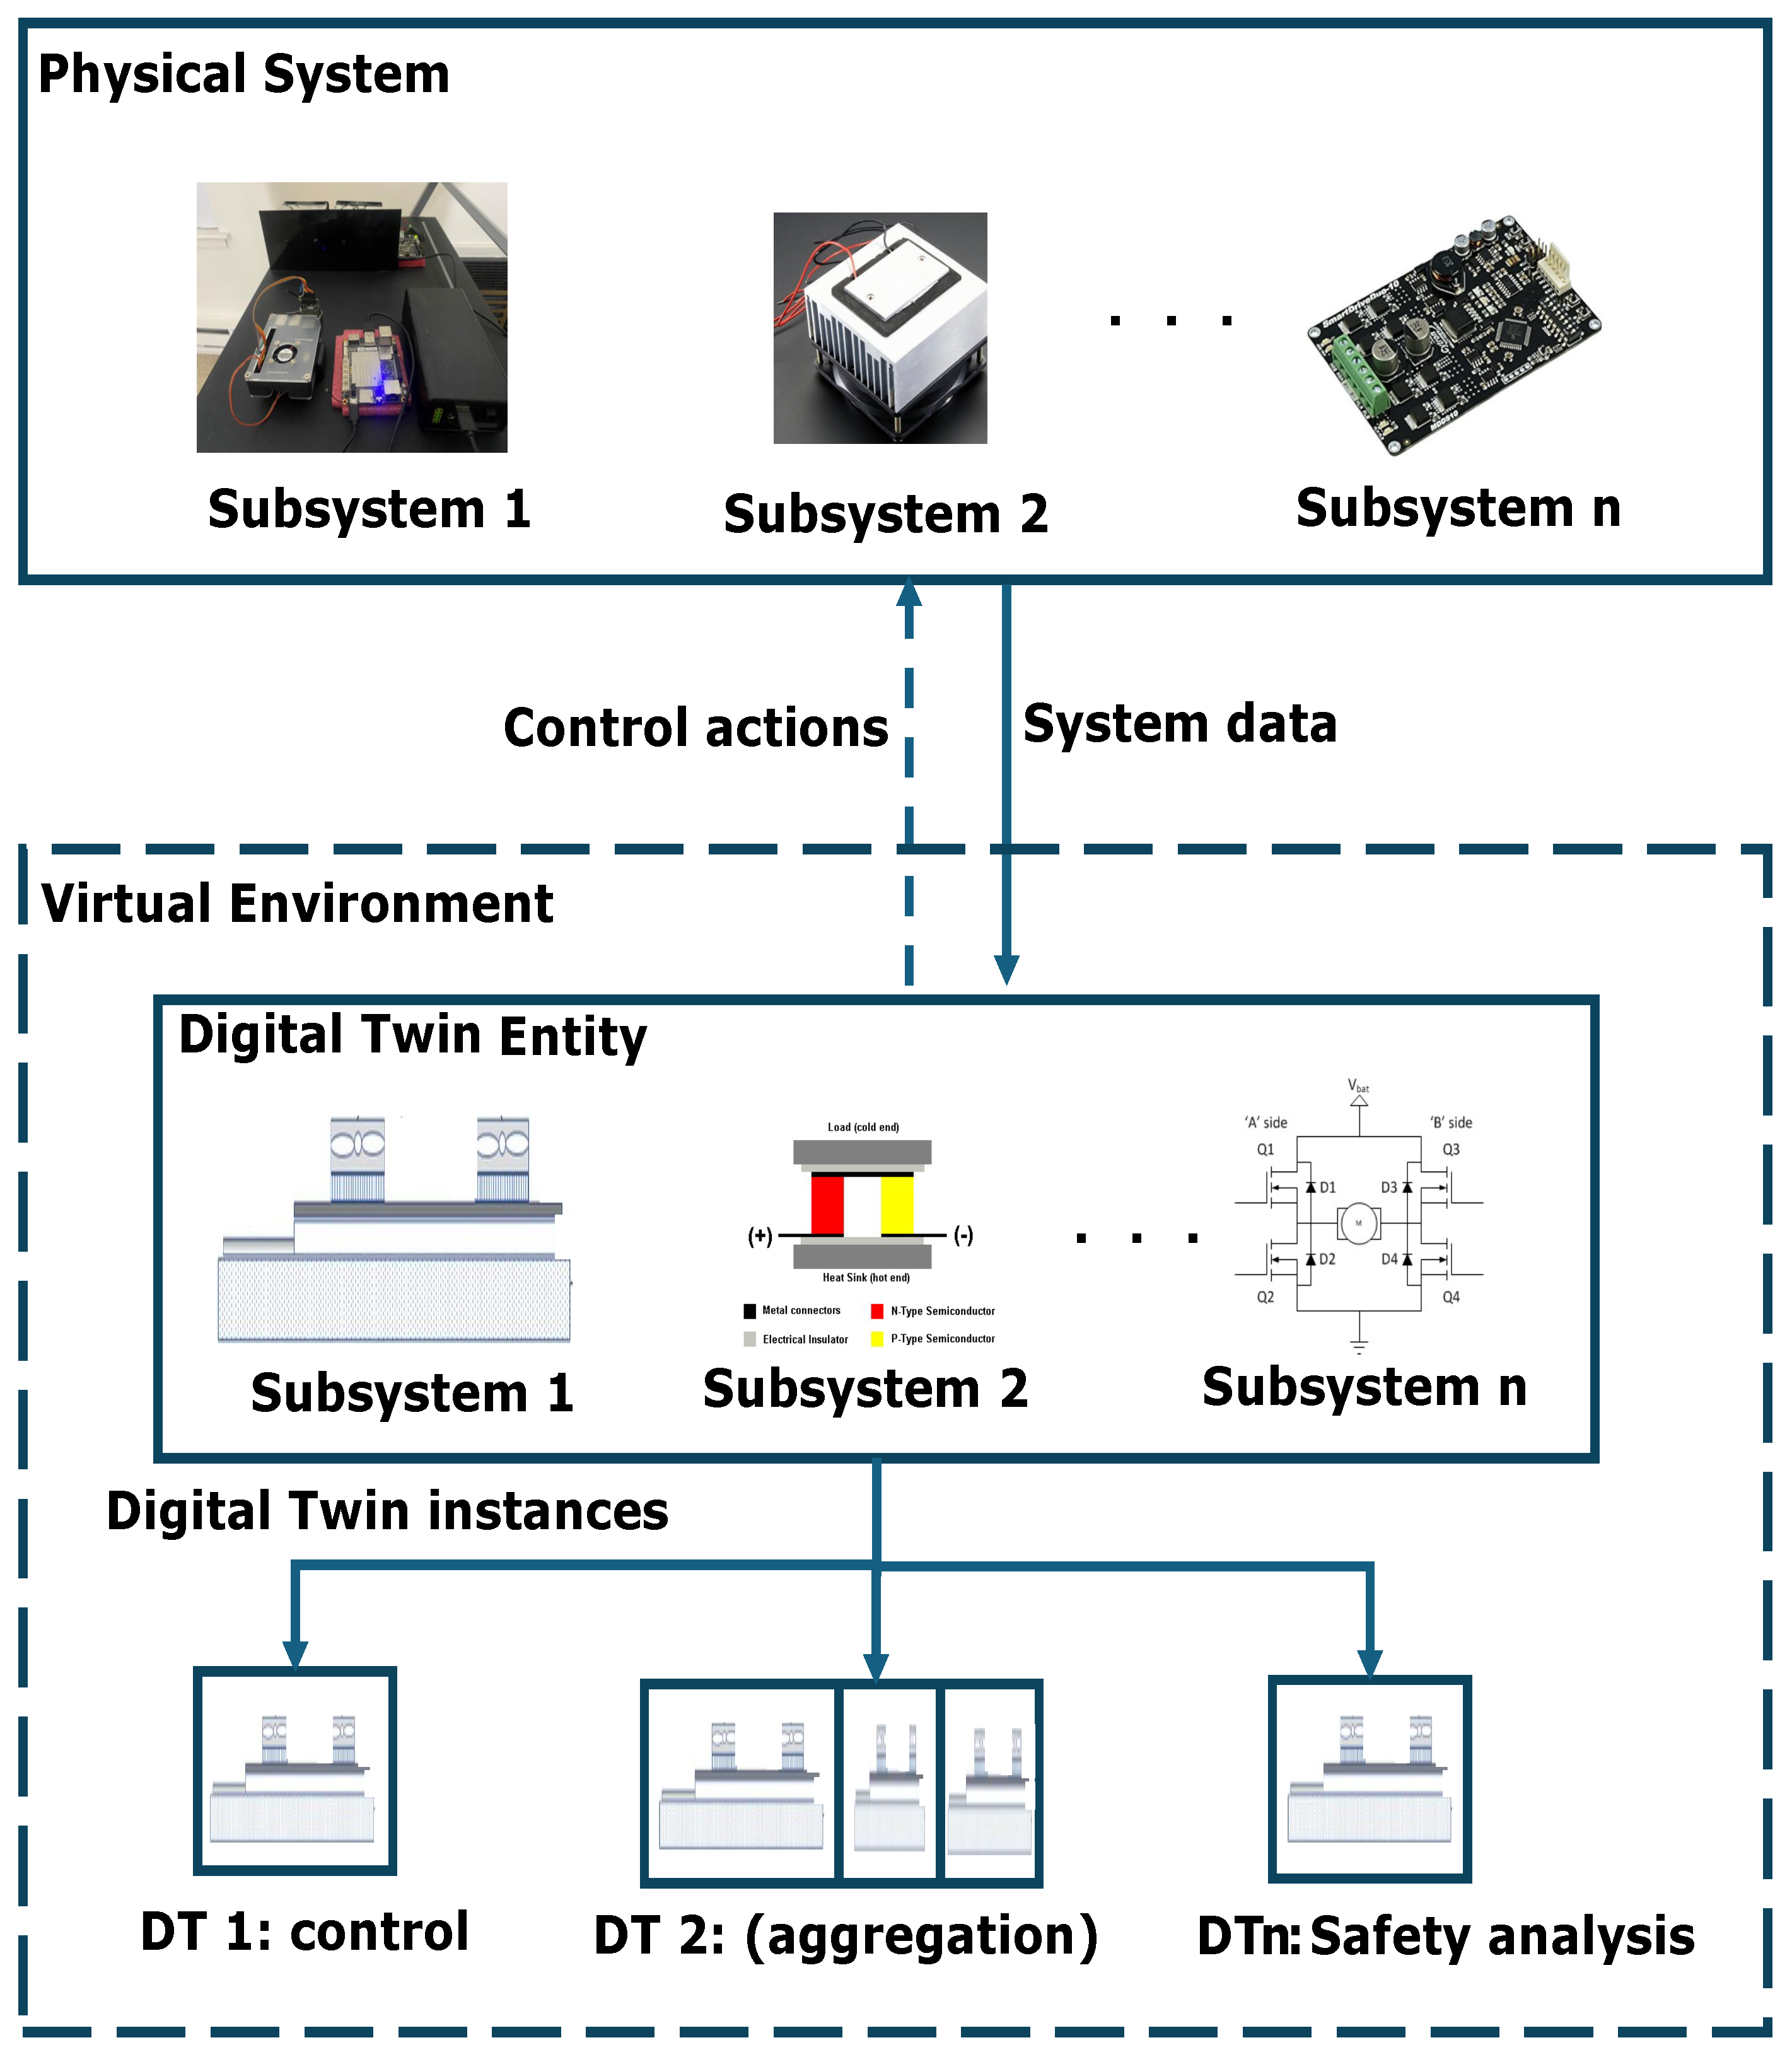
2.1. What Is a Digital Twin?
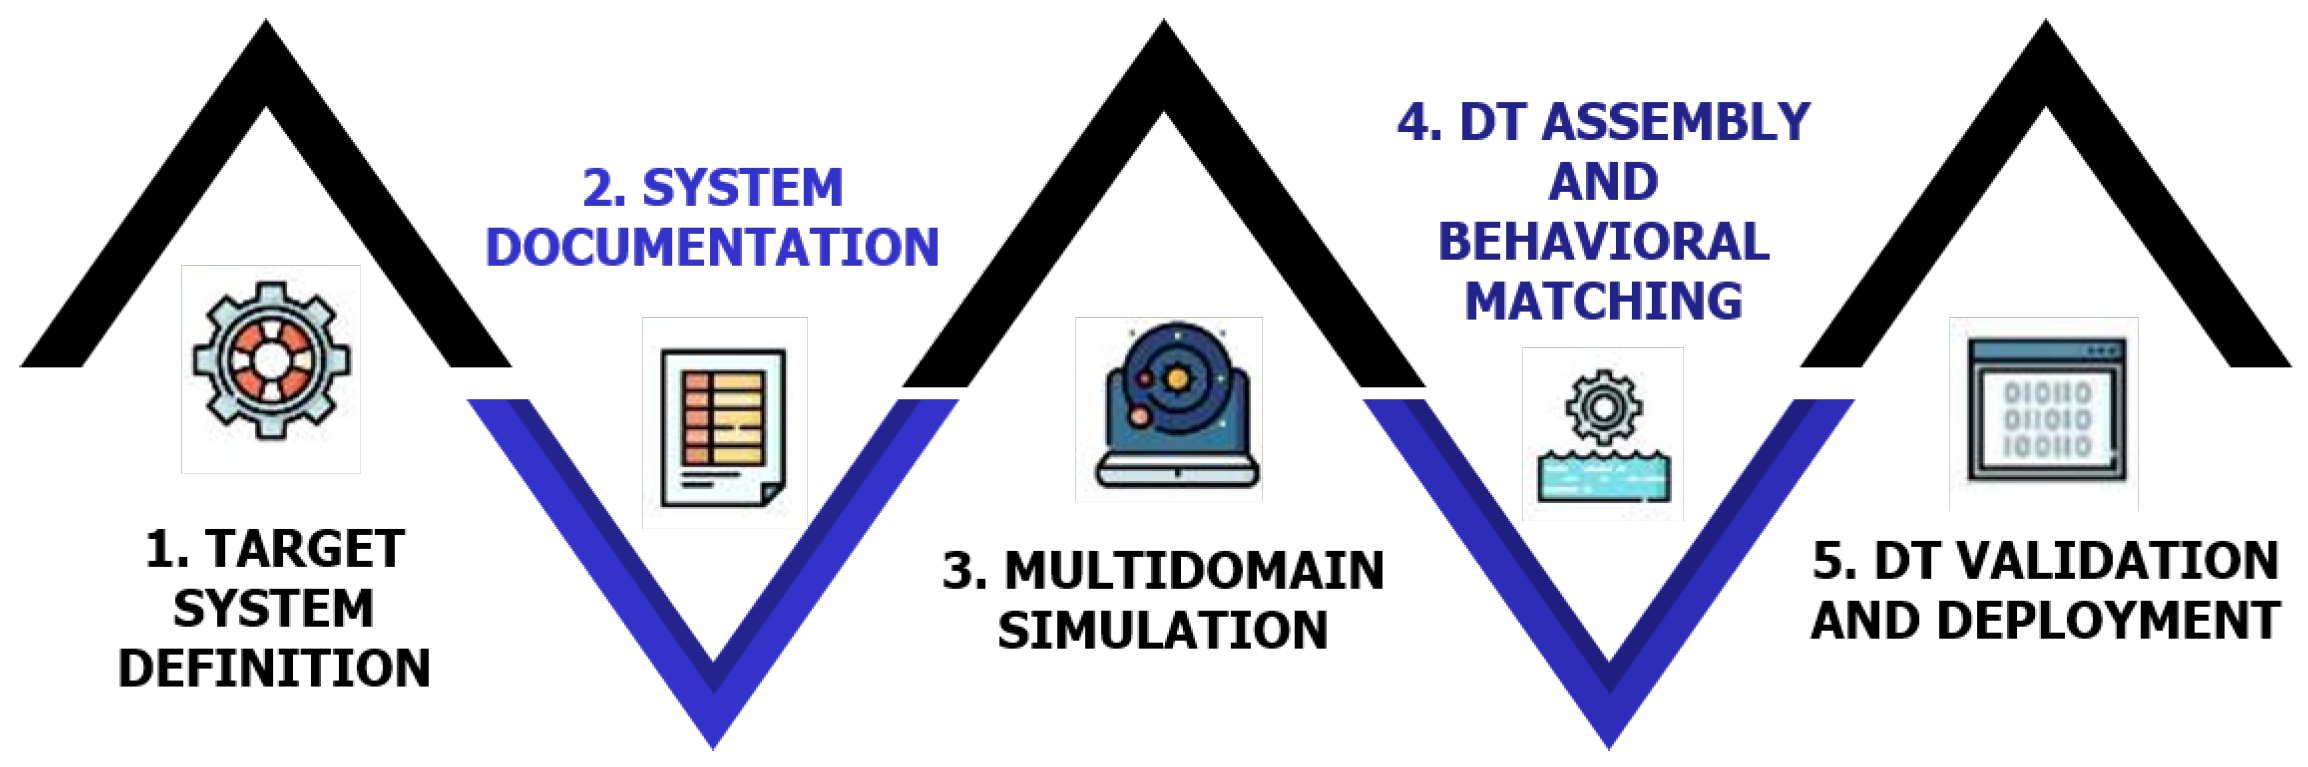
2.2. DT Development Framework
3. Case Study: Uniformity Temperature Control Process Based on a Thermal Plate with Multiple Peltier Heating Elements
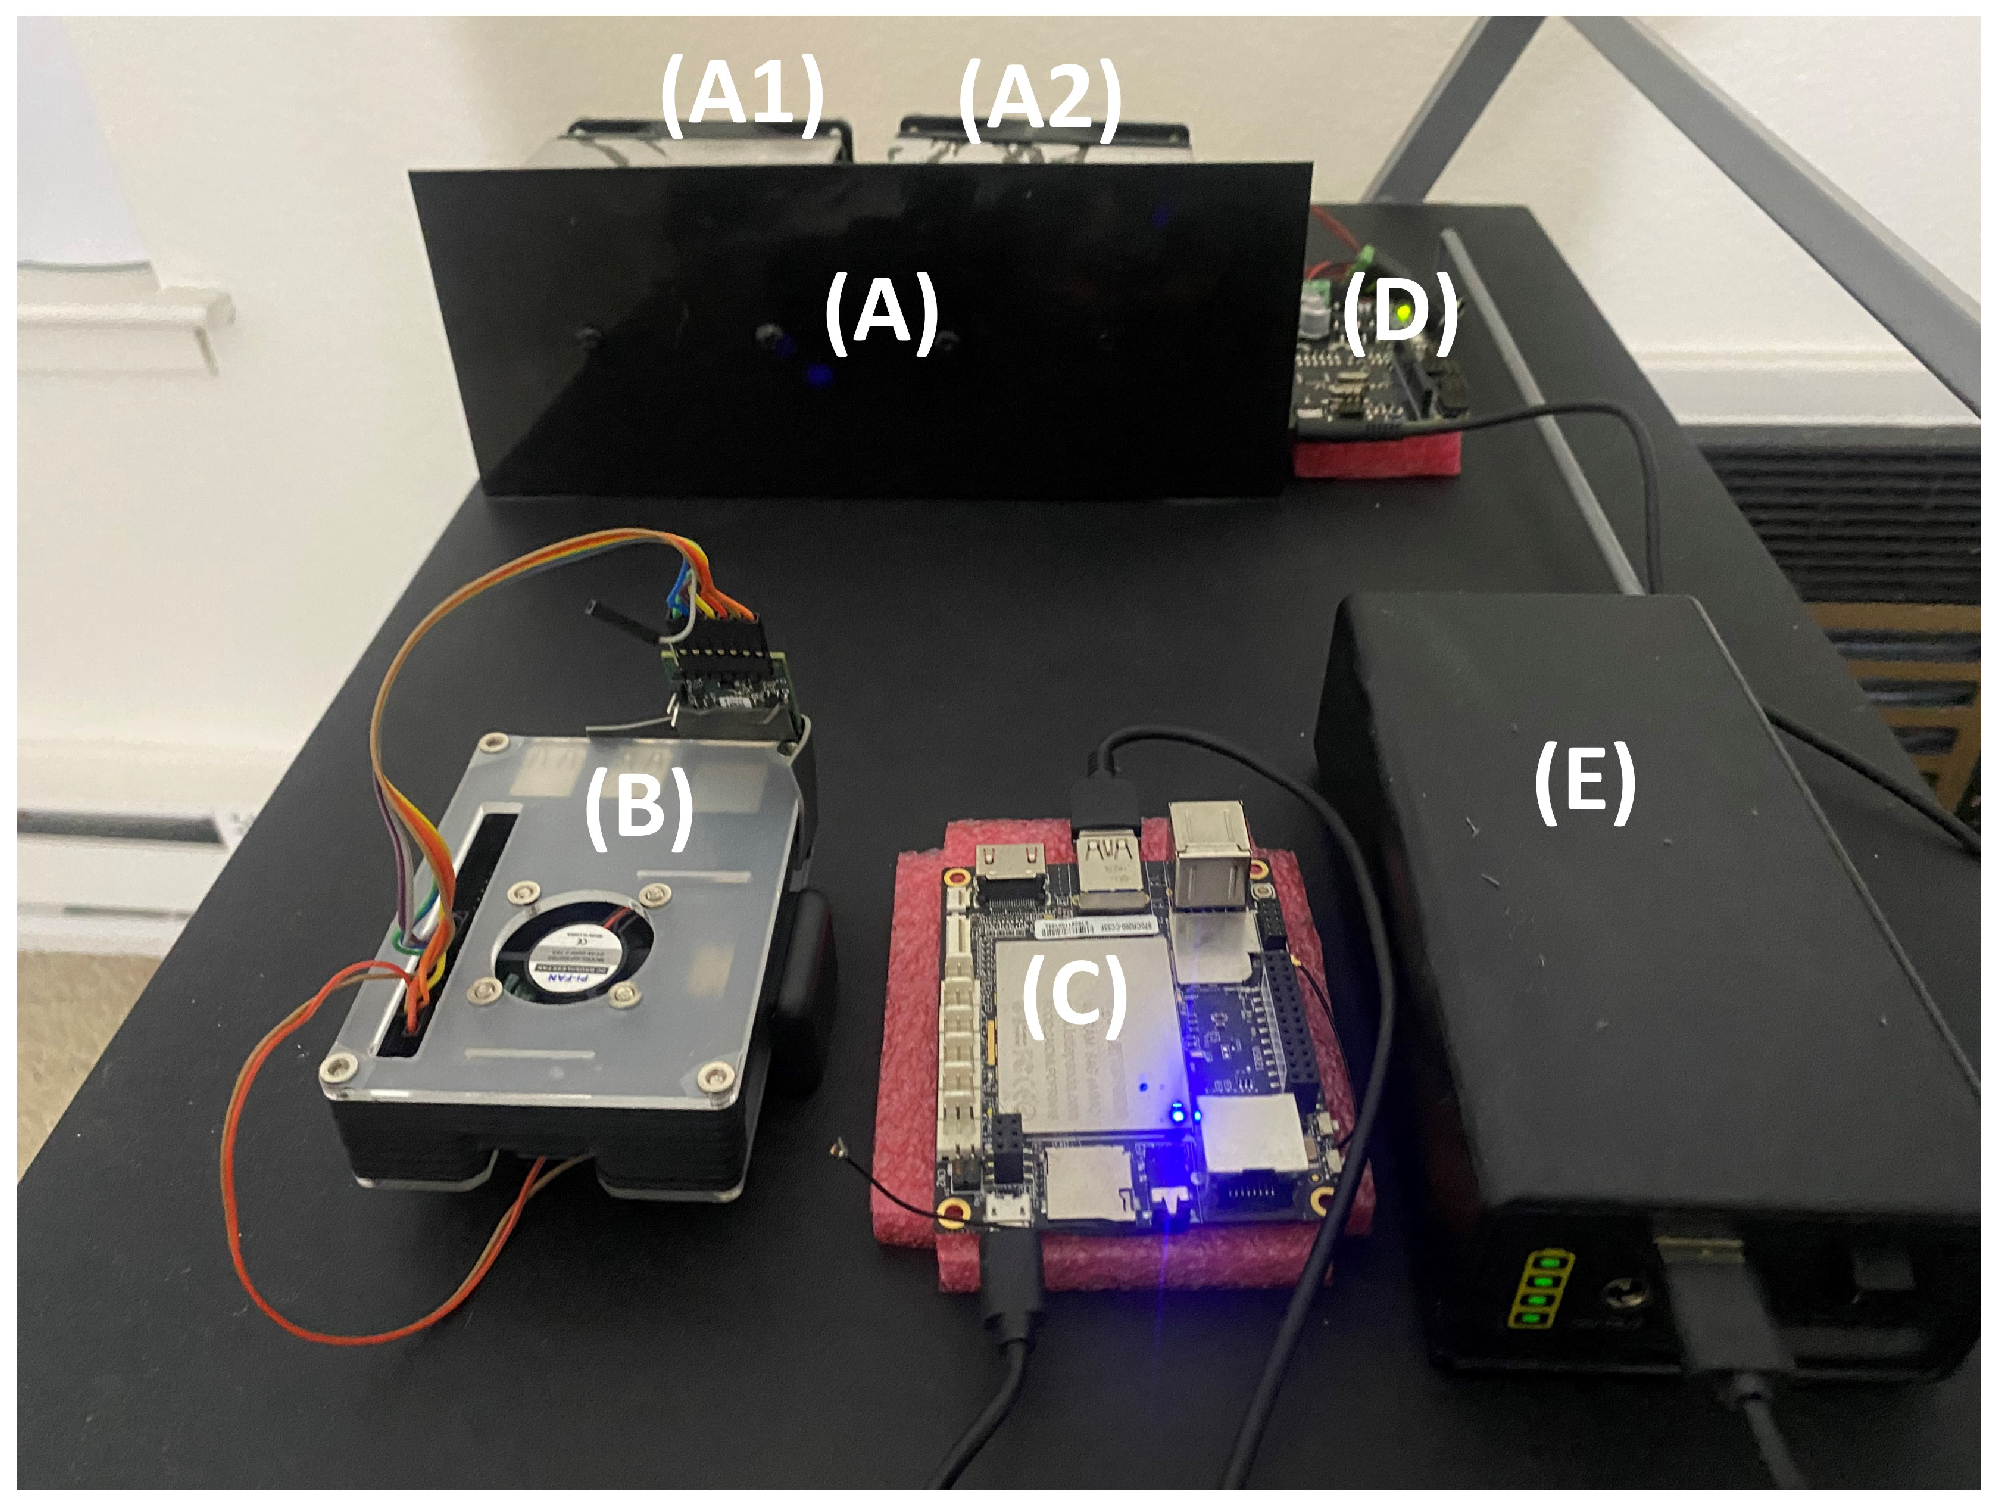
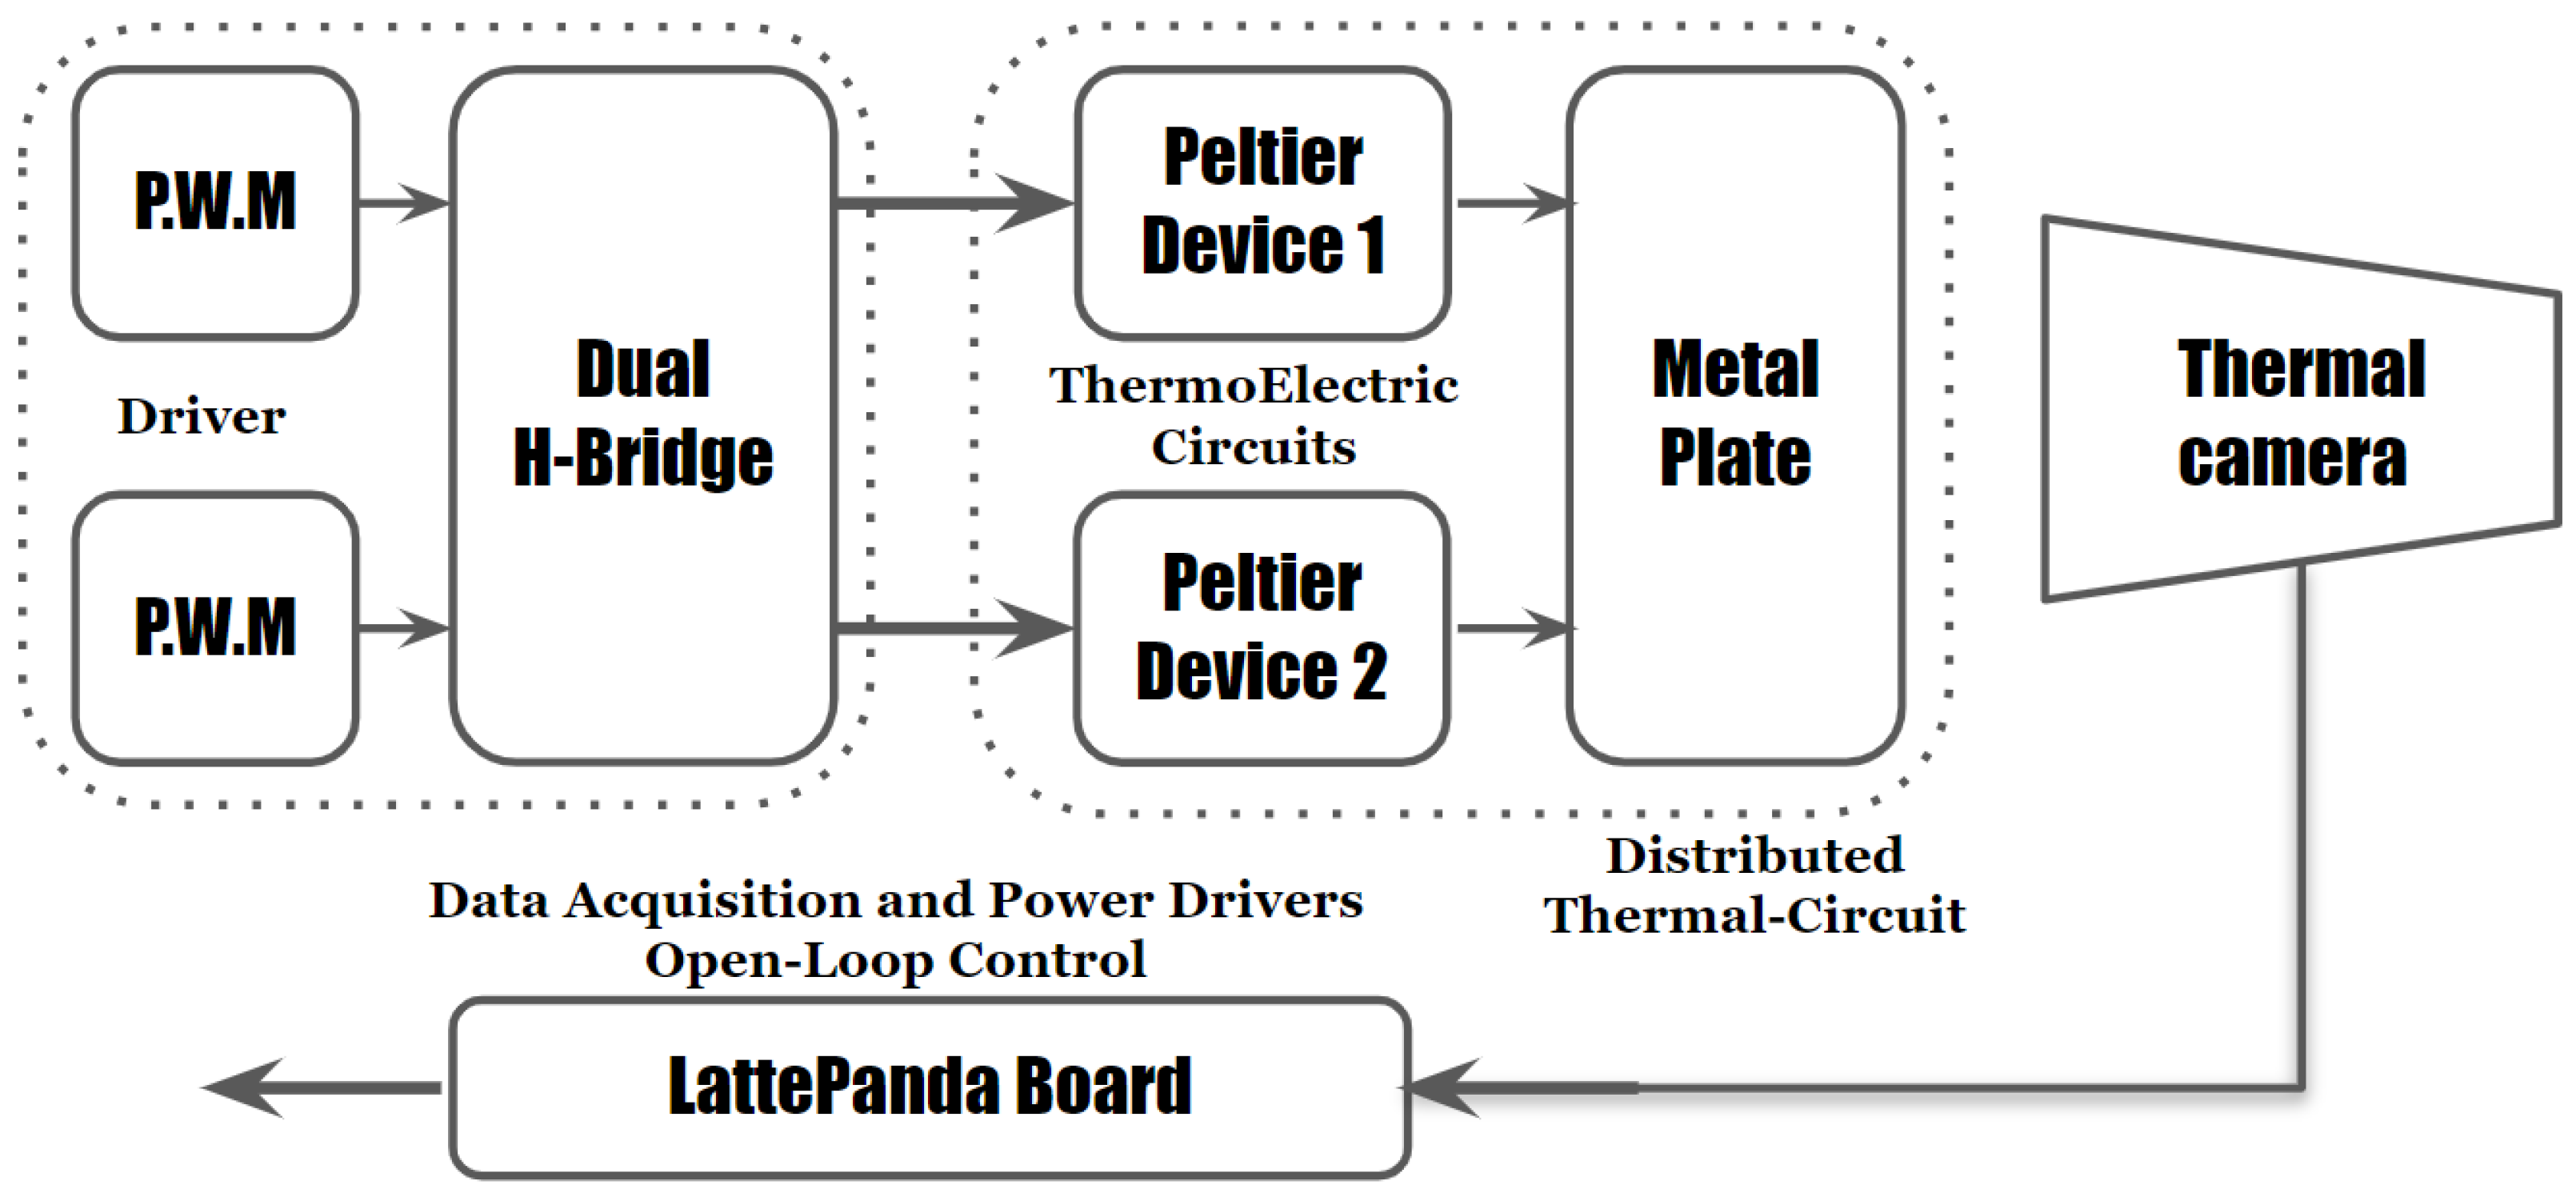
3.1. Steps 1 and 2: System Definition and Documentation
3.2. Step 3: DT Multidomain Simulation
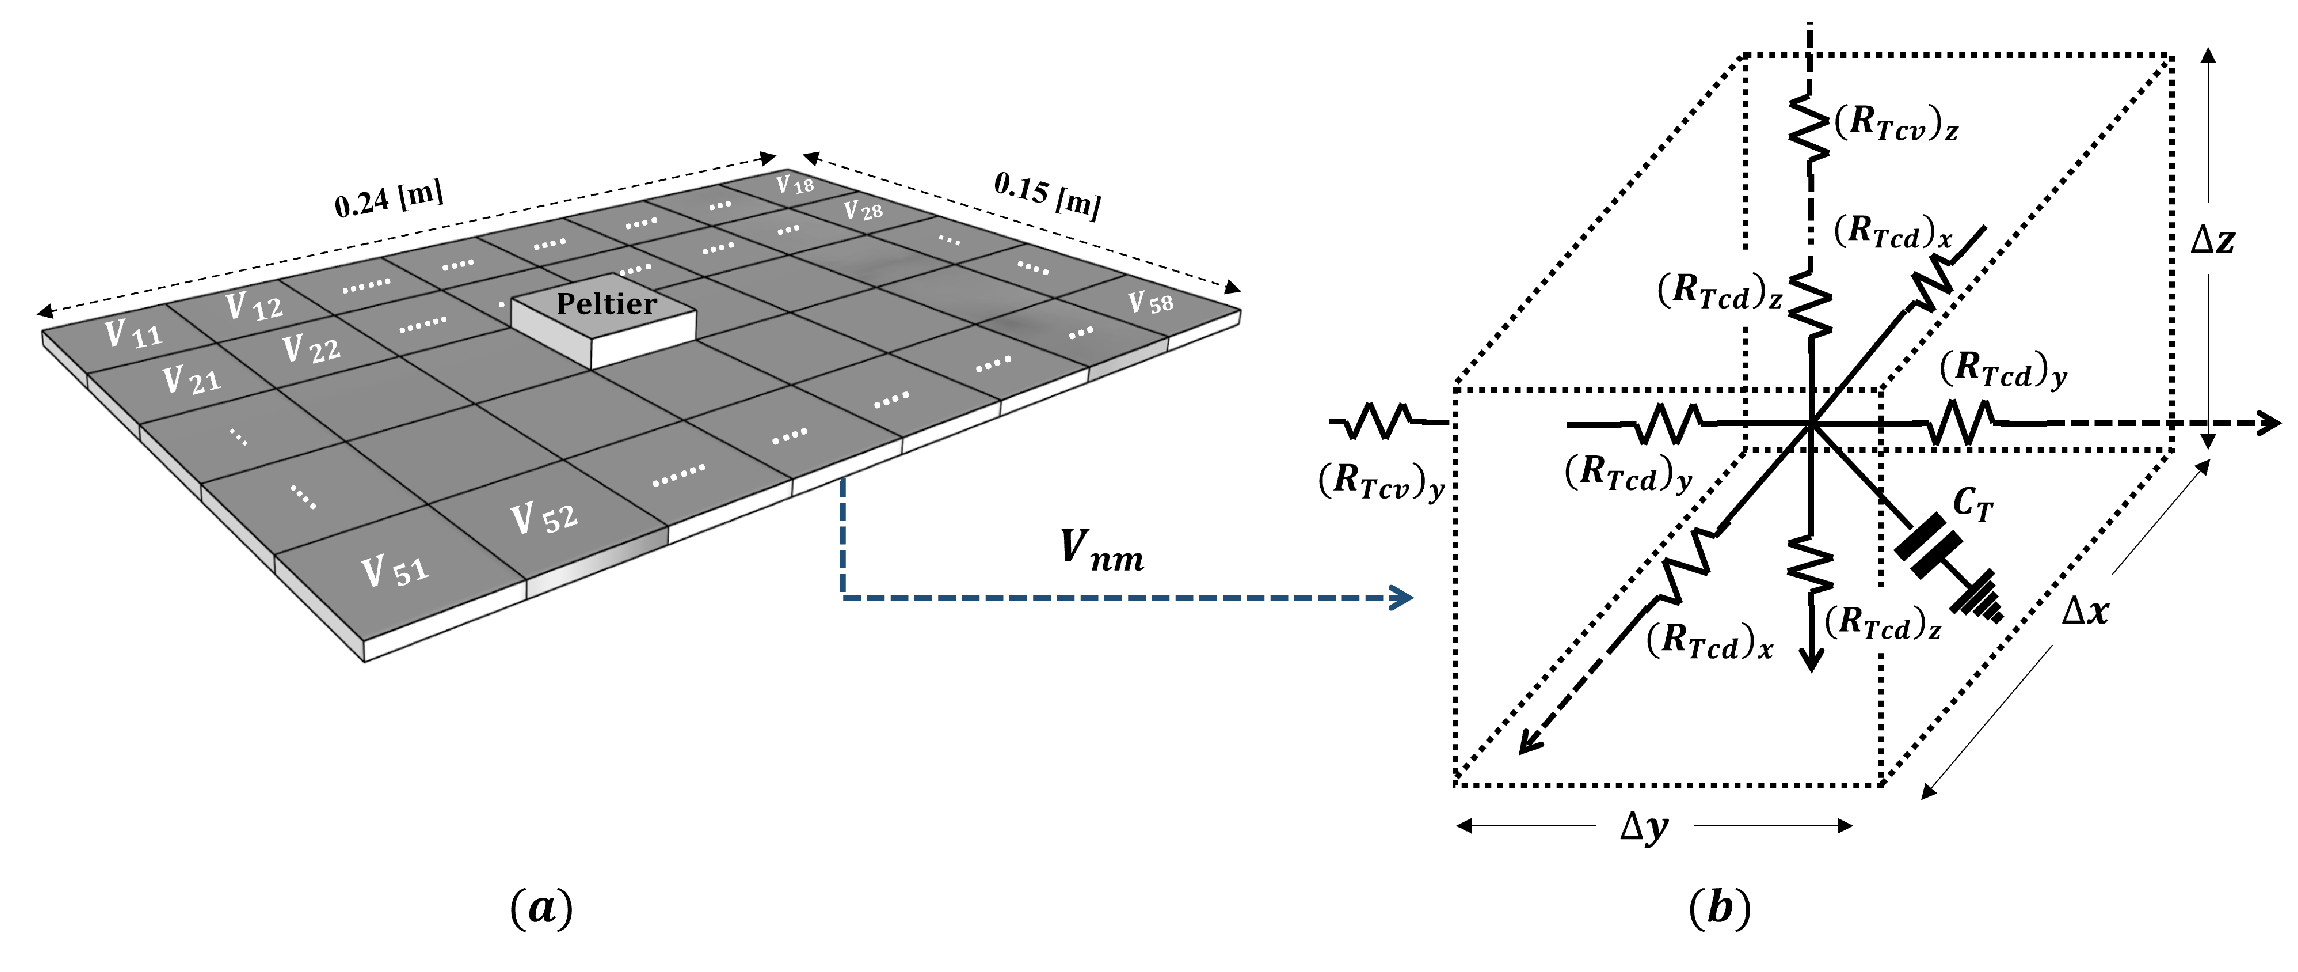
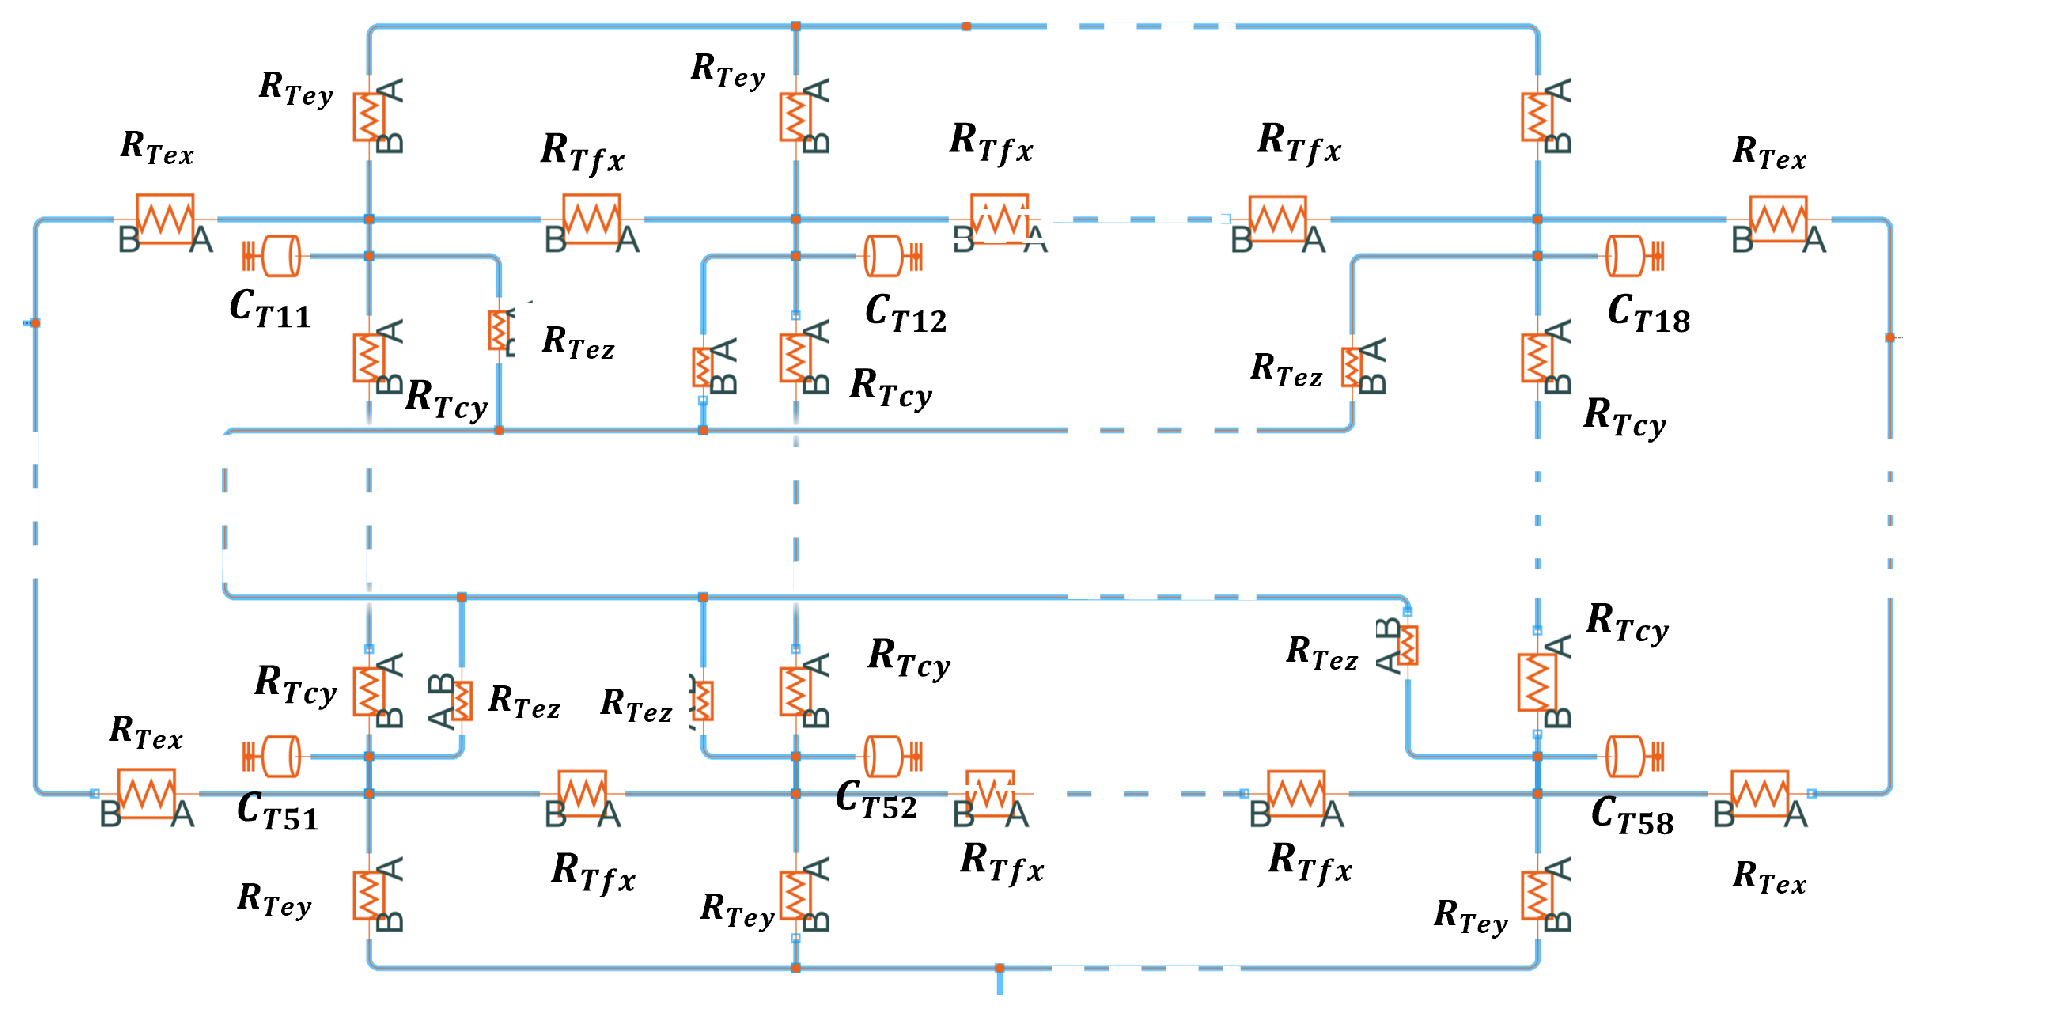
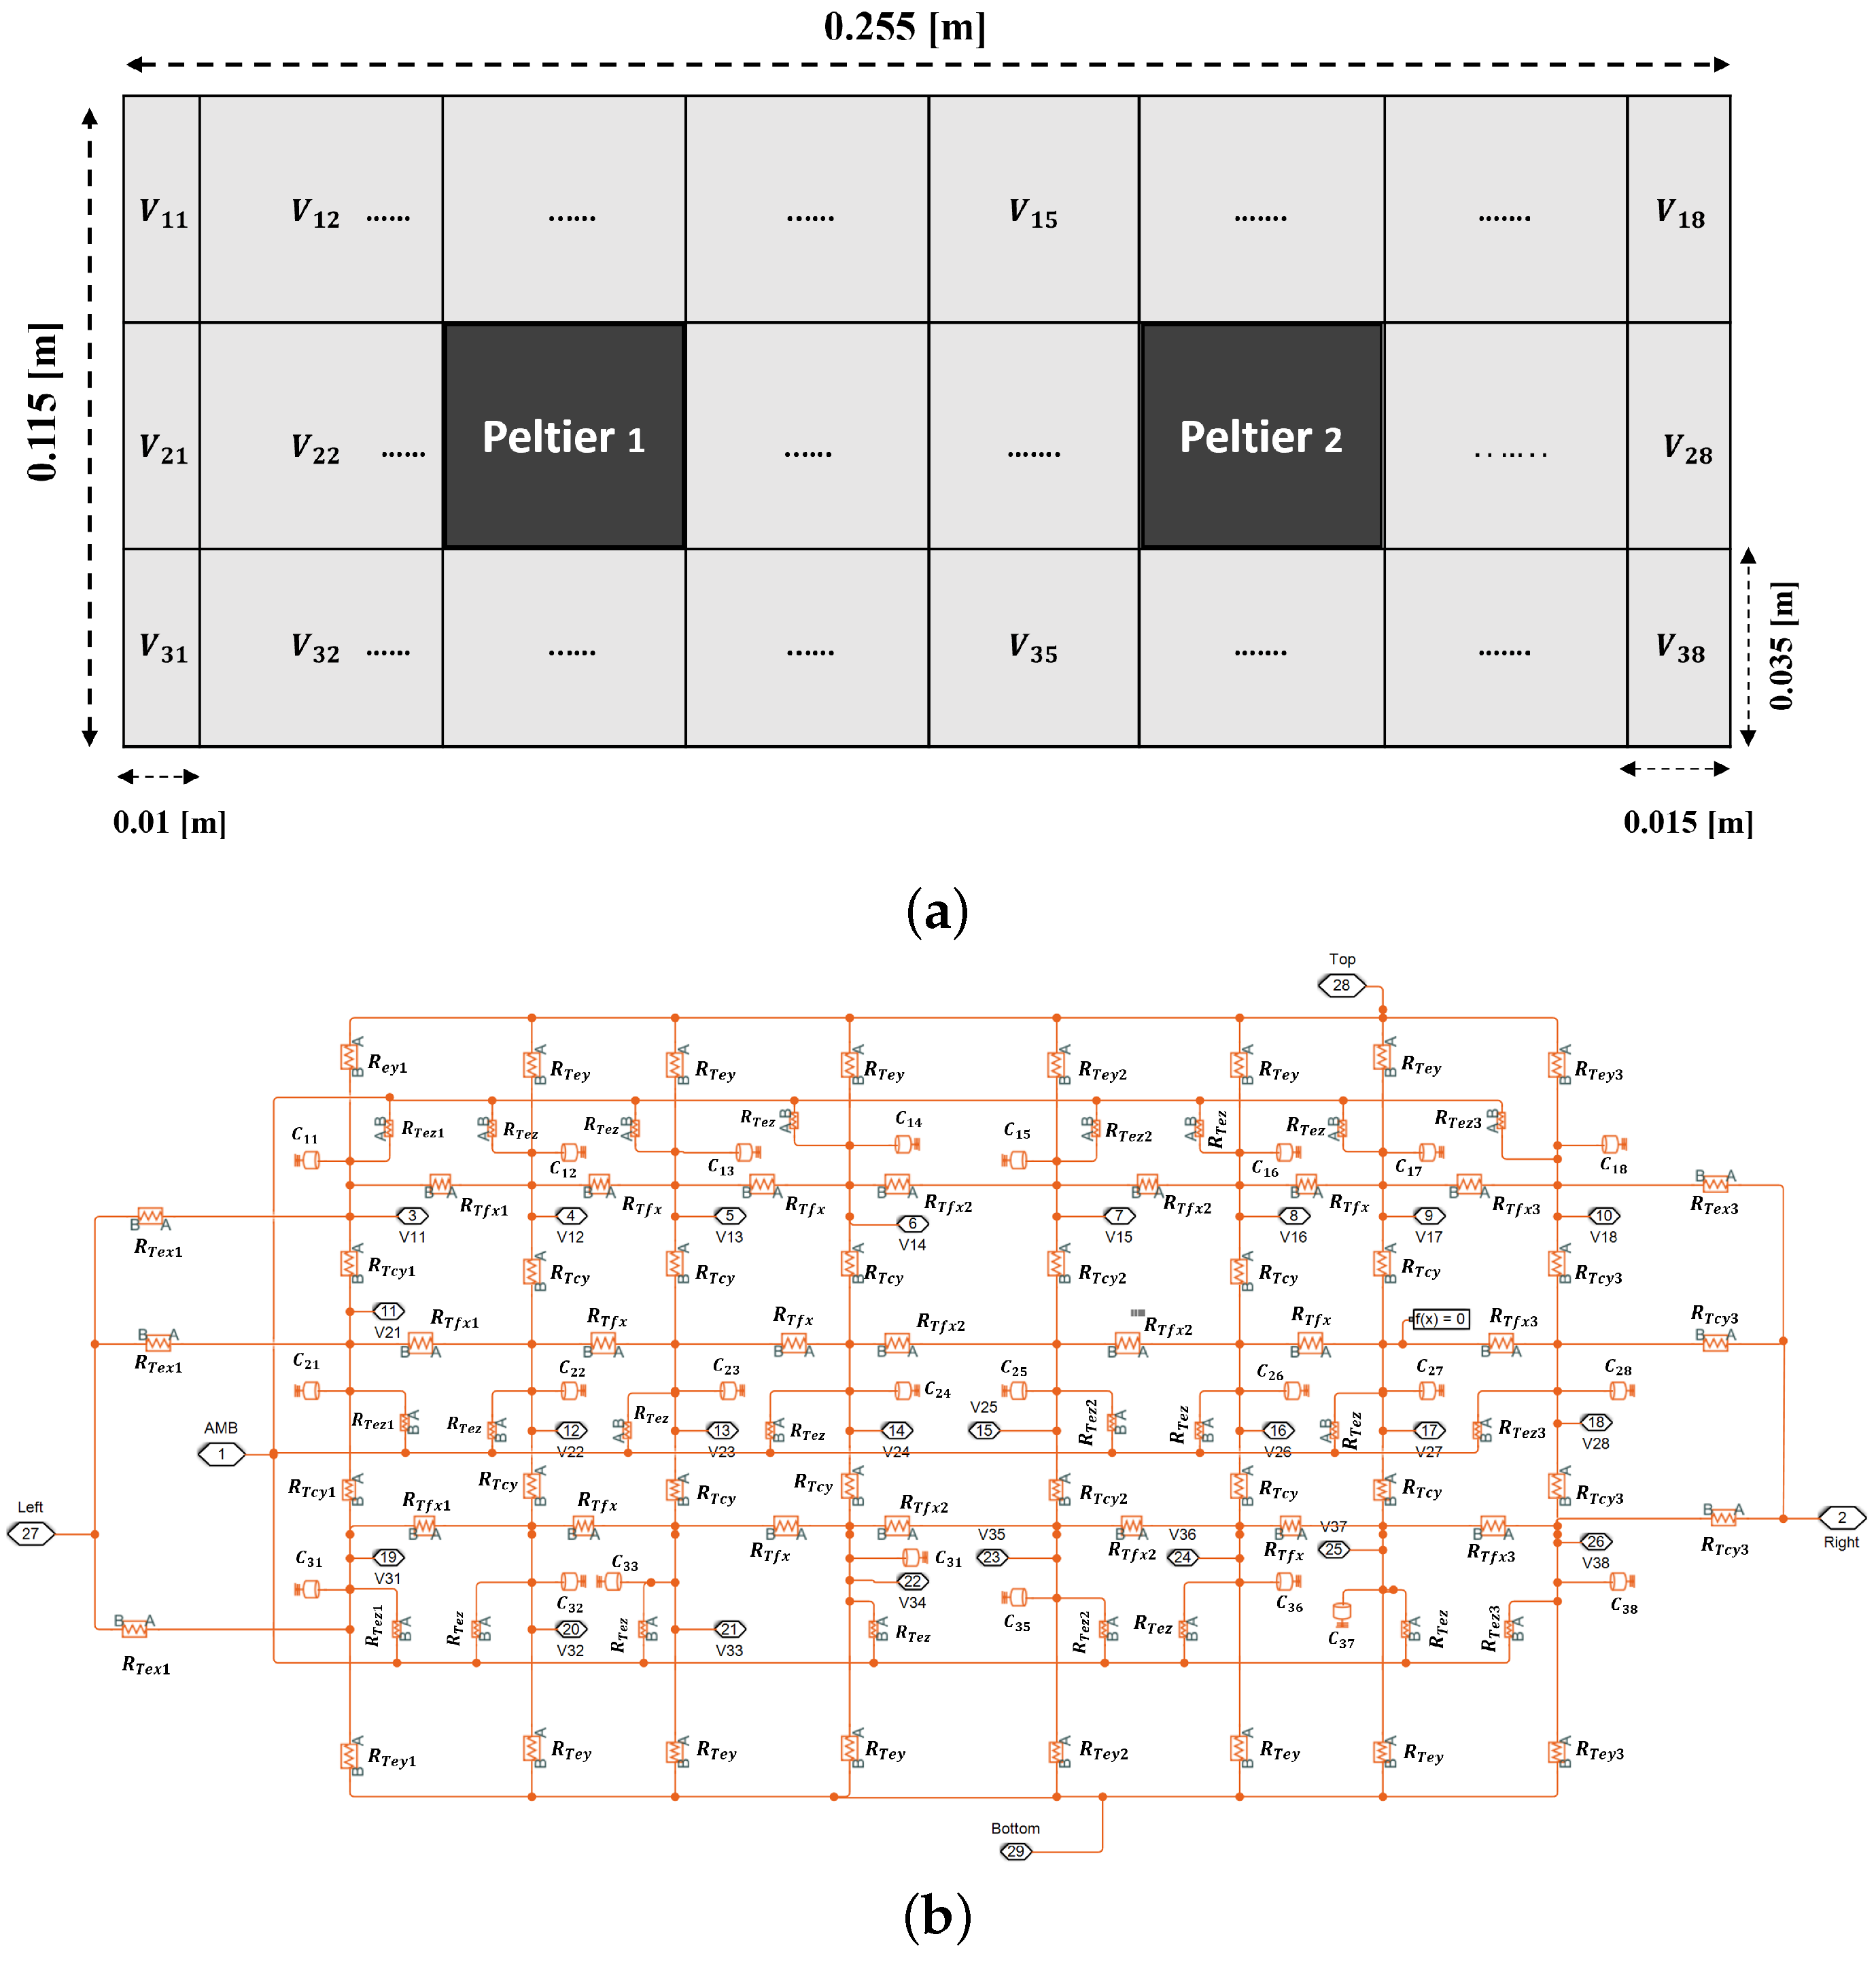
3.2.1. Thermal Distributed Element Circuit
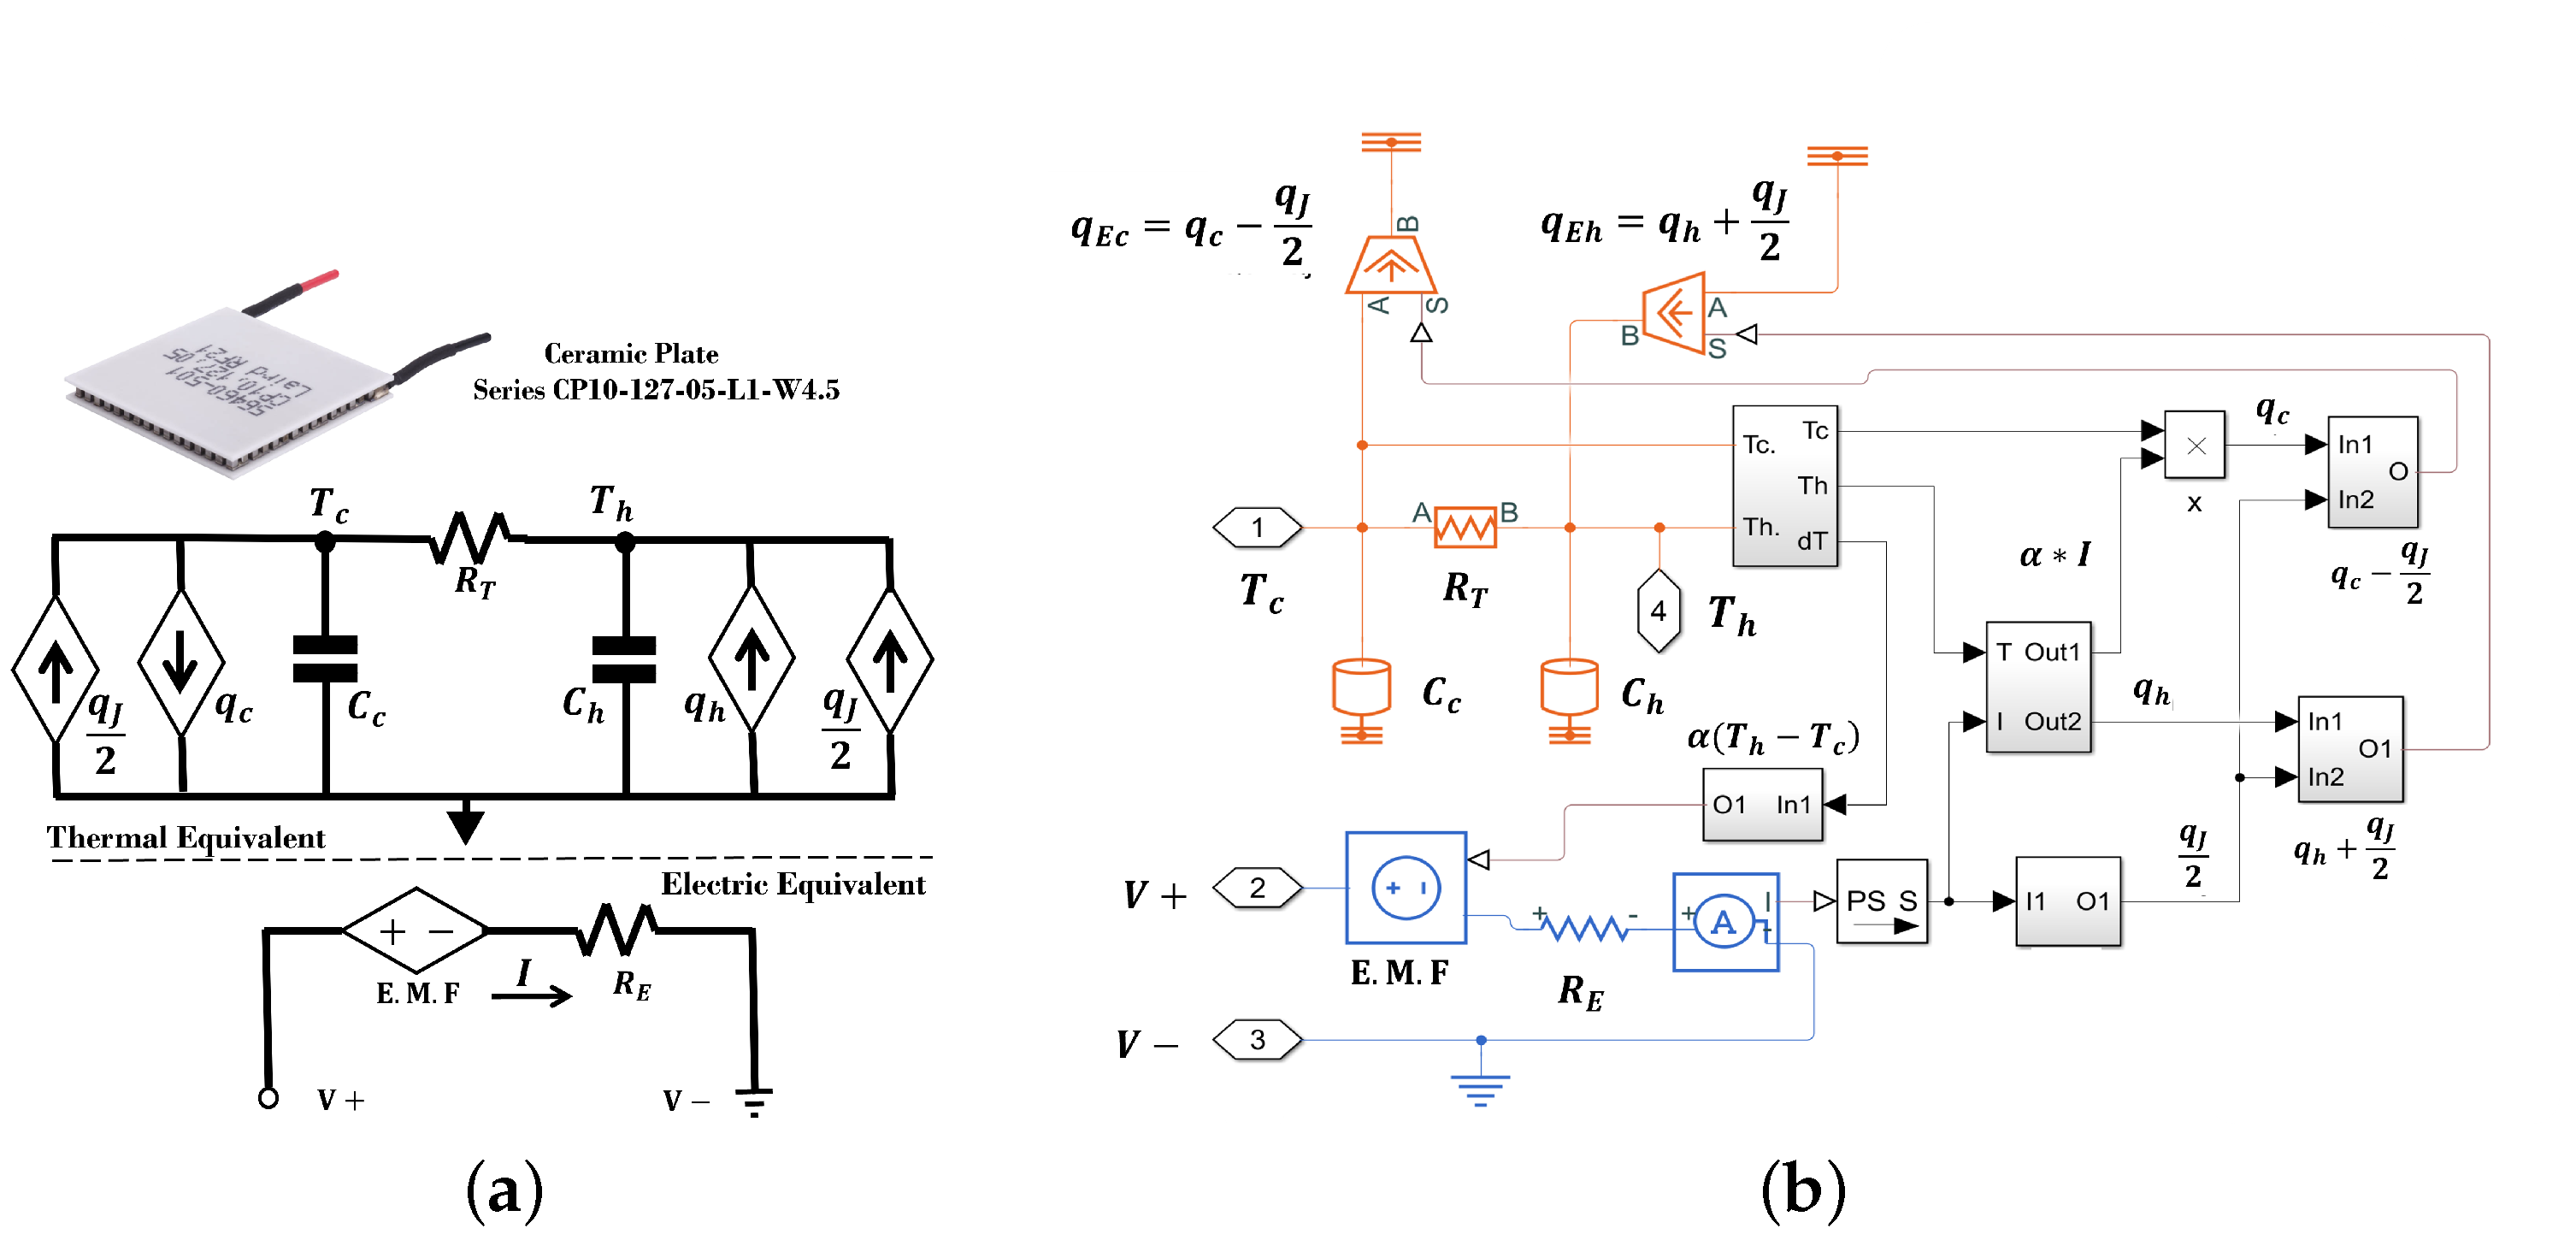
3.2.2. Peltier Thermoelectrical Equivalent Circuit
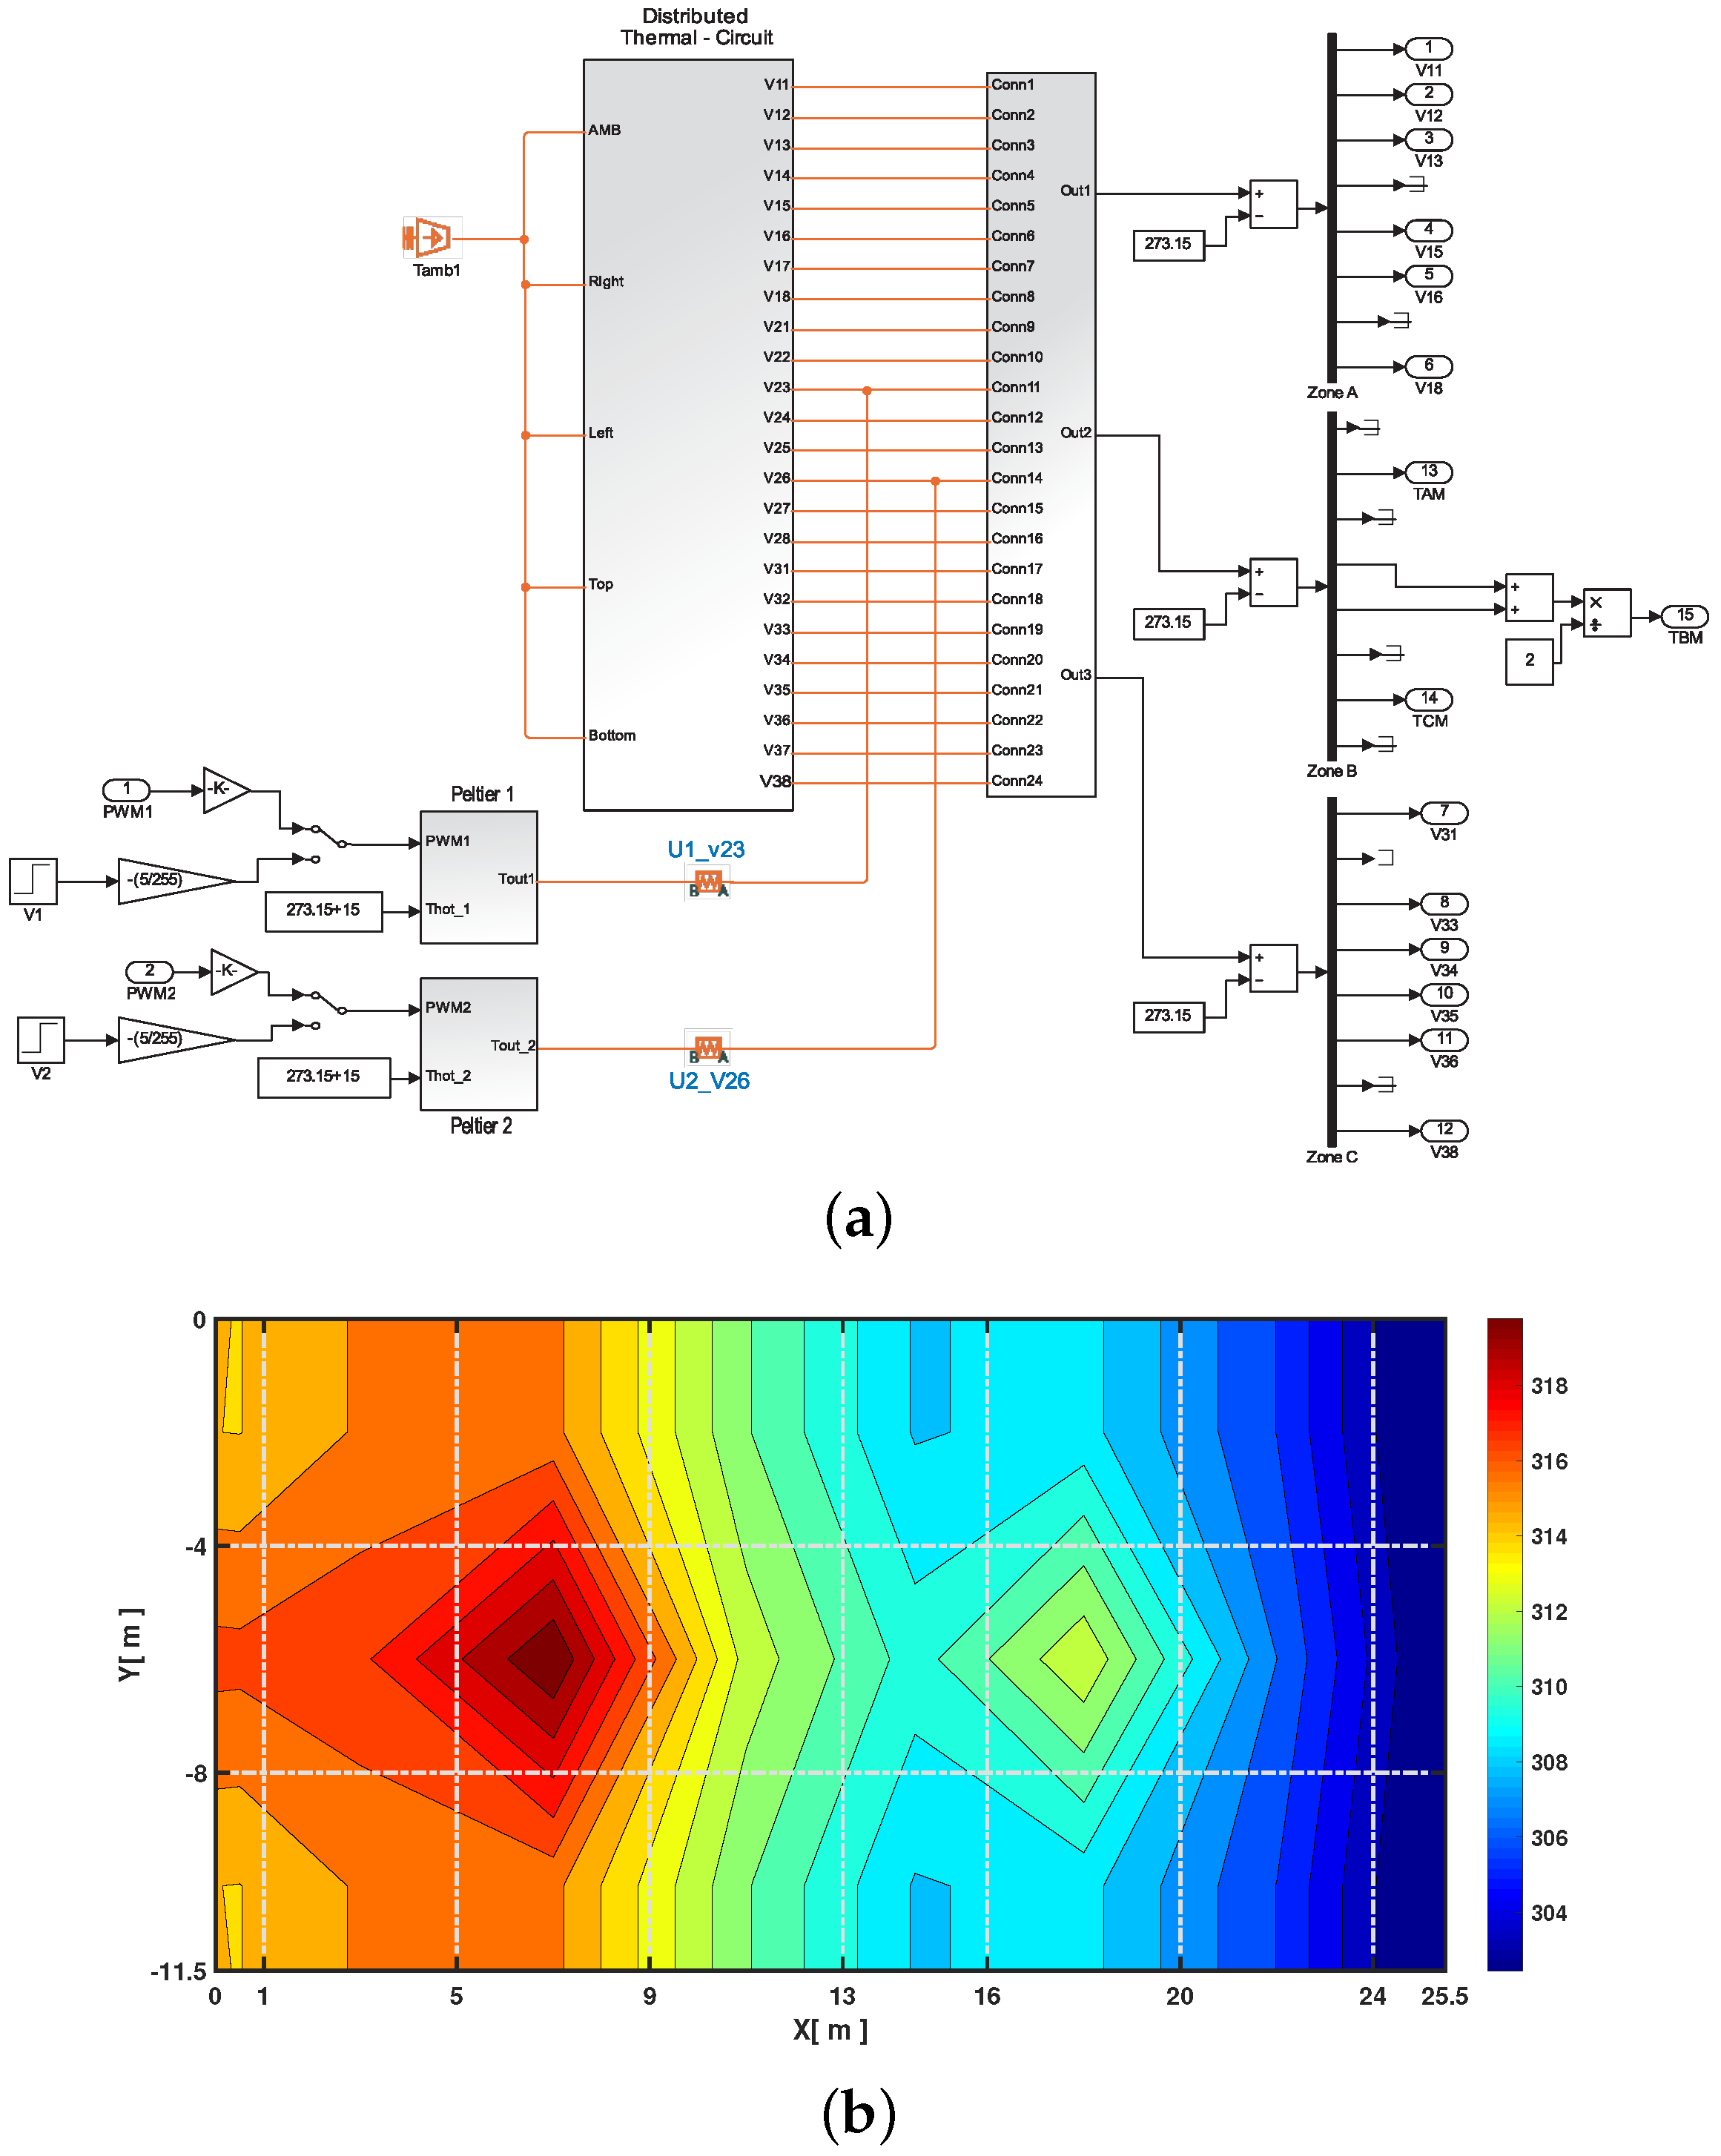
3.2.3. MIMO Digital Twin for the Uniformity Temperature Control System
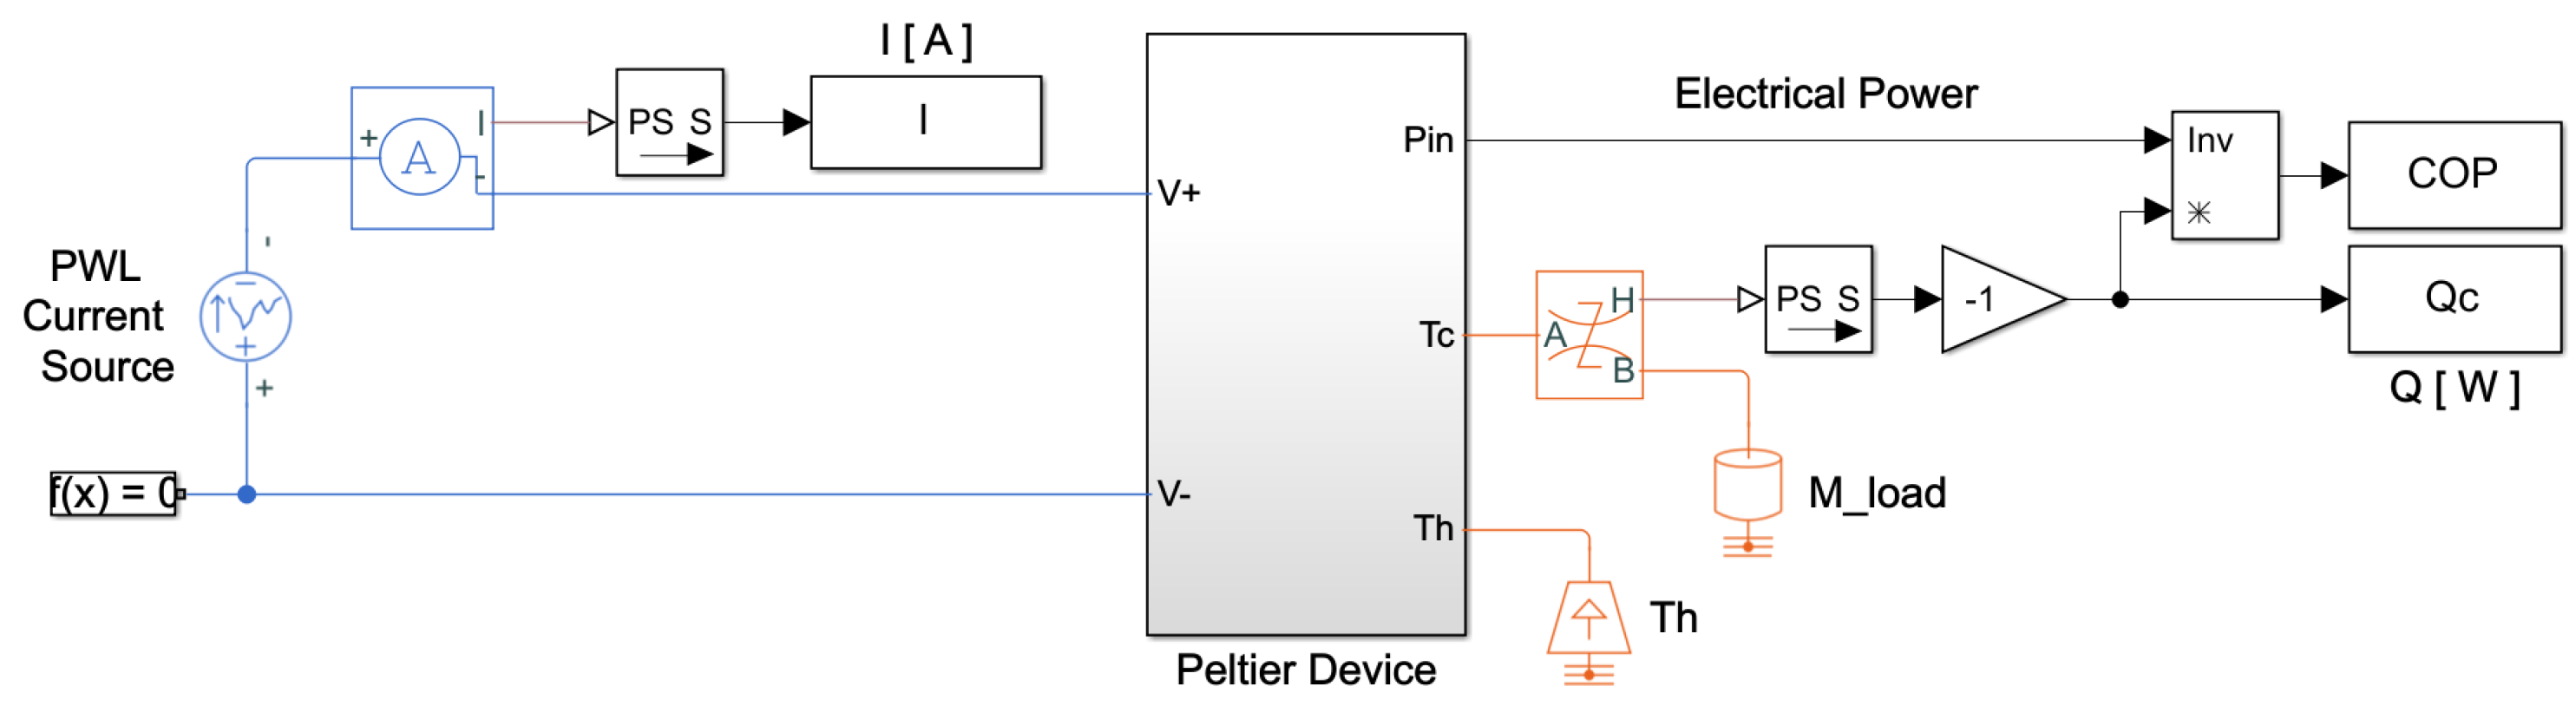
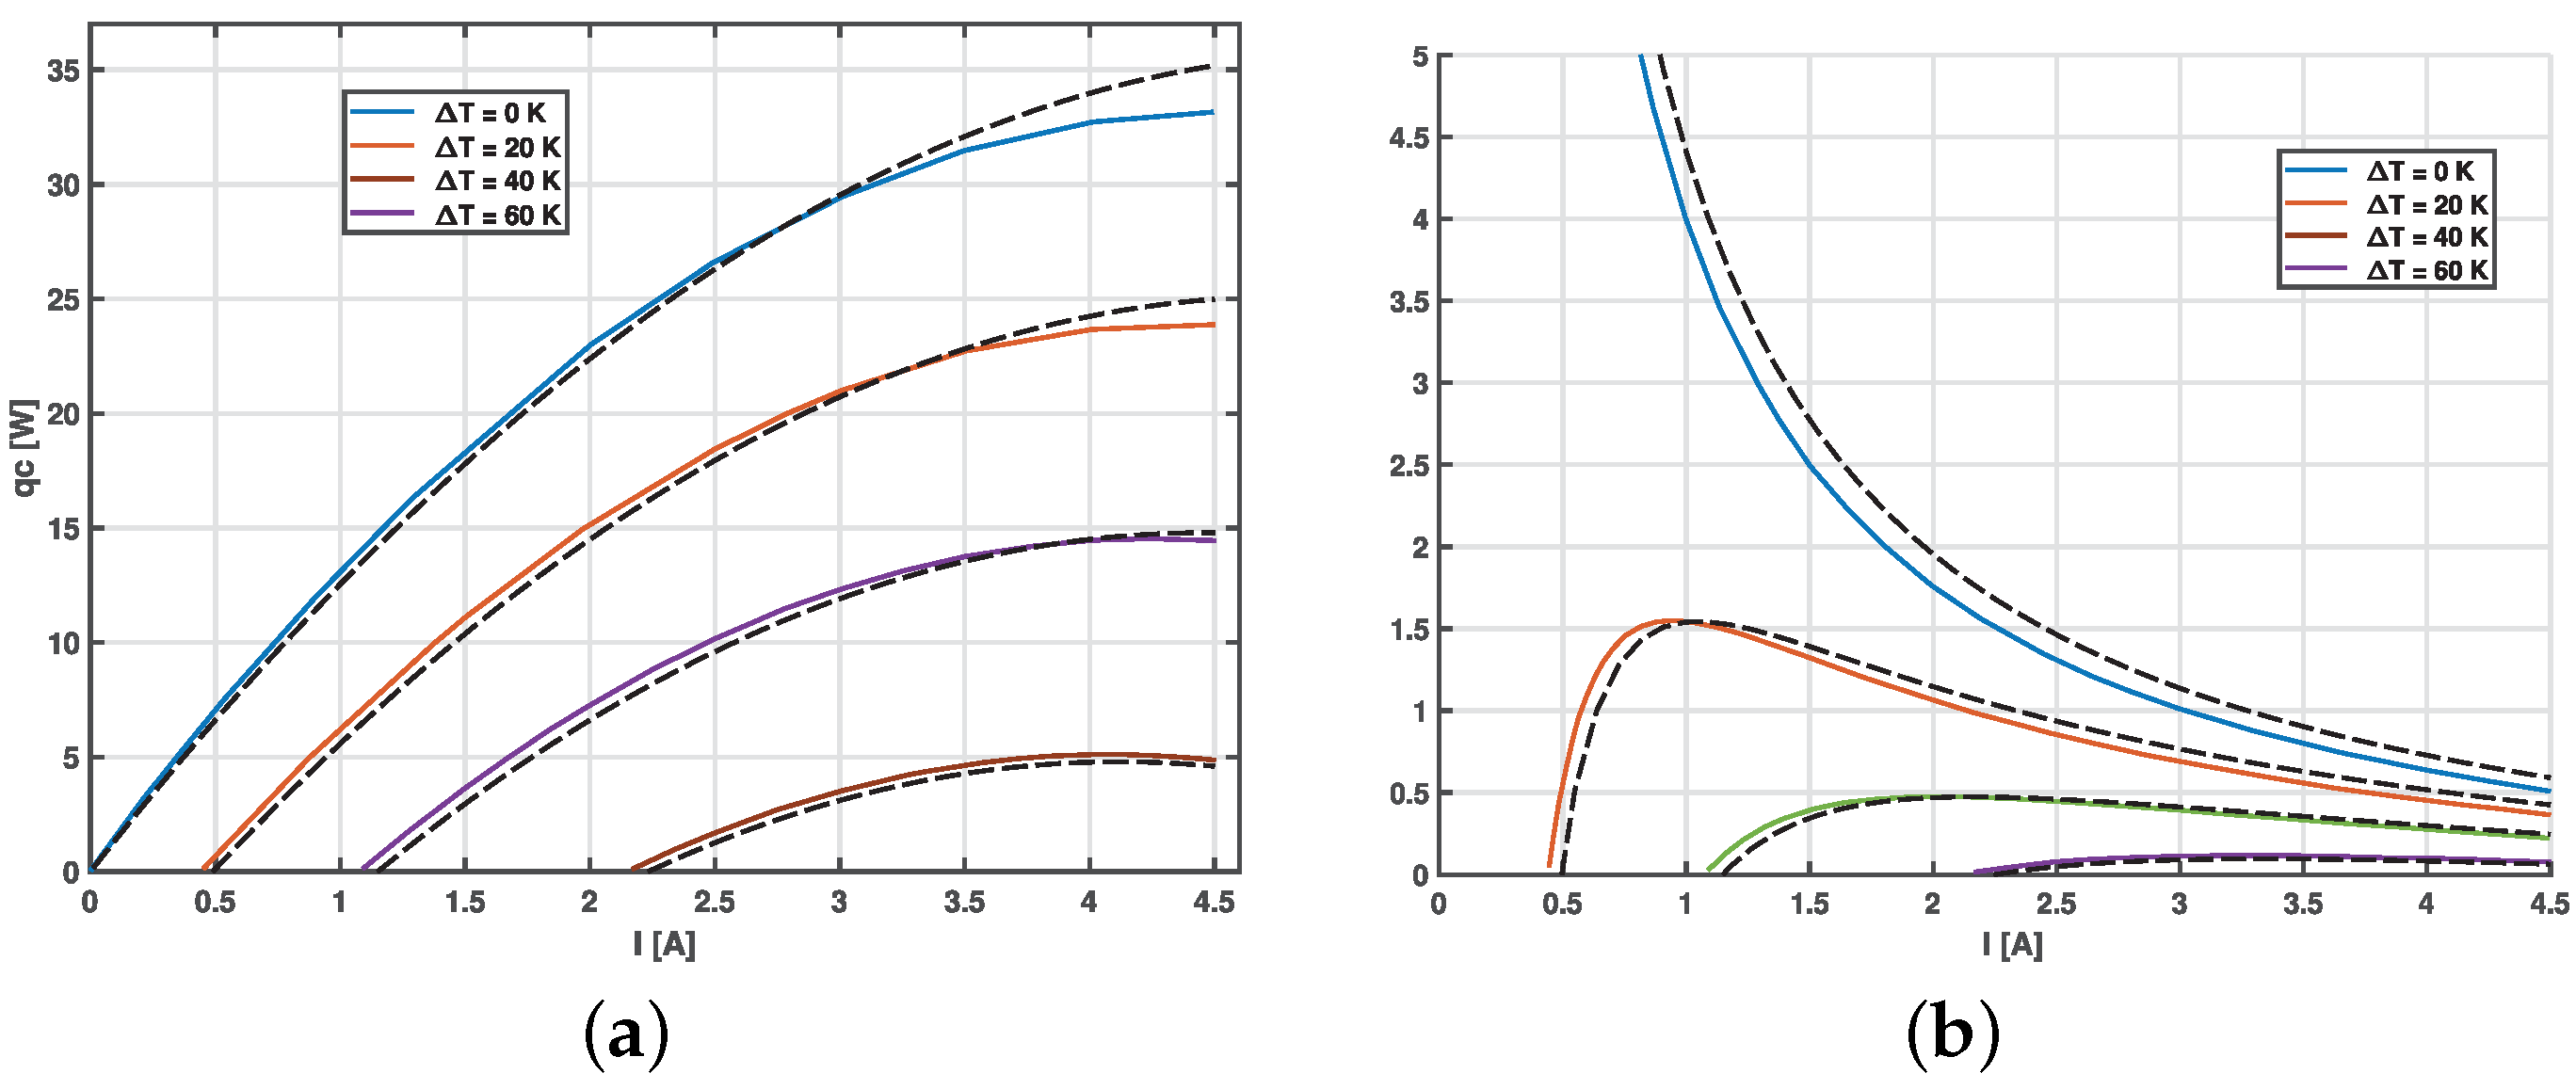
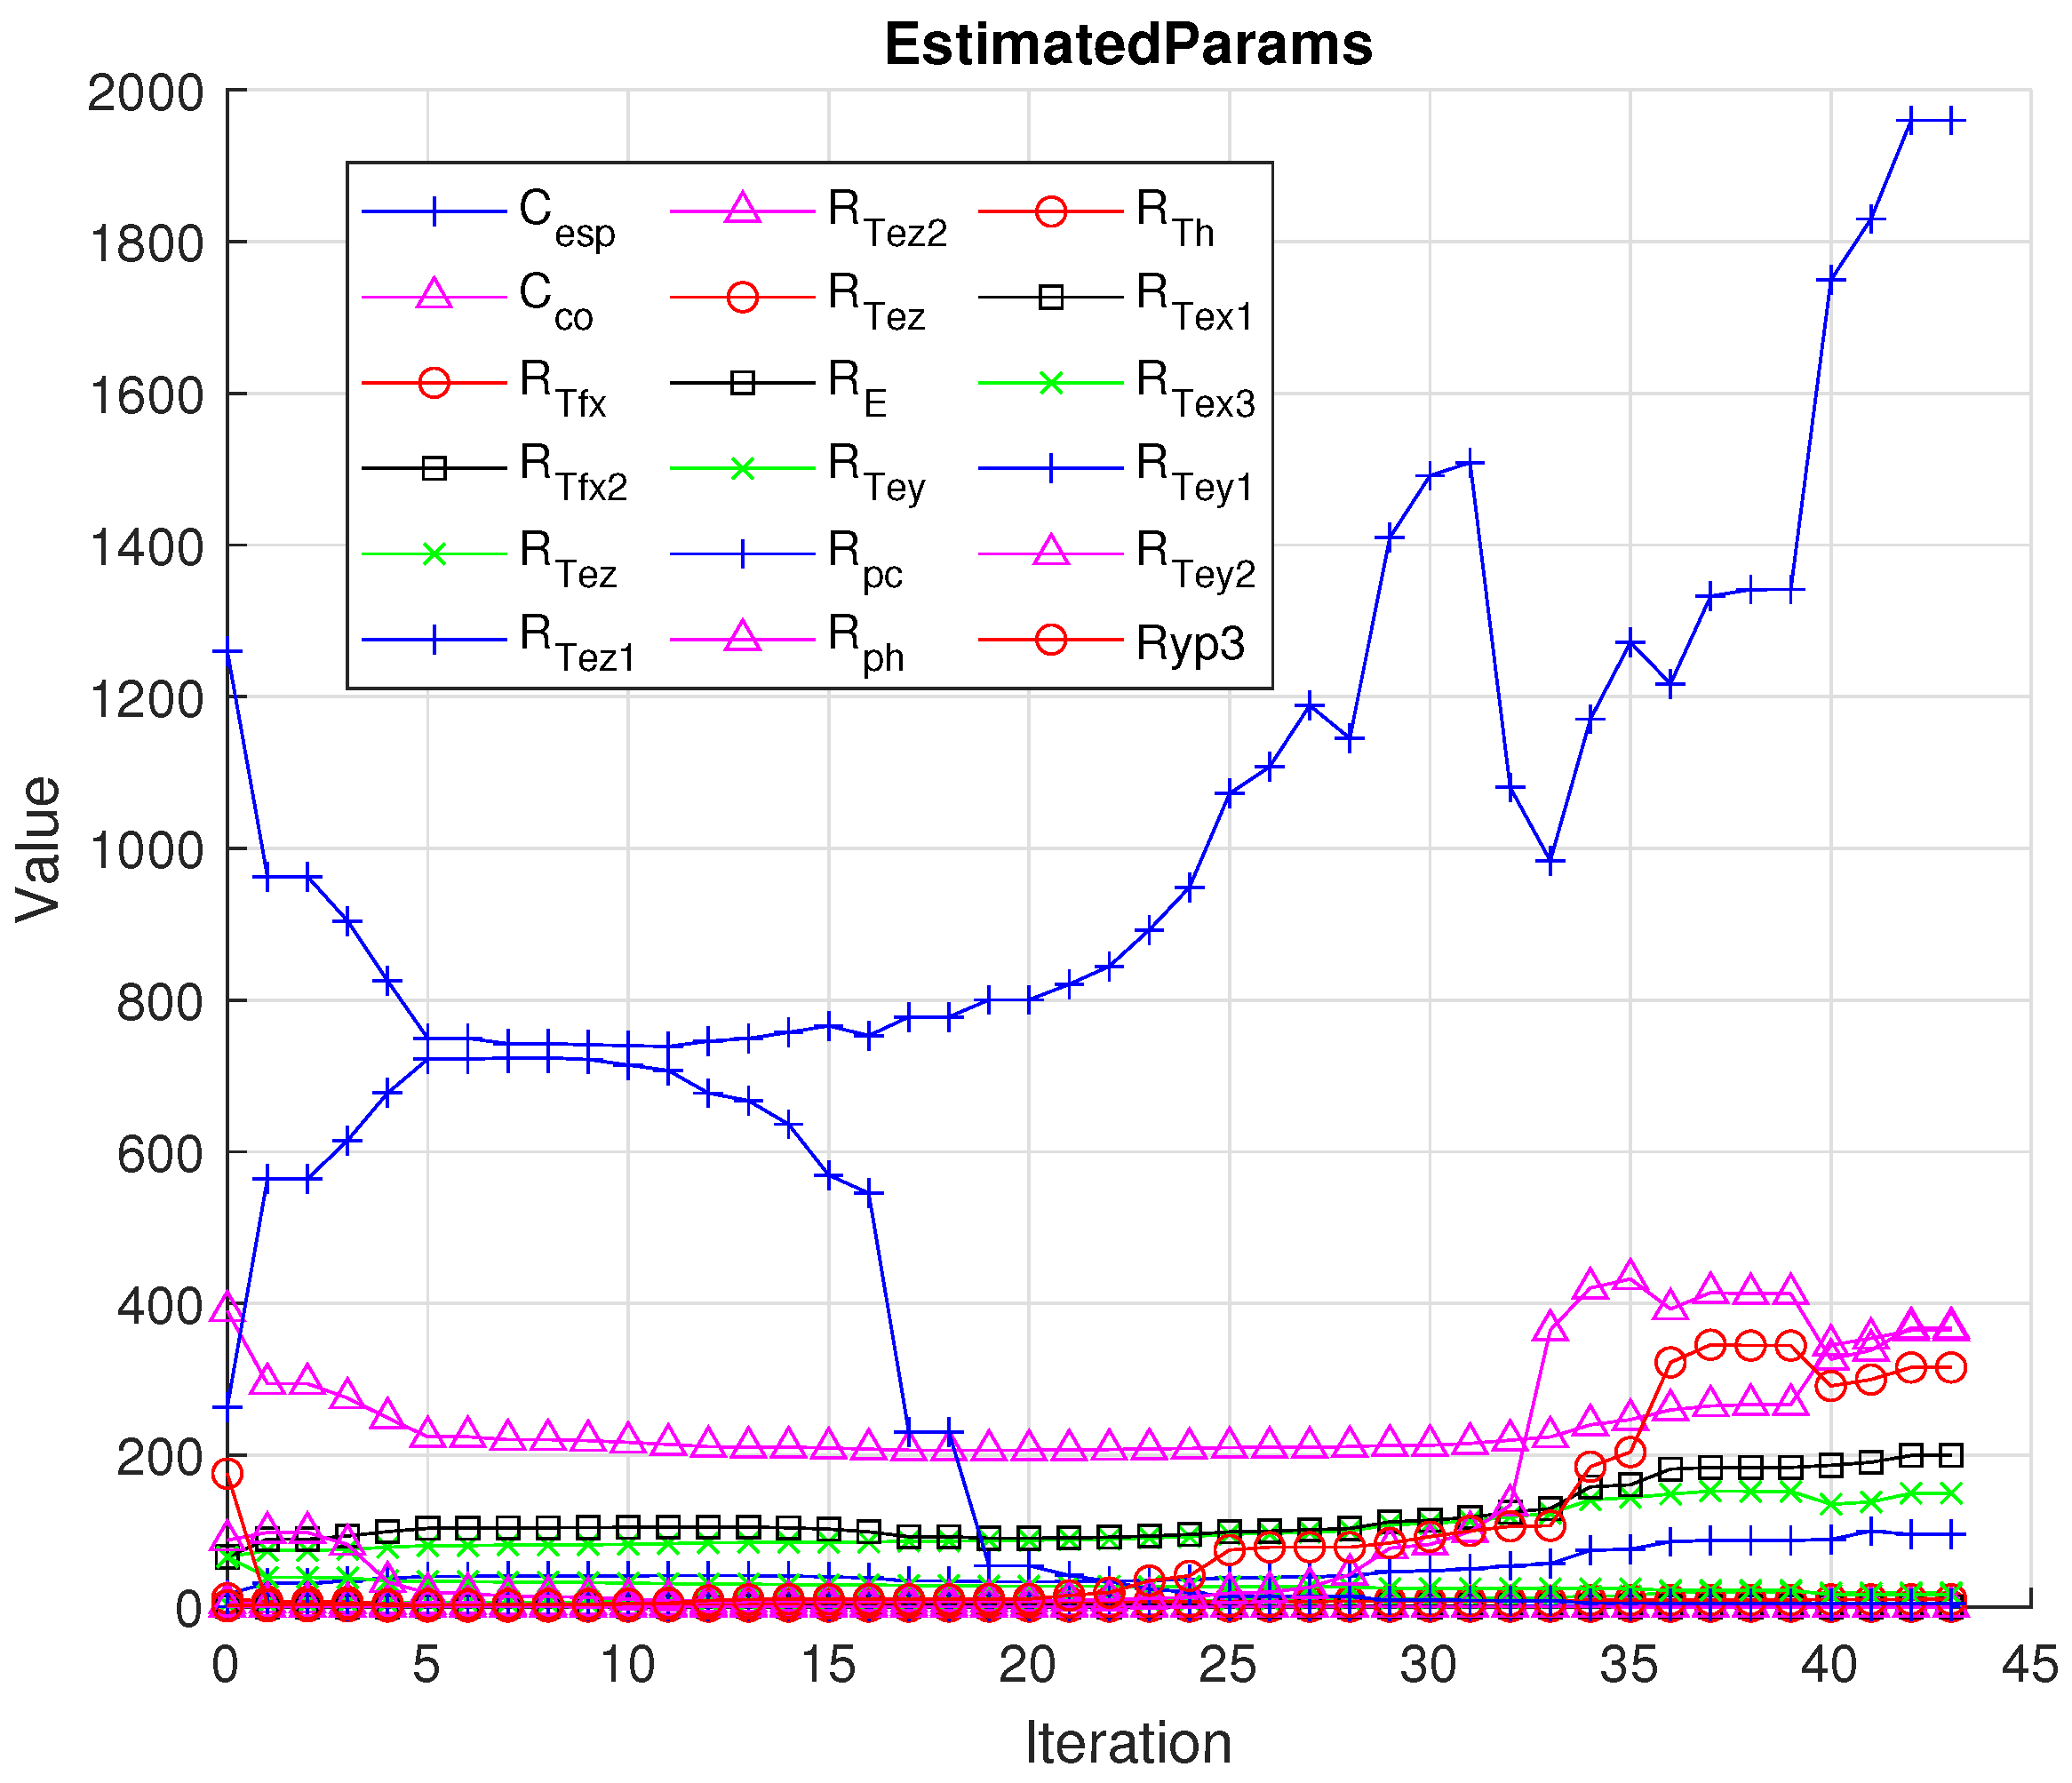
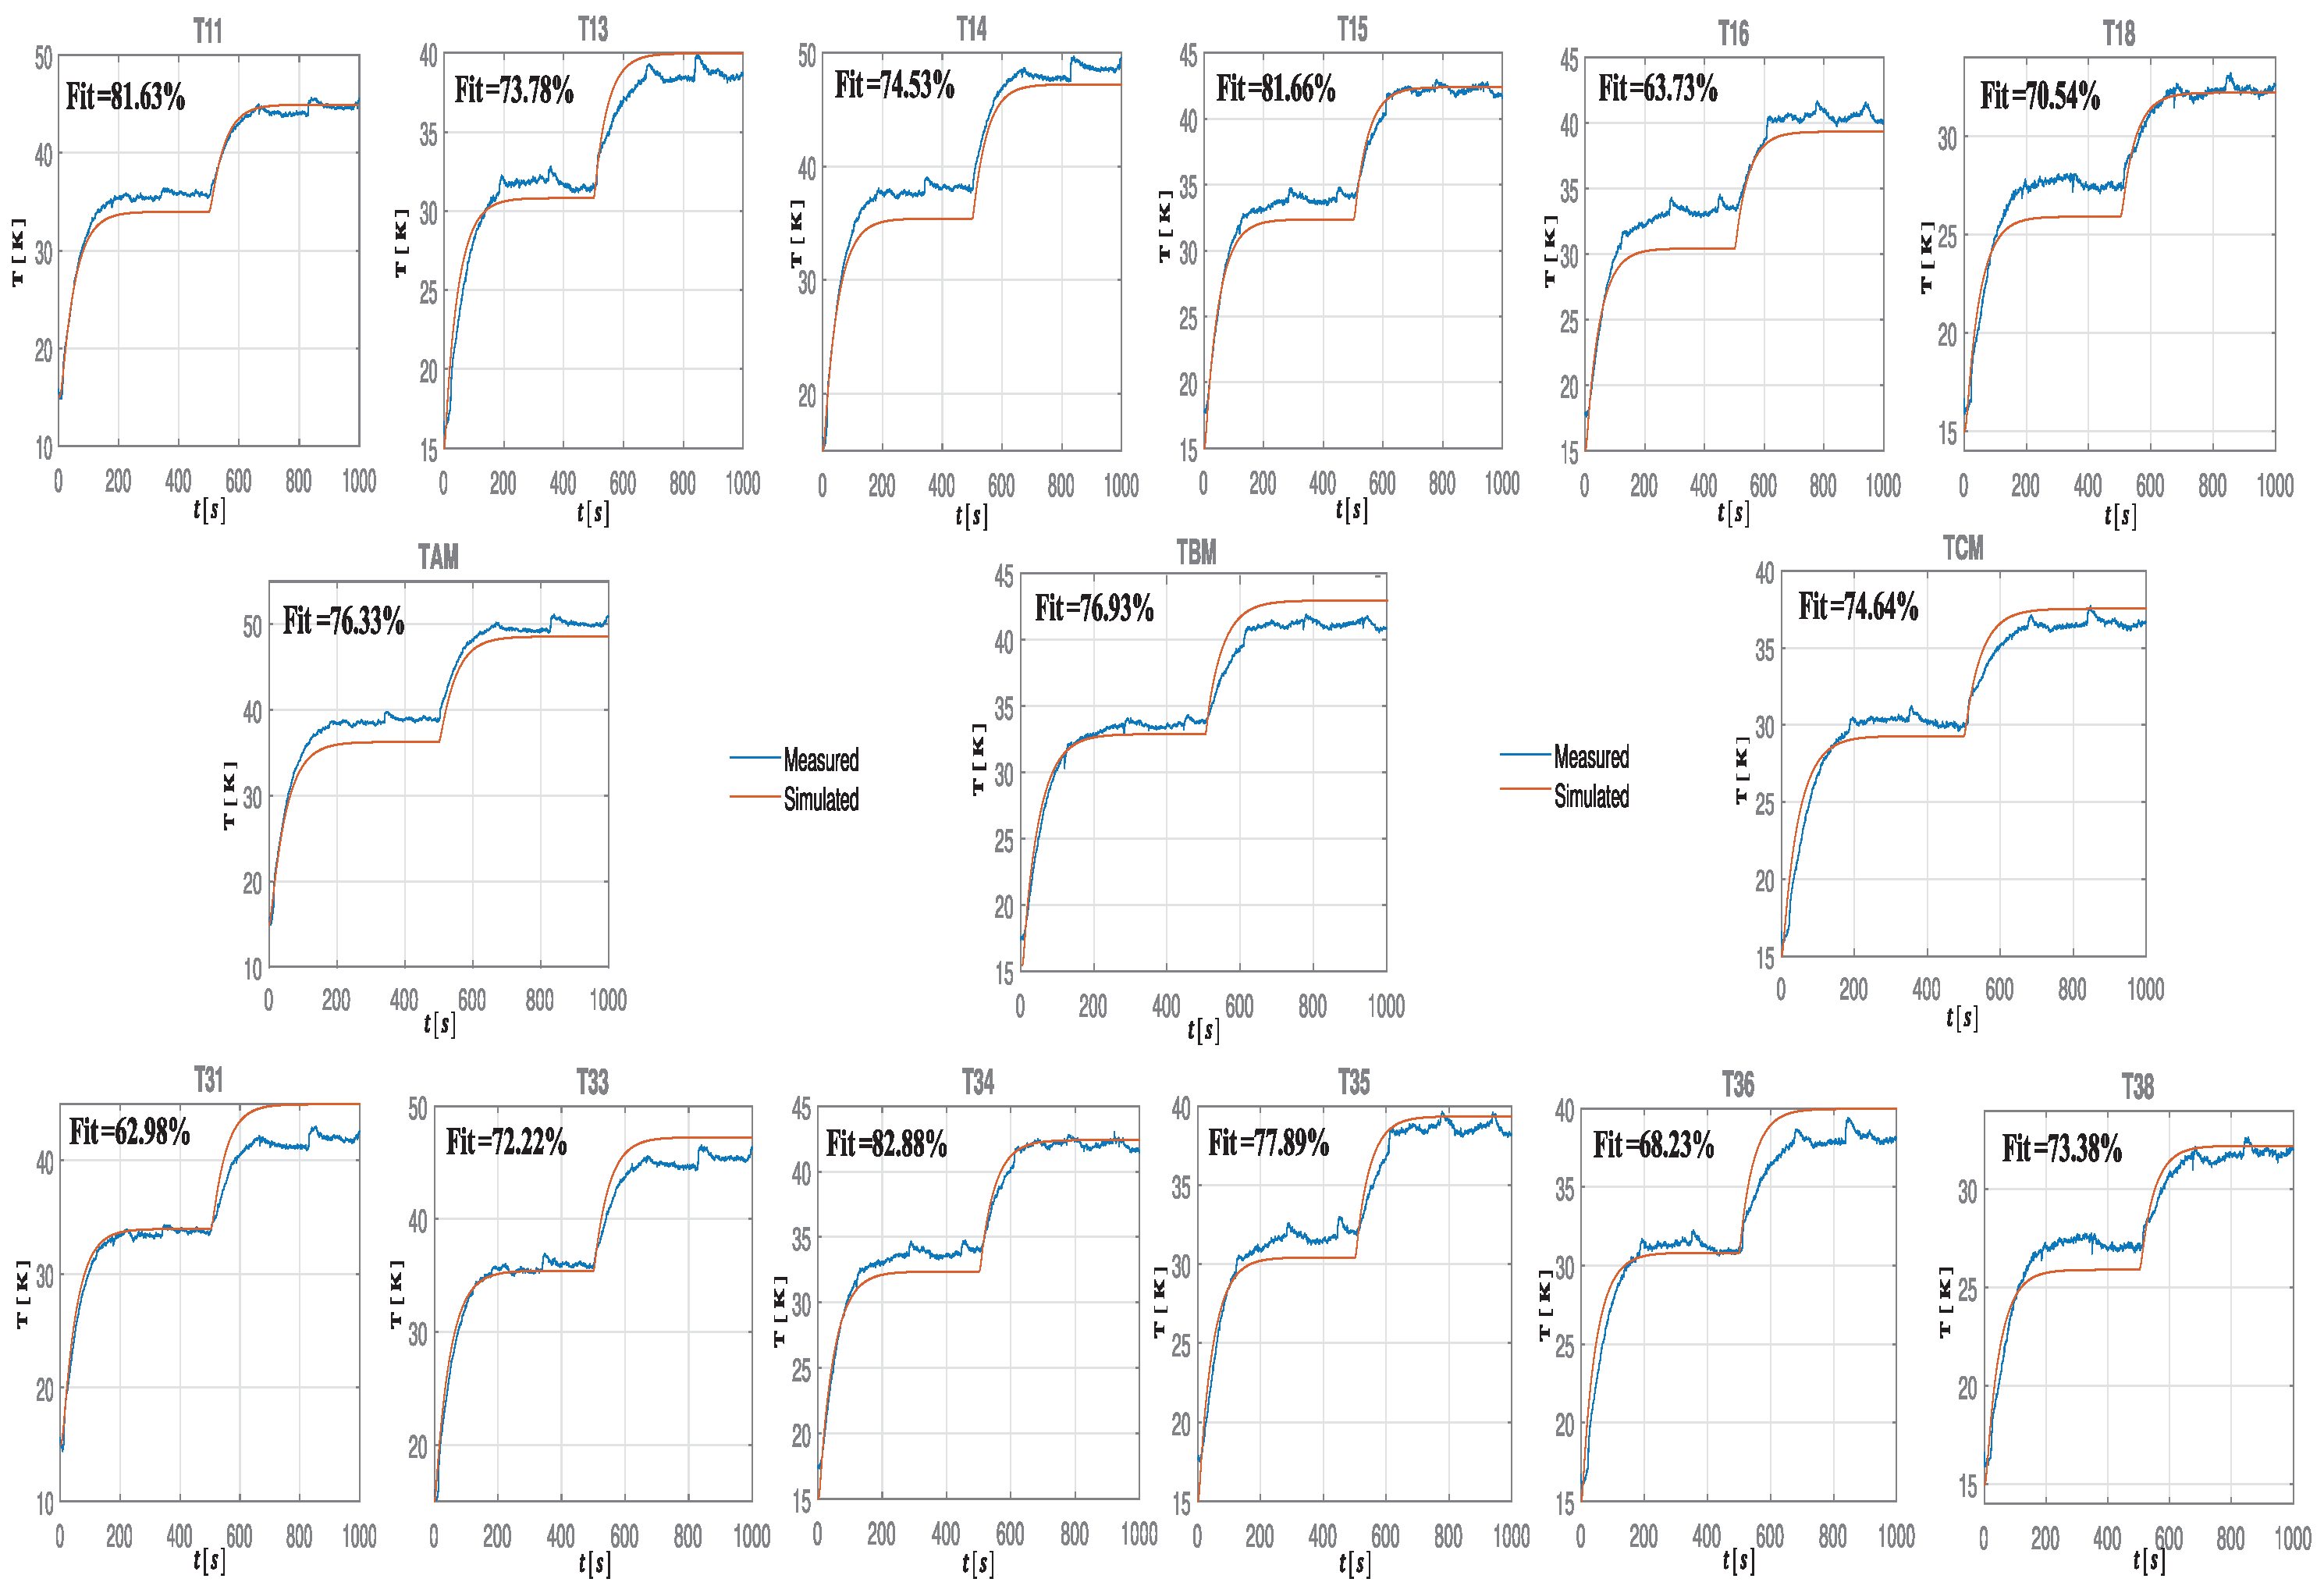
3.3. Fourth Step: Digital Twin Behavioral Matching
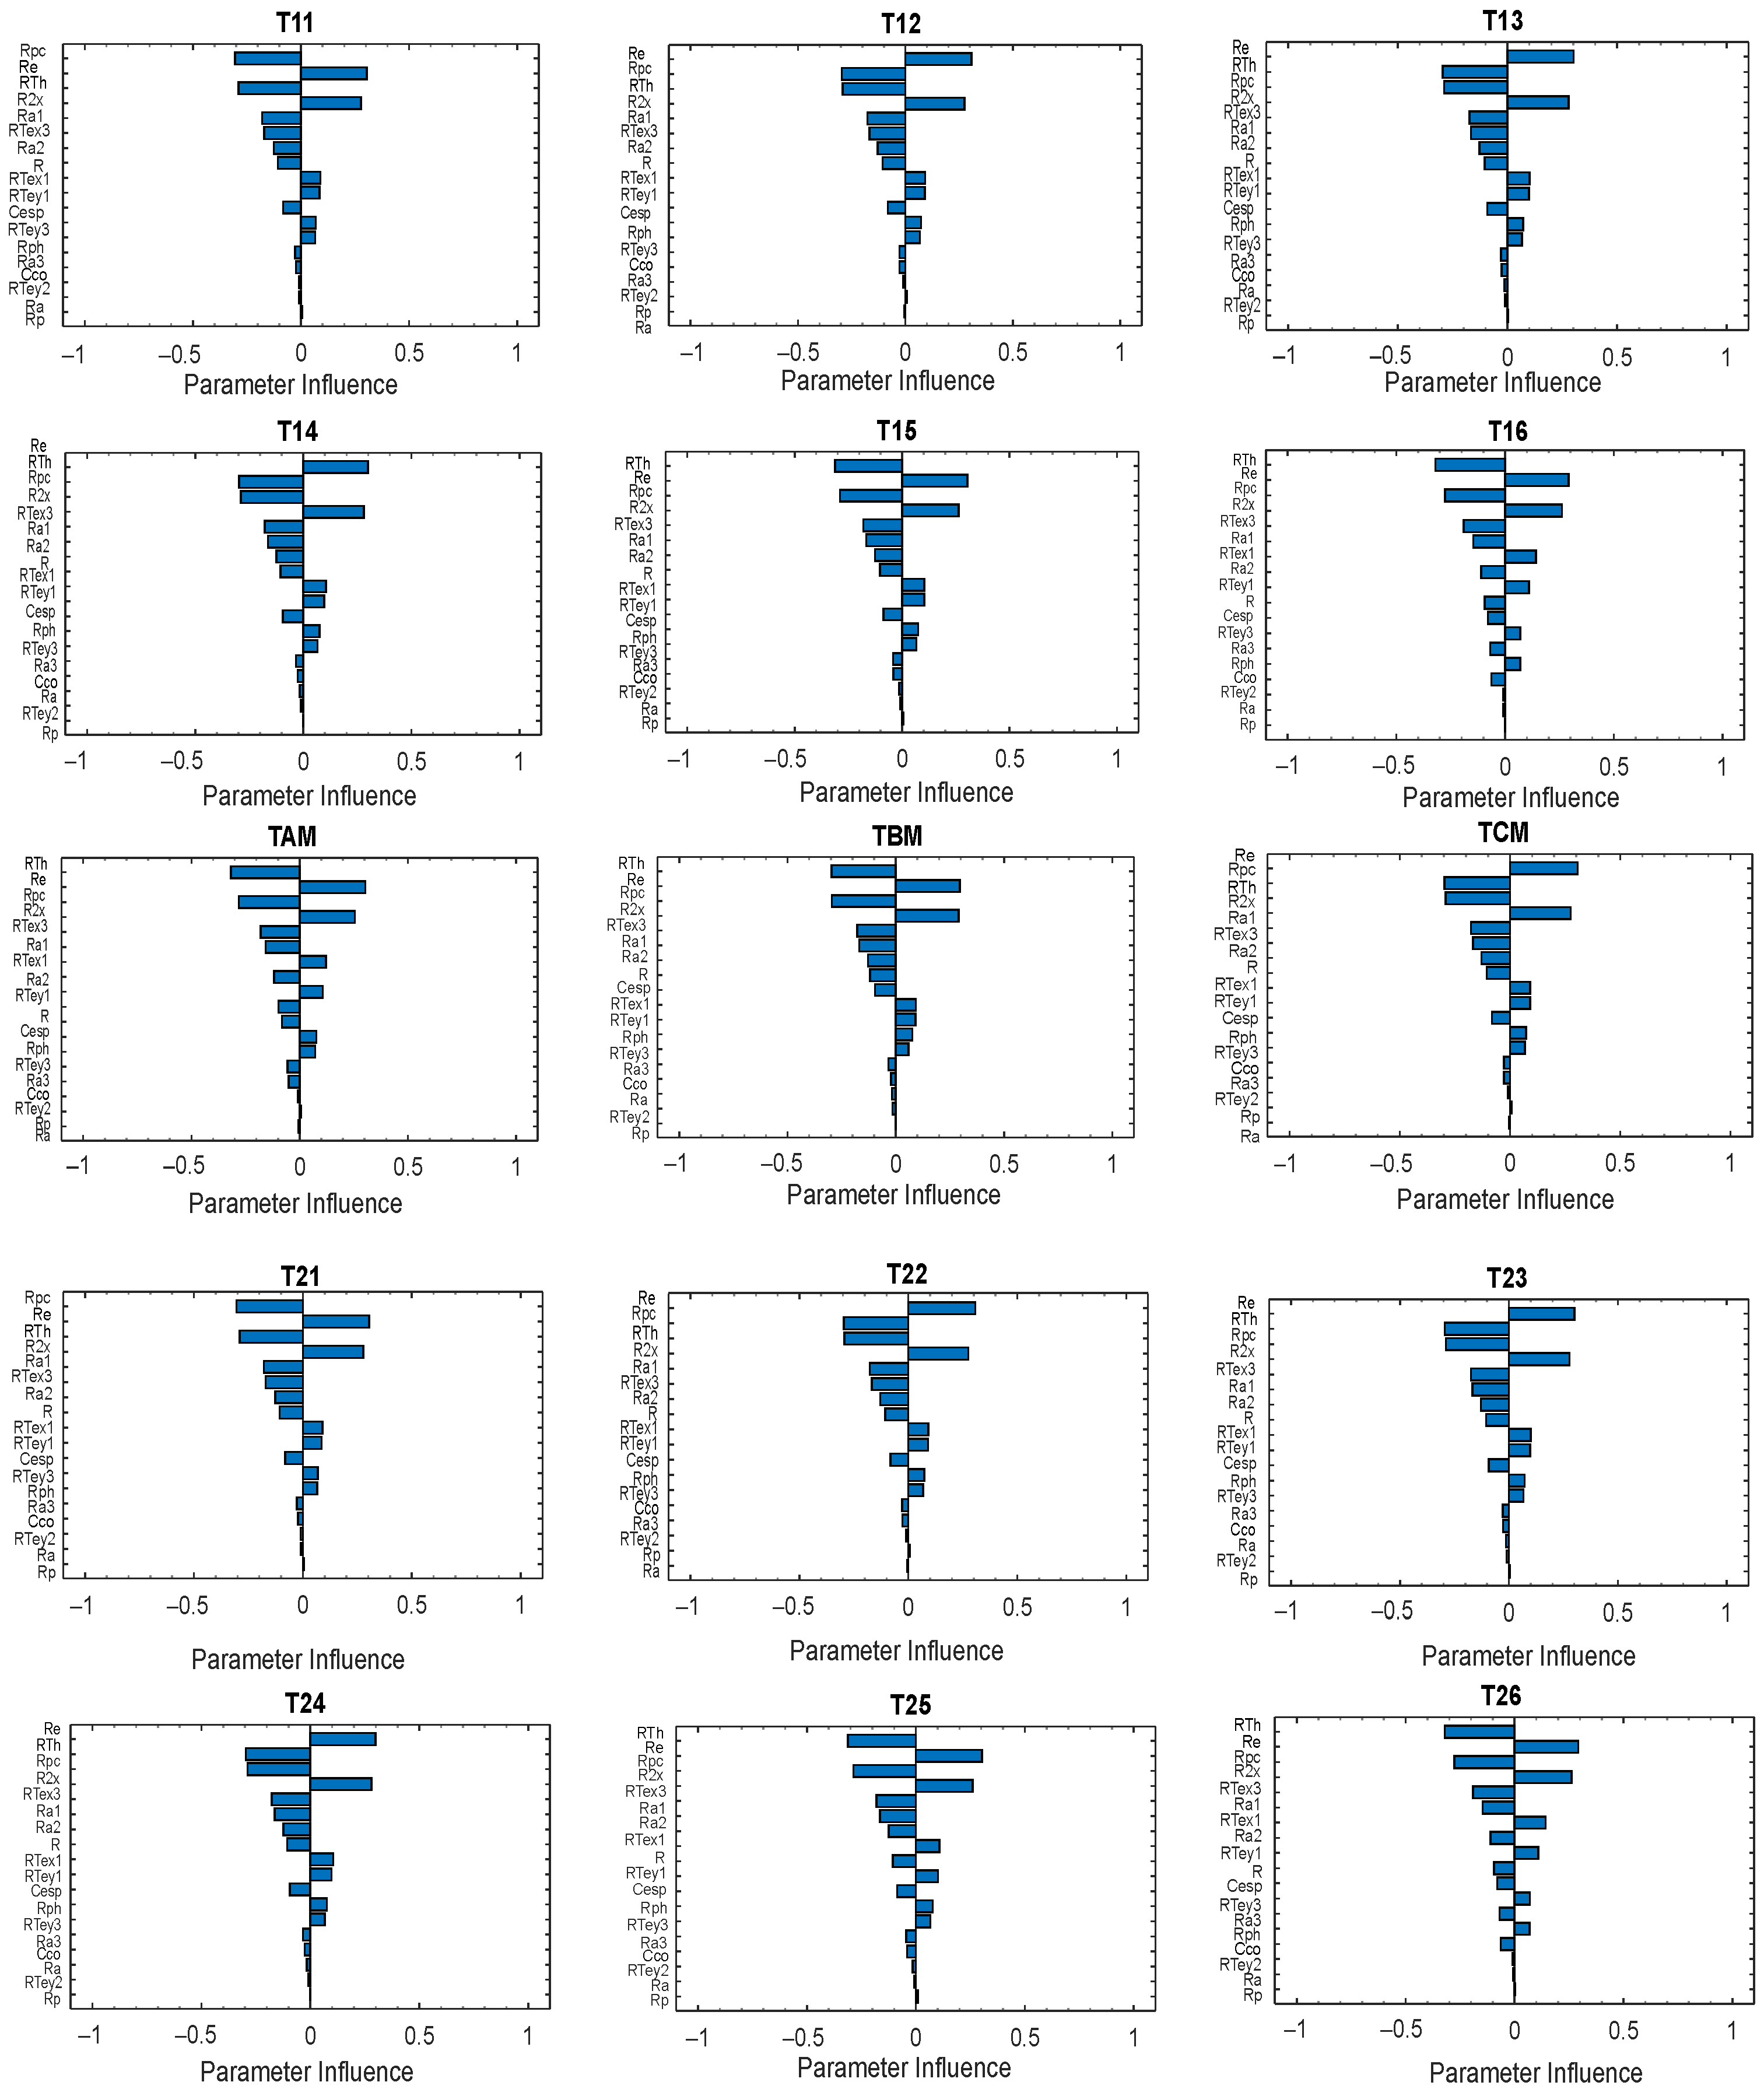
3.4. Sensitivity Analysis
3.5. Result Discussion and Next Steps towards Digital Twin-Enabled Capabilities
4. Conclusions and Future Works
Author Contributions
Funding
Data Availability Statement
Conflicts of Interest
Abbreviations
| BM | Behavioral Machine |
| CAD | Computer-Aided Design |
| CAM | Computer-Aided Manufacturing |
| COP | Coefficient of Performance |
| DT | Digital Twin |
| EMF | Electromotive Force |
| HIL | Hardware in the Loop |
| MIMO | Multiple Input Multiple Output |
| MOSFET | Metal Oxide Semiconductor Field Effect Transistor |
| PID | Proportional Integral Derivative |
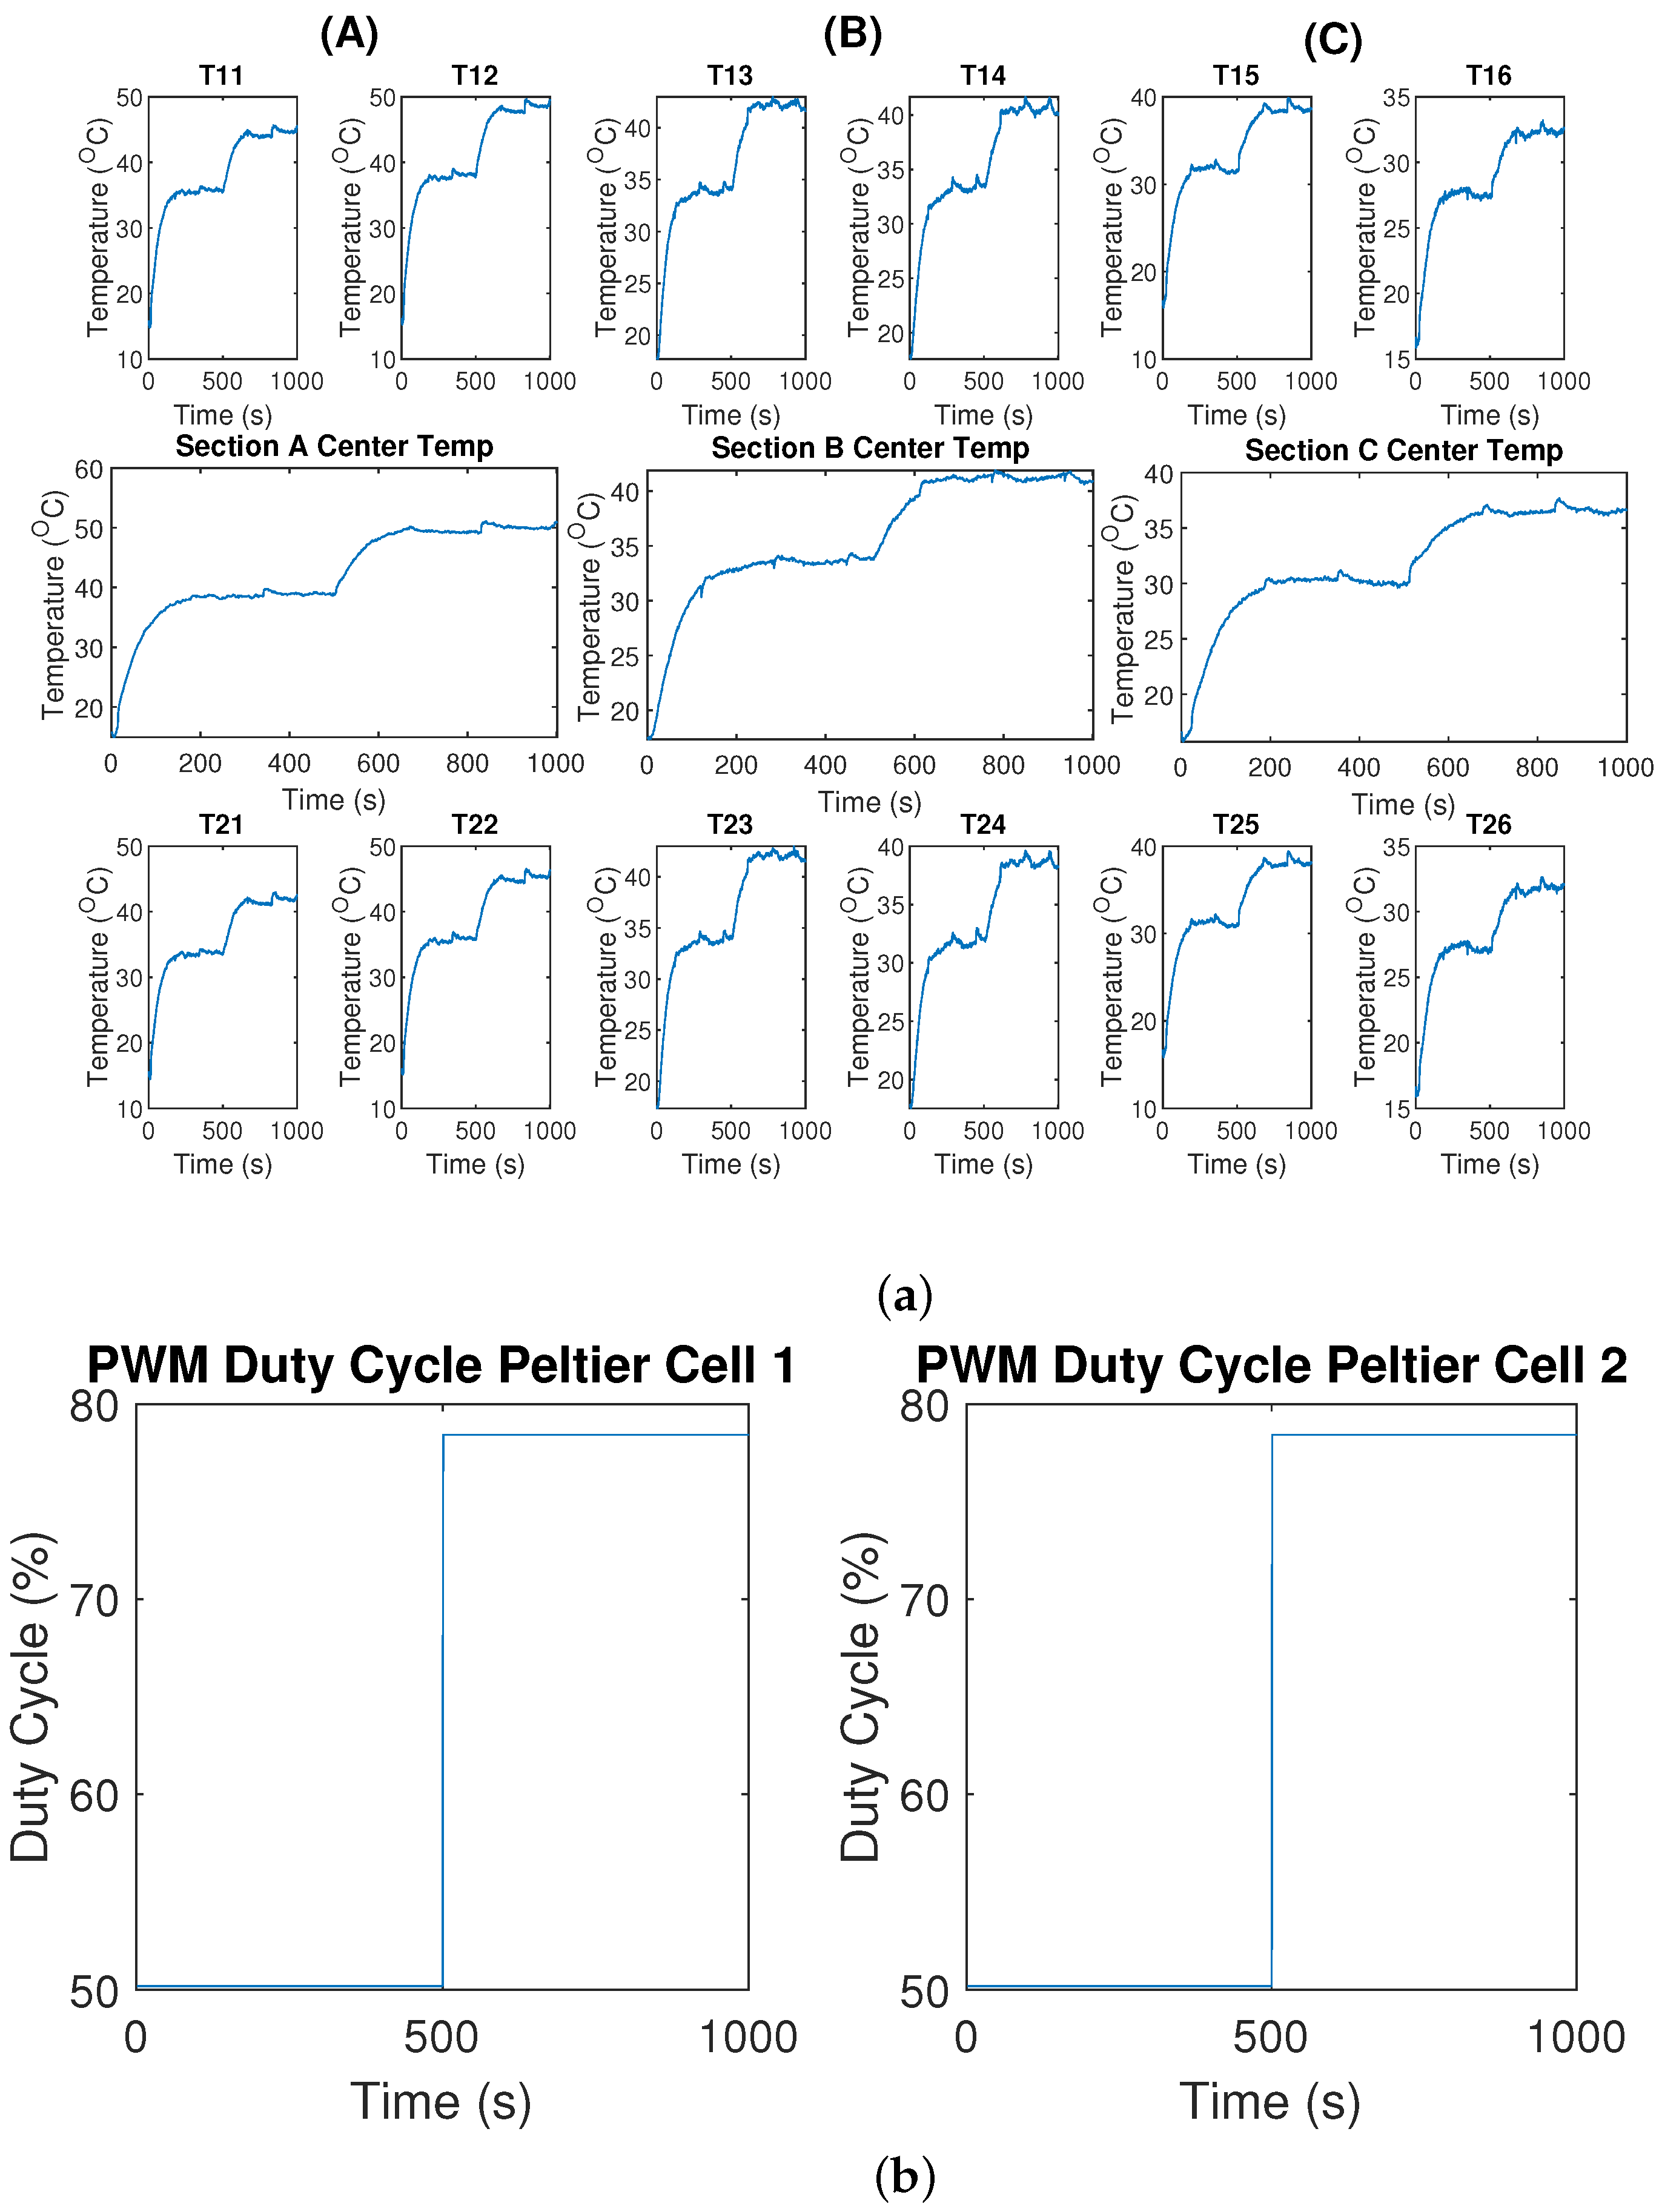
| PWM | Pulse Width Modulation |
| SLDO | Simulink Design Optimization |
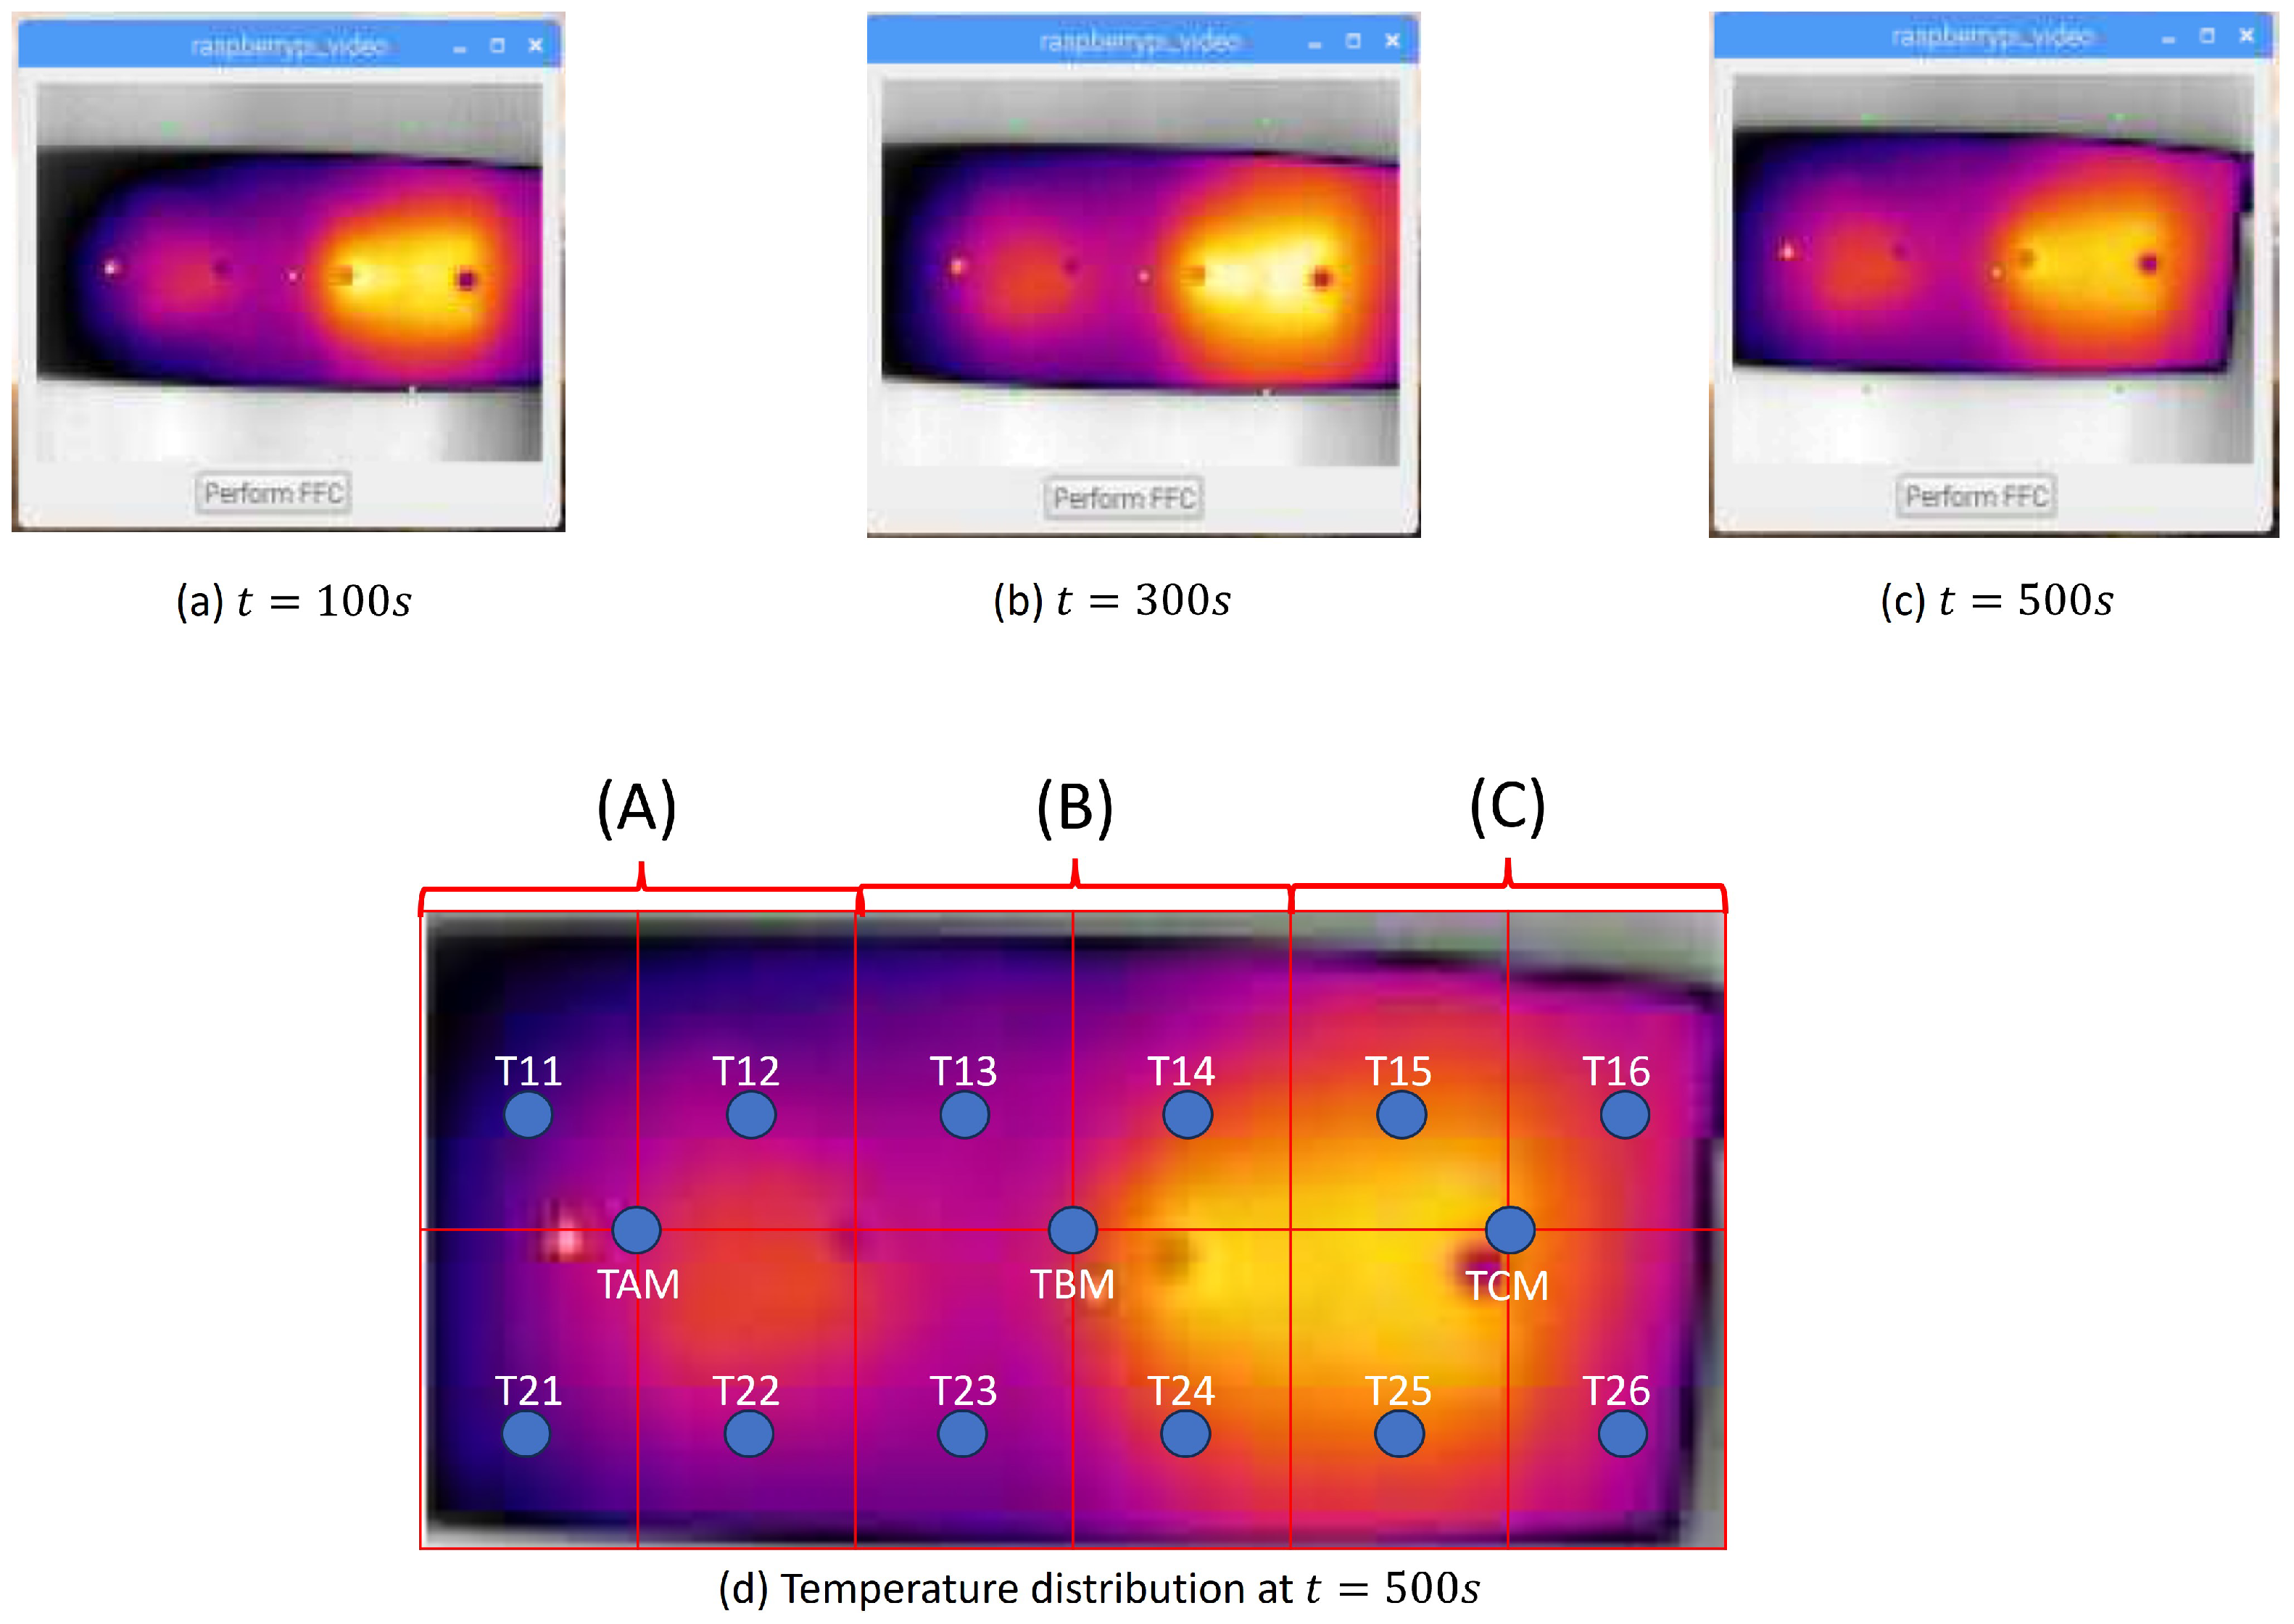
| TAM | Temperature Central Tap Heating Zone A |
| TBM | Temperature Central Tap Heating Zone B |
| TCM | Temperature Central Tap Heating Zone C |
| TCP-IP | Transmission Control Protocol/Internet Protocol |
References
- Fraczyk, A.; Kucharski, J. Surface temperature control of a rotating cylinder heated by moving inductors. Appl. Therm. Eng. 2017, 125, 767–779. [Google Scholar] [CrossRef]
- Shen, L.; He, J.; Yang, C.; Gui, W.; Xu, H. Temperature Uniformity Control of Large-Scale Vertical Quench Furnaces for Aluminum Alloy Thermal Treatment. IEEE Trans. Control Syst. Technol. 2016, 24, 24–39. [Google Scholar] [CrossRef]
- Shen, L.; Chen, Z.; Jiang, Z.; He, J.; Yang, C.; Gui, W. Optimal Temperature Rise Control for a Large-Scale Vertical Quench Furnace System. IEEE Trans. Syst. Man Cybern. Syst. 2022, 52, 4912–4924. [Google Scholar] [CrossRef]
- Tay, A.; Ho, W.K.; Hu, N. An In Situ Approach to Real-Time Spatial Control of Steady-State Wafer Temperature during Thermal Processing in Microlithography. IEEE Trans. Semicond. Manuf. 2007, 20, 5–12. [Google Scholar] [CrossRef]
- Zhang, X.X.; Li, H.X.; Wang, B.; Ma, S. A Hierarchical Intelligent Methodology for Spatiotemporal Control of Wafer Temperature in Rapid Thermal Processing. IEEE Trans. Semicond. Manuf. 2017, 30, 52–59. [Google Scholar] [CrossRef]
- Tay, A.; Ho, W.K.; Wu, X. Real-Time Control of Photoresist Extinction Coefficient Uniformity in the Microlithography Process. IEEE Trans. Control Syst. Technol. 2007, 15, 99–105. [Google Scholar] [CrossRef]
- Gumpher, J.; Bather, W.; Wedel, D. LPCVD silicon nitride uniformity improvement using adaptive real-time temperature control. IEEE Trans. Semicond. Manuf. 2003, 16, 26–35. [Google Scholar] [CrossRef]
- Li, S.; Lou, G.; Wang, J. The temperature uniformity control of cooling system for medium plate. In Proceedings of the 2009 Chinese Control and Decision Conference, Guilin, China, 17–19 June 2009; pp. 3973–3975. [Google Scholar] [CrossRef]
- Hosoya, N.; Yanou, A.; Minami, M.; Matsuno, T. A proposal of temperature control model for two dimensional aluminum plate using two degree-of-freedom generalized predictive control. In Proceedings of the 2014 SICE Annual Conference (SICE), Sapporo, Japan, 9–12 September 2014; pp. 1804–1809. [Google Scholar] [CrossRef]
- Xu, S.; Shi, S.; Jiang, W.; Hashimoto, S. Cooperative Control of Recurrent Neural Network for PID-Based Single Phase Hotplate Temperature Control Systems. IEEE Access 2023, 11, 105557–105569. [Google Scholar] [CrossRef]
- Chen, T.; Zhao, T.; He, Q.; Sun, R. Determination of vibration energy flow-controlling regions in a piezoelectric metamaterial plate with temperature rise. Appl. Math. Model. 2024, 125, 329–346. [Google Scholar] [CrossRef]
- Mannella, G.A.; La Carrubba, V.; Brucato, V. Peltier cells as temperature control elements: Experimental characterization and modeling. Appl. Therm. Eng. 2014, 63, 234–245. [Google Scholar] [CrossRef]
- Mironova, A.; Mercorelli, P.; Zedler, A. Chapter 3—Temperature control in Peltier cells comparing sliding mode control and PID controllers. In Modeling, Identification, and Control for Cyber-Physical Systems towards Industry 4.0; Mercorelli, P., Zhang, W., Nemati, H., Zhang, Y., Eds.; Emerging Methodologies and Applications in Modelling; Academic Press: Cambridge, MA, USA, 2024; pp. 41–77. [Google Scholar] [CrossRef]
- Viola, J.; Rodriguez, C.; Chen, Y. PHELP: Pixel Heating Experiment Learning Platform for Education and Research on IAI-based Smart Control Engineering. In Proceedings of the 2020 2nd International Conference on Industrial Artificial Intelligence (IAI), IEEE, Shenyang, China, 23–25 October 2020; pp. 1–6. [Google Scholar]
- Bobič, M. Digital Twin of Heat Exchanger. In Heat Transfer; Kazi, S.N., Ed.; IntechOpen: Rijeka, Croatia, 2022; Chapter 12. [Google Scholar] [CrossRef]
- Xu, Z.; Xu, J.; Guo, Z.; Wang, H.; Sun, Z.; Mei, X. Design and Optimization of a Novel Microchannel Battery Thermal Management System Based on Digital Twin. Energies 2022, 15, 1421. [Google Scholar] [CrossRef]
- Abdoune, F.; Nouiri, M.; Cardin, O.; Castagna, P. An enhanced methodology of Fault Detection and Diagnosis based on Digital Twin. IFAC-PapersOnLine 2022, 55, 43–48. [Google Scholar] [CrossRef]
- Idrissi Kaitouni, S.; Ait Abdelmoula, I.; Es-sakali, N.; Mghazli, M.O.; Er-retby, H.; Zoubir, Z.; El Mansouri, F.; Ahachad, M.; Brigui, J. Implementing a Digital Twin-based fault detection and diagnosis approach for optimal operation and maintenance of urban distributed solar photovoltaics. Renew. Energy Focus 2024, 48, 100530. [Google Scholar] [CrossRef]
- Viola, J.; Chen, Y. Smart Control Engineering Enabled by Digital Twin. In Digital-Twin-Enabled Smart Control Engineering: A Framework and Case Studies; Springer: Berlin/Heidelberg, Germany, 2023; pp. 73–102. [Google Scholar]
- Viola, J.; Chen, Y. A Self Optimizing Control Framework and A Benchmark for Smart Process Control. In Proceedings of the 2021 3rd International Conference on Industrial Artificial Intelligence (IAI), Shenyang, China, 8–11 November 2021; pp. 1–6. [Google Scholar] [CrossRef]
- Araque–Mora, J.; Angel, L. Distributed Equivalent Circuit for Modeling Heat Transfer Process in a Thermoelectric System. In Proceedings of the 2021 IEEE 5th Colombian Conference on Automatic Control (CCAC), Ibague, Colombia, 19–22 October 2021; pp. 326–331. [Google Scholar] [CrossRef]
- Grieves, M. Digital Twin: Manufacturing Excellence through Virtual Factory Replication. This Paper Introduces the Concept of a A Whitepaper by Dr. Michael Grieves. White Paper. 2014. Available online: https://www.3ds.com/fileadmin/PRODUCTS-SERVICES/DELMIA/PDF/Whitepaper/DELMIA-APRISO-Digital-Twin-Whitepaper.pdf (accessed on 1 January 2024).
- Tao, F.; Qi, Q. Make more digital twins. Nature 2019, 573, 490–491. [Google Scholar] [CrossRef]
- Wright, L.; Davidson, S. How to tell the difference between a model and a digital twin. Adv. Model. Simul. Eng. Sci. 2020, 7, 13. [Google Scholar] [CrossRef]
- Viola, J.; Chen, Y.; Wang, J. Information-Based Model Discrimination for Digital Twin Behavioral Matching. In Proceedings of the 2020 2nd International Conference on Industrial Artificial Intelligence (IAI), Shenyang, China, 23–25 October 2020; pp. 1–6. [Google Scholar] [CrossRef]
- Hebei I. T. (Shanghai) Co., Ltd. Thermoelectric Cooler TEC1-12706; Hebei I. T. (Shanghai) Co., Ltd.: Shanghai, China, 2010. [Google Scholar]
- FLIR Systems Inc. FLIR LEPTON® Engineering Datasheet; FLIR Systems Inc.: Wilsonville, OR, USA, 2018. [Google Scholar]
- LattePanda Inc.®. LattePanda V1 Single Computer Board Datasheet; Lattepanda Inc.®: China, 2018. Available online: https://docs.lattepanda.com/content/1st_edition/power_on/ (accessed on 1 March 2024).
- Cytron Technologies. Sumo Robot Controller R1.1; Cytron Technologies: Bukit Mertajam, Malaysia, 2024. [Google Scholar]
- Lineykin, S.; Ben-Yaakov, S. Modeling and Analysis of Thermoelectric Modules. IEEE Trans. Ind. Appl. 2007, 43, 505–512. [Google Scholar] [CrossRef]
- Astrain, D.; Vián, J.; Albizua, J. Computational model for refrigerators based on Peltier effect application. Appl. Therm. Eng. 2005, 25, 3149–3162. [Google Scholar] [CrossRef]
- Incropera, F. Fundamentals of Heat and Mass Transfer; Wiley: New York, NY, USA, 2007. [Google Scholar]
- Salome, P.; Leroux, C.; Crevel, P.; Chante, J.P. Investigations on the thermal behavior of interconnects under ESD transients using a simplified thermal RC network. Microelectron. Reliab. 1999, 39, 1579–1591. [Google Scholar] [CrossRef]
- Lineykin, S.; Sitbon, M.; Kuperman, A. Spatial Equivalent Circuit Model for Simulation of On-Chip Thermoelectric Harvesters. Micromachines 2020, 11, 574. [Google Scholar] [CrossRef]
- De Baetselier, E.; Goedertier, W.; De Mey, G. A survey of the thermal stability of an active heat sink. In Proceedings of the InterSociety Conference on Thermal Phenomena in Electronic Systems, I-THERM V, Orlando, FL, USA, 29 May–1 June 1996; pp. 373–382. [Google Scholar] [CrossRef]
- Laird Thermal System. Datasheet Ceramic Plate Series CP10-127-05-L1-W4.5; Laird Thermal System: Morrisville, NC, USA, 2020. [Google Scholar]
- Mathworks Inc. Simulink Design Optimization; Mathworks Inc.: Natick, MA, USA, 2020. [Google Scholar]
- Zhao, C. Parameter sensitivity analysis of 3D numerical simulation in the high-pressure groundwater. In Proceedings of the 2011 International Symposium on Water Resource and Environmental Protection, Xi’an, China, 20–22 May 2011; Volume 1, pp. 157–160. [Google Scholar] [CrossRef]
- Xue, L.; Xu, S.; Nie, J.; Qin, J.; Han, J.X.; Liu, Y.T.; Liao, Q.Z. An efficient data-driven global sensitivity analysis method of shale gas production through convolutional neural network. Pet. Sci. 2024, in press. [CrossRef]
- Rahmani, F.; Ataei, M.; Daghighi, S.M. Sensitivity analysis in quantitative modeling of toxicology. In Encyclopedia of Toxicology, 4th ed.; Wexler, P., Ed.; Academic Press: Oxford, UK, 2024; pp. 473–476. [Google Scholar] [CrossRef]
- Tarantola, S.; Ferretti, F.; Lo Piano, S.; Kozlova, M.; Lachi, A.; Rosati, R.; Puy, A.; Roy, P.; Vannucci, G.; Kuc-Czarnecka, M.; et al. An annotated timeline of sensitivity analysis. Environ. Model. Softw. 2024, 174, 105977. [Google Scholar] [CrossRef]
- Cetina-Quiñones, A.; Arıcı, M.; Cisneros-Villalobos, L.; Bassam, A. Digital twin model and global sensitivity analysis of an indirect type solar dryer with sensible heat storage material: An approach from exergy sustainability indicators under tropical climate conditions. J. Energy Storage 2023, 58, 106368. [Google Scholar] [CrossRef]
- Pallavicini, J.; Fedeli, M.; Scolieri, G.D.; Tagliaferri, F.; Parolin, J.; Sironi, S.; Manenti, F. Digital twin-based optimization and demo-scale validation of absorption columns using sodium hydroxide/water mixtures for the purification of biogas streams subject to impurity fluctuations. Renew. Energy 2023, 219, 119466. [Google Scholar] [CrossRef]
- Vandana; Bose, B.; Garg, A. Sensitivity Analysis of Battery Digital Twin Design Variables Using Genetic Programming. In Proceedings of the 2023 IEEE 3rd International Conference on Sustainable Energy and Future Electric Transportation (SEFET), Bhubaneswar, India, 9–12 August 2023; pp. 1–6. [Google Scholar] [CrossRef]
- Viola, J.; Chen, Y. An Accelerated Self Optimizing Control Framework for Smart Process Control Using Fractional Order Stochasticity. In Proceedings of the 2021 9th International Conference on Control, Mechatronics and Automation (ICCMA), Luxembourg, 11–14 November 2021; pp. 104–109. [Google Scholar] [CrossRef]
- Viola, J.; Chen, Y. Parallel Enabled and Stability-Aware Self Optimizing Control with Globalized Constrained Nelder-Mead Optimization Algorithm. IEEE J. Radio Freq. Identif. 2023, 7, 178–181. [Google Scholar] [CrossRef]
- Nwoke, J.; Milanesi, M.; Viola, J.; Chen, Y.Q. FPGA-Based Digital Twin Implementation for Mechatronic System Monitoring. In Proceedings of the 2023 5th International Conference on Industrial Artificial Intelligence (IAI), Niaoning, China, 21–24 August 2023; pp. 1–6. [Google Scholar] [CrossRef]
- Nwoke, J.; Milanesi, M.; Viola, J.; Chen, Y. FPGA-Based Digital Twin Implementation for Power Converter System Monitoring. In Proceedings of the 2023 IEEE 3rd International Conference on Digital Twins and Parallel Intelligence (DTPI), Orlando, FL, USA, 7–9 November 2023; pp. 1–6. [Google Scholar] [CrossRef]
- Bouzid, S.; Viarouge, P.; Cros, J. Real-Time Digital Twin of a Wound Rotor Induction Machine Based on Finite Element Method. Energies 2020, 13, 5413. [Google Scholar] [CrossRef]
- Dufour, C.; Soghomonian, Z.; Li, W. Hardware-in-the-Loop Testing of Modern On-Board Power Systems Using Digital Twins. In Proceedings of the 2018 International Symposium on Power Electronics, Electrical Drives, Automation and Motion (SPEEDAM), Amalfi, Italy, 20–22 June 2018; pp. 118–123. [Google Scholar] [CrossRef]


| Component | Features |
|---|---|
| FLIR Lepton Thread Infrared Thermal Camera | Wavelength: 8 to 14 μm Resolution: 80 × 60 pixels Accuracy: ±0.5 °C |
| TEC1-12706 Peltier Module | ΔTmax = 75 °C Imax = 6.4 A Vmax = 16.4 V |
| URC10 Dual Output Power Driver | Input: 0–5 V Output: 8–25 V Peak Current: 30 A Built-in Arduino Uno |
| LattePanda board | 5 inch Windows 1064 bits PC Intel Atom 4 GB of RAM |
| Thin Copper Plate | Size: 25 × 10 × 0.1 cm (length, height, width) Specific heat 390 Jkg−1 K−1 |
| Hot Side Temperature at K | ||
|---|---|---|
| Symbol | Description | Value |
| Maximum amount of heat absorbed at a Certain Load Specification when K | 33 W | |
| Maximum temperature differential. This point occurs when Qc = 0 W | 345.5 K | |
| DC current level which will produce the maximum possible | 4 A | |
| DC voltage which will deliver the maximum possible across the device | 13.9 V | |
| m | Mass of the Peltier devices | Kg |
| Hot Side Temperature at K | ||
|---|---|---|
| Symbol | Description | Value |
| Seebeck coefficient | V/K | |
| Electrical resistance | 2.65 Ω | |
| Thermal resistance | K/W | |
| Thermal equivalent capacitances (hot and cold sides) | J/K | |
| Name | Variable | Initial Value | Final Value | Min | Max | Units |
|---|---|---|---|---|---|---|
| Peltier-specific heat | 1200 | 1959 | 0 | 2000 | [J/(kg· K)] | |
| Peltier Thermal Resistance | 0 | 12 | [K/W] | |||
| Peltier Electrical Resistance | 0 | 10 | [Ω] | |||
| Thermal resistance | 0 | 2 | [K/W] | |||
| Thermal resistance | 0 | 36 | [K/W] | |||
| Thermal resistance | 50 | 0 | 200 | [K/W] | ||
| Thermal resistance | 0 | 32 | [K/W] | |||
| Thermal resistance | 0 | 70 | [K/W] | |||
| Thermal resistance | 197 | 0 | 400 | [K/W] | ||
| Thermal resistance | 0 | 400 | [K/W] | |||
| Thermal resistance | 0 | 400 | [K/W] | |||
| Thermal resistance | 0 | 2000 | [K/W] | |||
| Thermal resistance | 0 | 200 | [K/W] | |||
| Thermal resistance | 0 | 200 | [K/W] | |||
| Thermal resistance | 0 | 2 | [K/W] | |||
| Thermal resistance | 0 | 2 | [K/W] | |||
| Thermal resistance | 0 | 2 | [K/W] | |||
| Copper-specific heat | 0 | 400 | [J/(kg· K)] |
Disclaimer/Publisher’s Note: The statements, opinions and data contained in all publications are solely those of the individual author(s) and contributor(s) and not of MDPI and/or the editor(s). MDPI and/or the editor(s) disclaim responsibility for any injury to people or property resulting from any ideas, methods, instructions or products referred to in the content. |
© 2024 by the authors. Licensee MDPI, Basel, Switzerland. This article is an open access article distributed under the terms and conditions of the Creative Commons Attribution (CC BY) license (https://creativecommons.org/licenses/by/4.0/).
Share and Cite
Araque, J.G.; Angel, L.; Viola, J.; Chen, Y. Digital Twin-Enabled Modelling of a Multivariable Temperature Uniformity Control System. Electronics 2024, 13, 1419. https://doi.org/10.3390/electronics13081419
Araque JG, Angel L, Viola J, Chen Y. Digital Twin-Enabled Modelling of a Multivariable Temperature Uniformity Control System. Electronics. 2024; 13(8):1419. https://doi.org/10.3390/electronics13081419
Chicago/Turabian StyleAraque, Juan Gabriel, Luis Angel, Jairo Viola, and Yangquan Chen. 2024. "Digital Twin-Enabled Modelling of a Multivariable Temperature Uniformity Control System" Electronics 13, no. 8: 1419. https://doi.org/10.3390/electronics13081419
APA StyleAraque, J. G., Angel, L., Viola, J., & Chen, Y. (2024). Digital Twin-Enabled Modelling of a Multivariable Temperature Uniformity Control System. Electronics, 13(8), 1419. https://doi.org/10.3390/electronics13081419