Novel AMI in Zigbee Satellite Network Based on Heterogeneous Wireless Sensor Network for Global Machine-to-Machine Connectivity

 , , , ,

Abstract
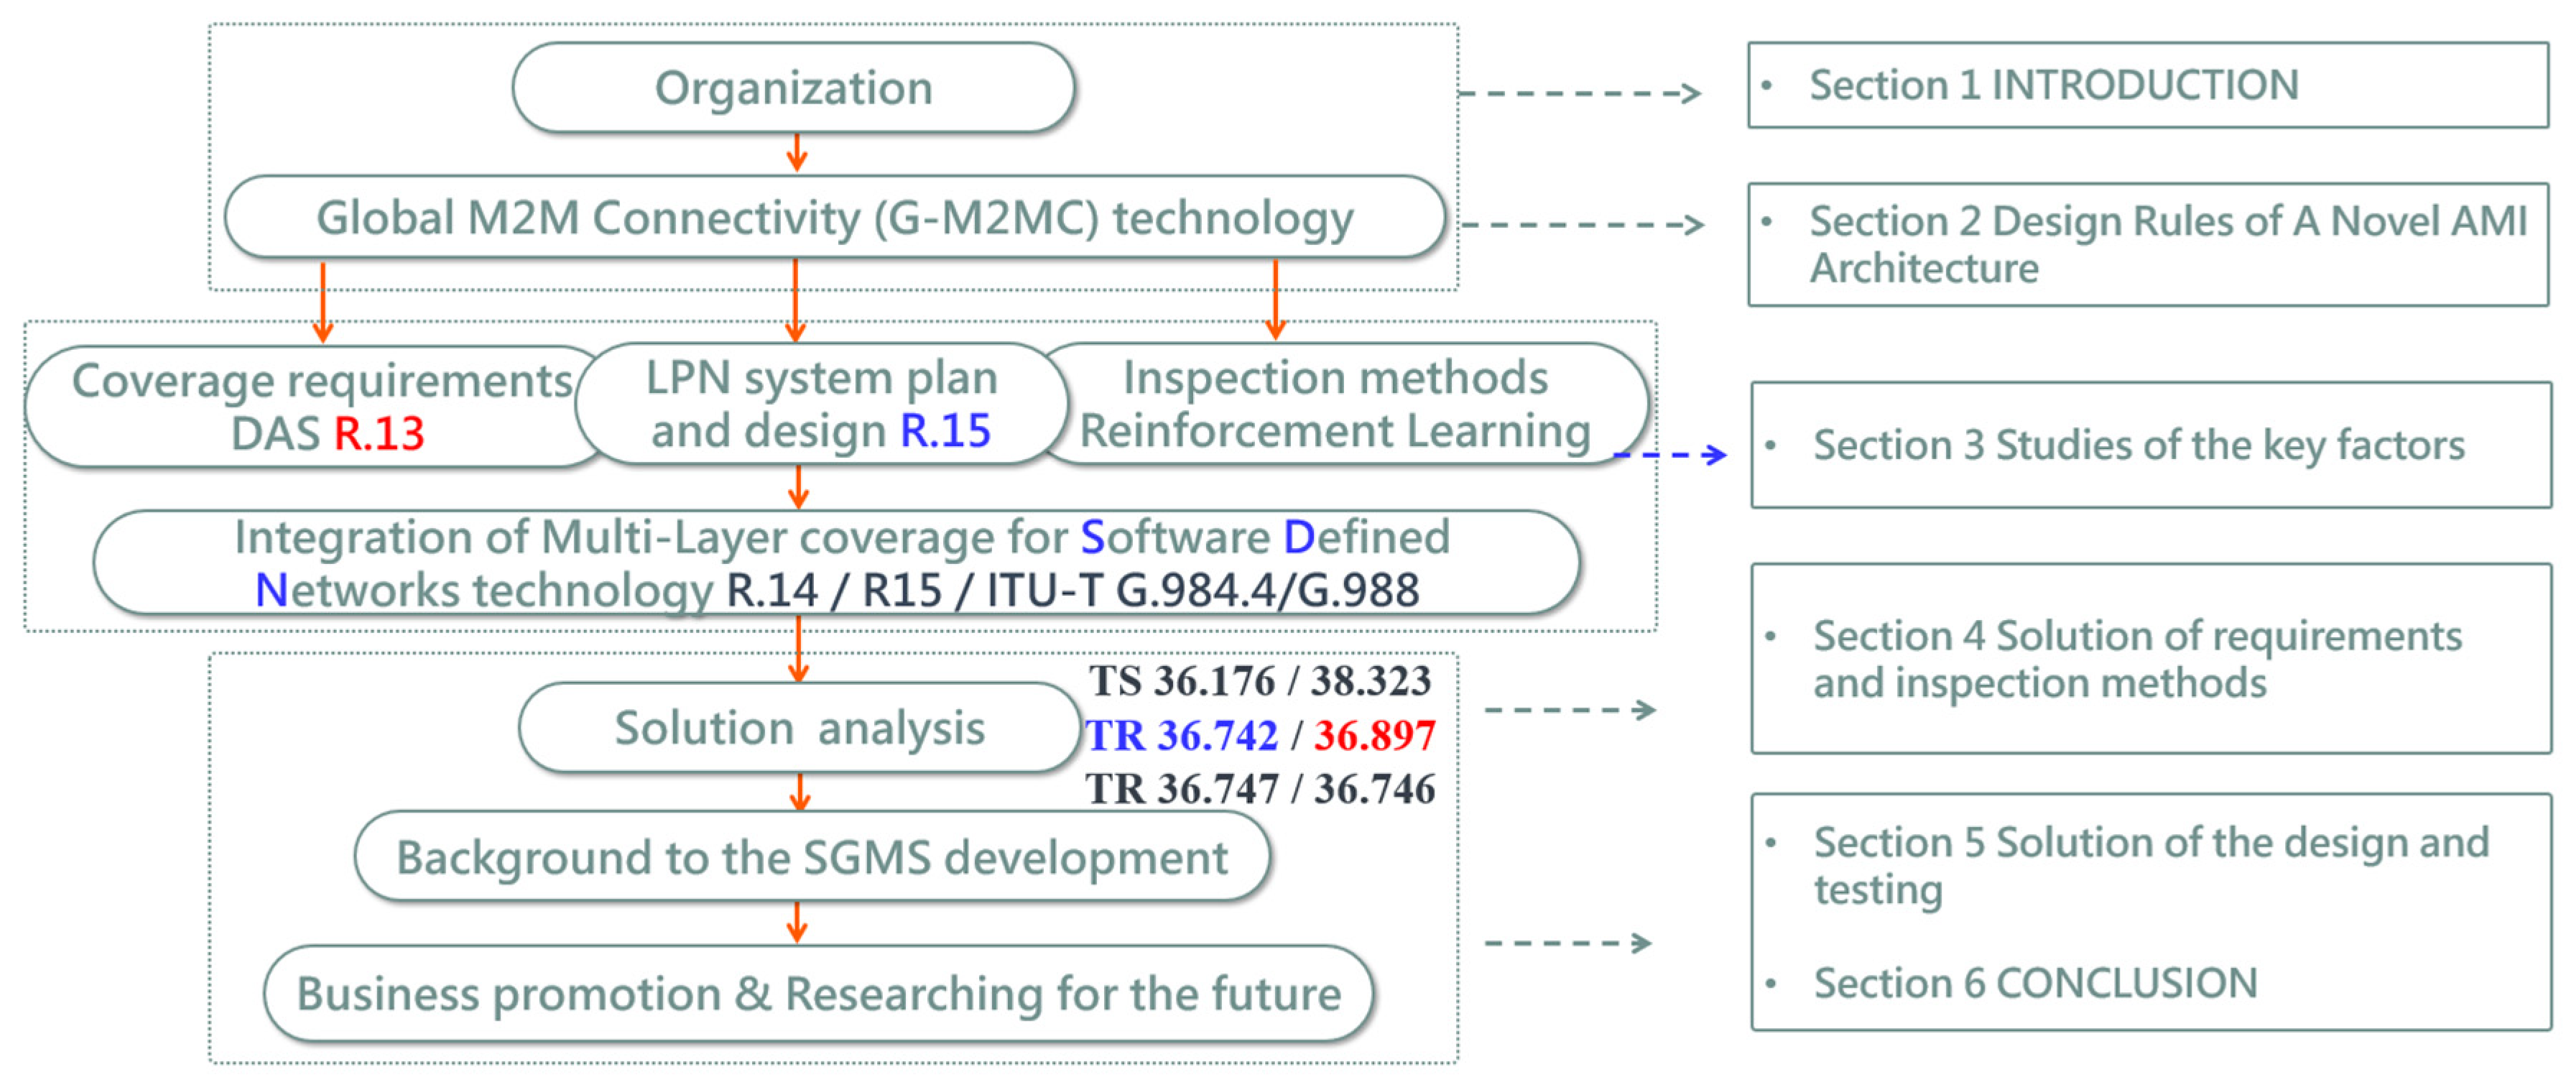
:1. Introduction
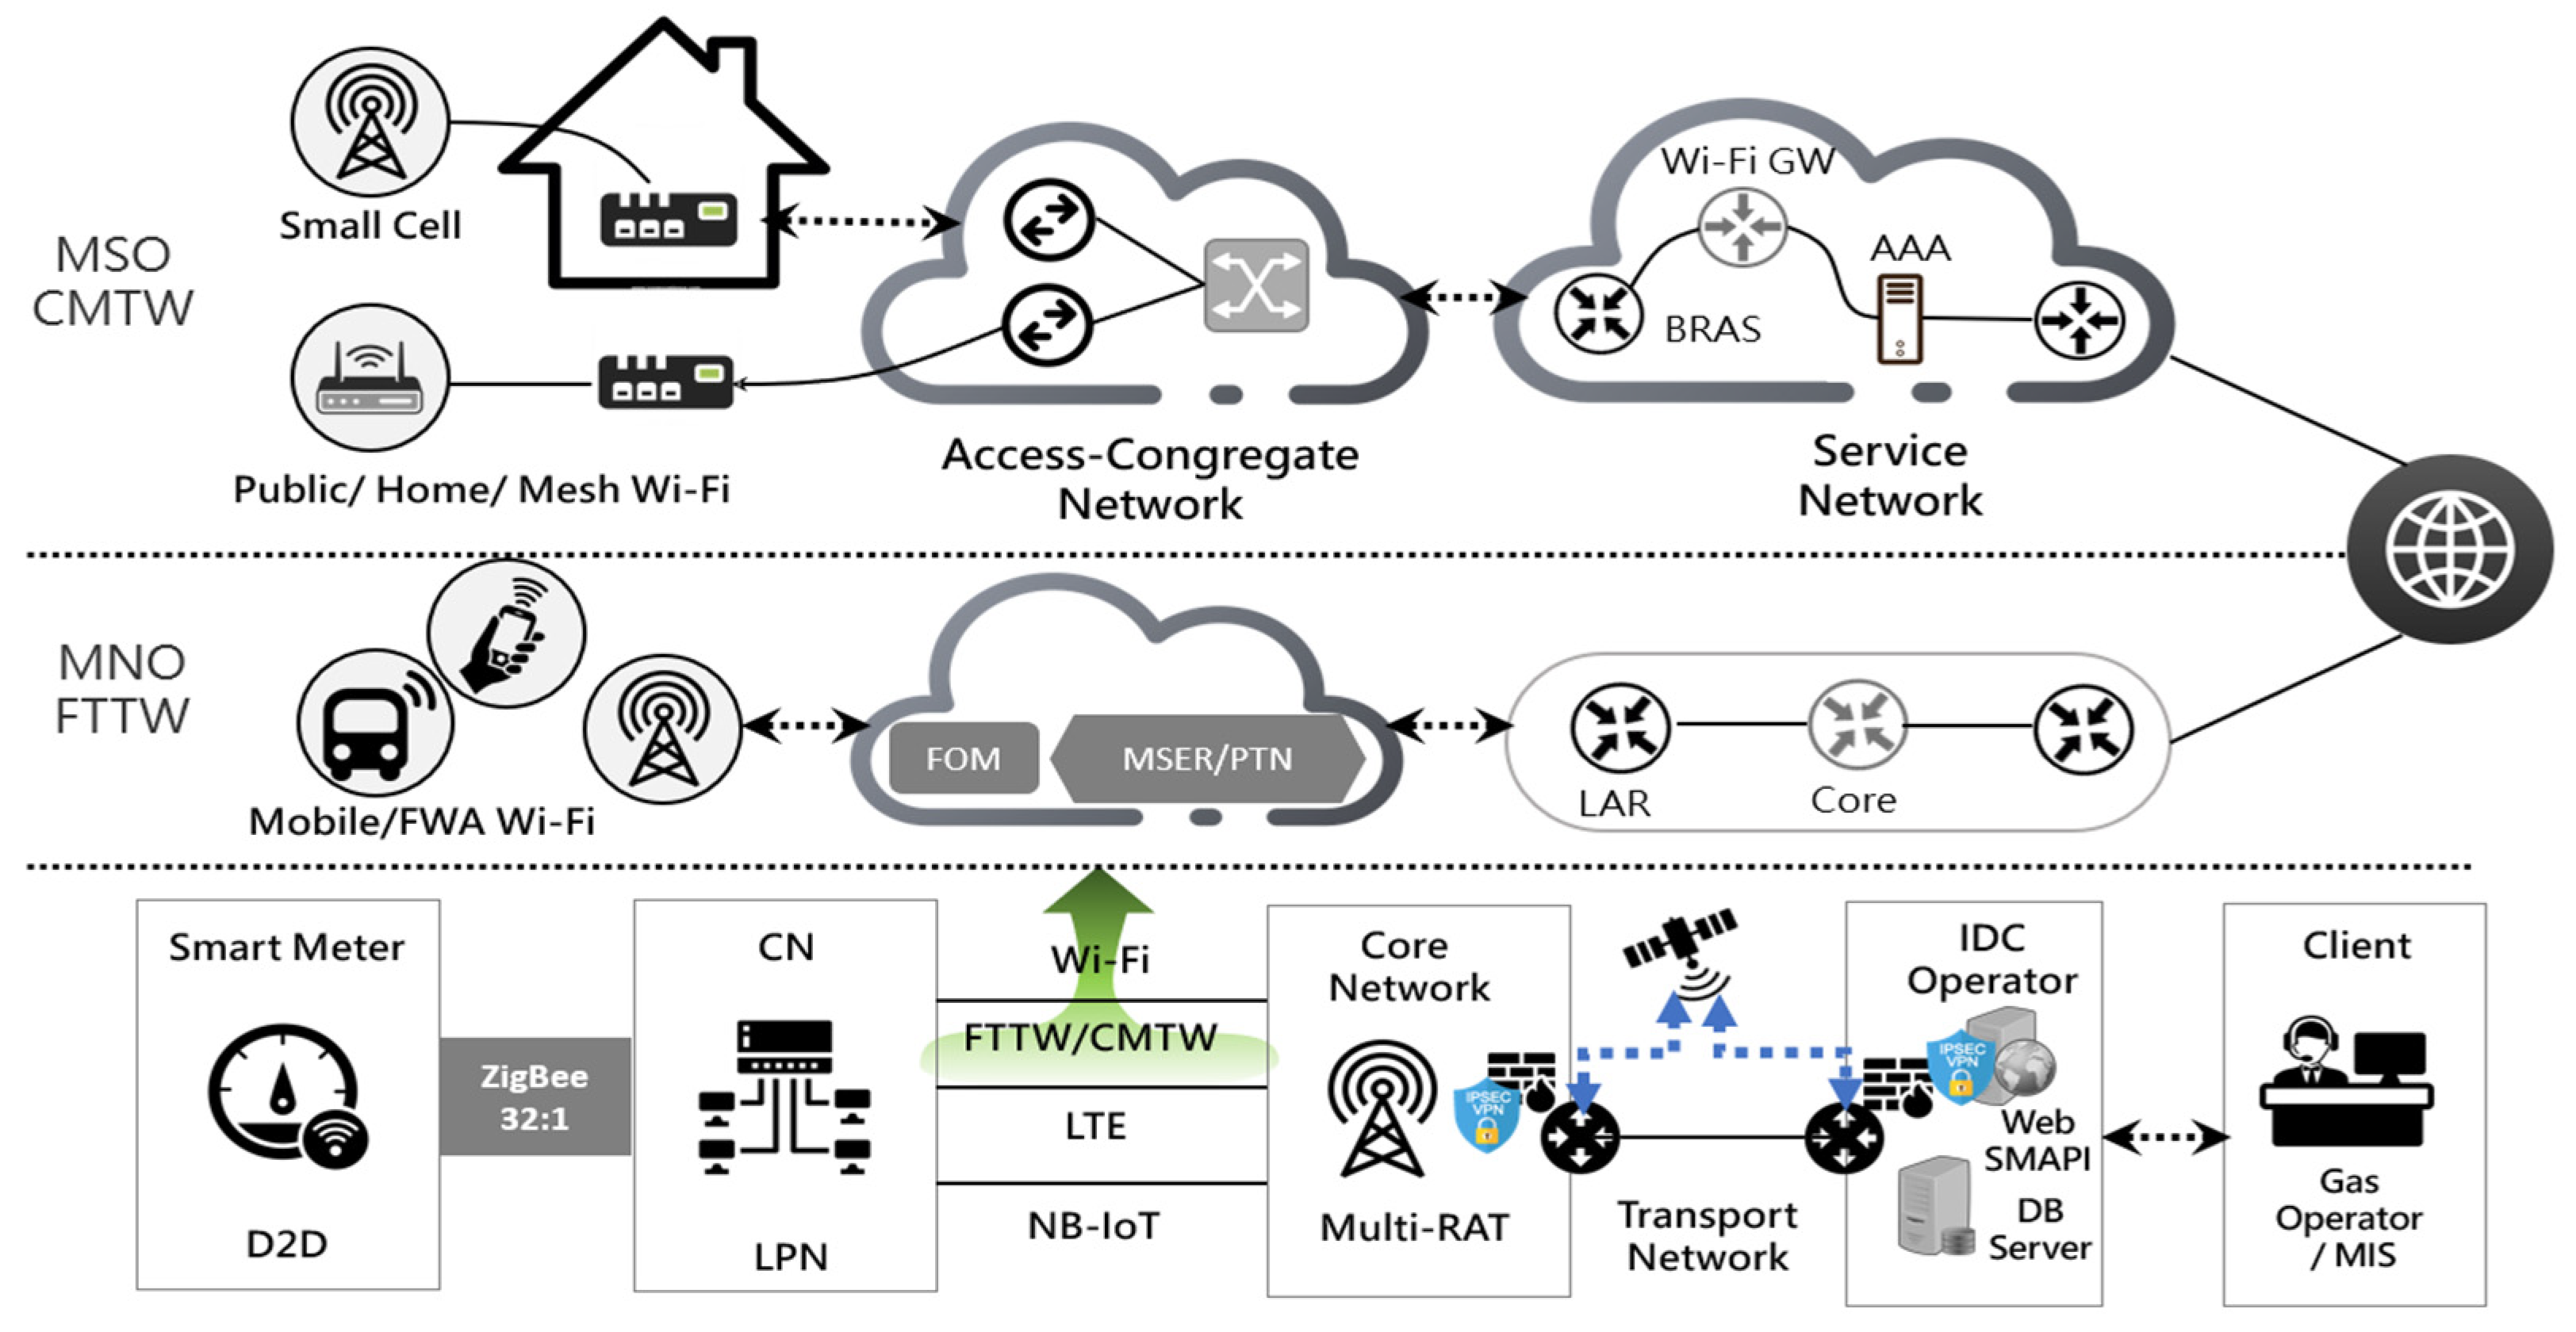
- Technologies: The novel advanced metering infrastructure (AMI) architecture is becoming increasingly popular, such as in M-RAT, Multi-Layer, and Multi-Vendor technologies, that is integrated in wireless communication adoption applications and provides the benefits of modularization and interoperability.
- Networks: An HWSN infrastructure can easily solve the reliability, performance, and compatibility issues of these systems, which operators believe will improve transmission limitations.
- Systems: Low-power node environments with low capital costs, low implementation risk, and fast roll out allow operators to try these SGMS platforms.
2. Design Principles for Mesh Networks
2.1. Multi-Input, Multi-Output
2.2. IEEE802.15.4-TG4g
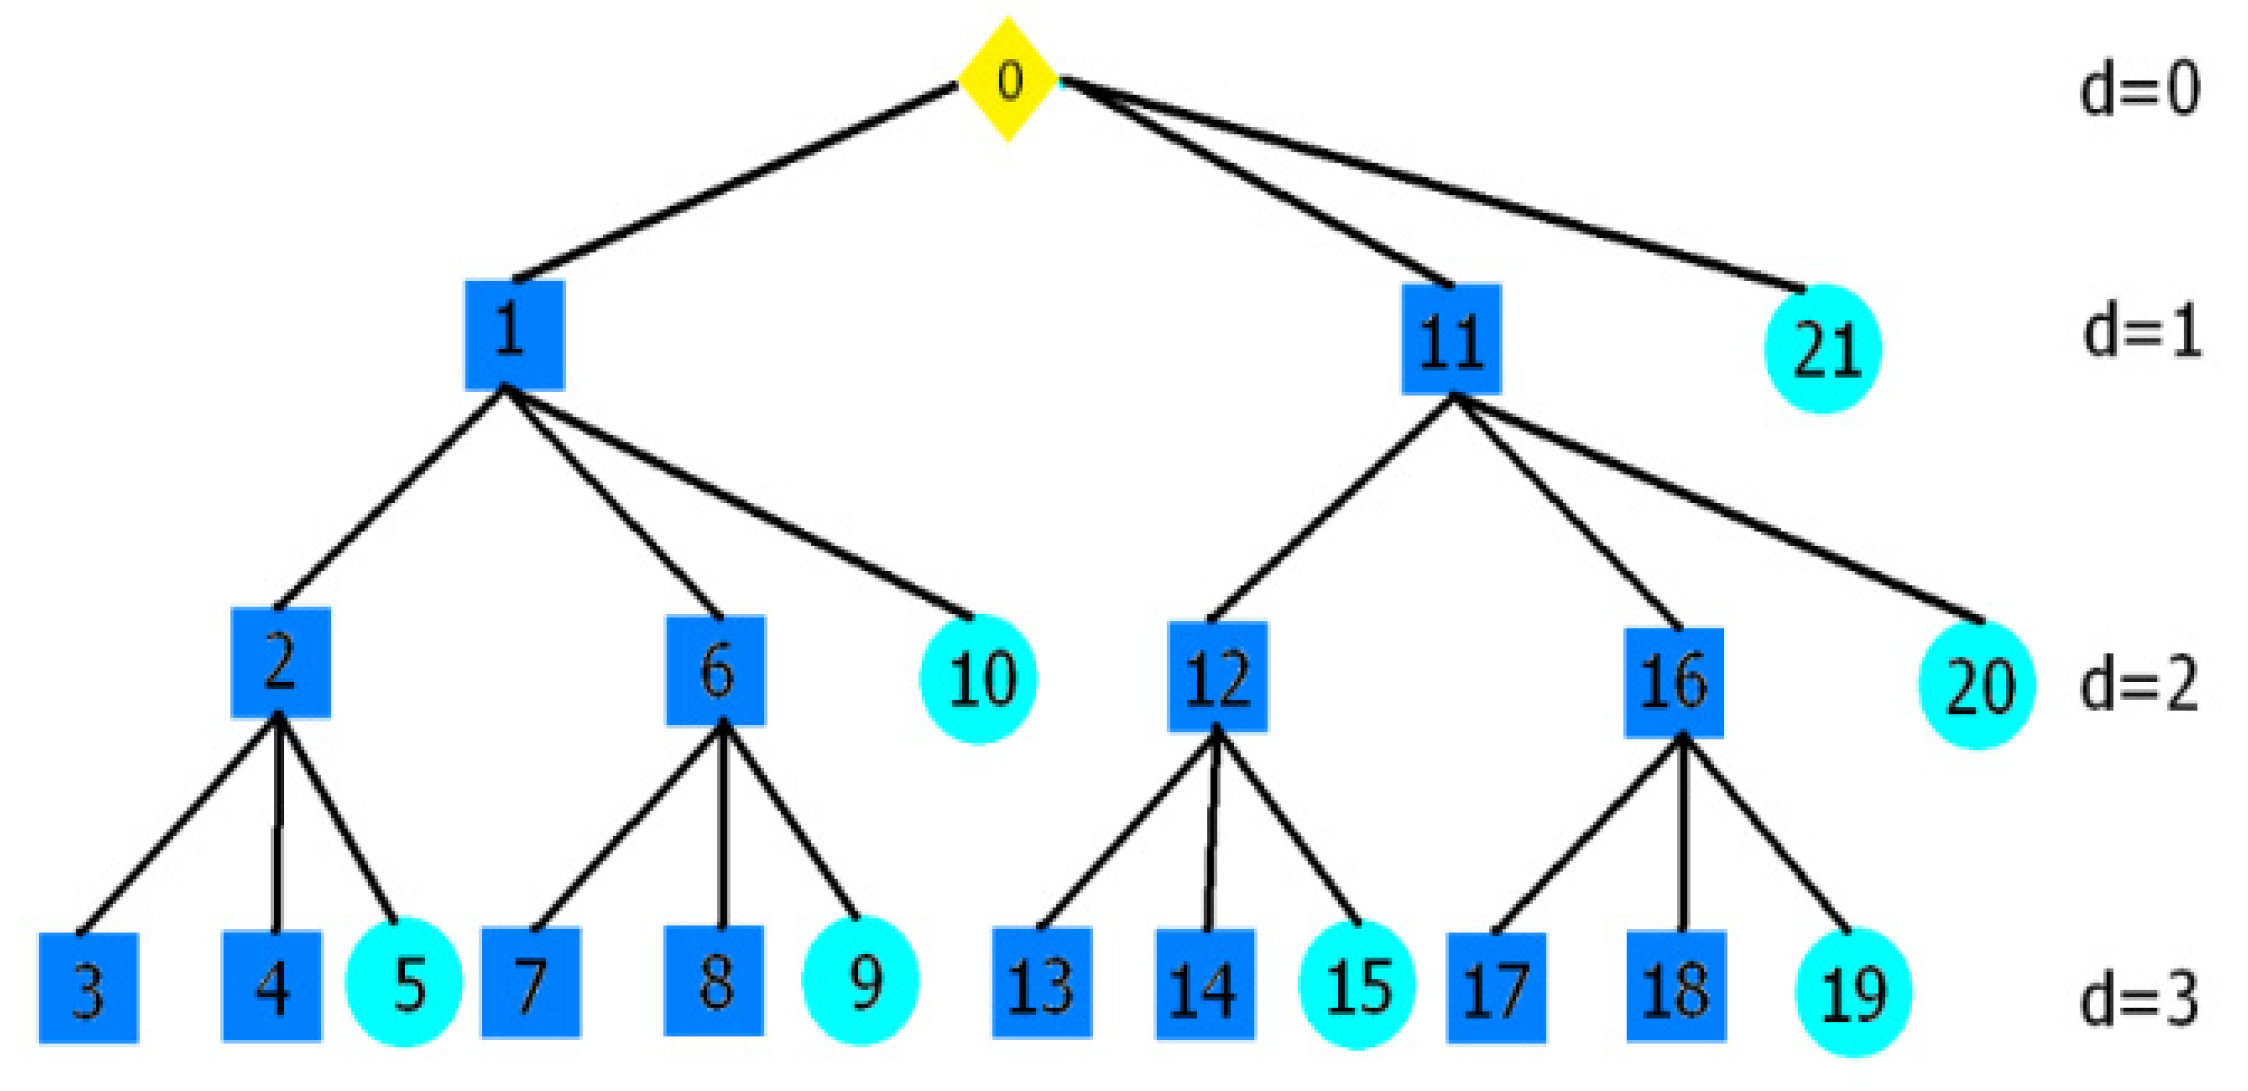
2.3. Network Structure and Address Allocation
- Cm: The maximum number of child devices that both the coordinator and routers can accommodate.
- Rm: The maximum number of routers (Rm) among the child devices situated between the coordinator and other routers.
- Lm: The maximum depth (d) of the network.
- For the kth router, as shown in Equation (2):
- 2.
- For an nth end device, as shown in Equation (3):
3. Study of the Pivotal Factors
- (1)
- The facilitation of remote automated meter reading:
- (2)
- The enhancement of gas safety:
- (3)
- The amplification of emergency repair efficiency:
- (4)
- The mitigation of gas consumption loss:
- (5)
- The promotion of the domestic energy information and communications industry:
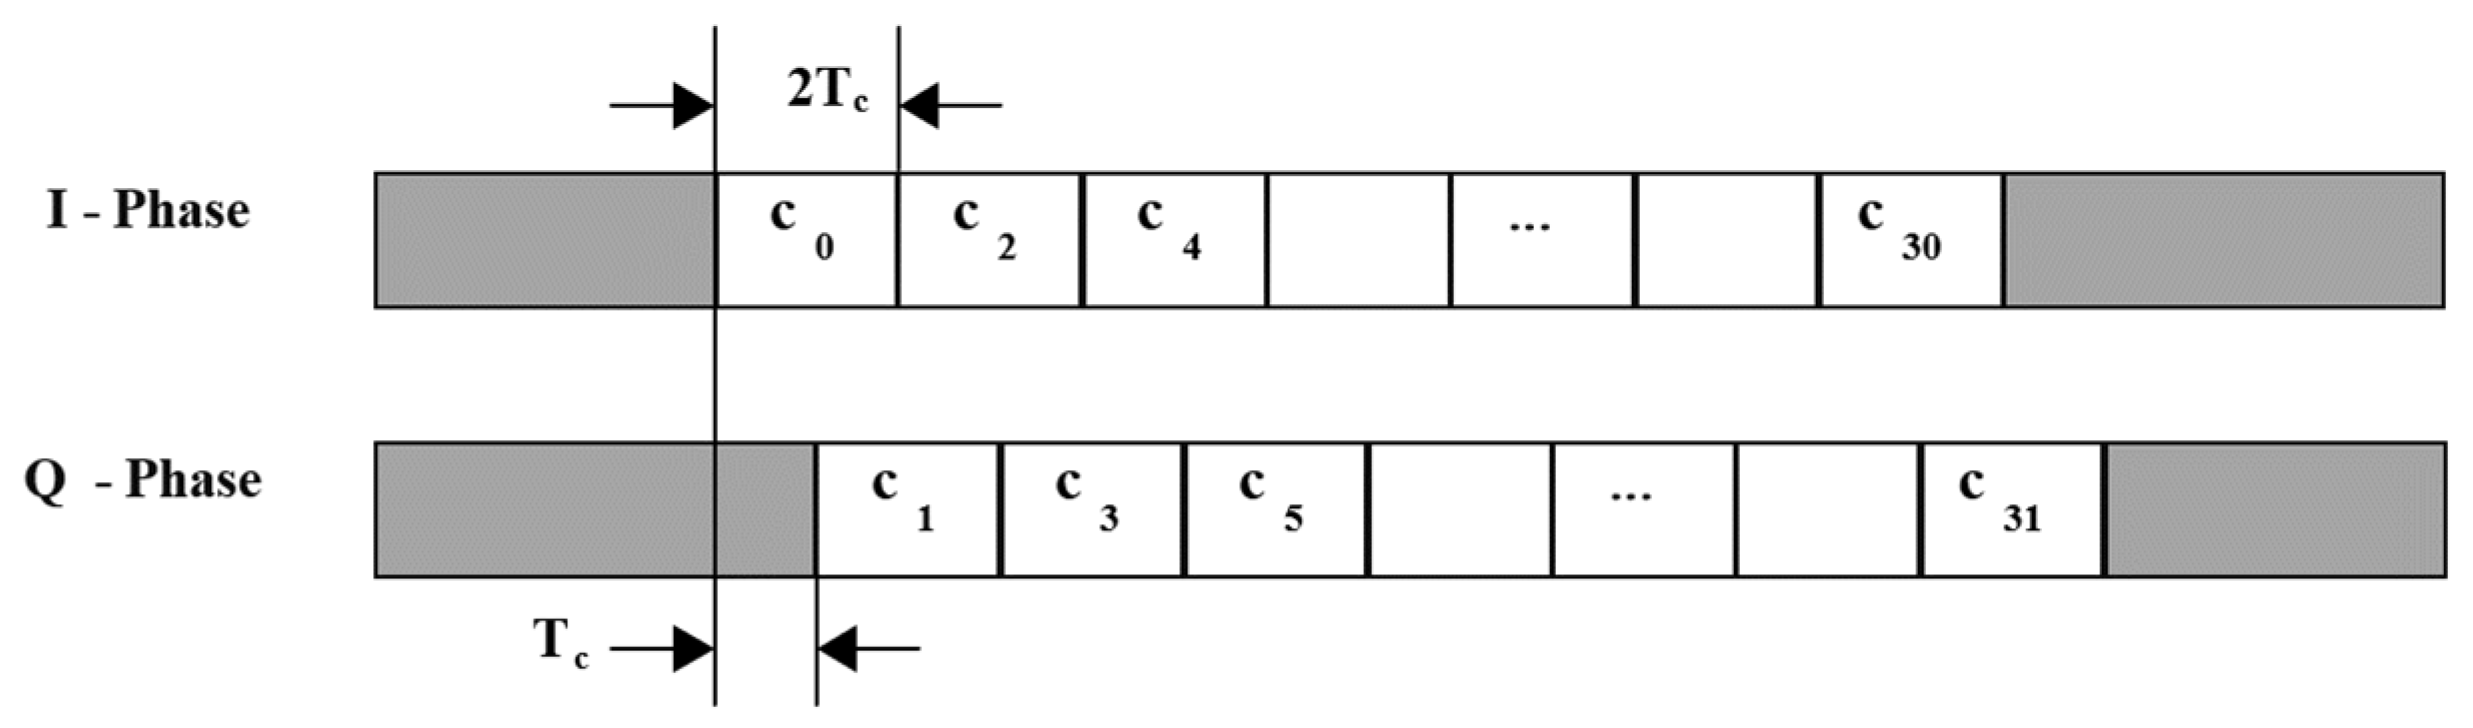
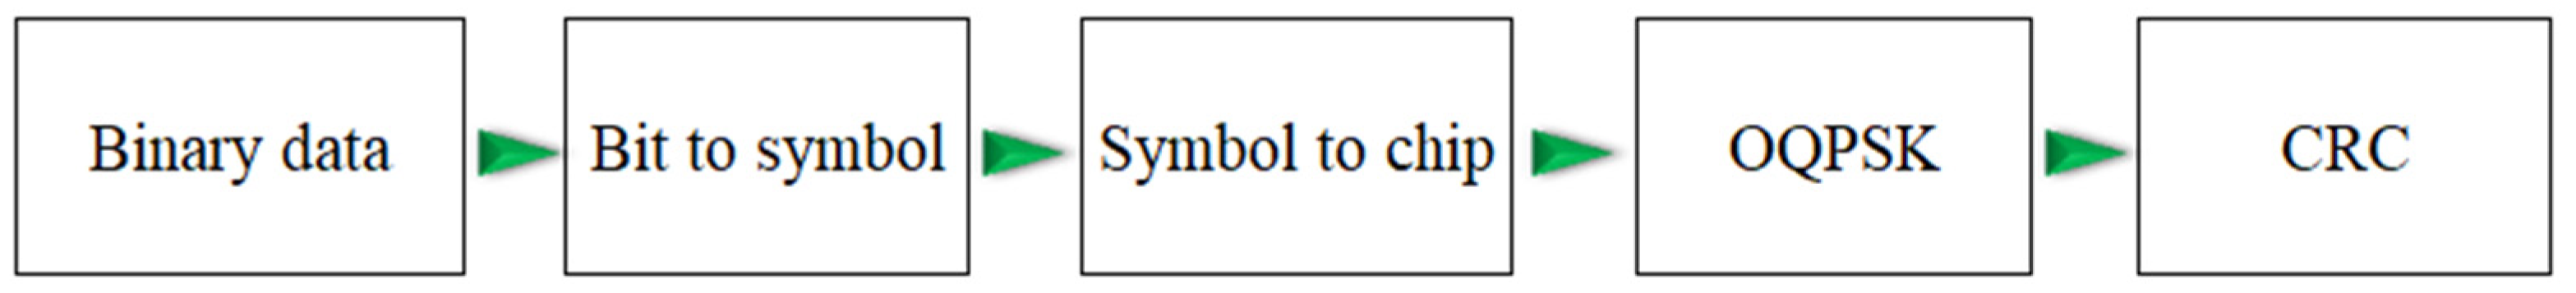
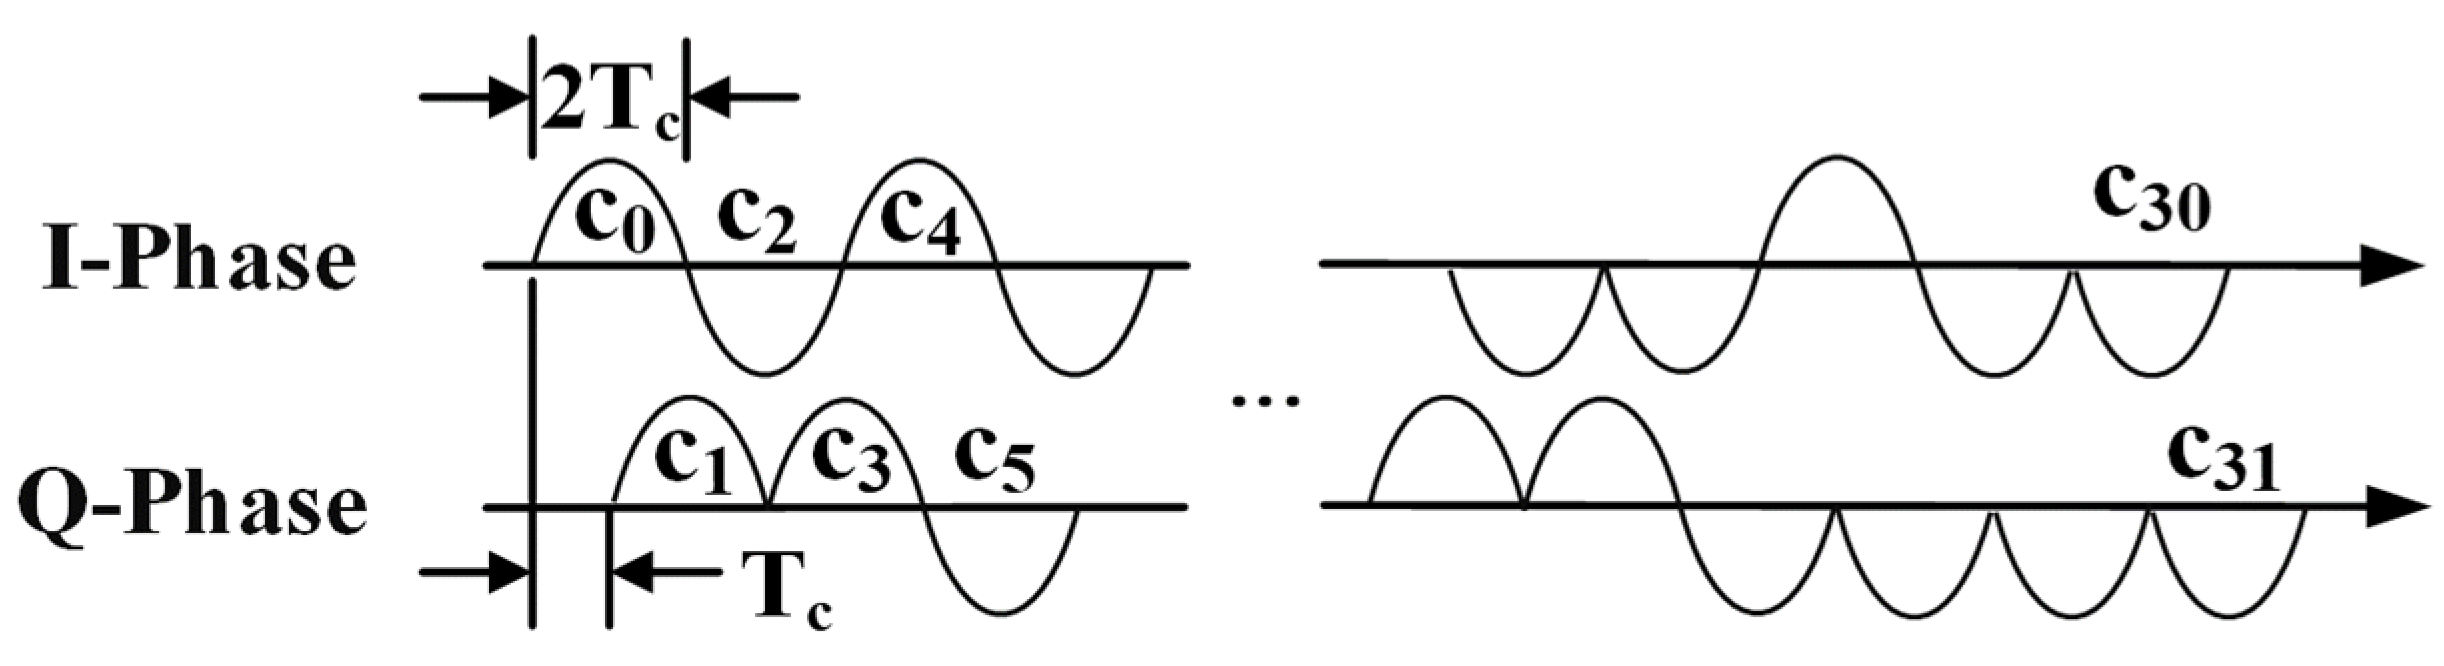
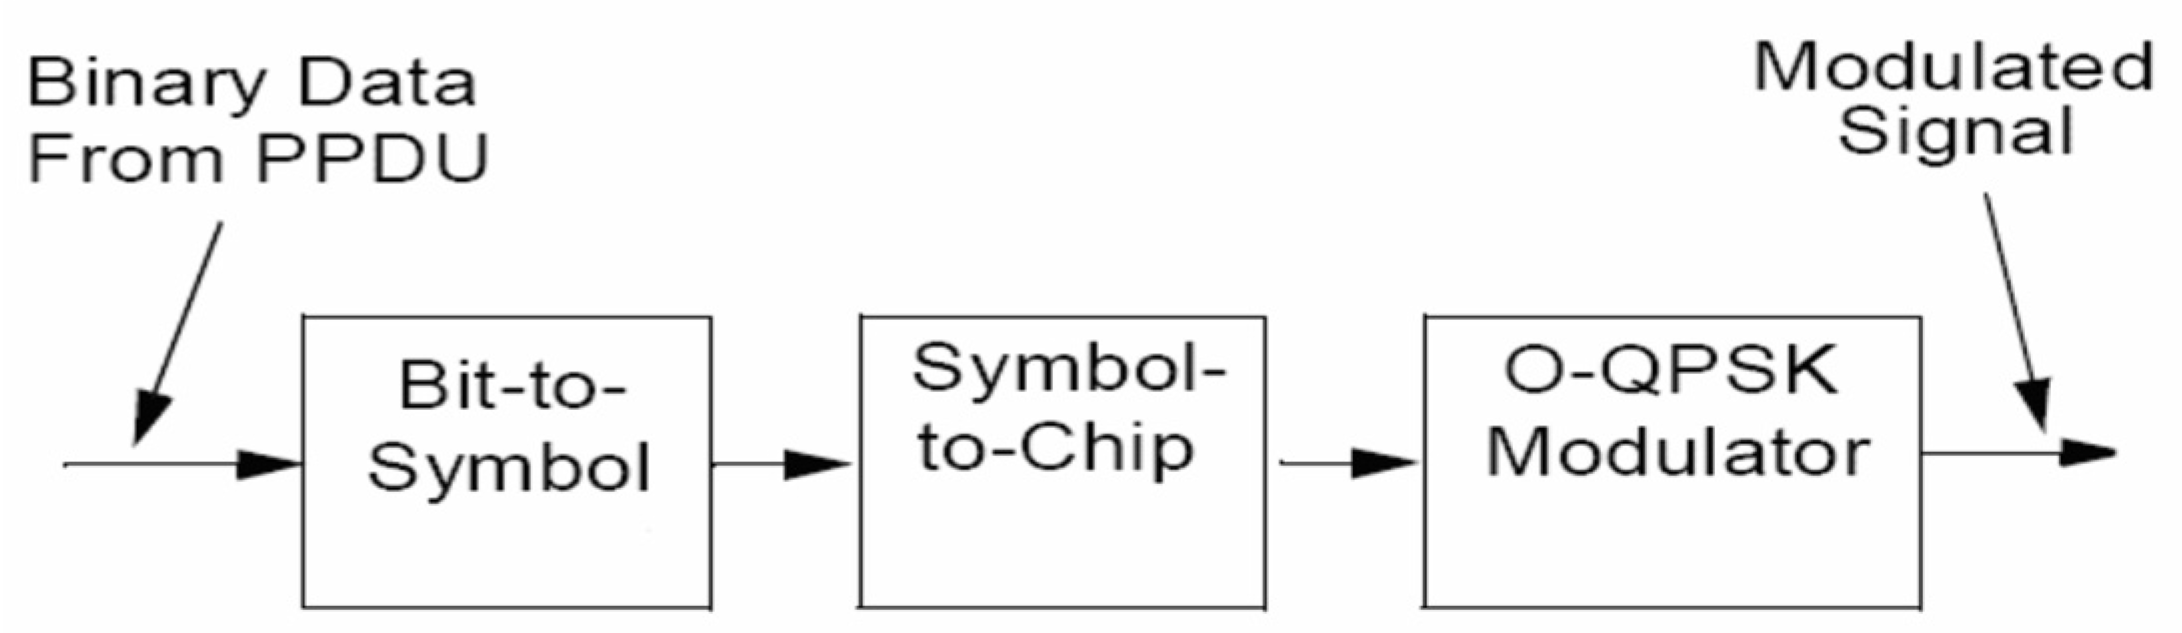
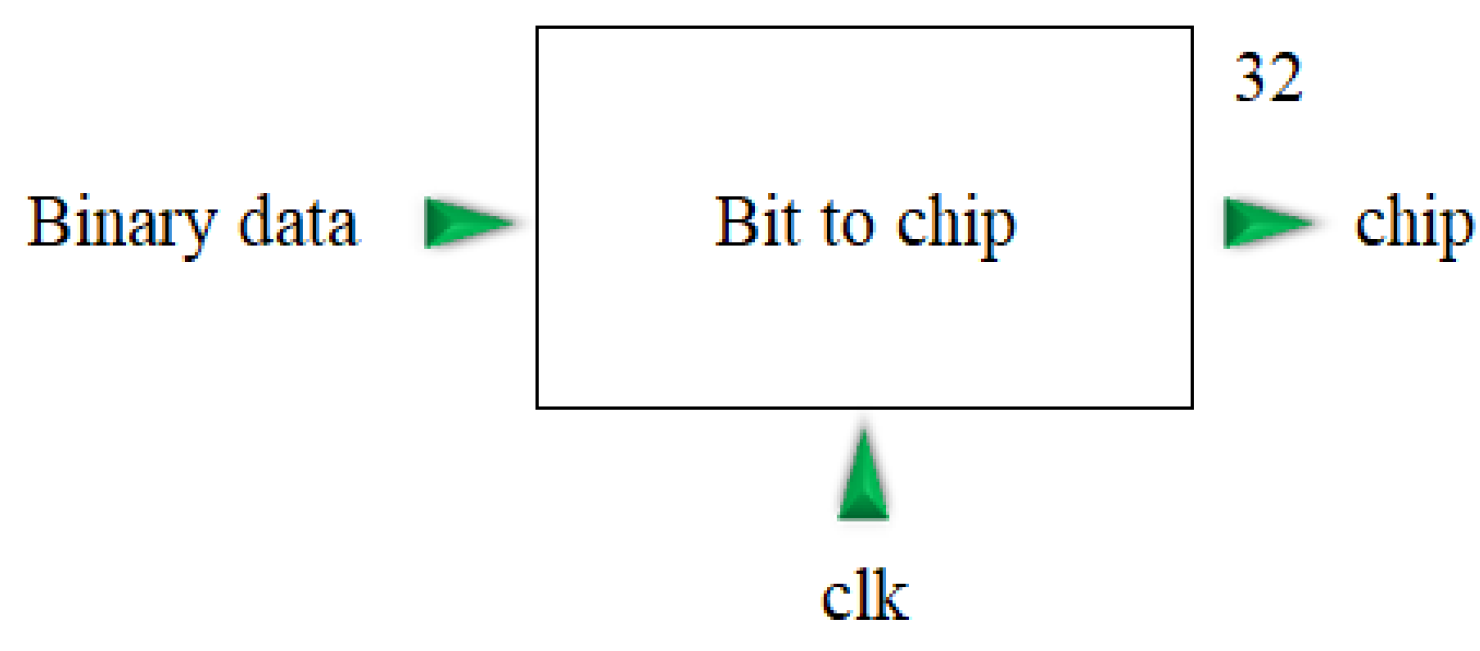
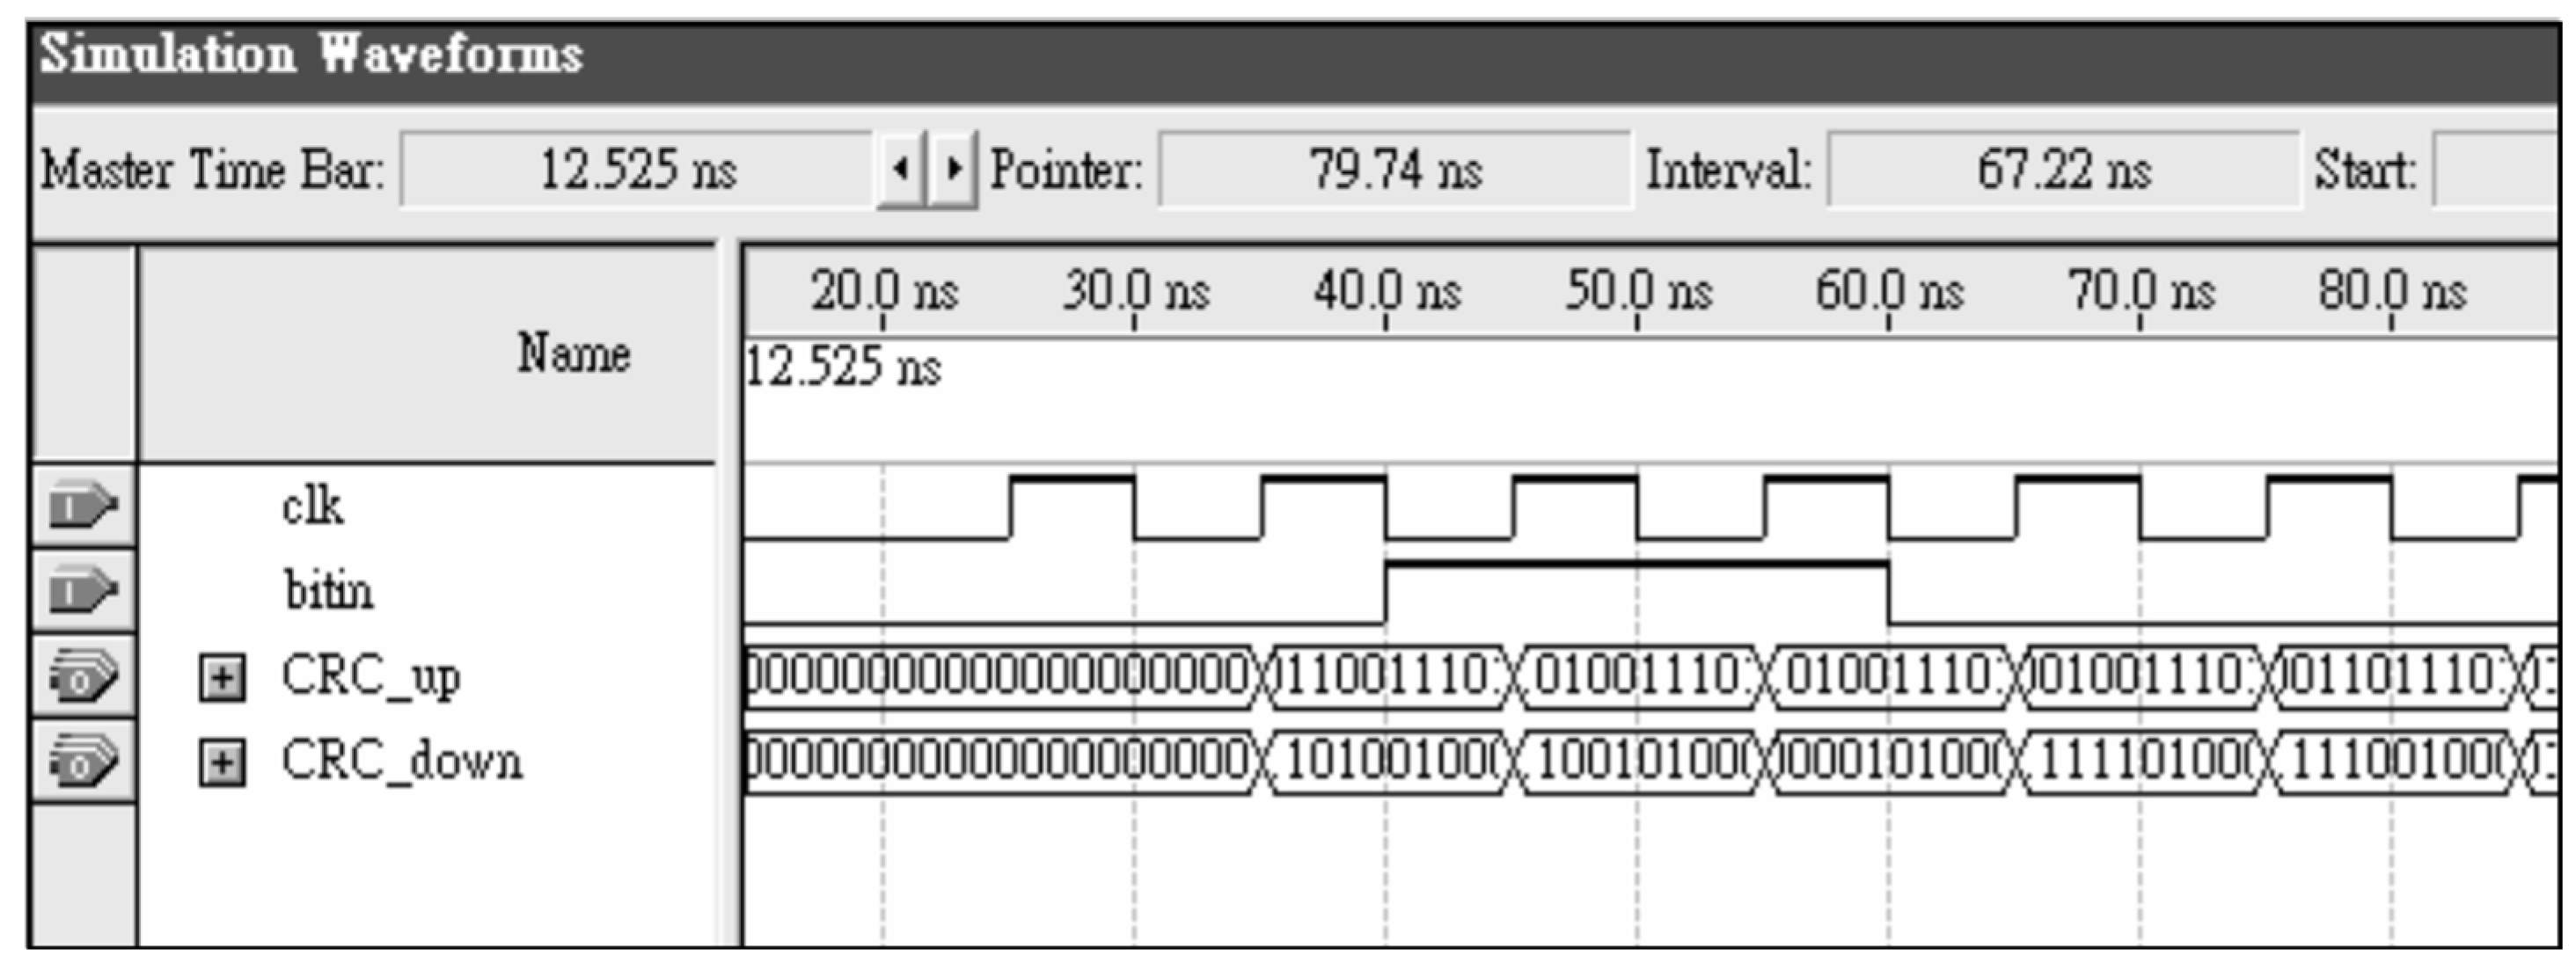
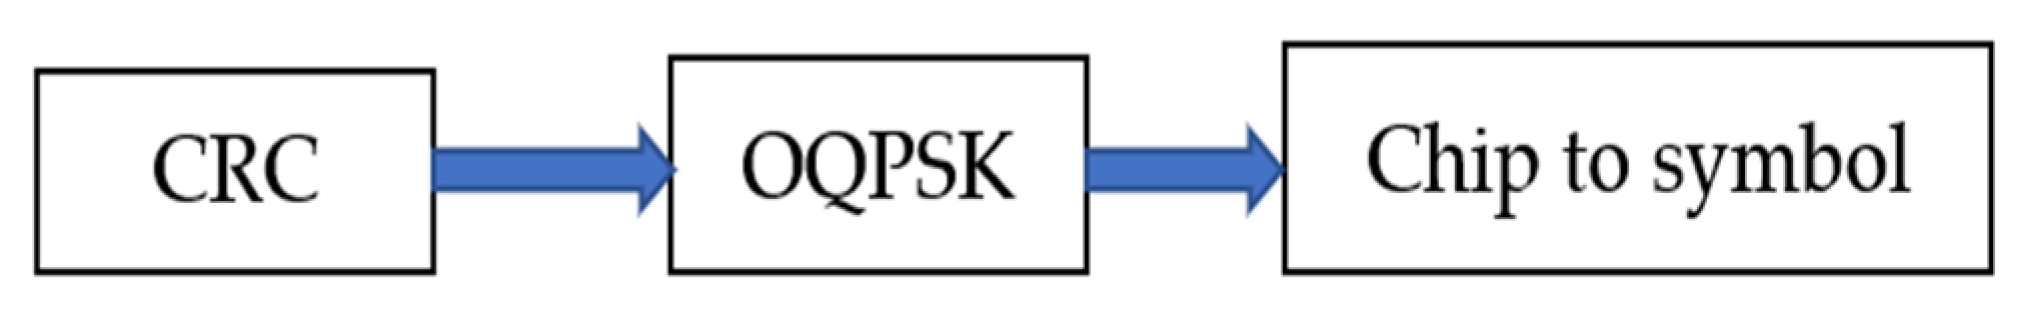
3.1. Modulation Data and Spread Spectrum Specifications
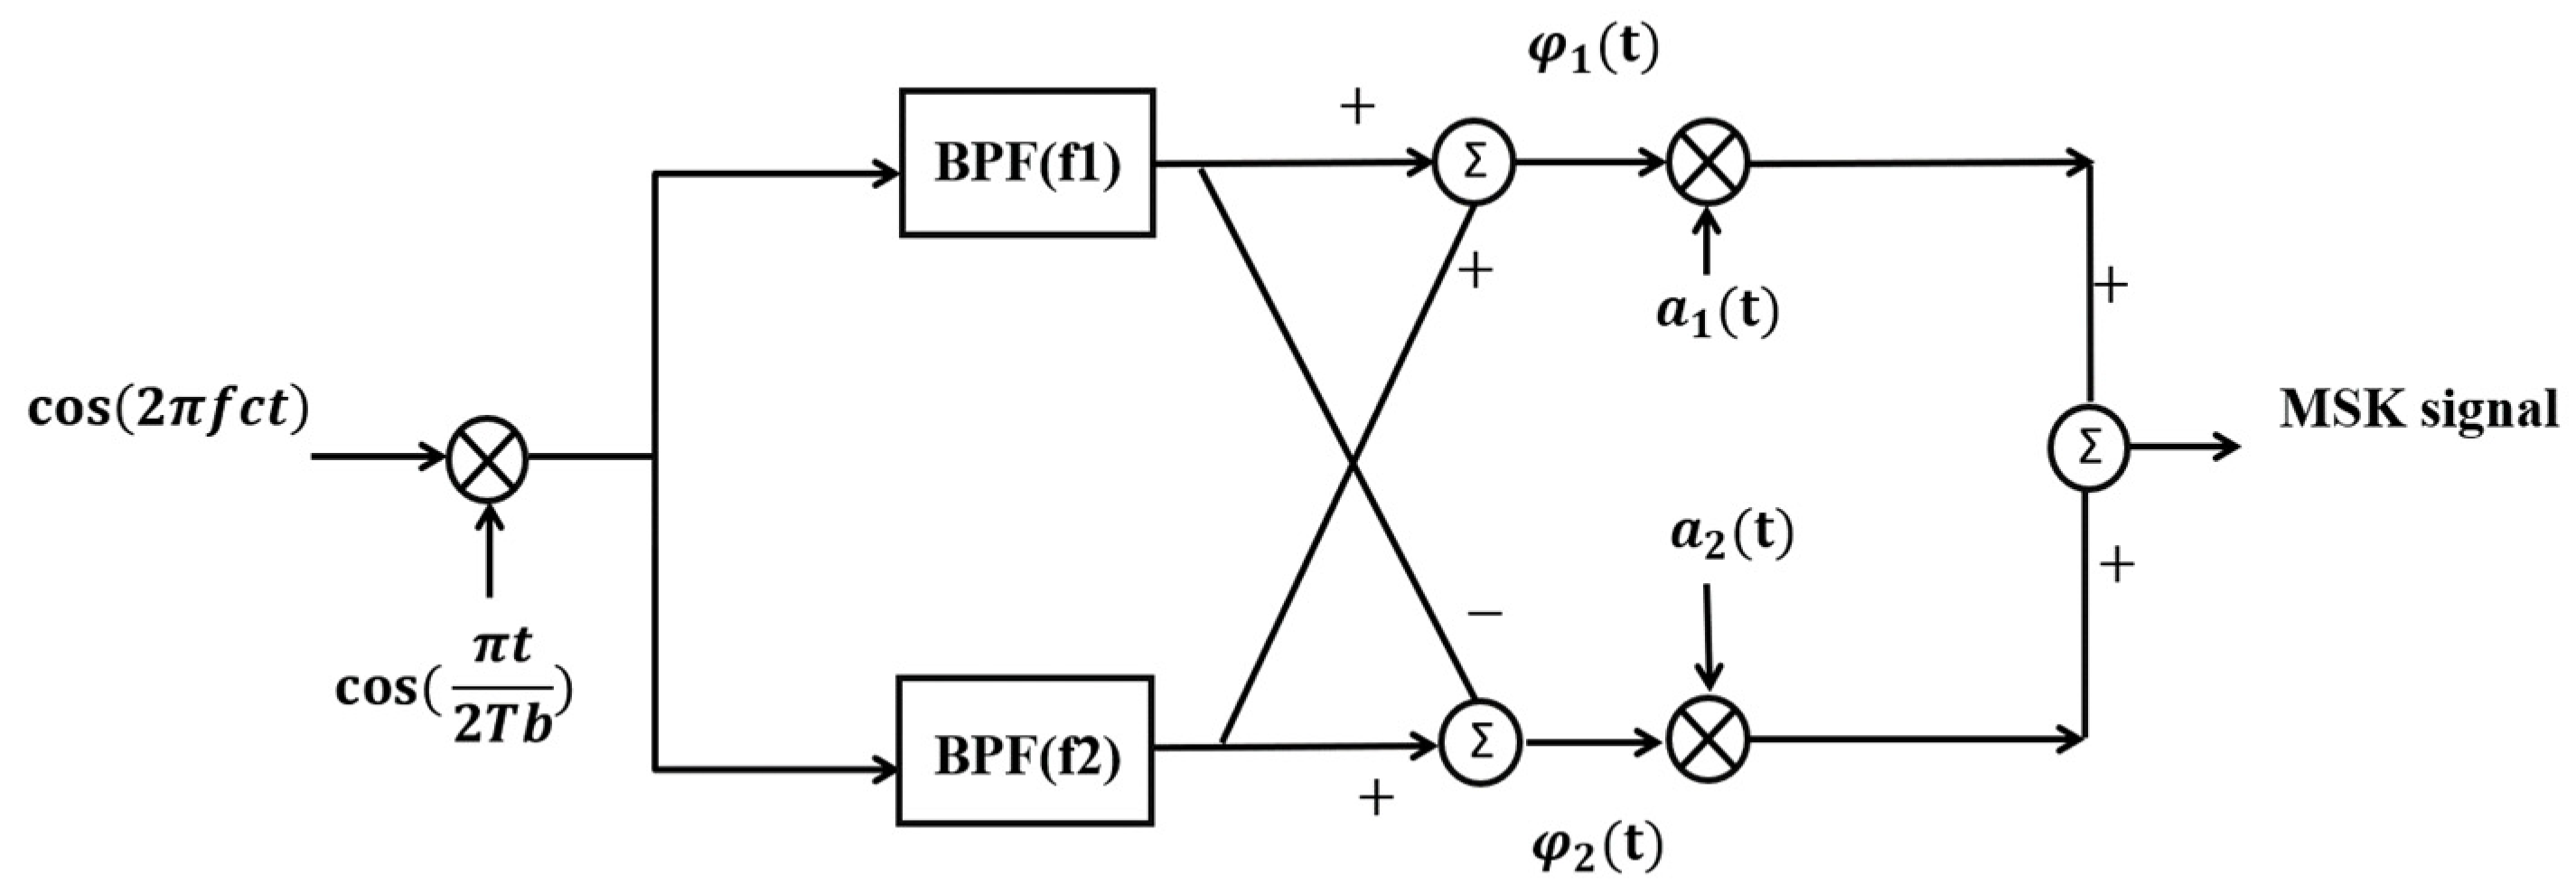
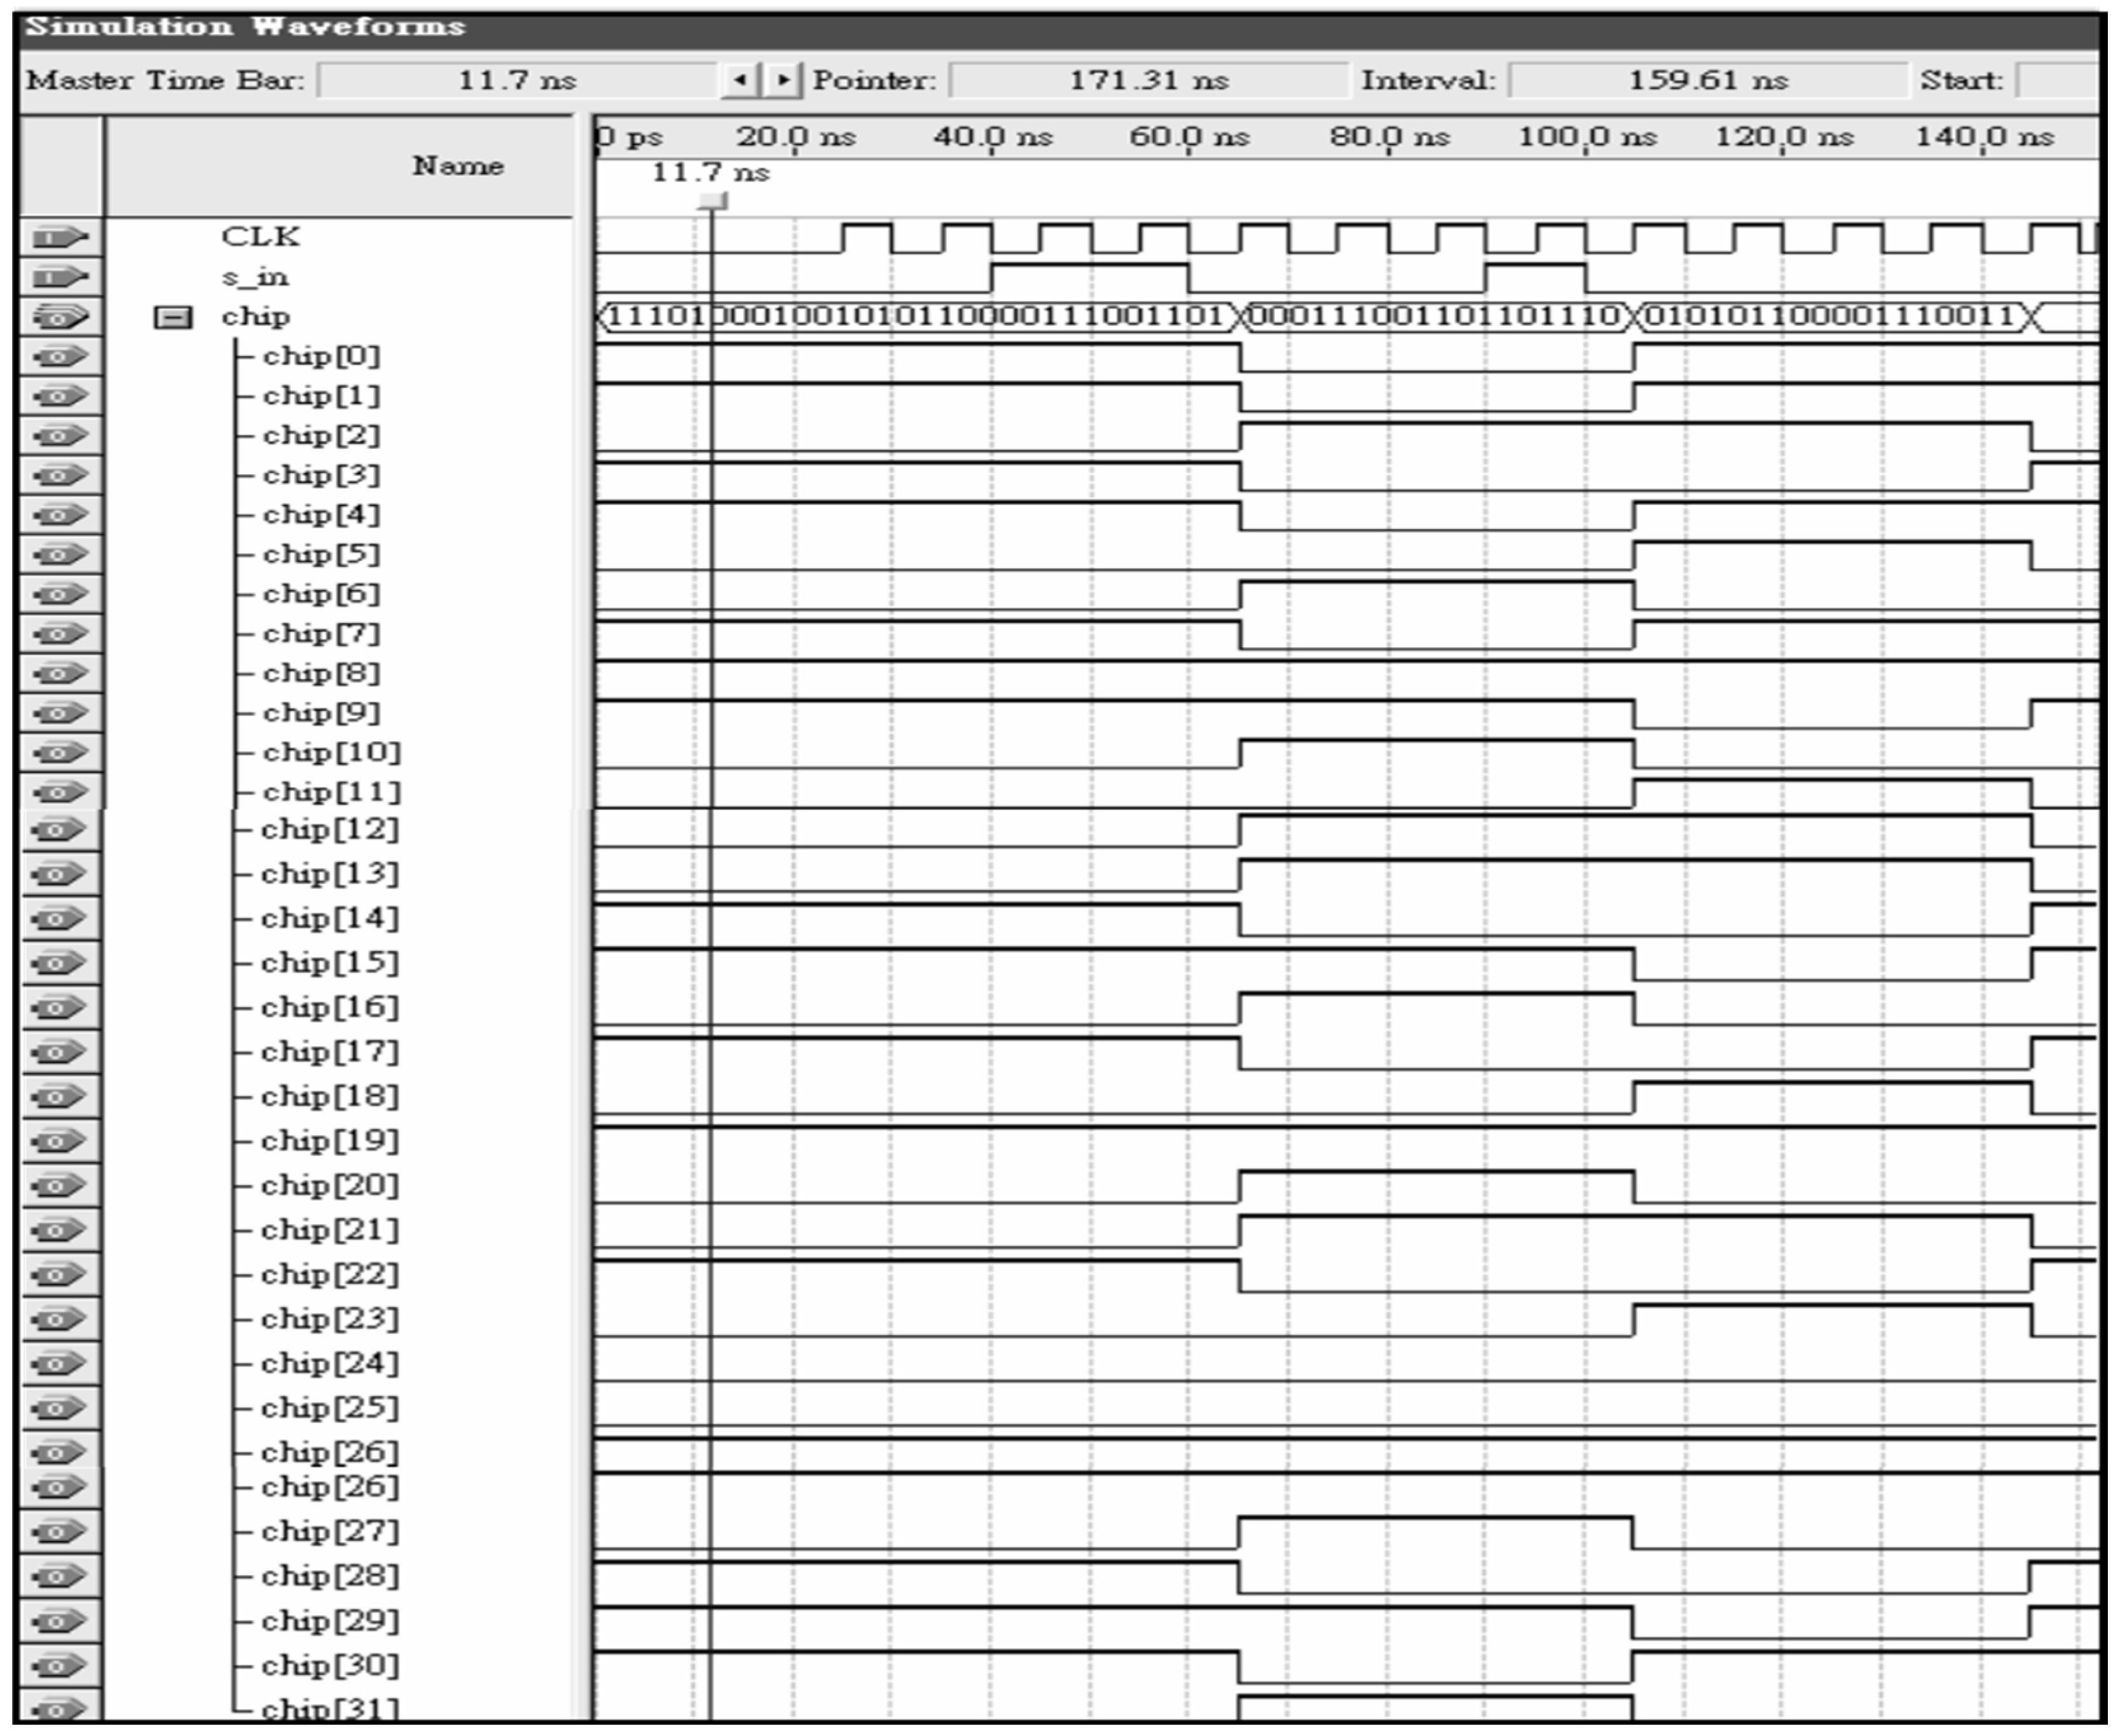
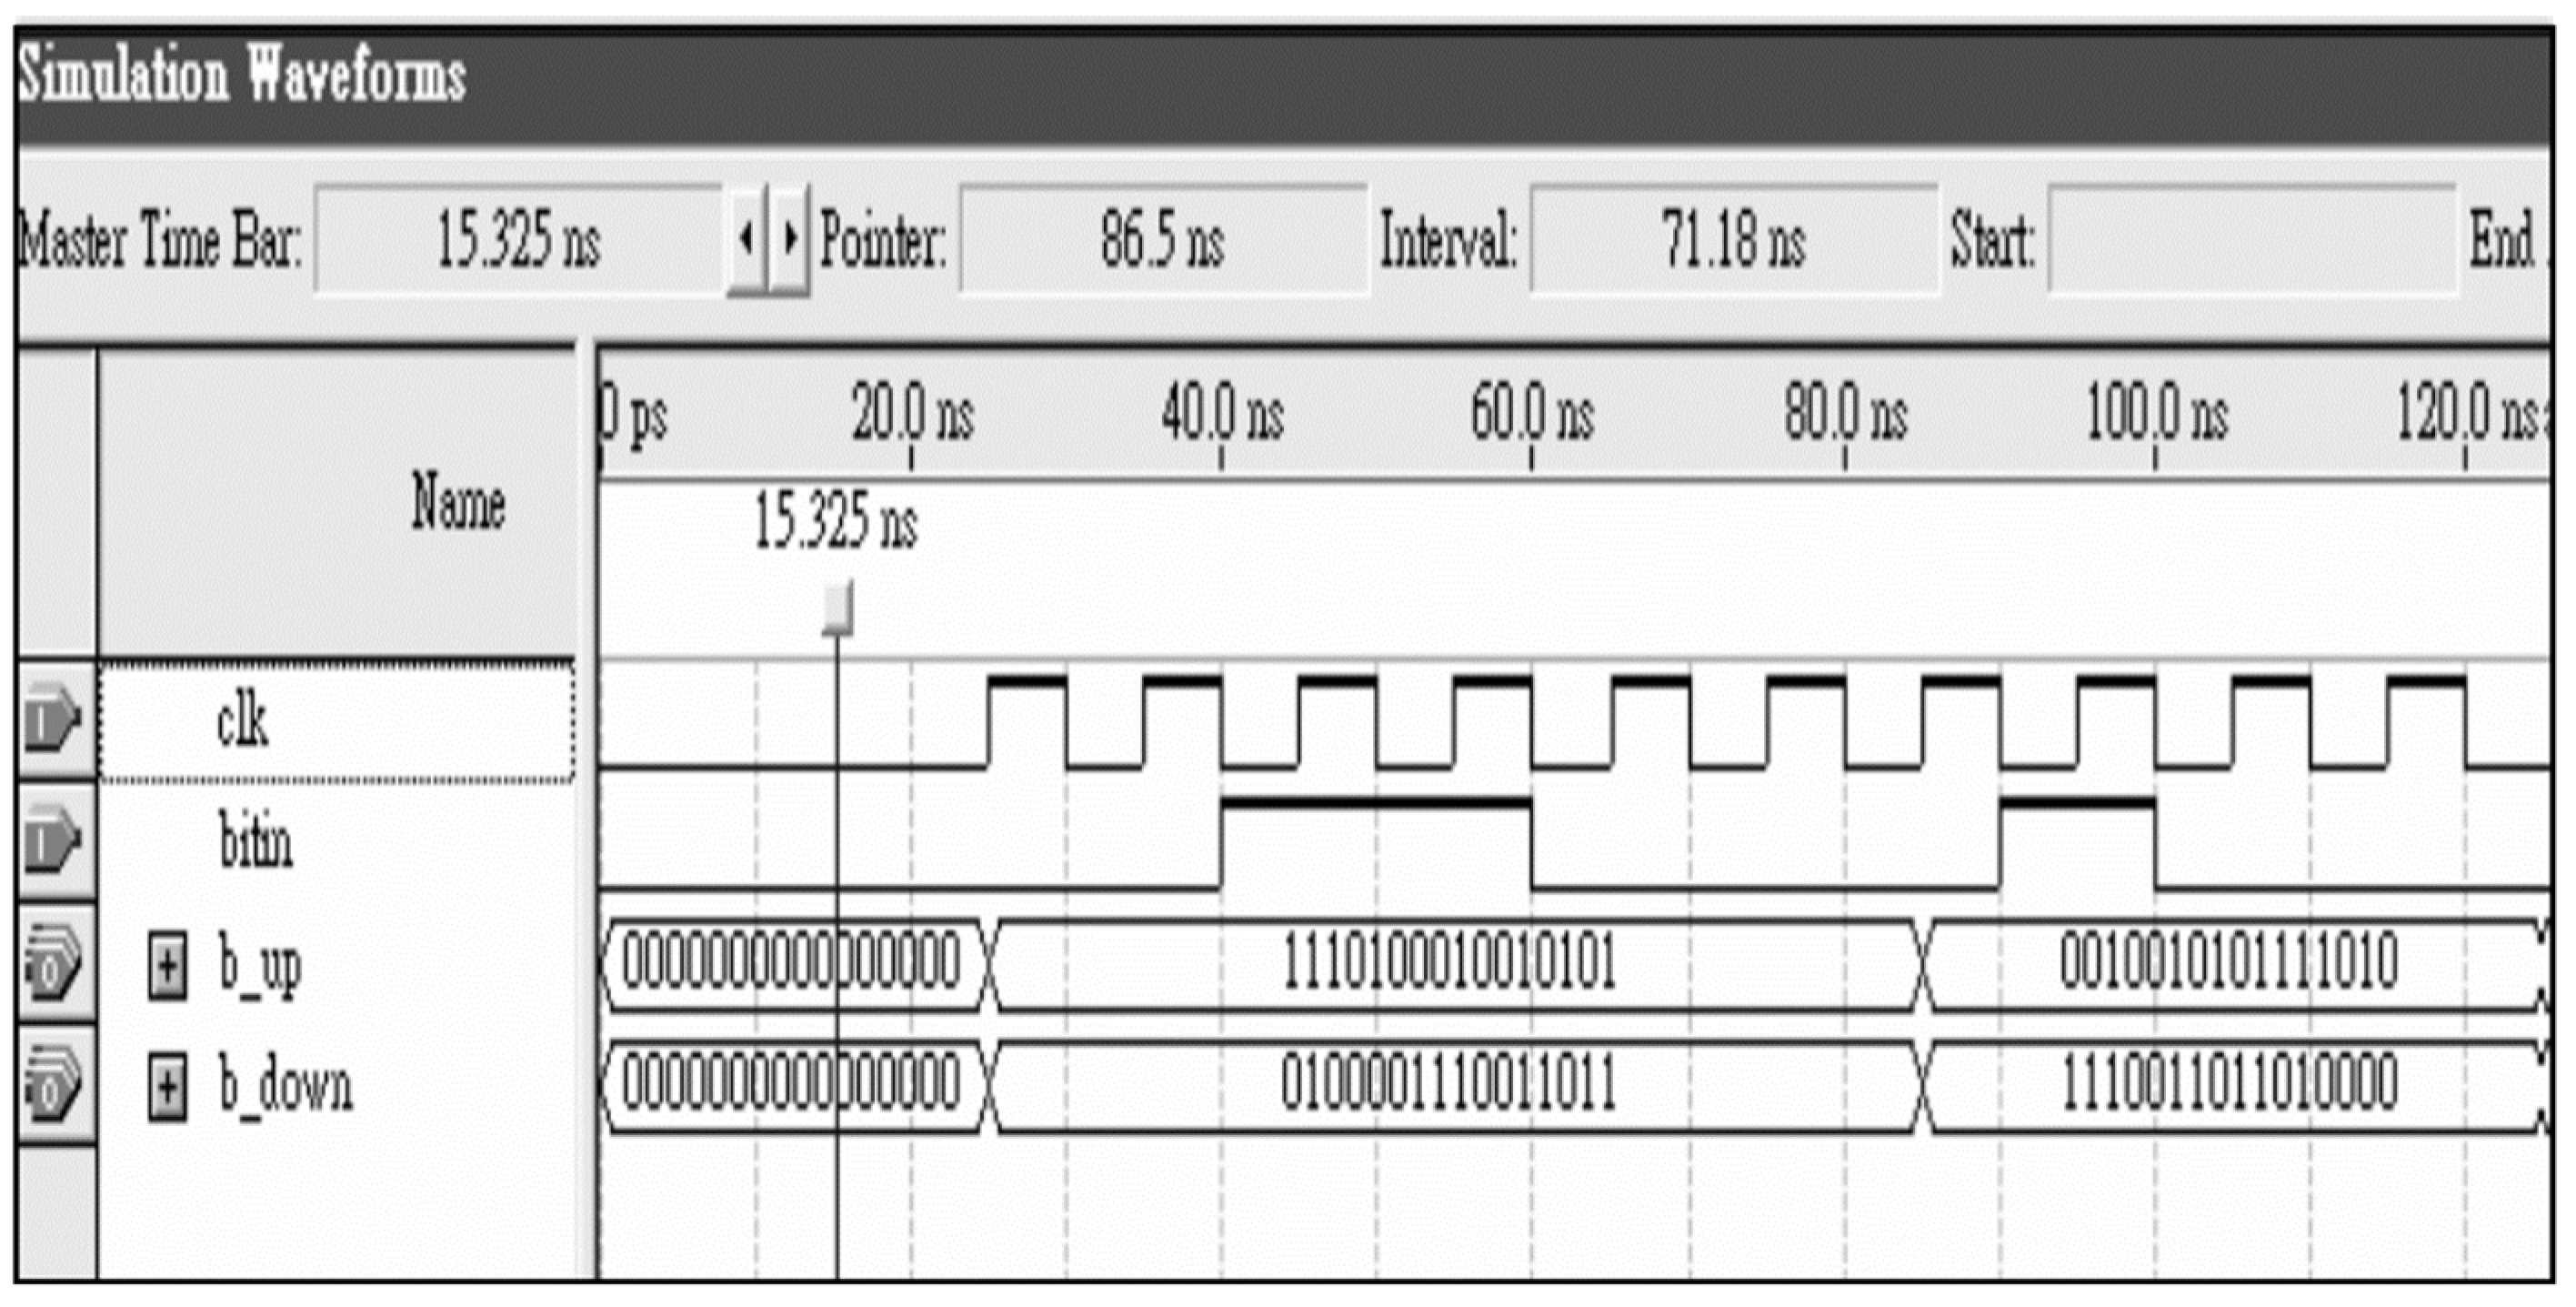
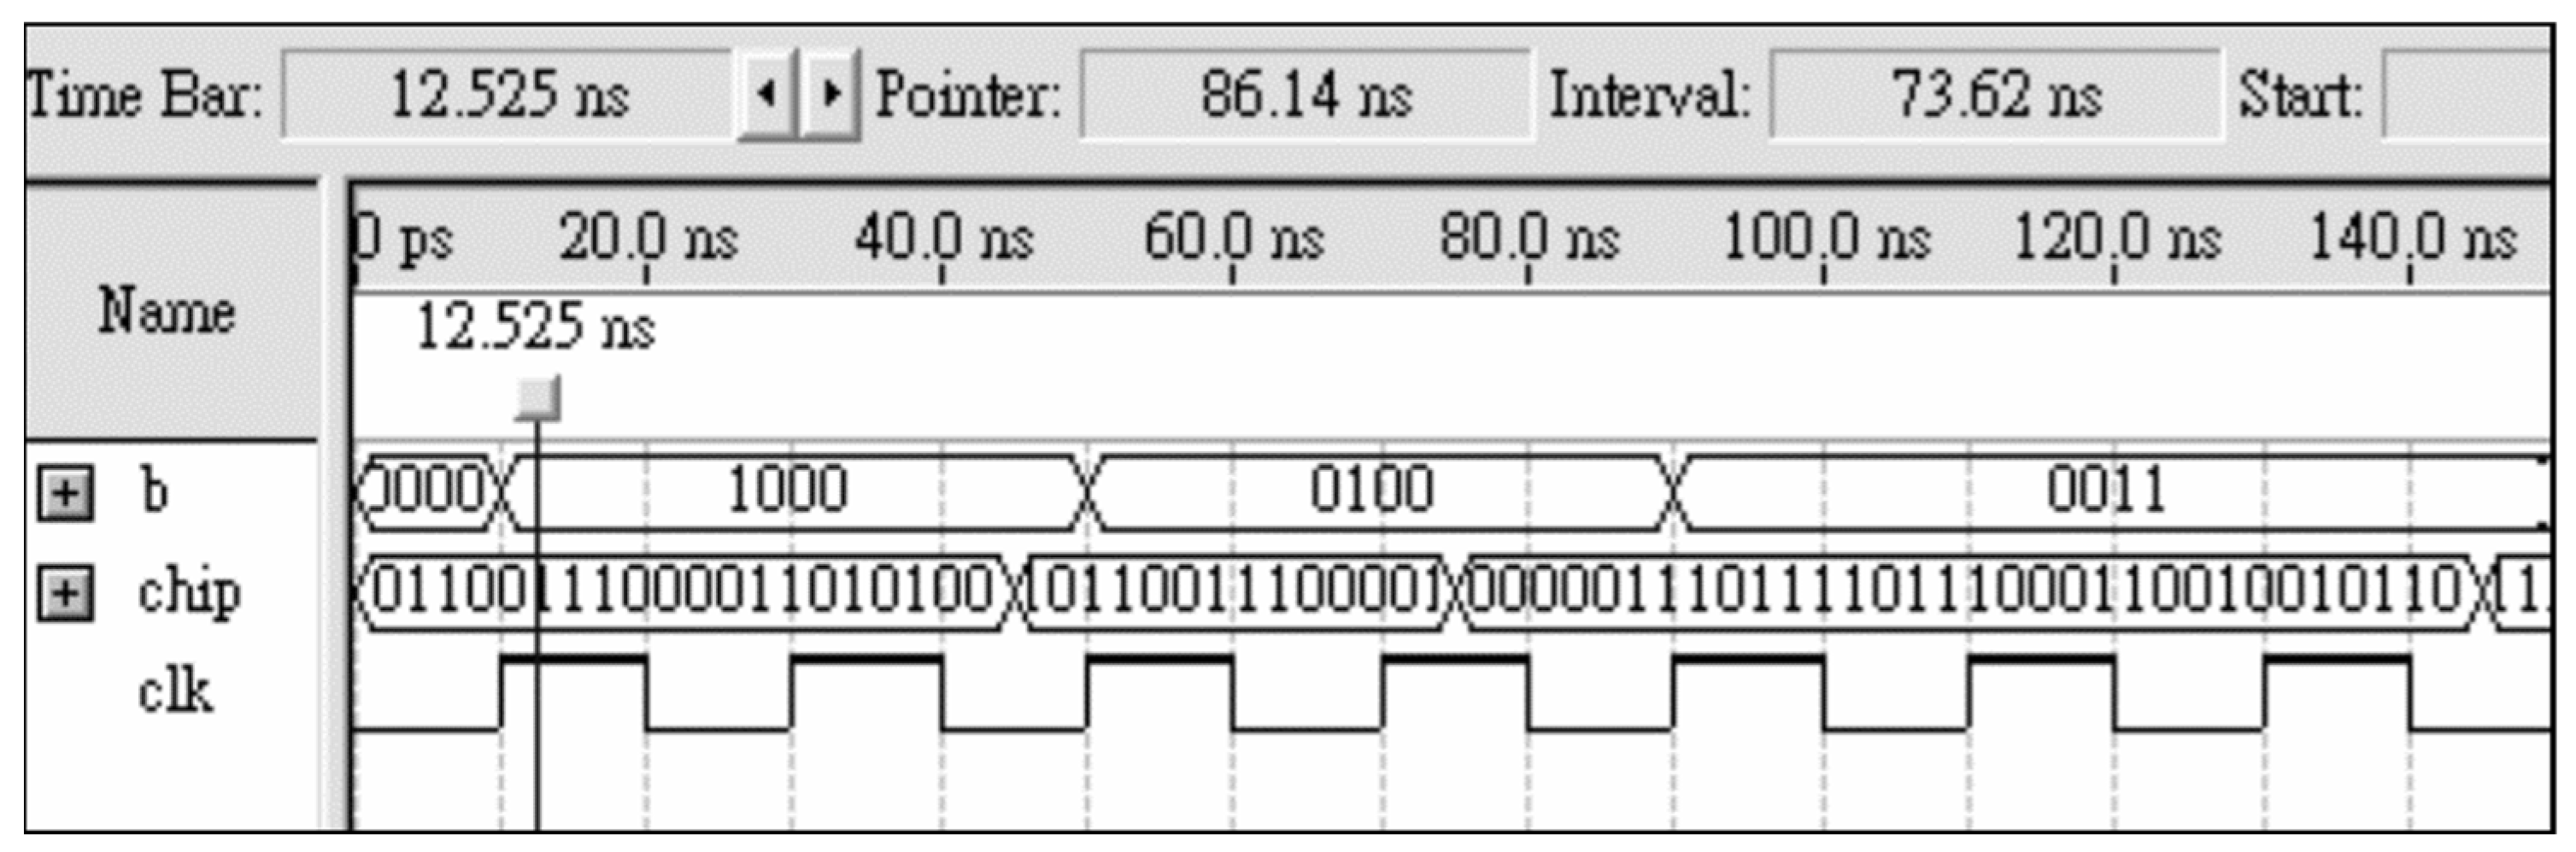
3.2. IEEE 802.15.4 Hopping Design Method
3.2.1. TX Terminal
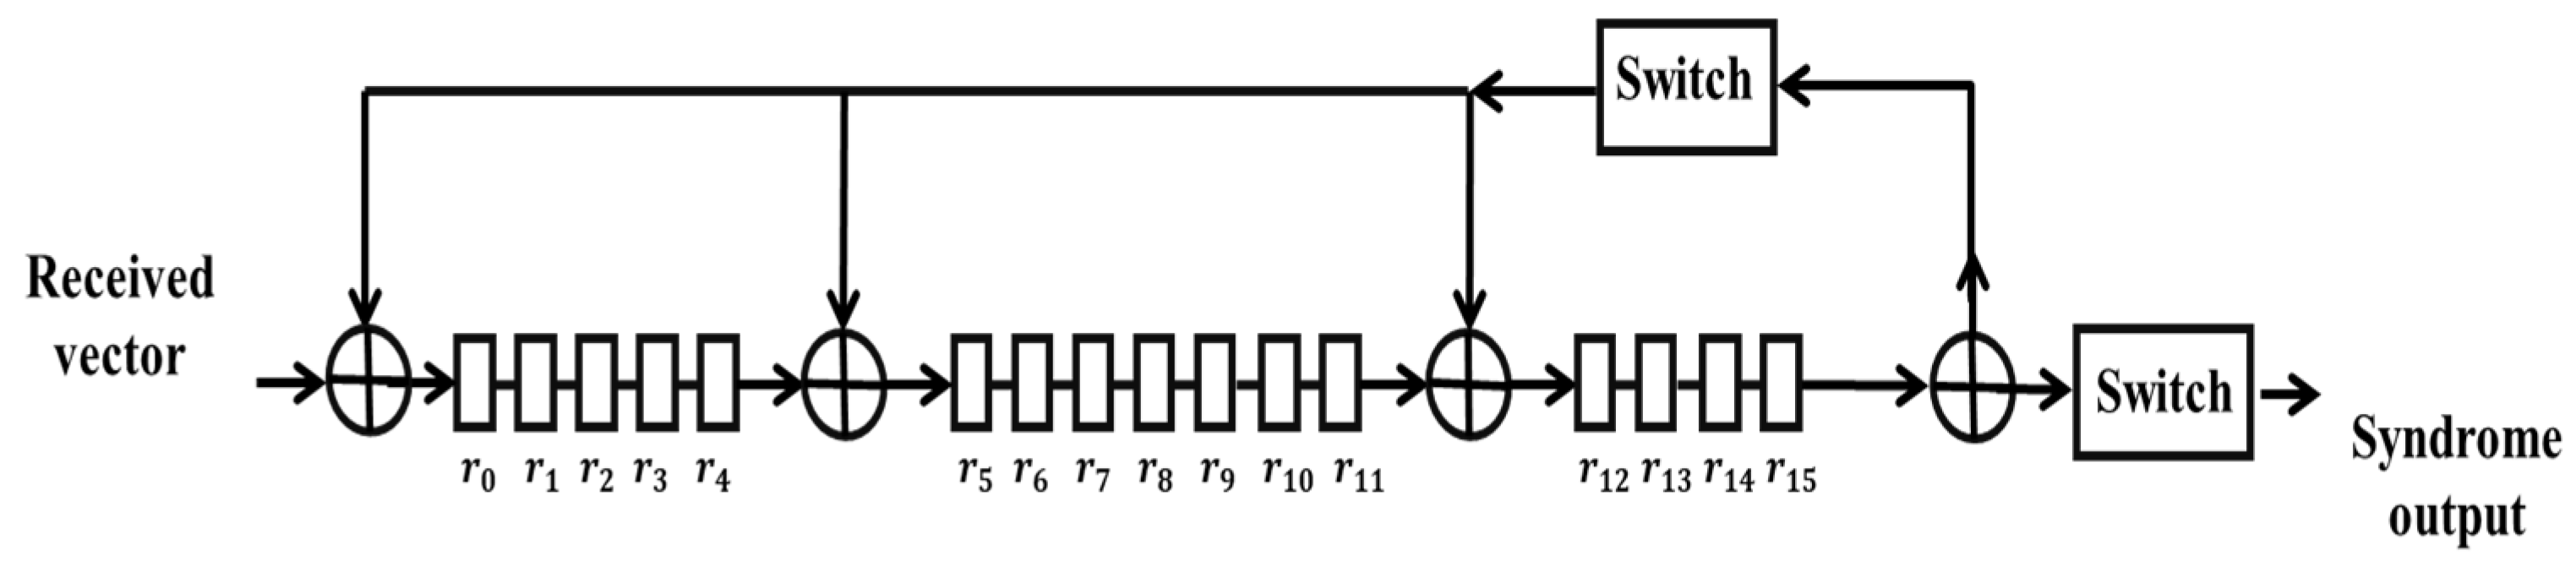
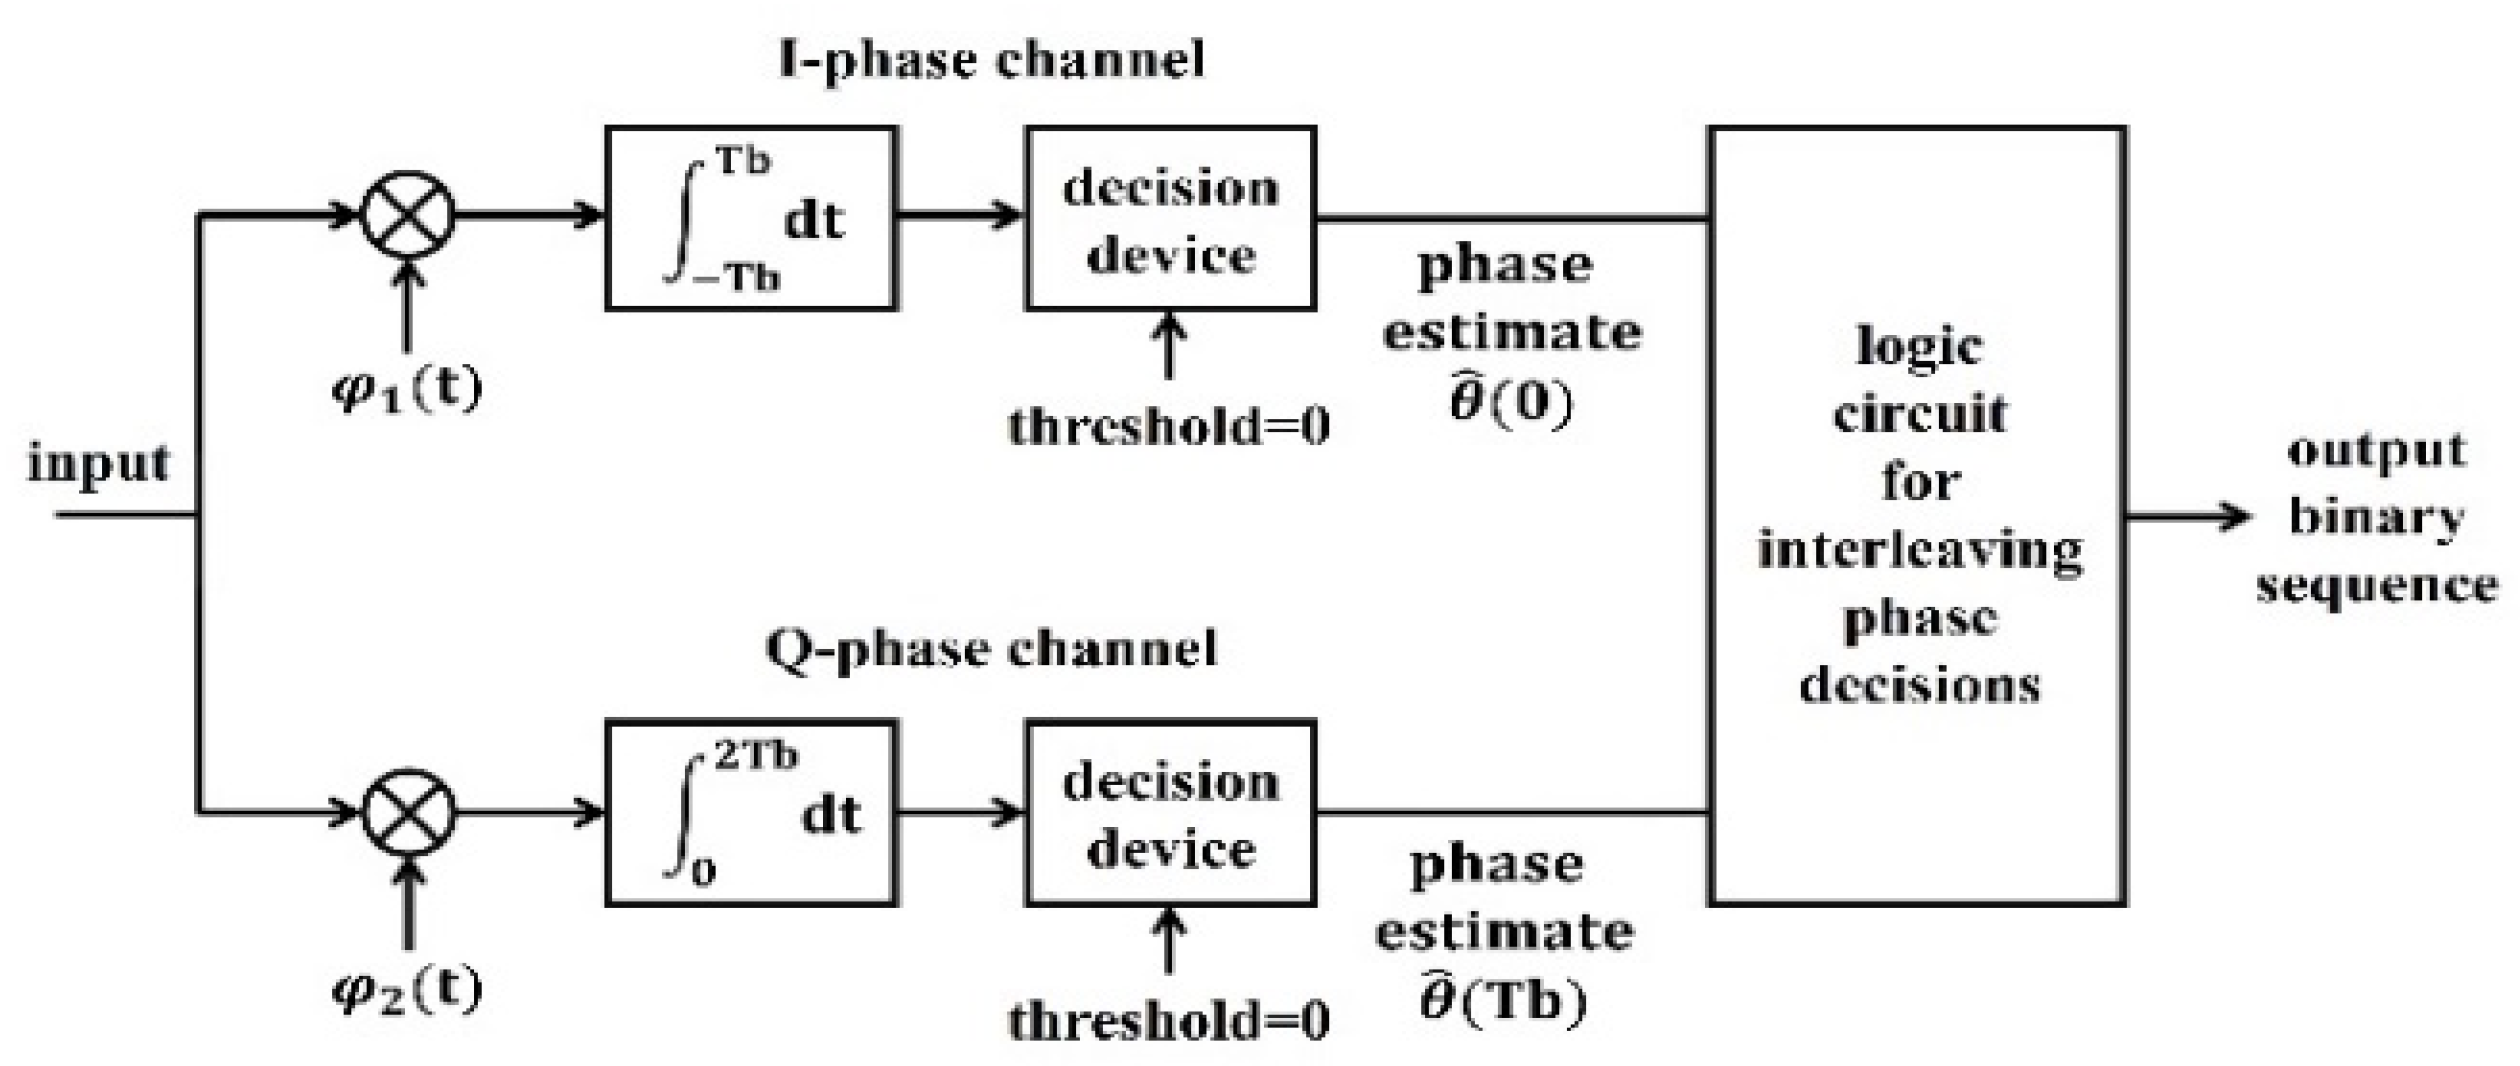
3.2.2. RX Terminal
- (1)
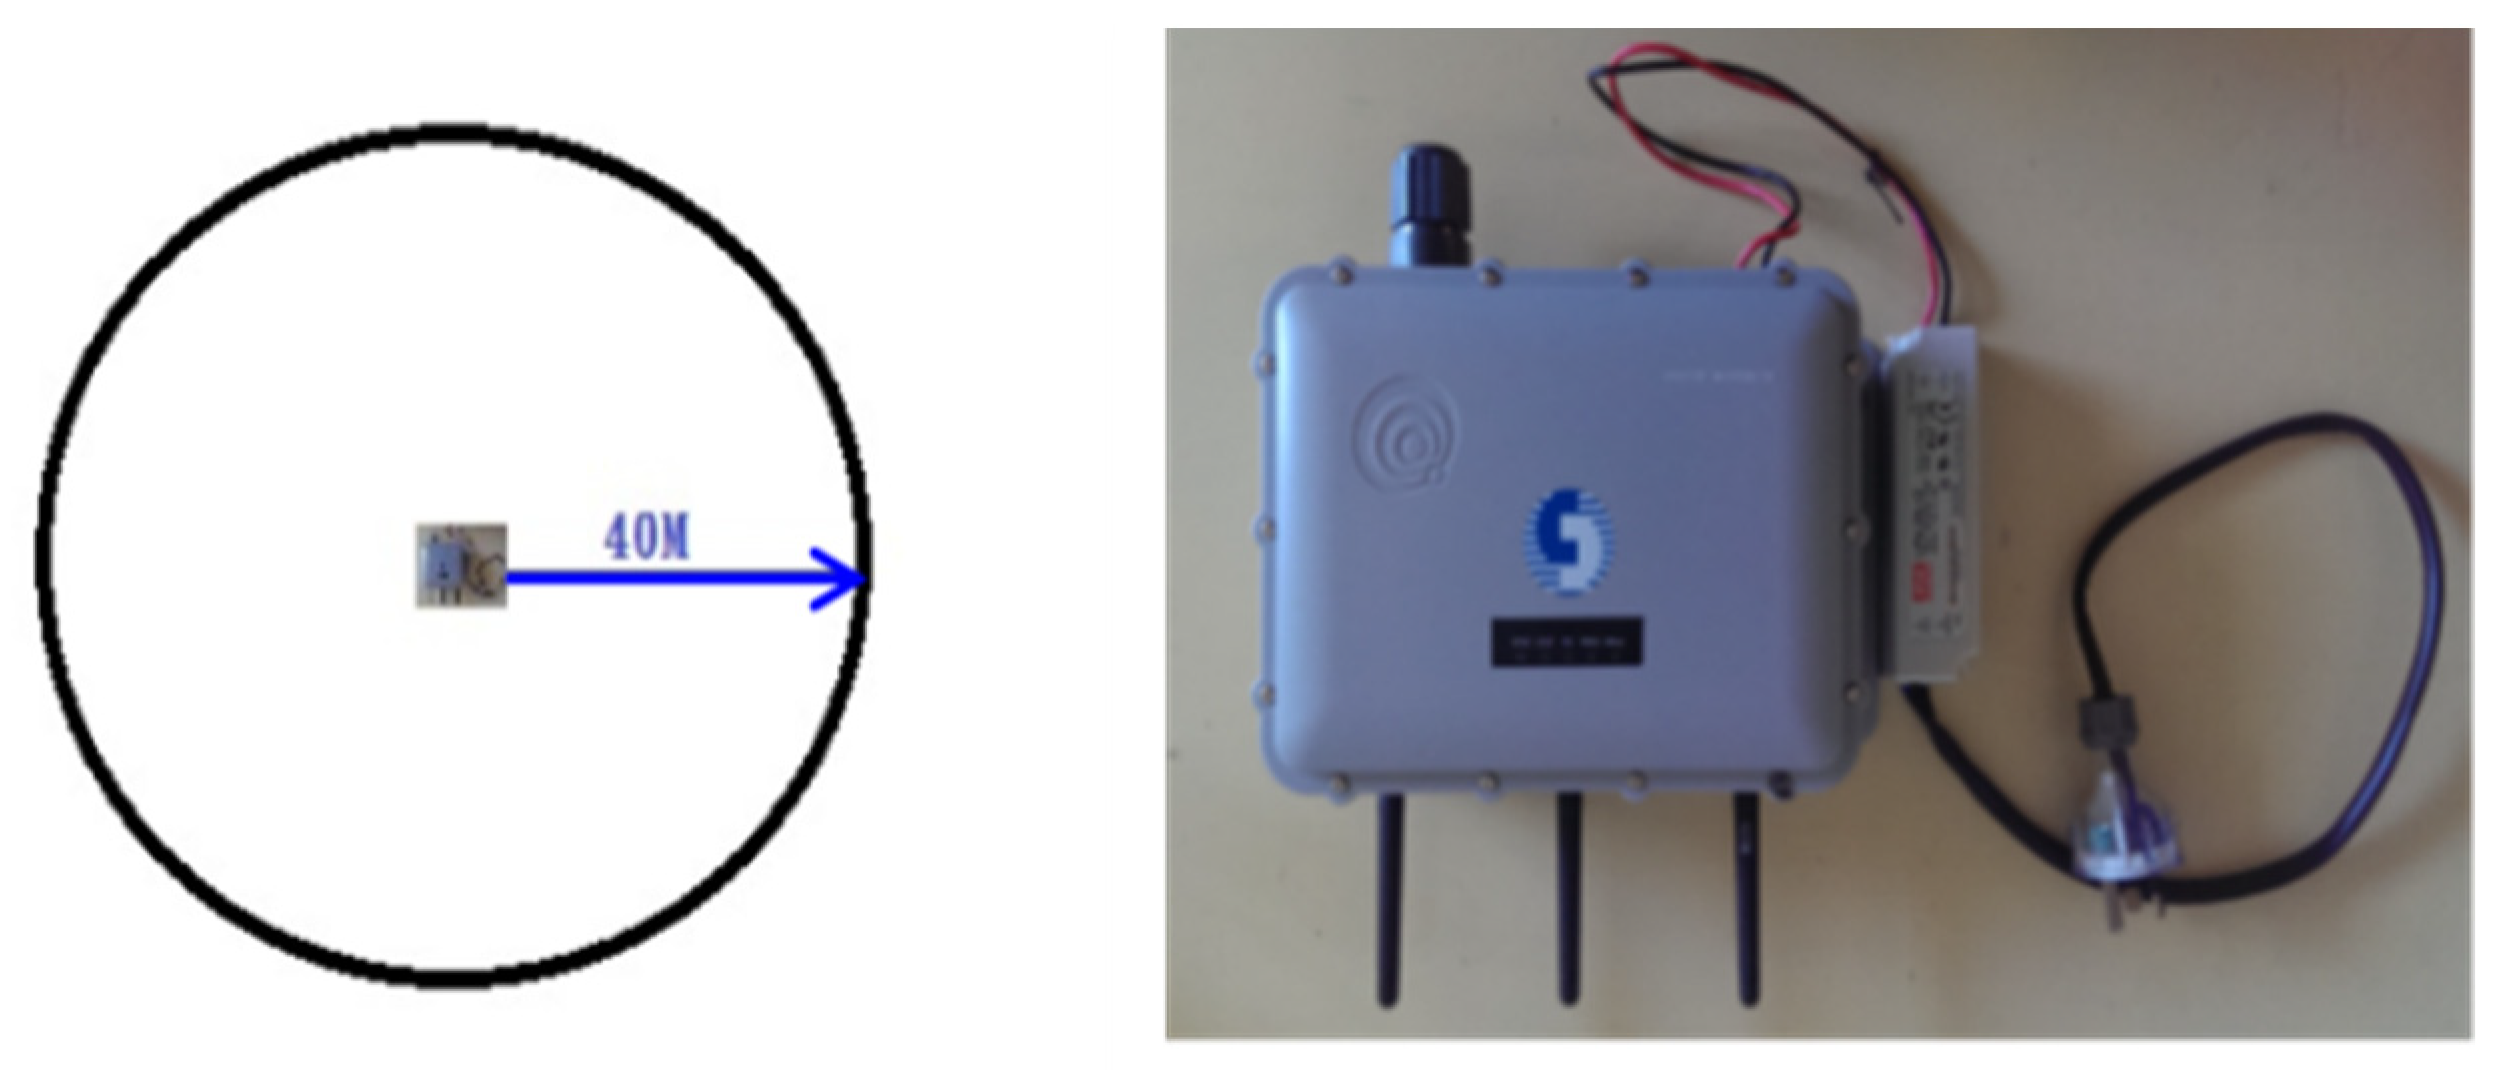
- The control apparatus for communication nodes.
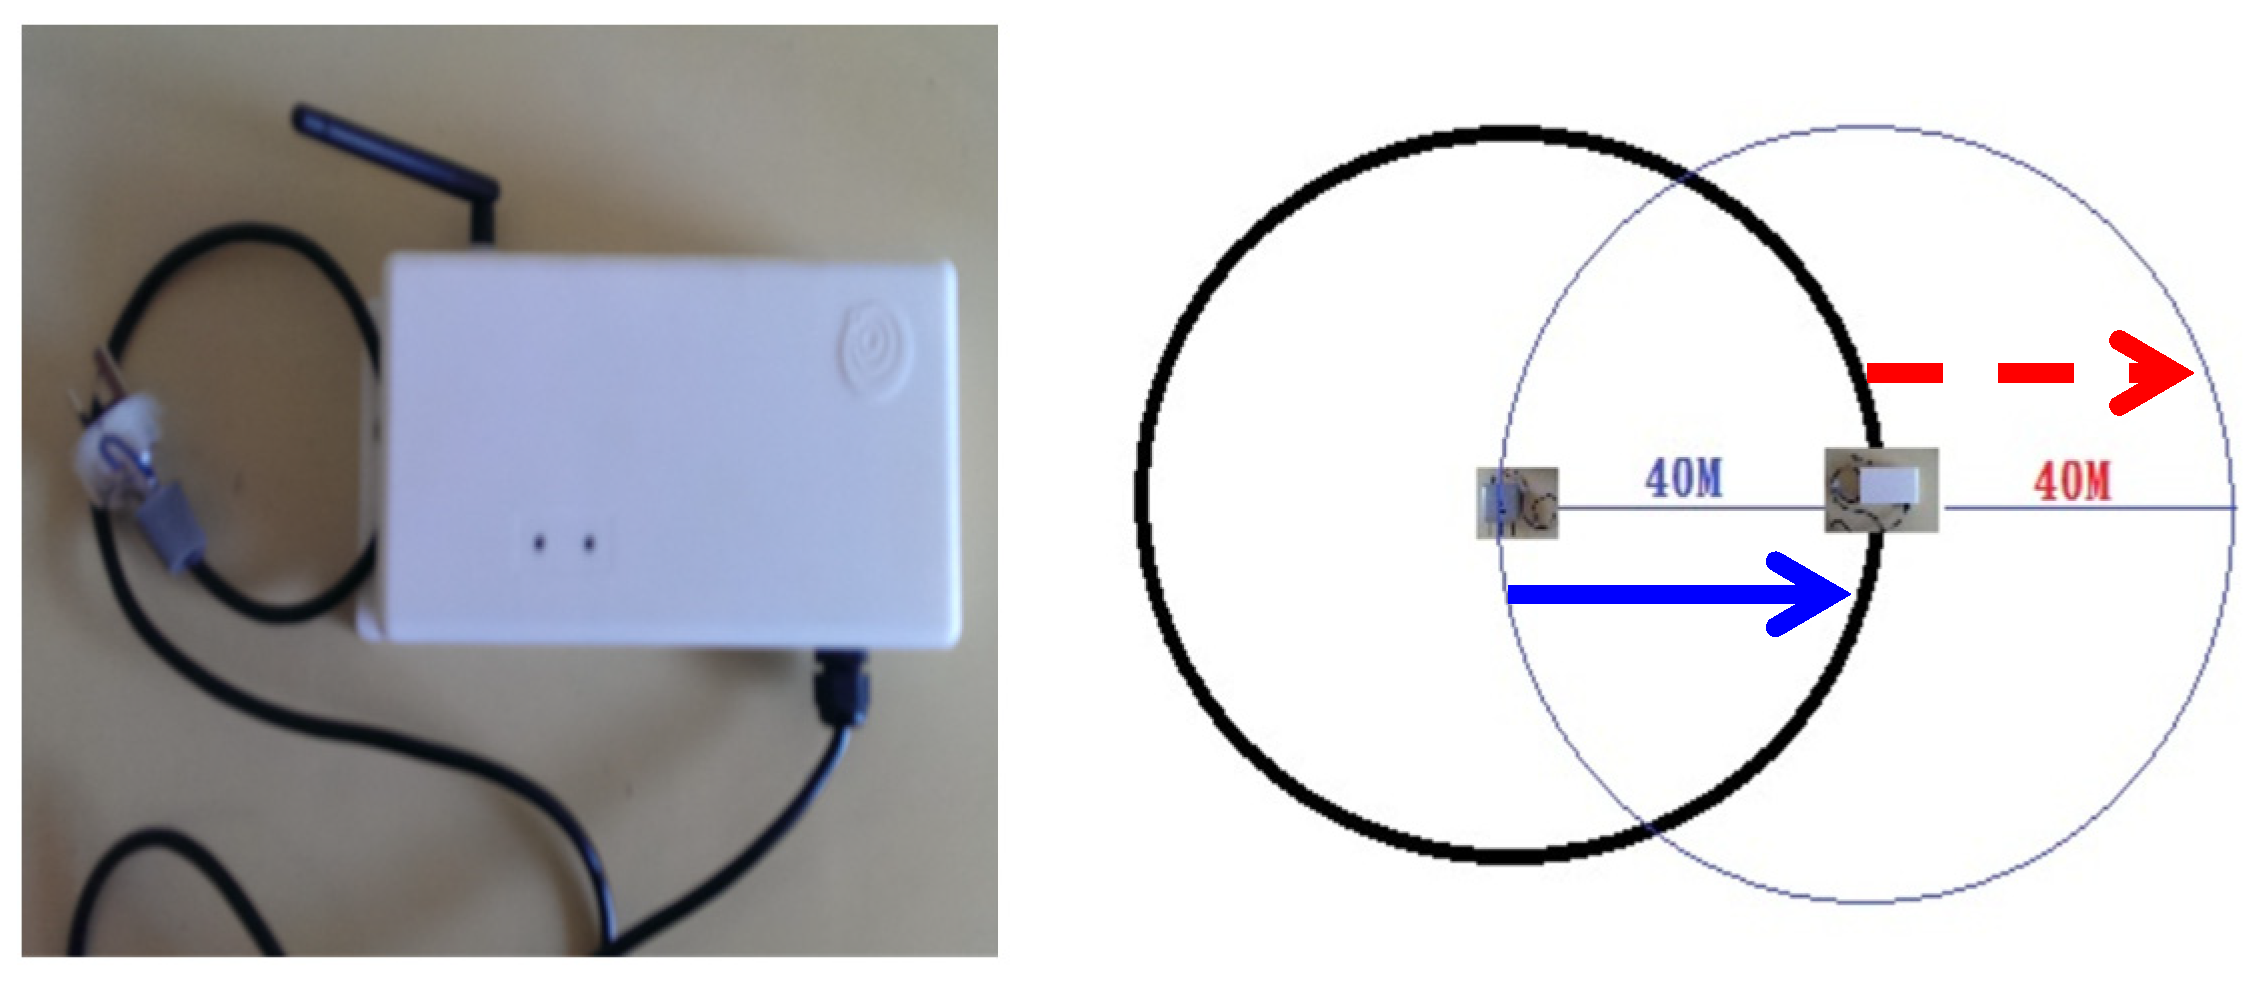
- (2)
- The seamless incorporation of repeater units for advanced signal expansion.
- (3)
- The salient features encapsulated within these utilization directives are expounded as follows:
- Possess a robust waterproof rating of IP67, designed for outdoor applications with inherent waterproofing.
- Operate on an electrical supply ranging from AC 90 V to 220 V (non-waterproof), tailored for the purpose of linking with intelligent timepieces and the CHT mobile network.
- Facilitate connectivity with a maximum of 32 intelligent timepieces.
- Adhere to the Taiwan standard double-hole plug design (for outdoor use, paying meticulous attention to waterproofing is advised).
- Possesses an impermeable IP67 rating, meticulously crafted for outdoor deployment, rendering it inherently waterproof.
- Operates on an electrical supply spanning AC 90 V to 220 V, with a design tailored for non-waterproof environments.
- Serves the noble purpose of extending the communication range between smart meters and a communication node control apparatus (it is imperative to note that this does not augment the capacity for smart meter connections).
- Adheres to the Taiwanese standard double-hole plug configuration (for outdoor usage, vigilance toward waterproofing is advised).
4. Solution of Requirements and Inspection Methods
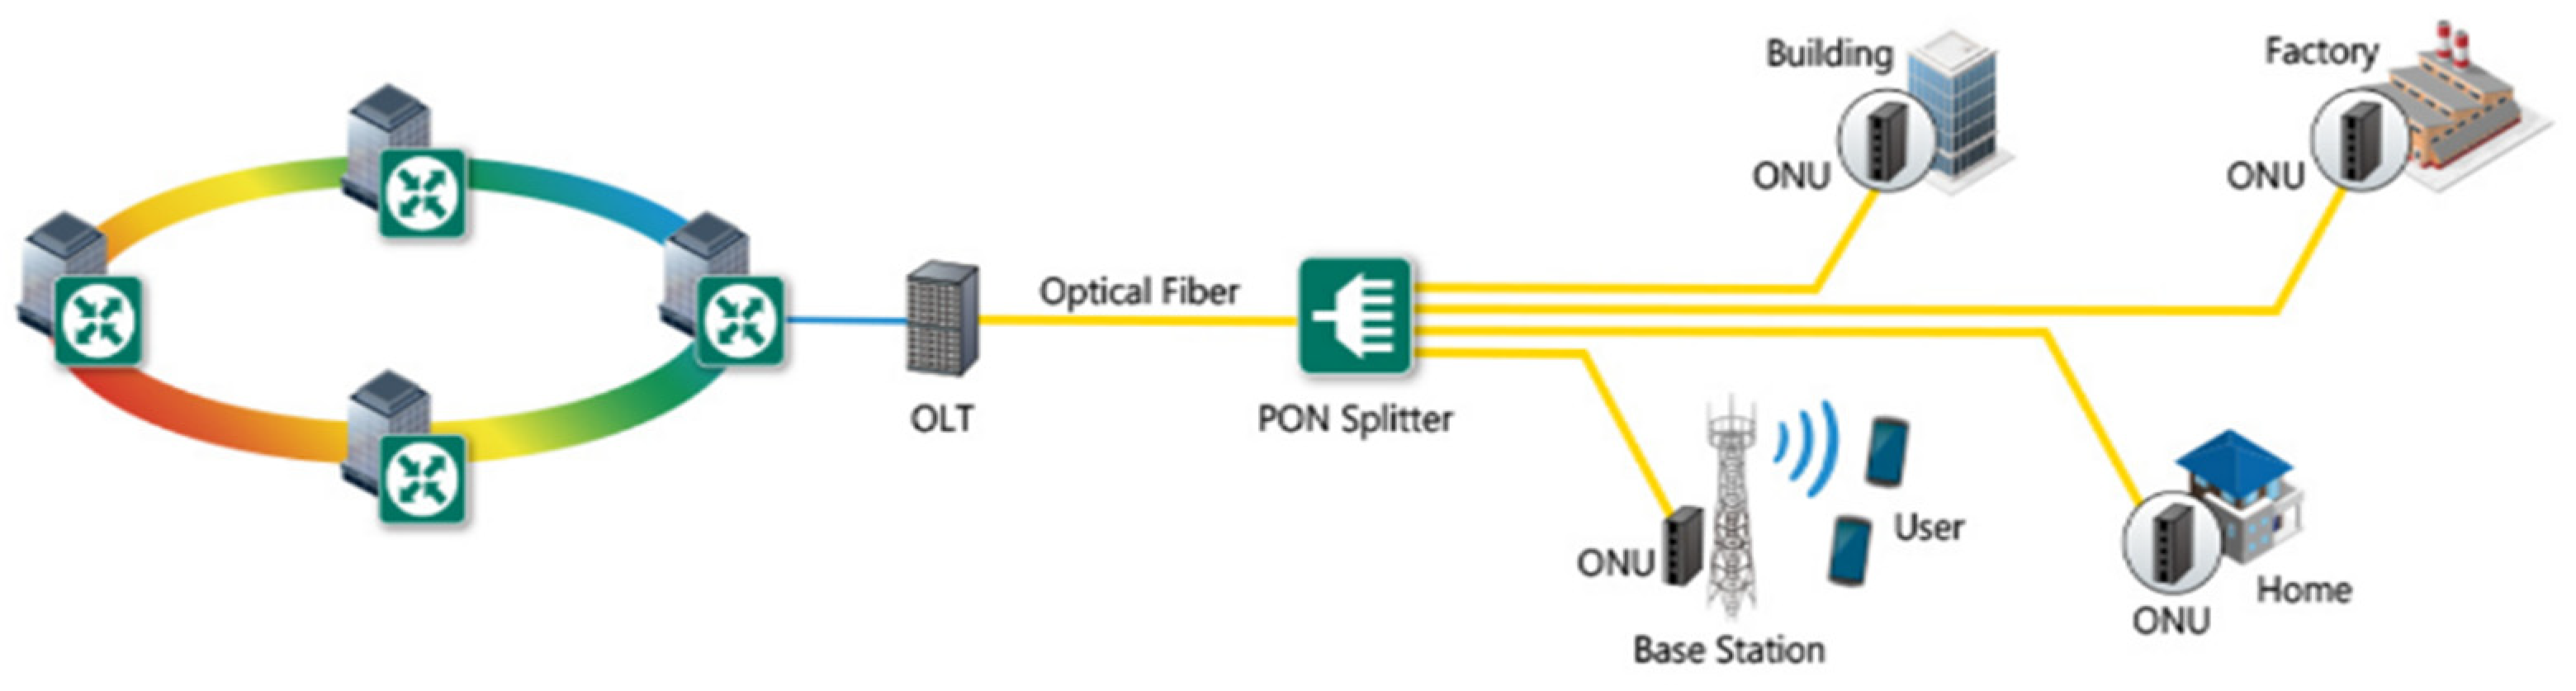
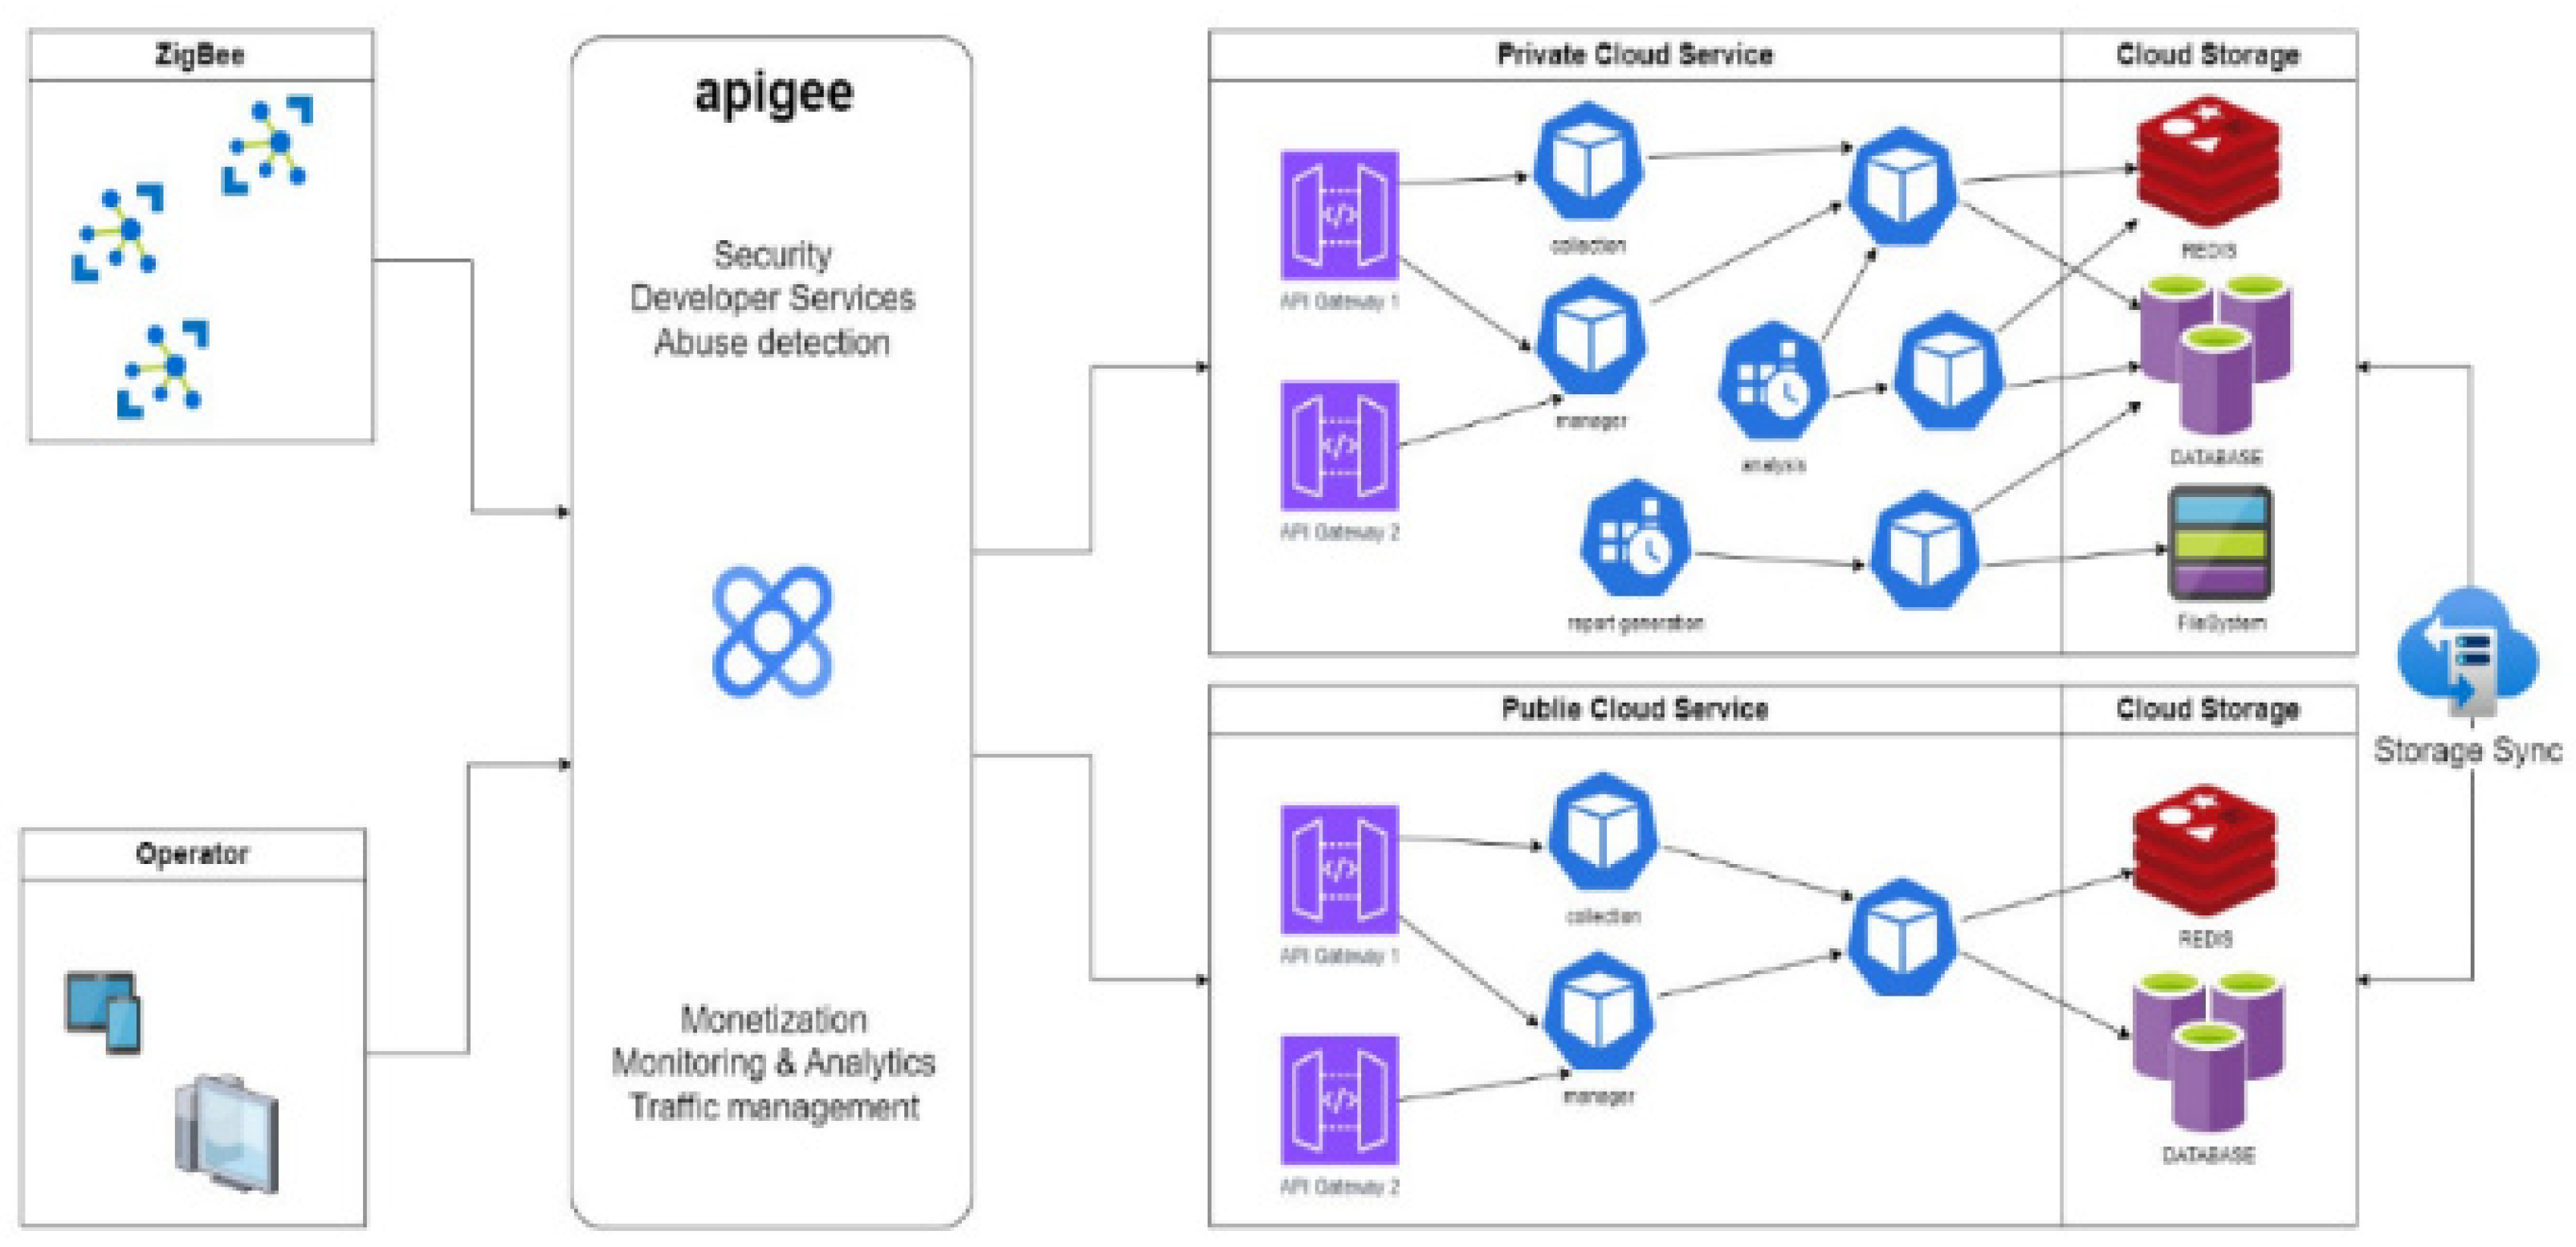
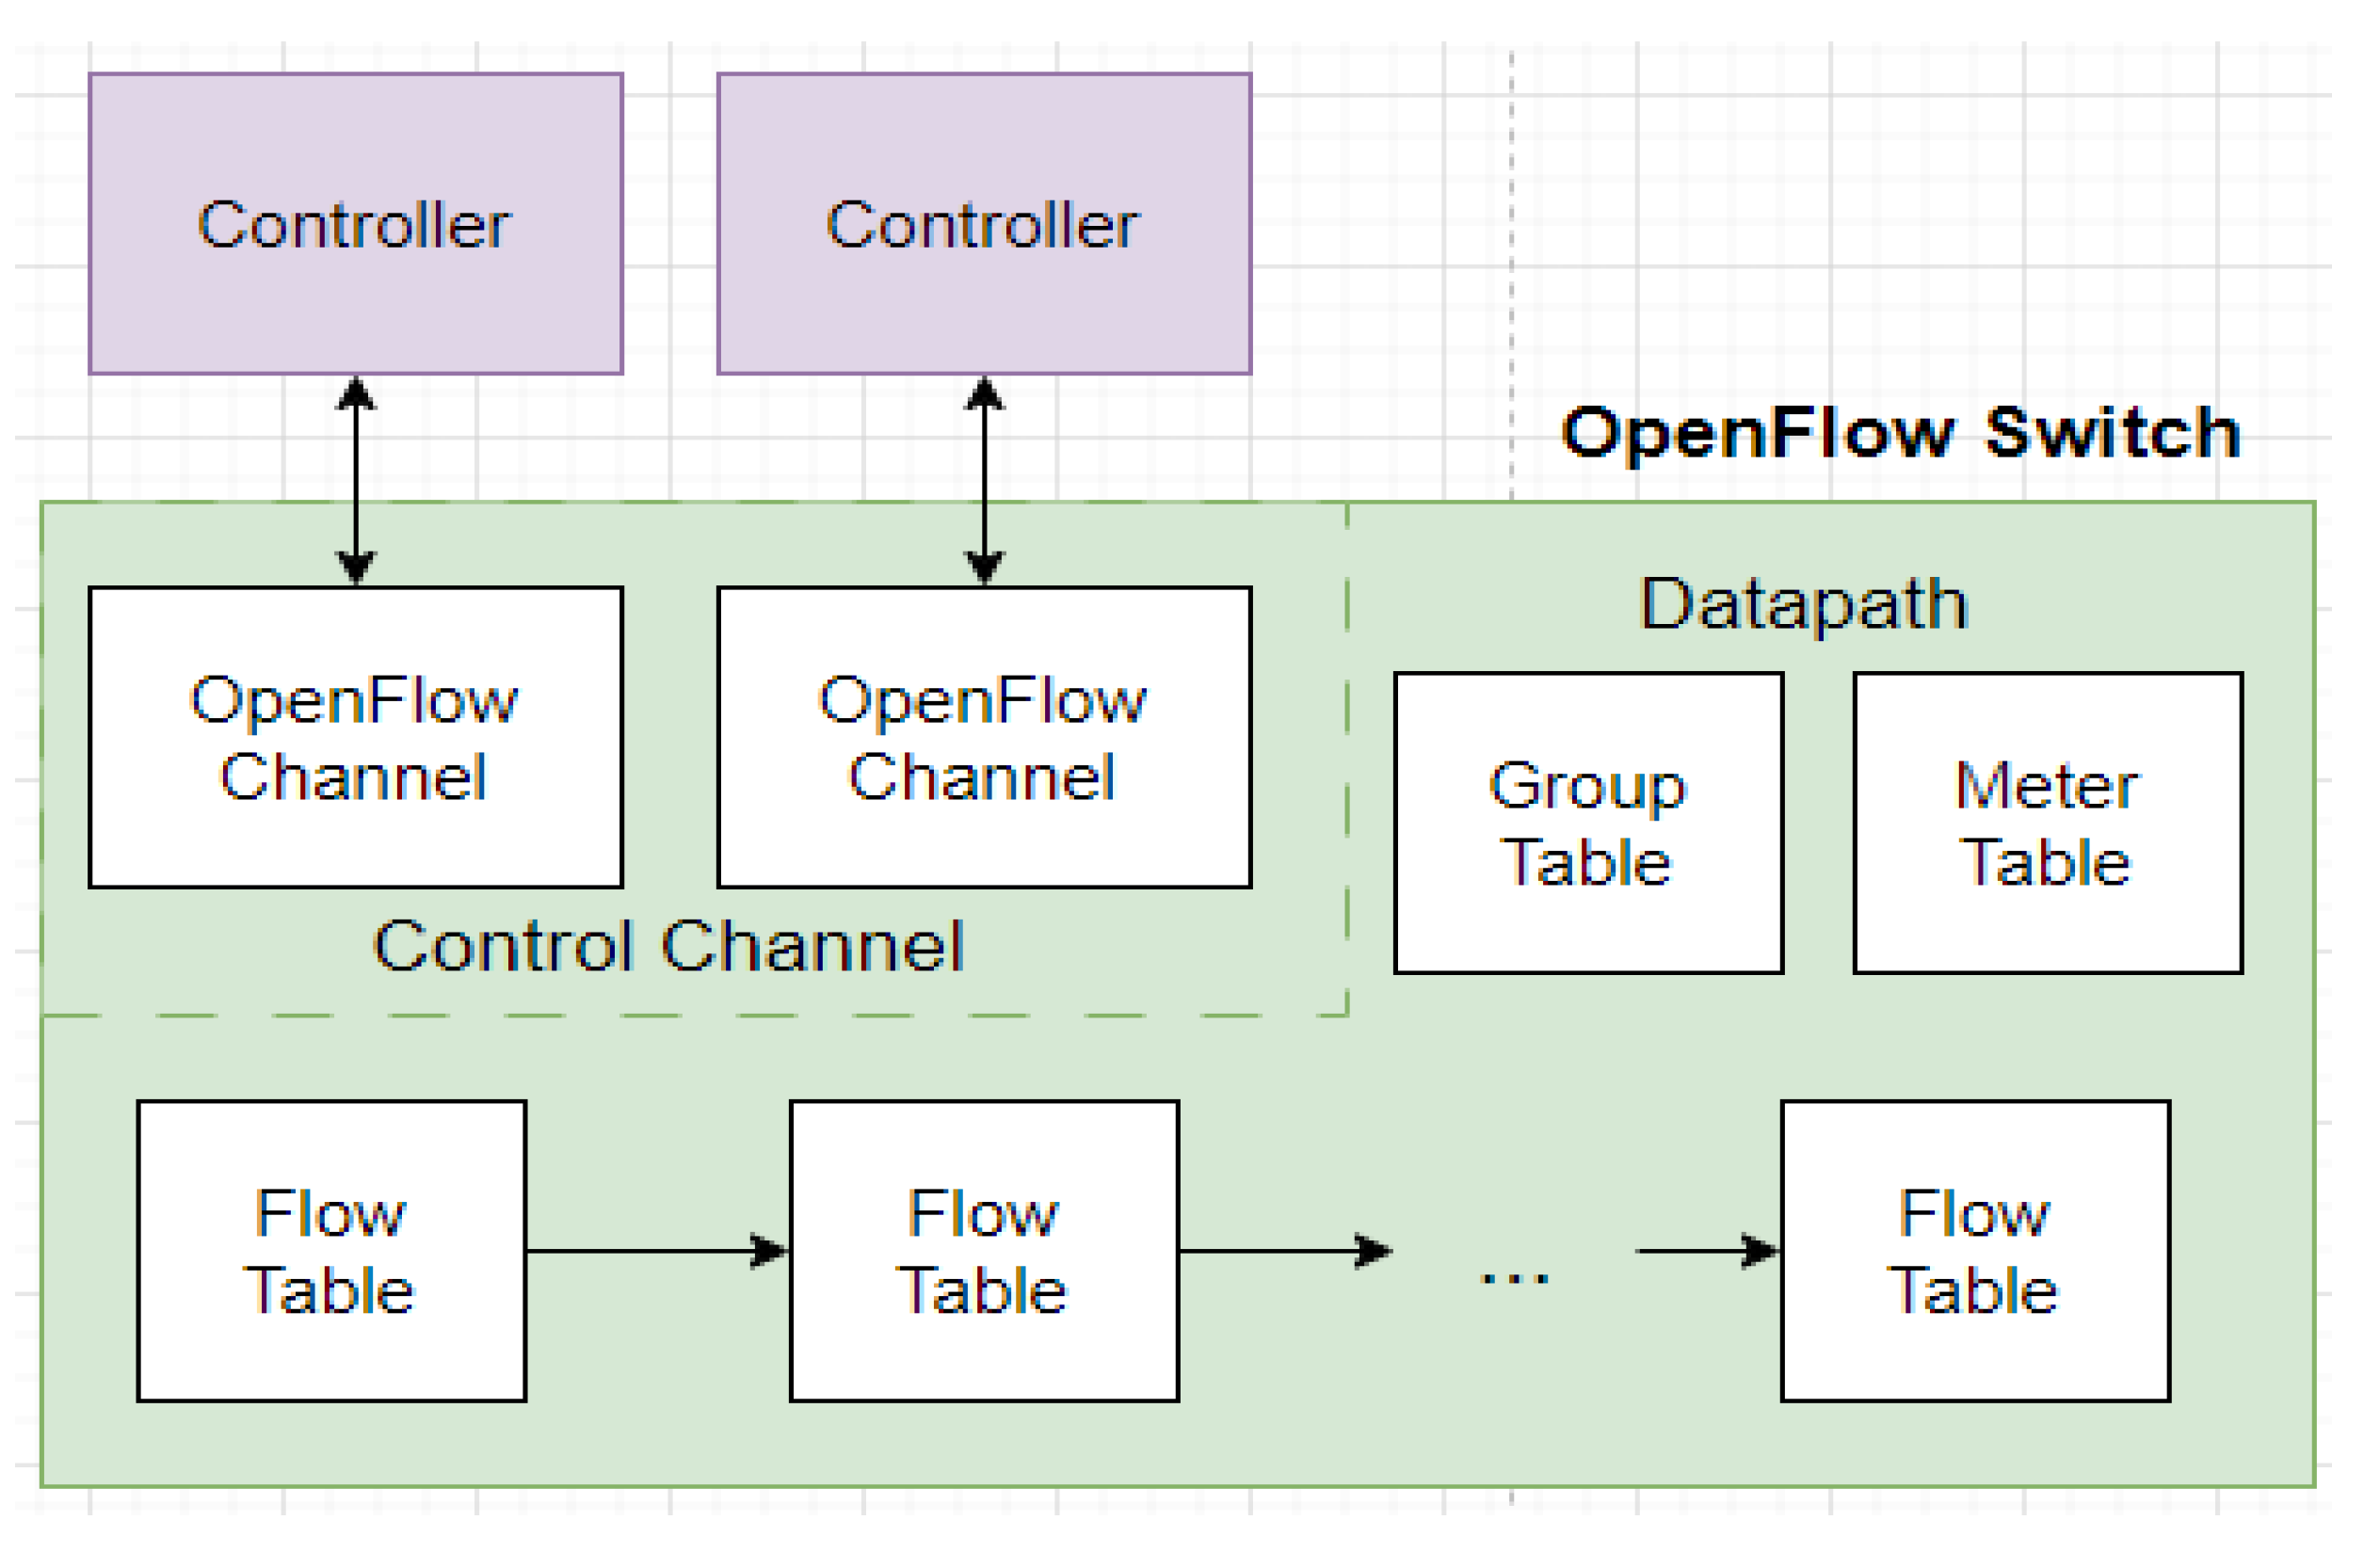
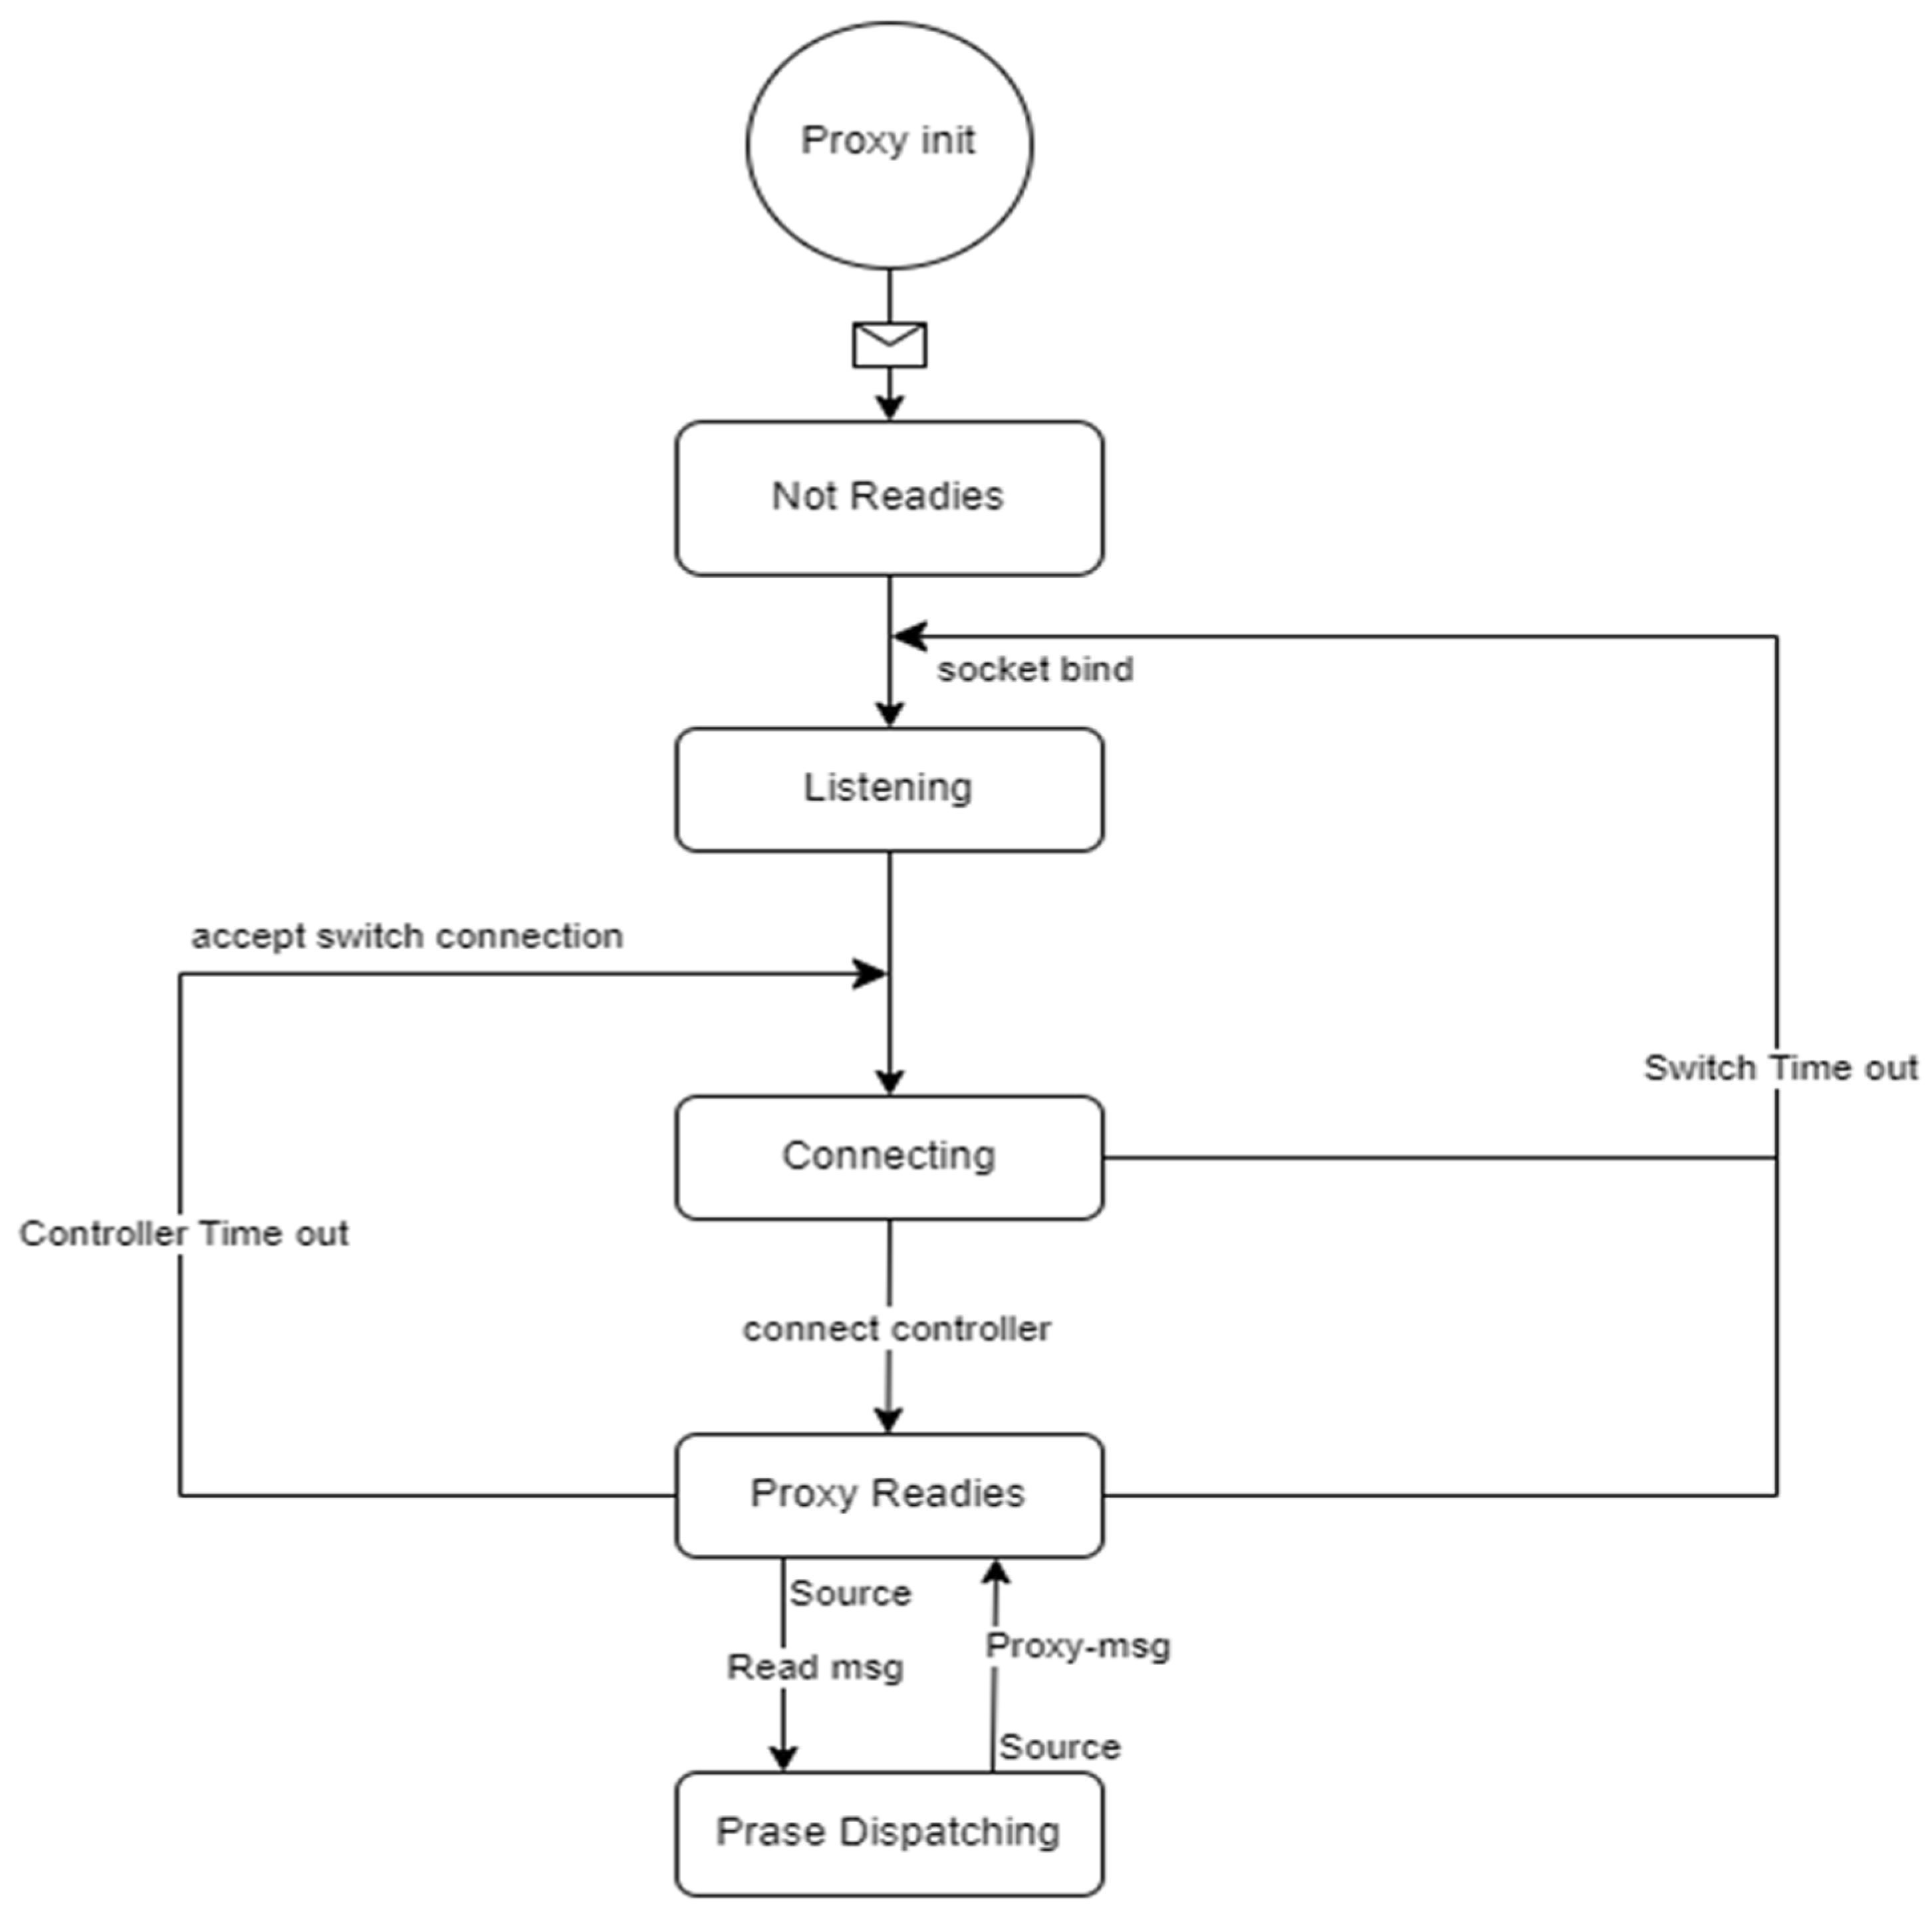
4.1. Open-Flow Proxy Construction
- The initiation and termination of GPON encapsulation method (GEM) connections between the OLT and ONU.
- The configuration of VLAN settings for application services [40] and the management of a user network interface (UNI).
- The compilation of performance statistics.
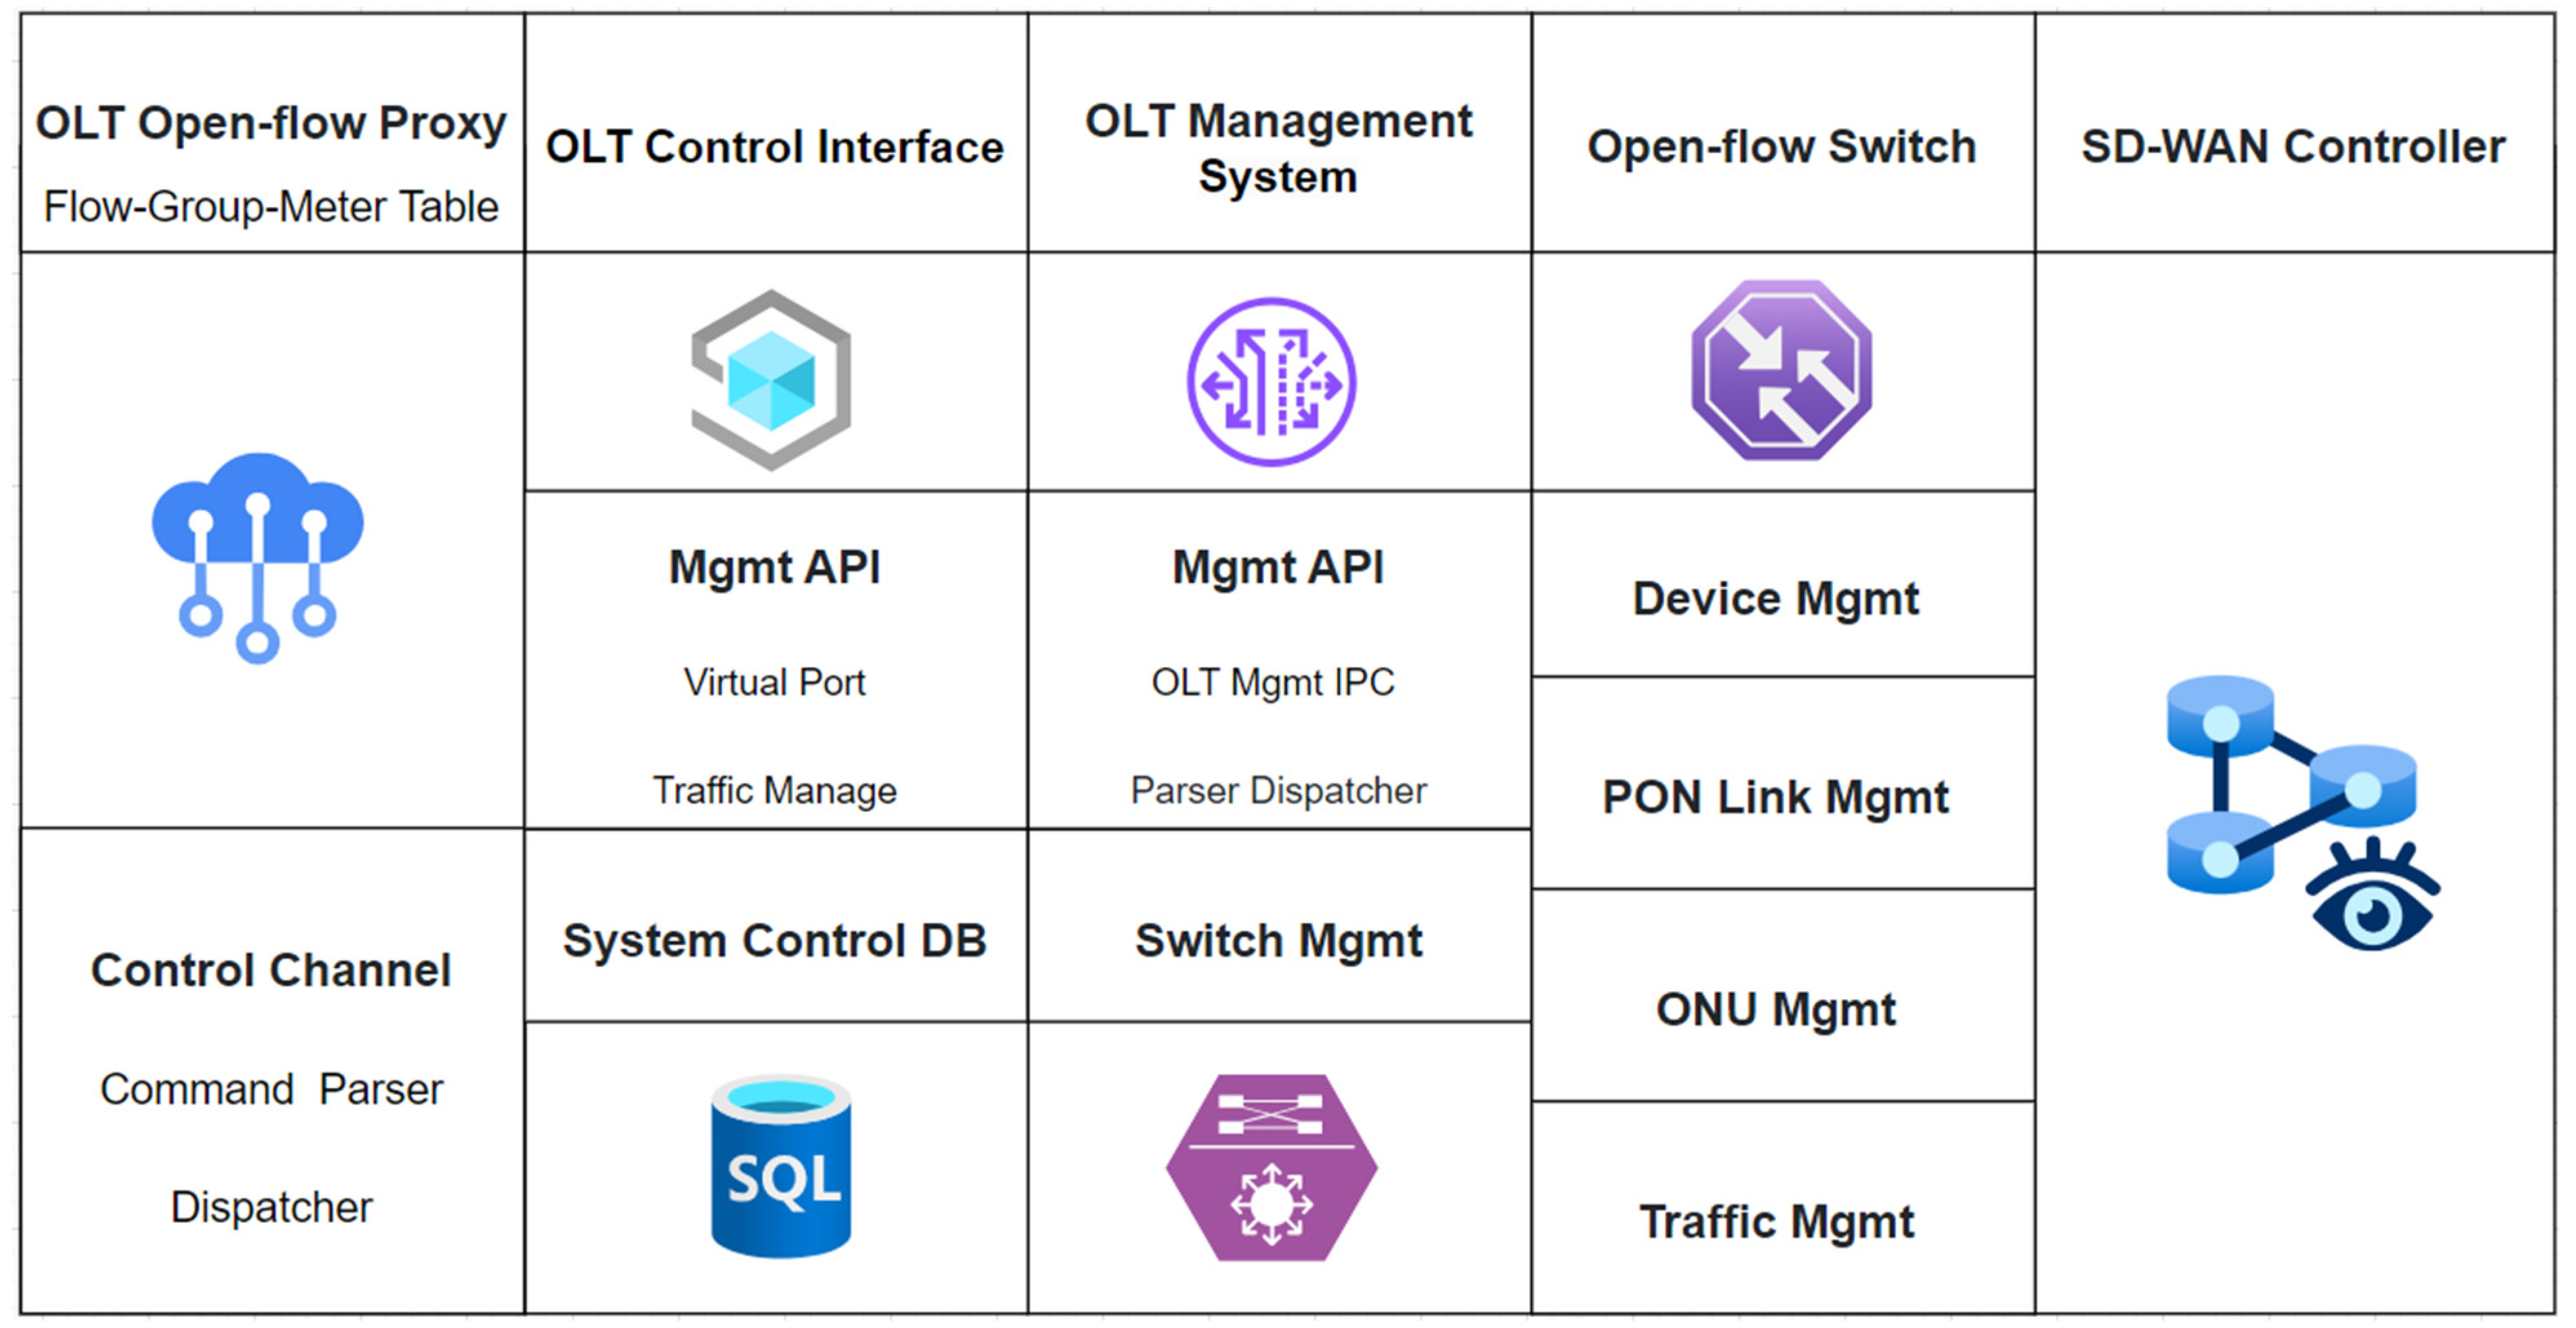
- The OpenFlow Proxy module
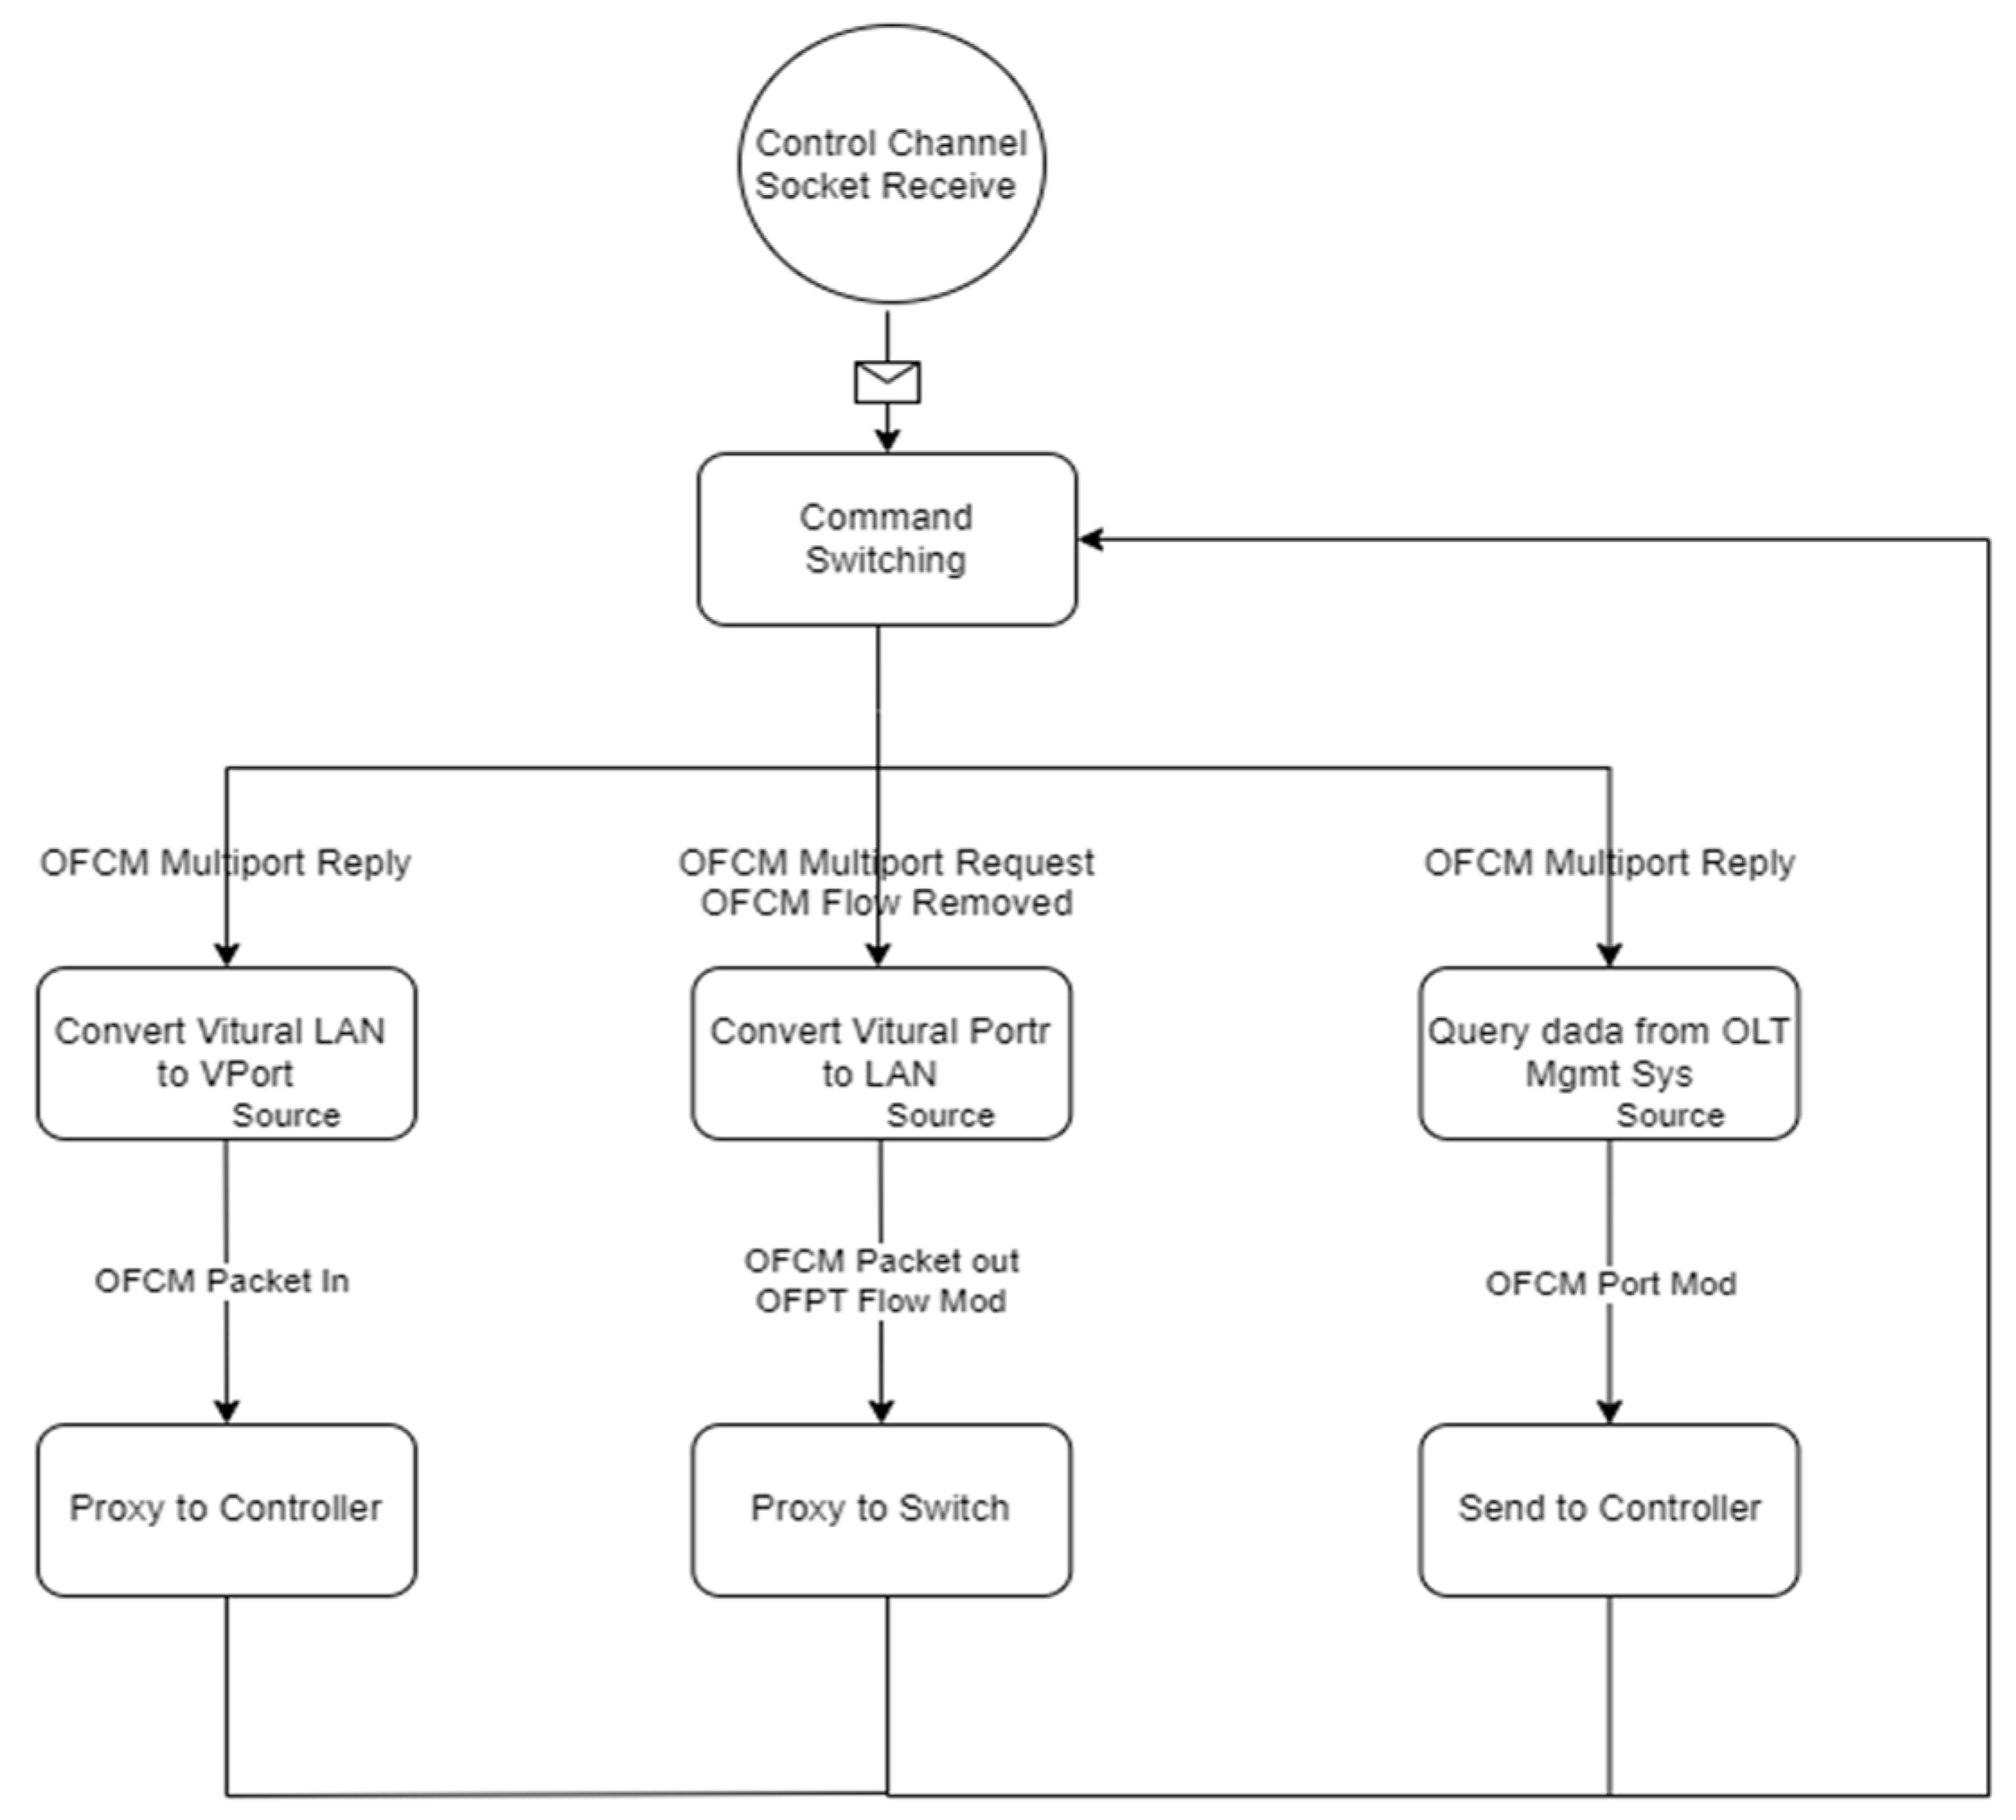
- Receiving and transmitting control messages between the OpenFlow switch and SD-WAN controller and modifying field data to ensure the accurate transmission of virtual ports messages to both the SD-WAN controller and the OpenFlow switch.
- Utilizing the OLT management API to convert the PON-Port status into a virtual port status and transmitting it to the SD-WAN controller.
- Handling statistics request control commands initiated by the controller. This acquires packet delivery data for virtual ports through the OLT management system, transmitting it back to the controller for calculations in management algorithms such as load balancing and QoS.
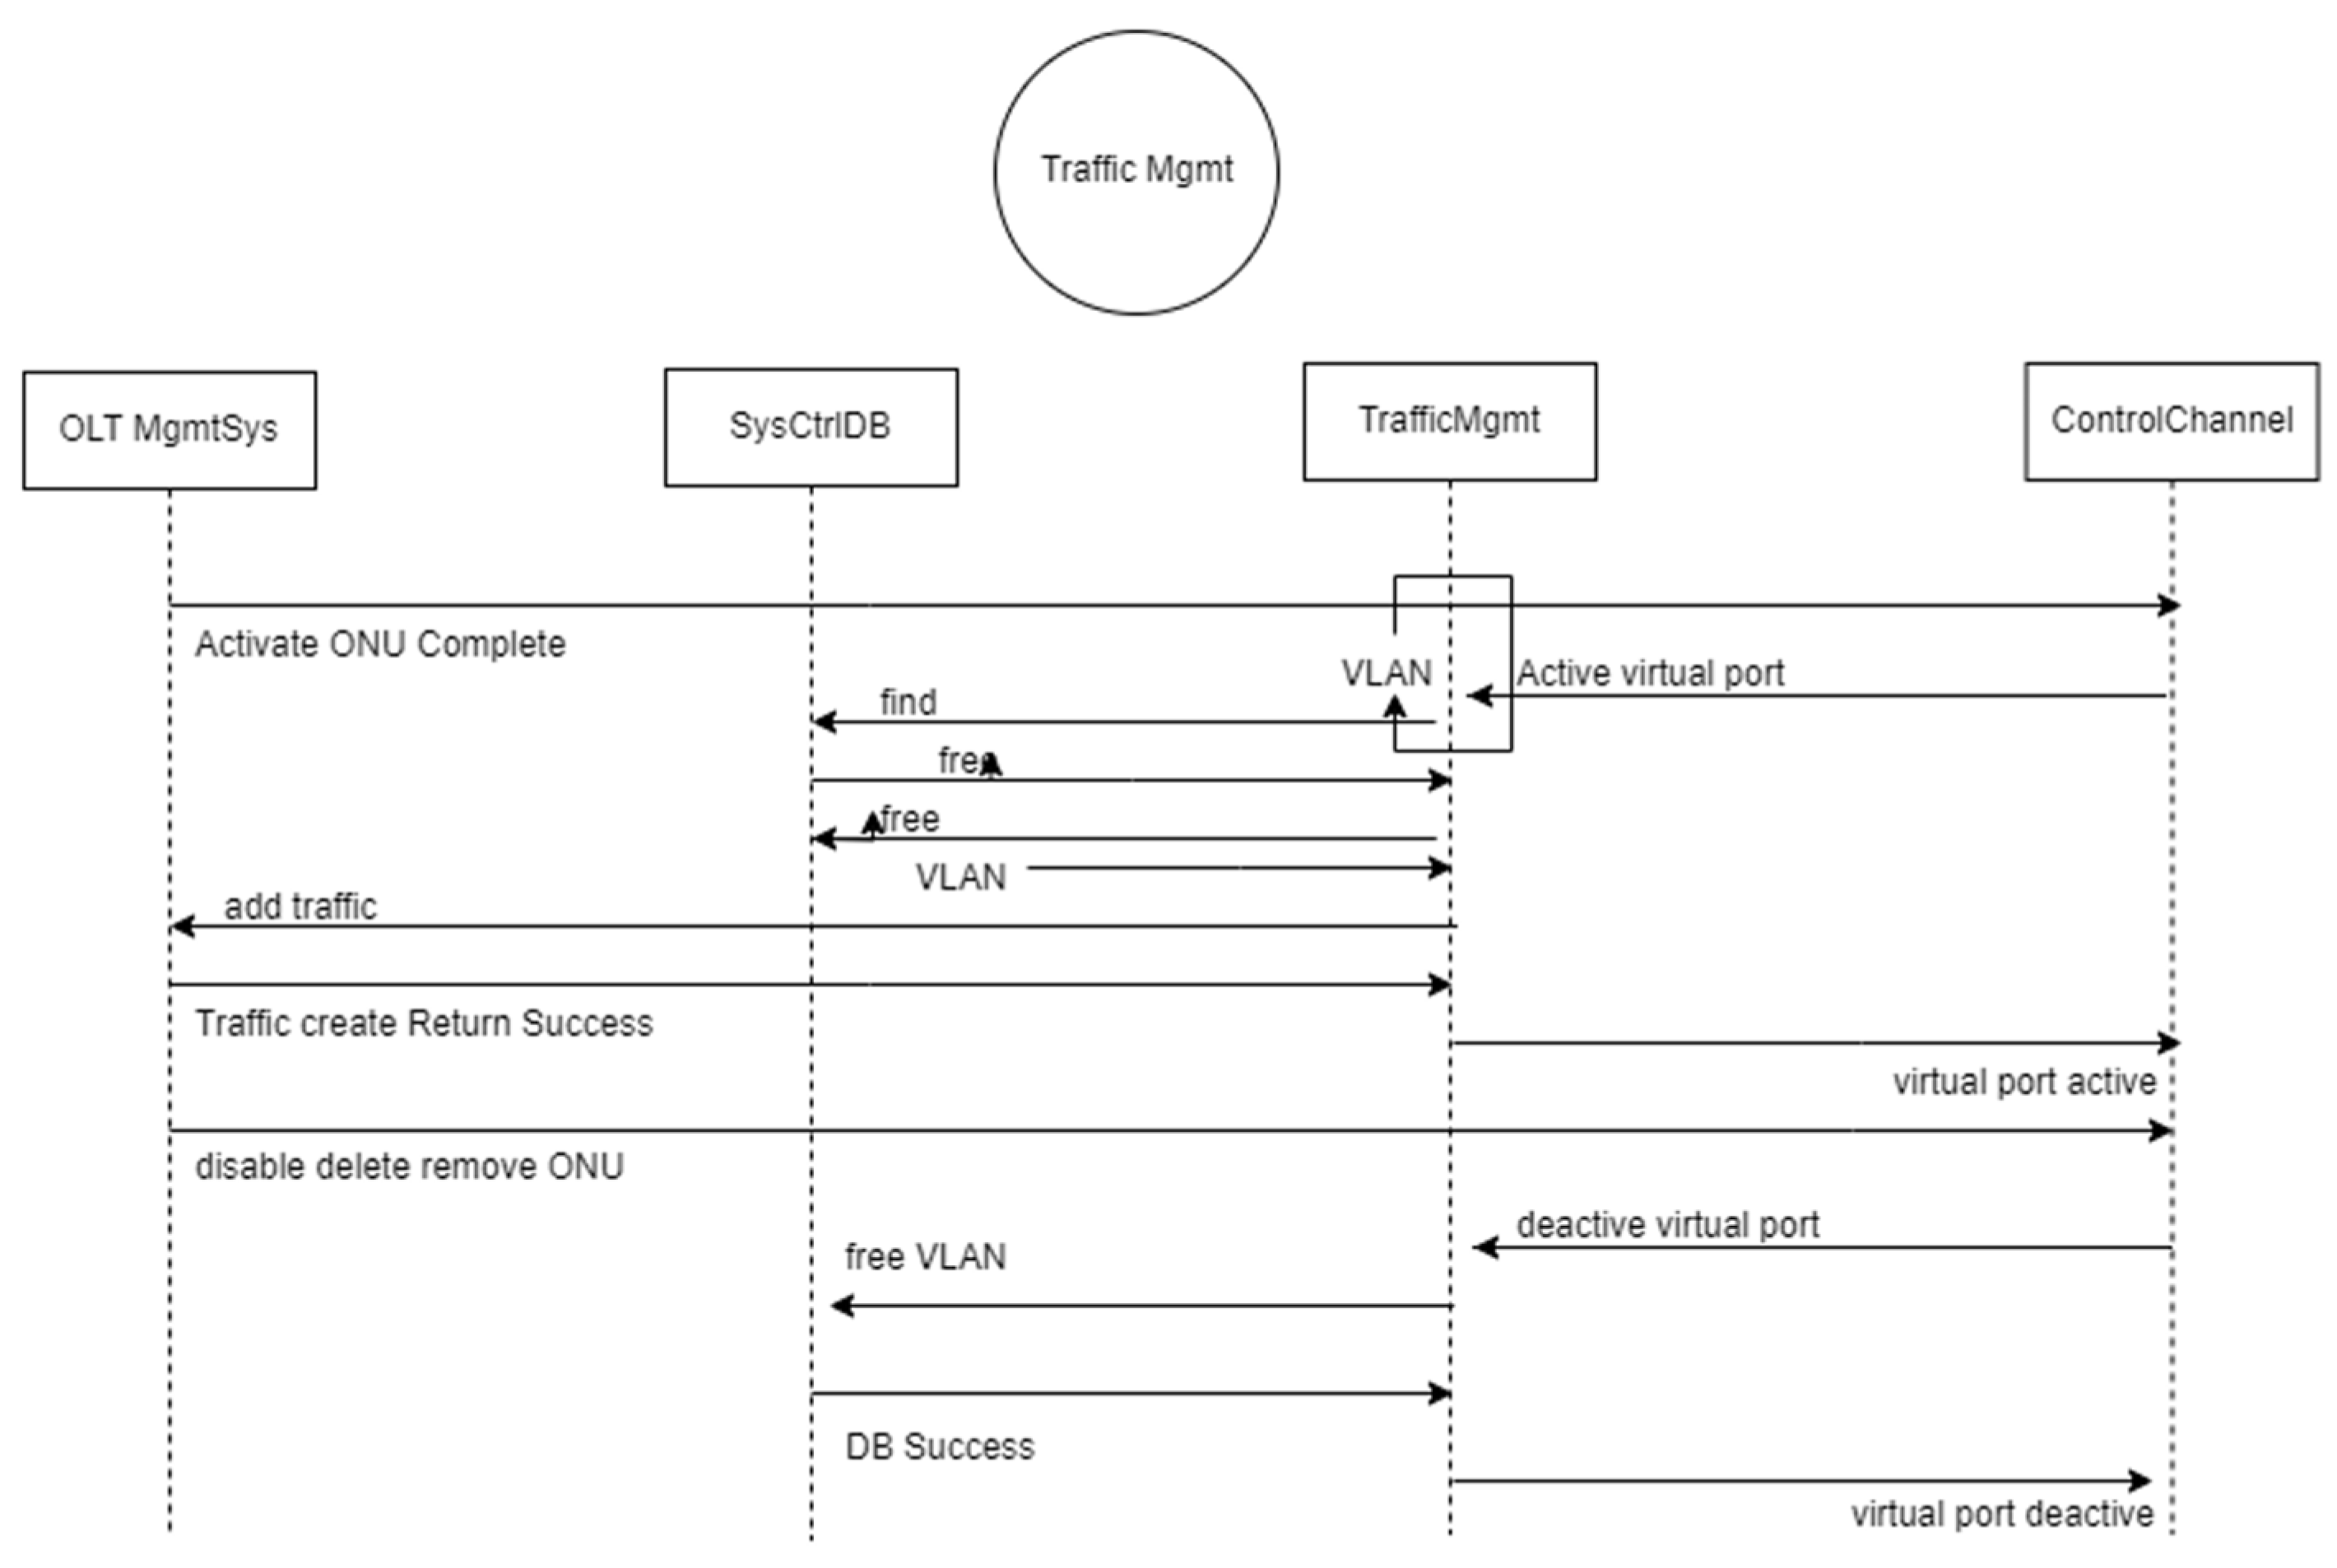
- The virtual port module
- 2.
- Virtual port module
- 3.
- Traffic Management Module
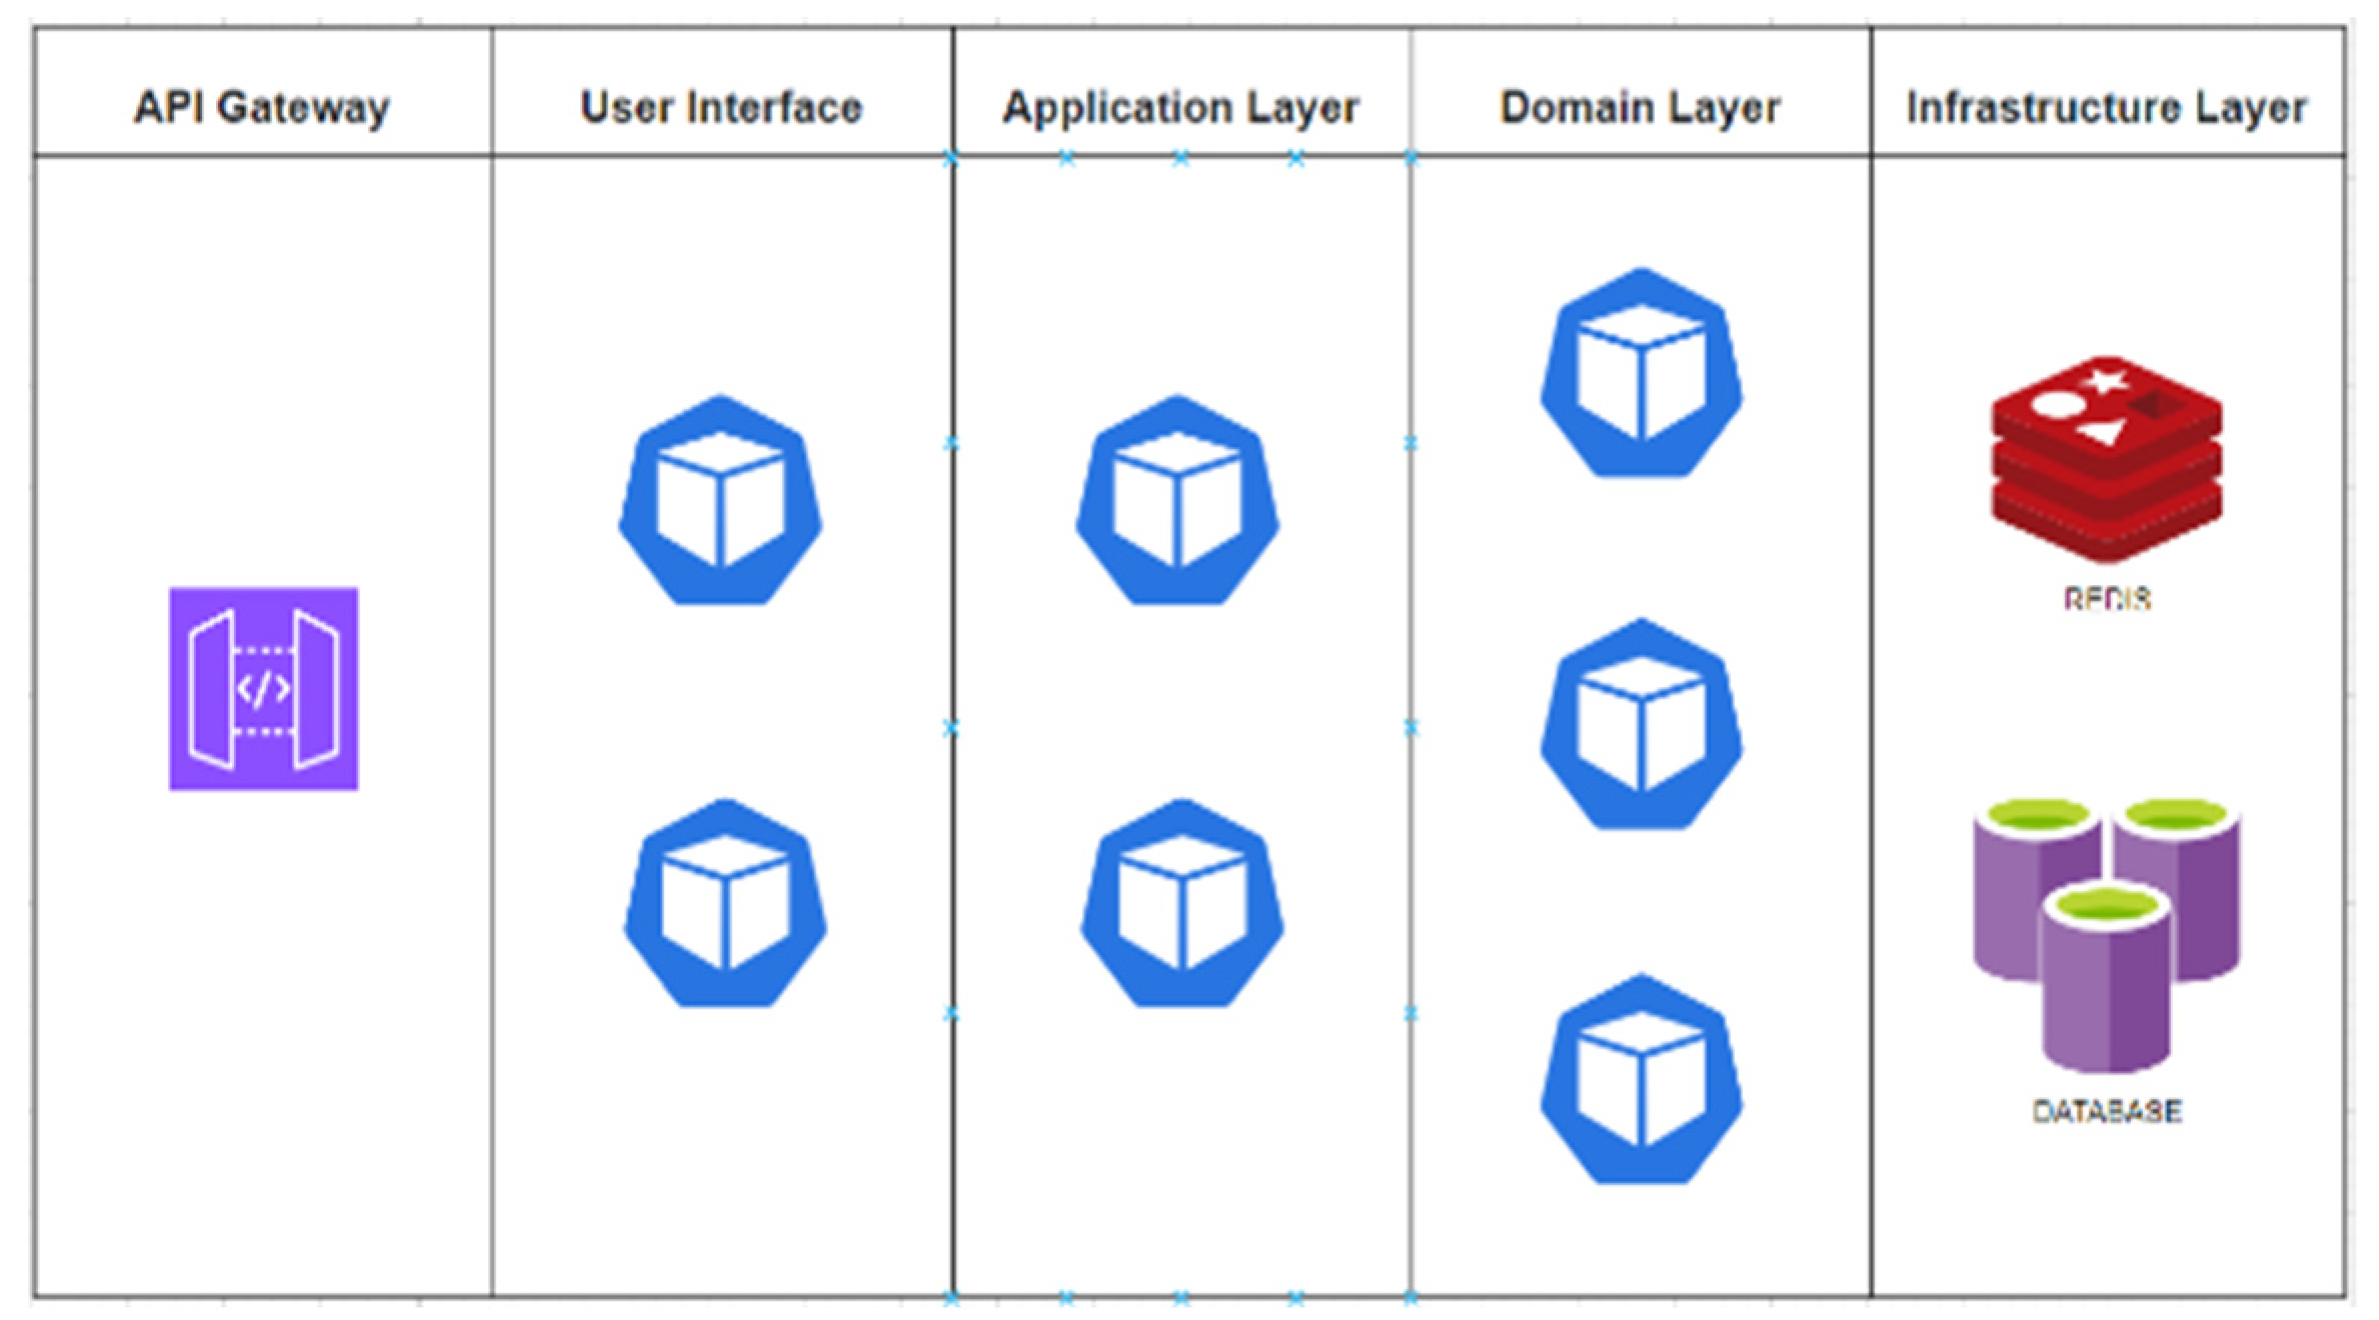
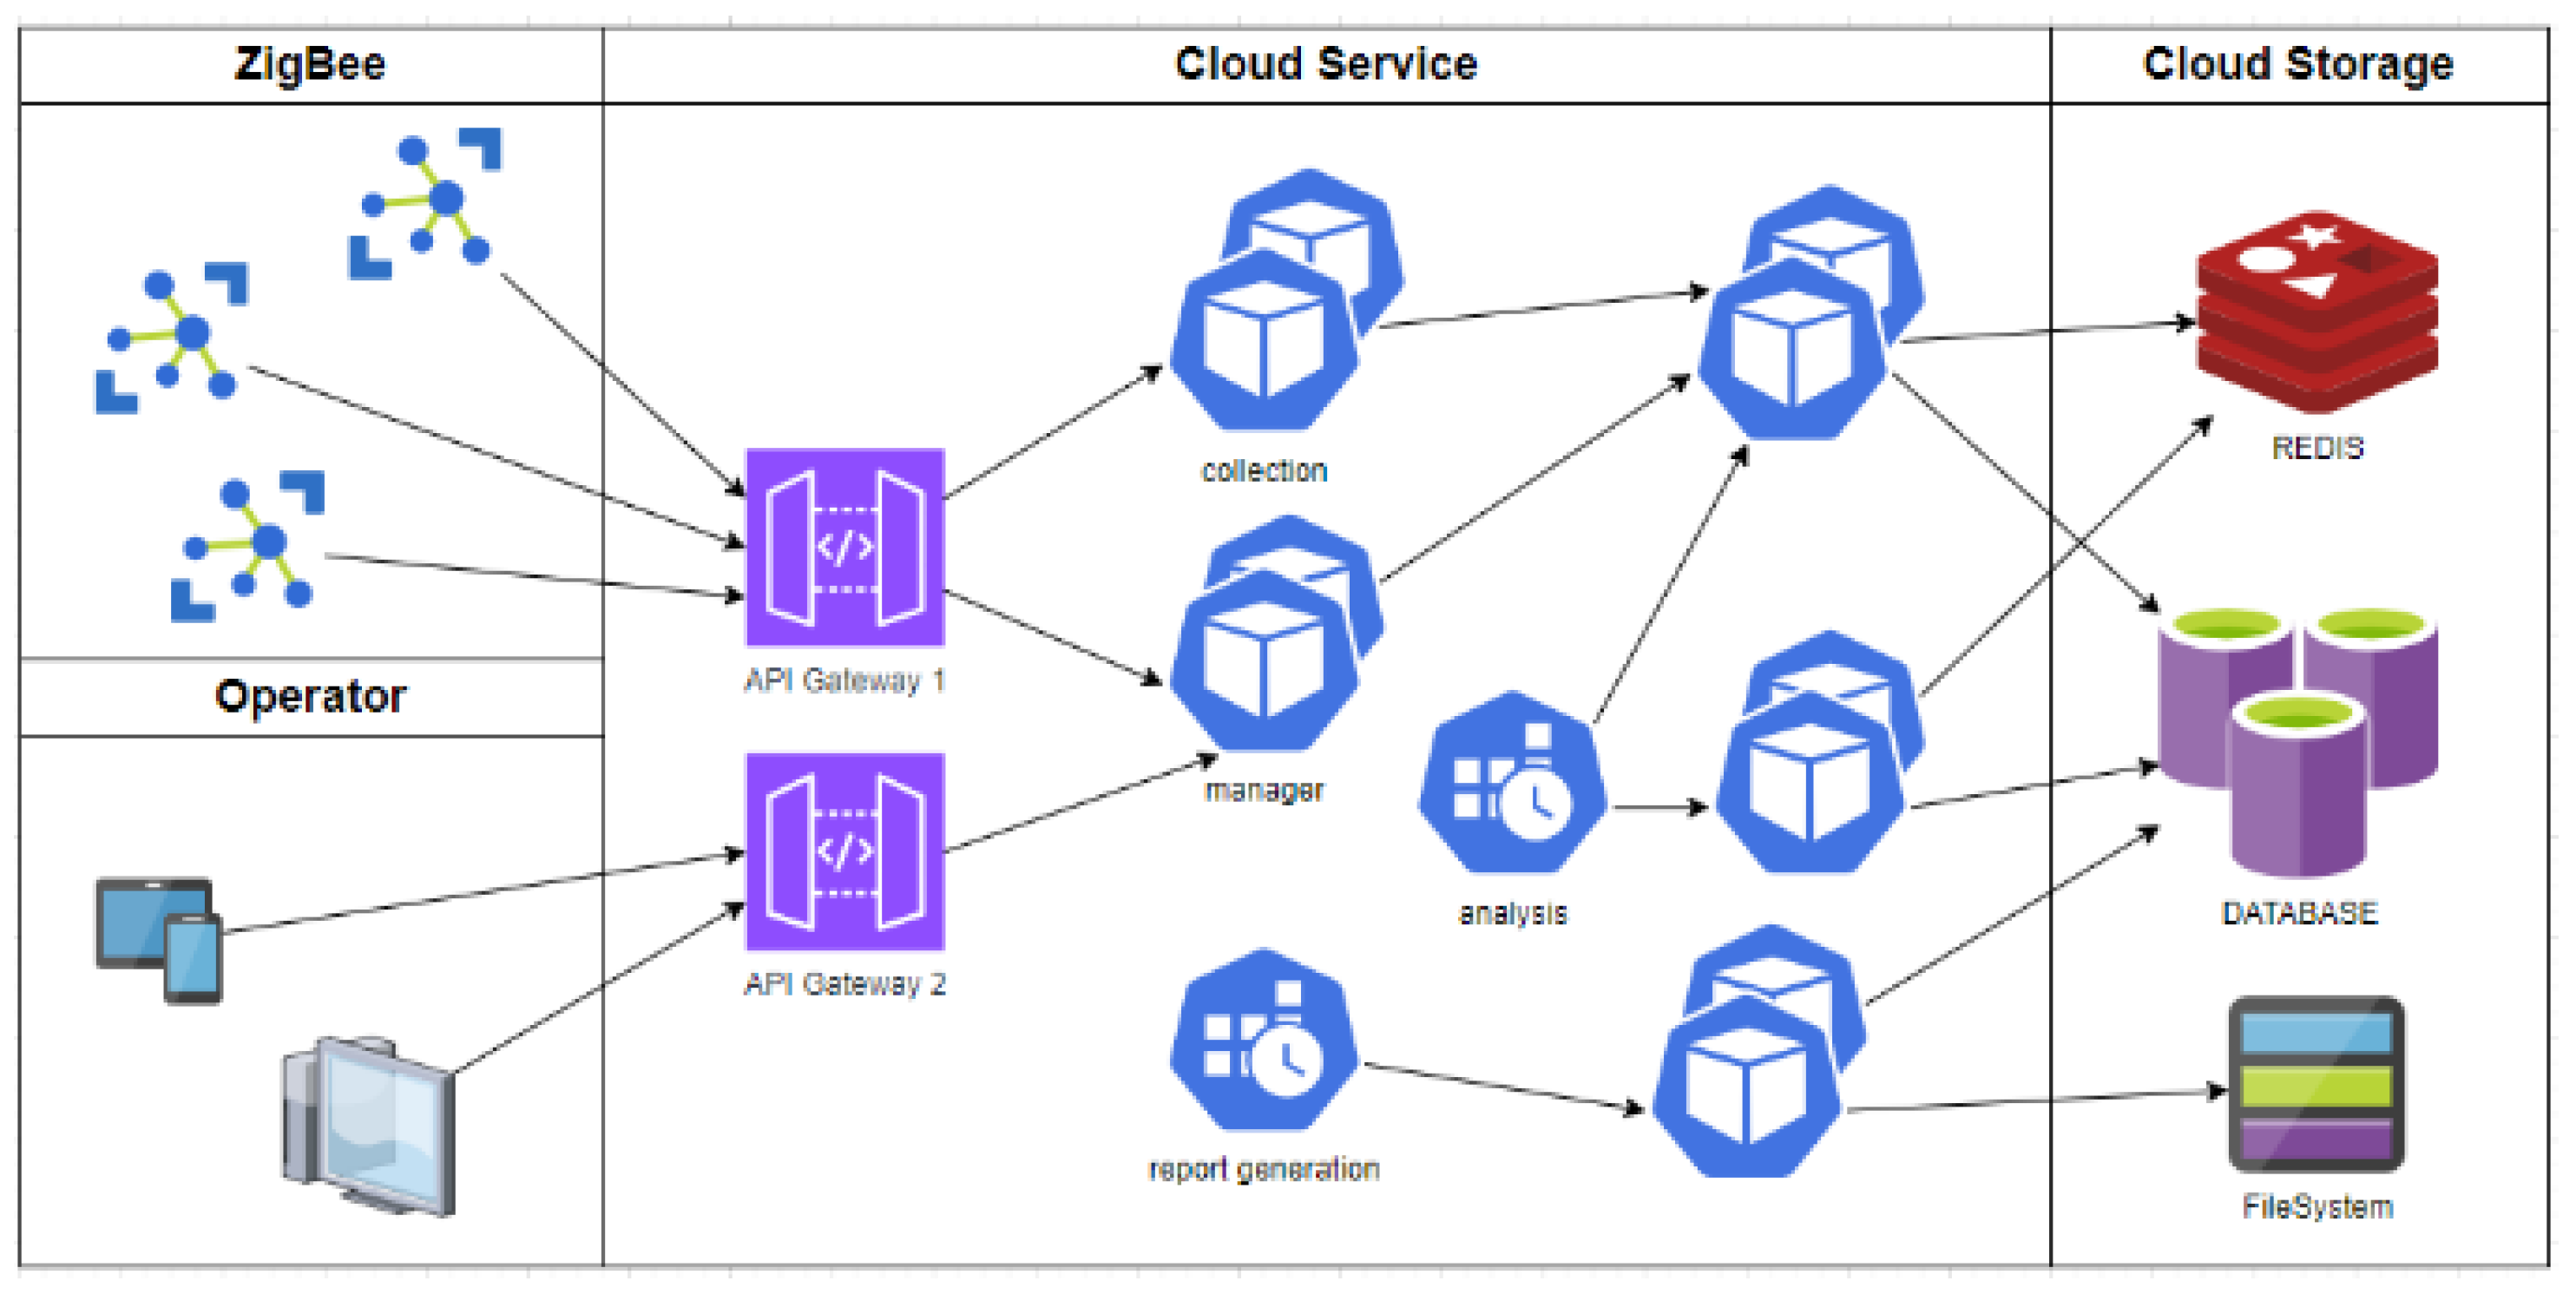
4.2. Microservice of the Open-Flow Proxy Service Construction
- Autonomy: The service scale being relatively modest permits autonomous deployment and individual updates for each service.
- Elevated Scalability: Services can undergo dynamic horizontal expansion based on hardware resources, service status, and similar metrics.
- Pliability in Development and Maintenance: The minimized scale of the service facilitates a clear understanding of the code base by team members, enabling swift contributions.
- API gateway controller
- 2.
- Digital twin smart AI
4.3. Active Defense Mechanism Enhances Broadband Network Resilience
- Detection: The implementation of malicious file analysis, network traffic analysis, user behavior analysis, and platform monitoring to identify potential malicious threats within low Earth orbit satellite domains.
- Isolation: Implementing program isolation measures, executable whitelists, blacklists, etc., to develop zero-trust mechanism scenarios suitable for asynchronous orbit satellite domains.
- Asynchronous Orbit Satellite Cybersecurity Architecture
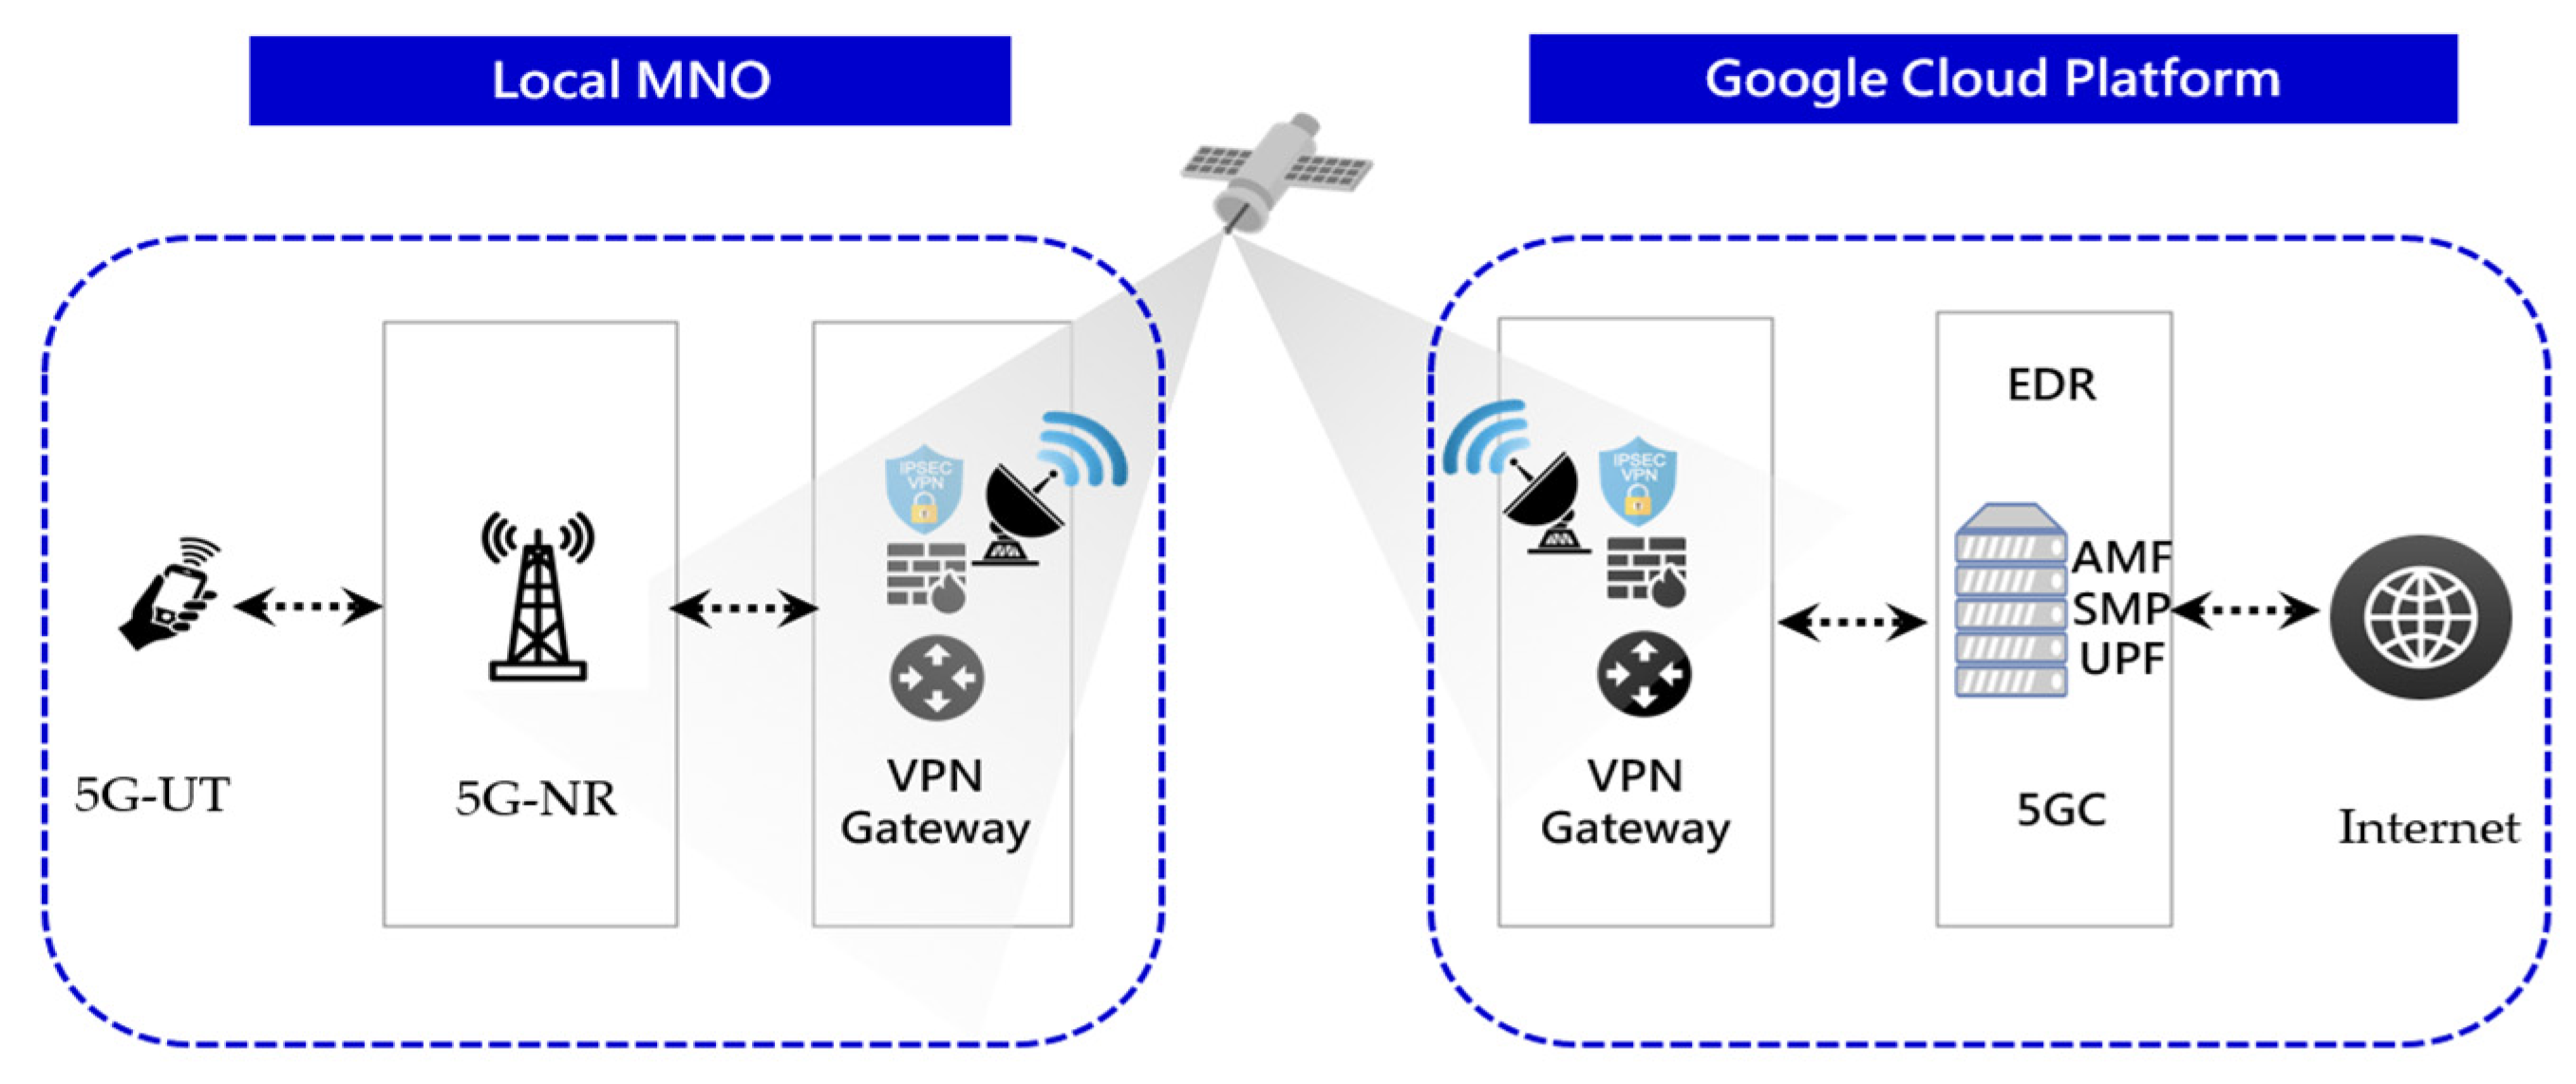
- Enhancing the Security of the 5G Core Network: The 5G core network supports various critical applications, including the Internet of Things (IoT) and critical infrastructure. The implementation of EDR can help detect and block abnormal activities on endpoint systems that may pose threats to the 5G core network, thereby enhancing the overall security of the 5G core network.
- Early Detection of Hacker Activities: EDR solutions can monitor activities on endpoint devices and identify potential signs of attacks. This helps in the early detection of hacker activities, including unknown and novel attack methods, and allows for immediate measures to counter these attacks.
- Rapid Response and Recovery: When EDR detects abnormal activities, it can swiftly take corresponding mitigation measures, such as isolating infected devices to reduce the spread of damage and restoring affected systems when necessary. This helps reduce the damage and downtime caused by attacks.
- Strengthening Overall Network Security: The 5G core network is a complex network that includes many different components and access points. The introduction of EDR can provide more comprehensive security monitoring, including monitoring the core network and edge devices, to reduce the overall network cybersecurity risks.
- 2.
- Implementation of Active Cybersecurity Measures for Asynchronous Orbit Satellites
- (1).
- 5G NR
- (2).
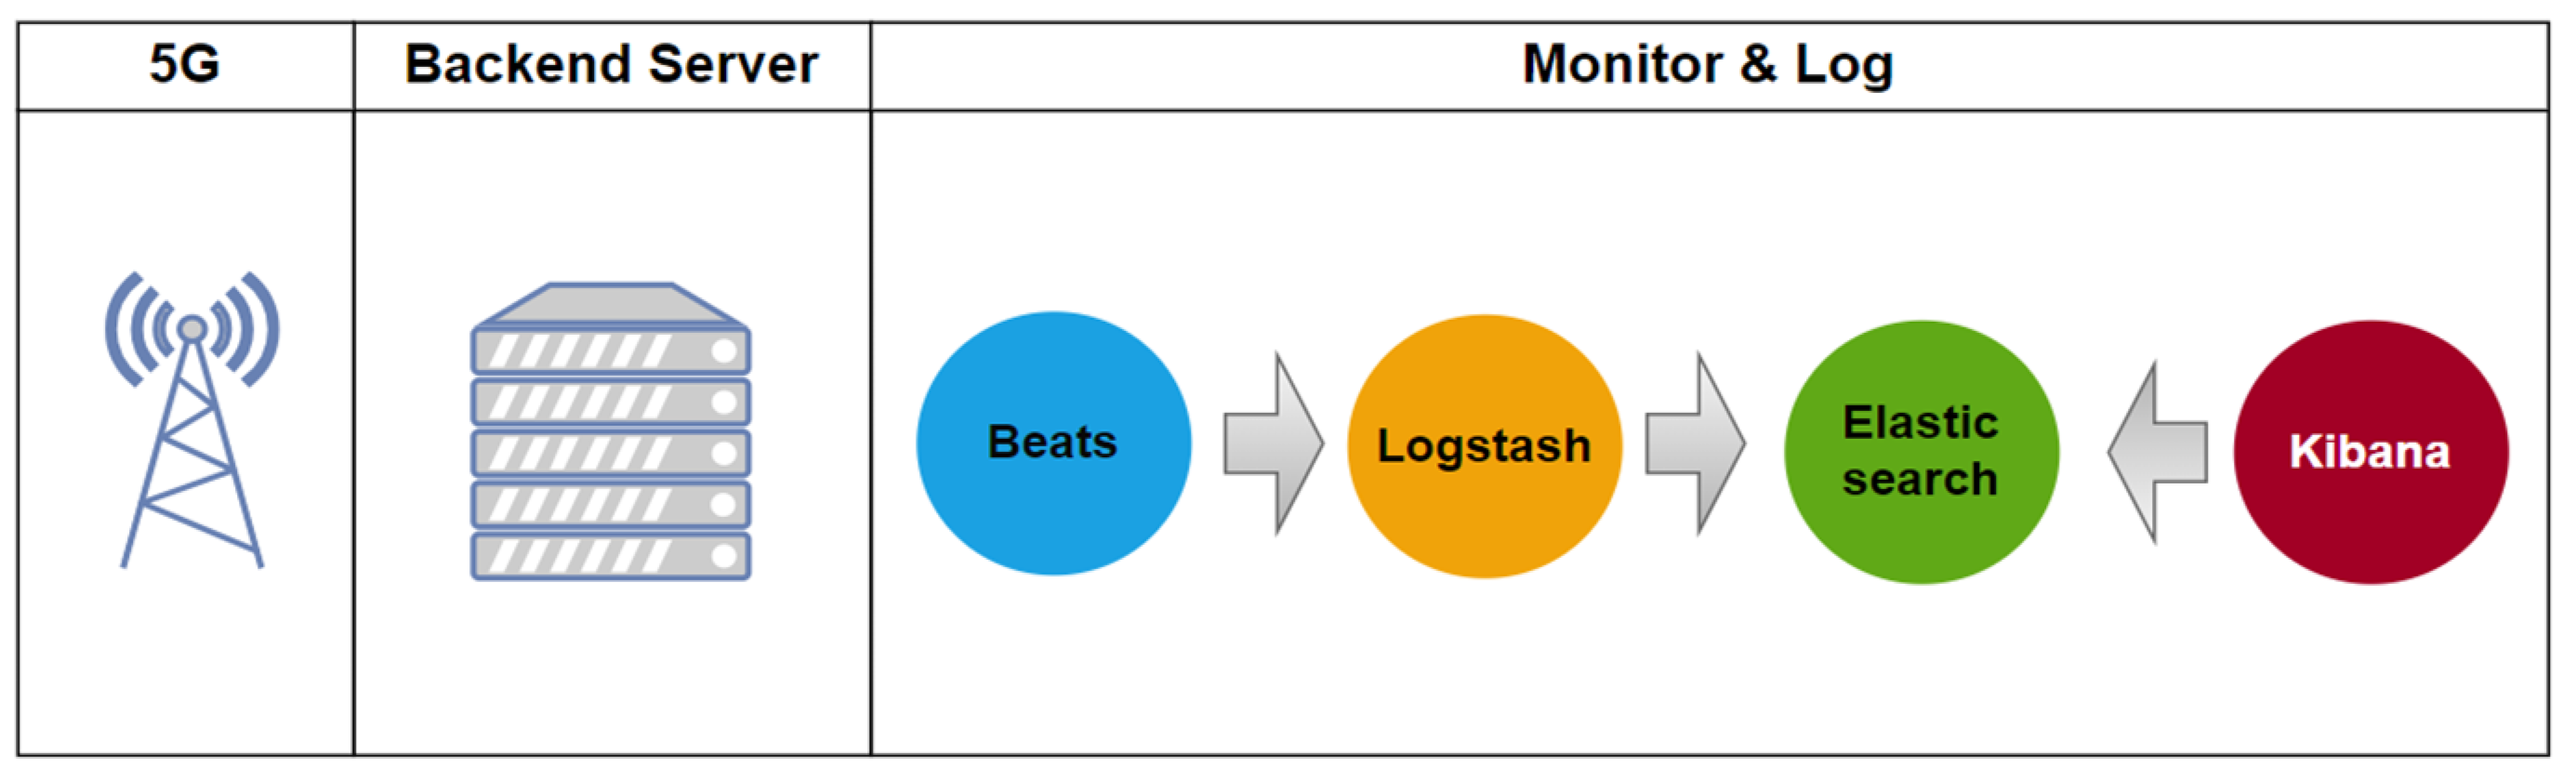
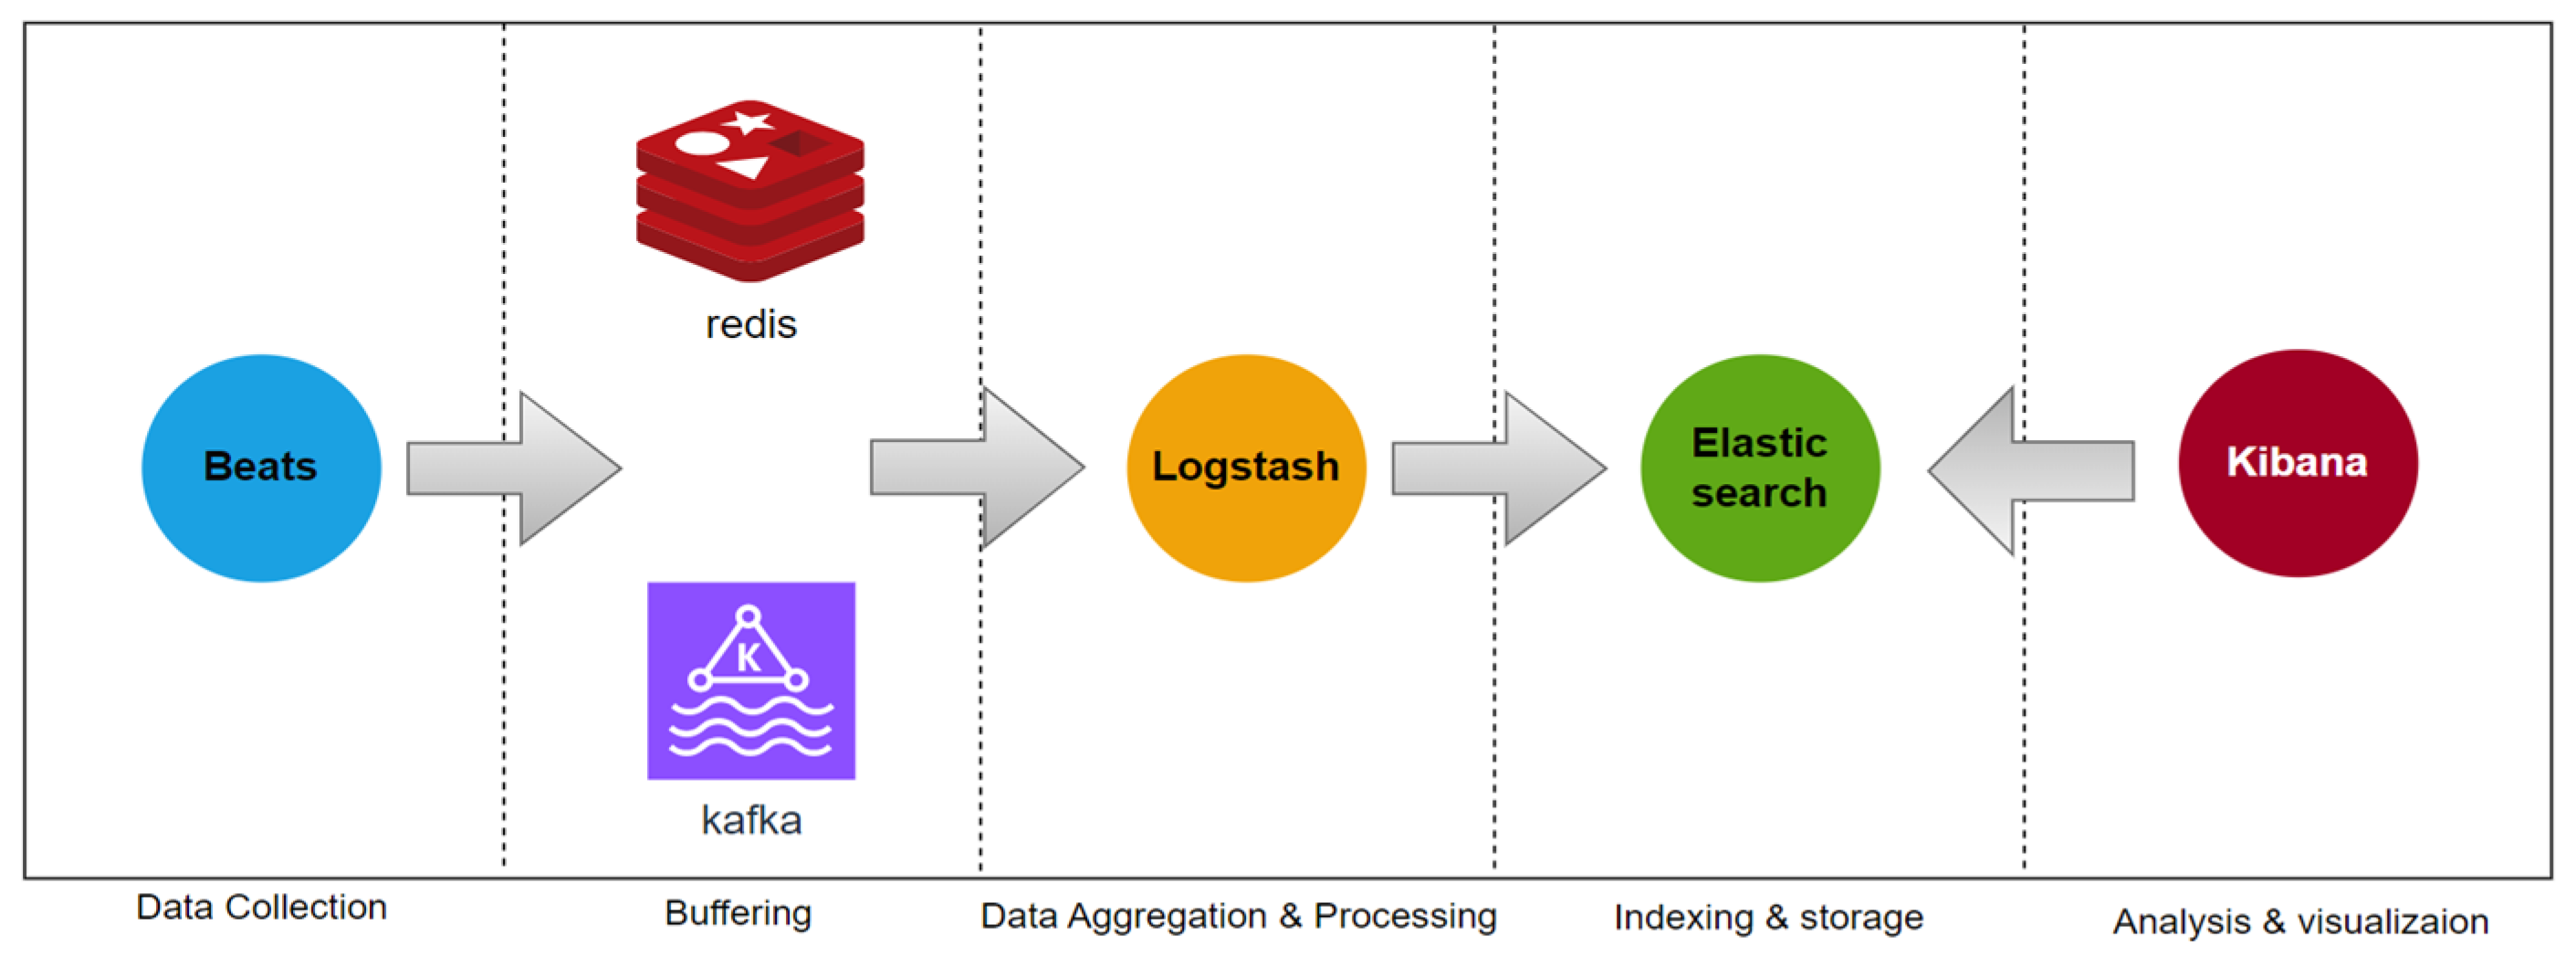
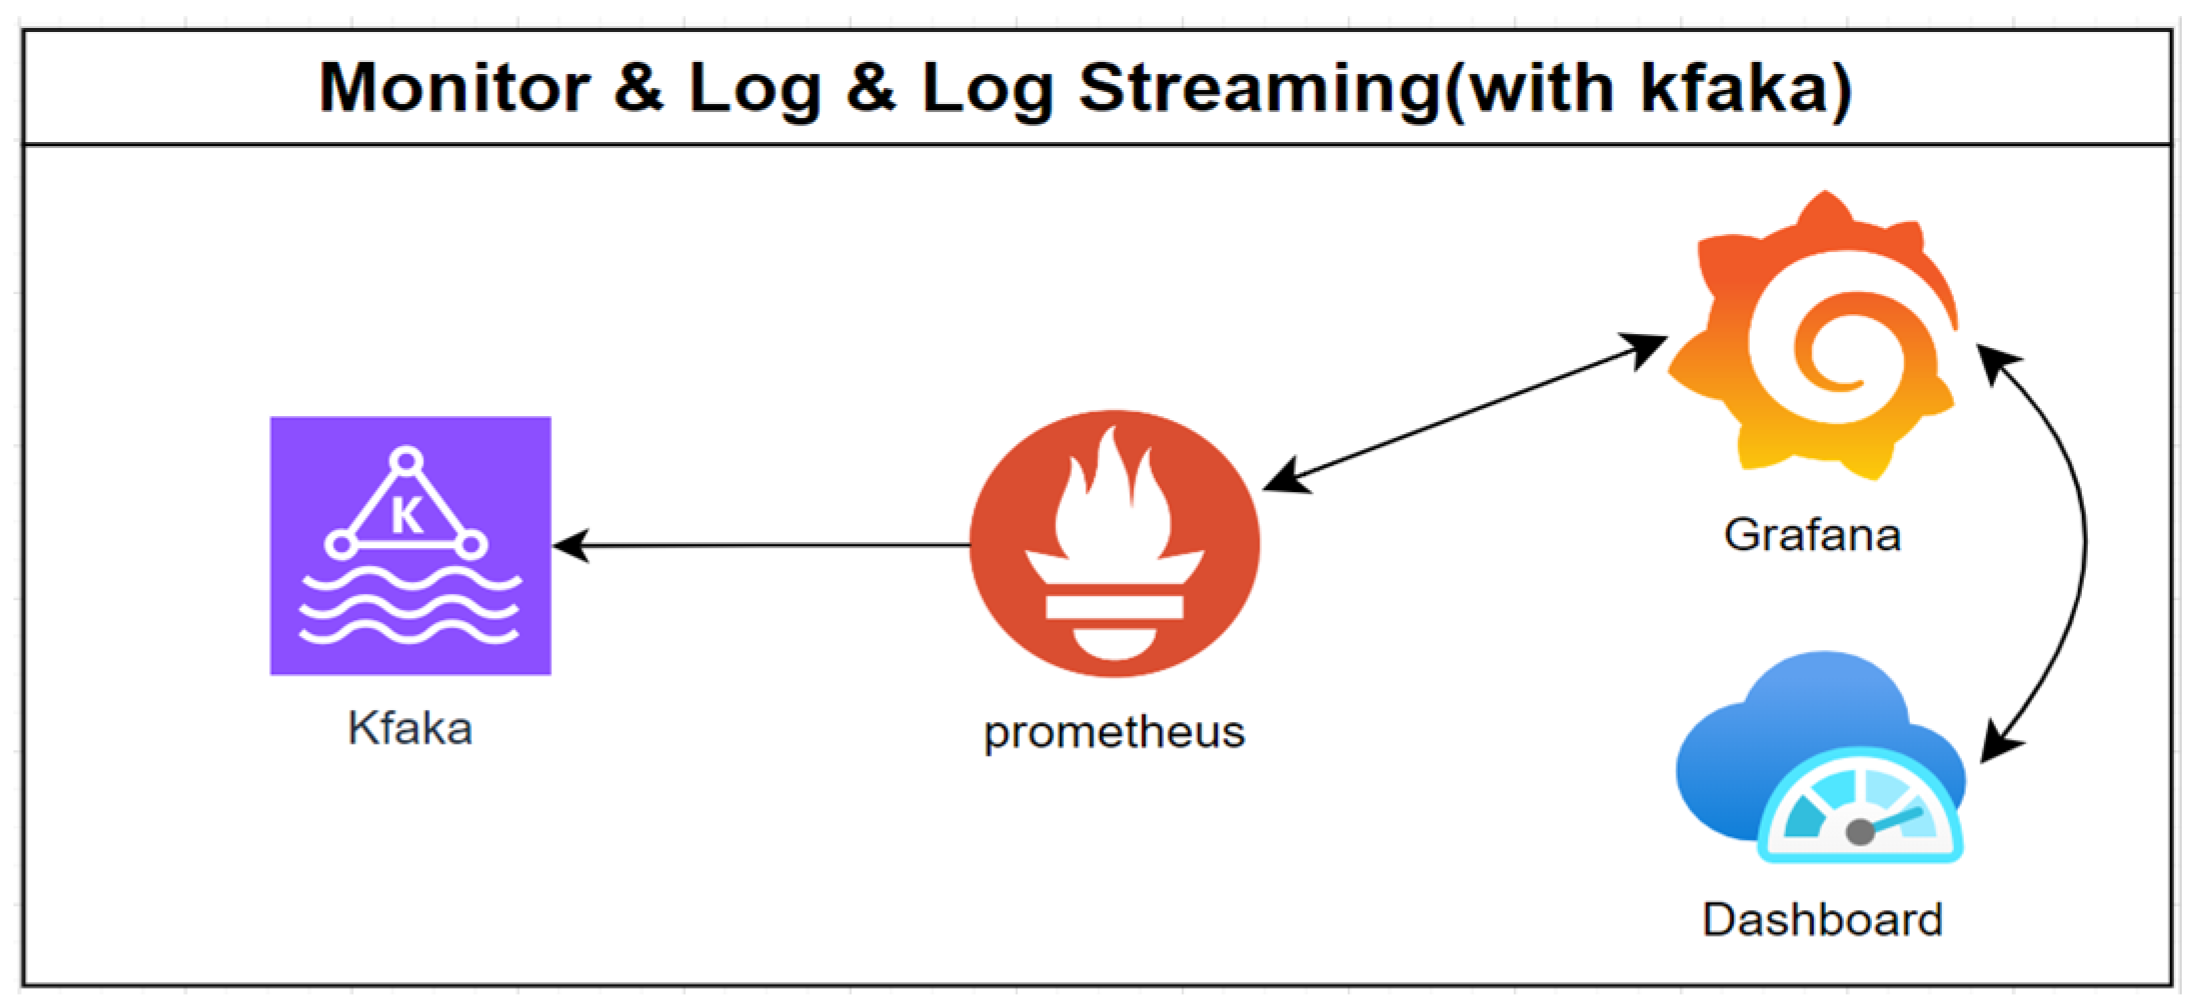
- Log Containment
- (3).
- Log Forwarding
- (4).
- Log Streaming
5. Solution of the Design and Testing
5.1. Positioning and Construction
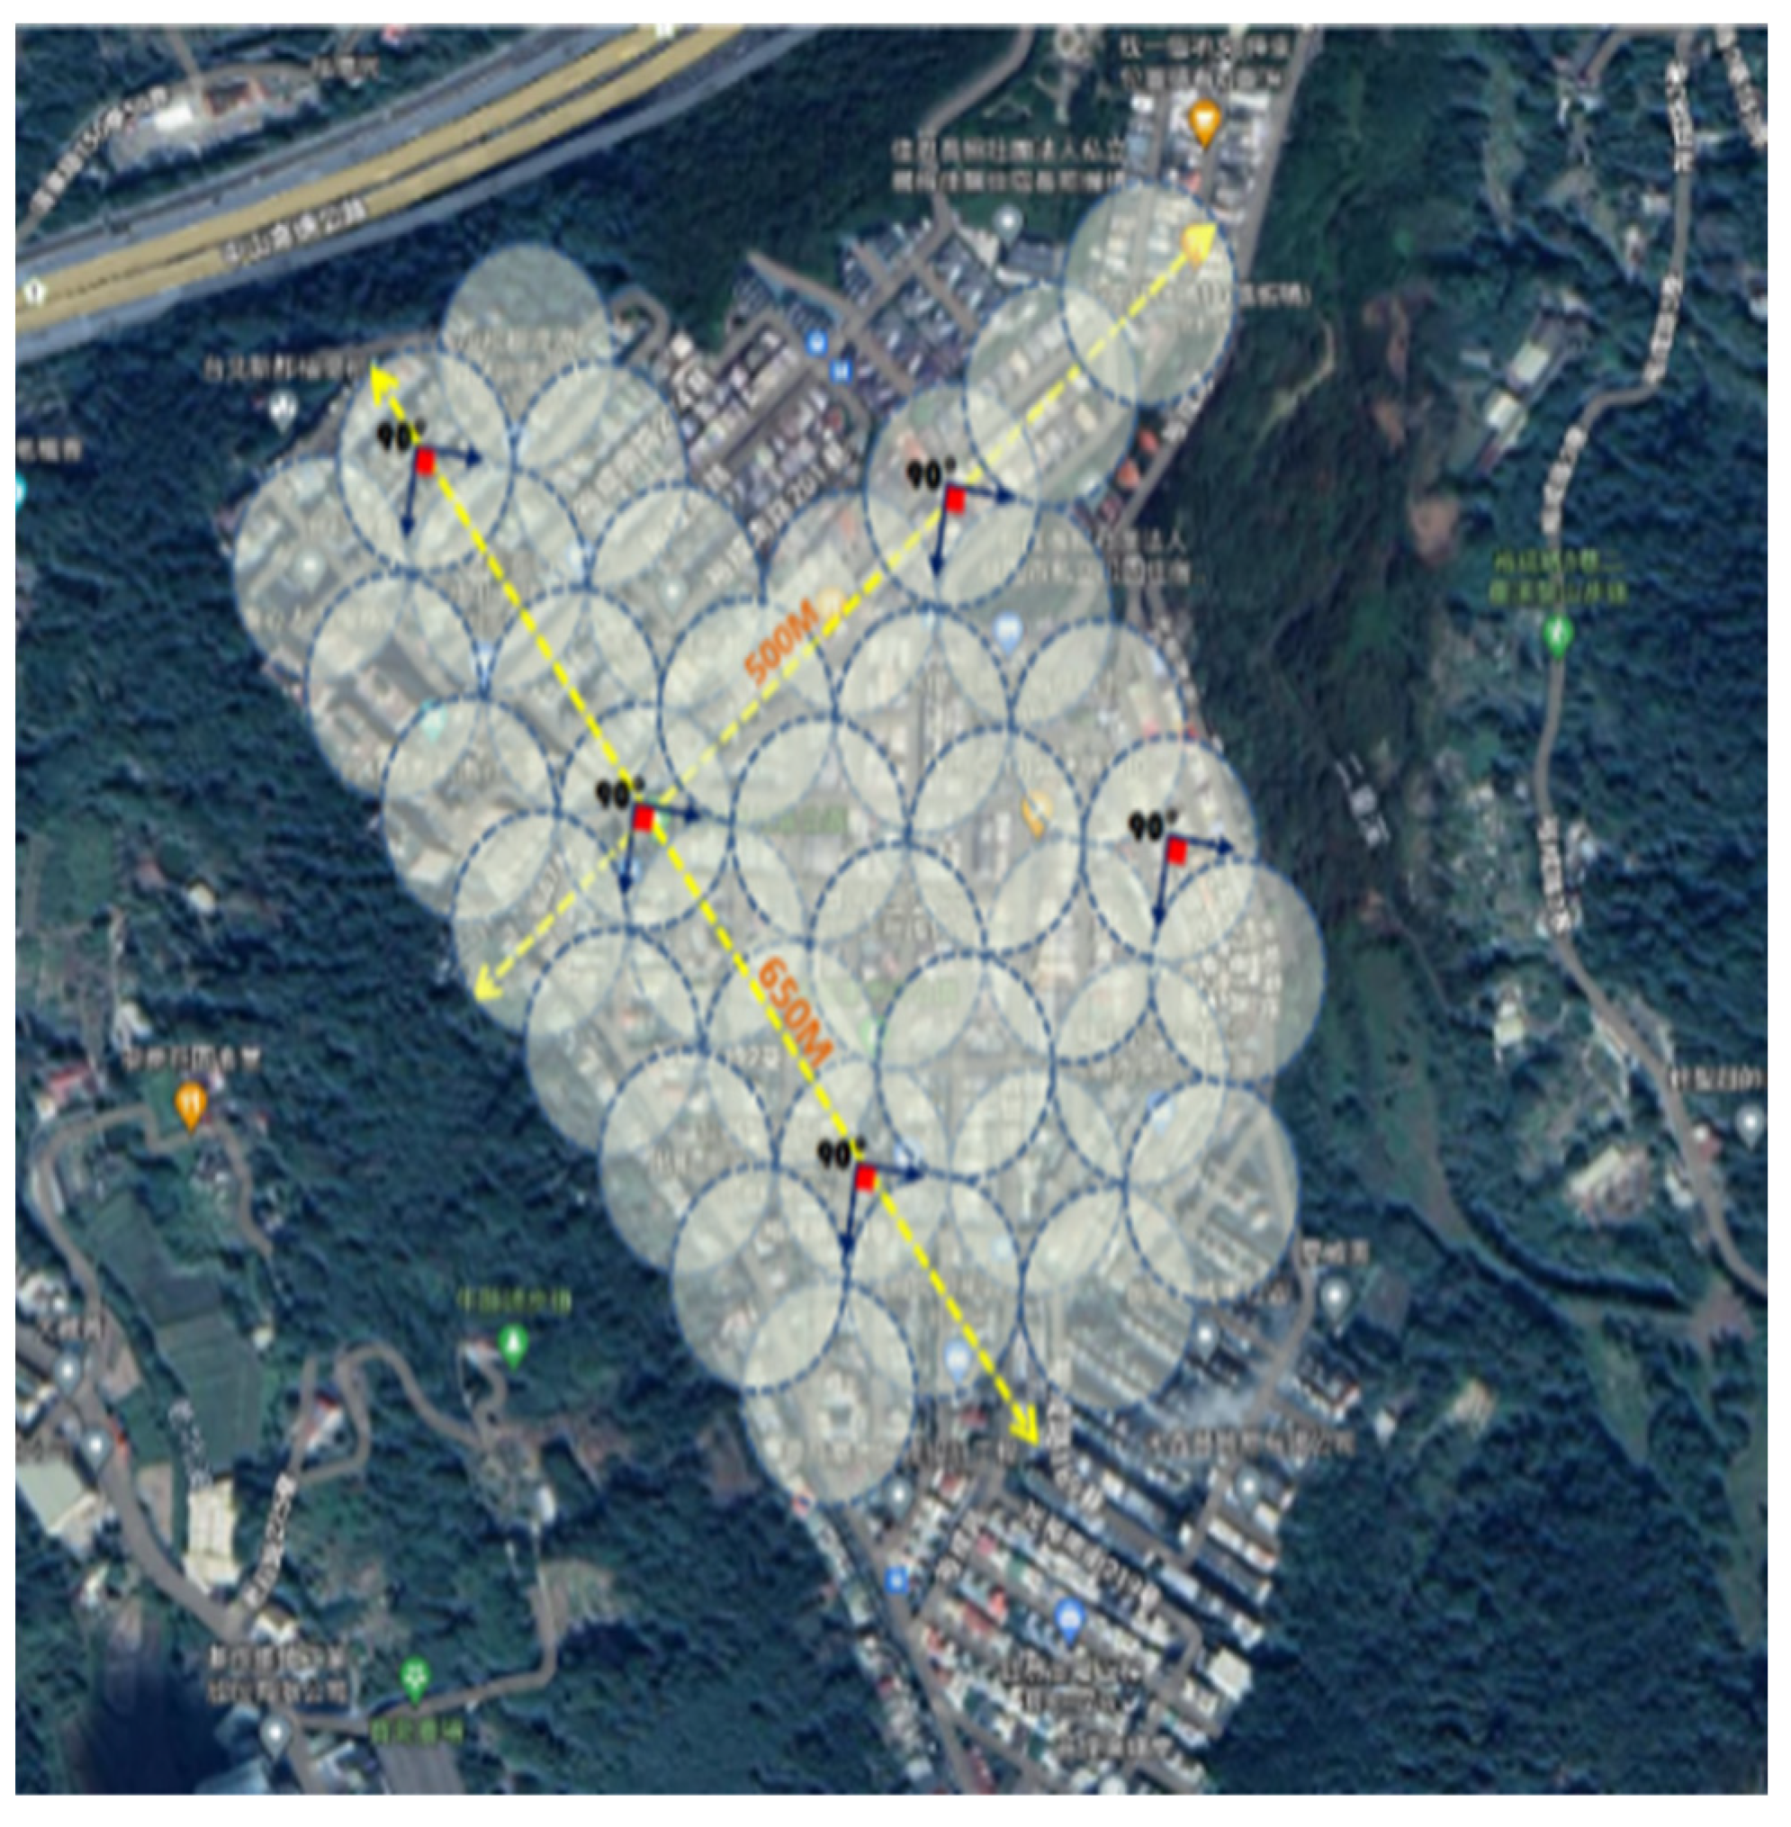
- Real Case 1.Design and Network Architecture of Smart Town.
- Mandates of coverage and methodologies of scrutiny.
- ➢
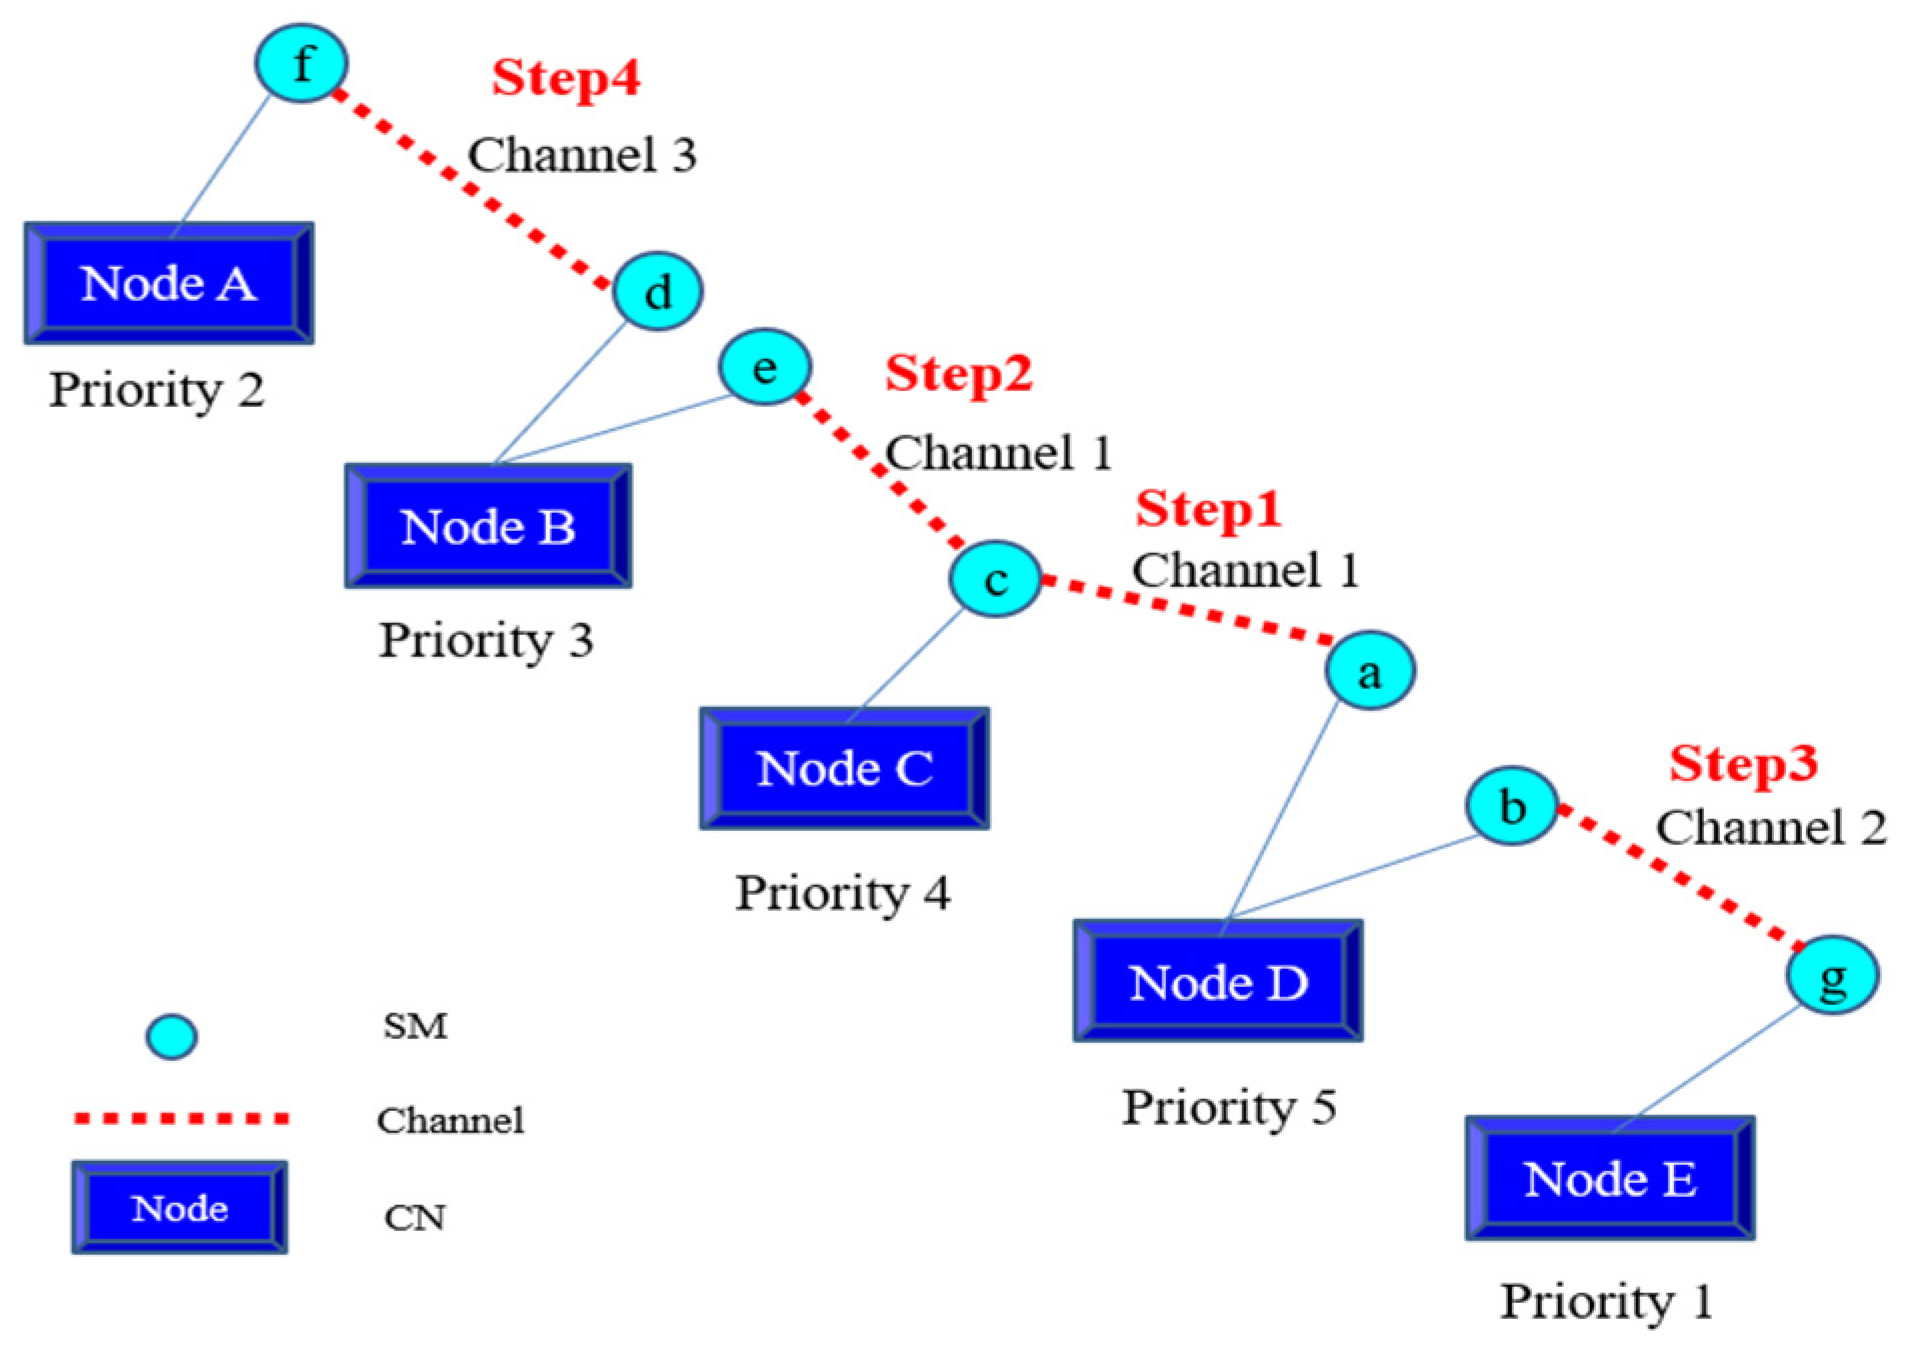
- Channel allocation
- Equip a node with several wireless transceivers, each operating on a channel distinct from the others.
- Employ a solitary wireless transceiver on a node that dynamically switches between different channels.
- ○
- Load-aware channel allocation
- ○
- Channel assignments
- 2.
- Gateway distribution of routing nodes
- 3.
- Positioning principle
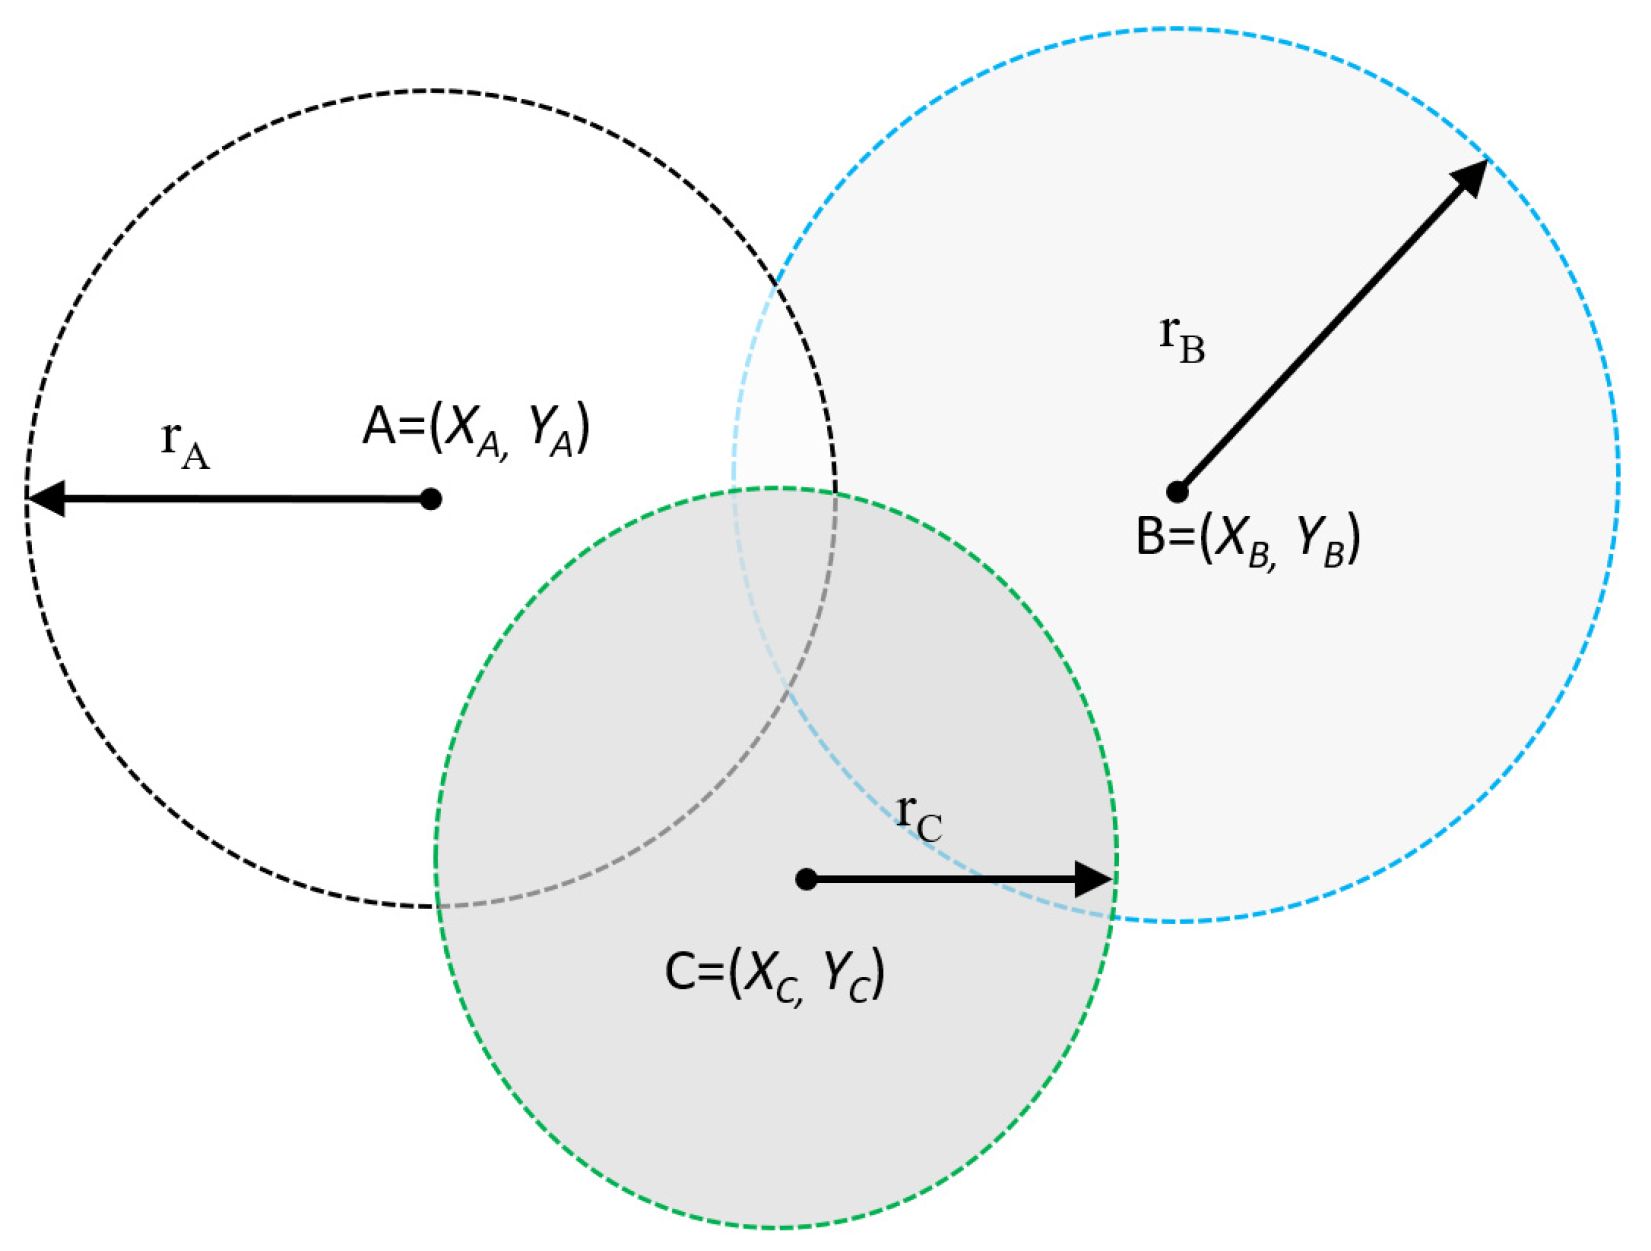
- (1)
- Signal strength positioning
- (2)
- Tree point positioning
- (3)
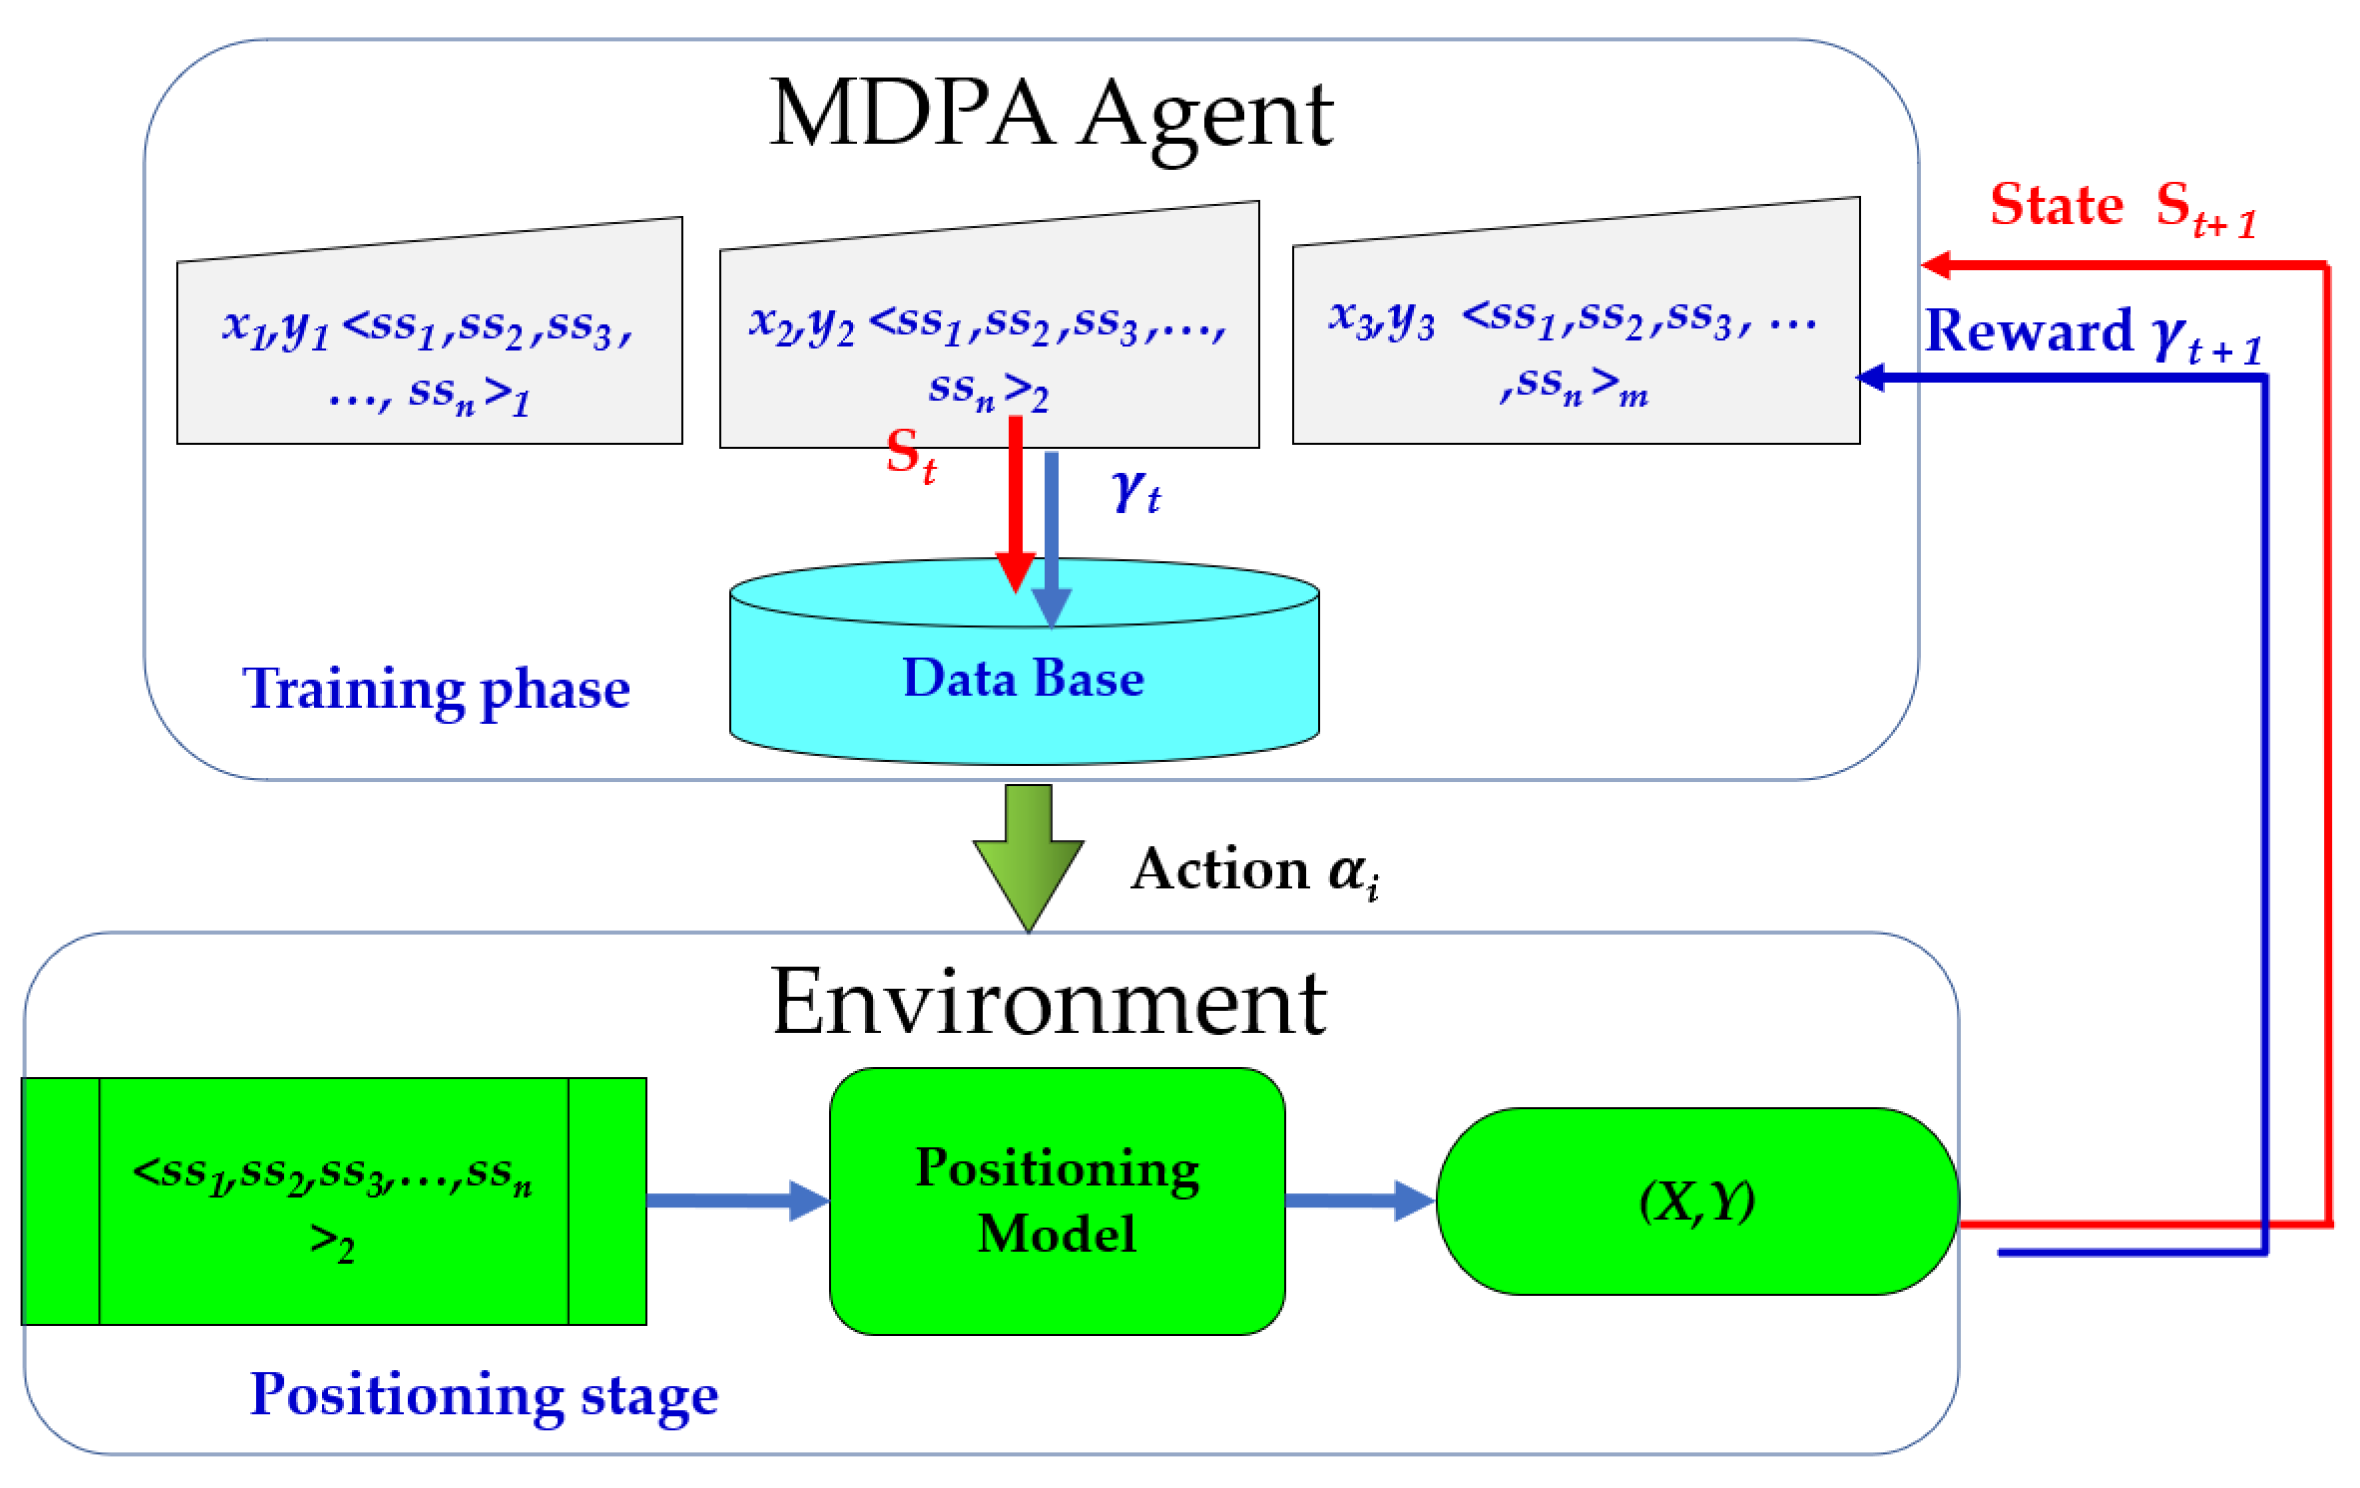
- Sample comparison method
- Training phase
- Positioning stage
- (4)
- Nearest Neighbor in Signal Strength:
5.2. Environmental Assessment and Measurement Practice
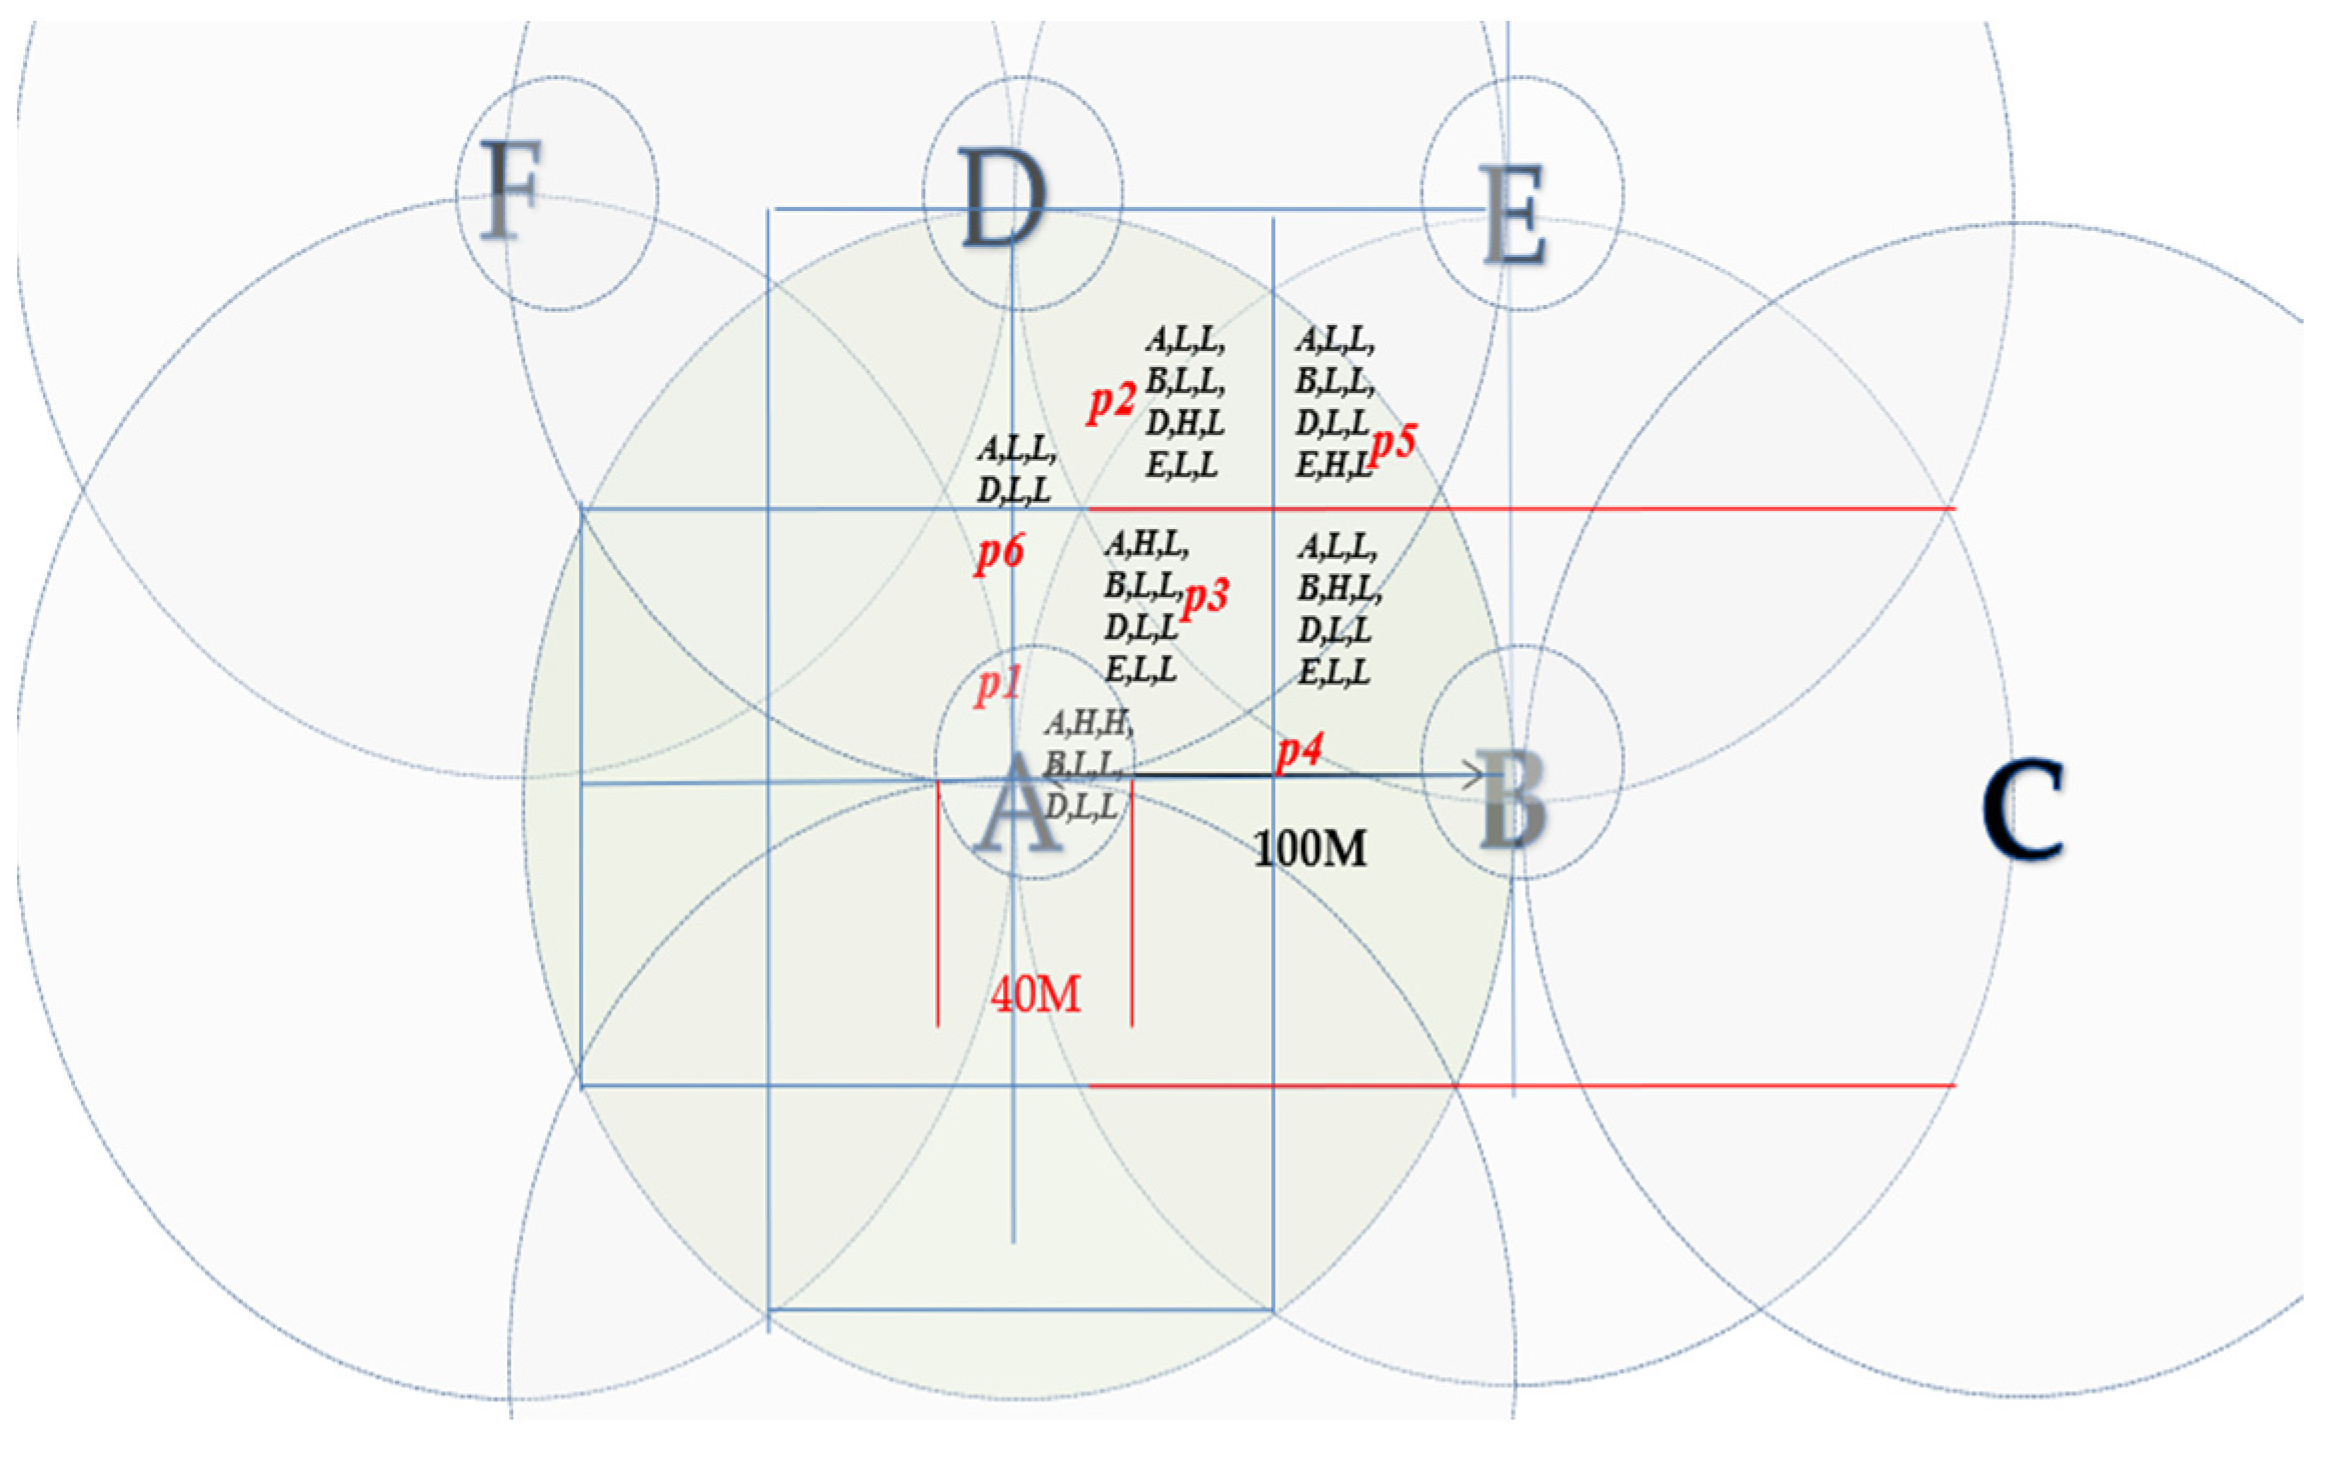
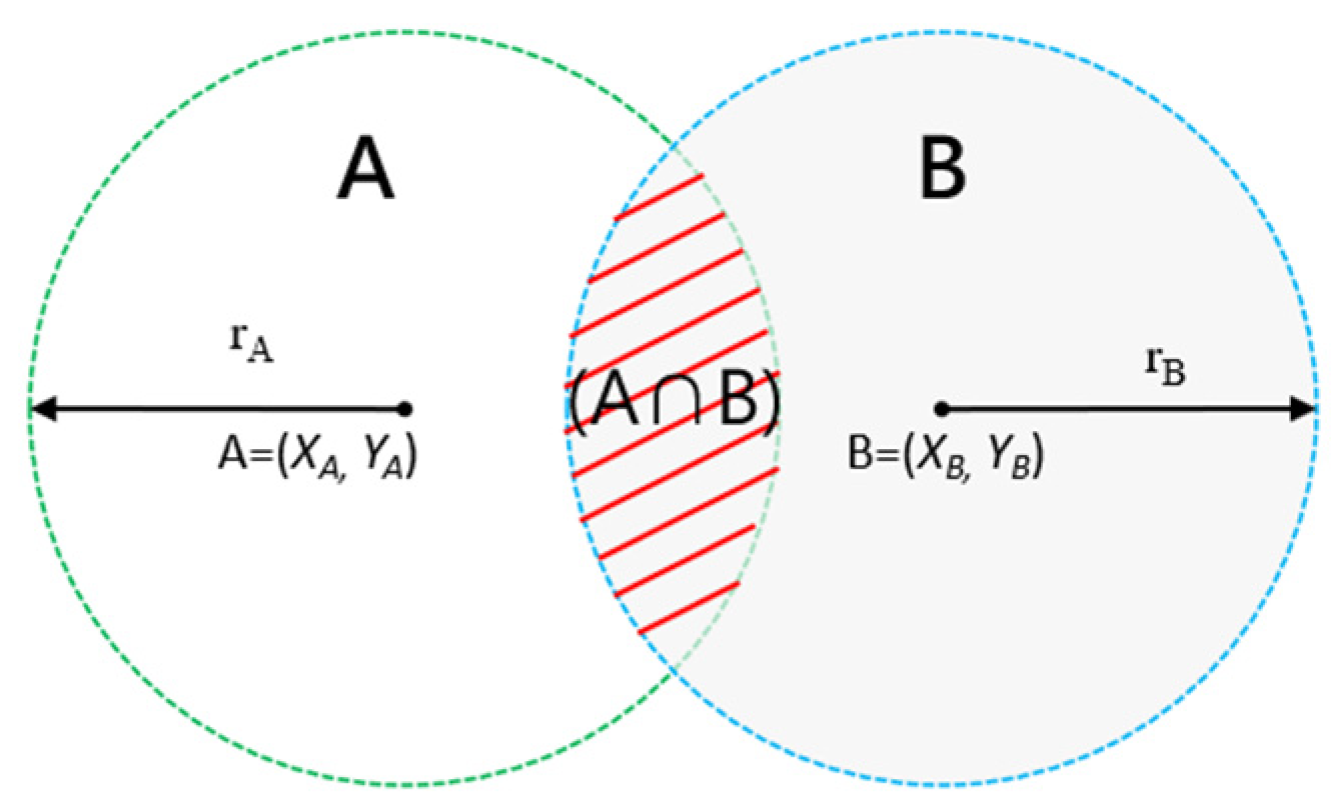
- Assessment of outdoor positioning
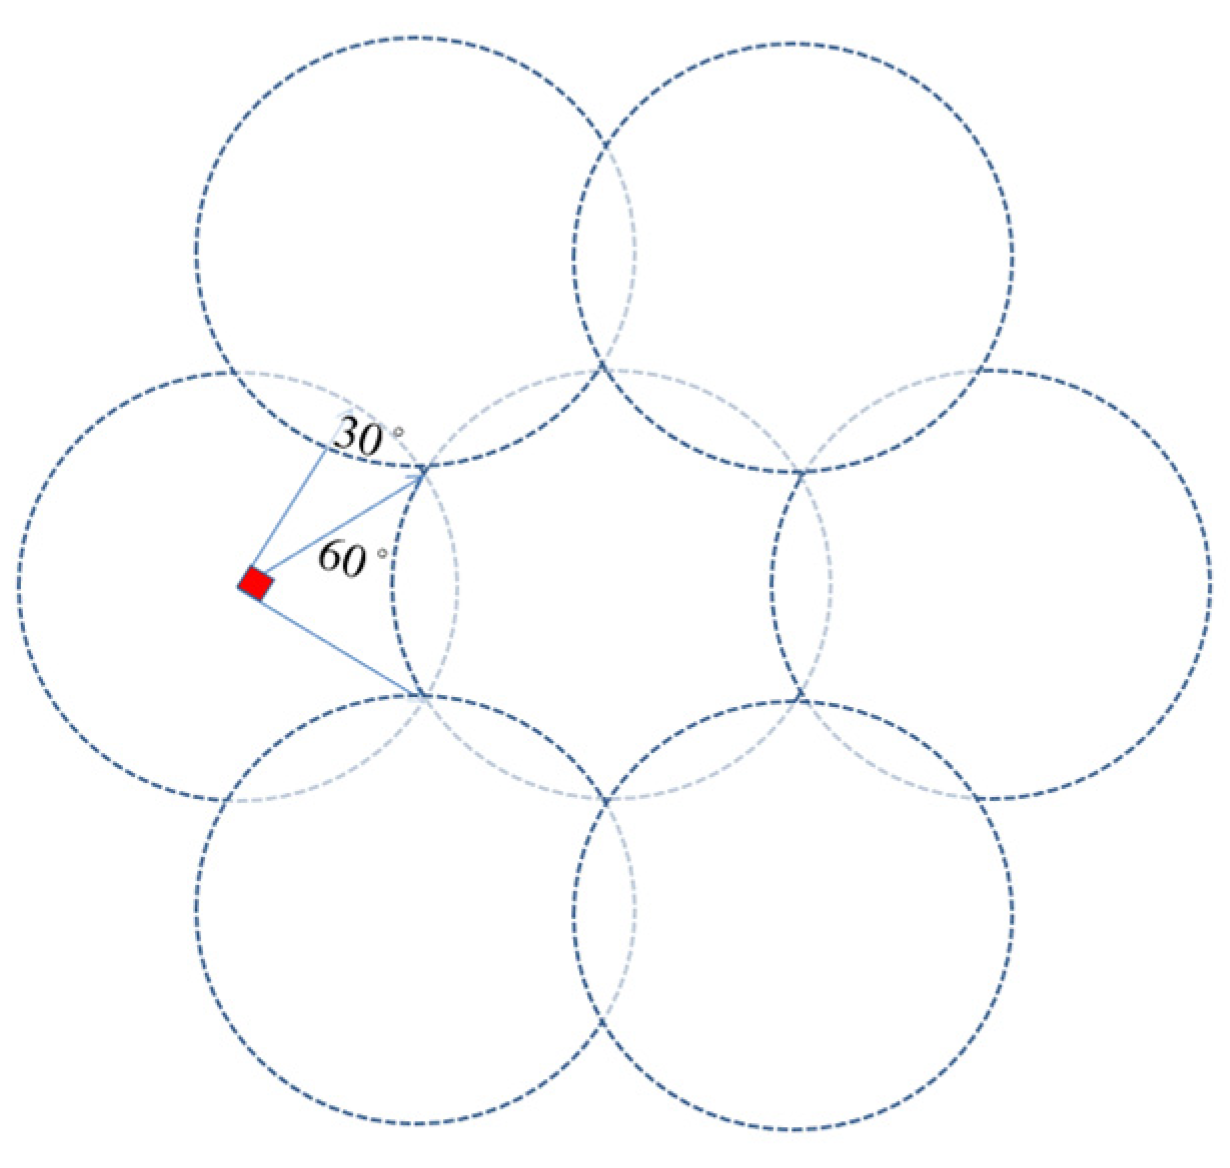
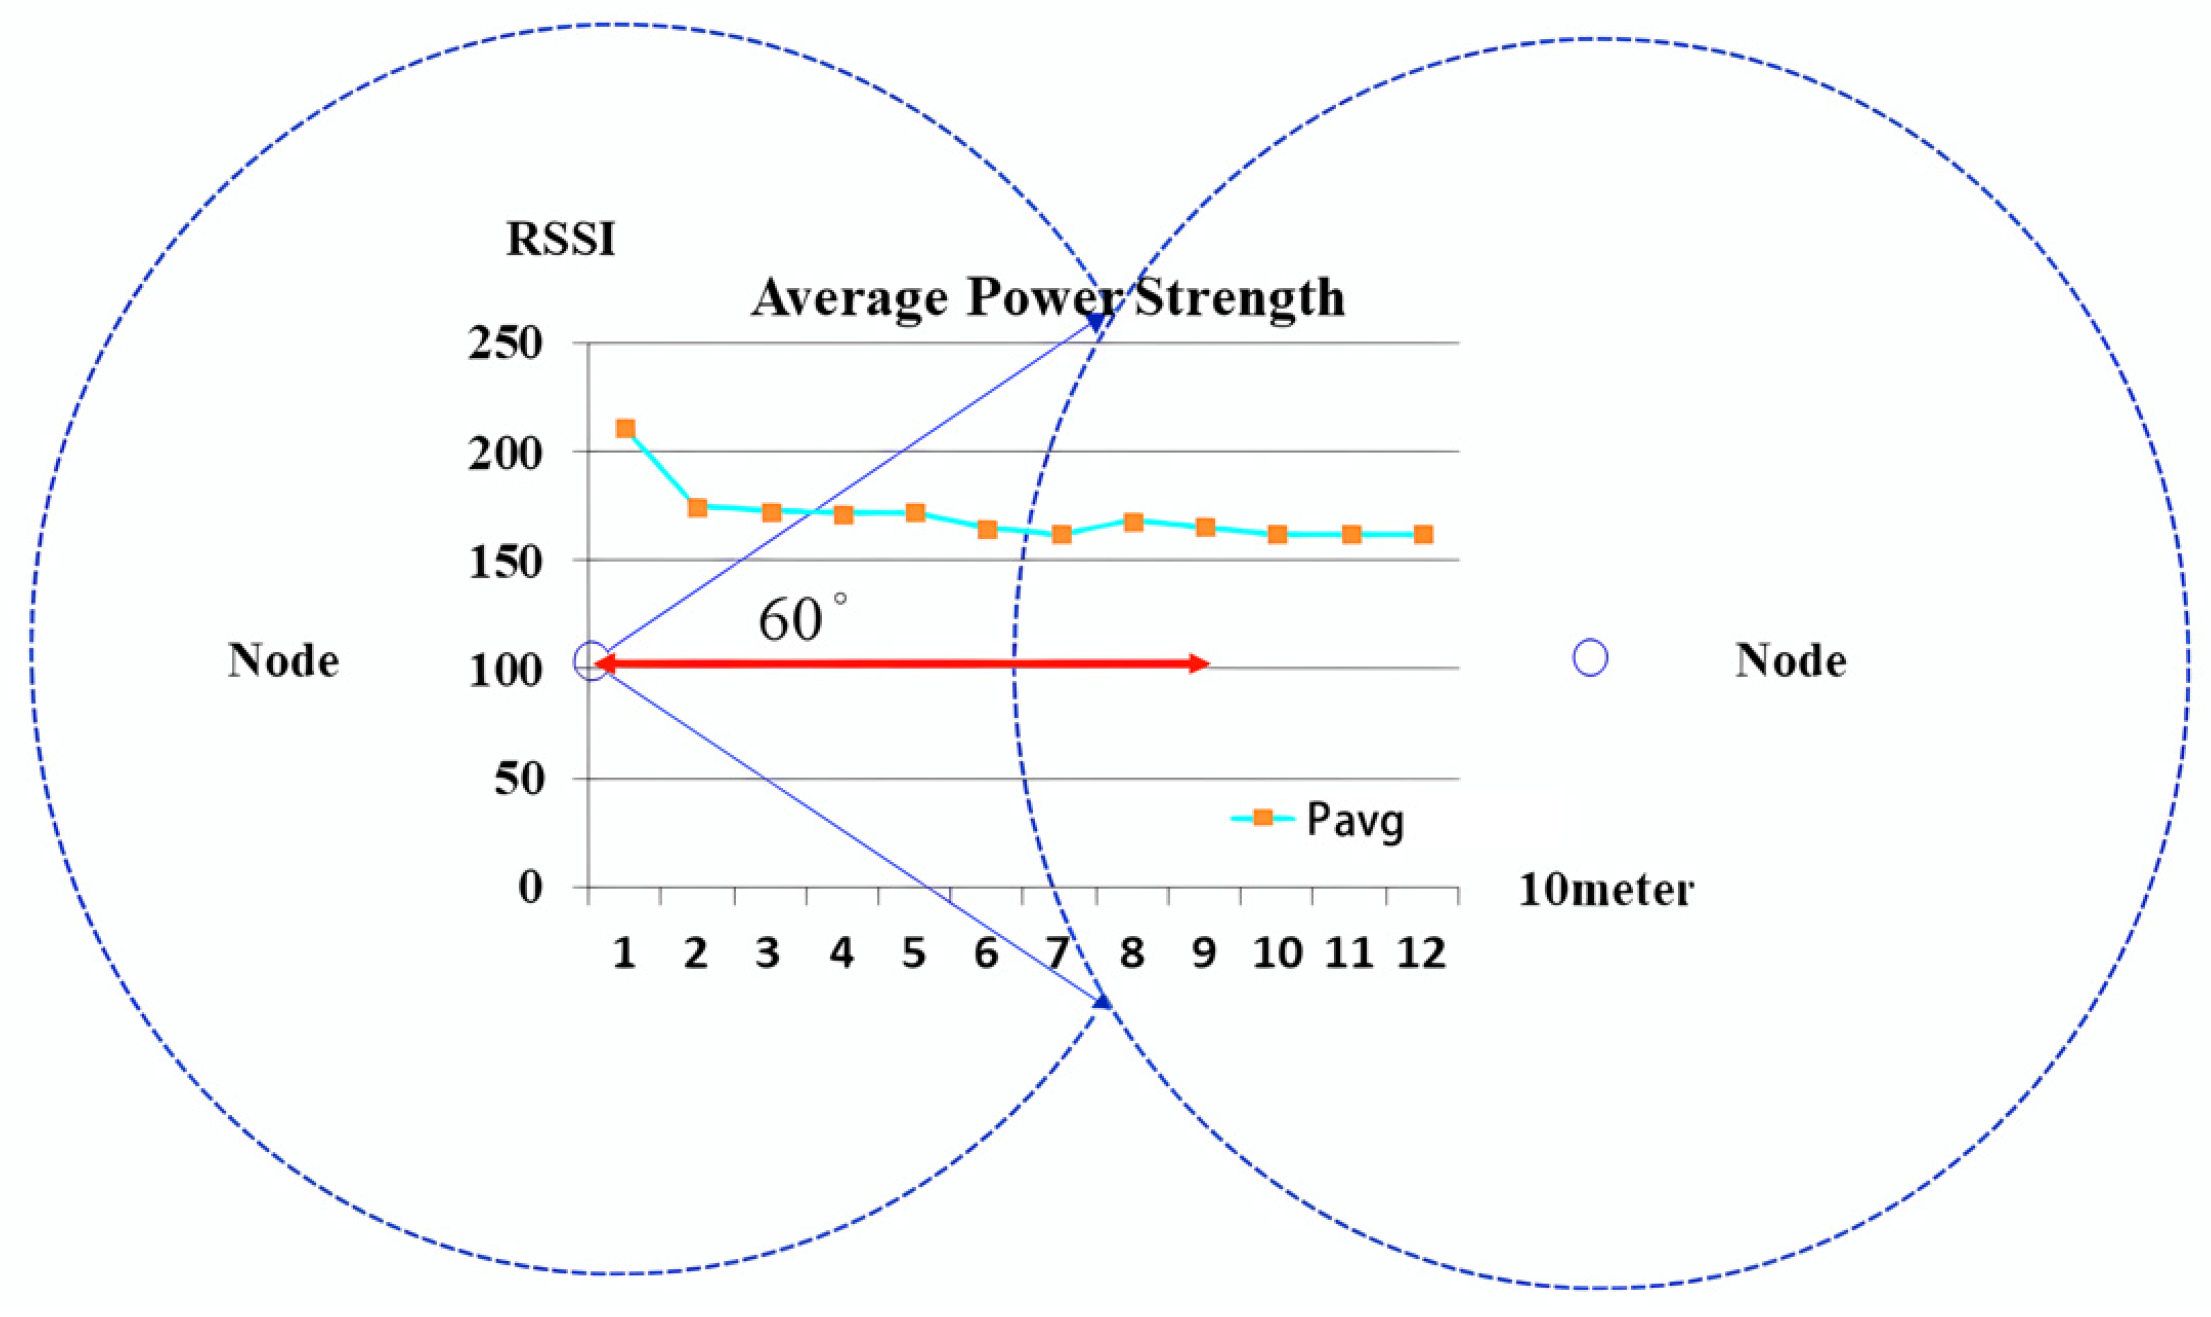
- Arranging peripheral nodes and inner nodes at a 60° separation.
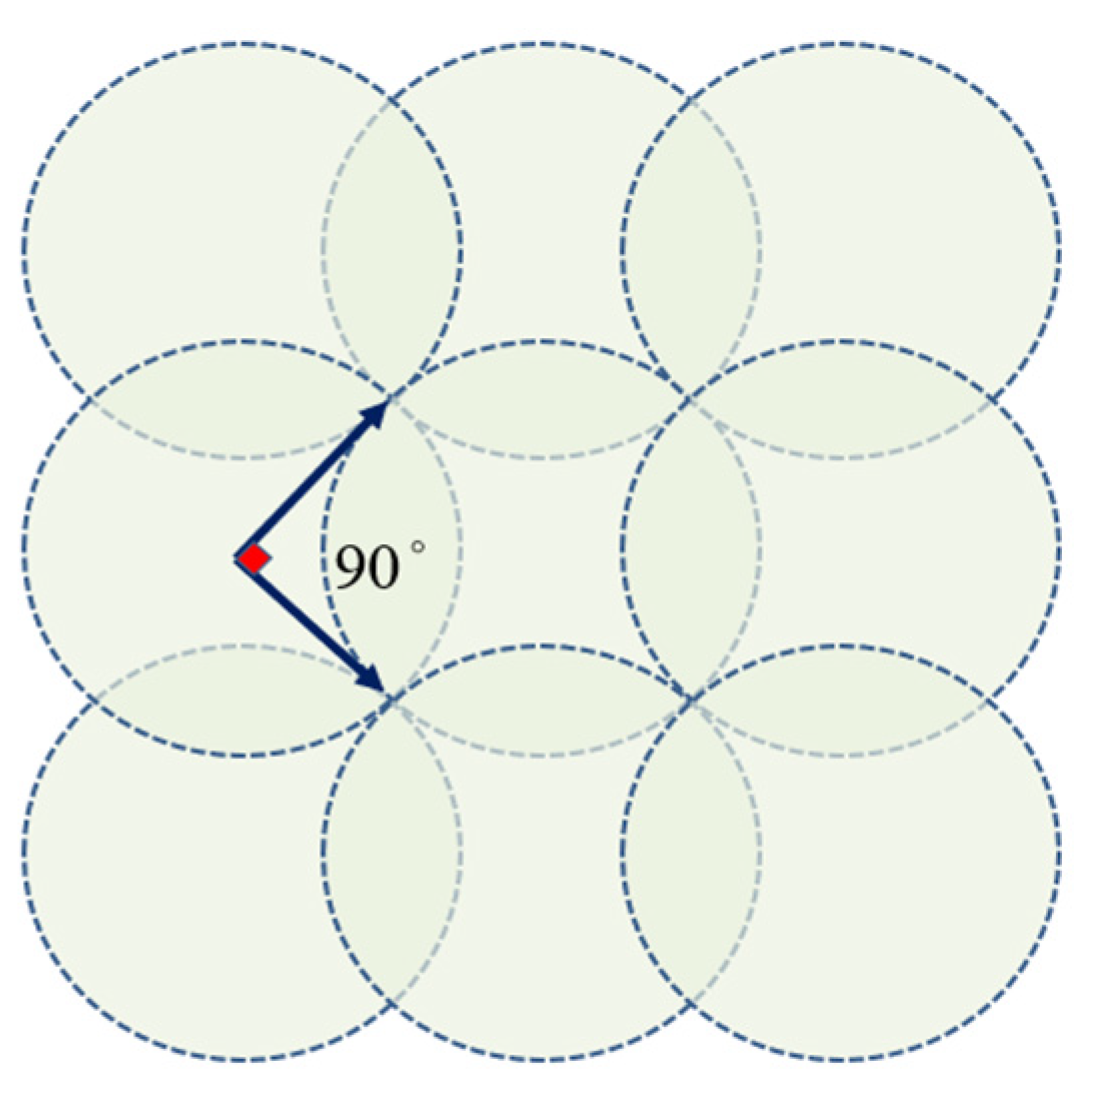
- Arranging peripheral nodes and inner nodes at a 90° separation.
- (1).
- Node Placement Strategy
- (2).
- 60° Bisecting Arrangement
- (3).
- Bisecting Arrangement
- (4).
- Optimization for the Installation Technique
5.3. Positioning and Construction
- Real Case 2. Implementation and Measurement Practices of the Smart Town.
- (1).
- System apparatus
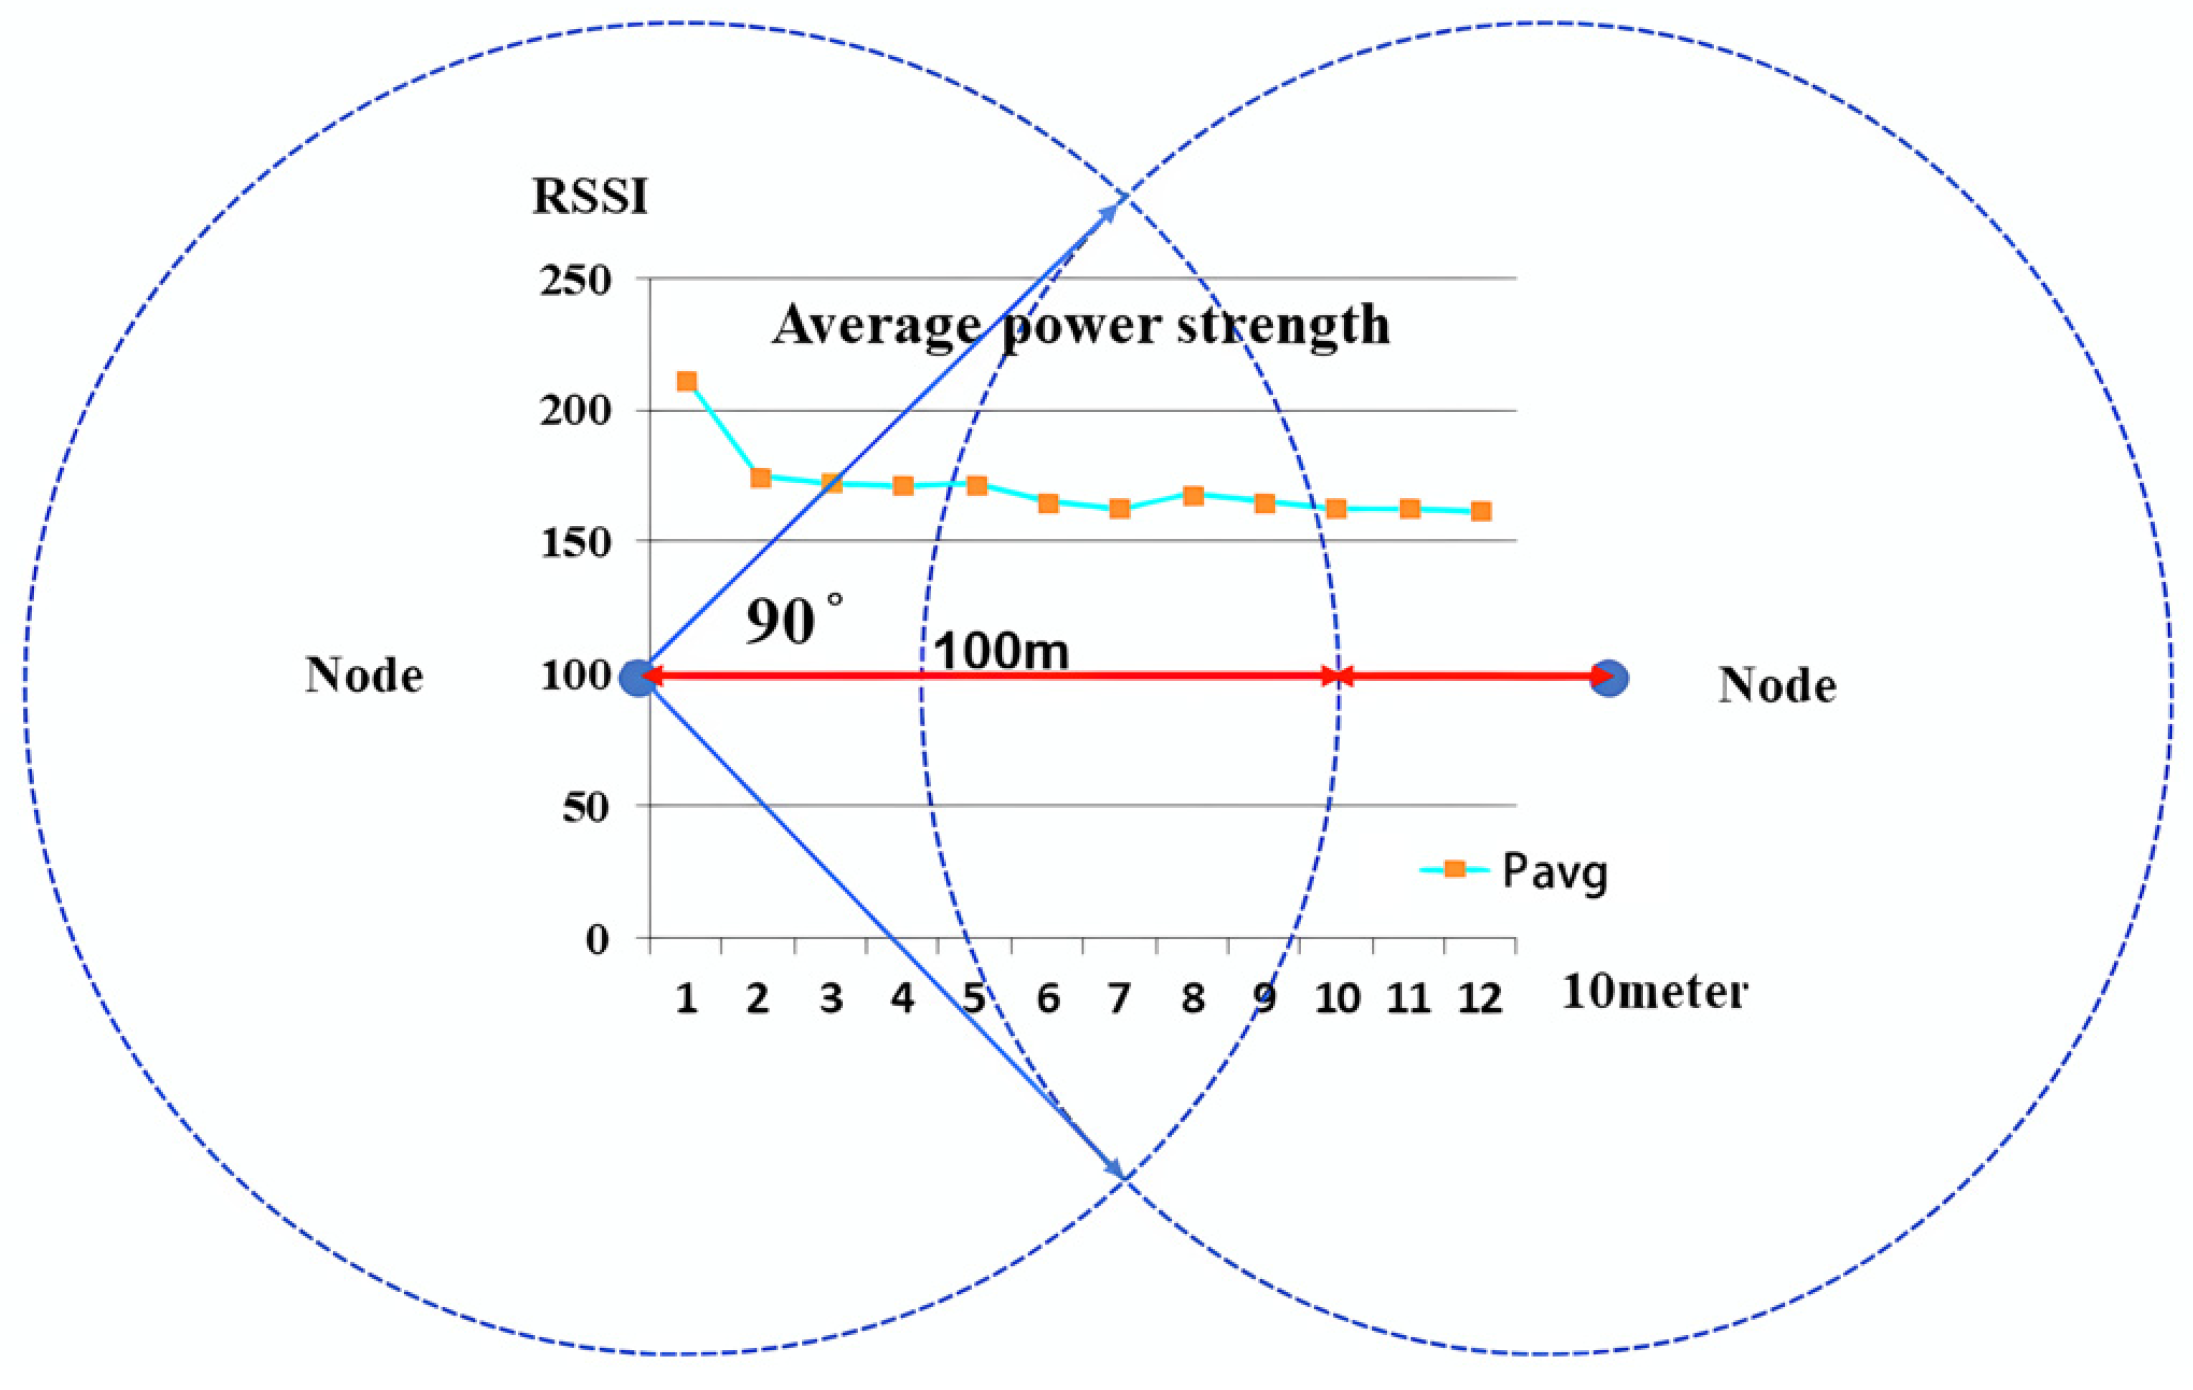
- Network planning system aspect: The best suggestion for positioning the arbitrage comparison device in conjunction with the natural gas company’s geographical information system was 0 to 100 m.
- The CN-xxx device, the best service area was based on 100 m: The empirical approach of this inquiry involved the utilization of the ZigBee device CN-xxx functioning as the node tasked with message reception. It was designated as the reference point for coordinate establishment, configuring an expansive outdoor positioning quadrant.
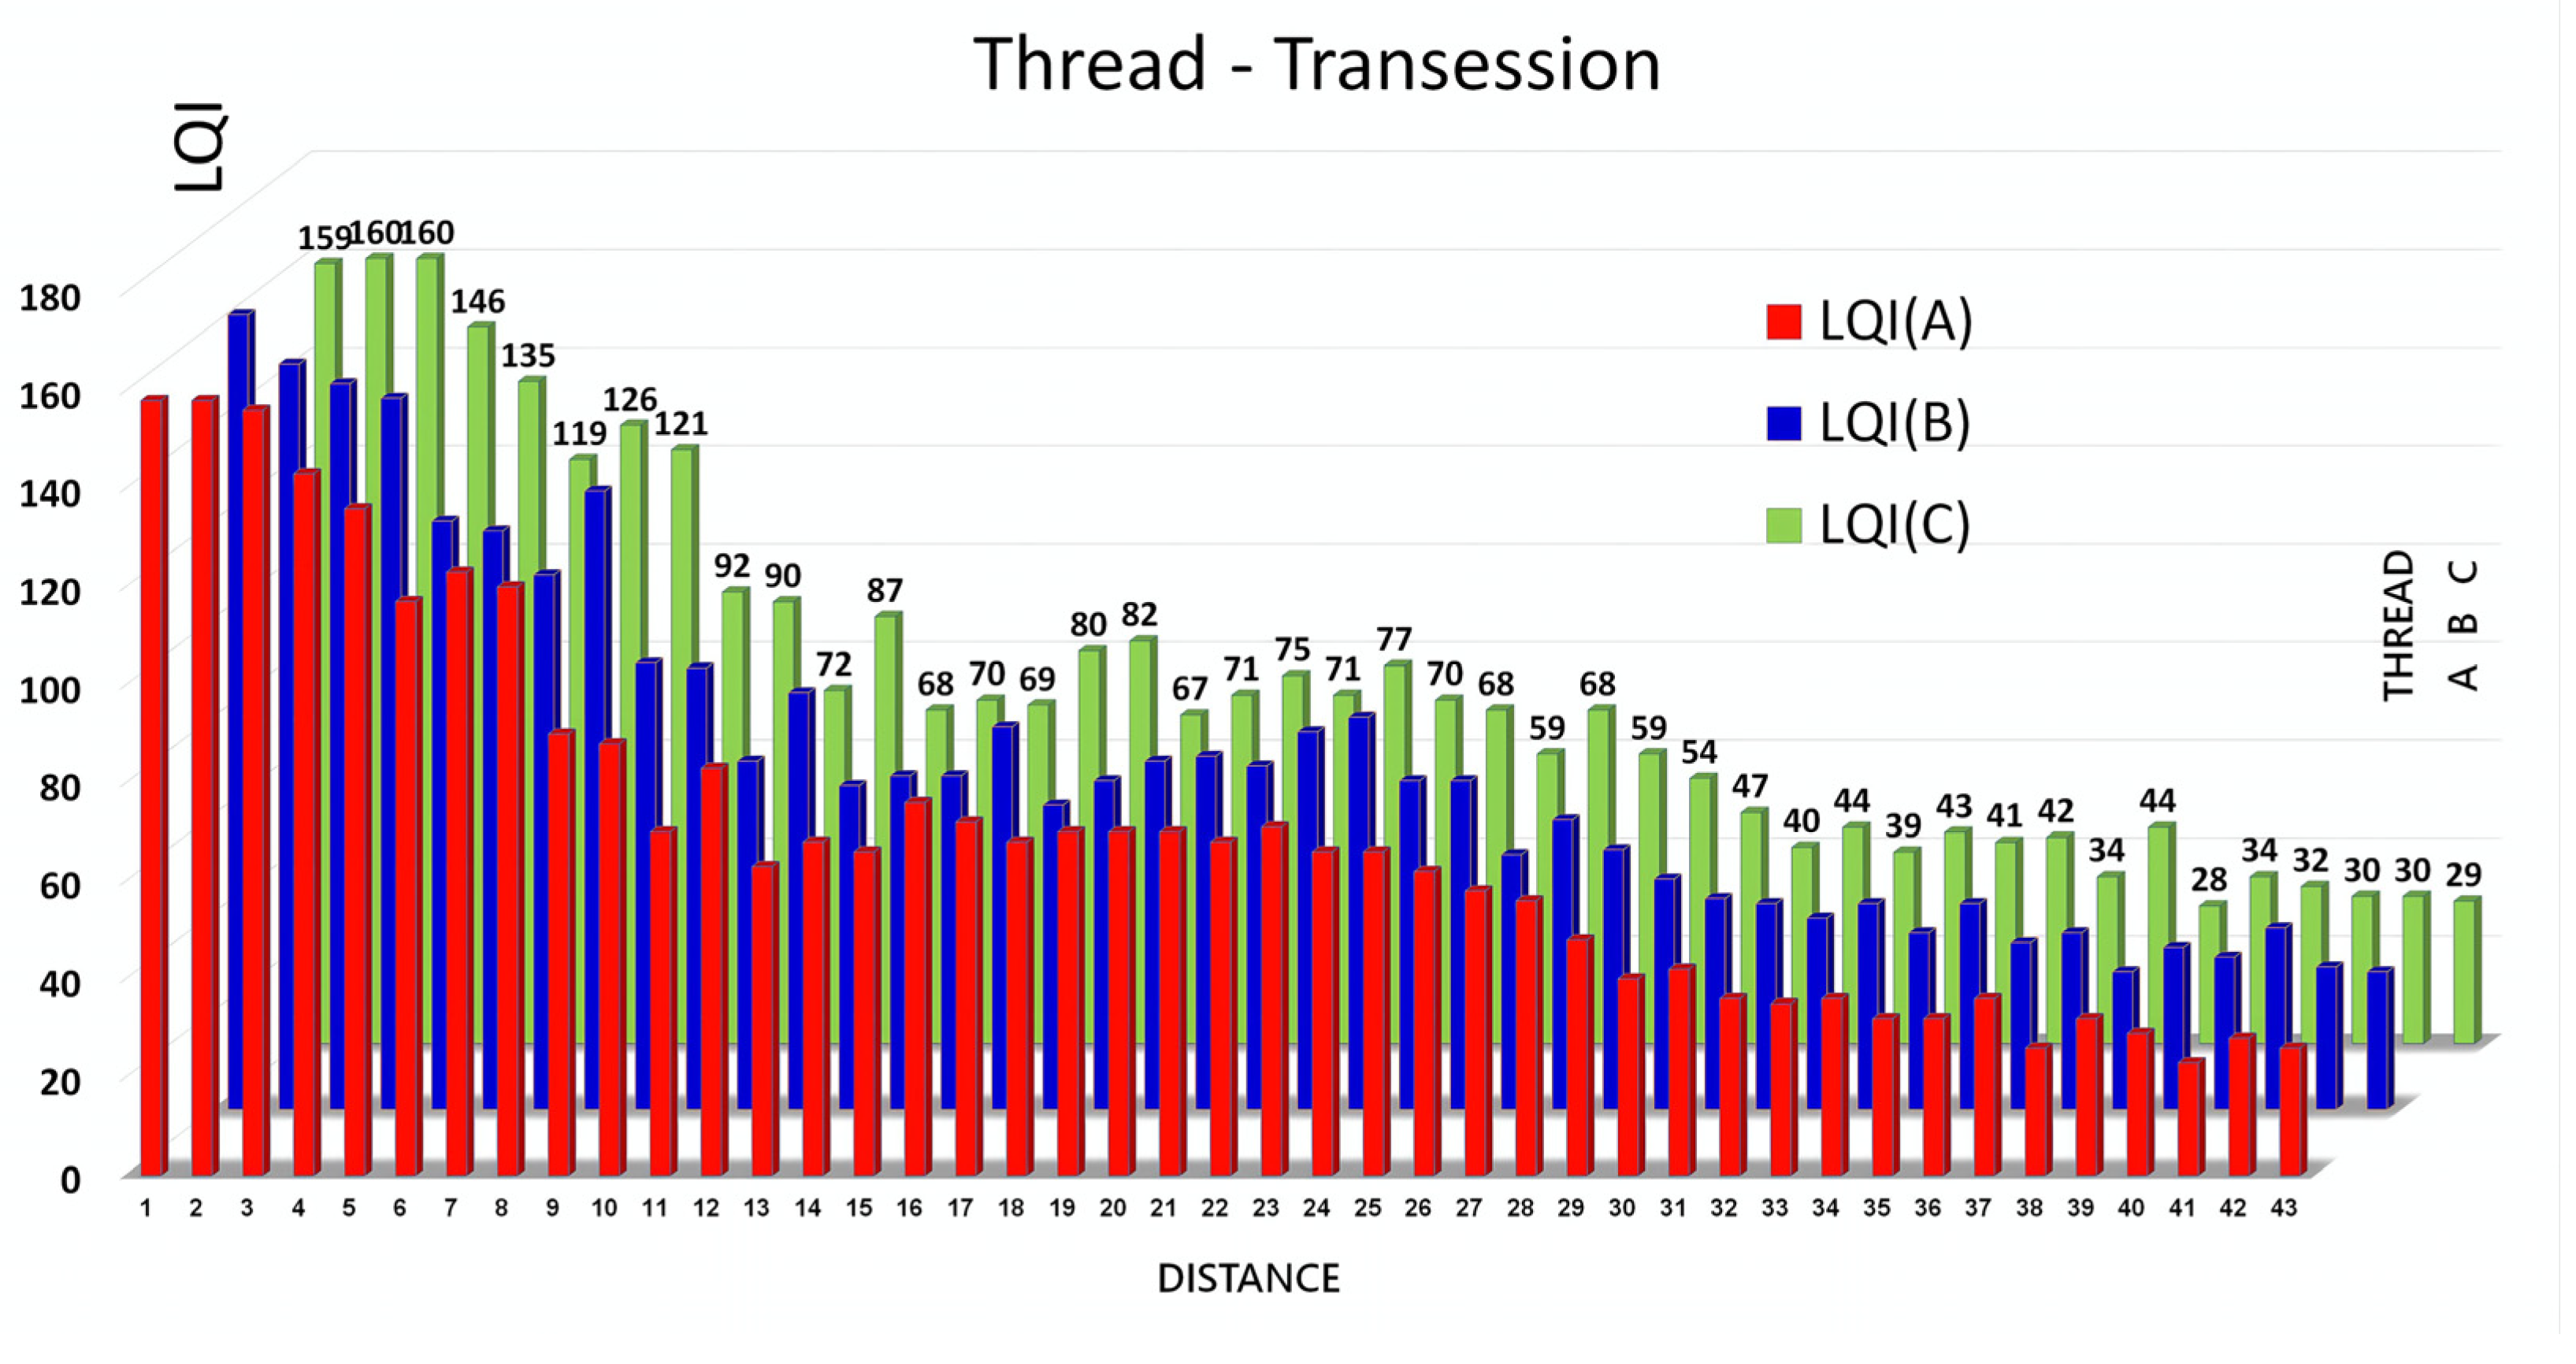
- SM-ooo device specifications, the best service area was based on 100 m: In the realm of mobile anchor points, SM-ooo served as the ZigBee tag. Various data streams, encompassing signal strength and signal quality, transmitted by SM-ooo, were meticulously acquired through CN-xxx, as delineated in Table 7 and Table 8.
- (2).
- Validate Operational Approaches
- n: constant representing signal propagation;
- d: representing the distance from the transmitter;
- A: signal strength received at one meter.
- (3).
- RSSI and LQI measurements
- (4).
- Establish a Positioning Model
- ○
- Analysis of the Model
- ○
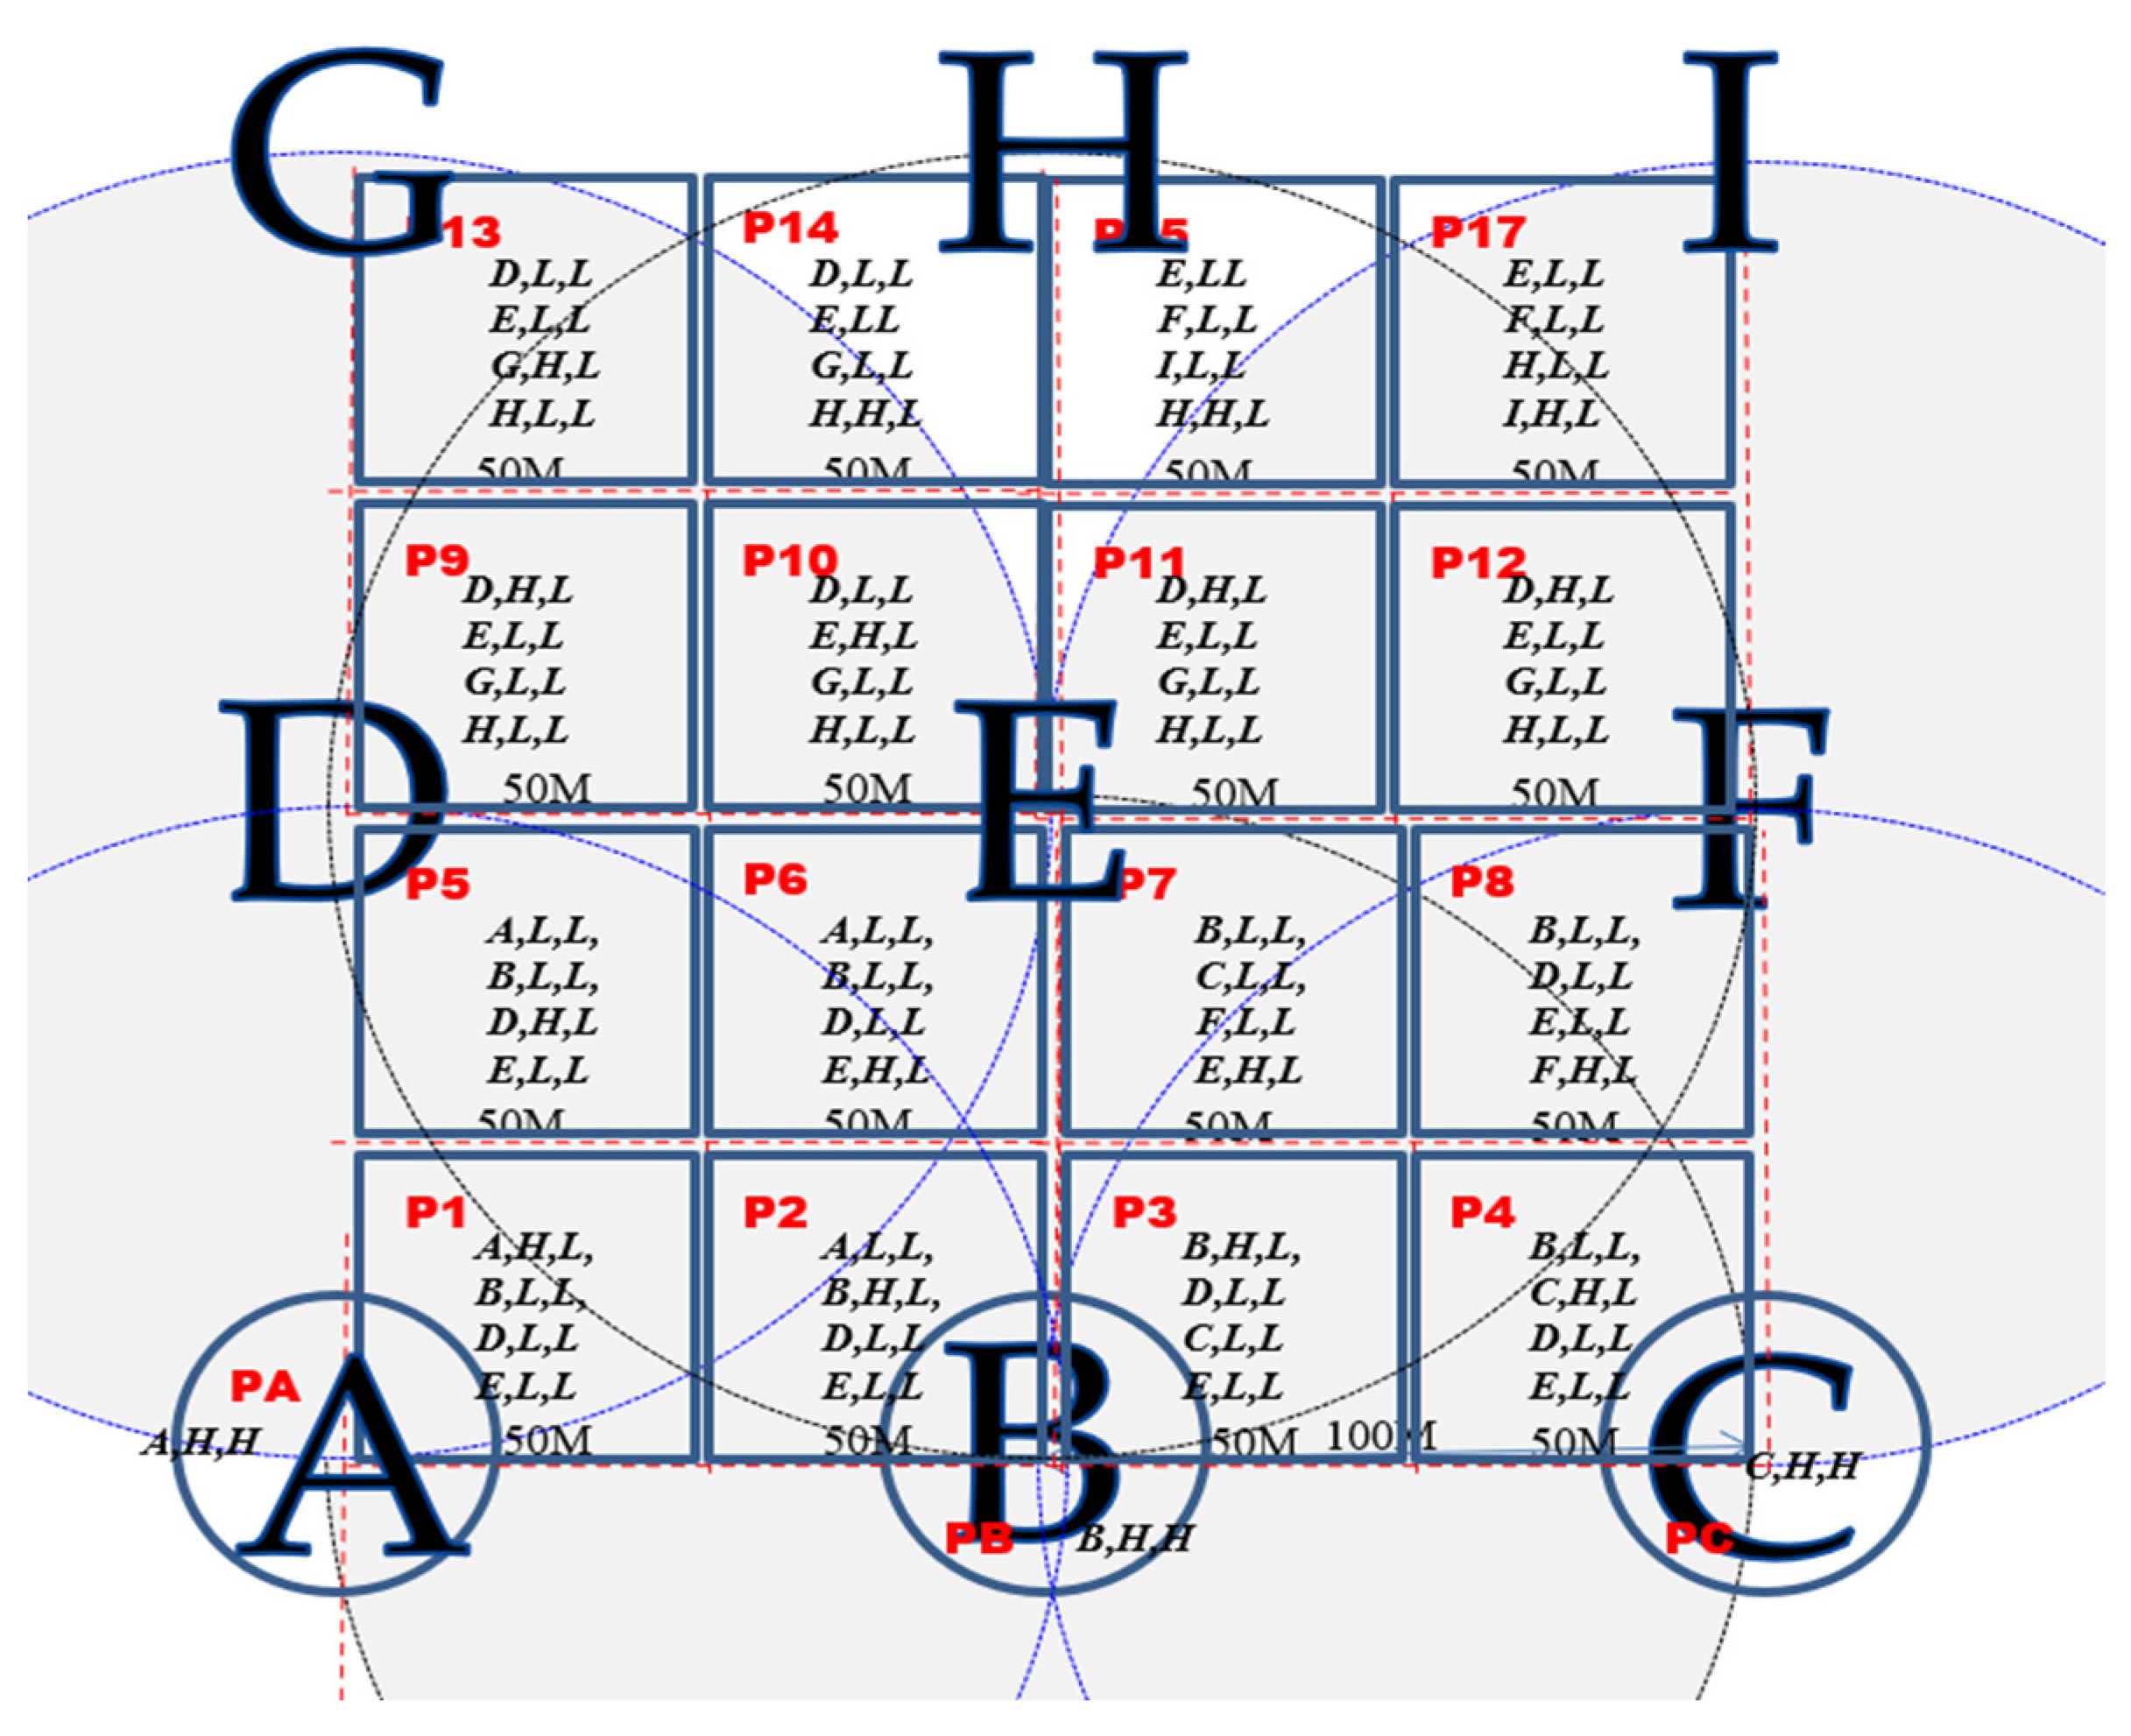
- The advantages of the 120° distribution method are as follows:
- A.
- The reference point arrangement boasts minimal density, strategically positioned every 100 m, rendering it ideal for location determination in expansive outdoor settings. In contrast to conventional ZigBee reference points, which are typically spaced at intervals of 10 to 30 m, this approach significantly diminishes the cost associated with reference point deployment.
- B.
- The positioning areas resemble a checkerboard pattern, segmented into areas with dimensions of 50 m in length and width.
- C.
- The positioning blocks, designed as square segmented areas, facilitate the creation of straightforward and convenient practical positioning algorithms.
- D.
- When leveraging ZigBee’s mesh network configuration technology and energy-efficient characteristics, the placement locations encounter fewer restrictions in real outdoor environments. Consequently, the entire designated area can be deployed in close approximation to a square.
- E.
- Within the central region of each reference point, such as A, an enclosed circular area with a 20 m radius defines a grouping of positioning blocks, augmenting the likelihood of precise positioning interpretation.
- F.
- The data essential for positioning can be readily accessed without the need for intricate calculations.
- G.
- A heightened level of efficacy is maintained even in scenarios with limited training point data.
- ○
- The cons of the 120° distribution method are as follows:
- A.
- The distance between any two blocks may vary from 0 to 100 m, potentially impacting the precision of practical assessments.
- B.
- While the 50 m2 interval design is well suited for extensive villa areas, open-air residences, and communal apartments with expansive surroundings, it may not be optimal for locales characterized by vertical structures, national parks, or environments with diverse and dynamic scenery changes.
6. Conclusions
Author Contributions
Funding
Data Availability Statement
Acknowledgments
Conflicts of Interest
References
- ZigBee Alliance. ZigBee Specification. Available online: https://zigbeealliance.org/wp-content/uploads/2019/11/docs-05-3474-21-0csg-zigbee-specification.pdf (accessed on 27 June 2015).
- IEEE 802.15.4; Specification, Wireless Medium Access Control (MAC) and Physical Layer (PHY) Specifications for Low-Rate Wireless Personal Area Networks (LR-WPANs). IEEE: Piscataway, NJ, USA, 2015.
- Atzori, L.; Iera, A.; Morabito, G. The internet of things: A survey. Comput. Netw. 2010, 54, 2787–2805. [Google Scholar] [CrossRef]
- Djahel, S.; Doolan, R.; Muntean, G.M.; Murphy, J. A Communications-Oriented Perspective on Traffic Management Systems for Smart Cities: Challenges and Innovative Approaches. IEEE Commun. Surv. Tutor. 2015, 17, 125–151. [Google Scholar] [CrossRef]
- Andreev, S.; Galinina, O.; Pyattaev, A.; Gerasimenko, M.; Tirronen, T.; Torsner, J.; Sachs, J.; Dohler, M.; Koucheryavy, Y. Understanding the IoT connectivity landscape: A contemporary M2M radio technology roadmap. IEEE Commun. Mag. 2015, 53, 32–40. [Google Scholar] [CrossRef]
- Ericsson. More than 50 Billions Connected Devices; Ericsson: Stockholm, Sweden, 2011; Volume 1. [Google Scholar]
- Wu, C.-L.; Lu, T.-T.; Lee, C.-T.; Sun, J.-S.; Lin, H.-P.; Hwang, Y.-S.; Sung, W.-T. Evolution towards Coordinated Multi-Point Architecture in Self-Organizing Networks for Small Cell Enhancement Systems. Electronics 2023, 12, 2473. [Google Scholar] [CrossRef]
- Condoluci, M.; Sardis, F.; Mahmoodi, T. Softwarization and Virtualization in 5G Networks for Smart Cities. In Proceedings of the EAI International Conference on Cyber physical systems, IoT and sensors Networks (CYCLONE), Rome, Italy, 26 October 2015. [Google Scholar]
- Sanchez, L.; Munoz, L.; Galache, J.A.; Sotres, P.; Santana, J.R.; Gutierrez, V.; Ramdhany, R.; Gluhak, A.; Krco, S.; Theodoridis, E.; et al. Smart Santander: IoT experimentation over a smart city testbed. Comput. Netw. 2014, 61, 217–238. [Google Scholar] [CrossRef]
- Lien, S.Y.; Chen, K.C.; Lin, Y. Toward ubiquitous massive accesses in 3GPP machine-to-machine communications. IEEE Commun. Mag. 2011, 49, 66–74. [Google Scholar] [CrossRef]
- Zheng, K.; Hu, F.; Wang, W.; Xiang, W.; Dohler, M. Radio resource allocation in LTE-advanced cellular networks with M2M communications. IEEE Commun. Mag. 2012, 50, 184–192. [Google Scholar] [CrossRef]
- Polese, M.; Centenaro, M.; Zanella, A.; Zorzi, M. M2M Massive Access in LTE: RACH Performance Evaluation in a Smart City Scenario. In Proceedings of the 2016 IEEE International Conference on Communications (ICC), Kuala Lumpur, Malaysia, 23–27 May 2016. [Google Scholar]
- 3GPP. TS 36.300; Evolved Universal Terrestrial Radio Access (E-UTRA) and Evolved Universal Terrestrial Radio Access Network (E-UTRAN), Rel. 11. 3GPP: Sophia Antipolis Cedex, France, 2012.
- 3GPP. TS 36.388; Study on Provision of Low-Cost Machine-Type Communications (MTC) User Equipments (UEs) Based on LTE, Rel. 12. 3GPP: Sophia Antipolis Cedex, France, 2013.
- Ben Dhaou, I.; Kondoro, A.; Kelati, A.; Rwegasira, D.S.; Naiman, S.; Mvungi, N.H.; Tenhunen, H. Communication and Security Technologies for Smart Grid. Int. J. Embed. Real-Time Commun. Syst. 2017, 8, 40–65. [Google Scholar] [CrossRef]
- Shajahan, A.H.; Anand, A. Data acquisition and control using Arduino-Android platform: Smart plug. In Proceedings of the 2013 International Conference on Energy Efficient Technologies for Sustainability, Nagercoil, India, 10–12 April 2013; pp. 241–244. [Google Scholar]
- Gungor, V.C.; Sahin, D.; Kocak, T.; Ergut, S.; Buccella, C.; Cecati, C.; Hancke, G.P. A Survey on Smart Grid Potential Applications and Communication Requirements. IEEE Trans. Ind. Inform. 2013, 9, 28–42. [Google Scholar] [CrossRef]
- Gallardo, J.L.; Ahmed, M.A.; Jara, N. LoRa IoT-Based Architecture for Advanced Metering Infrastructure in Residential Smart Grid. IEEE Access 2021, 9, 124295–124312. [Google Scholar] [CrossRef]
- Ashok, K.; Reno, M.J.; Blakely, L.; Divan, D. Systematic Study of Data Requirements and AMI Capabilities for Smart Meter Analytics. In Proceedings of the 2019 IEEE 7th International Conference on Smart Energy Grid Engineering (SEGE), Oshawa, ON, Canada, 12–14 August 2019; pp. 53–58. [Google Scholar]
- Luambano, M.M.; Kondoro, A.; Dhaou, I.B.; Mvungi, N.; Tenhunen, H. IoT enabled Smart Meter Design for Demand Response Program. In Proceedings of the 2020 6th IEEE International Energy Conference (ENERGYCon), Gammarth, Tunisia, 28 September–1 October 2020; pp. 853–857. [Google Scholar]
- Dai, X.; Xiao, Z.; Jiang, H.; Alazab, M.; Lui, J.C.; Dustdar, S.; Liu, J. Task co-offloading for d2d-assisted mobile edge computing in industrial internet of things. IEEE Trans. Ind. Inform. 2022, 19, 480–490. [Google Scholar] [CrossRef]
- Yuan, H.; Yang, B. System Dynamics Approach for Evaluating the Interconnection Performance of Cross-Border Transport Infrastructure. J. Manag. Eng. 2022, 38, 04022008. [Google Scholar] [CrossRef]
- Balador, A.; Cinque, E.; Pratesi, M.; Valentini, F.; Bai, C.; Gómez, A.A.; Mohammadi, M. Survey on decentralized congestion control methods for vehicular communication. Veh. Commun. 2021, 33, 100394. [Google Scholar] [CrossRef]
- IEEE P802.15 Working Group for WPANs. Cluster Tree Network; April 2001. Available online: https://mentor.ieee.org/802.15/file/05/15-05-0261-01-003c-generalization-and-parameterization-mmwave-channel-models.pdf (accessed on 10 November 2023).
- Zheng, J.; Lee, M.J. A Comprehensive Performance Study of IEEE 802.15.4. 2004. Available online: http://www.inf.ufes.br/~zegonc/material/Redes%20de%20Sensores%20sem%20Fio/IEEE_802.15.4-ARTIGOA%20Comprehensive%20Performance%20Study%20of%20IEEE%20802.15.4.pdf (accessed on 22 June 2023).
- ZigBee Alliance. Available online: http://www.zigbee.org/en/index.asp (accessed on 21 February 2024).
- Laneman, J.N.; Wornell, G.W. Energy-efficient antenna sharing and relaying for wireless networks. Proc. IEEE Wireless Commun. Netw. Conf. 2000, 1, 7–12. [Google Scholar] [CrossRef]
- Hasna, M.O.; Alouini, M. A performance study ofdual-hop transmissions with fixed gain relays. IEEE Trans. Wireless Commun. 2014, 3, 1963–1968. [Google Scholar] [CrossRef]
- IEEE Std 802.11; LAN-MAN Standards Committee of the IEEE Computer Society. Wireless LAN Medium Access Control (MAC) and Physical Layer(PHY) Specification. IEEE: New York, NY, USA, 1997.
- LAN-MAN Standards Committee of the IEEE Computer Society. Wireless Medium Access Control (MAC) and Physical Layer (PHY) Specifications for Low-Rate Wireless Personal Area Networks (LR-WPANs); IEEE: New York, NY, USA, 2013. [Google Scholar]
- Mahmoodi, T.; Seetharaman, S. Traffic Jam: Handling the Increasing Volume of Mobile Data Traffic. IEEE Veh. Technol. Mag. 2014, 9, 56–62. [Google Scholar] [CrossRef]
- Koubaa, A.; Alves, M.; Tovar, E. A Comprehensive Simulation Study of Slotted CSMA/CA for IEEE 802.15.4 Wireless Sensor Networks. In Proceedings of the IEEE WFCS 2006, Torino, Italy, 28–30 June 2016. [Google Scholar]
- Kleinrock, L.; Toubagi, F.A. Packet Switching in Radio Channels: Part I—Carrier Sense Multiple Access Modes and Their Throughput-Delay Characteristics. IEEE Trans. Commun. 1975, 23, 1400–1416. [Google Scholar] [CrossRef]
- Jurcík, P.; Koubâa, A. The IEEE 802.15.4 OPNET Simulation Model: Reference Guide v2.0. IPP-HURRAY Technical Report, HURRAY-TR-070509, May 2014. Available online: http://www.open-zb.net (accessed on 21 January 2024).
- Cunha, A. On the use of IEEE 802.15.4/ZigBee as Federating Communication Protocols for Wireless Sensor Networks. HURRAY-TR-070902. Master’s Thesis, Faculdade de Engenharia da Universidade do Porto, Porto, Portugal, 2007. [Google Scholar]
- Open Networking Foundation ONF. Available online: https://www.opennetworking.org/ (accessed on 21 February 2024).
- ONF Specification. OpenFlow Switch Specification 1.0.0. December 2009. Available online: https://opennetworking.org/wp-content/uploads/2013/04/openflow-spec-v1.0.0.pdf (accessed on 10 November 2023).
- ONF Specification. OpenFlow Configuration and Management Protocol 1.1.1. November 2013. Available online: https://opennetworking.org/wp-content/uploads/2013/02/of-config-1-1-1.pdf (accessed on 21 February 2024).
- ONF Specification. OpenFlow Switch Specification 1.3.3. October 2020. Available online: https://opennetworking.org/wp-content/uploads/2014/10/openflow-spec-v1.3.0.pdf (accessed on 21 February 2024).
- Opendaylight Controller. Available online: https://wiki.opendaylight.org/view/OpenDaylight_Controller:Overview (accessed on 21 February 2024).
- IEEE Std. 802.1D-2004; Media Access Control (MAC) Bridges. IEEE: New York, NY, USA, 2004.
- IEEE Std. 802.1Q-2011; Media Access Control (MAC) Bridges and Virtual Bridged Local Area Networks. IEEE: New York, NY, USA, 2011.
- Available online: https://arxiv.org/abs/2112.11324 (accessed on 21 February 2024).
- Tedeschi, P.; Sciancalepore, S.; Di Pietro, R. Satellite-Based Communications Security: A Survey of Threats, Solutions, and Research Challenges. Comput. Netw. 2022, 216, 109246. [Google Scholar] [CrossRef]
- Muthukrishnan, A.; Charles Rajesh Kumar, J.; Vinod Kumar, D.; Kanagaraj, M. Internet of image things-discrete wavelet transform and Gabor wavelet transform based image enhancement resolution technique for IoT satellite applications. Cogn. Syst. Res. 2019, 57, 46–53. [Google Scholar] [CrossRef]
- Available online: https://www.nics.nat.gov.tw/EDR.htm (accessed on 21 January 2024).
- Sturdivant, R.L.; Yeh, J.; Stambaugh, M.; Zahnd, A.; Villareal, N.; Vetter, C.K.; Rohweller, J.D.; Martinez, J.F.; Ishii, J.M.; Brown, R.A.; et al. IoT enabled pico-hydroelectric power with satellite back haul for remote himalayan villages. In Proceedings of the IEEE Topical Workshop on Internet of Space (TWIOS), Anaheim, CA, USA, 14–17 January 2018; pp. 5–8. Available online: https://www.researchgate.net/publication/323714221_IoT_enabled_pico-hydro_electric_power_with_satellite_back_haul_for_remote_himalayan_villages (accessed on 21 February 2024).
- Available online: https://www.mitre.org (accessed on 21 February 2024).
- Ball, F.; Basu, K. Analysis of the Suitability of Satellite Communication for Time-Critical IoT Applications in Smart Grid and Medical Grade Networks. In Lecture Notes of the Institute for Computer Sciences, Social Informatics and Telecommunications Engineering, Proceedings of International Conference on Wireless and Satellite Systems, Oxford, UK, 14–15 September 2017; Springer: Berlin/Heidelberg, Germany, 2018; Volume 231, p. 231. [Google Scholar]
- Sturdivant, R.L.; Lee, J. Systems engineering of IoT connected commercial airliners using satellite backhaul links. In Proceedings of the IEEE Topical Workshop on Internet of Space (TWIOS), Anaheim, CA, USA, 14–17 January 2018; pp. 1–4. [Google Scholar]
- Available online: https://d3fend.mitre.org (accessed on 21 February 2024).
- Palma, D.; Birkland, R. Enabling the Internet of Arctic Things with Freely-Drifting Small-Satellite Swarms. IEEE Access 2018, 6, 71435–71443. [Google Scholar] [CrossRef]
- Qu, Z.; Zhang, G.; Cao, H.; Xia, J. LEO satellite constellation for Internet of Thing. IEEE Access 2017, 5, 18391–18401. [Google Scholar] [CrossRef]
- Available online: https://www.rsyslog.com/ (accessed on 21 February 2024).
- Huang, H.; Guo, S.; Liang, W.; Wang, K. Online Green Data Gathering from Geo-Distributed IoT Networks via LEO Satellites. In Proceedings of the IEEE International Conference on Communications (ICC), Kansas City, MO, USA, 20–24 May 2018; pp. 1–6. [Google Scholar]
- RFC 3164—The BSD Syslog Protocol. Available online: https://datatracker.ietf.org/doc/html/rfc3164 (accessed on 21 February 2024).
- Hills, A. Large-scale wireless LAN Design. IEEE Commun. Mag. 2001, 39, 98–107. [Google Scholar] [CrossRef]
- Kamenetzky, M.; Unbehaun, M. Coverage planning for outdoor wireless LAN systems. In Proceedings of the 2002 IEEE International Zurich Seminar on Broadband Communications, Zurich, Switzerland, 19–21 February 2002; pp. 49-1–49-6. [Google Scholar]
- Chuang, Y.S. Zigbee Research and Implementation in the Wireless Sensor Network. Master’s Thesis, Graduate Institute of National Taiwan University of Science and Technology, Taipei, China, 2005; pp. 12–14. [Google Scholar]
- Chen, H.F. Context-Aware Services Based on ZigBee Wireless Sensor Network. Master’s Thesis, Graduate Institute of Computer and Communication Engineering, National Cheng Kung University, Tainan, China, 2007; pp. 11–14. [Google Scholar]
- Wang, C.T. IEEE 802.11 WLAN Access Point (AP) Deployments. Master’s Thesis, Graduate Institute of Nation Central University, Taoyuan, China, 2003; pp. 15–20. [Google Scholar]
- Google Map. Available online: http://maps.google.com.tw/ (accessed on 21 February 2024).
- Ding, J.H. Localization in Zigbee-based Sensor Networks. Master’s Thesis, Graduate Institute of National Tsing Hua University, Hsinchu, China, 2006; pp. 23–24. [Google Scholar]
- Bahl, P.; Padmanabhan, V.N.; Balachandran, A. Enhancements to the RADAR User Location and Tracking System, MSR-TR-00-12, Microsoft Research Technical. 2000. Available online: https://www.microsoft.com/en-us/research/publication/enhancements-to-the-radar-user-location-and-tracking-system/ (accessed on 21 February 2024).


| Solve Problem | ||
| The Taiwan liquefied natural gas operator (LNGasO) must install simple and stable systems to improve signal intensity within high buildings, congregate housing, toutingcuo, and apartments to facilitate integration with and the extension of existing architecture, reserve active and passive equipment space necessary for a next-generation novel system, and improve the quality of the communication network. | ||
| Technologies | Business Requirement | |
| Multi-Radio Access Technology Multi-Layer Multi-Vender | Capacity Enhancement Global M2M Connectivity (G-M2MC) Technology | Modularization Interoperability |
| Spectrum Extension Spectrum Efficiency Network Densification | HetNets-WSNs Software Defined Wide Area Networks (SD-WAN) | Reliability Performance Compatibility |
| Low-Power Nodes (LPNs) | LPN + RL + FTTW/CMTW = Novel AMI Architecture Smart LNGas Management System (SGMS) Distributed Antenna Systems (DASs) | Fast Roll Out Low Capital Costs Low Implementation Risk |
| Reinforcement Learning (RL) | ||
| Fiber to the Wireless (FTTW) | ||
| Cable Modem to Wireless (CMTW) | ||
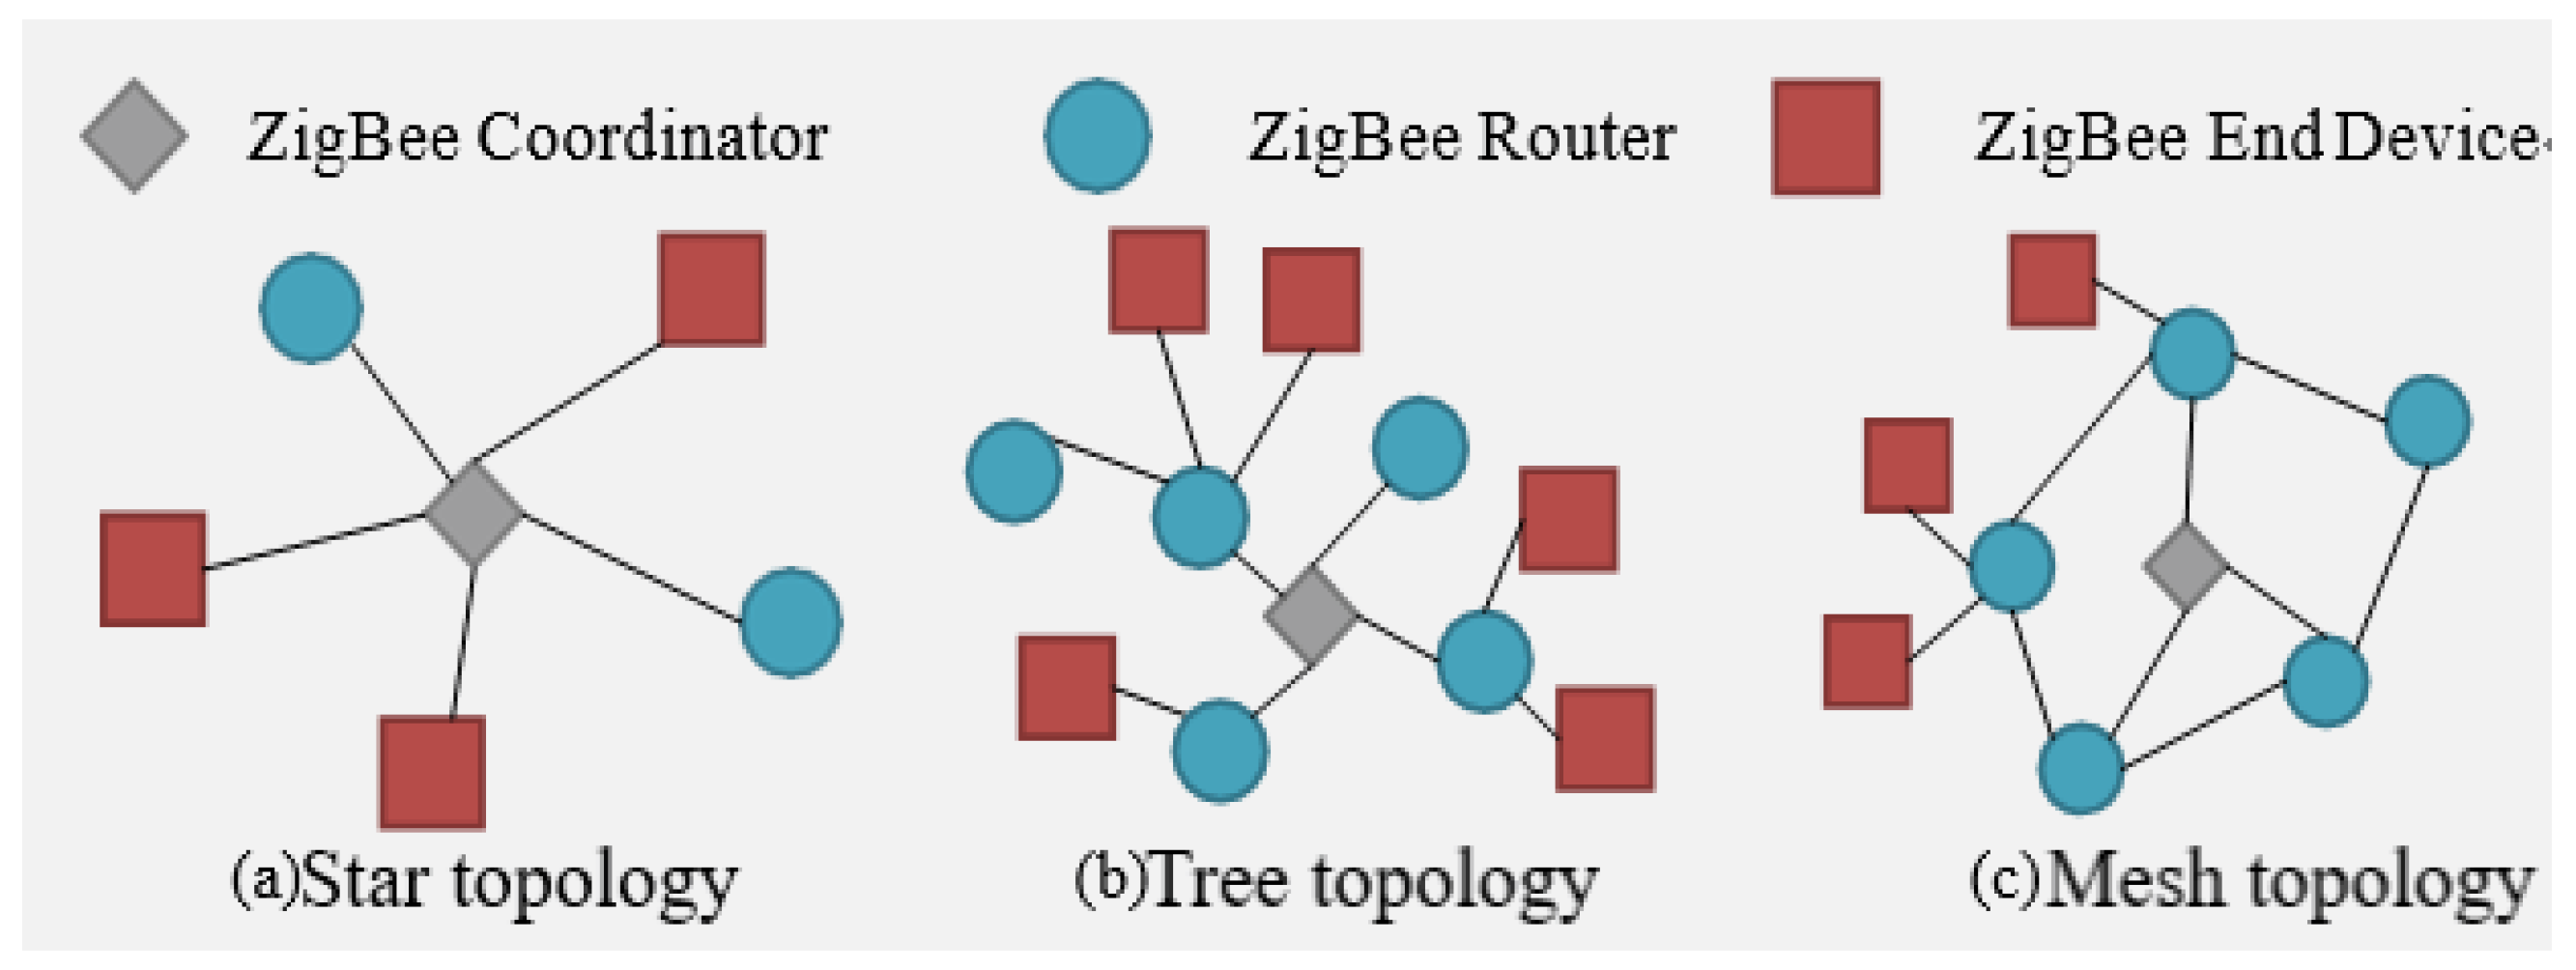
| Topology | Star | Tree | Mesh |
|---|---|---|---|
| Protocol | Slotted CSMA/CA | Slotted CSMA/CA | Unslotted CSMA/CA |
| Pros. | 1. Easy to synchronize | 1. Router consumes low energy | 1. Support multipoint connection |
| 2. Low latency | 2. Can support sleep mode | 2. High flexibility of network architecture | |
| 3. Support large-scale network | 3. Low latency | ||
| 4. Support large-scale network | |||
| Cons. | 1. Small scope | 1. Data transmission consumes more energy | 1. Cannot support sleep mode |
| 2. High latency | 2. Router consumes more energy |
| PHY | Frequency Band | Spreading Parameters | Data Parameters | |||
|---|---|---|---|---|---|---|
| Chip Rate | Modulation | Bit Rate | Symbol Rate | Symbols | ||
| 868/915 MHz PHY | 868–868.6 MHz | 300 k chip/s | BPSK | 20 kb/s | 20 k symbols/s | Binary |
| 902–928 MHz | 600 k chip/s | BPSK | 40 kb/s | 40 k symbols/s | Binary | |
| 2.4 GHz PHY | 2.4–2.4835 GHz | 2.0 M chip/s | O-QPSK | 250 kb/s | 62.5 k symbols/s | 16-ary Orthogonal |
| Data Symbol (Decimal) | Data Symbol (Binary) (b0 b1 b2 b3) | Chip Values (c0 c1 … c30 c31) |
|---|---|---|
| 0 | 0 0 0 0 | 1 1 0 1 1 0 0 1 1 1 0 0 0 0 1 1 0 1 0 1 0 0 1 0 0 0 1 0 1 1 1 0 |
| 1 | 1 0 0 0 | 1 1 1 0 1 1 0 1 1 0 0 1 1 1 0 0 0 0 1 1 0 1 0 1 0 0 1 0 0 0 1 0 |
| 2 | 0 1 0 0 | 0 0 1 0 1 1 1 0 1 1 0 1 1 0 0 1 1 1 0 0 0 0 1 1 0 1 0 1 0 0 1 0 |
| 3 | 1 1 0 0 | 0 0 1 0 0 0 1 0 1 1 1 0 1 1 0 1 1 0 0 1 1 1 0 0 0 0 1 1 0 1 0 1 |
| 4 | 0 0 1 0 | 0 1 0 1 0 0 1 0 0 0 1 0 1 1 1 0 1 1 0 1 1 0 0 1 1 1 0 0 0 0 1 1 |
| 5 | 1 0 1 0 | 0 0 1 1 0 1 0 1 0 0 1 0 0 0 1 0 1 1 1 0 1 1 0 1 1 0 0 1 1 1 0 0 |
| 6 | 0 1 1 0 | 1 1 0 0 0 0 1 1 0 1 0 1 0 0 1 0 0 0 1 0 1 1 1 0 1 1 0 1 1 0 0 1 |
| 7 | 1 1 1 0 | 1 0 0 1 1 1 0 0 0 0 1 1 0 1 0 1 0 0 1 0 0 0 1 0 1 1 1 0 1 1 0 1 |
| 8 | 0 0 0 1 | 1 0 0 0 1 1 0 0 1 0 0 1 0 1 1 0 0 0 0 0 0 1 1 1 0 1 1 1 1 0 1 1 |
| 9 | 1 0 0 1 | 1 0 1 1 1 0 0 0 1 1 0 0 1 0 0 1 0 1 1 0 0 0 0 0 0 1 1 1 0 1 1 1 |
| 10 | 0 1 0 1 | 0 1 1 1 1 0 1 1 1 0 0 0 1 1 0 0 1 0 0 1 0 1 1 0 0 0 0 0 0 1 1 1 |
| 11 | 1 1 0 1 | 0 1 1 1 0 1 1 1 1 0 1 1 1 0 0 0 1 1 0 0 1 0 0 1 0 1 1 0 0 0 0 0 |
| 12 | 0 0 1 1 | 0 0 0 0 0 1 1 1 0 1 1 1 1 0 1 1 1 0 0 0 1 1 0 0 1 0 0 1 0 1 1 0 |
| 13 | 1 0 1 1 | 0 1 1 0 0 0 0 0 0 1 1 1 0 1 1 1 1 0 1 1 1 0 0 0 1 1 0 0 1 0 0 1 |
| 14 | 0 1 1 1 | 1 0 0 1 0 1 1 0 0 0 0 0 0 1 1 1 0 1 1 1 1 0 1 1 1 0 0 0 1 1 0 0 |
| 15 | 1 1 1 1 | 1 1 0 0 1 0 0 1 0 1 1 0 0 0 0 0 0 1 1 1 0 1 1 1 1 0 1 1 1 0 0 0 |
| Name | Type | Description |
|---|---|---|
| Tag | str | Event log |
| Priority | int | Priority: Facility × 8 + Severity |
| Time | date | Incident time |
| Host | str | The source host that sends syslog messages |
| Ident | str | Identify the device or application that generated the message |
| Pid | int | Process name: often used to analyze the continuity of the log generation process but does not guarantee reliability |
| message | str | The complete content of the event |
| Facility | Description |
|---|---|
| kernel messages (kern) | Most of the messages generated by the system core involve hardware detection and core function activation. |
| user-level messages (user) | Information generated at the user level, such as the user uses the logger command to record the function of the login file |
| mail system (mail) | Email sending and receiving |
| system daemons (daemons) | System daemon or service related, such as system-related information |
| security/authorization messages (auth) | Login authorization related, such as login, ssh, and su |
| messages generated internally by syslog (syslog) | Information generated by syslog related protocols; information generated by the rsyslogs program itself |
| LINE printer subsystem (lpr) | Print related |
| network news subsystem (news) | Newsgroup server related |
| UUCP subsystem (uucp) | Unix to Unix Copy Protocol, used in the early days to exchange program data between Unix systems |
| clock daemon (cron) | Routine work schedule |
| security/authorization messages (authpriv) | Similar to auth, but records more private account information, including the operation of the pam module |
| FTP daemon (ftp) | FTP communication protocol related |
| Item | Specification |
|---|---|
| Frequency | 2.4 GHz |
| Modulation | O-QPSK |
| Maximum Transmission Rate | 250 kbps |
| Receive Sensitivity | −104 dBm |
| Transmission Distance | 1200 m (LOS) |
| Channel No. | 16 (5 MHz) |
| Tx | −6 to +208 dBm |
| Power Consumption Tx | <204 mA |
| Power Consumption Rx | <54 mA |
| Item | Specification |
|---|---|
| Frequency | 2.4 GHz |
| Modulation | O-QPSK |
| Maximum Transmission Rate | 250 kbps |
| Receive Sensitivity | −95 dBm |
| Transmission Distance | 100 m (LOS) |
| Channel No. | 16 (5 MHz) |
| Tx Power | −24 dBm to 0 dBm |
| Power Consumption Tx | <24 mA |
| Power Consumption Rx | <76 μA |
| Distances (m) | RSSI (dB) |
|---|---|
| 0 | 210.69 |
| 10 | 173.93 |
| 20 | 172.49 |
| 30 | 171.73 |
| 40 | 171.15 |
| 50 | 165.13 |
| 60 | 166.86 |
| 70 | 167.16 |
| 80 | 164.53 |
| 90 | 161.57 |
| 100 | 162.89 |
| 110 | 161.75 |
| 120 | 162.07 |
| Ref. / Take | Reference Point A | Reference Point B | Reference Point C | Reference Point D | ||||
|---|---|---|---|---|---|---|---|---|
| RSSI | LQI | RSSI | LQI | RS SI | LQI | RSSI | LQI | |
| p1 | 174(H) | 85 | 162 | - | - | - | - | - |
| p2 | 165 | 30 | - | - | - | - | 171 | 60 |
| p3 | 172(H) | 40 | 163 | 30 | - | - | 165 | 42 |
| p4 | 168 | 42 | 172 (H) | 55 | - | - | - | - |
| Ref. / Take | Ref. Point A | Ref. Point B | Ref. Point C | Ref. Point D | Ref. Point E | |||||
|---|---|---|---|---|---|---|---|---|---|---|
| RSSI | LQI | RSSI | LQ I | RSSI | LQI | RSSI | LQI | RSSI | LQ I | |
| p2 | L | L | L | L | L | L | H | L | L | L |
| p3 | H | L | L | L | L | L | L | L | L | L |
| p4 | L | L | H | L | L | L | L | L | L | L |
| p5 | L | L | L | L | L | L | L | L | H | L |
| p6 | L | L | L | L | - | - | - | - | - | - |
| Key Factors | Descriptions | Operating Performance | Future Prospects |
|---|---|---|---|
| 1. Optimal Cost Efficiency | |||
| (1). System Infrastructure Expenditure | In embracing a cloud-based architecture, the company finds itself in a position where investments in system software and hardware infrastructure remain virtually unaltered. Moreover, as the system’s application scope expands, the specter of augmented maintenance expenses is notably absent. | Propelled by the relentless march of science and technology, we dared to conceive novel system architectures and operational paradigms. Our aspiration transcends the confines of the rudimentary AMR SM, and we set our sights squarely on the AMI horizon. Presently, industries incoming to business-promotion status comprise peers that have actively participated in cloud platform testing, offering invaluable insights to the project team, leading the world into a new realm of cross-domain Internet of Things with Taiwan’s natural gas industry technology and applications to improve AMI network resilience and equipment’s zero-trust security risk information management and contingency management in the defense of disaster relief responses. | 1. Fracture Analysis System |
| (2). Communication Expenses | Currently, NB-IoT/LTE SMS transmission incurs a fee of NT$1.0 per instance. Actions such as meter readings, alarms, and other system functionalities, each treated as a distinct transmission, attract a monthly circuit rental fee. This fee is of paramount concern amongst industry peers who advocate for microcomputer watches. Remarkably, this study harnessed cutting-edge transmission technology and system architecture, compelling telecommunications providers to recalibrate their pricing model to align with the AMI system’s characteristics. Consequently, a singular communication fee per meter per month is levied, eliminating supplementary charges, thereby substantially curtailing communication-related expenses. | 2. Energy Efficiency Analysis System | |
| (3). Maintenance Outlays | As previously highlighted, the cloud-based architecture obviates the need for additional software and hardware acquisitions. Post installation, there exist no exigencies for equipment maintenance, replacements, or the hiring of maintenance personnel. Coupled with the marked reduction in communication costs, post system deployment, the company’s sole outlays comprise meter reading service fees and monthly communication fees for online message transmissions. | 3. Deployment of a Digital Security System | |
| 2. Expedited Implementation | Telecom operators possess fully fledged network systems. The extant backend management platform and transmission technologies represent well-vetted offerings within the purview of intelligent cloud management systems. These have undergone meticulous modification and rigorous testing by collaborating manufacturers. Further, communication modules have secured NCC certification in R.O.C. In summation, the system environment is in a state of readiness and can be set into motion according to the internal timeline of the natural gas company. | 4. Integrated Utilization of Mobile Data Devices | |
| 3. Mitigated Information Security Risks | Telecommunication operators stand as the nation’s foremost data communication firms, instilling a profound sense of confidence in their expertise regarding information security control mechanisms and technology. Consequently, the adoption of this model serves to alleviate information security risks and associated expenditures for natural gas operators. Furthermore, contracts act to standardize the legal obligations of telecommunications operators in data processing, transmission, and storage endeavors on behalf of natural gas operators. | 5. Advancements in Customer Service Center Development | |
| 4. Synergistic Collaboration | Beyond the confines of system operations, both entities can furnish each other with operational platforms, fostering mutual collaboration and revenue augmentation. This platform can subsequently accommodate value-added services, with the telecommunications operator systems serving as an extension of the company’s customer service platform. | ||
Disclaimer/Publisher’s Note: The statements, opinions and data contained in all publications are solely those of the individual author(s) and contributor(s) and not of MDPI and/or the editor(s). MDPI and/or the editor(s) disclaim responsibility for any injury to people or property resulting from any ideas, methods, instructions or products referred to in the content. |
© 2024 by the authors. Licensee MDPI, Basel, Switzerland. This article is an open access article distributed under the terms and conditions of the Creative Commons Attribution (CC BY) license (https://creativecommons.org/licenses/by/4.0/).
Share and Cite
Wu, C.-L.; Lu, T.-T.; Lee, C.-T.; Sun, J.-S.; Lin, H.-P.; Hwang, Y.-S.; Sung, W.-T. Novel AMI in Zigbee Satellite Network Based on Heterogeneous Wireless Sensor Network for Global Machine-to-Machine Connectivity. Electronics 2024, 13, 1421. https://doi.org/10.3390/electronics13081421
Wu C-L, Lu T-T, Lee C-T, Sun J-S, Lin H-P, Hwang Y-S, Sung W-T. Novel AMI in Zigbee Satellite Network Based on Heterogeneous Wireless Sensor Network for Global Machine-to-Machine Connectivity. Electronics. 2024; 13(8):1421. https://doi.org/10.3390/electronics13081421
Chicago/Turabian StyleWu, Chia-Lun, Tsung-Tao Lu, Chin-Tan Lee, Jwo-Shiun Sun, Hsin-Piao Lin, Yuh-Shyan Hwang, and Wen-Tsai Sung. 2024. "Novel AMI in Zigbee Satellite Network Based on Heterogeneous Wireless Sensor Network for Global Machine-to-Machine Connectivity" Electronics 13, no. 8: 1421. https://doi.org/10.3390/electronics13081421
APA StyleWu, C.-L., Lu, T.-T., Lee, C.-T., Sun, J.-S., Lin, H.-P., Hwang, Y.-S., & Sung, W.-T. (2024). Novel AMI in Zigbee Satellite Network Based on Heterogeneous Wireless Sensor Network for Global Machine-to-Machine Connectivity. Electronics, 13(8), 1421. https://doi.org/10.3390/electronics13081421