1. Introduction
Modern automobiles have evolved into comprehensive mobile spaces, where in-vehicle displays have become a crucial element for drivers to obtain information. With the development of vehicle electrification and the increase in displays inside vehicles, this advantage is being reinforced [
1]. The current advancement of Advanced Driver Assistance Systems (ADAS) is progressing to more sophisticated stages, increasingly enabling users to divert their attention during driving, thus liberating their hands and focus for tasks beyond driving. In 2014, SAE International published a six-level classification system for autonomous driving, which has become the standard for most mainstream autonomous driving researchers [
1]. The SAE standard classifies autonomous driving technology into six levels: Level 0–5. L2 is partial automation, where the system controls steering, acceleration, and deceleration, but the human driver monitors the driving environment and executes dynamic driving tasks in complex situations. The system supports only partial road conditions and driving modes. L3 is conditional or autonomous driving on structured roads, such as highways and better urban roads, where the vehicle can make automatic judgments and decisions without human supervision and intervention [
2]. Although autonomous driving capabilities higher than L3 have been achieved in closed environments, most vehicles are in the critical stage between L2 and L3, which does not mean that drivers can completely release their hands and attention, which is challenging [
3]. Between 2014 and 2015, Google carried out tests on autonomous driving for smart vehicles lasting 15 months. The test report revealed that there were 341 disengagements from autonomous driving, including 69 instances initiated by the users themselves [
4]. This clearly demonstrates that even in autonomous driving, the system cannot eliminate human intervention. Schoettle [
5] posits that a considerable disparity exists between the system’s safety and the expectations of the market and public, necessitating further enhancements. According to data from the National Highway Traffic Safety Administration (NHTSA), until Level 5 autonomy is achieved, intelligent driving systems remain unreliable, constantly at risk of failures and incorrect judgments. According to Safety Administration NHTSA in 2011, 10% of fatal accidents and 17% of injury accidents in the United States were reported to be distraction-affected accidents [
6]. This means that 390,331 individuals died or were injured in accidents involving distracted drivers [
7]. As crucial channels of interaction, in-vehicle displays can showcase road information captured by vehicle sensors, performing recognition and conversion before relaying this data back to the user via the interactive screen interface. Despite the variety of in-vehicle display systems on the market that cater to user experience and intuitive feeling, the quality of experience is inconsistent; thus. the perspective of users towards the R&D and application of these products is critically important. The challenging aspect is that, while driving, the vehicle system permits suitable distractions but requires drivers to instantly return to the driving task in specific situations [
8]. This is comparable to a classroom setting where a teacher allows sleeping but requires readiness to respond to questions at any time. As ADAS gradually evolve into autonomous driving systems, a significant period of human–machine co-driving is anticipated. In this context, the experiment focuses on validating in-vehicle display preferences under conditions of distracted driving. The study aims to address two primary research questions: what kinds of information and needs users have in distracted driving scenarios, and how users prefer in-vehicle displays during such scenarios. To explore this issue, we investigated users’ needs during distractions by using questionnaires to examine their preferences for informational displays in distracted driving scenarios. Based on the data from user research, simulated driving experiments will be conducted to analyze users’ distraction behaviors and determine their preferences for display areas.
1.1. Co-Driving and Driving Distraction
Given the limitations in the intelligence of driving systems, drivers and autonomous driving systems are required to collaborate closely in completing driving tasks within complex and dynamic environments. This collaboration necessitates a seamless switch in control authority, thus facilitating effective co-driving. Deng Chao highlights that achieving a harmonious coexistence between human drivers and autonomous systems is a significant challenge, particularly due to the issue of attention diversion [
8]. This makes cognitive ergonomics a critical aspect of human–machine co-driving.
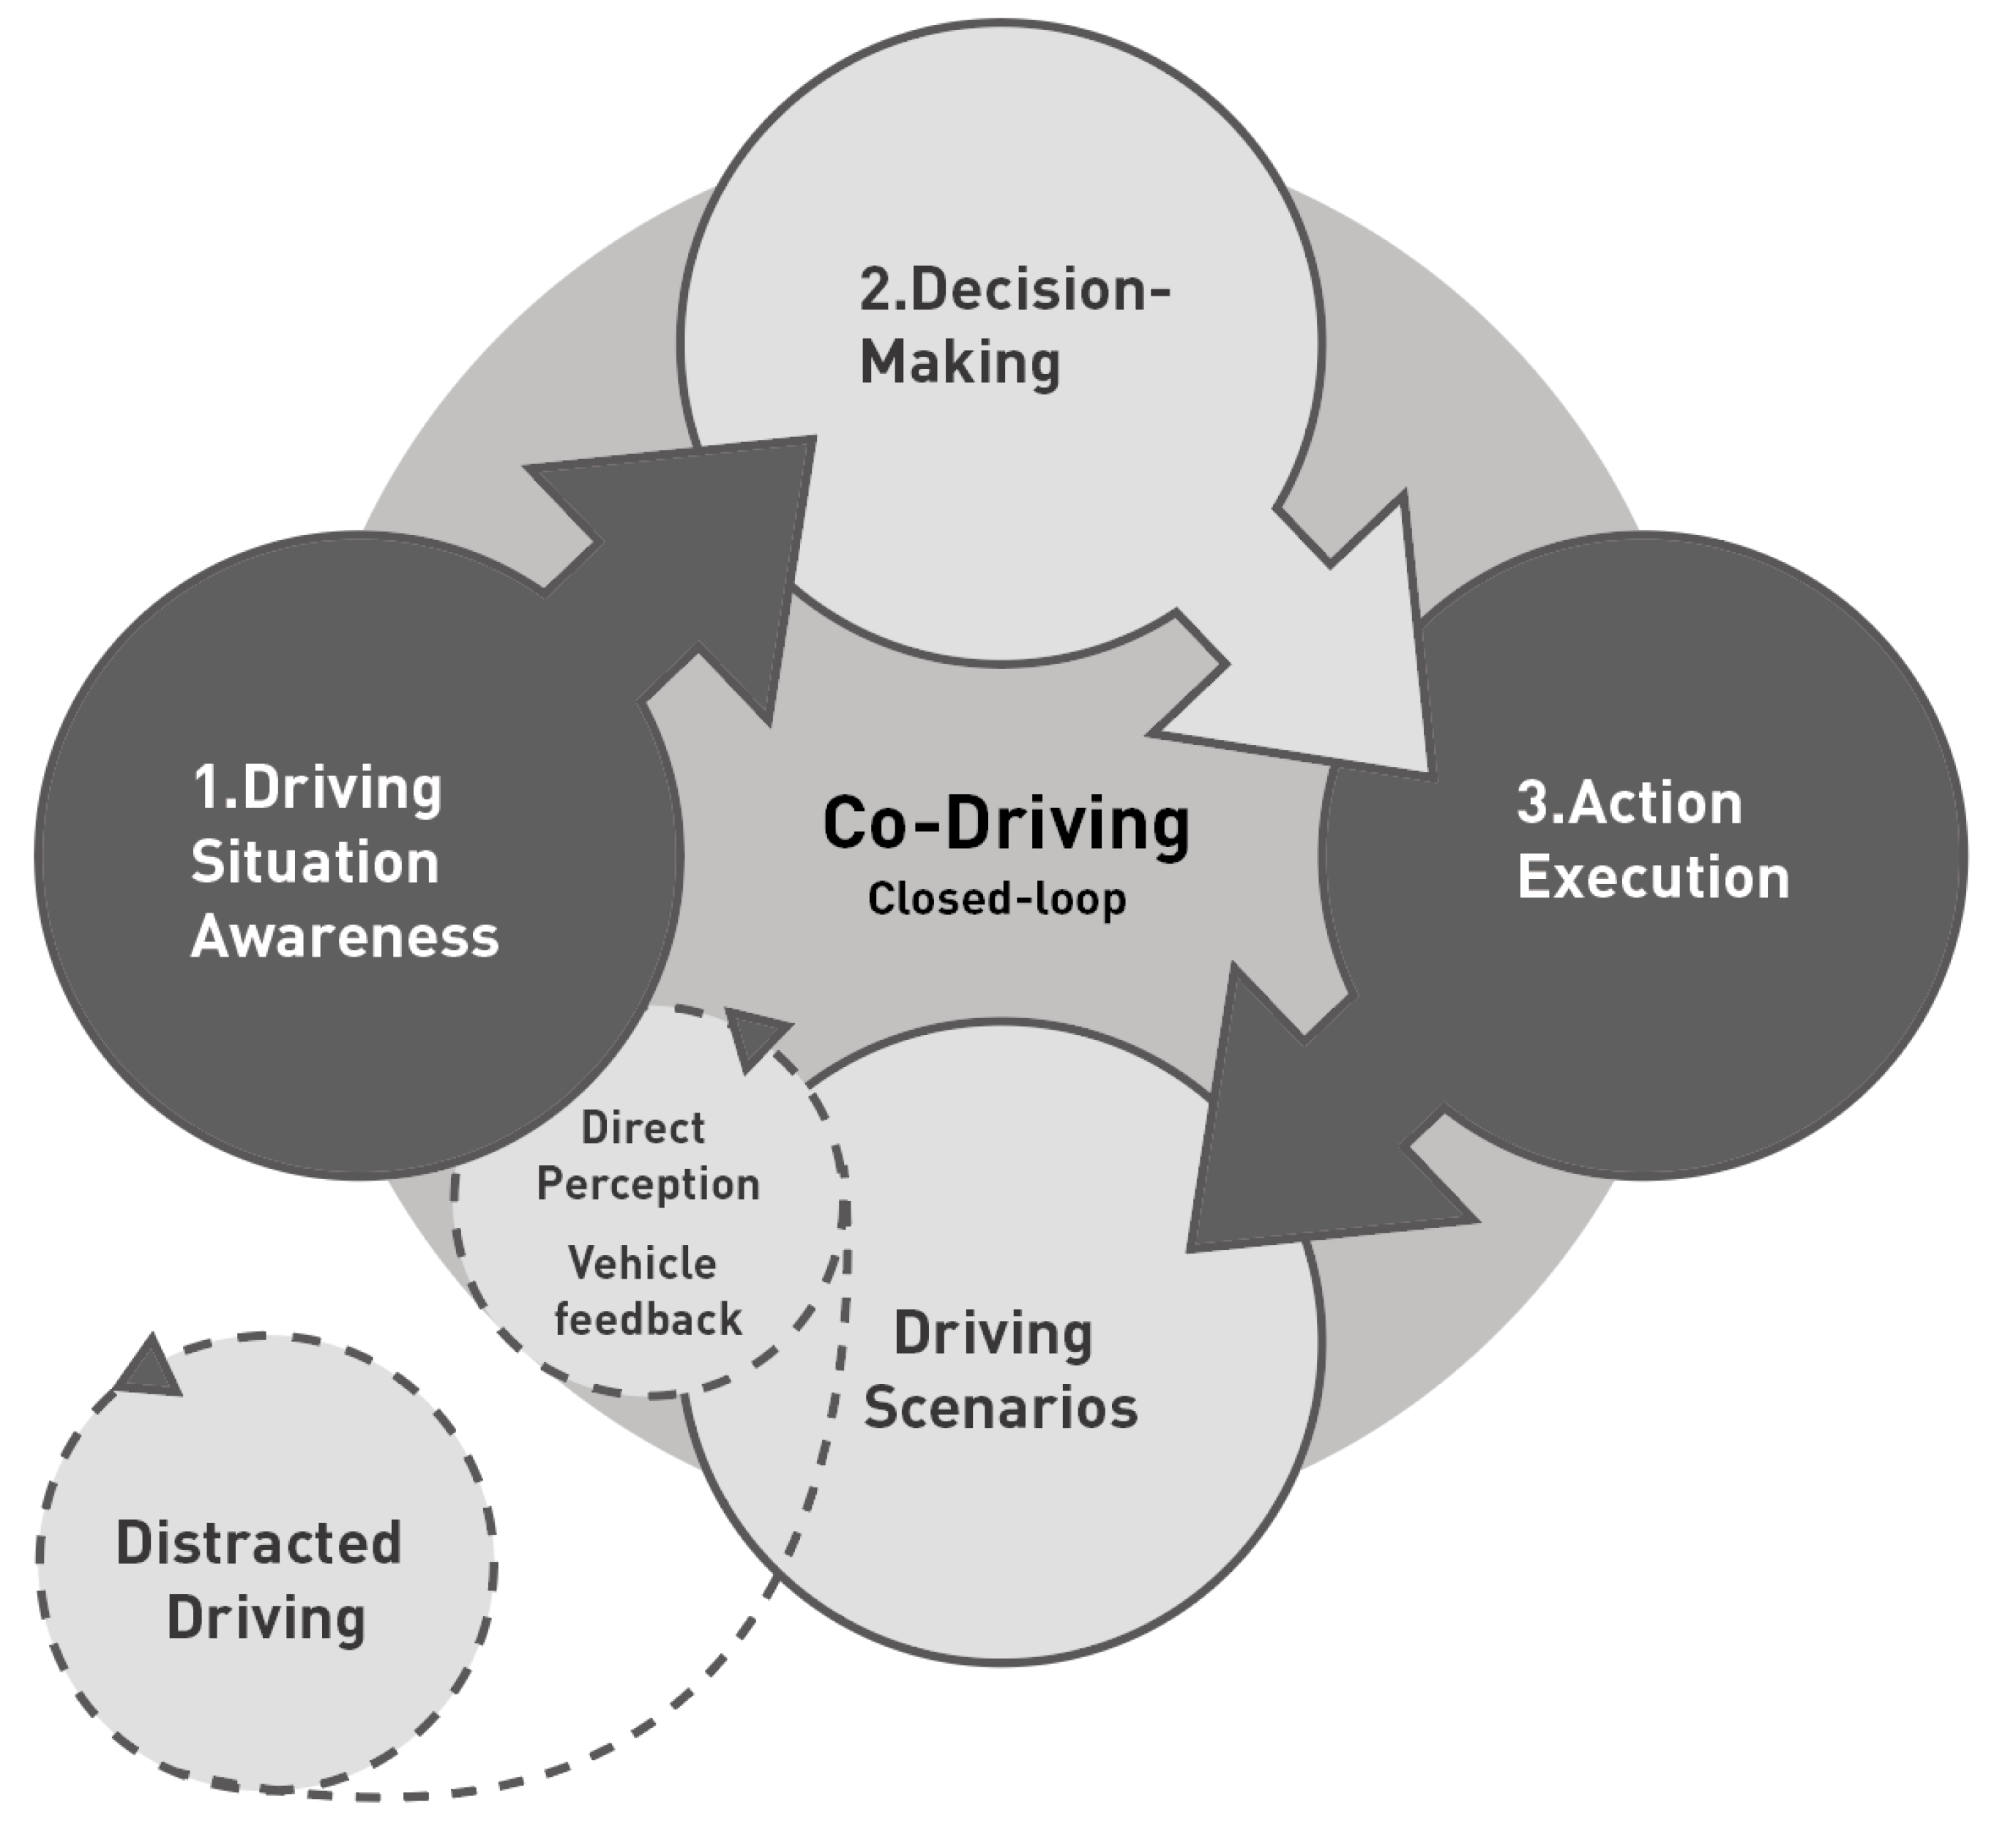
Figure 1 depicts that the co-driving process can be conceptualized into three phases: situational awareness, decision-making, and control execution. Regarding the method of driving control, Fernand et al. [
9] proposed a Multiple Input Multiple Output (MIMO) approach for path tracking control of autonomous vehicles under network-induced delays, aimed at enhancing driving safety and passenger comfort. The risk of distracted driving increases when the driver’s perception is not fully integrated into the feedback loop. In exploring criteria for distracted driving, Klauer et al. [
10] collected nearly 43,000 h of data from naturalistic driving experiments and proposed a criterion based on the driver’s eyes being off the forward road for more than 2 s. This criterion has significantly influenced subsequent research on distracted driving. Recarte et al. [
11] argue that visual distractions reduce both the frequency and proportion of times drivers look ahead, as well as shorten the duration of each gaze. Further supporting this, Ma Yong et al. [
12] conducted real-vehicle road trials on highways to examine drivers’ gazing behaviors under visual distraction. They found that in-vehicle information systems are the primary source of visual distractions for drivers. In addition to visual distractions, voice interaction is also a vital mode of interaction. Enrique et al. [
13] have proposed a dialogue modeling method based on fundamental atomic interaction units known as “communicative acts.”
Against the backdrop of distracted driving, the significance of high-quality driving takeovers is emphasized as essential for ensuring safety and enhancing the quality of the driving experience. Current studies have shown that in the context of distracted driving, the effectiveness of takeovers is influenced by a combination of factors [
12]. Specifically, the research on how in-vehicle display systems vary in content and format in cueing drivers for takeovers is still lacking. Therefore, when addressing the issue of distracted driving, it is important to establish a sound research framework and collectively analyze the impacts of different driving levels and in-vehicle display cues. This approach not only aids users in identifying potential sources of risk but also significantly boosts their motivation for intervention. Distracted driving involves the distribution of attentional resources amid multitasking activities during driving. In exploring the wide range of factors affecting distracted driving, Iqbal et al. [
12] examined the impact of telephone conversation content and different driving contexts on distraction, finding that certain scenarios could exacerbate the issue [
14]. Therefore, this research focuses on drivers’ preferences for in-vehicle displays and their choices concerning methods of displaying takeover messages, which are invaluable for understanding and improving the state of distracted driving.
1.2. In-Vehicle Displays
The in-vehicle display is a crucial interface for human–vehicle interaction, playing a significant role in the evolution of smart in-vehicle display systems within contemporary automotive design. Tan et al. [
15] distilled the types and methods of multi-screen displays for autonomous vehicles, marking a variety of transformations as these systems become more intelligent. This intelligence is reflected in the shift from physical buttons to larger displays and multiple monitors, a change that has led to the enlargement of display sizes, an increase in the number of displays, and diversification in display formats [
16]. These formats now include traditional displays, head-up displays (HUDs), and window displays, with HUDs undergoing the most extensive research [
17]. The current array of planar visual display technologies features combiner head-up displays (C-HUDs), windshield head-up display (W-HUDs), and augmented reality head-up displays (AR-HUDs) [
18]. These advancements underscore the indispensable role of smart in-vehicle display systems in enhancing interaction experiences and driving safety.
Table 1 illustrates the display devices used in current production models, distinguishing between traditional luxury car brands and the innovative interior display configurations of electric vehicle brands such as Tesla, NIO, and XPeng1. Considering the diverse types of in-vehicles displays, this study focuses on display modes that are directly pertinent to driving tasks. It excludes concept display devices not yet fully legalized (such as electronic rearview mirrors) and display setups unrelated to driving tasks (such as rear-seat entertainment systems). This approach streamlines the analysis of in-vehicle display configurations, with the aim of emphasizing display technologies that significantly enhance driving safety and convenience.
New display devices have not replaced traditional display methods; instead, they have created a scenario where various types of displays coexist. Olaverri-Monreal et al.’s [
7] research explored drivers’ preferences for the placement of in-vehicle displays, revealing that their preferred layouts for the Driving Information System (DIS) and ADAS align with those available on the market. However, their study was confined to a single driving mode and overlooked the effects of autonomous driving technology on shifts in driving authority. The preferences of drivers for specific display methods do not necessarily reflect the experience across different driving tasks [
19]. Future research on in-vehicle displays should broaden its scope to include diverse driving contexts, examining how display shapes and placements influence experiences under conditions such as distracted driving. This research should be grounded in drivers’ feedback to provide an intuitive experience that goes beyond studies focused solely on specific functions.
2. User Studies
User experience studies of in-vehicle display systems are composed of two main components. The initial part involves quantitative research via questionnaires, which entails creating a survey about scenarios of distraction in the context of autonomous and manual driving technologies. It focuses on discerning users’ needs for secondary tasks performed during both manual and autonomous driving. The second segment centers on driving safety, prompting users to describe emergency situations they have encountered while driving, aiming to investigate scenarios that frequently lead to user distraction and to conduct a filtering process.
2.1. Participants and Materials
We collected 300 questionnaires (180 males and 120 females), with ages ranging from 18 to 43 years (M = 25.7, SD = 5.27), all holding valid driving licenses. Before the questionnaire, we provided participants with various backgrounds and presentation concepts of car displays, including contexts (e.g., manual driving and advanced driver-assistance backgrounds) and areas of in-vehicle display (e.g., center console, dashboard, head-up display, side windshields, etc.), presented in the form of images.
2.2. Questionnaire
The survey uses qualitative analysis to explore drivers’ backgrounds and preferences.
Table A1 shows the details. Questions 1–7 encompass basic information such as gender, age, driving experience, awareness of autonomous driving, and the frequency of distracted driving, Questions 8–9 are aimed at comparing distracted behaviors during automated versus manual driving, and question 10 investigates the in-vehicle display needs in emergency scenarios, excluding individuals who lack driving qualifications or do not meet the age criteria.
2.3. Participant Interviews
In order to investigate user experiences during emergency scenarios while driving distracted, interviews were conducted with 15 questionnaire participants (10 males and 5 females) who have experienced autonomous driving systems, aiming to identify common emergency scenarios under the context of both driving technologies, utilizing open-ended questions to guide discussions about experiences in a state of distraction and ideal solutions, and extracting and categorizing keywords pertaining to emergency scenarios from the interview content.
2.4. Results
Table 2 from the survey indicates a positive correlation between the amount of driving experience and the understanding of autonomous driving technology, alongside a negative correlation with the likelihood of never experiencing a distracted driving event. Specifically, individuals with more than four years of driving experience constitute 60.7% of the sample and have an autonomous driving technology comprehension score of M = 4.12. However, only 2.4% of them report never having encountered a distracted driving incident. On the other hand, participants with less than one year of driving experience represent 16.5% of the sample, with an average understanding of autonomous driving technology (M = 2.12), and notably, 16.2% have reported never experiencing distracted driving. This pattern suggests that as driving experience accumulates, familiarity with autonomous driving technology increases, which could potentially reduce the instances of distracted driving.
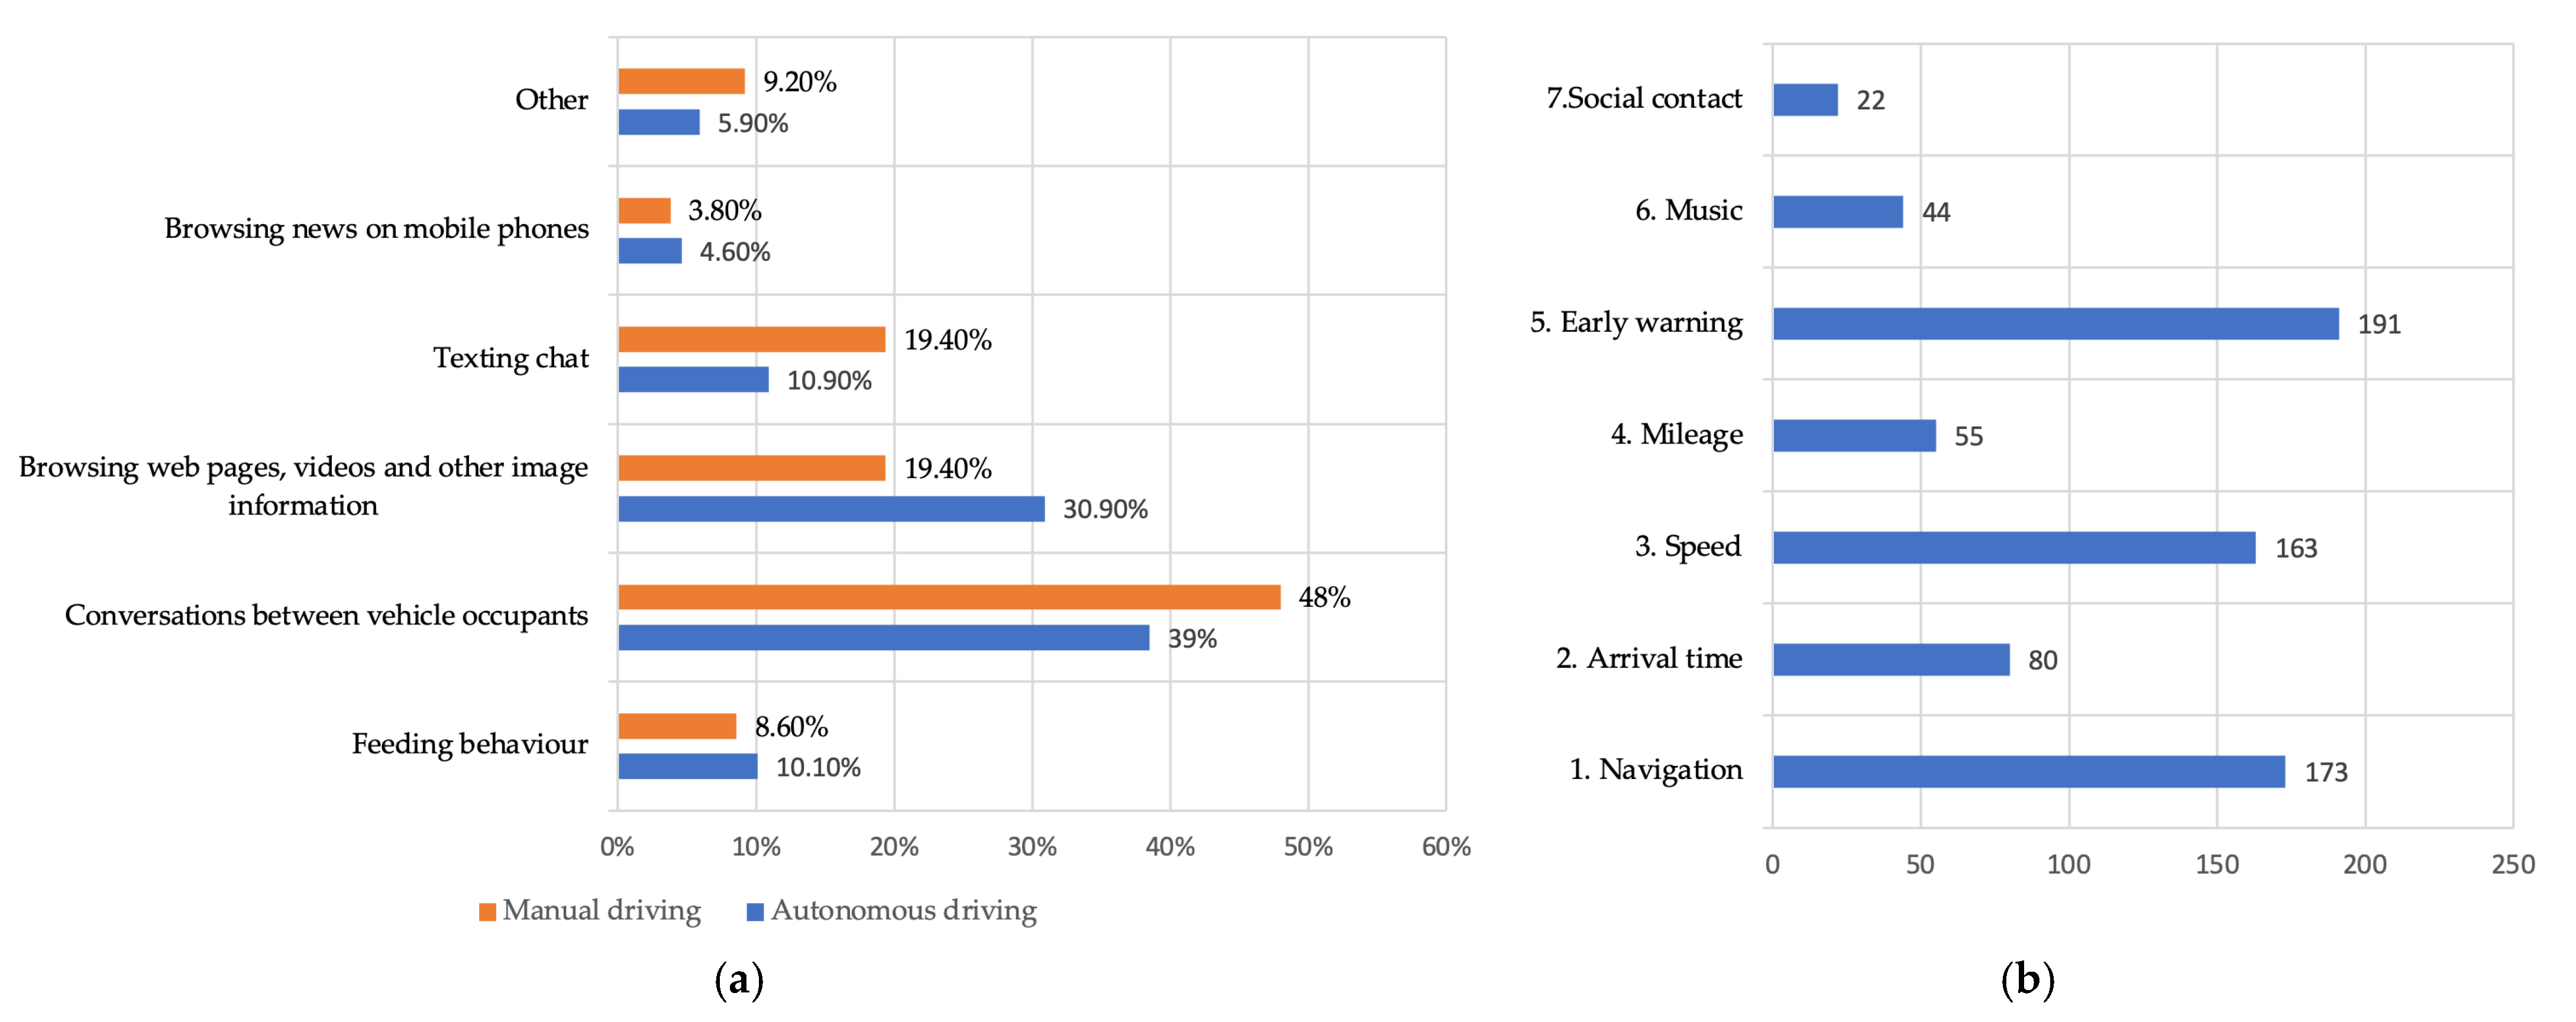
Figure 2a shows that during manual driving, conversations inside the vehicle are the primary source of distraction, accounting for 48% of distractions, followed by voice and video calls at 21%. In contrast, under autonomous driving conditions, while in-vehicle conversations remain the top distraction at 39%, the frequency of distractions related to viewing webpages and videos increases significantly to 30.9%. This highlights that irrespective of the driving mode, engaging in conversations within the vehicle and viewing webpages and videos are the most common distractions. These activities lead to a state of distraction among users in both manual and autonomous driving scenarios.
Figure 2b reveals the types of information users prioritize during states of distraction, ranked by their preferences: warning information and navigation details are tied for the most selected (191 Selections), followed by speed (163 Selections). These preferences underscore the importance of information related to the vehicle’s basic condition and the current traffic scenario. Notably, the emphasis on warning information is critical, as it helps drivers decide when to shift their focus back to driving, highlighting its significance in mitigating the effects of distracted driving. This questionnaire insightfully captures the perceptions of users with varying levels of driving experience towards autonomous driving technology, indicating that a majority of the participants possess substantial driving experience.
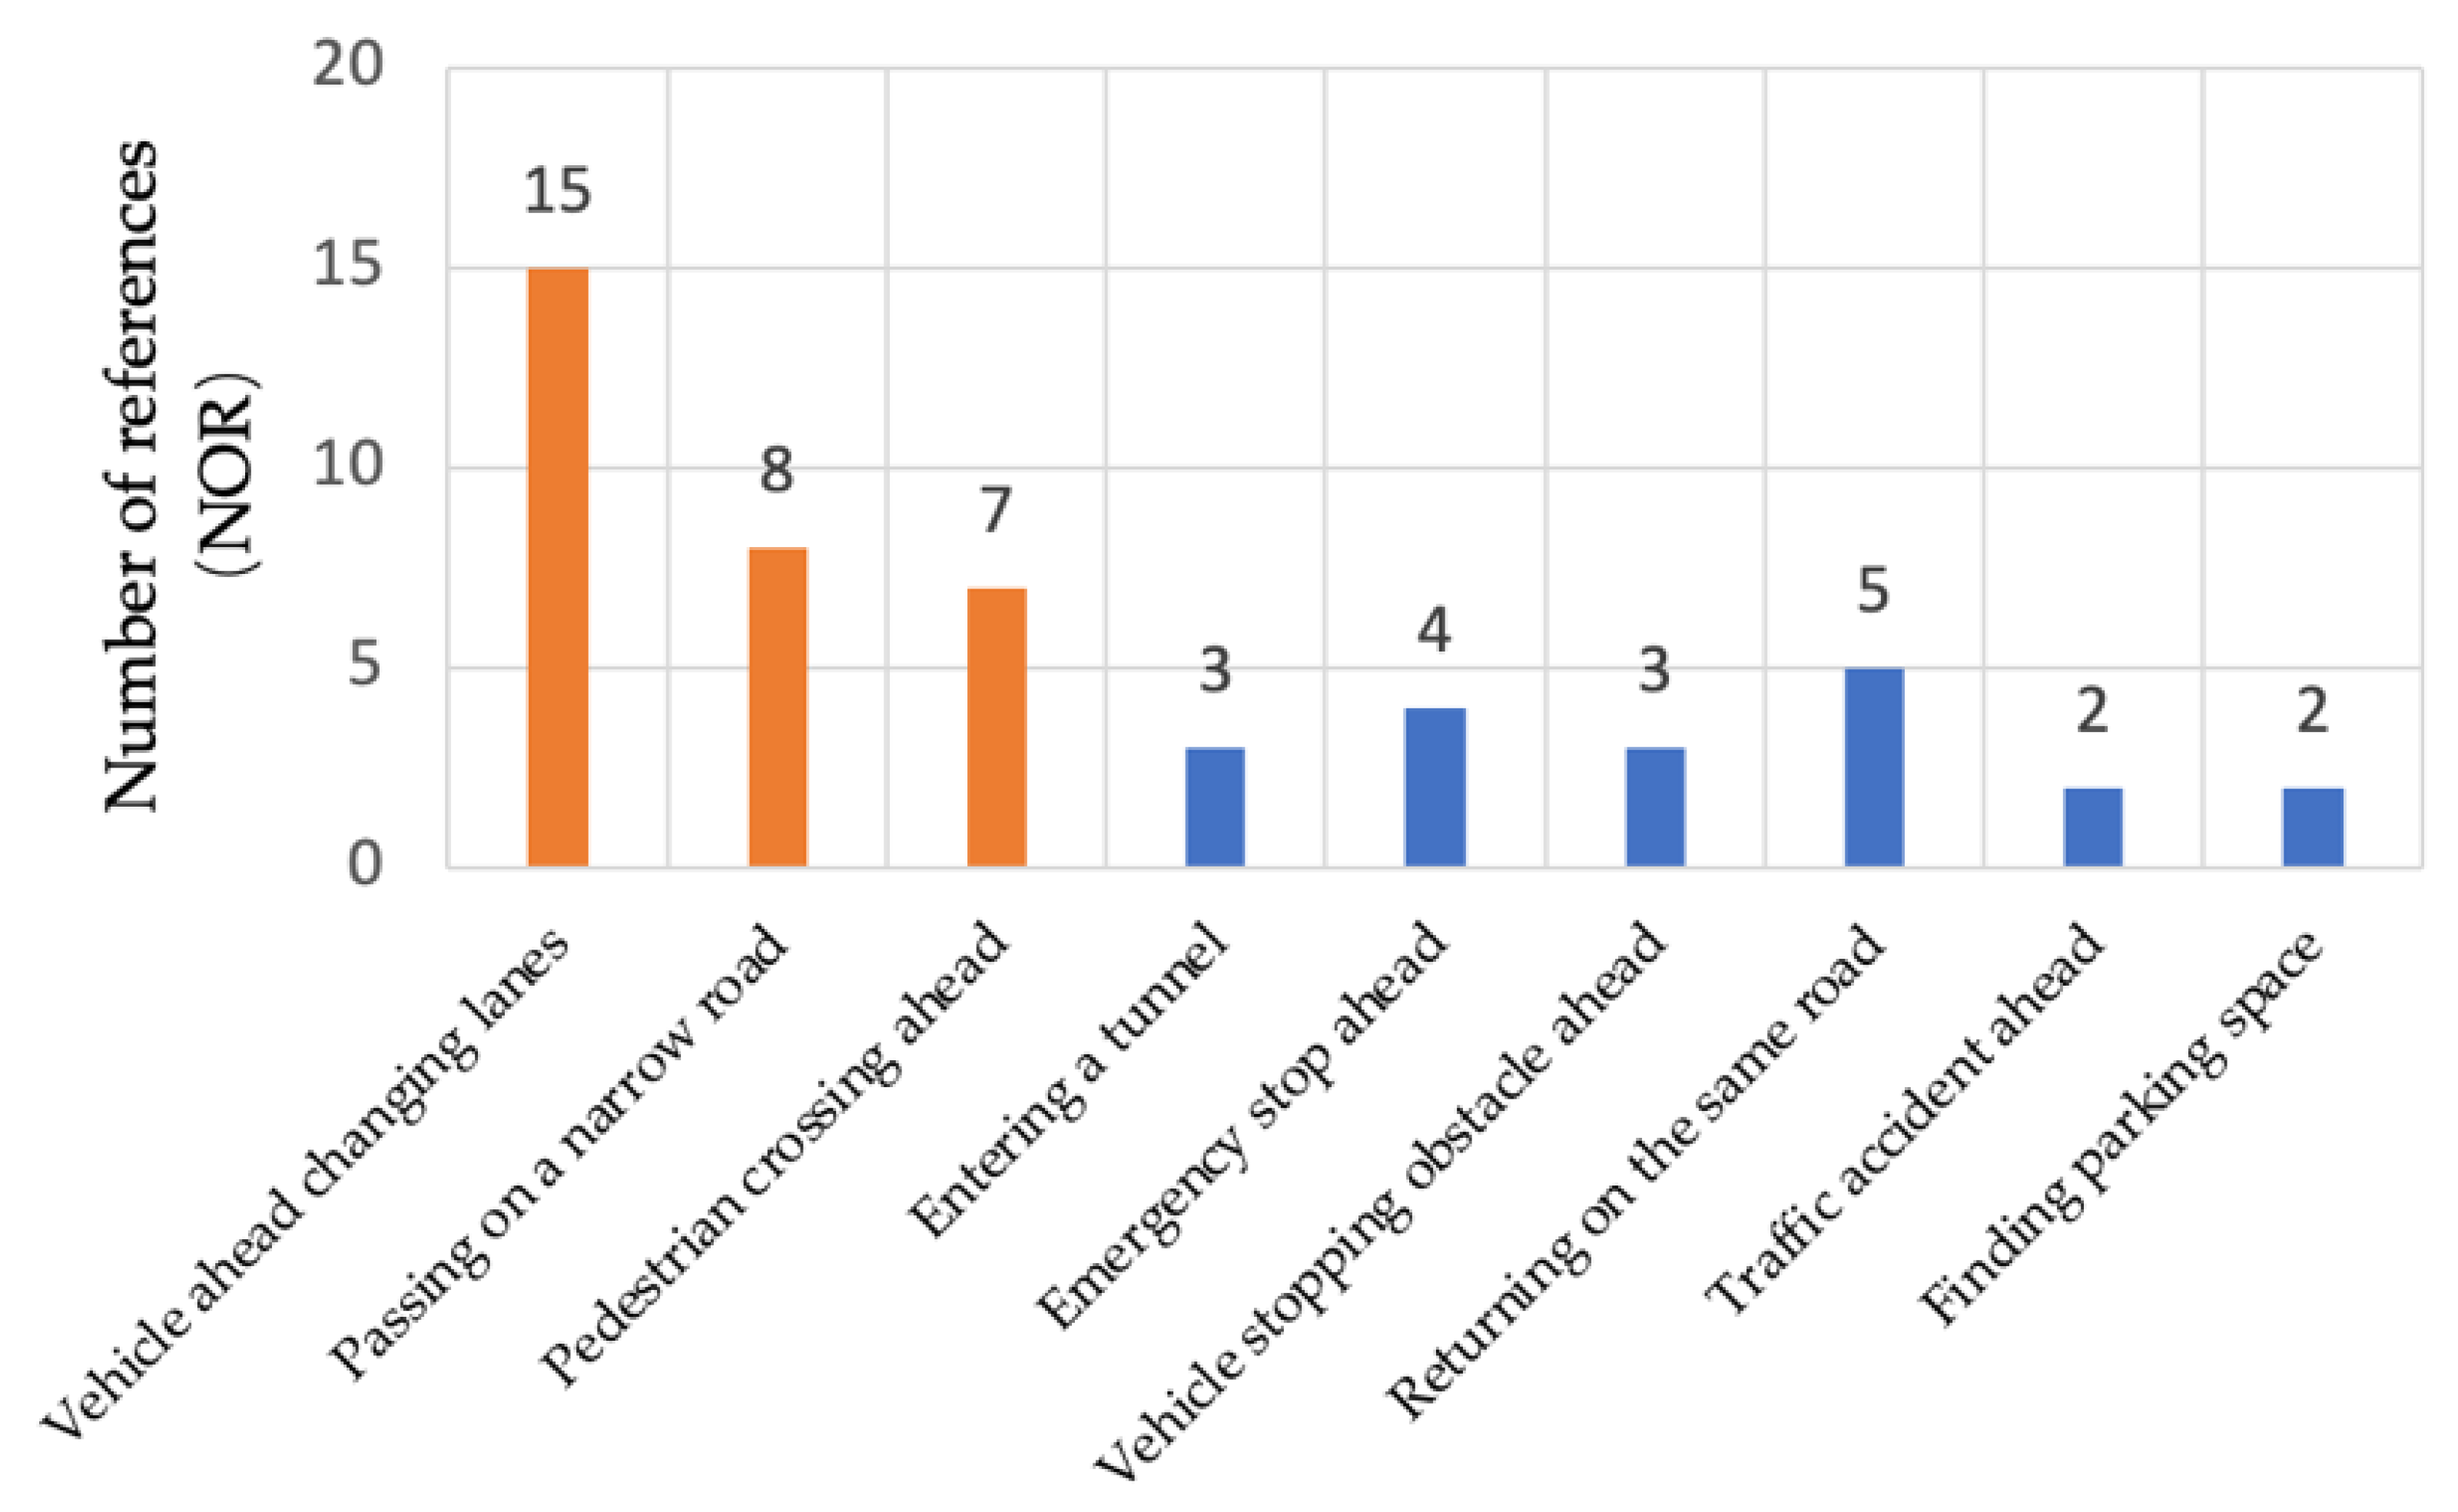
Figure 3 reveals that the information disclosed in user interviews reflects individual experiences, showing differences in respondents’ familiarity with the system and their takeover capabilities. Analysis of high-frequency words in recorded interviews found that the most difficult scenario to recognize in urban sections is sudden lane changes by vehicles ahead, mentioned 15 times. This discovery points out that in the complex urban road environment, the system depends on cameras and millimeter-wave radar for recognition, yet faces challenges in dealing with frequent occurrences, necessitating vehicle intervention. Narrow road navigation, mentioned 8 times, is the second most cited scenario, with the low obstacle recognition rate on narrow roads necessitating a shift back to driving from a state of distraction. The sudden appearance of pedestrians or other motor vehicles ahead, mentioned 9 times, is the third scenario. Although the system provides warnings and automatically deals with it, drivers frequently intervene, highlighting the critical reference value of this situation.
3. Experiment on Display Preferences during Distracted Driving Activities
As outlined before, drivers require accessing information via in-vehicle displays during distracted driving to resume control. The purpose of the experimental test is to confirm the preferences of drivers for various in-vehicle displays, offering ideas for analyzing the influencing factors on user preferences for in-vehicle displays within the context of autonomous driving.
3.1. Method
This experiment, carried out within a simulated driving environment, aims to quantitatively assess drivers’ preferences for different display methods during autonomous driving, employing the Analytic Hierarchy Process (AHP). It meticulously records the time from the onset of distraction to the initiation of takeover actions, utilizing computerized tracking to directly measure the effectiveness of driver takeovers. The goal is to gain a comprehensive understanding of users’ attitudes and preferences towards various display methods under autonomous driving conditions. The study opts for a simulation driving platform over a real-world driving environment. This approach is designed to reduce the impact of subjective biases on the experimental results, ensuring that the findings more accurately reflect the efficiency of display methods in supporting driver takeover in autonomous vehicles.
The AHP, proposed by Saaty, is a method that evaluates decision-making by breaking down the problem into a multilevel structure of objectives, criteria, and alternative options [
20]. Utilizing the AHP allows for the quantification of the relative importance of in-vehicle display areas, with higher weights signifying greater priorities.
To investigate the impact of in-vehicle display system performance in a distracted driving environment, this study identifies driver reaction time as a key metric for assessing distracted behavior. According to studies by Kumar et al. [
20], this approach not only facilitates the evaluation of various display methods’ applicability but also provides a means to quantify the duration from perception to response in emergencies for drivers. Driver reaction time refers to the time required from perceiving an emergency to initiating a response. Therefore, a shorter reaction time implies that the display system can alert the driver more quickly and effectively focus their attention on driving. Participants are required to quickly press the space bar in response to predefined distracting scenarios, thereby interrupting the distraction and regaining control. This method evaluates the attention-directing efficacy of in-vehicle displays in emergencies, providing a scientific basis for developing more effective display systems.
3.2. Experimental Design
3.2.1. Experimental Setup
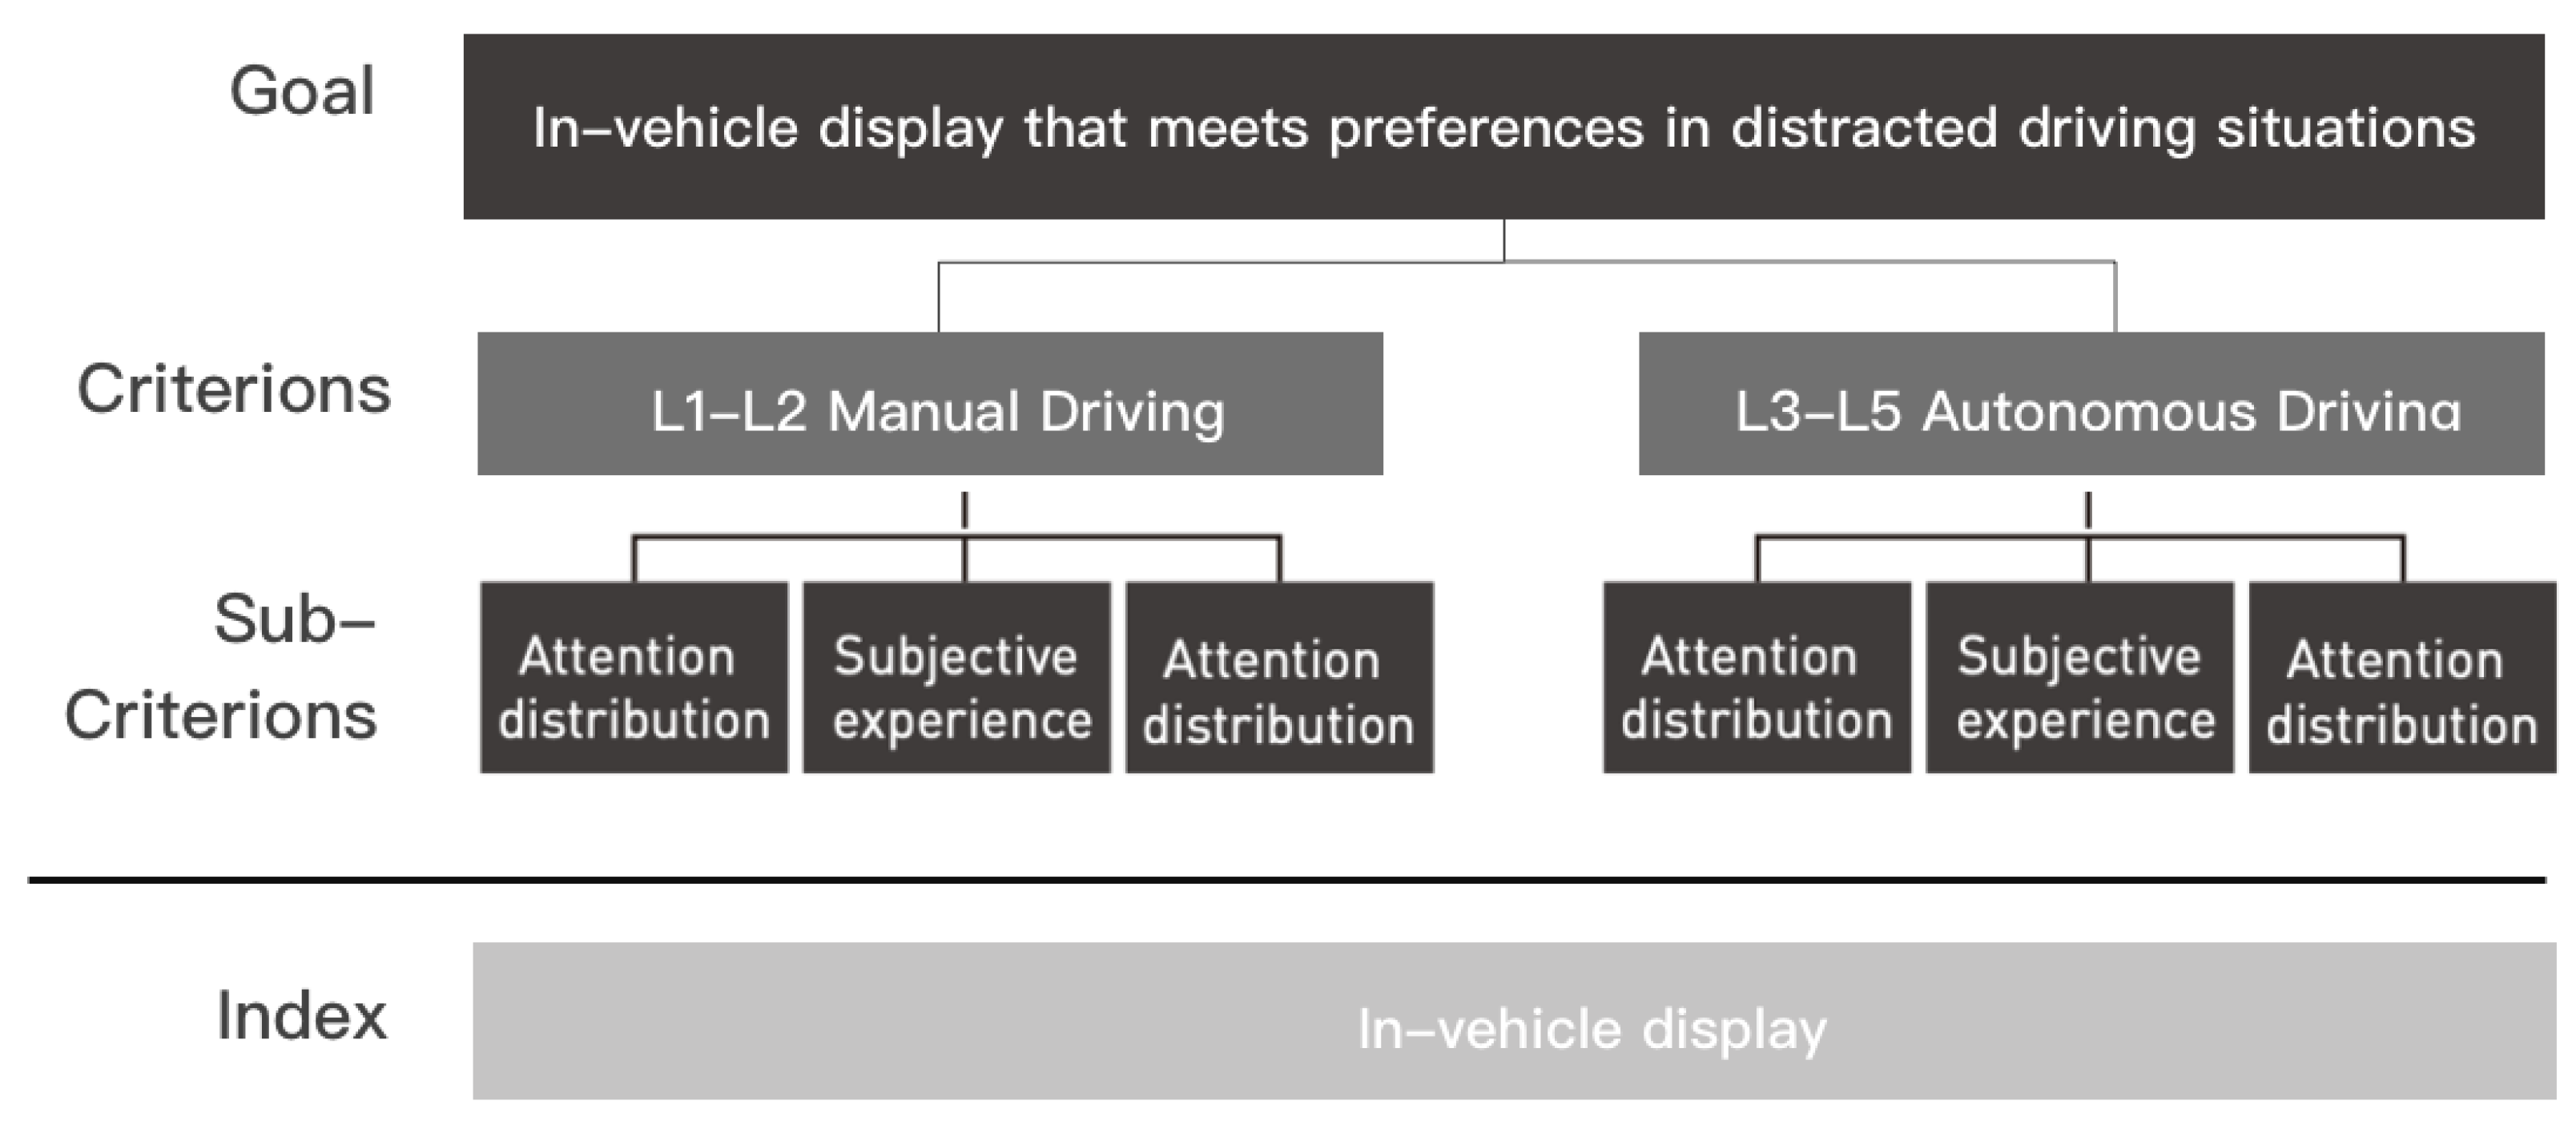
The AHP dissects decision issues into a tiered framework comprising objectives, standards, and alternatives for analysis [
20]. Within the criteria tier, it is segmented into two primary groups. Given that Level 2 vehicles come with driver-assistance systems offering limited warnings and temporary aid, Level 1 to Level 2 vehicles are categorized under the manual driving group.
In contrast, Level 4 to Level 5 vehicles, not requiring traditional driving controls like steering wheels or pedals, are deemed highly automated vehicles. Despite Level 3 systems needing human intervention for incomplete tasks, given their automation, Level 3 to Level 5 vehicles are consolidated into the autonomous driving experiment group. This categorization considers the prolonged use of the vehicle, foreseeing that various automation levels of vehicles will coexist in mixed traffic settings for years to come [
21].
Figure 4 shows that in the sub-criteria layer, three evaluative dimensions are established: attention, subjective experience, and situational awareness. The intent of these dimensions is to holistically assess user preferences towards in-vehicle systems [
22].
3.2.2. Interface Design and Simulation
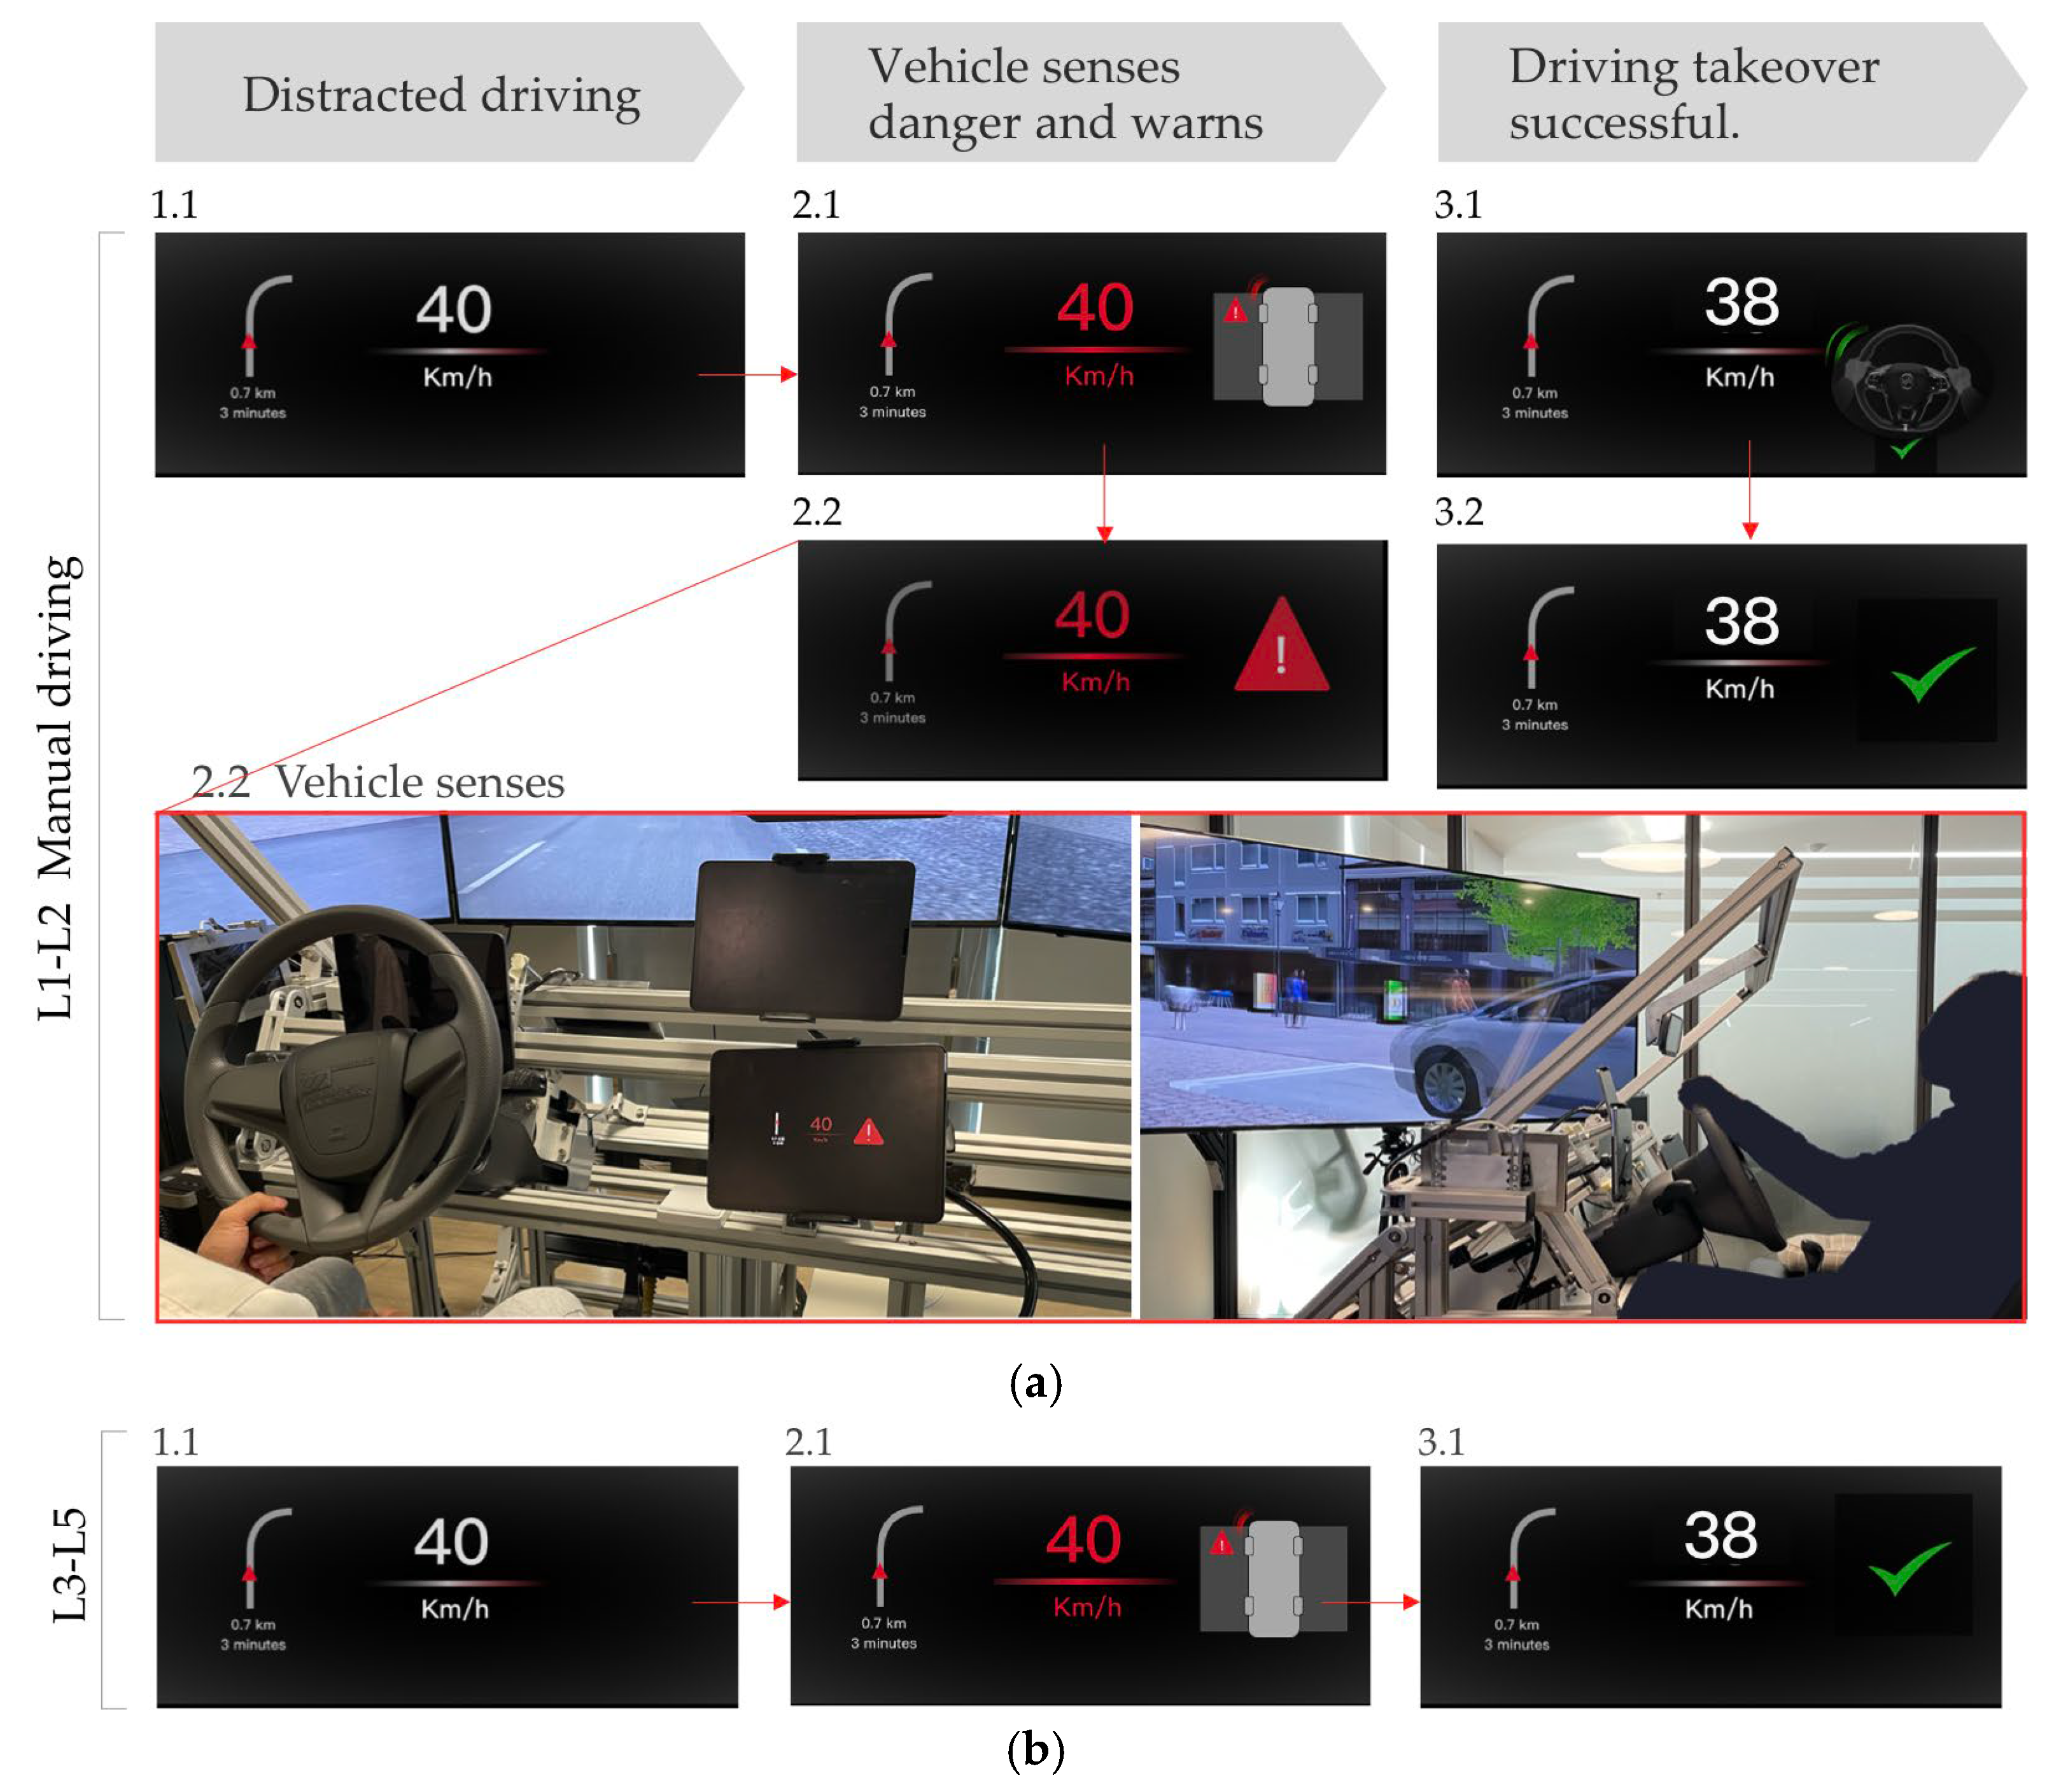
Figure 5a,b’s interface prototype is designed from questionnaire findings, incorporating the in-vehicle information elements most crucial to drivers during distracted driving situations. Centered on enhancing safety, the design foregrounds information types often needed during distracted driving, like navigation, speed, and alerts. The interaction process of the prototype is segmented into three principal phases: 1, it shows standard driving information during distracted driving; 2, it provides real-time warnings through the interface when potential dangers are detected, enabling immediate driver response through the steering wheel; 3, upon driver takeover, it presents pertinent safety information and symbols for driving safety assurance.
Regarding the presentation of information, the design upholds uniformity in the size of areas, content of information, and methods of control to guarantee that identical information is shown for the same length of time in various areas [
21].
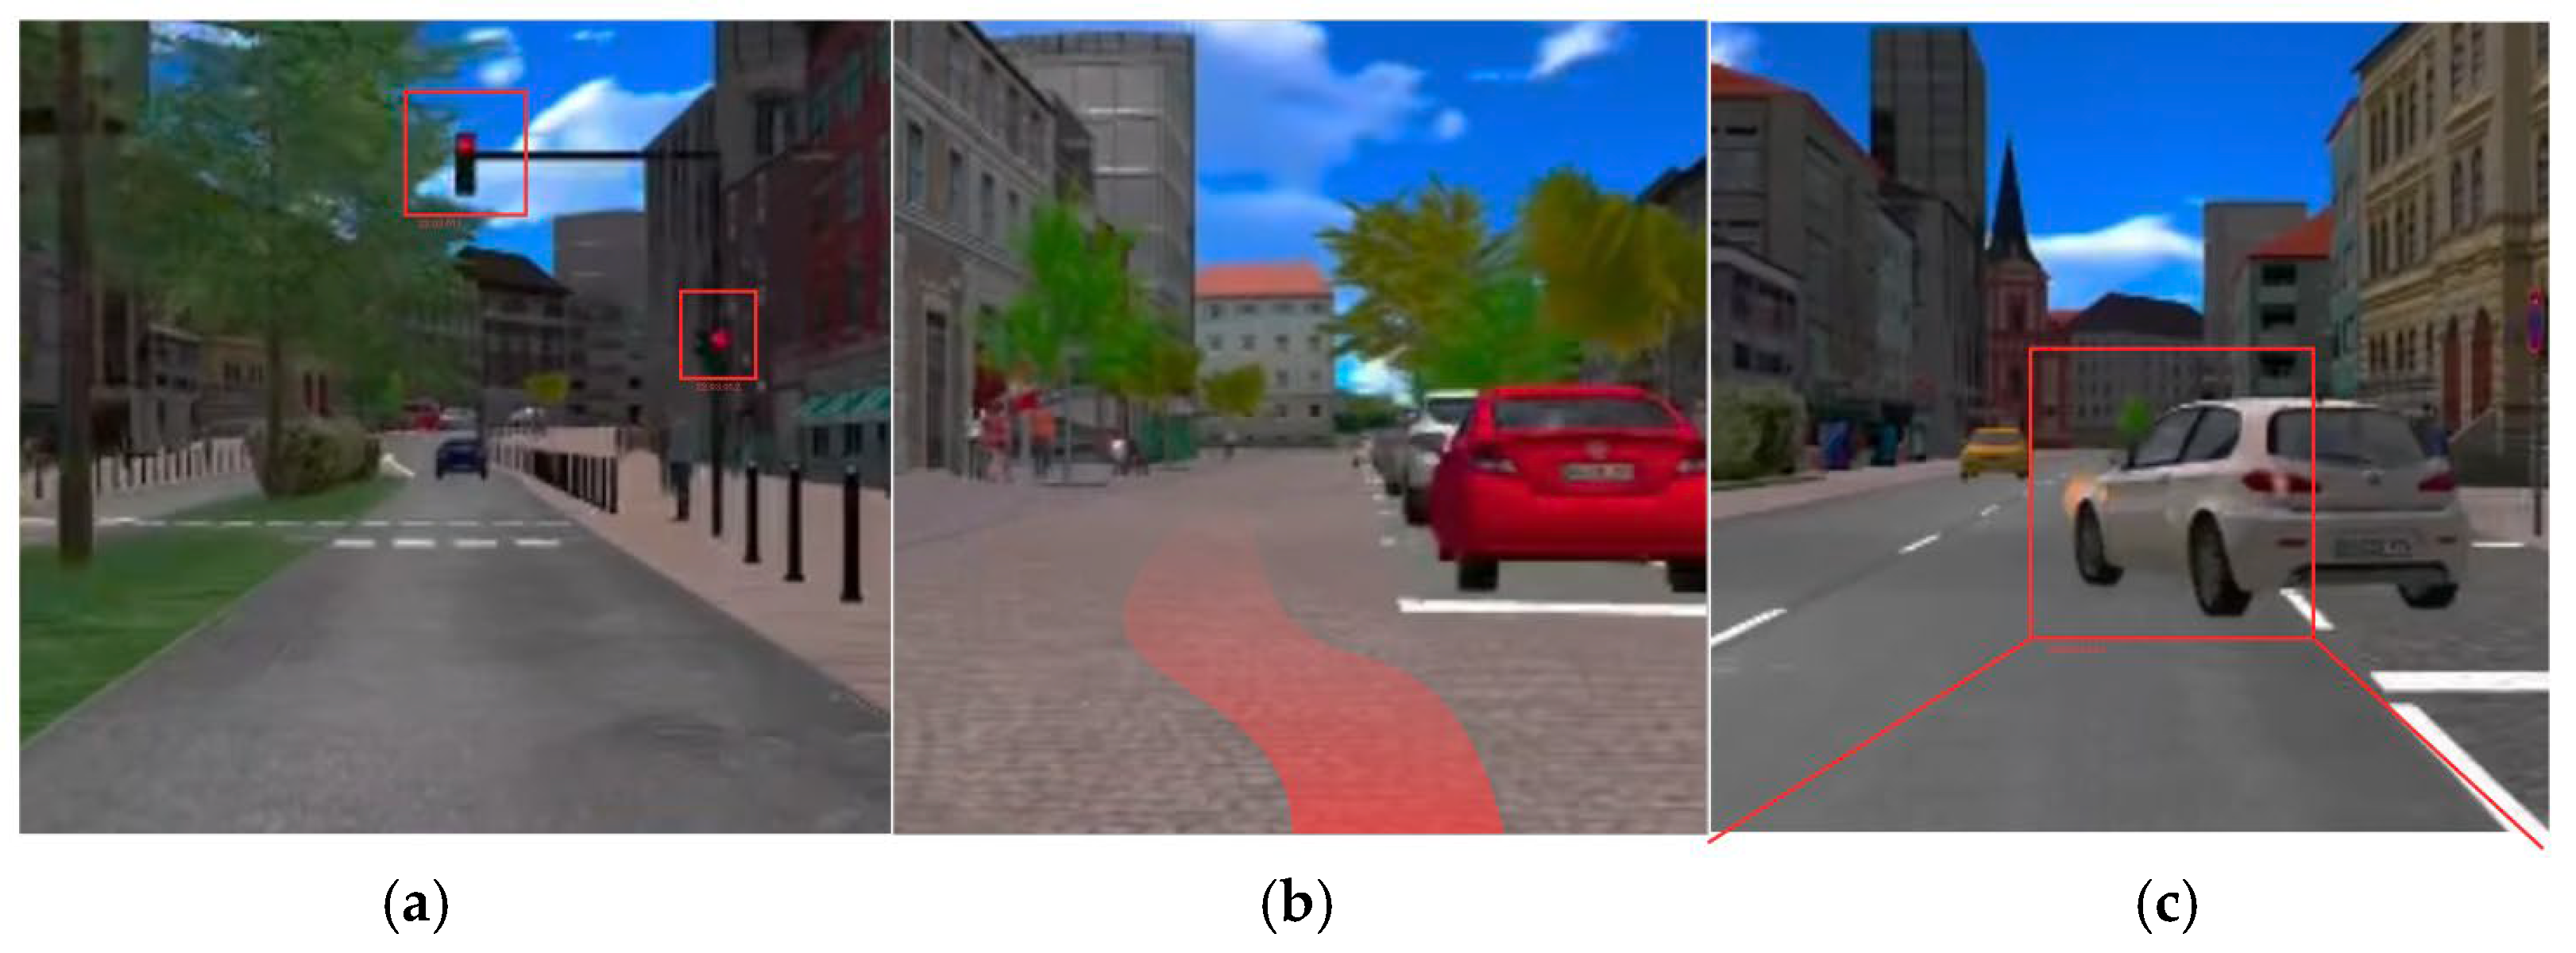
The driving simulation equipment uses SILAB (version 6.0), produced by the Würzburger Institut für Verkehrswissenschaften. Participants can experience various scenarios configured in advance and provide close-to-real driving experience. In the design of the experimental prototype’s environmental setup, a focus was placed on the emergency scenarios referenced during the user survey phase, particularly the three most commonly mentioned emergencies highlighted in
Figure 6, which serve as critical components of the experimental setting. These scenarios are: (1) emergency braking in response to suddenly appearing traffic signals, (2) lane-changing actions of vehicles in front, and (3) passage through narrow roads. By employing a simulated driving environment, the design leverages its superiority to real driving by enabling flexible configuration and adjustment of urban road scenes, thus accurately replicating the stated emergency situations. To ensure an immersive experience, each scenario is designed to last for about 2 min, and each in-vehicle display area will sequentially go through these three scenarios.
3.2.3. Establishment of In-Vehicle Display Areas
Within the framework of the AHP model, a comprehensive assessment of simulated in-vehicle display devices focuses on encompassing a wide variety of display types. The simulation driving platform features HUD, window displays, and the ubiquitous central displays and dashboards. Given the diversity in automotive design and variations in configurations, the study implements a strategy that consolidates current layouts and marks distinct display areas from Display A to E, enabling straightforward analysis and comparison. Moreover, the research specifically notes that choosing in-vehicle display devices does not aim to exhaustively cover every brand’s design solution [
23]. For example, although speed information is commonly shown on the dashboard, it can also be located on the central display, suggesting that certain information might be duplicated across several display devices [
24]. The study also omits specific unique display devices like humanoid robots and electronic rearview mirrors to ensure the evaluation’s broad applicability and utility.
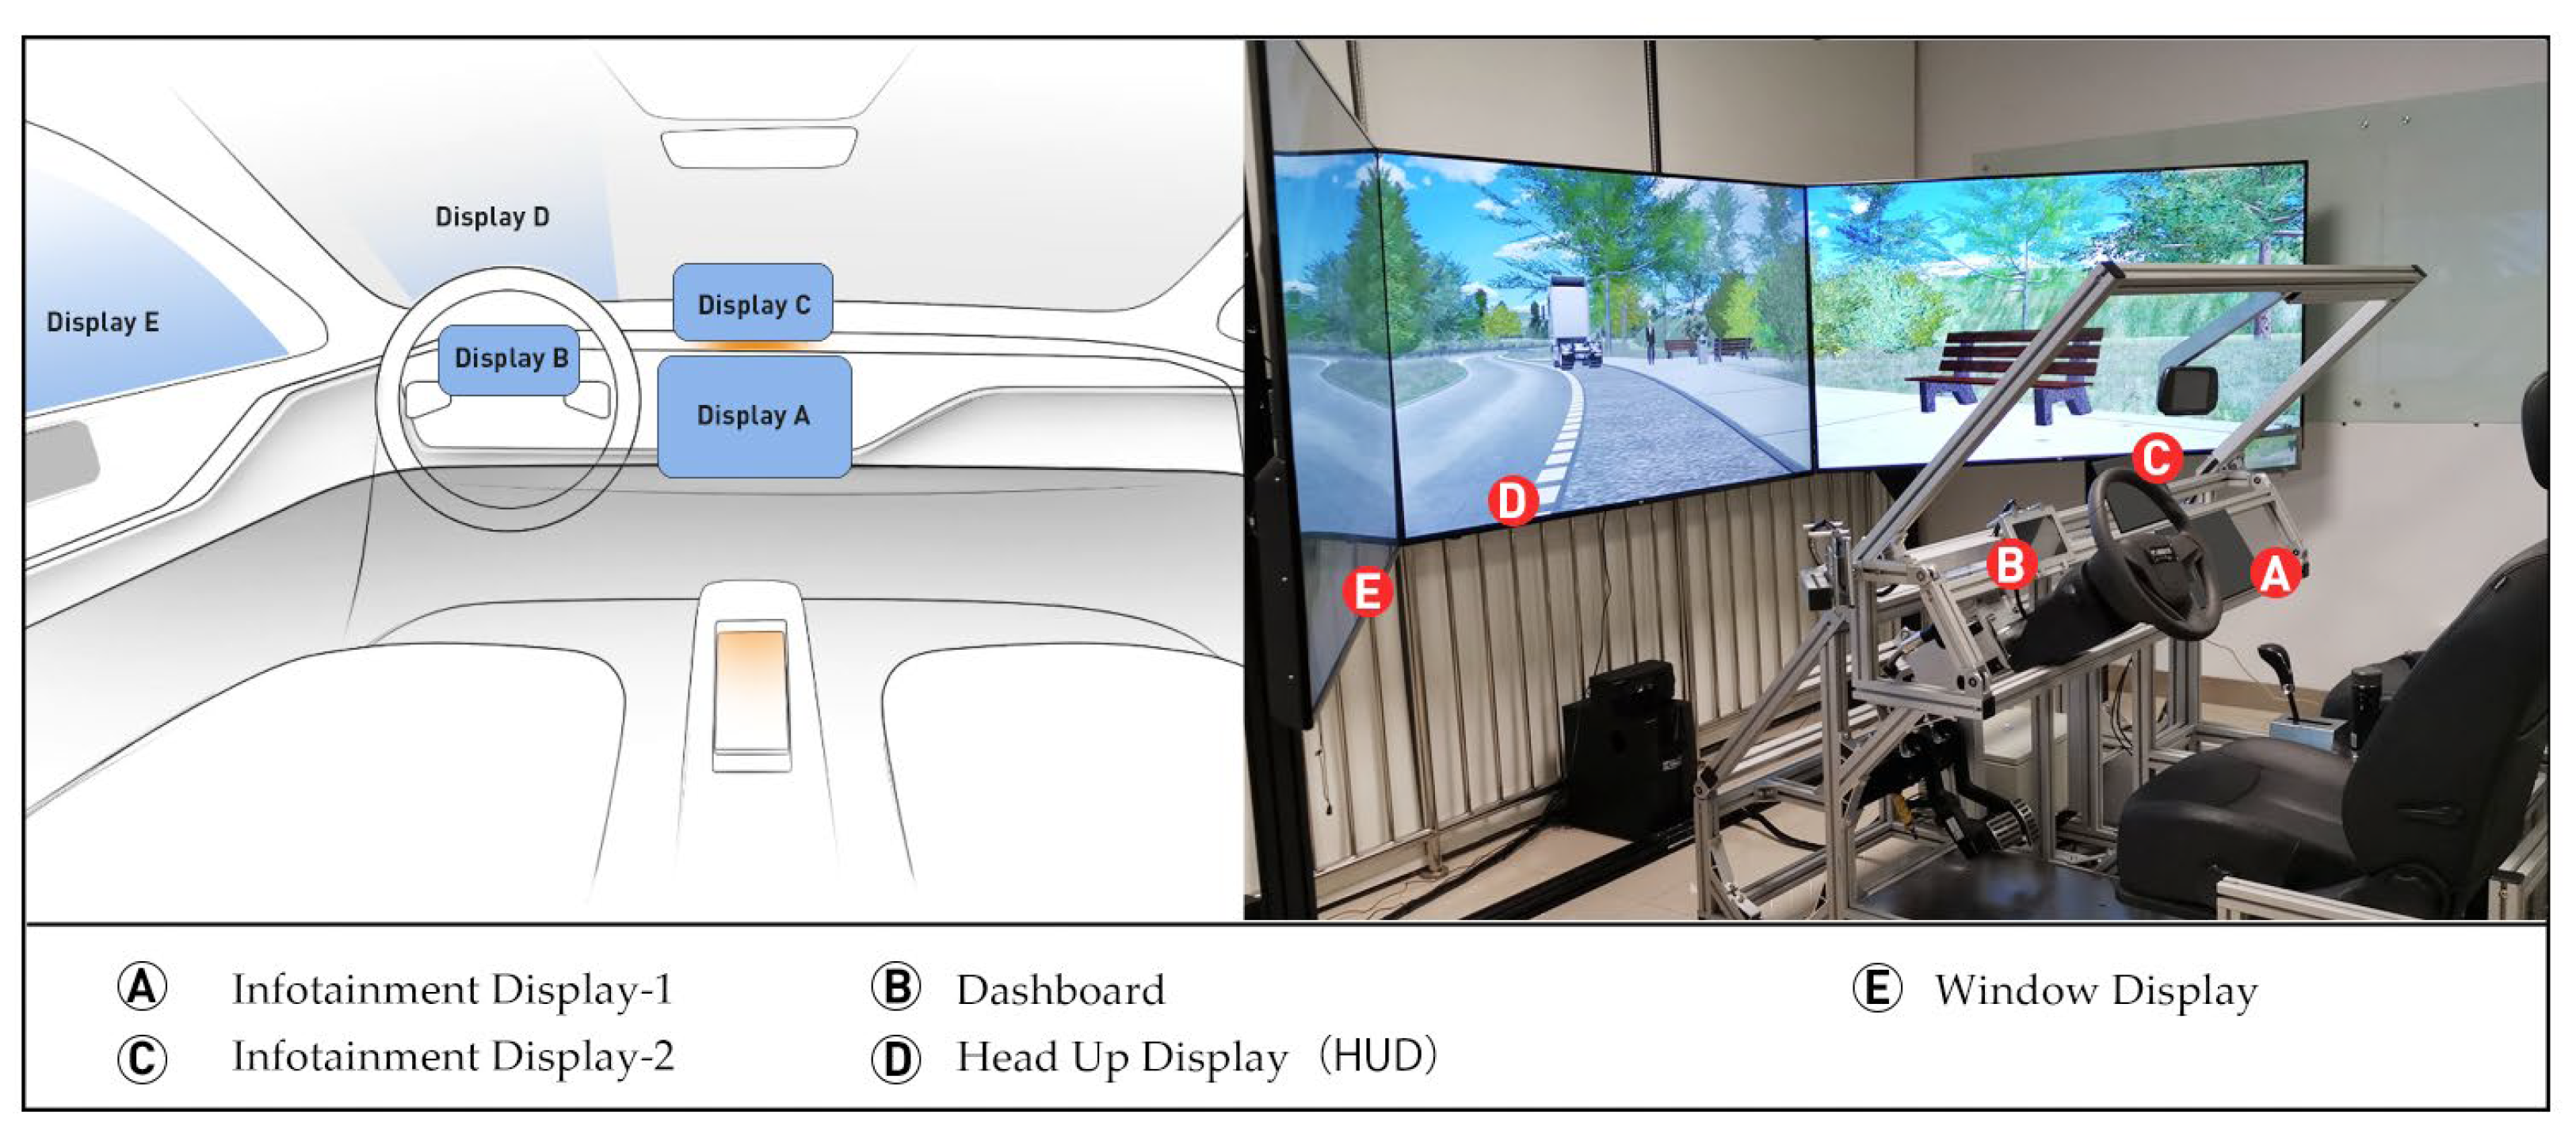
As illustrated in
Figure 7, by integrating general displays, a display layout was created for a simulated environment, where key information was then displayed.
Given the limited number of display devices on the simulator, the study utilized iPads as substitutes for certain displays. More specifically, Display D (HUD) and Display E (window display) utilized a special method of displaying information directly on the large displays of the simulator. Display B functioned as the dashboard, with Display A and Display C serving as two distinct types of central display options. This layout is intended to mimic the display environment within actual vehicles, making it easier to assess how various display methods affect the driving experience.
3.2.4. Participants
The study involved 20 participants, comprising 15 men (Mean Age = 37.90) and 5 women (Mean Age = 29.5), who were selected and recruited via a questionnaire survey aimed at customers meeting the criteria for driving. All participants satisfied the preliminary screening conditions of possessing over a year of practical driving experience and having good eyesight (corrected vision included). This experiment received approval from the Ethics Review Committee of Huizhou Desay SV Automotive Co., Ltd. (Huizhou, China).
3.2.5. Procedure
This experiment utilized a repeated measures design, aiming to provide each participant with the opportunity to experience five different display designs. The experimental procedure is divided into five steps:
Introduction and Orientation: Participants are introduced to L1–L2 level manual driving and L3–L5 level autonomous driving through a video. The training video, aiming for a consistent understanding of driving speed and distance among participants, showcases road scenarios similar to those in the experiment, keeping a steady driving speed (40 km/h) and distance without showing any in-vehicle display designs.
Simulated Driving Experiment: Participants navigate through different in-vehicle display designs via a driving simulator, with each segment lasting approximately 2 min. Observers note the reaction times of participants to driving scenarios, evaluating their capacity to prevent collisions with vehicles or pedestrians. Each display design undergoes a single test, with the sequence of the five display types randomized to reduce systematic bias.
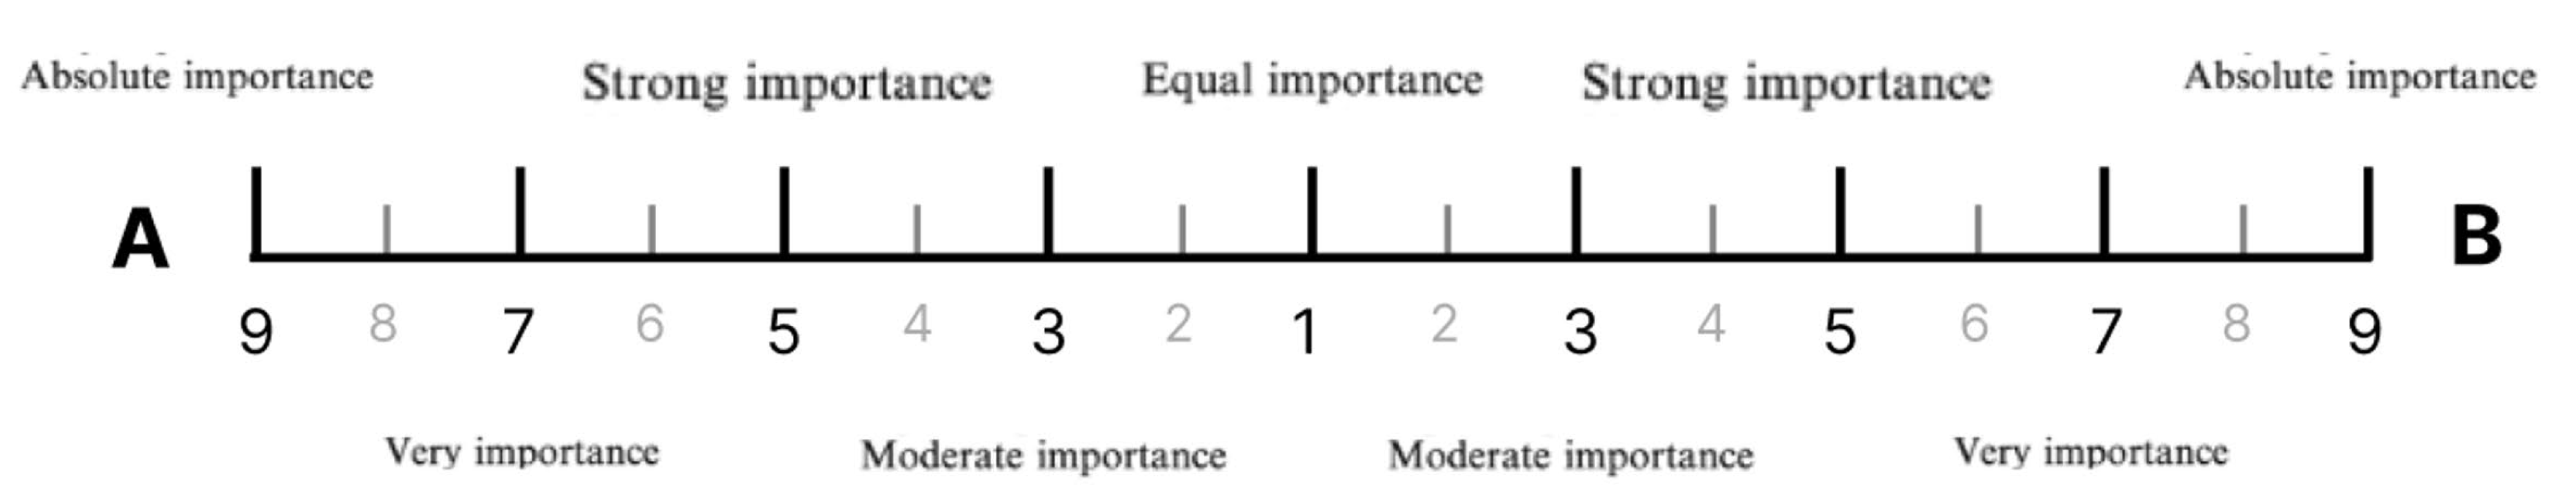
Assessment and Rating: Upon the completion of each test round, participants perform pairwise comparisons on the importance of various factors and assign scores within the questionnaire, as depicted in
Figure 8. The scoring utilizes a 9-point scale, with 1, 3, 5, 7, and 9 denoting equal importance, slightly important, moderately important, very important, and absolutely important, respectively; scores of 2, 4, 6, and 8 represent intermediate importance levels between these rankings. The scoring scale’s left side indicates the left-column factor as more important than the right-column factor, and the right side indicates the opposite.
3.2.6. Data Collection and Analysis
The AHP utilizes an importance scale for forming pairwise comparison matrices, leading to ten unique combination methods once duplicates are removed. The data undergo normalization processing in matrices through Statistical Product and Service Solutions (SPSS), utilizing a formula wherein n represents the matrix’s order,
A represents the judgment matrix, and
wi is the weight for the
i indicator.
Upon completion of each round of the driving simulation, participants are required to score the importance of various indicators through a survey. These scores are utilized to create a pairwise comparison judgment matrix. The weights of the indicators are derived by computing the largest eigenvalue of this matrix. For instance,
Table 3 shows participant D30’s preference ranking for five distinct areas, as presented below.
Initially, the largest eigenvalue
λmax = 5.0463 of the judgment matrix is determined. Subsequently, to ascertain data consistency, it is essential to conduct a consistency test, which involves calculating the Consistency Index (
CI), as follows:
Subsequently, utilizing the Average Random Consistency Index, the Random Consistency Ratio (
CR) is computed. Given that the
CR is below 0.1, the judgment matrix’s construction is deemed to be acceptable.
The analysis included key indicator weights such as attention distribution, subjective experience, and situational awareness.
Table 4a specifically indicates that situational awareness, being a focal point in distracted driving studies, has the highest weight, especially significant in manual driving (0.6232).
Using participant D30 as a case study, we derived the composite scores for the manual and autonomous driving stages by multiplying and summing various weights. Data from
Table 4c reveal that for participant D30, within both the manual and autonomous driving groups, Display D consistently leads in the composite score rankings across both stages (L1–L2: D > C > B > A > E; L3–L5: D > E > C > B > A). The experiment included 20 participants. For the other 19 participants, we similarly performed weight calculations and aggregated composite scores to evaluate their preferences towards different display areas.
4. Results and Analysis
Statistical analysis revealed that 20 participants evaluated five distinct in-vehicle display prototypes. One-way ANOVA on the L1–L2 group scores showed a significant main effect (F = 18.83,
p < 0.0001), demonstrating significant variations in participant ratings for the in-vehicle display prototypes.
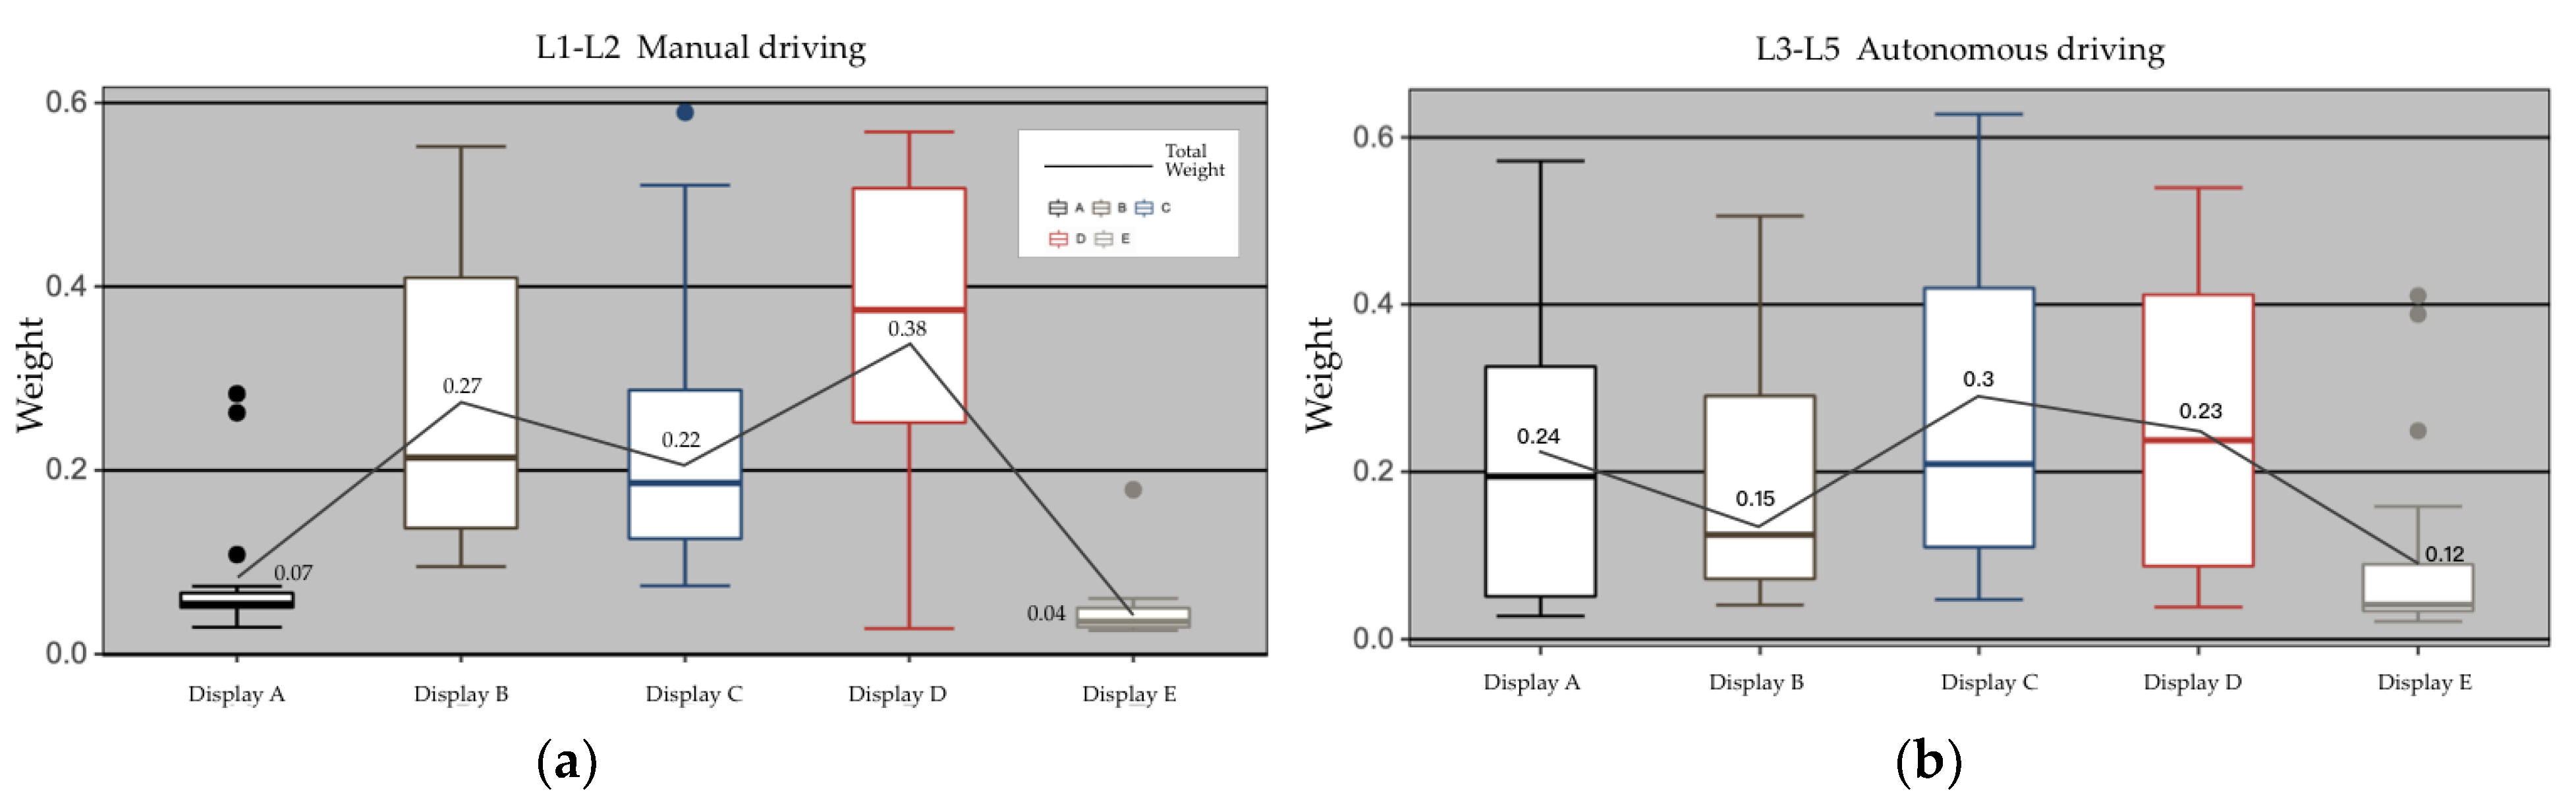
Figure 9a graphically illustrates the Composite Weights (CWs) for five manual driving positions L1–L3, intuitively ranked as D > B > C > A > E. Further validation of the data through post hoc pairwise comparisons (Tukey), presented in
Table 5a, revealed that Display D (HUD) (CW = 0.36) significantly outperformed Displays A, C, and E. Display B (dashboard), representing a traditional display approach, was ranked second (CW = 0.27), showing a significant edge over Displays A and E. Displays E (window display) and A (central display 1) were less favored, trailing behind the other displays in preference. Following the simulated driving, supplementary interviews revealed that user (D22) appreciated Display D (HUD) for its frontal positioning, dominating the driver’s visual field beyond the road scene, and noted that merging display information with the display could increase its appeal.
For levels L3–L5, one-way ANOVA results (F = 2.101,
p = 0.0867) indicated that the main effects of evaluations across different display solutions did not achieve statistical significance.
Figure 9b graphically displays the Composite Weights for five manual driving positions L1–L3, with an intuitive preference ranking of (C > D > A > B > E). A visualization analysis of the box plot indicated a non-normal distribution in the scoring data. Display C (central display 2) possessed the highest Composite Weight (CW = 0.24), and Display E (window display) possessed the lowest (CW = 0.102), yet these findings did not demonstrate statistically significant differences.
Table 5b indicates that the post hoc Tukey comparison also failed to reveal significant differences in user preferences. These results suggest that, in autonomous driving modes, participants did not show significant differences in their preferences for different in-vehicle display methods.
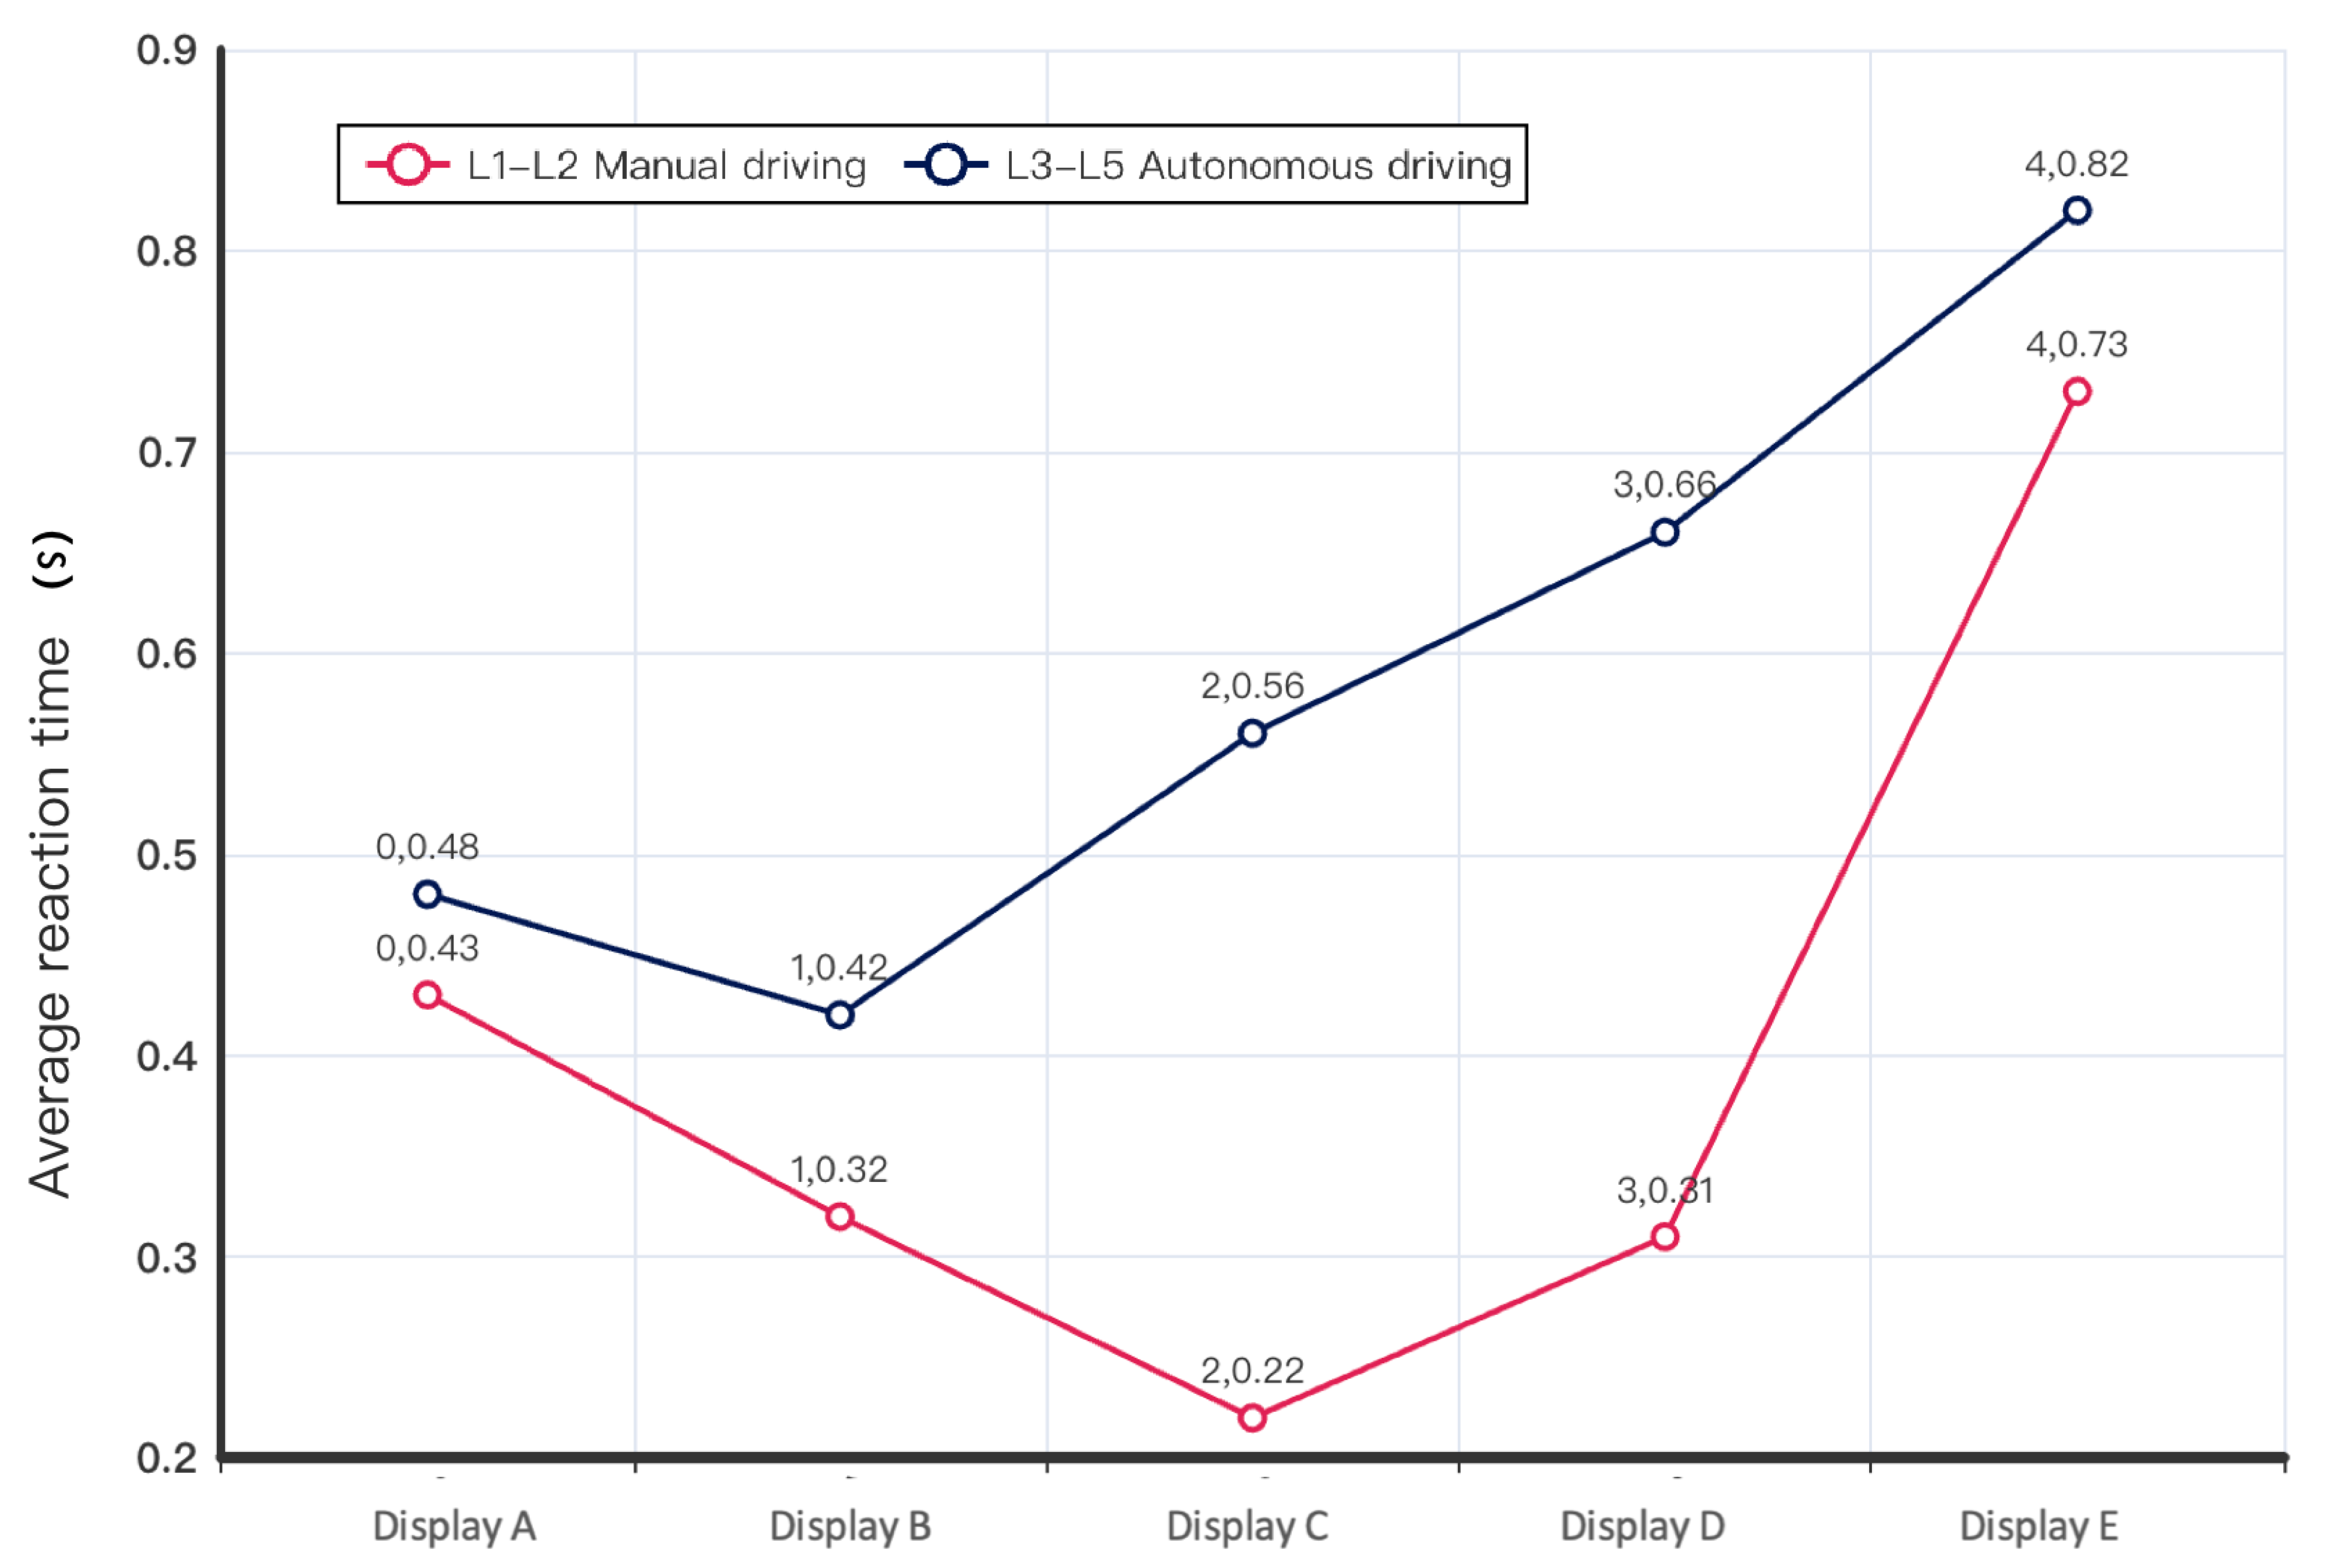
In the context of distracted driving, statistical analysis of takeover reaction times revealed significant differences for L1–L2 reaction times (F = 22.5,
p < 0.0001), according to a one-way analysis.
Figure 10 intuitively displays the advantage of Display C (central display 2) and Display D (HUD) in the L1–L2 manual driving groups, aligning with their leading positions in user preference ratings. This corroborates Yoonsook Hwang’s research conclusions that HUDs can improve user experience and perception by lowering reaction times [
25]. Conversely, Display E (window display) recorded the longest reaction time score (S = 0.73), indicating its reduced effectiveness and aligning with its lower position in user preference ratings, further validating the lack of popularity for window displays among users.
Within the L3–L5 autonomous driving groups, reaction time data across five positions (F = 1.125,
p = 0.3567) did not exhibit significant variability. The findings suggest that the efficiency of subjects during takeovers was comparable and that all in-vehicle displays equally contribute to improving user response performance. Visual analysis from
Figure 10 demonstrates that the average reaction time for takeovers in the autonomous driving group exceeds that of the manual driving group, indicating that advancements in autonomous driving technology could decelerate users’ takeover reaction times.
5. Discussion
As autonomous driving technology advances, there is a gradual shift in driving modes, but research on in-vehicle displays has been largely confined to traditional driving contexts. Hence, it is essential to investigate the information display requirements of drivers when distracted in the context of advanced autonomous driving. This research endeavors to bridge this gap by examining drivers’ preferences across multiple in-vehicle display settings and incorporating objective measures like takeover times to substantiate discoveries. (1) HUDs show a distinct benefit in emergency takeover scenarios during manual driving, but this advantage is less pronounced in autonomous driving situations. (2) Window displays are consistently unpopular across all technological phases. (3) Within advanced autonomous driving settings, despite variances in design and information presentation, the effectiveness of different displays in garnering user preferences is comparable. Nevertheless, it is important to acknowledge the limitations of this study, such as laboratory simulation conditions, choice of metrics, prototype designs, and individual variations among participants, which could all impact the generalizability of the findings.
Limitations in laboratory and equipment restrict the realization of a more authentic driving simulation experience. Consequently, our primary method involved dynamic video simulations of urban roads to assess drivers’ preferences for in-vehicle display systems, excluding scenarios such as high-speed or mountainous terrains, potentially not capturing the full spectrum of natural driving environments. Hence, future studies ought to encompass driving environments beyond urban areas and involve a larger pool of participants for more precise and objective data gathering. Regarding the observation of driving behaviors, the impact of existing habitual methods on users’ future preferences has not been explored through intuitive experience, rendering the prediction of scenarios and habits in future distracted driving contexts challenging.
The AHP serves as a method to document users’ intuitive experiences, primarily depending on scoring through questionnaires completed after the experience, which might lead to biases due to its delayed selection. Moreover, evaluations of user preferences could be impacted by the specific backgrounds of participants, such as age and driving habits. Future research should encompass a wider range of user demographics to bolster the universality of findings and provide deeper insights into various user groups’ display preferences in autonomous vehicles. Additionally, the scope of objective metrics is relatively restricted, as only the reaction time for takeovers has been analyzed statistically. Future studies should investigate additional data indicators, like in-vehicle display glances, blinking rates, and pupil sizes, to create a more elaborate assessment framework. Furthermore, apart from drivers’ visual features, the assessment system could also take into account driving behaviors and vehicle control data of the drivers.
This study concentrates on investigating drivers’ preferences for in-vehicle displays against the backdrop of autonomous driving, with a special emphasis on HUDs and window displays as key points of interest in industry research. Both questionnaires and experiments were designed with a focus on distracted driving. Subsequent efforts grounded in the findings of this study will aim to explore diverse configurations and technological integrations of in-vehicle displays to cater to passengers’ informational requirements.
6. Conclusions
In this study, we conducted comprehensive comparative experiments to assess differences in users’ display preferences. The main conclusions drawn from our research findings are as follows:
We confirmed that the experimental parameters could effectively differentiate the differences among five types of in-vehicle displays. The results indicated that, during the manual driving phase, Display D (HUD) scored significantly higher than Displays A, C, and E, and had an advantage in terms of reaction time user experience, suggesting that it might be the preferred in-vehicle configuration during manual driving stages, capable of mitigating distractions, aligning with drivers’ intuition, and fulfilling the needs of distracted driving. Conversely, in the autonomous driving phase, despite Display C (Center Console Screen 2) having the highest overall weight (CW = 0.3), statistical outcomes failed to effectively demonstrate distinctions among in-vehicle displays, indicating no significant preference among participants for different in-vehicle displays during autonomous driving. Despite the emergence of new display devices, it does not mean traditional display methods will be phased out. Instead, we are encountering a scenario of coexistence among various display methodologies, which is directly tied to user preferences. Hence, research of this nature is vital for thoroughly validating user needs at the onset of product development, helping circumvent potential industry setbacks and adverse effects.
Through questionnaires and intuitive experiences, we identified needs for distracted driving scenarios and designed in-vehicle display functions accordingly. The novelty of our experiment stems from selecting and analyzing three urban driving scenarios with substantial safety risks and functionalities often utilized while distracted. As autonomous driving technology progresses, drivers’ preferences for display information lean towards increased personalization and a marked preference for enhanced experiences. Offering comfortable in-vehicle displays enables drivers to divert their attention more comfortably, while sustaining moderate trust in autonomous driving capabilities.
Our study has several limitations that should be addressed in the future. Firstly, this study only considered specific task scenarios in urban settings, which may not fully encompass the complexity and variability present in other distracted driving scenarios. Future studies should explore different distracted driving scenarios to gain a more comprehensive understanding of in-vehicle display performance across various contexts. Secondly, the focus of the study was on a specific set of distracted driving tasks. To gain a deeper understanding of the impact of in-vehicle display types on drivers’ distracted driving experience, future research should consider the complexity and cognitive demands of tasks at a more detailed level. Thirdly, our study was limited to short-term user experience metrics. Conducting long-term evaluations of drivers’ usage to more comprehensively assess the effects of in-vehicle display types and distracted driving is of great value.
As driving technology progresses into the latter stages of its development cycle, the standards for judging distracted driving evolve with the increasing levels of automation. Our findings highlight the importance of focusing research and development of in-vehicle displays on improving user experience by enhancing the perceptibility of displays to meet user expectations, thus contributing to the automotive industry’s healthy growth.
Author Contributions
Conceptualization, L.L., Z.Y. and J.Z.; methodology, L.L.; software, L.L.; validation, L.L., Z.Y., J.Z. and C.Q.J.C.; formal analysis, L.L.; investigation, L.L.; resources, L.L. and C.Q.J.C.; data curation, L.L.; writing—original draft preparation, L.L.; writing—review and editing, L.L., Z.Y. and J.Z.; visualization, L.L.; supervision, C.Q.J.C.; project administration, L.L. and C.Q.J.C. All authors have read and agreed to the published version of the manuscript.
Funding
This research received no external funding.
Data Availability Statement
The data presented in this study are available in the article.
Conflicts of Interest
Authors Zijiang Yang and Jie Zeng were employed by the company Huizhou Desay SV Automotive Co., Ltd. The remaining authors declare that the research was conducted in the absence of any commercial or financial relationships that could be construed as a potential conflict of interest.
Abbreviations
| AHP | Analytic Hierarchy Process |
| ADAS | Advanced Driver Assistance Systems |
| AR-HUD | Augmented Reality Head-Up Display |
| DIS | Driving Information System |
| HUD | Head-up display |
| NHTSA | National Highway Traffic Safety Administration |
| W-HUD | Windshield Head-Up Display |
Appendix A
Table A1.
Questionnaire on Driver Background and Driving Preferences.
Table A1.
Questionnaire on Driver Background and Driving Preferences.
Section 1: Background information
1. What is your gender?
□ Male □ Female
2. How old are you?
Age______
3. What is your years of driving experience?
□ Within 1 year. □ 1 to 2 years. □ 2 to 4 years. □ More than 4 years
4. How well do you understand autonomous driving?
![Electronics 13 01428 i008]()
5. Have you ever engaged in distracted driving?
□ Yes, have experienced. □ No. □ Not sure
6. Average driving days per week:
□ 1–2 days. □ 3 to 4 days. □ 5–6 days. □ Every day.
7. Average driving time per trip:
□ Less than 30 min. □ 30 min to 1 h. □ 1–2 h. □ More than 2 h.
Section 2: Driver preferences for distracted driving.
8. What distraction do you most commonly engage in while manually driving?
□ Feeding behavior. □ Conversations between vehicle occupants. □ Browsing web pages.
□ videos and other image information. □Texting chat. □ Browsing news on mobile phones.
□ Other
9. What distraction do you most commonly engage in while autonomous driving?
□ Feeding behavior. □ Conversations between vehicle occupants. □ Browsing web pages.
□ videos and other image information. □Texting chat. □ Browsing news on mobile phones.
□ Other
10. What type of in-car display information do you most need to know in an emergency situation? (Multiple choice)
□ Navigation. □ Arrival time. □ Speed. □ Mileage. □ Early warning □ Music. □ Social contact. |
References
- Charissis, V.; Stylianos, P. Human–Machine Collaboration through Vehicle Head up Display Interface. Cogn. Technol. Work 2008, 12, 41–50. [Google Scholar] [CrossRef]
- Ma, R.H.; Morris, A.; Herriotts, P.; Birrell, S. Investigating What Level of Visual Information Inspires Trust in a User of a Highly Automated Vehicle. Appl. Ergon. 2021, 90, 103272. [Google Scholar] [CrossRef] [PubMed]
- Endsley, M.R. Toward a Theory of Situation Awareness in Dynamic Systems. Situational Aware. 2017, 37, 9–42. [Google Scholar] [CrossRef]
- Teoh, E.R.; Kidd, D.G. Rage against the Machine? Google’s Self-Driving Cars versus Human Drivers. J. Saf. Res. 2017, 63, 57–60. [Google Scholar] [CrossRef] [PubMed]
- Schoettle, B.; Michael, S. A Survey of Public Opinion about Connected Vehicles in the U.S., the U.K., and Australia. In Proceedings of the 2014 International Conference on Connected Vehicles and Expo (ICCVE), Vienna, Austria, 3–7 November 2014. [Google Scholar] [CrossRef]
- Kahn, C.; Victor, C.; Shahram, L.; Ghasem, I.; Bharath, C. Distracted Driving, a Major Preventable Cause of Motor Vehicle Collisions: ‘Just Hang up and Drive. West. J. Emerg. Med. 2015, 16, 1033–1036. [Google Scholar] [CrossRef] [PubMed]
- Olaverri-Monreal, C.; Hasan, A.E.; Bulut, J.; Korber, M.; Bengler, K. Impact of In-Vehicle Displays Location Preferences on Drivers’ Performance and Gaze. IEEE Trans. Intell. Transp. Syst. 2014, 15, 1770–1780. [Google Scholar] [CrossRef]
- Deng, C.; Cao, S.; Wu, C.; Lyu, N. Modeling Driver Take-over Reaction Time and Emergency Response Time Using an Integrated Cognitive Architecture. Transp. Res. Rec. J. Transp. Res. Board 2019, 2673, 380–390. [Google Scholar] [CrossRef]
- Viadero-Monasterio, F.; Nguyen, A.-T.; Lauber, J.; Boada, M.J.L.; Boada, B.L. Event-Triggered Robust Path Tracking Control Considering Roll Stability Under Network-Induced Delays for Autonomous Vehicles. IEEE Trans. Intell. Transp. Syst. 2023, 24, 14743–14756. [Google Scholar] [CrossRef]
- Klauer, S.G.; Dingus, T.A.; Neale, V.L.; Sudweeks, J.D.; Ramsey, D.J. The Impact of Driver Inattention on Near-Crash/Crash Risk: An Analysis Using the 100-Car Naturalistic Driving Study Data. PsycEXTRA Dataset 2006. [Google Scholar] [CrossRef]
- Recarte, M.A.; Nunes, L.M. Effects of Verbal and Spatial-Imagery Tasks on Eye Fixations While Driving. J. Exp. Psychol. Appl. 2000, 6, 31–43. [Google Scholar] [CrossRef]
- Tamer, Y.; Patterson, P.; Mumani, A. Distraction and visual search characteristics of young drivers when using navigation system displays. J. Eng. Res. 2023. [Google Scholar] [CrossRef]
- Fernández-Rodicio, E.; Castro-González, Á.; Alonso-Martín, F.; Maroto-Gómez, M.; Salichs, M.Á. Modelling Multimodal Dialogues for Social Robots Using Communicative Acts. Sensors 2020, 20, 3440. [Google Scholar] [CrossRef] [PubMed]
- Iqbal, S.T.; Ju, Y.-C.; Horvitz, E. Cars, Calls, and Cognition. In Proceedings of the SIGCHI Conference on Human Factors in Computing Systems, Atlanta, GA, USA, 10–15 April 2010. [Google Scholar] [CrossRef]
- Hao, T.; Sun, J.; Wang, W.; Zhu, C. User Experience & Usability of Driving: A Bibliometric Analysis of 2000–2019. Int. J. Hum. Comput. Interact. 2021, 37, 297–307. [Google Scholar] [CrossRef]
- Zhu, Y.; Geng, Y.; Huang, R.; Zhang, X.; Wang, L.; Liu, W. Driving towards the Future: Exploring Human-Centered Design and Experiment of Glazing Projection Display Systems for Autonomous Vehicles. Int. J. Hum. Comput. Interact. 2023, 1–16. [Google Scholar] [CrossRef]
- Beck, D.; Jung, J.; Park, J.; Park, W. A Study on User Experience of Automotive HUD Systems: Contexts of Information Use and User-Perceived Design Improvement Points. Int. J. Hum. Comput. Interact. 2019, 35, 1936–1946. [Google Scholar] [CrossRef]
- Shih, C.-Y.; Tseng, C.-C. Dual-Eyebox Head-up Display. In Proceedings of the 2018 3rd IEEE International Conference on Intelligent Transportation Engineering (ICITE), Singapore, 3–5 September 2018. [Google Scholar] [CrossRef]
- Hock, P.; Kraus, J.; Babel, F.; Walch, M.; Rukzio, E.; Baumann, M. How to Design Valid Simulator Studies for Investigating User Experience in Automated Driving. In Proceedings of the 10th International Conference on Automotive User Interfaces and Interactive Vehicular Applications, Toronto, ON, Canada, 23–25 September 2018. [Google Scholar] [CrossRef]
- Kumar, S.; Raj, T. A Multi Attribute Selection of Mobile Robot Using AHP/M-GRA Technique. Robot. Syst. 2020, 7, 262–284. [Google Scholar] [CrossRef]
- Kun, A.L.; Boll, S.; Schmidt, A. Shifting Gears: User Interfaces in the Age of Autonomous Driving. IEEE Pervasive Comput. 2016, 15, 32–38. [Google Scholar] [CrossRef]
- Zhang, S.; Tak, T. Risk Analysis of Autonomous Vehicle Test Scenarios Using a Novel Analytic Hierarchy Process Method. IET Intell. Transp. Syst. 2023. [Google Scholar] [CrossRef]
- Hensch, A.C.; Rauh, N.; Schmidt, C.; Hergeth, S.; Naujoks, F.; Krems, J.F.; Keinath, A. Effects of Secondary Tasks and Display Position on Glance Behavior during Partially Automated Driving. Transp. Res. Part F Traffic Psychol. Behav. 2020, 68, 23–32. [Google Scholar] [CrossRef]
- Tsimhoni, O.; Green, P. Visual Demand of Driving and the Execution of Display-Intensive in-Vehicle Tasks. Proc. Hum. Factors Ergon. Soc. Annu. Meet. 2001, 45, 1586–1590. [Google Scholar] [CrossRef]
- Hwang, Y.; Park, B.-J.; Kim, K.-H. The Effects of Augmented-Reality Head-up Display System 632 Usage on Drivers? Risk Perception and Psychological Change. ETRI J. 2016, 38, 757–766. [Google Scholar] [CrossRef]
| Disclaimer/Publisher’s Note: The statements, opinions and data contained in all publications are solely those of the individual author(s) and contributor(s) and not of MDPI and/or the editor(s). MDPI and/or the editor(s) disclaim responsibility for any injury to people or property resulting from any ideas, methods, instructions or products referred to in the content. |
© 2024 by the authors. Licensee MDPI, Basel, Switzerland. This article is an open access article distributed under the terms and conditions of the Creative Commons Attribution (CC BY) license (https://creativecommons.org/licenses/by/4.0/).


