Article

Three-Dimensional Ray-Tracing-Based Propagation Prediction Model for Macrocellular Environment at Sub-6 GHz Frequencies

1
School of Physics, Xidian University, Xi’an 710071, China
2
China Information Technology Designing & Consulting Institute Co., Ltd., Beijing 100080, China
*
Authors to whom correspondence should be addressed.
Electronics 2024, 13(8), 1451; https://doi.org/10.3390/electronics13081451
Submission received: 6 February 2024 / Revised: 7 April 2024 / Accepted: 10 April 2024 / Published: 11 April 2024

Abstract

:
This paper presents a 3D ray-tracing model using geometrical optics and the uniform theory of diffraction in radio channel characterizations of macrocellular environments. On the basis of the environmental information obtained from a digitized map, the model is effectively applied. A technique considering multiple reflections and diffractions through the ray path classification is utilized in this model. Ray paths belonging to each ray category are determined using different methods. The proposed model is justified (the prediction accuracy of the model is better than 6.5 dB) with measurement data for the two scenarios and can provide reliable theory as a basis for radio wave propagation prediction and network planning in urban macrocellular environments.

1. Introduction

Increasing demands for mobile traffic services are continuously growing because of the evolution of mobile services and the emergence of big data applications [1,2]. To satisfy these requirements, considerable research effort has been focused on overcoming the limitations of macrocell capacity and/or its coverage in wireless communications [3]. In general, achieving high capacity is a principal aim of wireless operators who often encounter small regions of high demand within a large cell coverage area [4]. In urban macrocellular environments, the transmitter (Tx) is located above the scenario under study. Analysis of electromagnetic wave environment is a prerequisite for efficient wireless communications, and this investigation is successfully conducted using a simulation technique rather than a measurement of wave strength in a test site [5]. Currently, the ray-tracing (RT) prediction model is considered the most powerful in terms of accuracy and can be an effective tool for obtaining location-specific predictions of power, delay, and angles of transmitted and received radio waves [6,7]. The RT method predicts the electromagnetic field at the receiver (Rx) due to an energy source at the Tx based on a collection of theories, including geometrical optics, uniform theory of diffraction, and other scattering mechanisms. RT models are used in the planning phase of mobile radio systems to save deployment costs and increase service quality [8].
RT algorithms usually demand considerable computational resources and must be highly efficient, especially when dealing with complex scenarios (such as macrocells) [9]. Such algorithms are generally based on forward or backward techniques. According to forward approaches, such as shooting and bouncing rays [10], rays are launched with a specific angular separation from source points so that no building faces are missed at large distances from the Rx; furthermore, their paths are traced until a certain power threshold is reached [11,12]. However, to include multiple reflections and diffractions, avoid missing important ray contributions, and consequently augment the accuracy of the predicted field (especially when observing in deep shadow regions), a fine angular discretization is needed, thereby making these techniques numerically demanding. Moreover, backward techniques are generally based on image theory (IT) [13]. This imaging technique works by conceptually generating an image tree for each base station location. This image information is then stored and used for computing channel characteristics at each user location. In this manner, the IT technique can guarantee high accuracy. Nevertheless, the computational complexity grows exponentially with the number of walls.
To the authors’ knowledge, some studies related to the improvement of the computational efficiency of the RT model under urban macrocellular environments were conducted. A set of urban macrocell propagation statistics is presented; these statistics are obtained from the integration of a measured 3D base station and user equipment antenna patterns with a state-of-the-art 3D RT software tool in two propagation environment scenarios [14]. With the application of IT, a new RT algorithm generalizes a previous solution and efficiently calculates the diffraction centers in the case of multiple-edge diffractions [9]. In [15], the vertical plane launching RT method was applied to an actual urban scenario, and the delay characteristics of received signals in the overall coverage area were extracted. In [16], based on the prior knowledge of the scenario digital elevation model and the combination of various individual propagation models available in the literature, a hybrid propagation model for macrocell coverage predictions in densely built-up areas is presented. Recently, the improvement of an advanced radio propagation simulation platform based on ray launching and empirical/semi-empirical methods to analyze macrocellular environments has been presented [17]. Most published works focused only on the acceleration of forward or backward techniques. Unfortunately, running time becomes linearly proportional to the total number of prediction points, especially for the coverage prediction over a large, complex environment. This tendency is a strict limitation for the study of macrocellular environments.
To address this problem, a deterministic RT method should be modified and employed for macrocellular environments with larger coverage, and more complex environments at the Sub-6 GHz frequency are proposed. This model is based on the ray path classification technique and can solve some of the problems concerning RT methods. The main contribution of this article lies in the following.
  • More detailed environmental structures are considered, including not only building elements (e.g., internal yards, indentations, edges, and roof structures), terrain profiles, green belts, etc., but also different terrain features.
  • Considering the physical laws associated with wave propagation in urban environments and the determination efficiency of the multipath components (rays) between the Tx and Rx, the path classification technology is adopted.
  • In order to improve the efficiency of coverage prediction over large areas, a hybrid propagation model based on the statistical model-assisted RT algorithm is established.
The remaining part of this paper is organized as follows. Section 2 presents the macrocellular environment representation. A brief summary of the proposed 3D RT model is shown in Section 3. Measured results and computed predictions are compared in Section 4. Section 5 computes the power coverage map. Finally, the conclusions are drawn in Section 6.

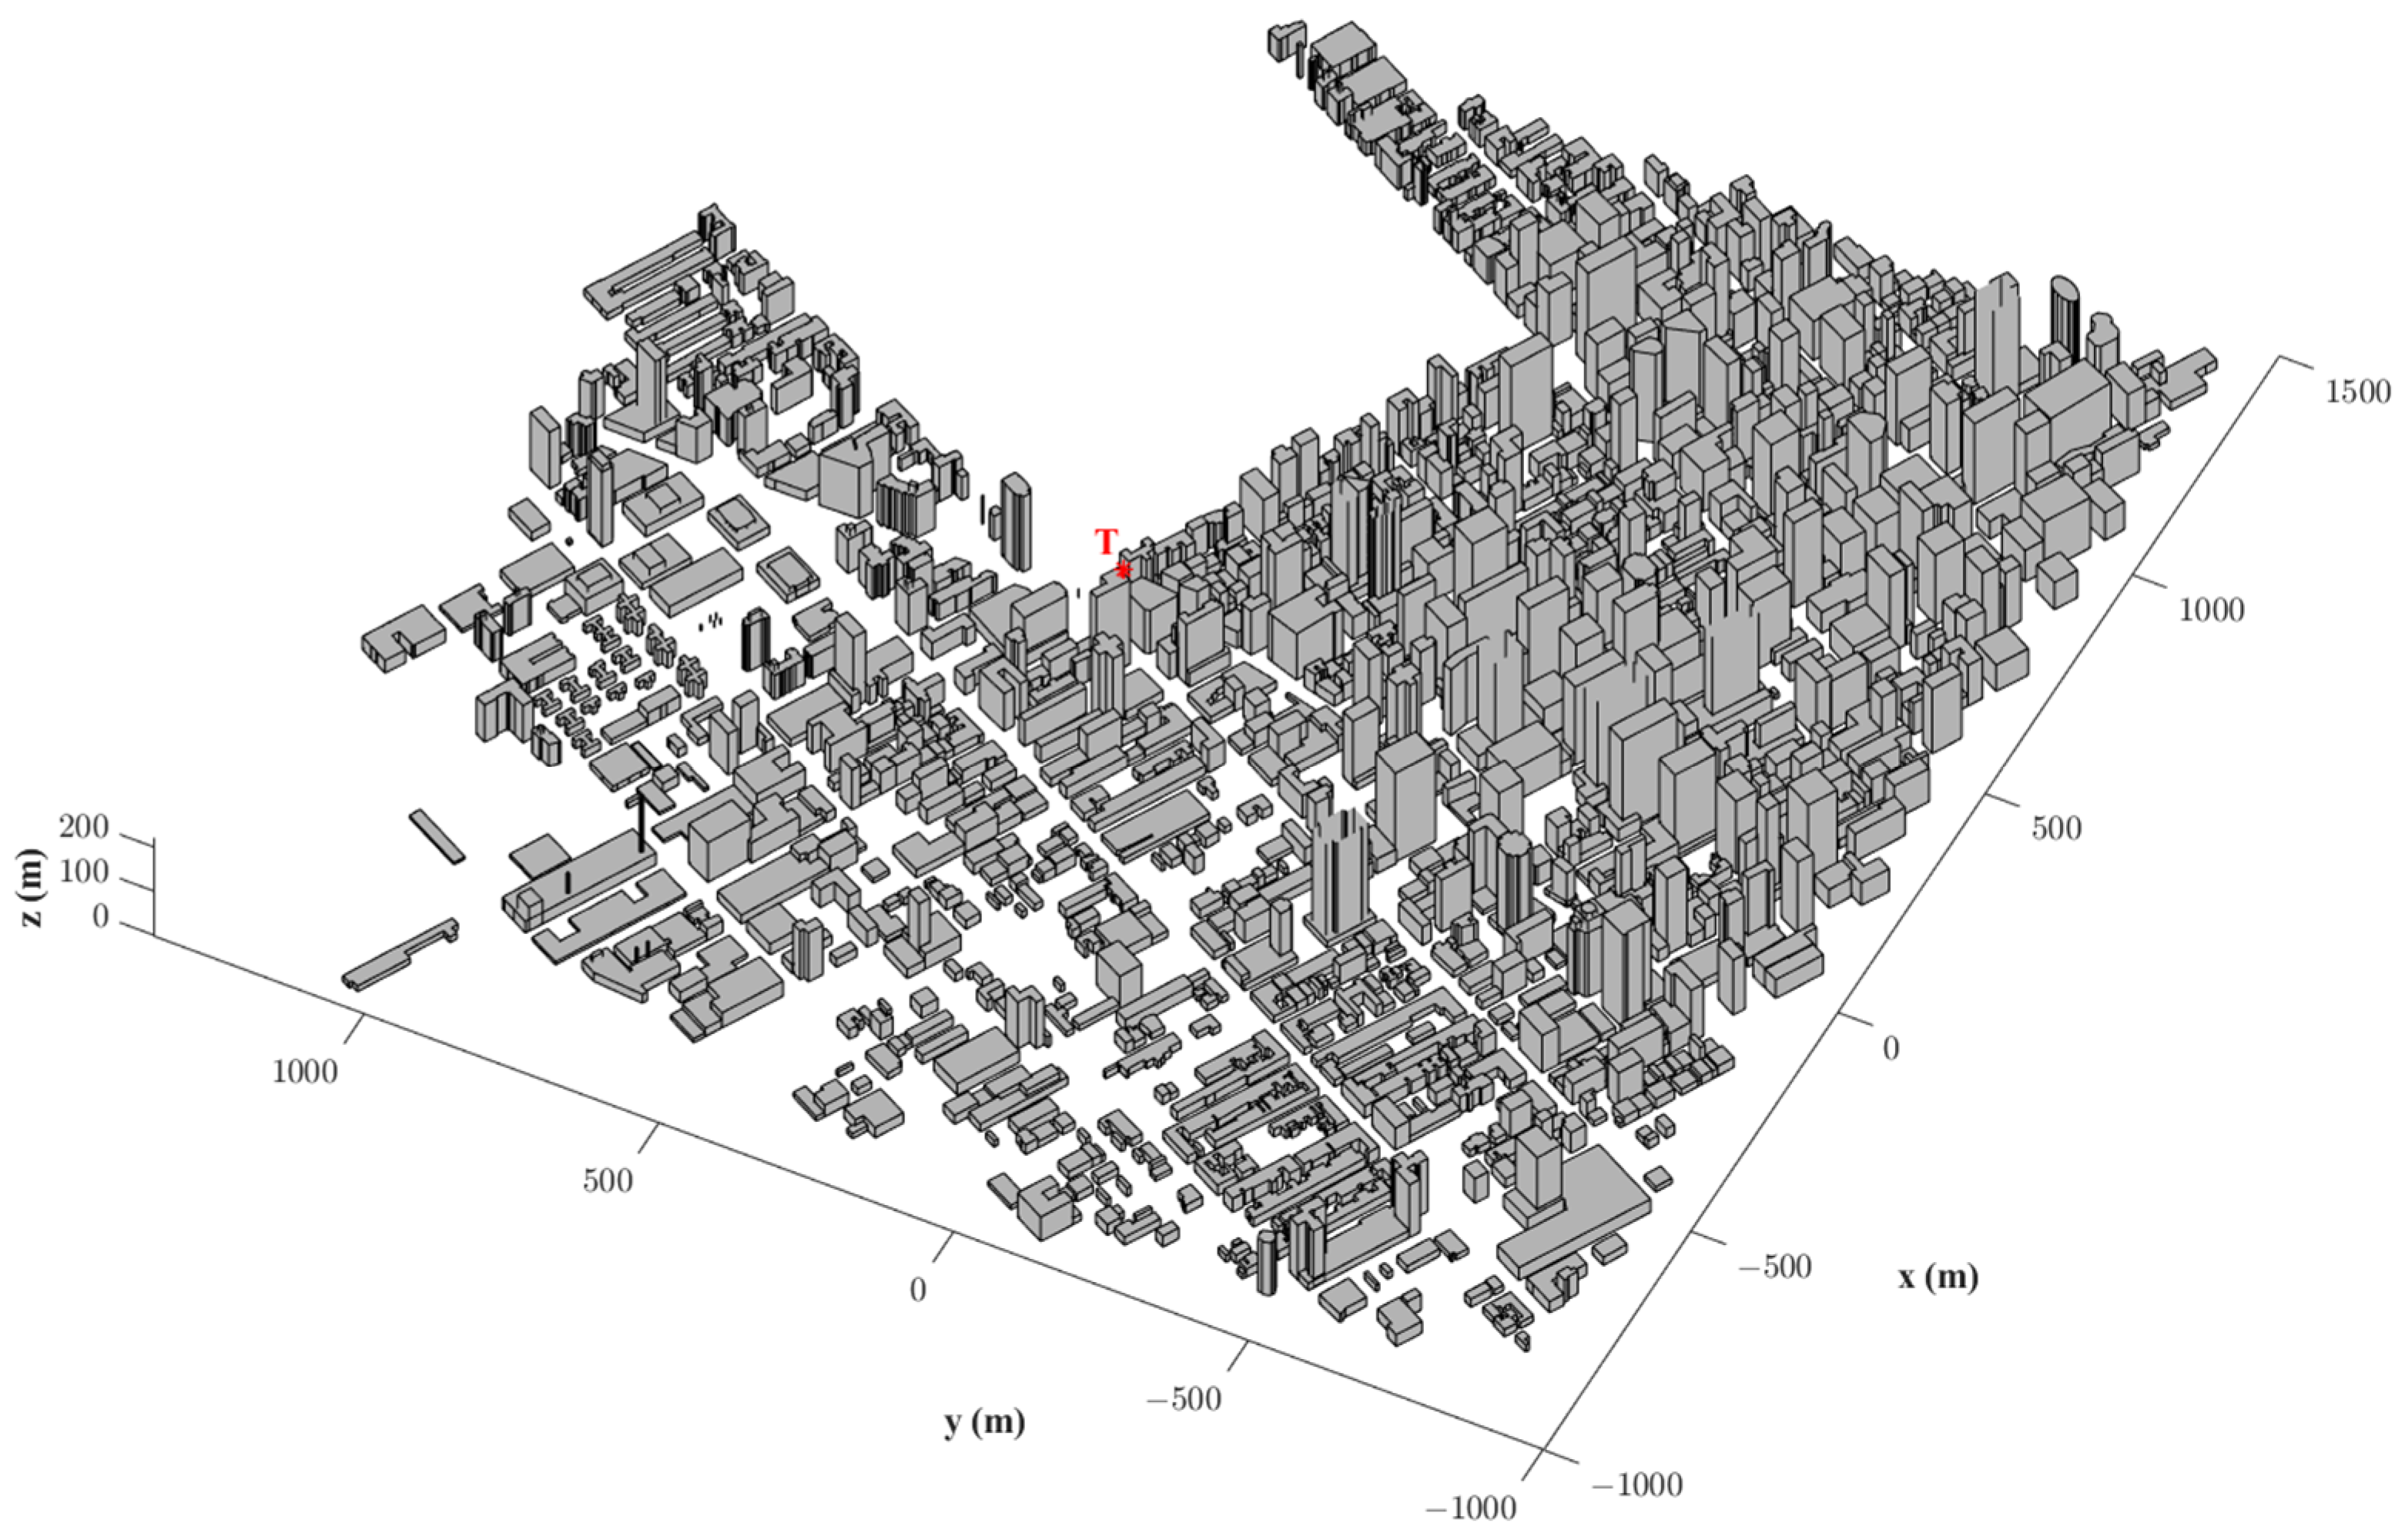
2. Macrocellular Environment Representation

In general, the geometric database in RT models can be obtained from a digitized map of a cell site. Under urban macrocellular environments, geometric modeling mainly includes buildings, terrain profiles, green belts, etc. The quality of this geometric information of the environment is the guarantee of high precision for multipath simulation in RT models. In addition, in order to accurately calculate the field amplitude of each multipath, it is also necessary to distinguish the electrical parameters of the environmental elements.

2.1. Buildings

Generally, the 3D RT model considers diffractions around horizontal and vertical edges, and the specular reflections of building surfaces are assumed to be flat. As shown in Figure 1, the simplified 3D model can reflect the main structure of the urban environment. This simplified 3D geometric model is used to realize a good accuracy of the RT-based propagation prediction results.
Each set of building data in the digitized map is conventionally modeled in two types. For the first type, a building record consists of the edge (wall) and normal vectors of exterior walls. For the second type, each building is represented by its corner points as a closed polygon, in which the first vertex is identical to the last one. Thus, the number of vertices of the polygon is one more than the actual number. Corner points within a building are arranged in a counterclockwise direction [18]. The proposed RT-based model is designed for the second type of building data.
The modeling approach of buildings can be sketched as follows:
(1)
Building groups are divided into different blocks, and each building presents a uniform height (i.e., polygonal cylinder). The building’s height is either relative to the ground or absolutely above sea level. Additionally, flat rooftops are used (horizontal planes). In urban databases, the basic element is a polygonal cylinder, which is constructed with many planar objects. The lateral face and vertical edge of the polygonal cylinder represent the wall and corner, respectively.
(2)
Each building in the macrocell is simplified as a combination of horizontal and vertical faces. Hence, important information regarding faces, wedges, and apexes can be easily extracted for tracing rays. On the basis of this extracted information, radio propagation in the studied environment can be simplified into direct rays and all possible combinations of reflected and diffracted rays reaching the Rx.
(3)
A high inner building is called a tower, and a low one is called a courtyard. A tower or courtyard, such as the building, is modeled as a polygonal cylinder.
For the RT-based propagation prediction in outdoor urban microcellular environments, all building walls are generally characterized by the same electrical parameter (relative permittivity and conductivity). The acceptable prediction accuracy could be obtained when this parameter is equal to the reasonable average value. However, in outdoor environments, obtaining considerable accurate prediction results may be unreasonable. In particular, the surface roughness is non-negligible with increasing carrier frequency. Building materials should also be distinguished from one another in complex macrocellular environments. To compensate for this, in the proposed 3D RT model, each building possesses a single set of material properties, which are used for the whole building.

2.2. Green Belts

As the Rx moves along the street grid, propagation paths from the Tx to Rx are blocked by high green belts. Therefore, it is necessary to reasonably model the green belts in urban macrocellular environments so as to quantitatively calculate the absorption loss generated by these green belts. In this study, the RT model treats the green belt as a special building (i.e., a column) that only allows the transmission path to pass through. The outline of the green belt is stored in the same format as the building, and its height and underside size are the average height and effective coverage area of the vegetation in the green belt, respectively. Based on the treatment of green belt modeling mentioned above, the accurate evaluation of the travel distance of each path in the green belt can be achieved during the ray-tracing process. During electrical parameter modeling, a pair of equivalent parameters are used to represent the physical properties of the green belt. Based on this electrical parameter, the transmission coefficient can be calculated and, thereby, the additional absorption loss caused by this propagation distance can be estimated.

2.3. Terrain Profile and Terrain Features

Generally, the ground is relatively flat under an urban macrocellular environment, and there is one order reflection from the ground between the Tx and Rx. However, in some cities, there may be large undulating terrain, even hills, which will form an obvious shielding effect on radio wave propagation. Based on the digital elevation model of the scenario, the terrain profile is subdivided and modeled according to the triangular plane as the basis. According to these subdivided triangular elements, the reflections on the terrain and the occlusion caused by the terrain can be accurately considered. Using a public database on the internet [19], the terrain features of the terrain surface have been refined in this study. Terrain features involve rivers, lakes, highways, grasslands, and bare soil. The electrical parameters (relative permittivity and conductivity) of different terrain features are different and determine the reflection loss on the surface with a specific terrain feature. When the electromagnetic wave interacts with the undulating terrain, one order or multiple reflections on the terrain are generated. Therefore, according to these features, triangular plane elements mentioned above can be assigned electrical parameters, which can support the accurate calculation of the terrain reflection.

3. 3D RT Model

The proposed RT-based propagation model is employed to predict the propagation in complex macrocellular environments. The presented work is an elaboration and extension of the preliminary study presented in [20]. Compared to our previous work, it is completed and further validated in the present work, and the performance of the creation of propagation paths has been also improved using the preprocessing for reflection in 3D conditions and a 3D polar sweep algorithm. In Figure 2, a simplified flow diagram of the implementation of the 3D RT model is presented. The corresponding process can be divided into the following main steps: simulation setup, loading and preprocessing of environmental information, creation of propagation paths between the Tx and Rx, calculation of fields and the process of simulation results, and the output of simulation results.

3.1. Simulation Setup

(1)
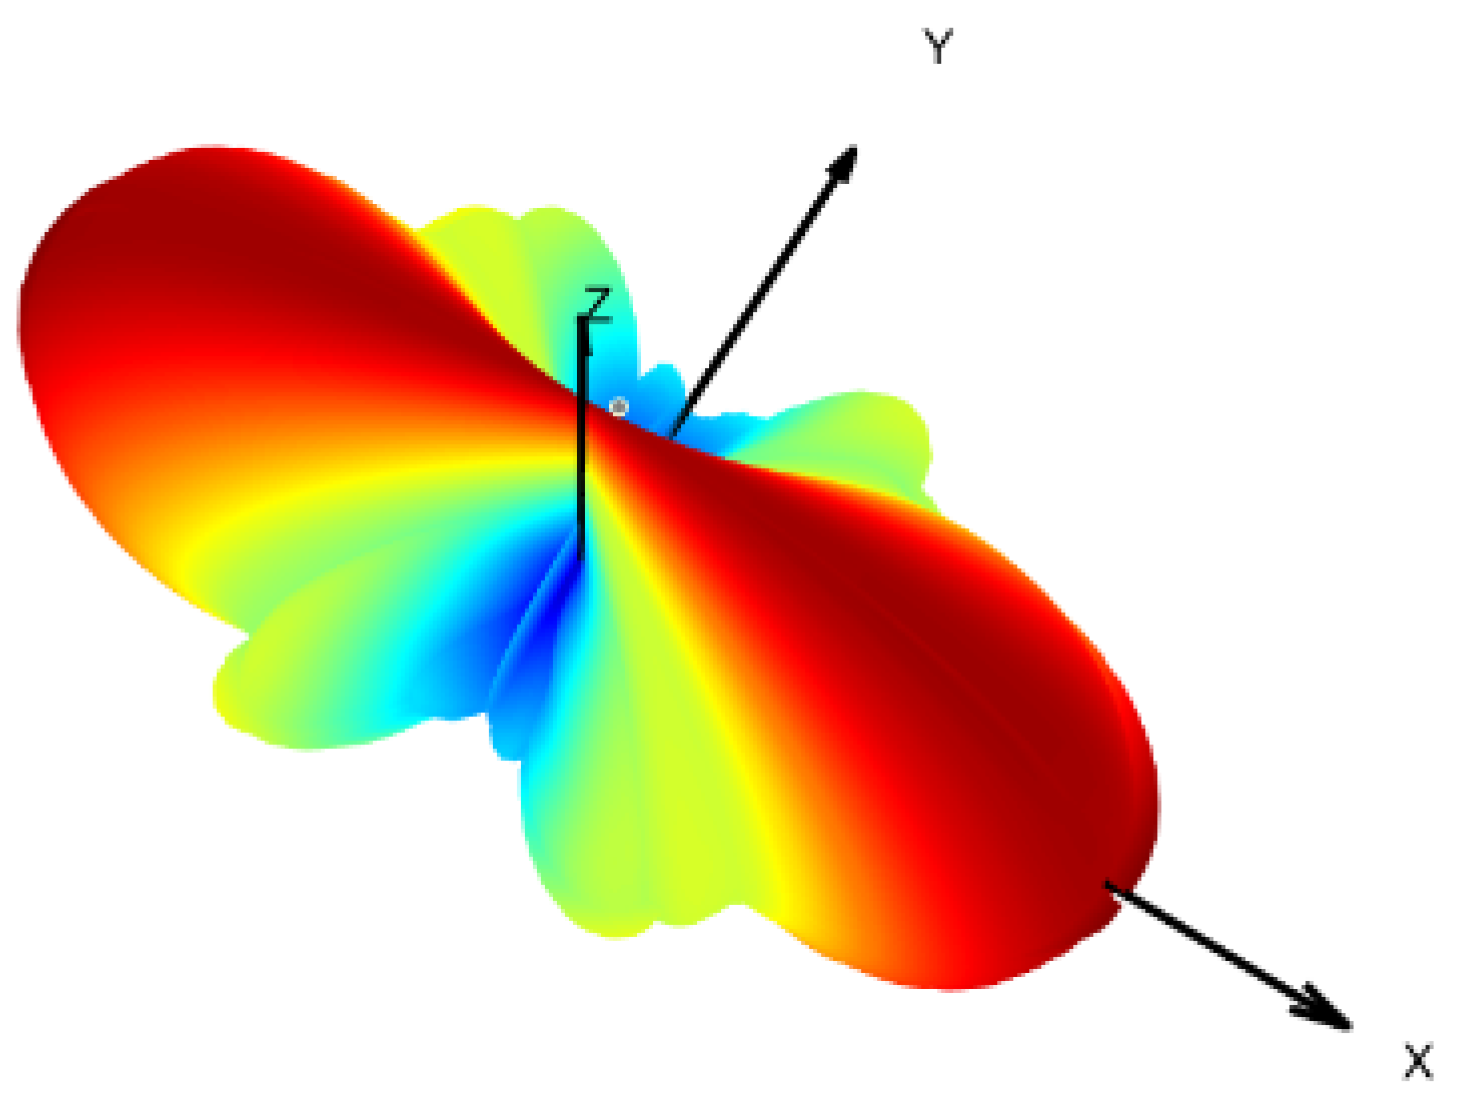
Tx parameters, namely, transmitted power, carrier frequency, antenna gain, antenna polarization, radiation pattern, and position, are established.
(2)
Rx parameters, namely, antenna gain, antenna polarization, and radiation pattern, are also set.
(3)
Prediction functions, such as path loss, received power, and all the information of propagation paths from the Tx to Rx (including 3D RT trajectory, time of arrival, angle of arrival, angle of departure, and field strength), are established.
(4)
The simulation prediction method should be selected and divided into three types: (a) disperse-point prediction (Rxs are placed at arbitrary locations); (b) single-route prediction, i.e., Rxs are placed along the test route with fixed intervals; and (c) coverage prediction, i.e., Rxs are uniformly distributed in the area of interest with uniform height.

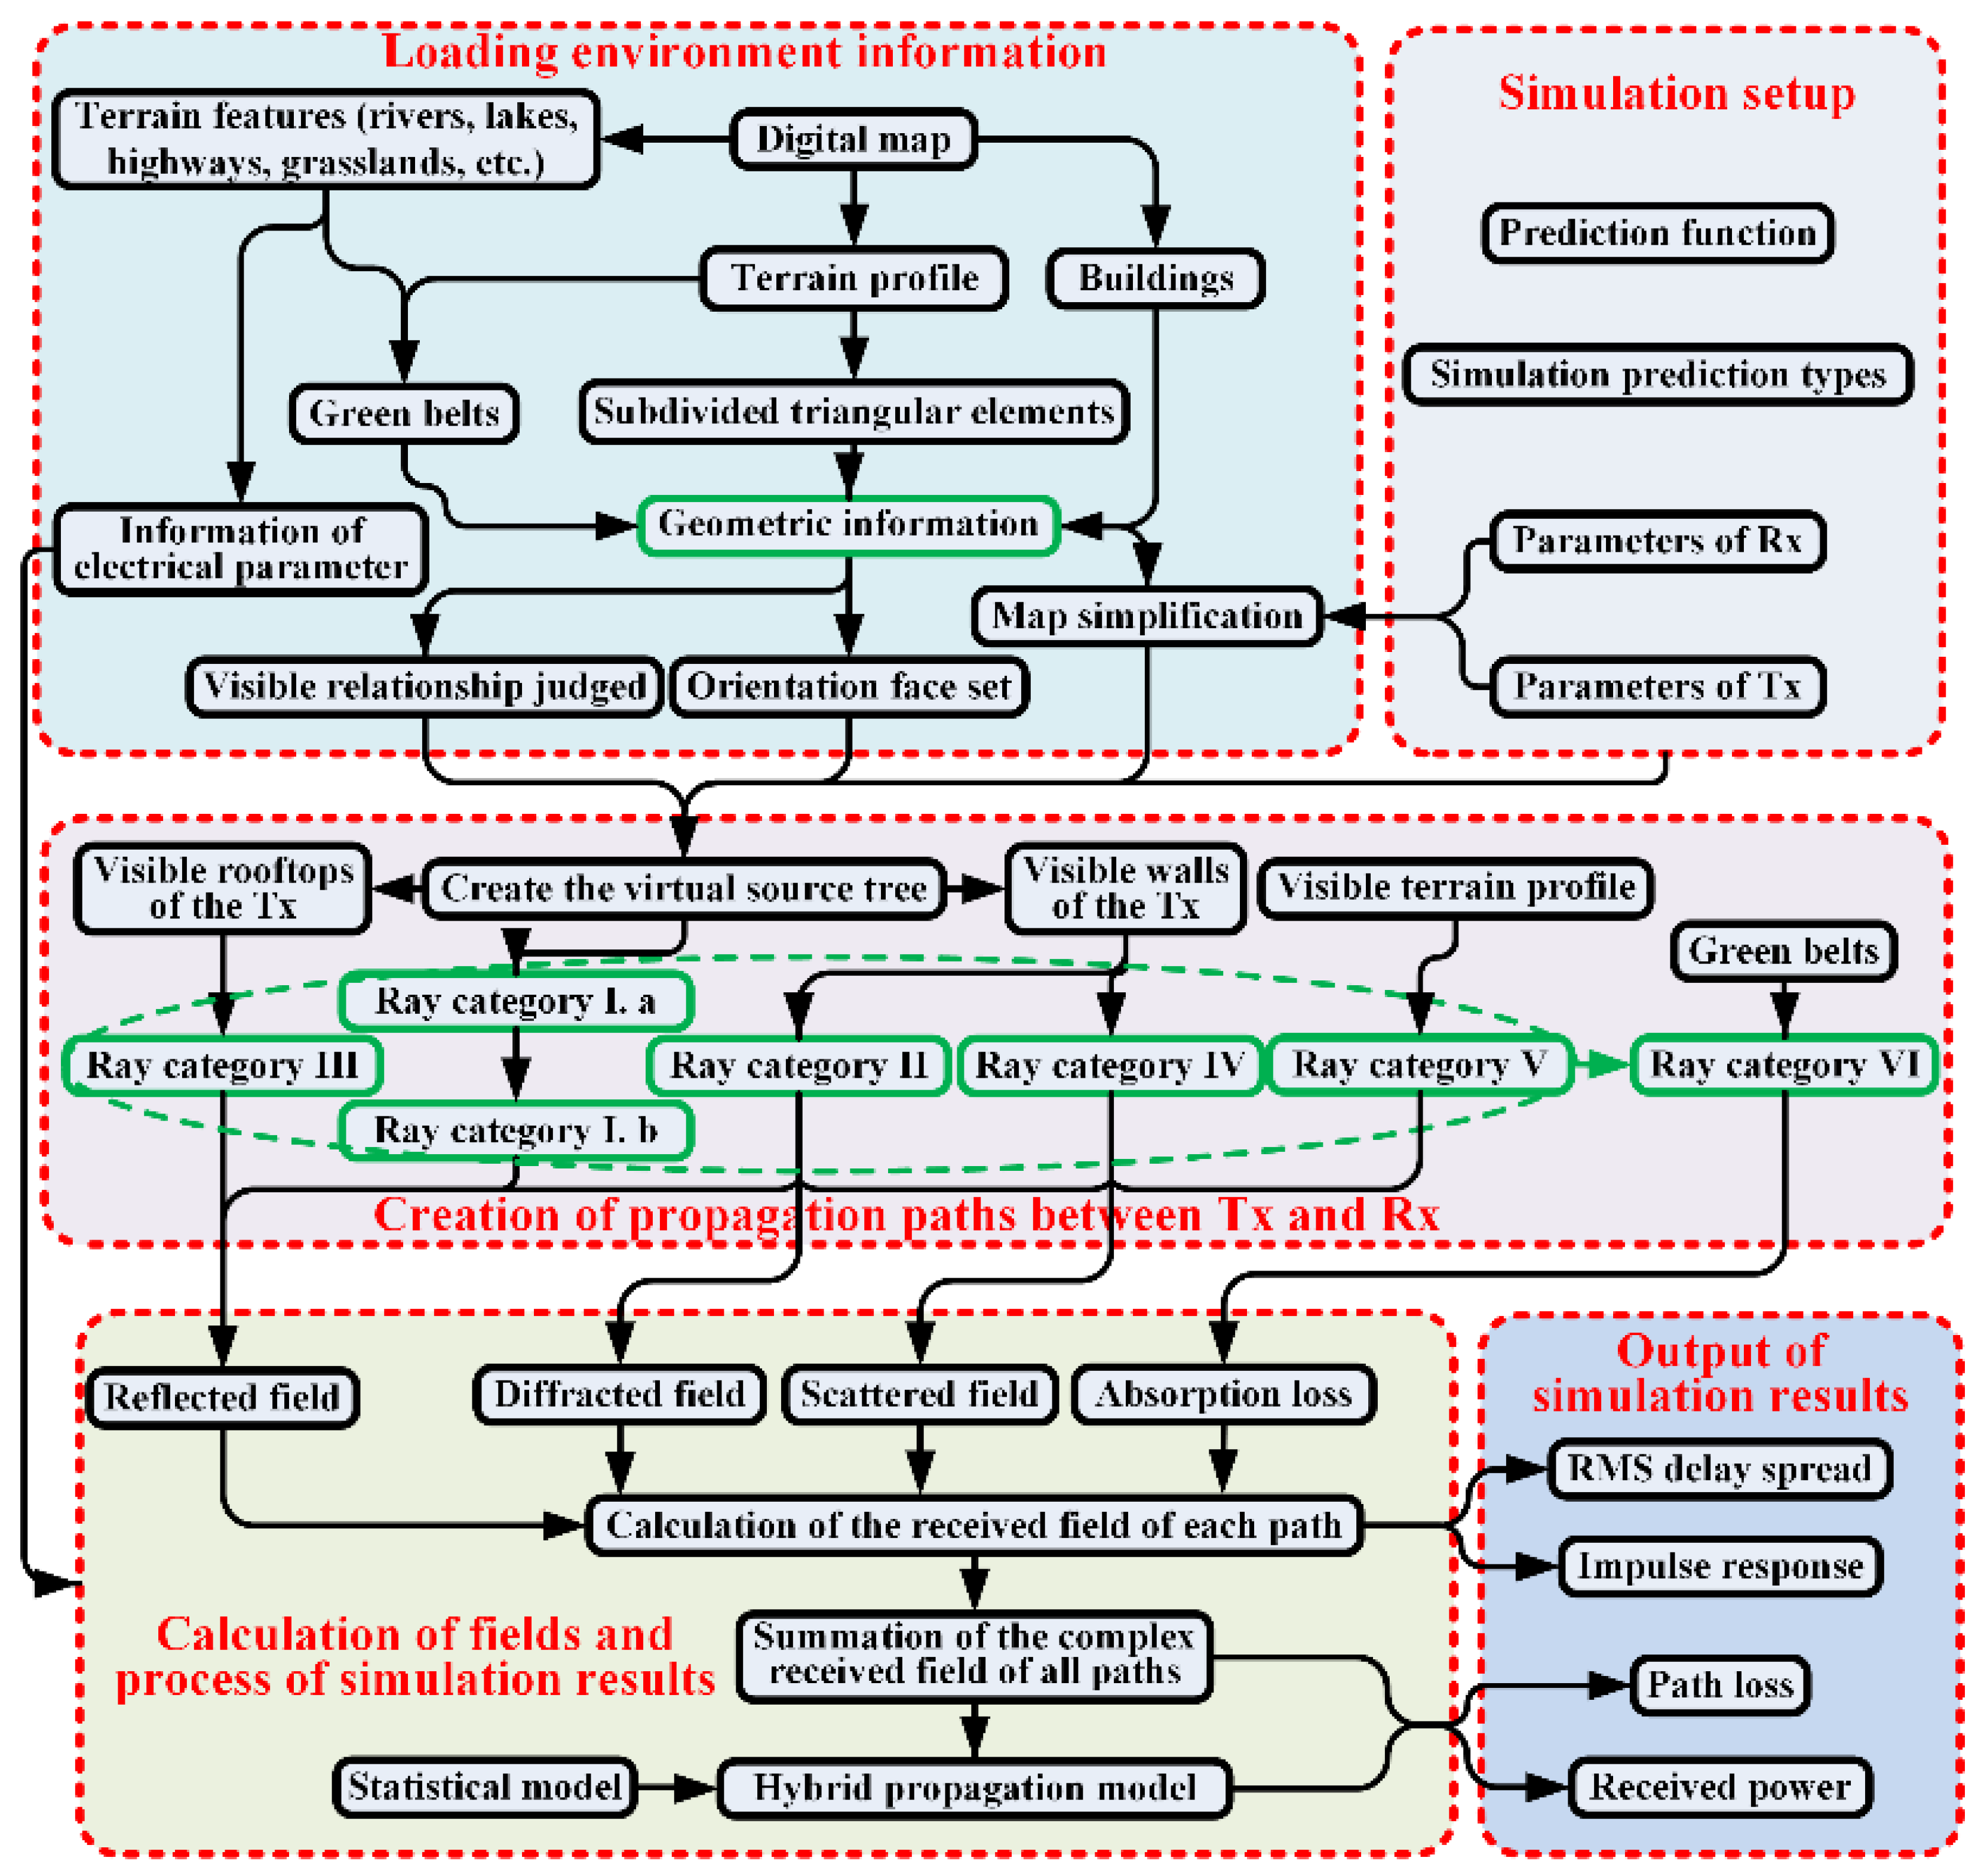
3.2. Loading and Preprocessing of Environmental Information

(1)
Environmental information includes electrical parameters (relative permittivity and conductivity) and geometric information (including buildings, green belts, terrain profile, and terrain features) and is obtained from the digital map.
(2)
According to the Tx and Rx positions, geometrical factors, which exert little or no effect on prediction results, are neglected from the digital map using a preprocessing technique for the geometric information of buildings. This preprocessing technique can retain the geometric information of buildings that create low-order reflected or diffracted rays between transmitting and receiving antennas. In the area containing these buildings, the rays carrying strong energy can arrive. Therefore, if the area is confirmed before executing the RT program, some repeated judgments could be avoided.
(3)
The visible relationship between vertical walls and simulated points (Rxs) should be assessed and stored. To determine the relationship, a simulated point can be treated as a light source. When a vertical wall is illuminated by a point, the relationship between the vertical wall and the simulated point is called “visible”. In this condition, the reflected ray on the vertical wall may arrive at this simulated point.
(4)
The orientation face set (already present in [21] for 2D conditions) between vertical walls should also be determined and stored in 3D conditions to accelerate the calculation of the reflection. The plane on which the wall of the building exists divides the 3D space into two half-spaces, and the half-space pointed by the outward normal vector of the vertical wall is described as the valid region of the vertical wall. If any vertex of a vertical rectangular wall is located in the valid region of the reflected wall, and at the same time, if any vertex of this reflected rectangular wall is located in the valid region of the vertical wall, the wall is defined as the orientation face of the reflected wall. Thus, all the orientation faces of the reflected wall comprise its orientation face set.

3.3. Creation of Propagation Paths between the Tx and Rx

This step is the core of the RT-based propagation prediction model, and the simulation prediction efficiency is obviously influenced by this step. To hasten the determination of propagation paths, the ray path classification technique is employed for the macrocellular environment. In the present study, all the propagation paths from the Tx to Rx are divided into five major categories and are individually determined by different approaches to obtain high efficiency in the RT process.
  • Ray category I. Category I can also be divided into two fine types. For the first type (called ray category I. a), the following ray paths are considered: direct rays as line of sight (LOS), ray paths with an arbitrary number of reflections on vertical walls, ray paths with an arbitrary number of diffractions on vertical edges (corners), and all combinations of reflections on vertical walls and diffractions on vertical edges. For the other type (called ray category I. b), all ray paths mentioned above are included, including one additional reflection on the ground.
  • Ray category II. Category II accounts only for single-diffracted ray paths on horizontal eaves belonging to the roofs of buildings.
  • Ray category III. Category III accounts only for single-reflected ray paths on horizontal roofs of buildings.
  • Ray category IV. Category IV includes only single-diffuse-scattering ray paths on vertical walls of buildings.
  • Ray category V. Category V includes reflections on large undulating terrain. When considering such paths, the ground cannot be considered flat. Paths belonging to ray category I. b should be ignored to avoid repetition of reflections on the ground.
  • Ray category VI. This category involves the five ray categories mentioned above and additional multiple transmissions through the green belt.
In order to store environmental elements that exert an effect on RT-based prediction results, a storage structure of a tree is designed. In this tree, all nodes involve many essential information; the position of the Tx, reflection points, reflecting walls, diffraction points, diffracting corners, and the positions of the Rxs. The root of the tree is the Tx and the lower order nodes of this tree are the precondition for generating the higher order nodes. Starting with any node toward its left child in the tree, the order of the nodes would be increased by one for passing through each node. According to the tree, in which the relationship between neighbor nodes is left son and right brother, all of the propagation paths belonging to both types one and two in ray category I can be found. In the current study, two techniques for improving the efficiency of tree construction, namely, (1) preprocessing for reflection and (2) a 3D polar sweep algorithm, are used. The former must use an orientation face set, and the latter originated from a 2D polar sweep algorithm that was early applied to propagation modeling by Agelet et al. [22] and can hasten the determination of visible faces for a 3D environment. However, before the implementation of the 3D polar sweep algorithm, each virtual source should be taken as a reference, and the environment elements should be sequentially sorted, which will worsen memory performance. Furthermore, considering the specific character of diffraction, storing visible simulated points, faces, and wedges of the diffraction source (the highest point on the wedge) can prevent unnecessary repeated calculation of the diffraction produced by the same corner. It should be noted that in the case of coverage prediction (including a large number of simulation points) based on this acceleration technology, the prediction efficiency of the RT model is improved significantly, but the demand for memory space will be increased. Fortunately, it is relatively easy to obtain large memory capacity, so the memory space requirements generated by the acceleration technology are less of an issue.
Paths belonging to ray categories II, III, and IV should be observed after determining paths belonging to ray category I. Such observation is attributed to that some intermediate results (i.e., Tx’s visible walls and horizontal roofs of buildings) produced during the construction of the tree are used by ray categories II, III, and IV. On the basis of the visible walls of the Tx, all the visible horizontal eaves can be obtained. Consequently, all paths belonging to ray categories II and IV are determined. All paths belonging to ray categories III can be easily calculated by utilizing the Tx’s visible horizontal roofs of buildings.
To obtain all the paths belonging to ray category V, it is first necessary to triangulate the terrain profile based on the digital elevation model. According to these subdivided triangular elements, the visible triangular plane set STx of the Tx and the visible triangular plane set SRx of the Rx can be obtained by calculating the occlusion relationship between line segments (determined by the Tx or Rx and the center of triangular planes in set STx or SRx) and macrocellular environment. Then, set STRx is achieved by finding the intersection of set STx and set SRx. For each triangular plane in STRx, all the possible one-order ground reflections can be obtained based on IT. If the possible reflection does not intersect all buildings or terrain in the environment, the one-order reflection path between the Tx and Rx is considered valid. By calculating all first-order mirror sources T x relative to each triangular plane, we can obtain all two-order ground reflection paths by solving the one-order reflection between each first-order mirror source and the Rx. By analogy, the higher-order ground reflection can be found.
The determination of all paths belonging to ray category V is based on all paths belonging to ray categories I, II, III, IV, and V. The transmission points penetrating and exiting the green belt can be calculated by intersecting paths belonging to the five ray categories with each green belt. All ray paths in path type VI can be formed by updating these transmission points into the five ray categories mentioned above in accordance with the distance from the Tx in the identified path.

3.4. Calculation of Fields and Process of Simulation Results

When all pertaining propagation paths from the Tx to Rx are determined, the contribution (complex received field amplitude) of each path can be calculated. The calculation of the field amplitude can be expressed as
E = E 0 f t f r e j k r r i = 1 n R i l = 1 m D l A l d s = 1 u T s A s .
where k is the propagation constant, E0 is the reference field, and ft and fr are the transmitting and receiving antenna field radiation patterns in the direction of the ray, respectively. R is the path length and A l d is the spreading factor for the lth diffraction. The spreading factor A l d describes the field amplitude variation with r and is determined by the energy conservation principle applied to an astigmatic pencil of rays surrounding the ray path of interest. The Tx is regarded as a point source and generates spherical wave radiation, so the factor A l d in this study is calculated as the spherical spreading factor. N, m, and u are the total number of reflections, diffractions, and transmissions, respectively, and Ri, Dl, Ts, and As are the reflection coefficient for the ith reflector, diffraction coefficient for the lth diffracting wedge, and the transmission coefficient and additional absorption loss for the sth transmission, respectively. The calculation of the two coefficients can be traced in [23]. The direct and reflected fields are evaluated in detail through geometrical optics, and the diffracted ray field is evaluated through the uniform theory of diffraction. Subsequently, the total field at each measurement point is computed by adding the contributions of all pertaining propagation paths.

3.5. Output of Simulation Results

Simulation results contain path loss, received power, and complex impulse response of the radio channel. A further detailed description of these corresponding definitions used for characterizing various parameters of a propagation channel can be found in [21,24]. It is worth noting that running the full 3D RT method in a large macrocell environment will consume a large amount of computation. Therefore, in order to alleviate this problem, this model can support the use of the RT model for simulation in the circle coverage area with the Tx as the center and a special set length as the radius. The macrocell statistical model can be used to estimate outside the coverage area. In this way, a hybrid model based on RT and a statistical model is formed. The hybrid model can achieve a good compromise between prediction accuracy and efficiency. When the hybrid model is used to predict a large area, this paper needs to use the simulation results of the RT model in conjunction with the calculation junction of the RT model and statistical model to correct the calculation results of the statistical model near the calculation junction, which is mainly to avoid the phenomenon of abnormally large gap between the two types of calculation results.

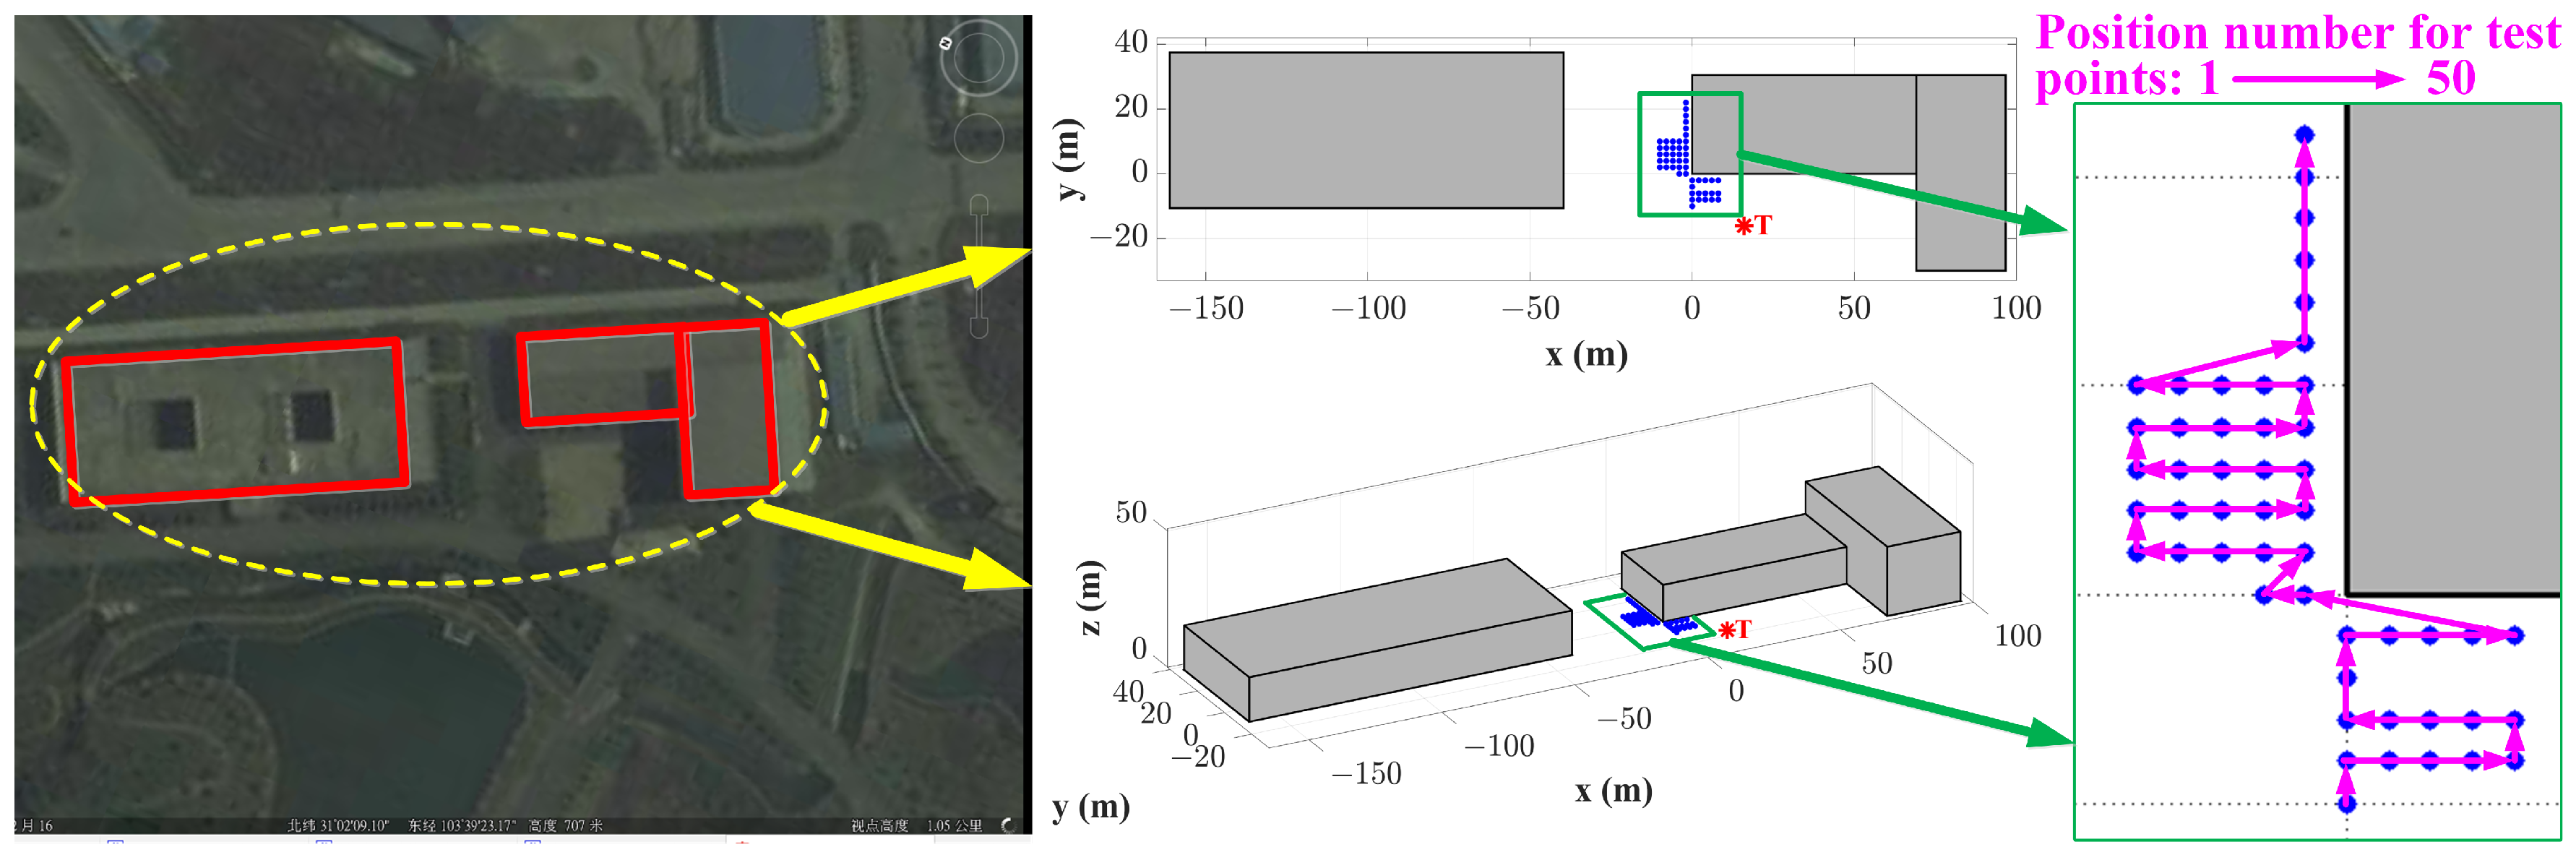
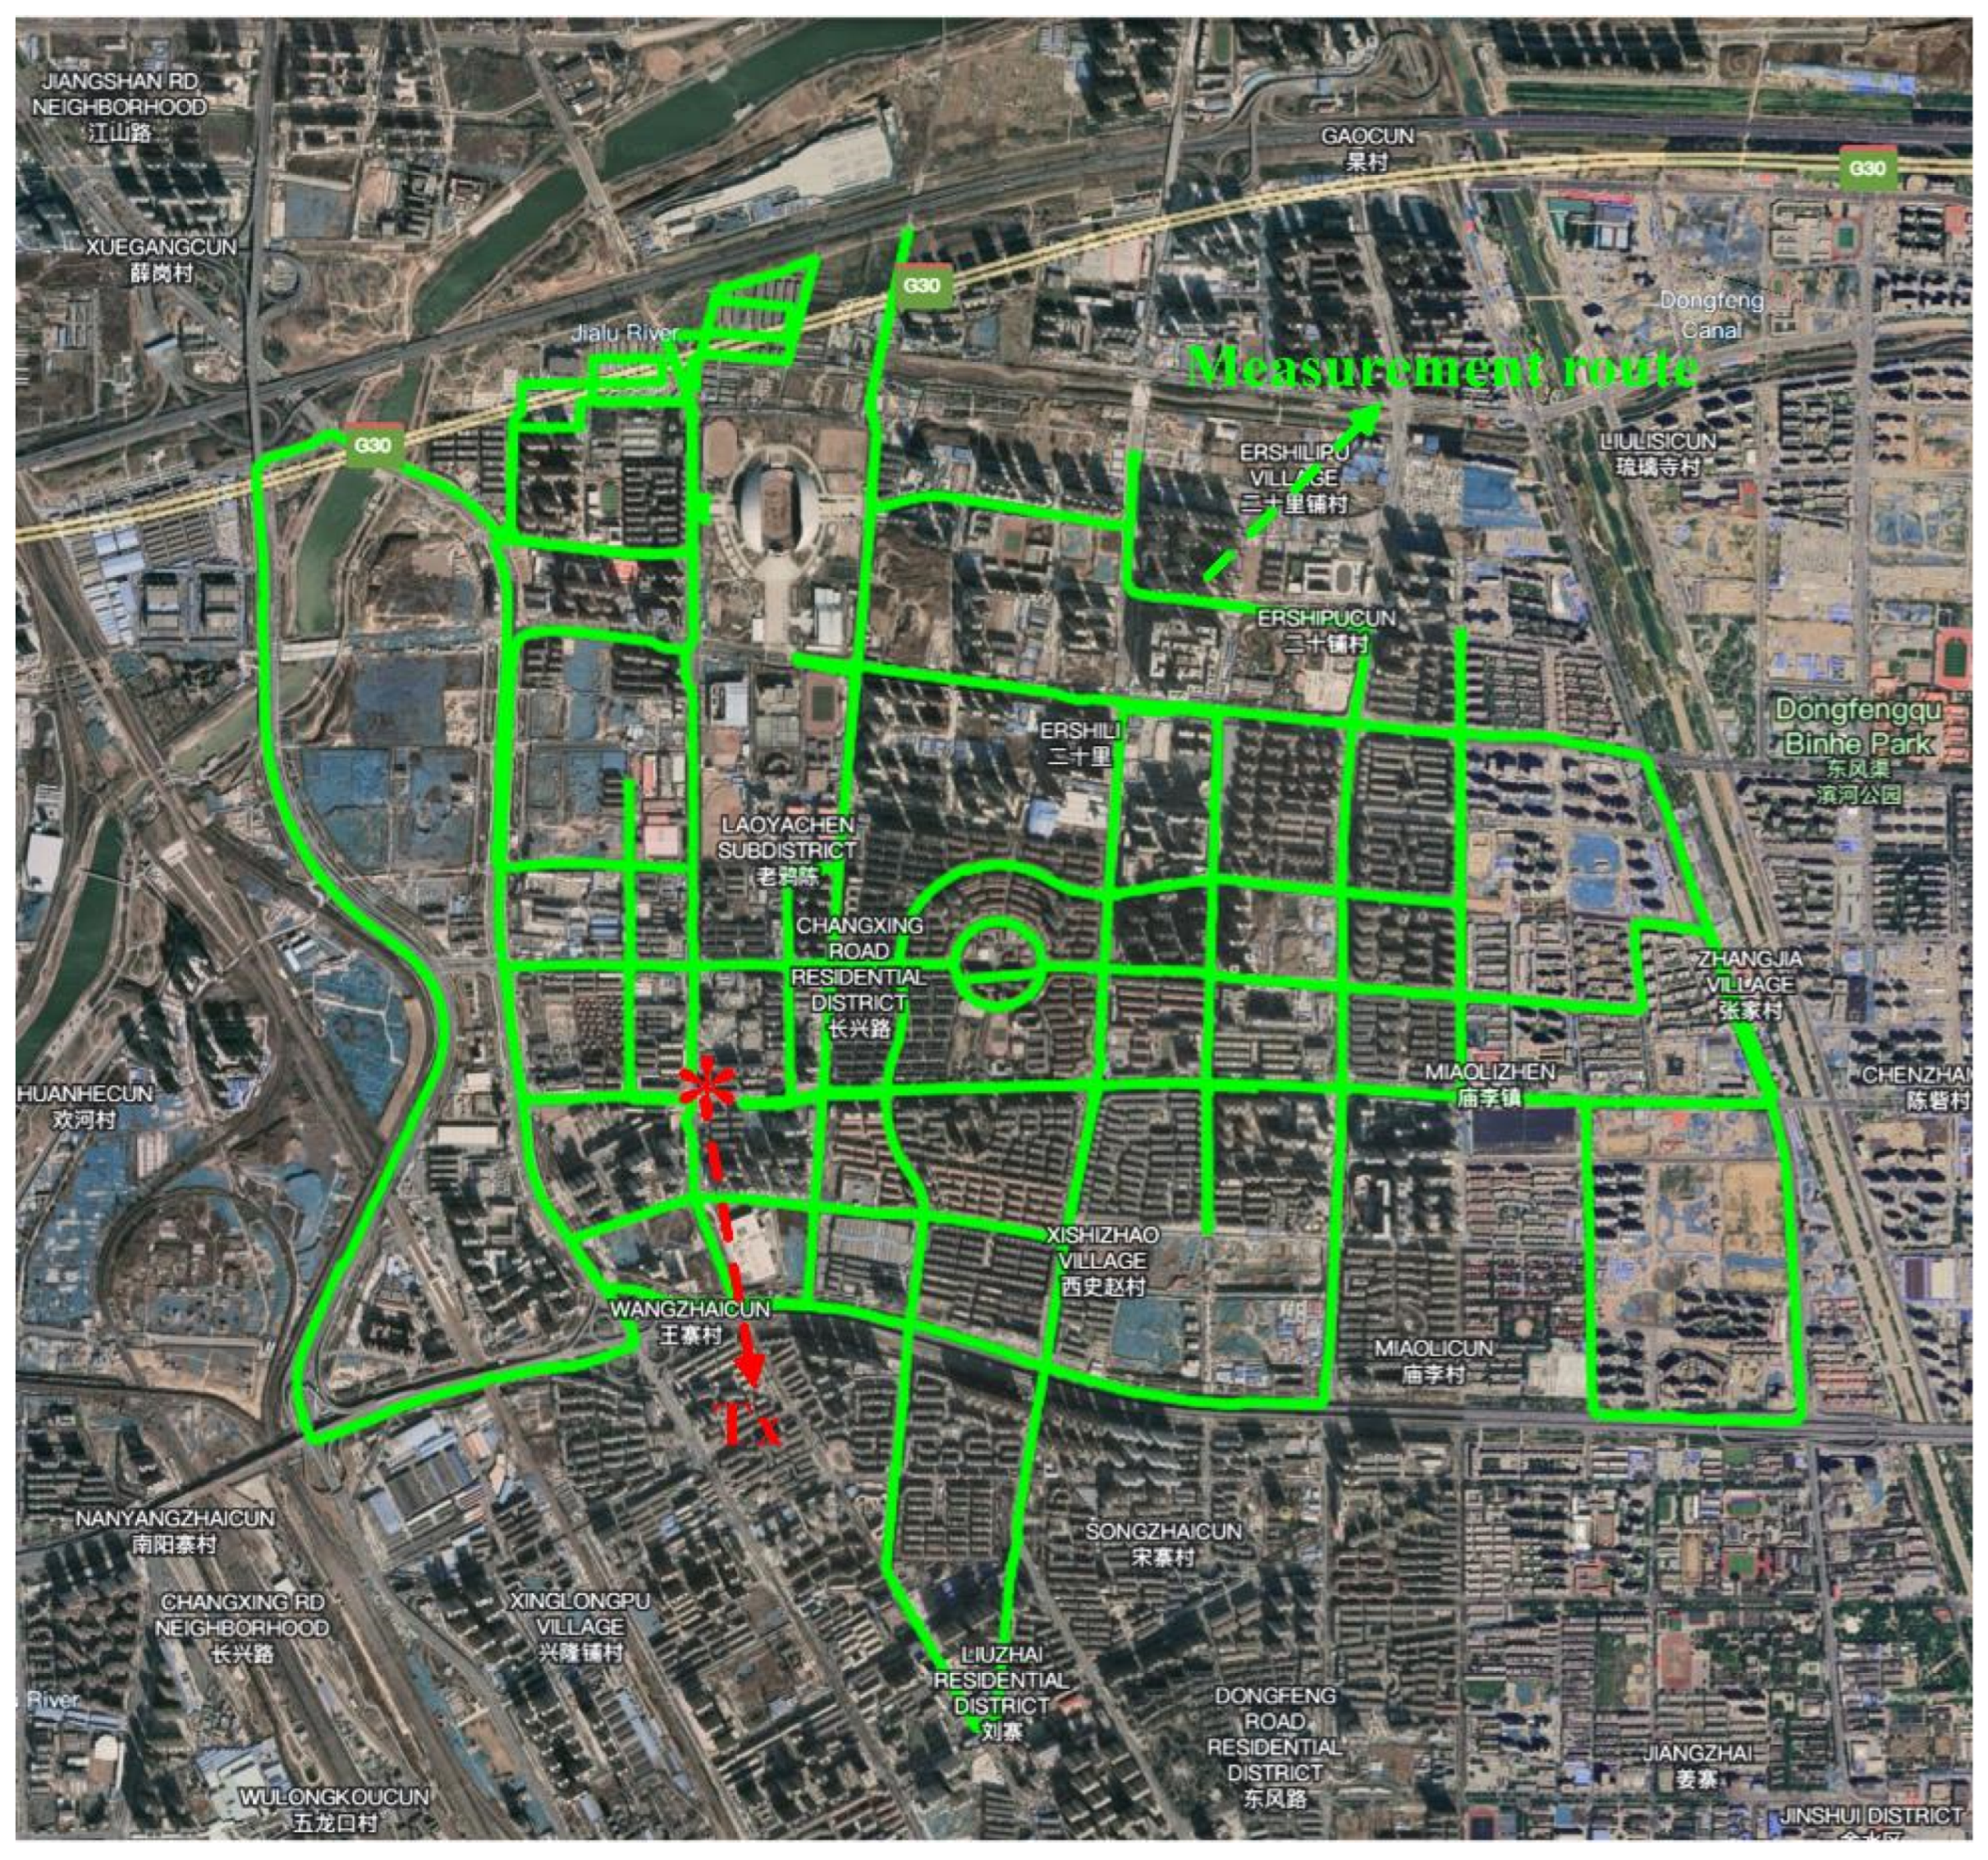
4. Measurement and Verification

To demonstrate the accuracy of the 3D RT model proposed in this study, the measured results involving two outdoor environments are compared. These two scenarios, one with a small coverage range of 250 m × 70 m and the other with a coverage range of 7500 m × 5500 m, are named outdoor scenario 1 (Figure 3) and outdoor scenario 2, respectively.

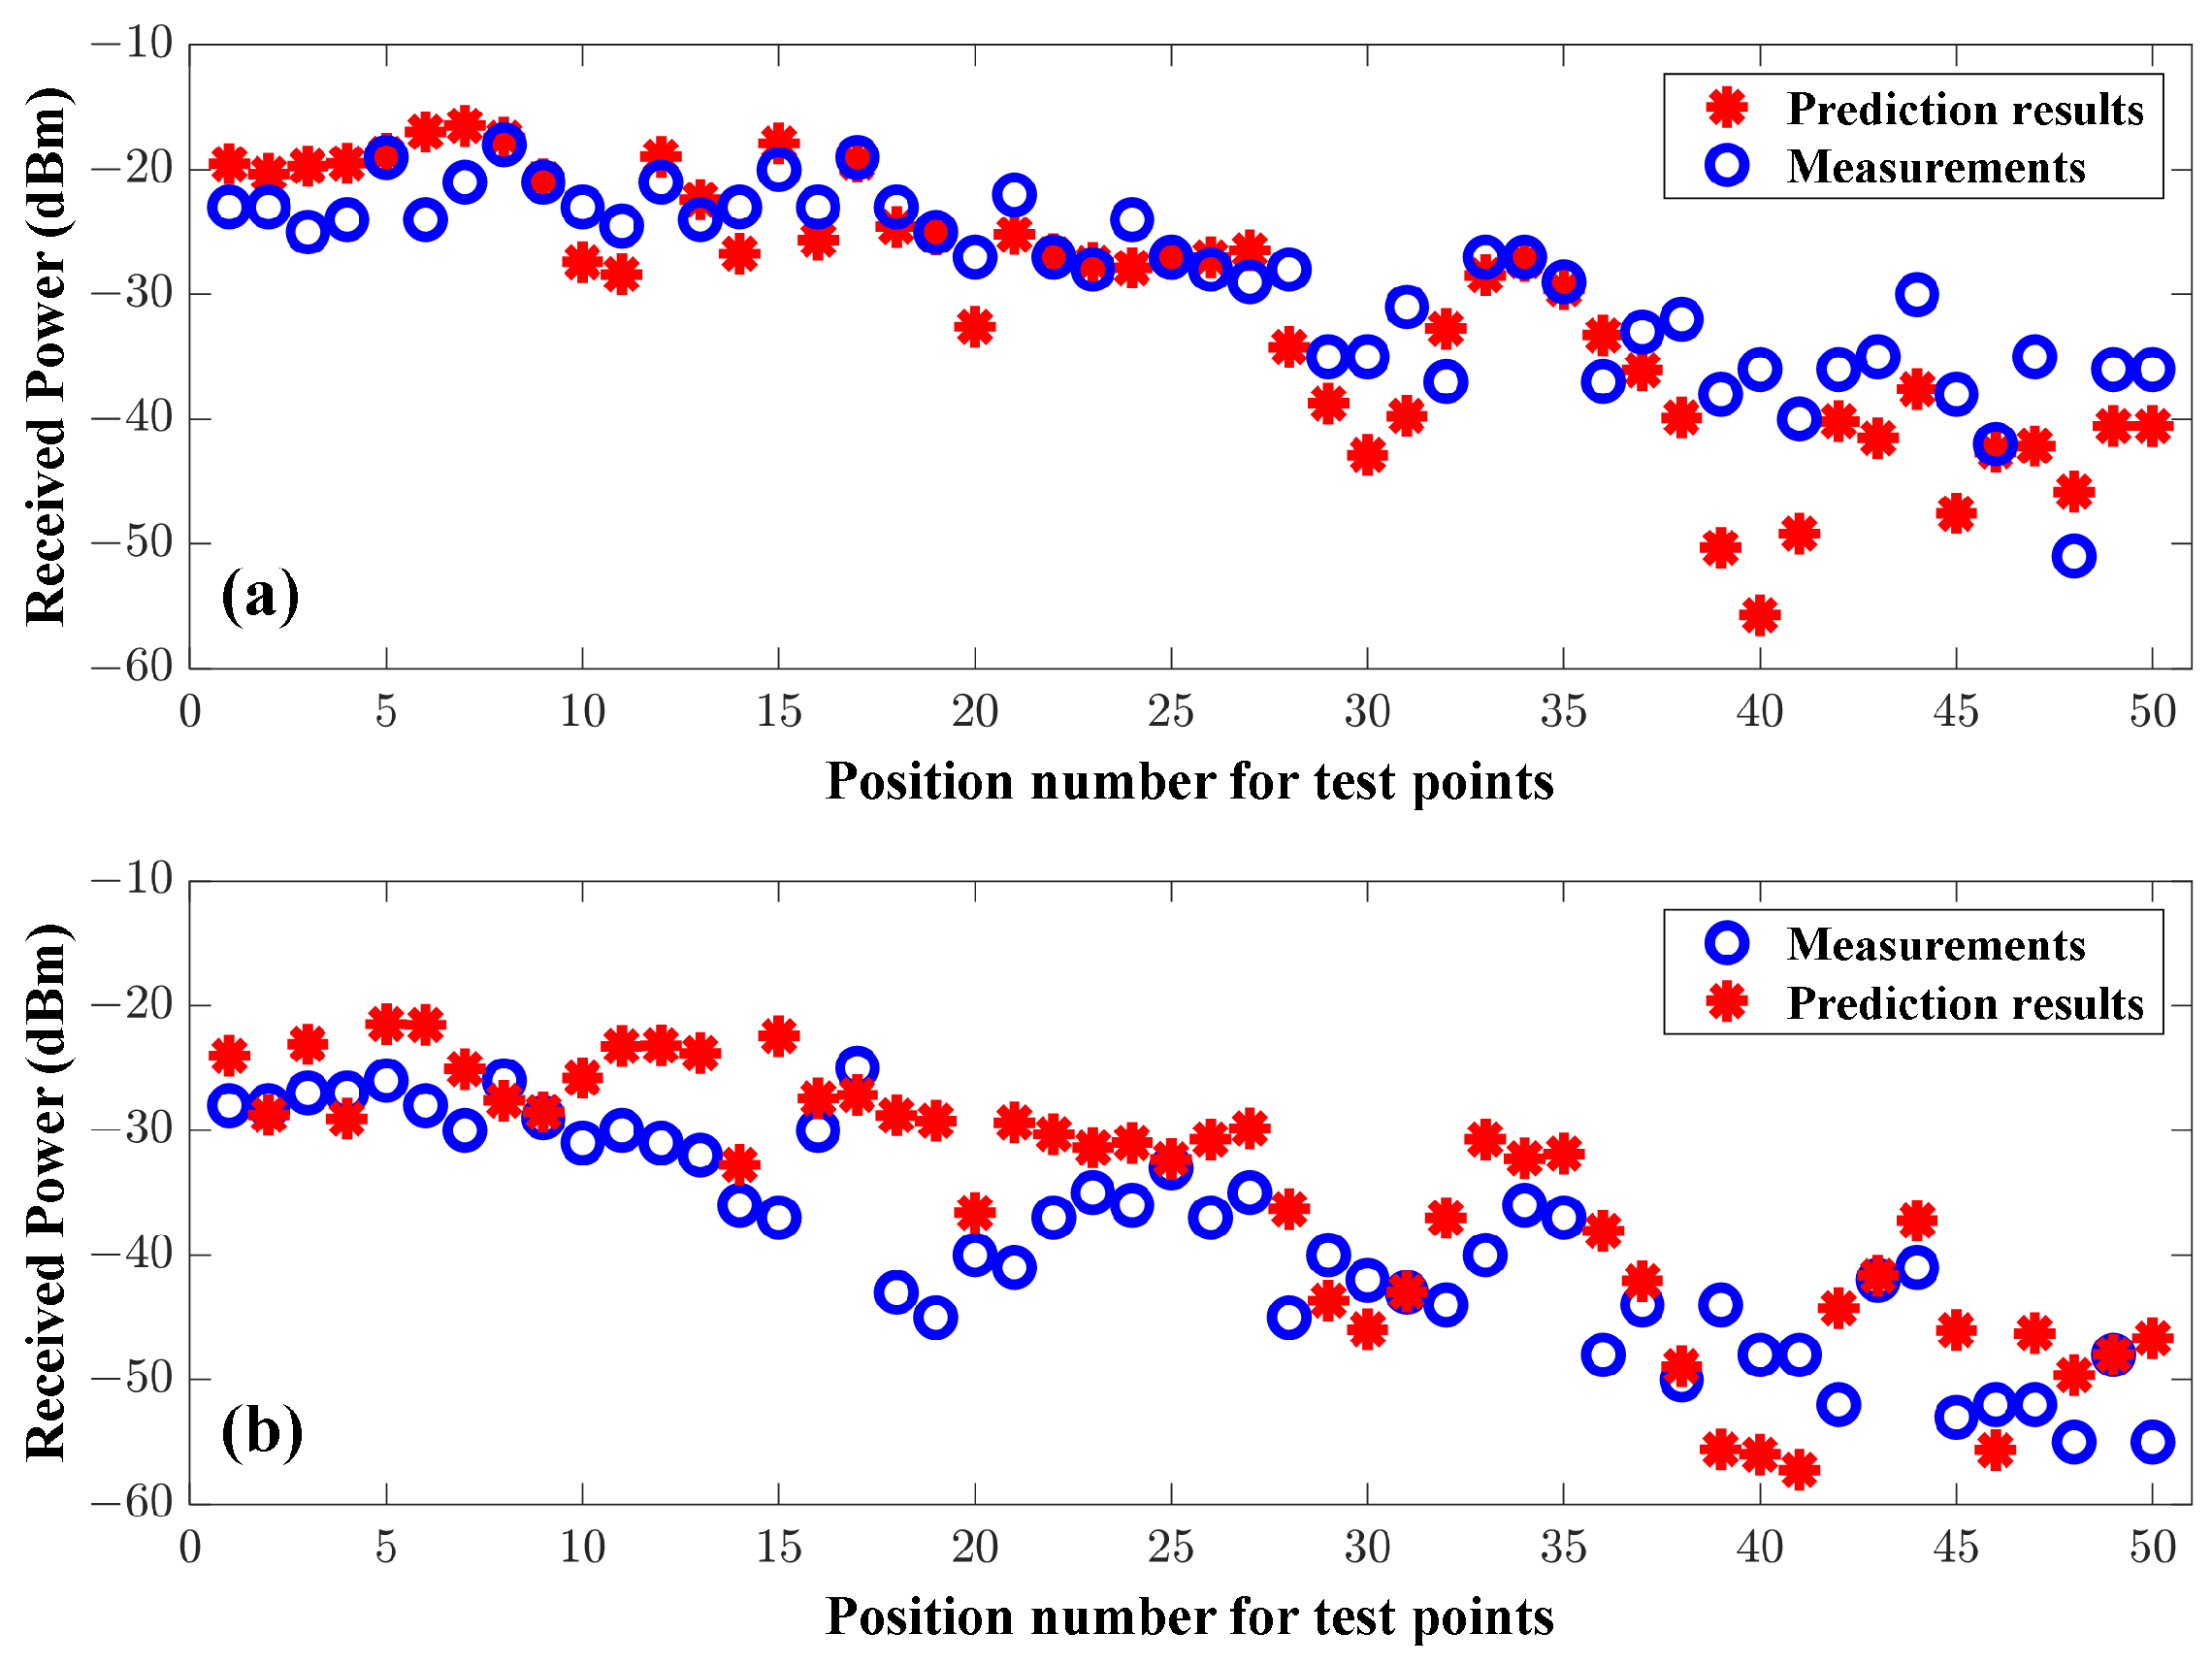
4.1. Outdoor Scenario 1

The measurement campaigns presented in this paper were obtained by the Southwest China Research Institute of Electronic Equipment in its outdoor measurement site. In Figure 3, test outdoor scenario 1 and its 3D view modeled in the simulation are depicted. During measurement, no people moved around the test area. The Tx height is 1.6 m, the carrier frequencies are 610 and 990 MHz, the power is 0.3 W, and the Rx height is 2.1 m. Approximately 50 test points (Rxs) with a separation of 2 m are predicted and numbered in the area of interest. In detail, 16 test points are in the non-line-of-sight (NLOS) area, and the other points are in the direct LOS area. Both the Tx and Rx are vertically polarized biconical antennas (Figure 4). In the calculations performed in the present study, wall conductivities and electrical features of the ground are set at 7.0 S/m, with a relative permittivity of 15.0 (following the existing literature [21]). In addition, propagation paths of about five orders of reflection, two orders of diffraction, and three reflected then diffracted waves are considered in the simulation.
Figure 5 shows the comparison between the measured and predicted results calculated using the proposed RT model. According to all these comparisons, the proposed model is in good agreement with these measurements, except for several test points (i.e., the corresponding position number is large) in the NLOS area. In the investigated region, local peaks of signals evidently exist. In these peaks, the LOS areas allow strong signals to reach the test positions.
The means and standard deviations of errors between measurements and simulated predictions are presented in Table 1. According to Figure 5 and Table 1, low-numbered test points are basically in the LOS area, and high-number points are in the NLOS area. In the LOS area, a direct ray is the main way of radio wave propagation arriving at test points. Conversely, the rays that undergo single/multiple reflections or diffractions carry weak energy. Nevertheless, under NLOS conditions, the ray paths arriving at the test points are primarily composed of reflected or diffracted rays. These rays undergo multiple reflections and diffractions and cause high attenuation. Moreover, the low-order transmitted field may not be neglected under NLOS conditions, but these corresponding computer codes are not added to the RT engine. Therefore, an inefficient prediction accuracy is obtained.

4.2. Outdoor Scenario 2

Outdoor scenario 2 refers to the dense urban environment in the Jinshui District of Zhengzhou City (see Figure 6). The relevant measurement campaigns and measured data in this scenario are carried out and provided by the China Information Technology Designing & Consulting Institute Co., Ltd. During the measurement, the Tx is located at the base station of Lvshi station, as shown in Figure 6 where the red asterisk is located, and the height from the ground is 30 m. The Tx used is a directed antenna, using a frequency of 3500 MHz and a gain of 5dBi. The corresponding radiation pattern of the directed antenna is shown in Figure 7. The direction of the radiation pattern of the Tx during measurement is that the X-axis direction in Figure 7 is to the north and the Z-axis is vertically upward. The measurement route, which contains 19,796 test points in total, is shown as the green curve in Figure 6. The height of these test points is about 1.5 m above the ground and is basically evenly distributed along the measurement route.
The detailed comparisons of received power by our simulations were calculated using the hybrid propagation model (i.e., the proposed RT) based on the statistical model-assisted RT algorithm, predictions obtained with the classical RT, and the measurements. Table 2 provides the error statistics of the predictions with respect to received power. In contrast to the proposed RT, the effects of terrain profile and green belts on radio wave propagation are not considered in the classical RT. In the calculations performed in outdoor scenario 2, propagation paths of about three orders of reflection on the wall, one order of reflection on the ground, one order of diffraction on bath edges and roof structures, and three orders of transmission are considered in the simulation. In addition, the geometric modeling of outdoor scenario 2 mainly includes buildings, terrain profiles, green belts, etc. The values of relative permittivity and conductivity are 15.56, 0.06 S/m for the ground, 4.28, 0.56 S/m for buildings, and 1.5, 1.5 S/m for green belts, respectively. As can be seen in Figure 8, the predicted results using the proposed RT are In good agreement with the measured results on the whole within the macrocell range of the Tx covering about 6000 m. Unlike the proposed RT, predictions using the classical RT at many test points are greater than 10 dBm compared to the measured results, mainly because the classical RT algorithm does not fully consider detailed environmental structures, such as terrain profiles and green belts. Therefore, the classical RT algorithm does not support environment data with fine structure, let alone obtain high prediction accuracy. The agreement is better when the values of position number are smaller because these predictions are mainly based on the RT model. When the value of the position number is large, the calculation is mainly combined with a statistical model, which leads to a large prediction error. According to the errors shown in Table 2, it could be observed that the proposed RT method yielded better prediction accuracy compared to the classical RT method. More precisely, the prediction accuracy of the proposed RT method is improved by 2.13 dBm in scenario 2. Therefore, more detailed environmental structures are a prerequisite to ensure they can achieve a higher precision in the RT models.

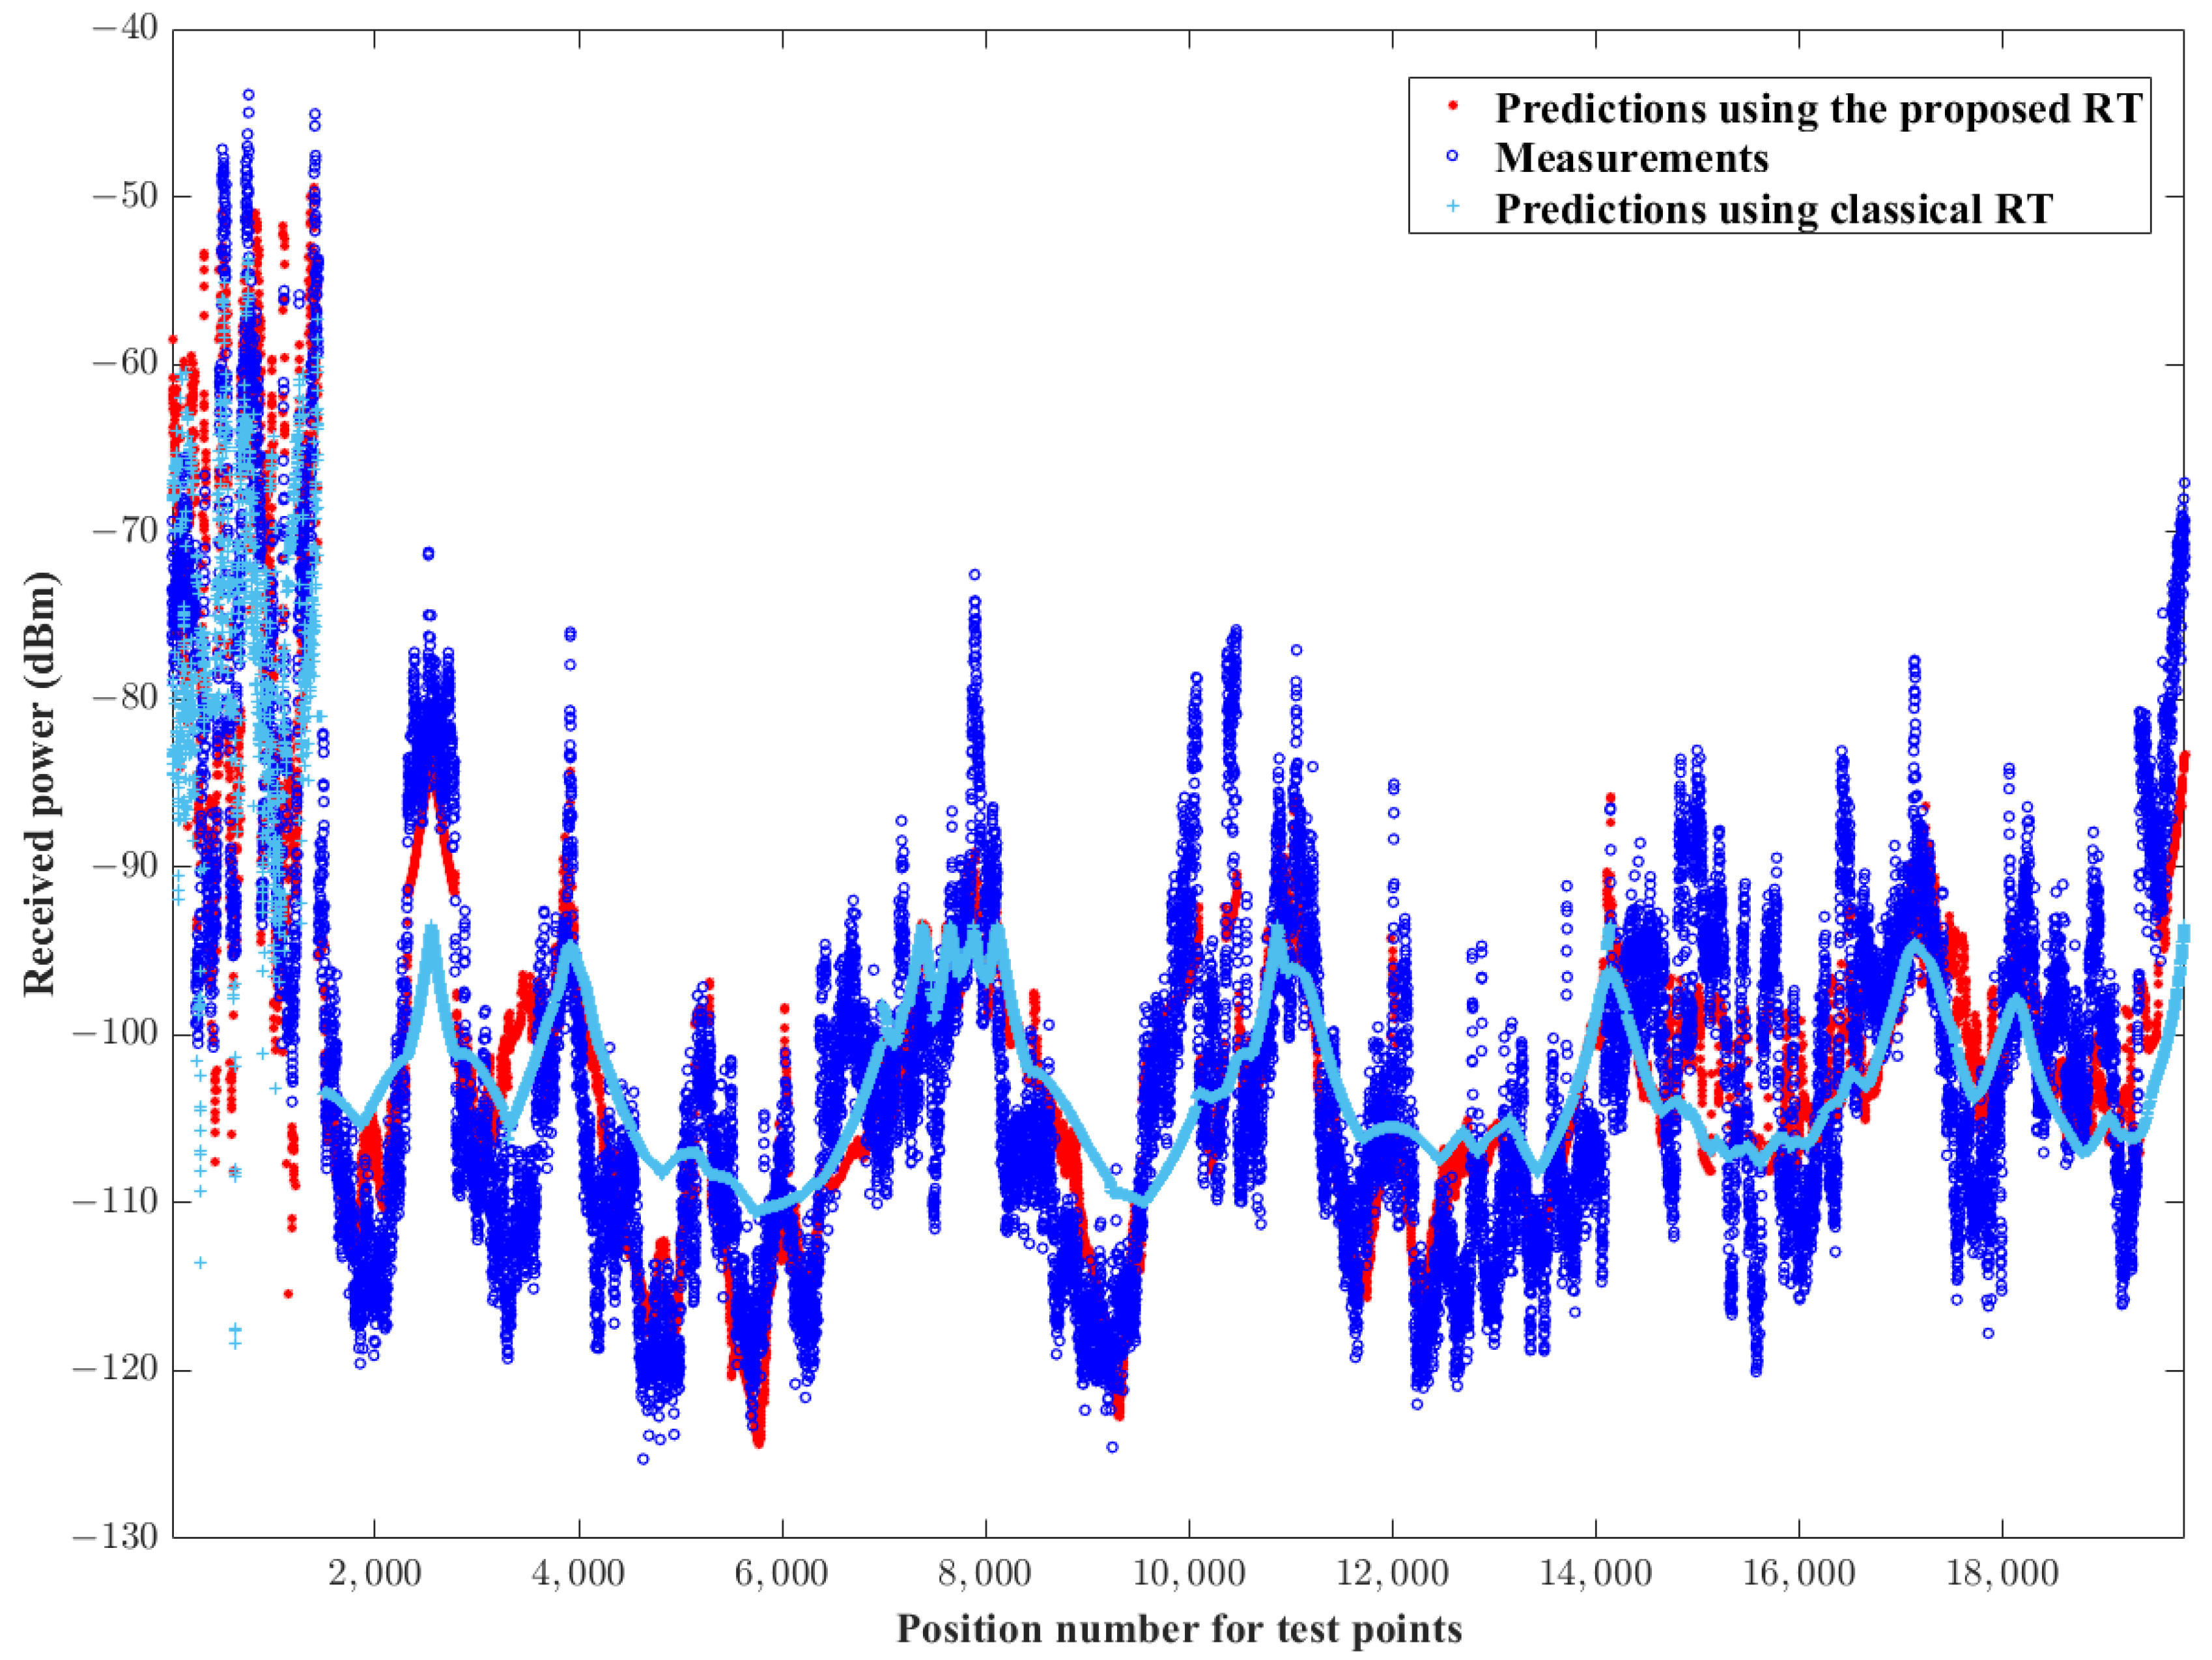
5. Power Coverage Predictions

In this section, a practical urban macrocellular environment (the core of Manhattan, USA, as depicted in Figure 1) is studied for one transmitter location. The concerned environment consists of 1242 buildings, comprising 9482 faces and edges. The Tx is located at a central area of the map at a height of 220 m. The transmitted power was 0.3 W at a center frequency of 2.0 GHz. The Rxs mounted 1.5 m above the ground are assumed to be uniformly distributed with a separation of 5 m between neighboring locations in the rectangular region (1000 m × 1000 m). Both the Tx and Rx are half-wavelength vertically polarized dipoles.
The proposed RT-based model has been coded in C. The Dell Precision M4800 Mobile Workstation used for simulations is an Intel(R) Core(TM) i7-4910MQ processor 2.90 GHz running Microsoft Windows 7 Professional with 16.0 GB RAM. All the electrical properties of the ground and buildings and the maximum studied order of reflection or diffraction used for the simulation in this section are identical to those in Section 4 (outdoor scenario 1). To fully visualize the distribution of radiation energy of the Tx under an urban macrocellular environment, RT-based power coverage predictions are presented in Figure 9. Signal power is computed for 27,156 locations of predicted simulation points. To obtain this power coverage map, the average processing time of each simulation point is about 0.17 s.

6. Conclusions

In this paper, the radio propagation prediction model based on the RT algorithm is proposed. In this model, the radio channel characterization between base stations and users in the complex macrocellular environment is considered. According to a technique that considers multiple reflections, transmissions, and diffractions through the ray path classification, the new model uses different methods to deal with different ray categories. In addition, several acceleration techniques, such as visible relationship pre-assessments among vertical walls, simulated points, orientation face sets, preprocessing for diffractions, and a 3D polar sweep algorithm, are employed to reduce the computational cost caused by high-resolution building data. Thus, the RT method exhibits high search efficiency and can be applied to various environmental scenarios. The proposed method is fundamentally a point-to-point tracing method, so reception tests are not required. To determine the accuracy of the presented model, two typical outdoor environments are investigated. Comparison of the predicted and measured results proves that reliable results are achieved. Scenario 1 is a typical urban canyon with a small coverage area, and the prediction accuracy of the proposed RT model in this scenario is better than 5.598 dBm. The prediction accuracy of the proposed RT model is better than 6.5 dBm in scenario 2 using a large amount of measurement data. The proposed method has also proven efficient in performing accurate coverage predictions (especially the LOS/NLOS reception condition) and generating reliable computations in challenging radio environments.

Author Contributions

Conceptualization, Z.L.; methodology, Z.L. and L.G.; software, Z.L. and Z.N.; validation, Z.L., P.Z. and L.G.; formal analysis, P.Z.; investigation, Z.L.; resources, Z.Z.; data curation, P.Z.; writing—original draft preparation, Z.L.; writing—review and editing, Z.L. and L.G.; visualization, J.L.; supervision, Z.L.; project administration, Z.N.; funding acquisition, Z.Z. All authors have read and agreed to the published version of the manuscript.

Funding

This work was supported in part by the key project of Social Governance and Scientific and Technological Support for Smart Society (Grant No. 2022YFC3301403), the Key Basic Research Project of the Foundation Strengthening Program, the Foundation of China Information Technology Designing & Consulting Institute Co., Ltd., and the National Natural Science Foundation of China (Grant Nos. 62231021 and U21A20457).

Data Availability Statement

The data that support the findings of this study are available from the corresponding author upon reasonable request.

Conflicts of Interest

The authors Zuoyong Nan, Zhigang Zhong are employed by the China Information Technology Designing & Consulting Institute Co., Ltd. The remaining authors declare that the research was conducted in the absence of any commercial or financial relationships that could be construed as a potential conflict of interest.

References

  1. Kim, K.; Oh, S. Geometric Optics-based Propagation Prediction Model in Urban Street Canyon Environments. IEEE Antennas Wirel. Propag. Lett. 2016, 15, 1128–1131. [Google Scholar] [CrossRef]
  2. Kocevska, T.; Javornik, T.; Švigelj, A.; Rashkovska, A.; Hrovat, A. Identification of Indoor Radio Environment Properties from Channel Impulse Response with Machine Learning Models. Electronics 2023, 12, 2746. [Google Scholar] [CrossRef]
  3. Seretis, A.; Sarris, C.D. An Overview of Machine Learning Techniques for Radiowave Propagation Modeling. IEEE Trans. Antennas Propag. 2022, 70, 3970–3985. [Google Scholar] [CrossRef]
  4. Kishore, S.; Greenstein, L.J.; Poor, H.V.; Schwartz, S.C. Uplink User Capacity in a CDMA Macrocell with a Hotspot Microcell: Exact and Approximate Analyses. IEEE Trans. Wirel. Commun. 2003, 2, 364–374. [Google Scholar] [CrossRef]
  5. Choi, M.S.; Park, H.K.; Heo, Y.H.; Oh, S.H.; Myung, N.H. A 3-D Propagation Model Considering Building Transmission Loss for Indoor Wireless Communications. ETRI J. 2014, 28, 247–249. [Google Scholar] [CrossRef]
  6. Kalliola, K.; Laitinen, H.; Vainikainen, P.; Toeltsch, M.; Laurila, J.; Bonek, E. 3-D Double-directional Radio Channel Characterization for Urban Macrocellular Applications. IEEE Trans. Antennas Propag. 2003, 51, 3122–3133. [Google Scholar] [CrossRef]
  7. Sangodoyin, S.; Kristem, V.; Umit Bas, C.; Käske, M.; Lee, J.; Schneider, C.; Sommerkorn, G.; Zhang, C.J.; Thomä, R.; Molisch, A.F. Cluster Characterization of 3-D MIMO Propagation Channel in an Urban Macrocellular Environment. IEEE Trans. Wirel. Commun. 2018, 17, 5076–5091. [Google Scholar] [CrossRef]
  8. Fan, W.; Carton, I.; Kyösti, P.; Pedersen, G.F. Emulating Ray-tracing Channels in Multiprobe Anechoic Chamber Setups for Virtual Drive Testing. IEEE Trans. Antennas Propag. 2016, 64, 730–739. [Google Scholar] [CrossRef]
  9. Puggelli, F.; Carluccio, G.; Albani, M. A Novel Ray Tracing Algorithm for Scenarios Comprising Pre-ordered Multiple Planar Reflectors, Straight Wedges, and Vertexes. IEEE Trans. Antennas Propag. 2014, 62, 4336–4341. [Google Scholar] [CrossRef]
  10. Liang, G.; Bertoni, H.L. A New Approach to 3-D Ray Tracing for Propagation Prediction in Cities. IEEE Trans. Antennas Propag. 1998, 46, 853–863. [Google Scholar] [CrossRef]
  11. Schettino, D.N.; Moreira, F.J.S.; Rego, C.G. Efficient Ray Tracing for Radio Channel Characterization of Urban Scenarios. IEEE Trans. Magn. 2007, 43, 1305–1308. [Google Scholar] [CrossRef]
  12. Franceshetti, G.; Iodice, A.; Riccio, D. Radio Propagation in the Urban Scenario, 1st ed.; Artech: Boston, MA, USA, 2023; pp. 190–195. [Google Scholar]
  13. Iskander, M.F.; Yun, Z. Propagation Prediction Models for Wireless Communication Systems. IEEE Trans. Microw. Theory Techn. 2002, 50, 662–673. [Google Scholar] [CrossRef]
  14. Mellios, E.; Nix, A.R.; Hilton, G.S. Ray-tracing Urban Macrocell Propagation Statistics and Comparison with WINNER II/+ Measurements and Models. In Proceedings of the 2012 Loughborough Antennas & Propagation Conference (LAPC), Loughborough, UK, 12–13 November 2012. [Google Scholar]
  15. Atamanesh, M.; Farzaneh, F. Microwave Wireless Orthogonal Frequency Division Multiplexing System Optimum Guard Interval Evaluation in an Urban Scenario Around 5 GHz. IET Commun. 2011, 5, 1113–1122. [Google Scholar] [CrossRef]
  16. Leonor, N.R.; Faria, S.; Ramos, G.; Castellanos, P.V.G.; Rodríguez, C.; da Silva Mello, L.; Caldeirinha, R.F.S. Site-Specific Radio Propagation Model for Macrocell Coverage at Sub-6 GHz Frequencies. IEEE Trans. Antennas Propag. 2022, 70, 9706–9715. [Google Scholar] [CrossRef]
  17. Gómez, J.; Hellín, C.J.; Valledor, A.; Barranquero, M.; Cuadrado-Gallego, J.J.; Tayebi, A. Design and Implementation of an Innovative High-performance Radio Propagation Sim-ulation Tool. IEEE Access. 2023, 11, 94069–94080. [Google Scholar] [CrossRef]
  18. Liu, H.T.; Li, B.H.; Qi, D.S. Novel Geometrical Database Model for Line-based GIS Urban Maps in 2D/2.5D Ray-tracing Algorithms. Microw. Opt. Technol. Lett. 2004, 43, 307–310. [Google Scholar] [CrossRef]
  19. OpenStreetMap. Available online: https://www.openstreetmap.org (accessed on 23 June 2021).
  20. Liu, Z.Y.; Guo, L.X.; Guan, X.W. Accelerated Ray Tracing Algorithm under Urban Macro Cell. In Proceedings of the SPIE Remote Sensing, Toulouse, France, 21–24 September 2015. [Google Scholar]
  21. Liu, Z.Y.; Guo, L.X.; Fan, T.Q. Microcellular Propagation Prediction Model Based on an Improved Ray Tracing Algorithm. J. Opt. Soc. Am. A 2013, 30, 2372–2380. [Google Scholar] [CrossRef] [PubMed]
  22. Aguado Agelet, F.; Formella, A.; Hernando Rabanos, J.M.; Isasi de Vicente, F.; Perez Fontan, F. Efficient Ray-tracing Acceleration Techniques for Radio Propagation Modeling. IEEE Trans. Veh. Technol. 2000, 49, 2089–2104. [Google Scholar] [CrossRef]
  23. El-Sallabi, H.M.; Vainikainen, P. Improvements to Diffraction Coefficient for Non-perfectly Conducting Wedges. IEEE Trans. Antennas Propag. 2005, 53, 3105–3109. [Google Scholar] [CrossRef]
  24. Sarkar, T.K.; Ji, Z.; Kim, K.; Medouri, A.; Salazar-Palma, M. A Survey of Various Propagation Models for Mobile Communication. IEEE Antennas Propag. Mag. 2003, 45, 51–82. [Google Scholar] [CrossRef]
Figure 1. Simplification of buildings obtained from a digitized map in an urban macrocell (Manhattan city core). The Tx is located at T (marked by asterisks).
Electronics 13 01451 g001
Figure 2. Flowchart of the proposed outdoor 3D ray-tracing model.
Electronics 13 01451 g002
Figure 3. Top view of the outside test environment obtained from Google Maps (left) and the corresponding environment (top view and 3D view) reproduced in MATLAB (right). Buildings are represented by gray objects, and white areas represent free space. The transmitter is located at T (marked by red asterisk), and all the test points are marked by blue dots.
Electronics 13 01451 g003
Figure 4. Biconical antenna.
Electronics 13 01451 g004
Figure 5. Comparison of the calculated and measured received power characteristics for two carrier frequencies: (a) 610 and (b) 990 MHz.
Electronics 13 01451 g005
Figure 6. Distribution of urban environment, measurement route, and Tx position (marked by red asterisk) in outdoor scenario 2.
Electronics 13 01451 g006
Figure 7. Radiation pattern of the Tx.
Electronics 13 01451 g007
Figure 8. Received power predictions and measurements along the measurement route in outdoor scenario 2.
Electronics 13 01451 g008
Figure 9. Power coverage map.
Electronics 13 01451 g009
Table 1. Error comparison between predicted and measured results in outdoor scenario 1.
FrequencyMeanStandard Deviation
610 MHz−2.074 dBm5.114 dBm
990 MHz3.667 dBm5.598 dBm
Table 2. Error comparison between predicted and measured results in outdoor scenario 2.
Propagation ModelMeanStandard Deviation
Proposed RT0.22 dBm6.49 dBm
Classical RT0.46 dBm8.62 dBm
Disclaimer/Publisher’s Note: The statements, opinions and data contained in all publications are solely those of the individual author(s) and contributor(s) and not of MDPI and/or the editor(s). MDPI and/or the editor(s) disclaim responsibility for any injury to people or property resulting from any ideas, methods, instructions or products referred to in the content.

