Abstract
With the continuous increase in the installed capacity of new energy systems, the impact of power shocks on grid frequency is becoming more significant, seriously affecting the stability of the grid and thermal power units. For this reason, a mixed variable parameter energy storage-assisted frequency support control method is proposed. This method introduces an integral control mode based on the existing control mode and forms a co-ordinated control mode. The impact of the switching point of the mixed control mode is analyzed, and a new mode switching method is used. The model adjusts the frequency regulation parameters according to the different states of the grid frequency, making the frequency regulation more efficient. Finally, a frequency regulation model that integrates various improvement methods is built, and a 10 min continuous load disturbance is applied to compare and verify the frequency regulation performance of the model as a whole. The results indicate that the proposed control method can significantly improve the quality of grid frequency regulation, reduce the frequency deviation amplitude to 0.00096 p.u., reduce the participation time of thermal power units to 190.8393 s, and reduce the peak output to 0.1934 MW, demonstrating its engineering feasibility.
1. Introduction
In response to the trend of global warming, many countries have proposed carbon reduction targets and related measures, an important part of which is the development of new energy technologies. At present, the installed capacity of photovoltaics and wind turbines is continuously increasing worldwide []. However, a large amount of wind and solar energy in the grid is significantly affected by environmental factors and has the characteristics of fluctuation and intermittency []. Power shocks can cause instability of grid frequency, which seriously affects the stability of the use of electrical equipment. In addition, similar to new energy equipment, large fluctuations in electricity load in a small area can also cause variations in power grid frequency.
In the application scenario of wind power or photovoltaic power connected to the power grid in a small area and normal fluctuations in the electricity load in the area, for example, the wind energy density in coastal areas is relatively high, there are more wind turbines installed, and the impact of wind direction and wind force changes on the power grid power shock is relatively large. The day and night fluctuations and short-term fluctuations of the surrounding residents and industrial electricity consumption will also cause power shocks. Therefore, it is very important to support the power grid frequency in this small area.
Traditional frequency regulation usually only uses thermal power units, which are associated with issues of overshoot, undershoot, and affecting the life of the units []. Modern methods use energy storage to assist thermal power units in smoothing new energy fluctuations. The frequency support strategy assisted by energy storage has the advantages of good robustness and high control flexibility [].
The research on the control strategy of energy storage-assisted grid is currently a hot spot [], including improvements to traditional control modes and optimization of energy storage capacity. Reference [] proposes a simulation model of flywheel energy storage-assisting frequency regulation of thermal power units, and verifies that energy storage can reduce the frequency regulation burden of thermal power units and extend the life of thermal power units, under the addition of 0.008 p.u. step disturbance, the output power change in the thermal power unit is reduced from 4.714 × 10⁻³ p.u. to 3.197 × 10⁻³ p.u.; Reference [] studies the response mechanism of proportional integral virtual inertia control, and derives the relationship between virtual inertia control and grid frequency; Reference [] proposes a mixed control method that complements the advantages of traditional virtual droop and virtual inertia control, and introduces negative virtual inertia control, and verifies the feasibility of the method according to the simulation frequency regulation effect. Under the continuous load disturbance set in this literature for 5 min, the frequency deviation is reduced to half of the energy storage; Reference [] proposes a control mode that switches between virtual inertia control and virtual droop control, and determines the mode-switching point based on the time-domain sensitivity principle and frequency regulation indicators; Reference [] proposes a technical economic model based on considering the participation of energy storage batteries in frequency regulation, and designs a capacity configuration strategy to balance frequency regulation performance and economy; Reference [] proposes a flexible wind-storage joint frequency control strategy that takes into account the frequency regulation dead zone, and studies the impact of the frequency regulation dead zone on the participation of energy storage in frequency regulation; Reference [] proposes to use the variable K droop control method to improve, so that the state of charge of the energy storage battery remains within the normal range; Reference [] establishes a frequency response model of the virtual inertia wind-storage joint system and proposes a co-ordinated support control strategy. Under conditions where the wind speed change is 0.012 p.u., the maximum frequency change is reduced to 0.43 Hz.
In addition, in terms of energy control strategies, various optimization control algorithms are also extensively employed. In Reference [], a mixed adaptive algorithm using continuous mixed p-norm (CMPN) and block sparse Bayesian technology (BSB) is used to configure energy-storage units, improving the transient stability of wind power plants. In Reference [], a model predictive control algorithm (MPC) is used to configure the energy storage system, and a wavelet packet decomposition algorithm is used to extract the high-frequency component of power fluctuation. Finally, the high-frequency component fluctuation in the output power of the wind power plant is smoothed, and the high-frequency wind energy above 300 kW is suppressed to below 100 kW. Reference [] couples the flywheel energy storage array (FESA) and uses automatic generation control (AGC) to improve the operational flexibility of traditional thermal power units. Reference [] uses an improved measurement of the rate of change of frequency (RoCoF) to improve the effect of virtual inertia control and mitigate the impact of power shocks caused by photovoltaic power generation.
However, current studies on energy storage-assisted grid frequency regulation face notable limitations: current research mainly focuses on the mixing and switching of traditional virtual droop control and virtual inertia control, and the mixed traditional control mode has the disadvantage of undershoot. Existing research such as Reference [] uses control mode switching, but rarely considers the impact of the control mode switching point on the frequency support performance. The existing control mode that adjusts the frequency regulation coefficients in real time is only limited to adjustment according to the state of charge of energy storage, and does not adjust parameters according to the real-time state of grid frequency and optimize the performance of energy storage frequency regulation.
Based on the above analysis, a mixed variable parameter energy storage-assisted power grid frequency support system is proposed. Within the power grid of the aforementioned power fluctuation area, a flywheel energy storage system is integrated as a frequency support device, and energy output/input is carried out according to the energy storage-assisted control strategy. Subsequent analysis focuses on how parameters and control modes of energy storage-assisted frequency support impact power grid frequency modulation, the way in which integral control mode is introduced, how a new type of control mode switching method is adopted, and how the droop coefficient, inertia coefficient and other frequency support related parameters are adjusted in real time, ultimately reducing the frequency fluctuation and deviation of the power grid and improving the performance of frequency support. A thermal power unit–flywheel energy storage model is established, the proposed energy storage mixed control model is integrated, and the system is simulated under continuous disturbance (compared with the traditional frequency support model). It is then confirmed that the model in this study improves the performance of power grid frequency support, and can effectively reduce the frequency deviation amplitude and the time of a thermal power unit’s participation in the output in the power shock environment of long-term unstable new energy and electricity load in a small area, and improve the performance of new energy grid connections. The entire simulation is conducted in MATLAB(R2022b)/Simulink.
2. Thermal Power Units—Flywheel Energy Storage Model
2.1. Thermal Power Units Model
When a load disturbance occurs in the grid, the mechanical power and electromagnetic power on both sides of the generator in the thermal power units are not equal, causing the generator speed to change, thereby changing the grid frequency. At this time, the speed control system inside the thermal power units can adjust the output power of the thermal power units to restore the grid frequency to the original level. The transfer function between the system power change amount and the regional grid frequency change amount is usually represented by Equation (1).
where, H is the load inertia coefficient, and D is the load damping coefficient.
The transfer function of the steam turbine model inside the thermal power units is represented by Equation (2).
where, Fc, Fr, and Fl represent the power output ratios of the high, medium, and low pressure cylinders of the steam turbine, respectively. Tc, Tr, and Tl represent the time constants of high-pressure steam, reheated steam, and low-pressure steam, respectively.
Although thermal power units can participate in grid frequency regulation, this is not conducive to the normal combustion of the unit. The addition of energy storage devices can ensure the long-term normal operation of thermal power units, while enhancing the efficiency of grid frequency regulation and improving the flexibility of energy dispatch.
2.2. Flywheel Energy Storage Model
The energy storage system in the model is flywheel energy storage, which uses a flywheel unit with a large moment of inertia to store electrical energy in the form of rotational kinetic energy through a motor. It outputs energy to the outside through the flywheel unit driving the generator. Current research usually uses flywheel motors that can transmit electrical energy in both directions, saving the time required for charge- and discharge-switching. Flywheel energy storage can charge and discharge at high power in a short time, has high energy storage density, and has a long life [], suitable for grid frequency regulation applications. By monitoring the angular velocity of the flywheel energy storage unit, the state of charge (SOC) of the flywheel energy storage can be obtained. The energy of the flywheel energy storage can be represented by Equation (3).
where, J is the moment of inertia of the flywheel unit, and ω is the angular velocity of the flywheel rotation. The SOC of flywheel energy storage represents the relationship between the remaining energy of flywheel energy storage and the maximum capacity of flywheel energy storage, which is calculated using Equation (4).
where, QR represents the maximum energy storage capacity of the flywheel, and Qw represents the energy output from the flywheel to outside.
The transfer function between the command power and output power of the flywheel energy storage is represented by Equation (5). Equation (5) shows the response speed of the flywheel energy storage system, where the mechanical inertia of the flywheel motor is the main factor affecting the response speed.
where TS is the time constant of flywheel energy storage.
When the SOC is close to 1/0, if the flywheel energy storage unit continues to charge/discharge, it will cause the flywheel motor to work beyond the limit state, causing power loss and affecting the life of the flywheel energy storage unit. Therefore, SOCmax and SOCmin are set to 0.90 and 0.10, respectively, which are the maximum and minimum values of the SOC of flywheel energy storage. When considering the power of the flywheel energy storage unit to absorb/release energy, it is necessary to limit the power according to the SOC of flywheel energy storage. The logistic curve is usually used to limit the output of energy storage []. The power limitation curve used in the model is shown in Equations (6) and (7).
where, Pm is the rated power of flywheel energy storage, and a, b, K are constants. Changing the constants according to specific requirements can change the shape of the logistic curve. The power limitation curve used in the model is shown in Figure 1.
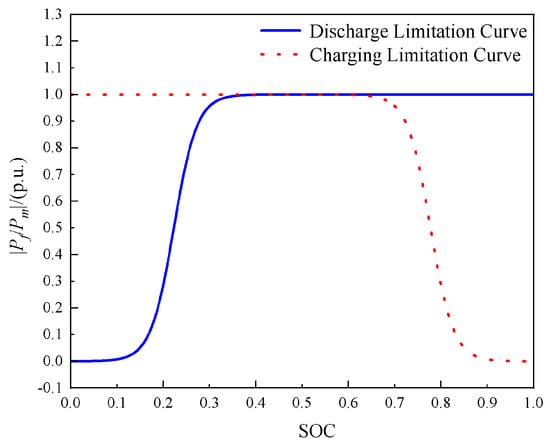
Figure 1.
SOC power limitation curve.
2.3. Integrated Regulation Model
In the model, the thermal power units and flywheel energy storage always serve in the process of the grid frequency regulation. In addition, a commonly used two-area model is adopted for research. The significance of this model is that when one of the two areas experiences frequency fluctuations, a nearby area can provide power support. Power is exchanged between the two places through a tie line. This model can simplify the current research hotspot of multi-area interconnected grids [], which holds greater significance for modern power systems. The integrated frequency regulation model is shown in Figure 2. In the figure, the tie line obtains the corresponding target tie line power value after the frequency difference between the two areas is calculated, and then transmits the corresponding power value.
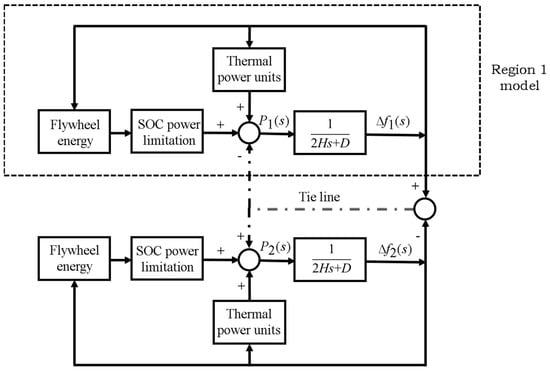
Figure 2.
Integrated frequency regulation model.
The transfer function used by the tie line is shown in Equation (8).
where, T0 is the synchronization coefficient of the tie line, and s is the Laplace operator.
All parameters in this model are given in Table 1.

Table 1.
Parameters of integrated frequency regulation model.
3. Energy Storage Mixed Control Mode
At present, the control modes of energy storage mostly adopt virtual droop control or virtual inertia control (hereinafter referred to as droop control and inertia control). Among them, droop control has disadvantages such as a large rise rate and a large frequency fluctuation amplitude, which are not conducive to the normal operation of the grid; although inertia control can suppress the rise rate of frequency during frequency fluctuations, the grid frequency stabilization time is too long, and it cannot guarantee that the grid frequency will eventually return to the normal level. Reference [] clarifies that the larger the energy storage virtual inertia coefficient KL in droop control and virtual control, the faster the initial change rate of frequency can be suppressed, but it does not contribute to reducing the steady-state deviation; the larger the energy storage virtual droop coefficient KD, the smaller the steady-state deviation, but it cannot suppress the initial change rate of frequency. The model of the traditional energy storage control mode is no longer redundant. Figure 3 shows the frequency fluctuation of the grid adopting two traditional control modes when a step load is applied.
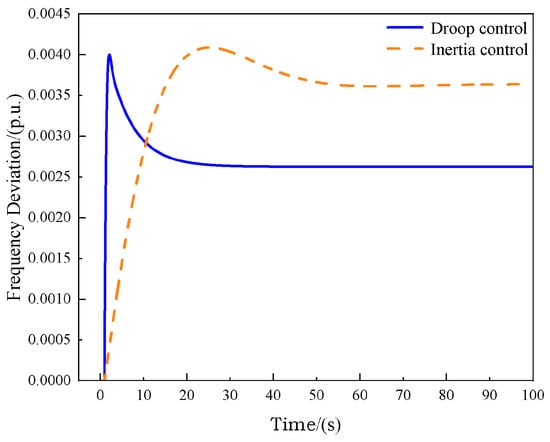
Figure 3.
Frequency deviation curve of traditional energy storage control mode.
The frequency deviation Δf in frequency regulation is significantly affected by the control mode of energy storage. However, most of the current research on the control mode of energy storage is focused on the mixed mode of droop control and inertia control or the control mode of variable droop and inertia coefficients. In the research involving real-time switching of frequency regulation control modes, little consideration is given to the impact of the switching point of the control mode on the effect of frequency regulation.
In this study, simulation analysis indicated that the switching point of the mode has a greater impact on frequency regulation and a better mode switching point could be chosen; integral control was introduced and combined with droop control and inertia control, constituting a mixed control mode, and was switched according to the switching threshold. Finally, the droop coefficient, inertia coefficient, and integral coefficient were adjusted in real time according to the state of frequency regulation, having different effects at different stages. The overall mixed variable parameter frequency regulation model is shown in Figure 4.
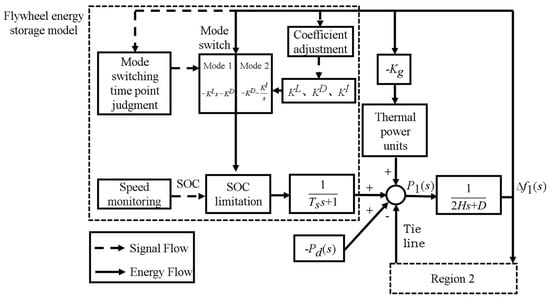
Figure 4.
Mixed variable parameter frequency regulation model.
In Figure 4, KI is the integral coefficient, Pd(s) is the change in load power, P1(s) is the total power change in Region 1, Δf1(s) is the frequency deviation in Region 1, and Kg is the unit regulation power of the thermal power units.
After the load causes changes in the grid frequency, the thermal power units and flywheel energy storage participate in grid frequency regulation. The energy storage chooses the control mode according to the mode switching point and calculates the target output power of the flywheel energy storage with the adjusted frequency regulation coefficient. The system monitors the speed of the flywheel unit, calculates the SOC of the flywheel energy storage, and limits the output of the flywheel energy storage. The total power change P1(s) includes four parts: the power change in the thermal power units, the power change in the flywheel energy storage, the power change in the load, and the power change of the support in Region 2. The model in Region 2 is exactly the same as the model in Region 1, so it will not be repeated.
The frequency deviation relationship of Region 1 under the mixed variable parameter frequency regulation control model can broadly be represented by Equation (9).
where, F(s) is the control mode transfer function, is the SOC limit power of the flywheel energy storage, and n and (s) are represented by Equations (10) and (11) respectively.
where, n is the direction of flywheel output power, and (s) is the frequency deviation in Region 2.
4. Control Analysis
4.1. Control Mode
During the operation of the grid, the change in grid frequency can be divided into two states: the frequency deviation state and frequency recovery state. The frequency deviation state is the process wherein the frequency deviation value gradually increases shortly after the grid is subjected to load fluctuations; the frequency recovery state is the process wherein the frequency deviation value gradually decreases under the action of frequency regulation. This study adopts two modes and switches in real time to control the output of flywheel energy storage. In the frequency deviation state, the inertia + droop mixed mode is adopted, and in the frequency recovery state, the droop + integral mixed mode is used. There is a mode switching process between these two states, as shown in Figure 5.
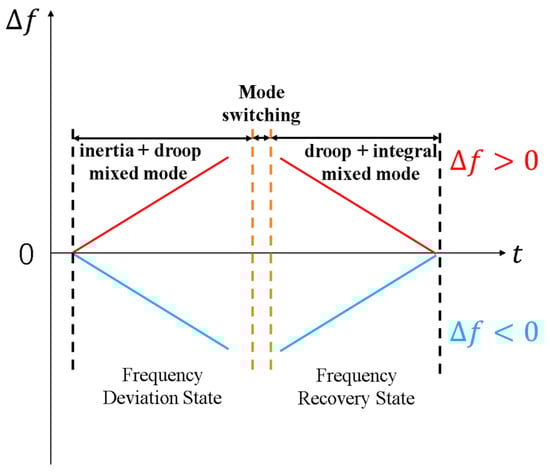
Figure 5.
Schematic diagram of energy storage control mode.
When working under two modes, the system calculates the output size command sent to the energy storage according to the control function corresponding to the mixed mode. The control function of the inertia + droop mixed mode can be expressed as:
in which inertia control can monitor the slope of grid frequency fluctuation and suppress the deviation rate of frequency in the frequency deviation state, and if there is only inertia control, the time to enter the frequency recovery state will too late, which will cause the frequency deviation to be too large; thus, in this state, droop control is added to collaborate with inertia control, and droop control can accelerate the entry into the frequency recovery state and enhance the suppression of frequency deviation.
The control function of the droop + integral mixed mode can be expressed as:
in which droop control can measure the deviation value of grid frequency fluctuation; in the frequency recovery state, it can quickly reduce the frequency deviation value, and it can reduce the frequency deviation degree when stable. If the system relies only on droop control, it will still have a certain frequency deviation in the end, and after adding integral control, the deviation can be further reduced. The integral control mode used in this study resets when the frequency deviation value crosses zero, to prevent the phenomenon of reverse regulation caused by integral control under continuous reverse disturbance, especially when the amplitude of the second load disturbance is smaller than the amplitude of the first load disturbance, as shown in Figure 6. Reverse regulation causes the frequency deviation peak to be too large, affecting the frequency regulation effect.
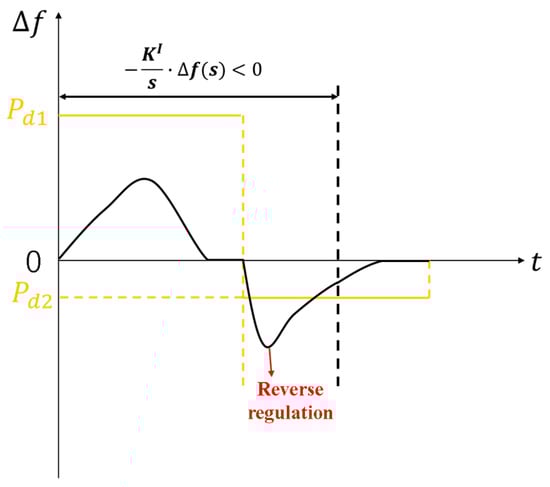
Figure 6.
Schematic diagram of reverse regulation.
This study sets the rated capacity of the thermal power units to 100 MW and the base frequency to 50 Hz. The subsequent related parameters are expressed in per-unit values based on the rated capacity and base frequency. In addition, the specifications of flywheel energy storage are set to 6 MW/0.5 MW·h according to the findings proposed in Reference []. The parameters selection for the subsequent part refer to References [,].
Assuming that KL, KD, and KI are constants, the mode switching threshold is set as a constant, and the tie-line power of other regions is not considered. The frequency state is determined according to the size relationship between the slope of the Δf curve and the mode switching threshold t0, and then the control mode switching is determined, specifically as follows:
- If Δf > 0 and dΔf/dΔt > t0, use the inertia + droop mixed mode.
- If Δf < 0 and dΔf/dΔt < −t0, use the inertia + droop mixed mode.
- If Δf > 0 and dΔf/dΔt ≤ t0, use the droop + integral mixed mode.
- If Δf < 0 and dΔf/dΔt ≥ −t0, use the droop + integral mixed mode.
This control mode is compared with the traditional control mode and the mixed control mode in Reference [] (the “inertia + droop” control switches to droop control, herein referred to as the “comparative literature mode”) under the step load disturbance (−0.05 p.u. applied at 1 s). The frequency deviation is shown in Figure 7, the power change in the thermal power units is shown in Figure 8, and the corresponding frequency regulation indicators are shown in Table 2 (the control coefficients KL, KD, and KI of each control mode are equal: KL is 50, KD is 80, and KI is 100).
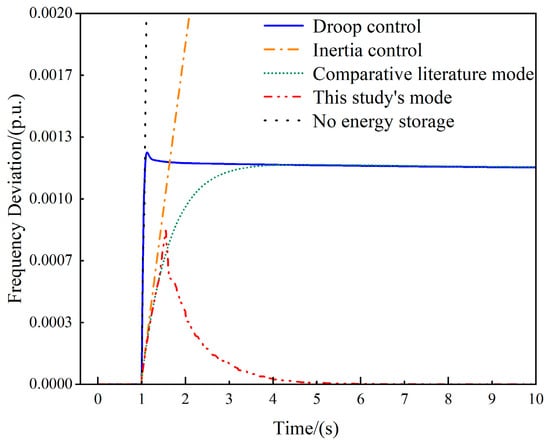
Figure 7.
Frequency deviation curve of each control mode under step load disturbance.
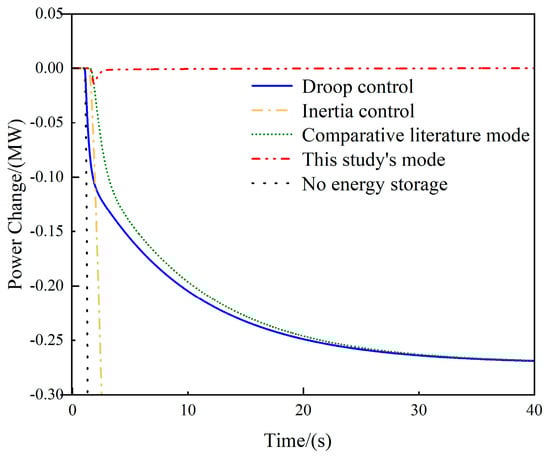
Figure 8.
Power change curve of thermal power units under step disturbance for each control mode.
Table 2.
Frequency modulation indicators for each control mode.
In Table 2, |Δfm| is the absolute value of the frequency deviation peak and tp is the time from the start to the frequency deviation peak (the smaller these two values, the stronger the ability to suppress the deterioration of frequency regulation); ts is the time from the start to the frequency stability (the smaller its value, the stronger the stabilizing effect of frequency regulation on the grid); Δfs is the steady-state value of frequency deviation, which is the stable value of grid frequency after frequency regulation (the smaller its value, the better the outcome); and Pp is the peak value of the power change in the thermal power units and Ps is the steady-state value of the power change in the thermal power units (the smaller the absolute values of Pp and Ps, the smaller the output of the thermal power units and the better the safety performance of the thermal power units).
From Figure 7, it can be seen that the frequency deviation of the five control modes is zero before the step load disturbance reaches 1 s, and the flywheel energy storage system does not work; at 1 s, due to the impact of the negative step load disturbance, the grid frequency is disturbed and increased. At this point, the thermal power units and the flywheel energy storage system output negative power to suppress power deterioration. The initial frequency change rate of no energy storage and droop control is larger, the initial frequency change rate of inertia control, comparative literature mode and the mode used in this study is smaller. At around 1.1 s, droop control first reaches its peak; at around 4 s, this study’s mode also reaches the frequency peak, but the absolute value of the frequency peak is significantly lower than other control modes; when the grid frequency is stable, inertia control and no energy storage have a larger steady-state frequency deviation, the comparative literature mode and droop control have a smaller steady-state frequency deviation, and the study’s mode has basically no frequency deviation in the steady state, and the time to reach the steady state is less, only approximately 4.6 s. From Figure 8, it can be seen that under the control mode of this study, the peak value of the power change in the thermal power units is only about −0.01 MW, its absolute value is significantly smaller than other control modes, the speed to reach the steady state is significantly faster, and at the steady state, the thermal power units basically do not output extra power for frequency regulation, and the operation stability of the thermal power units is good.
Figure 7 and Figure 8 and Table 2 show that the frequency deviation peak of this study’s control mode is the smallest, which is 0.00083 p.u., and that it can reduce the steady-state value of frequency deviation to 0, the time spent on frequency regulation only takes about 3.6 s, the power change in the thermal power unit is significantly smaller, and it has good engineering feasibility.
4.2. Allocation of Coefficients
The larger the droop coefficient, inertia coefficient and integral coefficient, the larger the output amplitude of energy storage in grid frequency support, and the better the corresponding frequency regulation effect. The role of each coefficient in the frequency regulation process has been explained in Section 4.1, and the degree of the role of the above coefficients in each state of frequency regulation is different, so adjusting the above parameters according to different time points can improve the efficiency of frequency regulation and directly increasing the size of all coefficients can improve the effect of frequency regulation, but the energy consumption is higher, which is not conducive to the SOC of flywheel energy storage staying in the normal range.
This study sets the droop coefficient and inertia coefficient in the frequency deviation state to satisfy the following equation:
where, KA and g are constants, and both are positive values, KA is the sum of the droop coefficient and inertia coefficient in the frequency deviation state. The size of KA is determined by the local load disturbance environment—the larger the load disturbance amplitude, the larger the value of KA and the value of g needs to be obtained through experiments for the optimal value.
From Equations (14) and (15), it can be elucidated that in the parameter allocation of the frequency deviation state, the larger the frequency change rate, the larger the inertia coefficient; the reason for this is that, in the early stage of load disturbance, the inertia control needs to maximize the suppression of the deviation rate of frequency; after the load disturbance, the grid frequency gradually approaches the peak, and the change rate gradually decreases. At this time, the role of inertia control also gradually decreases, and the droop coefficient gradually increases, and the droop control role is strengthened, which makes the flywheel energy storage enter the frequency recovery state faster.
This study sets the integral coefficient and droop coefficient in the frequency recovery state to satisfy the following equation:
where KB, p, and d are constants and positive values, KB is the sum of the droop coefficient and integral coefficient in the frequency deviation state. The larger the local load disturbance amplitude, the larger the value of KB, and the smaller the value of d, the value of p needs to be obtained through experiments to obtain the optimal value.
From Equations (16) and (17), it can be established that in the frequency recovery state, the larger the absolute value of frequency deviation, the larger the droop coefficient, which can maximize the role of droop control and quickly reduce the frequency deviation. Then, the role of droop control is gradually reduced, enhancing the role of integral control, and the steady-state frequency deviation is reduced. In Equation (16), the maximum value of is limited to prevent the frequency deviation from being small; if continues to increase, it will cause the frequency deviation to cross zero, causing the integral control to clear and the frequency deviation oscillation phenomenon under continuous disturbance.
When this coefficient configuration mode is adopted, the sum of parameters under different states is a constant, thereby preventing the power output of energy storage from being too large. In the early stage of frequency deviation, the rate of change in grid frequency is large and the frequency deviation is small. The energy output corresponding to inertia control is large. At this time, is large and is small. According to Equation (12), the amplitude of energy storage output increases and the rate of frequency change is greatly suppressed. In the later stage of frequency deviation, the rate of change in grid frequency is small and the frequency deviation is large. Inertia control hardly plays a role, and the energy output corresponding to droop control is large. At this time, is large and is small. According to Equation (12), the amplitude of energy storage output increases and the frequency deviation is greatly suppressed. When the effect of inertia control is weak, it transitions to the frequency recovery state. In the early stage of frequency recovery, the energy output corresponding to droop control is large, is large, and is small. According to Equation (13), the amplitude of energy storage output increases and continues to suppress frequency deviation. In the later stage of frequency recovery, the frequency deviation is small, and droop control can hardly play a role. However, under inertia control, the energy storage output continues to increase. is small and is large. According to Equation (13), the amplitude of energy storage output increases, making the frequency return to normal level.
The mode switching threshold is set as a constant, and the tie-line power of other regions is not considered; the energy storage control mode with coefficient allocation is compared with the energy storage control mode with fixed coefficients under the step load disturbance (apply −0.05 p.u. at 5 s), as shown in Figure 9 (KA and KB are both 120, d is 0.71, and the control coefficients of each control mode of the energy storage control mode with fixed coefficients are all 60).
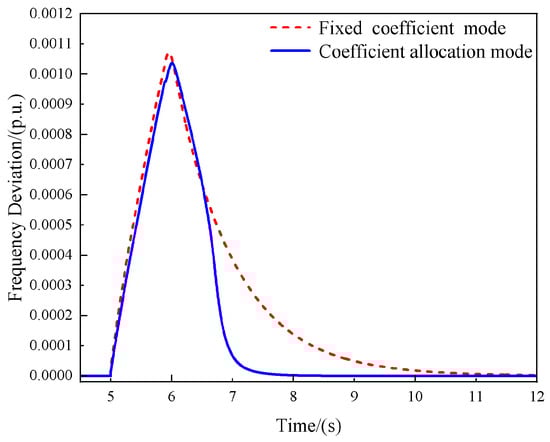
Figure 9.
Frequency deviation curves of two coefficient allocation control modes.
From Figure 9, it can be seen that after adopting the coefficient allocation mode, the deviation rate and deviation peak of frequency in the frequency deviation state are reduced; the time spent on frequency regulation is significantly reduced, among which the coefficient fixed mode frequency regulation takes about 7 s, while the coefficient allocation mode frequency regulation only takes about 2.7 s to stabilize the frequency deviation at 0 p.u. In the process of grid frequency regulation, the coefficient allocation mode can improve the frequency regulation performance, and the control mode with integral control participating in the frequency recovery stage has a strong recovery effect, which has a certain guiding significance for engineering applications.
4.3. Mode Switching Method
Most of the current literature considers the switching between energy storage control modes when studying energy storage-assisting grid frequency support. They usually use a threshold as a constant to simply switch the control mode. For example, in frequency regulation in Reference [], it first judges whether Δf is greater than or less than the frequency deviation threshold, and then judges whether dΔf is greater than or less than 0 to switch the energy storage control mode. However, the switching point of the energy storage control mode has a significant impact on the actual frequency regulation effect. At present, no method in the literature can obtain the best frequency regulation effect under all load disturbance conditions based on the size of Δf or dΔf/dt. This section first determines the control mode switching through the size relationship between dΔf/dt and the mode switching threshold t0 (the specific switching method has been explained in Section 4.1) and then changes t0 to observe the impact of the size of the mode switching threshold on the frequency regulation effect; finally, a better mode switching method is proposed and verified.
Without considering the tie-line power of other regions, using different mode switching thresholds, under different degrees of step load disturbance (all apply negative disturbance at 5 s), the frequency deviation curve is observed, as shown in Figure 10, Figure 11 and Figure 12.
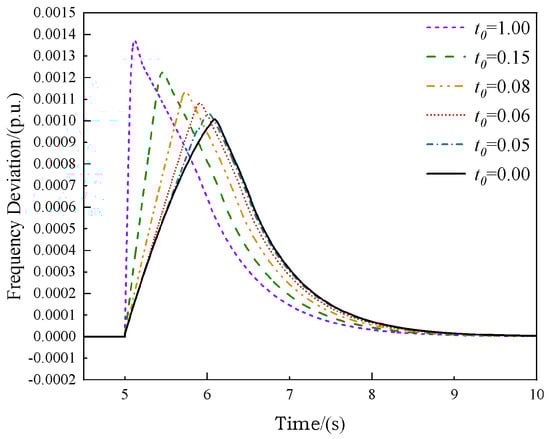
Figure 10.
Frequency deviation curve of different mode switching thresholds under −0.05 p.u. step disturbance.
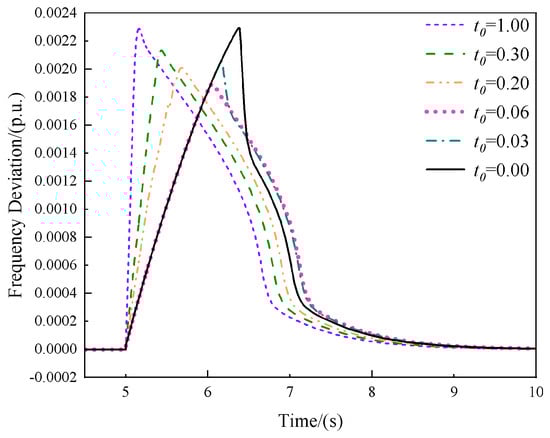
Figure 11.
Frequency deviation curve of different mode switching thresholds under −0.1 p.u. step disturbance.
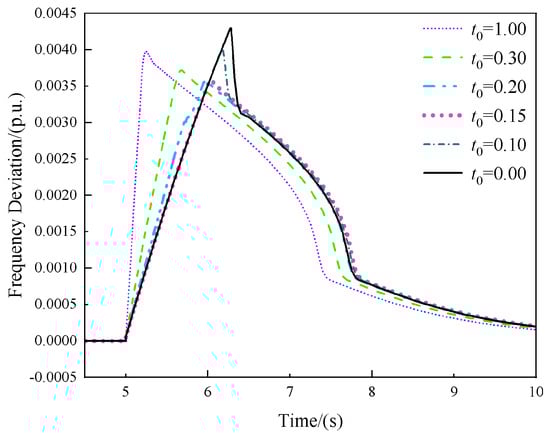
Figure 12.
Frequency deviation curve of different mode switching thresholds under −0.2 p.u. step disturbance.
From Figure 10, Figure 11 and Figure 12, it can be seen that under different degrees of step disturbance, the size of the mode switching threshold has a significant impact on the frequency regulation result. t0 = 0.00 is the mode switching method adopted by most of the current literature. When the step disturbance is −0.05 p.u., t0 = 0.00 is the switching method with the smallest frequency deviation peak. However, when the step disturbance is −0.1 p.u. or −0.2 p.u., it becomes the switching method with the largest frequency deviation peak. Therefore, comparing dΔf/dt with the fixed value of t0 to switch the mode cannot obtain the best frequency regulation effect under all disturbances. When t0 = 1.00, the energy storage has entered the frequency recovery phase as soon as the step disturbance occurs, and the droop + integral mixed mode is used throughout the process. The frequency deviation changes quickly, but the frequency deviation peak is large. The t0 values corresponding to the smallest frequency deviation peak in Figure 10, Figure 11, and Figure 12 are approximately 0.00, 0.06, and 0.15, respectively. By applying a larger amplitude of load disturbance, it is found that the t0 corresponding to the smallest frequency deviation peak when the frequency deviation peak is the smallest is larger. Therefore, as the amplitude of the load disturbance increases, the t0 corresponding to the smallest frequency deviation peak is larger.
The reason for the above results mainly lies in the size relationship of the energy storage output corresponding to the two mixed modes. For example, in Figure 11, when t0 is between 0.2 and 1.0, the droop + integral mixed mode quickly switches to the inertia + droop mixed mode. At this time, the energy storage output corresponding to the droop + integral mixed mode is larger, and the energy storage output corresponding to the inertia + droop mixed mode is smaller, so the suppression effect on the frequency after switching is weaker. When the size of t0 is approximately 0.06, the energy storage output power of the inertia + droop mixed mode and the droop + integral mixed mode at the switching point is basically the same. According to Equations (9), (12), and (13), the effect of inertia control will weaken later, and the effect of integral control will strengthen, so switching the control mode at this time will provide a greater frequency suppression effect. The characteristic of switching the time point too early is that the frequency deviation will still increase after switching the control mode, and switching the time point too late will cause the frequency deviation peak to be too large. In addition, as the amplitude of the load disturbance increases, the speed of the integral control effect will increase, so the best switching time point will advance.
There are many indicator parameters for grid frequency regulation. In order to reduce the difficulty of analysis, this study mainly considers the frequency deviation peak when considering the mode switching method. Other indicator parameters will be considered comprehensively in subsequent research by sacrificing a certain frequency deviation peak. When considering the switching point of the energy storage control mode, this study will adopt the switching mode as shown in Figure 13. In the frequency deviation state, due to the larger frequency increase rate in a short time after the load disturbance, the absolute value of the energy storage command power corresponding to the inertia + droop mixed mode is larger. The frequency offset is smaller in a short time and the integral quantity is smaller, so the absolute value of the energy storage command power of the droop + integral mixed mode is lower. After a certain period of time, the frequency offset and integral quantity are large enough, and the frequency increase rate gradually decreases. At this time, the absolute value of the energy storage command power of the droop + integral mixed mode will be greater than the absolute value of the energy storage command power of the inertia + droop mixed mode. In terms of the ability to suppress frequency deterioration, the droop + integral mixed mode is stronger, so it switches to the droop + integral mixed mode at this time and enters the frequency recovery state, and the frequency regulation effect is better.
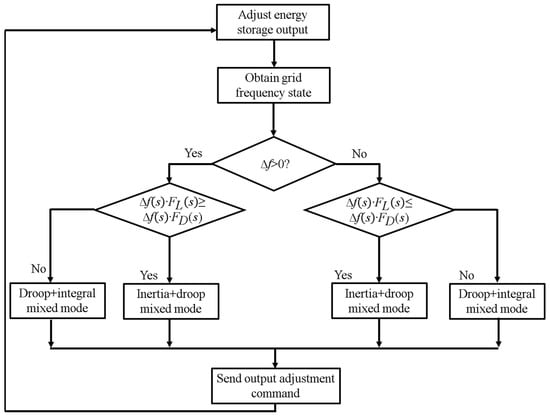
Figure 13.
Energy storage control mode switching process.
Due to the different energy storage control modes used in Reference [] compared to this study, it is inconvenient to compare the mode switching methods. Therefore, only some parts of the switching points in Reference [] that are most suitable for the mode of this study are selected as a reference for comparison (the frequency deviation threshold Δfp is taken as the per unit value 0.001, if |Δf| < Δfp and df·Δf > 0, it is considered to be in the frequency deviation state, and in other cases, it is in the frequency recovery state, which is referred to as the comparison literature switching mode in the following text). This study’s switching mode, the comparative literature switching mode, and the fixed mode switching threshold of t0 = 0 (referred to as switching mode 1 in the following text) are compared. A step load disturbance of −0.1 p.u. is applied at 5 s, and the resulting frequency deviation is shown in Figure 14.
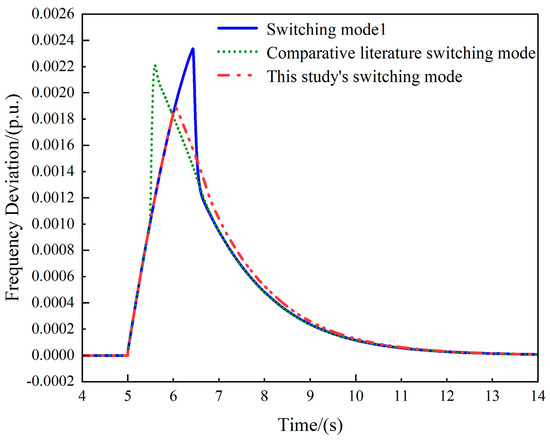
Figure 14.
Frequency deviation curve of each switching mode under step disturbance.
It can be seen that both switching mode 1 and the comparative literature switching mode cannot achieve good frequency regulation of the grid. The comparative literature switching mode switches modes at an earlier point, but at this time, the inertia + droop mixed control has not fully exerted its effect of suppressing the frequency change rate, causing the frequency change rate to suddenly increase and then causing a larger frequency deviation peak; switching mode 1 switches modes at a later point, and the frequency deviation state time is too long, also causing a larger frequency deviation peak; this study’s switching mode switches frequency at about 6 s, and by this time, the inertia + droop mixed control has suppressed the frequency change rate to a certain level, and the instruction power of the droop + integral mixed control is enough to have a good recovery effect in the frequency recovery stage. The frequency deviation peak of this study’s switching mode only reaches 0.0019 p.u.; therefore, this study’s switching mode can optimize the performance of grid frequency regulation and reduce the frequency change amplitude caused by load disturbance.
5. Comprehensive Simulation Comparison
This study’s mode is an improvement on other modes in terms of three aspects: control mode, frequency regulation coefficient configuration, and mode switching, as elaborated on in Section 4.1, Section 4.2 and Section 4.3, respectively, and its feasibility was verified through observation of the frequency deviation curve under step load disturbance. In this section, the control model of mixed frequency regulation with comprehensive improvement in these three aspects will be tested and verified, considering the tie-line power of another region, limiting the flywheel energy storage power through the SOC curve given in Section 2.2; the initial SOC of flywheel energy storage is 0.5, applying a long-term load continuous disturbance for simulation, finally giving the key frequency regulation indicators, comparing with the comparative literature mode (KL and KD are both 60) and traditional mode (only considering droop control, inertia control has a worse effect in continuous disturbance because it will cause an anti-tuning phenomenon in the frequency recovery stage), verifying the practical engineering feasibility of the comprehensive improvement control model in the continuous disturbance environment.
The continuous load disturbance within 10 min of Region 1 is shown in Figure 15. After this disturbance is added to the frequency regulation model, the frequency deviation, energy storage output power, and power change in the thermal power unit under each energy storage control mode are obtained as shown in Figure 16, Figure 17 and Figure 18, and the corresponding frequency regulation indicators are shown in Table 3. The parameter selection of this study’s mode is the same as in Section 4.1, Section 4.2 and Section 4.3.
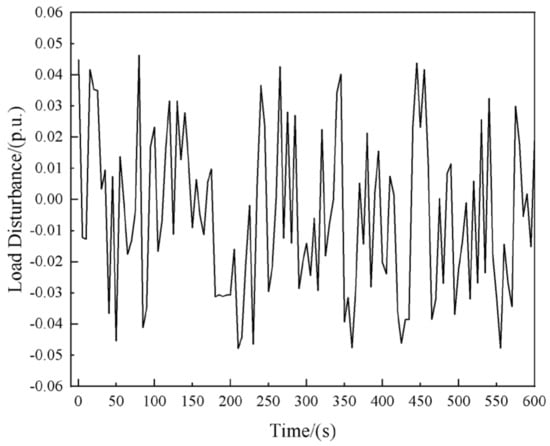
Figure 15.
Continuous load disturbance power curve for 10 min.
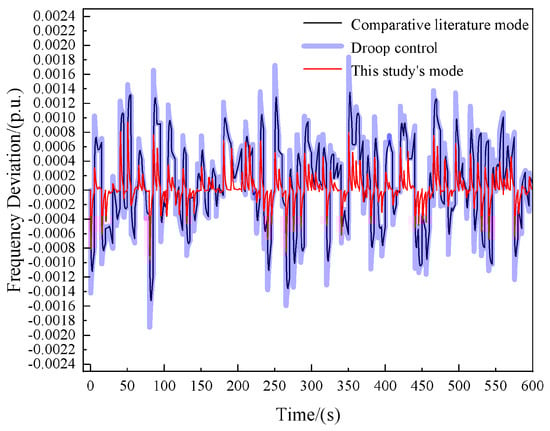
Figure 16.
Frequency deviation curve of each control mode under continuous disturbance.
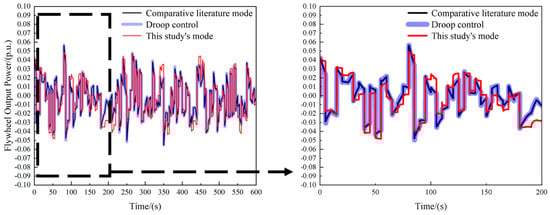
Figure 17.
Flywheel energy storage output power curve for each control mode under continuous disturbance (and the amplified curve in 0 s–200 s).
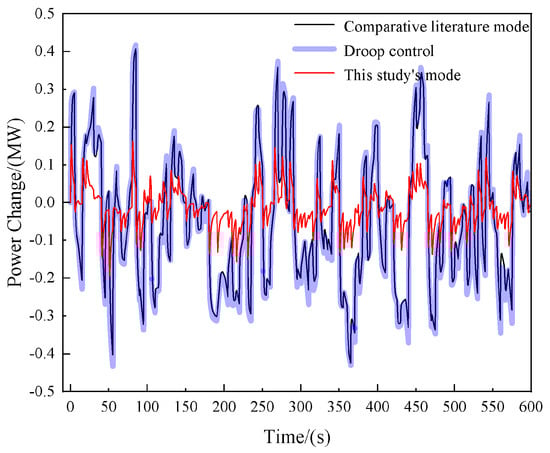
Figure 18.
Power change curve of thermal power units for each control mode under continuous disturbance.
Table 3.
Frequency modulation indicators for each control mode under continuous disturbance.
In Table 3, |Pfm| is the absolute value of the peak output power of flywheel energy storage. The larger this value, the more the flywheel energy storage participates in grid frequency regulation output; tn is the time of the thermal power units participation in grid frequency regulation. The power change in the thermal power units are set to be within −0.05 and 0.05 MW, which is considered to be the range wherein the thermal power units are not participating in grid frequency regulation.
As can be seen from Figure 16, when the load disturbance fluctuates violently, it will cause the frequency deviation value to fluctuate violently in a certain direction. The larger the amplitude of the load disturbance, the larger the peak value of the frequency deviation. According to the frequency support strategy of energy storage, the frequency deviation first increases sharply and then gradually suppressed to the normal range. Among them, the amplitude of the frequency deviation is the smallest under the mode of this study. Figure 17 and Figure 18 respectively show the output power of the flywheel energy storage and the power change in the thermal power units. Under the control of the frequency support strategy, they change regularly with the direction, amplitude, and frequency of the load disturbance. The sum of the output power of the flywheel energy storage and the power change in the thermal power units is the total output power of the system to support the power grid frequency. It is necessary to reduce the power change in the thermal power units and increase the output of the flywheel energy storage. Under the mode of this study, the output power of the flywheel energy storage is slightly more at the peak of each power fluctuation, and the power change in the thermal power units is significantly reduced.
From Figure 16, Figure 17 and Figure 18, and Table 3, it can be seen that under continuous load disturbance, the frequency deviation of this study’s mode is better improved compared with the comparative literature mode and droop control; in this study’s mode, the flywheel energy storage output is slightly more at some times, but |Pfm| is smaller than the other two control modes; in this study’s mode, the time when the thermal power units participate in grid frequency regulation output is significantly shorter; the output time of the thermal power unit is shortened to 190.8393 s, which can reduce the phenomenon of frequent actions of the thermal power units, and the comparative literature mode and droop control are in the state of thermal power unit frequency regulation output for most of the time during this continuous disturbance, which has a negative impact on the normal operation of the thermal power units, and the peak power of the thermal power units participating in grid frequency regulation output is significantly smaller, while the output peak of the comparative literature mode and droop control mode reaches above 0.4 MW. Therefore, the operational stability of the thermal power units under this study’s mode is significantly improved. The SOC curve of flywheel energy storage is shown in Figure 19, which shows that the state of charge of flywheel energy storage is maintained within the allowable range, indicating that this study’s mode can enable energy storage to participate in grid frequency regulation for a long time.
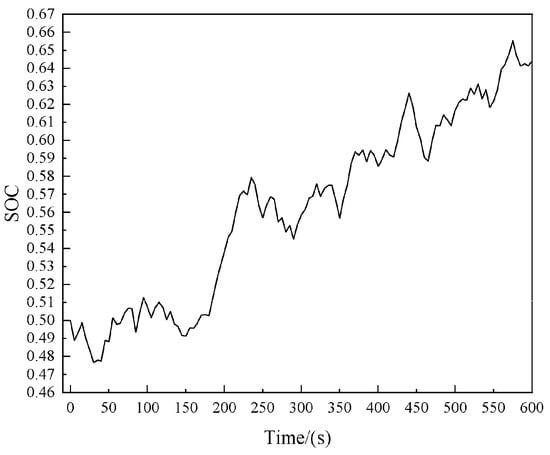
Figure 19.
The SOC curve of flywheel energy storage under continuous disturbance.
In order to further evaluate the performance of this frequency support strategy in different application scenarios, load disturbances under other conditions are used for evaluation. The first type of load disturbance is to apply a −0.05 p.u. step load at 5 s and cancel the load disturbance at 10 s, which can be used to evaluate the performance under the same direction load for a long time; the second type of load disturbance is to apply a −0.05 p.u. step load at 5 s and change it to apply a −0.06 p.u. step load at 10 s, which can be used to evaluate the performance under the same direction amplitude jump load for a long time; the third type of load disturbance is to apply a −0.05 p.u. step load at 5 s and then change it to apply a 0.05 p.u. step load at 10 s, which can be used to evaluate the performance under the reverse direction jump load for a long time.
Figure 20 shows the frequency deviation under the above three load disturbances. It can be seen that, compared other modes, deviation is smaller under the mode of this study, and the frequency can be quickly suppressed to the normal range, so this study’s mode is suitable for frequency support in various application scenarios and has robustness in practical applications.
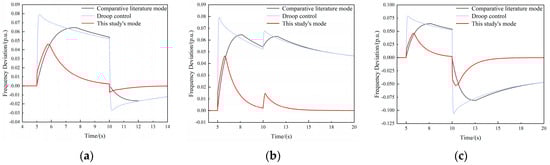
Figure 20.
Frequency deviation under the above three load disturbances: (a) A −0.05 p.u. step load at 5 s and canceled at 10 s; (b) A −0.05 p.u. step load at 5 s and change to −0.06 p.u. at 10 s; (c) A −0.05 p.u. step load at 5 s and change to 0.05 p.u. at 10 s.
According to the above analysis, under this study’s mode, the power grid frequency fluctuation and the time of a thermal power unit’s participation in frequency regulation when the energy storage output is slightly more can be effectively suppressed, and the SOC of energy storage can be maintained within the allowable range. Compared with the control methods in the existing literature, the mixed mode of the integral control method newly introduced in this study can achieve better results in reducing frequency deviation; there are real-time coefficient allocation modes in the existing literature, but most of them adjust according to the SOC of energy storage, and the parameters of the integral control method to join the allocation have not been considered. The allocation of coefficients in this study is easy to implement and can achieve good results, but it is not the best configuration mode in theory; this study considers and introduces the impact of the mode-switching threshold on frequency modulation performance, preventing the decline in frequency support performance of energy storage when mode switching, and the existing literature has not yet considered the relevant content of the mode switching threshold.
In practical applications, while the aforementioned effects are achievable in theory, there are some limitations. Due to the current limitations of flywheel energy storage materials, the energy storage capacity of flywheel energy storage units is limited; when the frequency deviation becomes too large, the SOC of flywheel energy storage will quickly deviate from the allowable range causing it to stop working, so it is primarily suitable for the power shock environment in a small area; in addition, this study ignores the impact of converter switch loss, self-discharge loss, motor iron loss and other factors on energy flow, so the output power through feedforward in practical applications needs to be adjusted.
6. Conclusions
This study proposes a mixed variable parameter energy storage-assisted grid frequency support strategy; its main features and performance are as follows:
- The integral control method is introduced. In the frequency deviation state, the inertia + droop mixed mode is used. In the frequency recovery state, the droop + integral mixed mode is used. The comparison results prove that the frequency deviation peak of this control mode is the smallest, only 0.00083 p.u., and it can reduce the steady-state value of frequency deviation to 0. The output of the thermal power unit is significantly the smallest, which has good engineering feasibility.
- The coefficient real-time configuration mode is adopted. According to the different states of the grid frequency and the effect of different control modes, the frequency regulation parameters are adjusted in real time. Through comparative analysis, it is found that this allocation mode can significantly reduce the time spent on frequency regulation and can reduce the frequency deviation peak. At the same time, it verifies the strong recovery effect of the integral control mode in the frequency recovery stage.
- The impact of different mode switching thresholds on the overall performance of frequency regulation has been studied and analyzed. It is finally proved that most of the existing mode switching methods cannot achieve better frequency regulation effects. In addition, a mode switching method based on the grid frequency state is proposed. The comparison proves that this switching mode can reduce the frequency deviation amplitude caused by load disturbance.
- After the control model of mixed frequency regulation with the joint action of various improvement methods is tested and verified using continuous load disturbance, it is compared with the traditional control mode and the comparative literature mode. The results show that this study’s mode can control the frequency deviation value within a smaller range. The flywheel energy storage outputs slightly more for some of the time, while the output and the output time of the thermal power unit participating in frequency regulation are significantly reduced, and the operation stability of the thermal power unit is significantly improved.
In conclusion, the mixed variable parameter energy storage-assisted power grid frequency support strategy is suitable for effectively reducing the frequency deviation amplitude and the time of thermal power unit participation in frequency regulation in the power shock environment caused by long-term unstable new energy and electricity load in a small area, and enhancing the performance of a new energy grid connection.
Future research will delve deeper into the impact of the energy storage structure on frequency support. For example, integrating a flywheel energy storage array into the power grid could enhance the flexibility of energy management and improve the ability to maintain SOC. Additionally, it is crucial to consider the self-loss of the energy storage structure. The internal loss of flywheel energy storage includes converter switch loss, self-discharge loss, motor iron loss, copper loss, etc. Simultaneously, the sudden change of electromagnetic torque and bus voltage during operation can cause an unstable working state of the flywheel motor. To mitigate these effects, the frequency support strategy should be adjusted appropriately.
Author Contributions
Conceptualization, Z.Y. and Y.Z.; Software, Z.Y. and Y.C.; Validation, Z.Y. and D.L.; Investigation, Z.Y.; Data curation, Z.Y.; Supervision, Y.Z. All authors have read and agreed to the published version of the manuscript.
Funding
This research was funded by National Natural Science Foundation of China, U22B2095.
Data Availability Statement
Data are contained within the article.
Conflicts of Interest
The authors declare no conflict of interest.
References
- Liu, H.; Ge, J.; Gong, Y.; Liu, H.M.; Xiao, F. Optimization Scheme Selection of Wind Farm Participation in Grid Primary Frequency Modulation and Study of Eind-storage Coordination Control Strategy. J. Glob. Energy Interconnect. 2019, 2, 44–52. [Google Scholar]
- Ren, G.R.; Wang, W.; Wan, J.; Hong, F.; Yang, K.; Yu, D.R. Investigating the Impacts of Spatial-temporal Variation Features of Air Density on Assessing Wind Power Generation and Its Fluctuation in China. Sci. China Technol. Sci. 2023, 66, 1797–1814. [Google Scholar] [CrossRef]
- Ding, D.; Yang, S.L.; Li, J.L.; Hui, D.; Liu, Z.Q. Capacity Configuration of Battery Energy Storage as an Alternative to Thermal Power Units for Frequency Regulation. Energy Storage Sci. Technol. 2014, 3, 302–307. [Google Scholar]
- Yang, Y.; Li, H.; Aichhorn, A.; Zheng, J.P.; Greenleaf, M. Sizing Strategy of Distributed Battery Storage System with High Penetration of Photovoltaic for Voltage Regulation and Peak Load Shaving. IEEE Trans. Smart Grid 2014, 5, 982–991. [Google Scholar] [CrossRef]
- Sun, B.Y.; Yang, S.L.; Liu, Z.Q.; Li, T.T. Analysis on Present Application of Megawtt-scale Energy Storage in Frequency Regulation and Its Enlightenment. Autom. Electr. Power Syst. 2017, 41, 8–16. [Google Scholar]
- He, L.X.; Li, W.Y. Simulation of the Primary Frequency Modulation Process of Thermal Power Units with the Auxiliary of Flywheel Energy Storage. Energy Storage Sci. Technol. 2021, 10, 1679–1686. [Google Scholar]
- Xing, P.X.; Shi, Q.M.; Wang, G.; Fu, L.J.; Wang, Y.; Wu, Y. Response Characteristics and Mechanism Analysis about Virtual Inertia Control of Wind Generators. High Volt. Eng. 2018, 44, 1302–1310. [Google Scholar]
- Deng, X.; Sun, W.; Xiao, H.W. Integrated Control Strategy of Battery Energy Storage System in Primary Frequency Regulation. High Volt. Eng. 2018, 44, 1157–1165. [Google Scholar]
- Huang, J.Y.; Li, X.R.; Cao, Y.J.; Liu, W.J. Capacity Allocation of Energy Storage System Considering Its Action Moment and Output Depth in Rapid Frequency Regulation. Trans. China Electrotech. Soc. 2015, 30, 454–464. [Google Scholar]
- Huang, J.Y.; Li, X.R.; Chang, M.; Li, S.J.; Liu, W.J. Capacity Allocation of BESS in Primary Frequency Regulation Considering Its Technical-Economic Model. Trans. China Electrotech. Soc. 2017, 32, 112–121. [Google Scholar]
- Yang, D.J.; Wang, X.; Yan, G.G.; Jin, E.S.; Jin, Z.Y. Flexible Frequency Regulation Scheme of DFIG Embed Battery Energy Storage System Considering Deadbands. Trans. China Electrotech. Soc. 2023, 38, 4646–4656. [Google Scholar]
- Zhang, Y.J.; Zhao, C.H.; Tang, W.R.; Low, S.H. Profit Maximizing Planning and Control of Battery Energy Storage Systems for Primary Frequency Control. IEEE Trans. Smart Grid 2018, 9, 712–723. [Google Scholar] [CrossRef]
- Zhang, X.Y.; Hu, J.F.; Fu, Y.; Jin, Z.Z. Virtual Inertia Demand and Collaborative Support Technology of Wind Power and Energy Storage System. Trans. China Electrotech. Soc. 2024, 39, 672–685. [Google Scholar]
- Hany, M.H.; Marcos, T.; Rania, A.T.; Francisco, J. Hybrid Adaptive Controlled Flywheel Energy Storage Units for Transient Stability Improvement of Wind Farms. J. Energy Storage 2022, 54, 105262. [Google Scholar]
- Lei, M.Z.; Meng, K.Q.L.; Feng, H.N.; Bai, J.S.; Jiang, H.W.; Zhang, Z.Q. Flywheel Energy Storage Controlled by Model Predictive Control to Achieve Smooth Short-term High-frequency Wind Power. J. Energy Storage 2023, 63, 106949. [Google Scholar] [CrossRef]
- Yang, T.T.; Liu, Z.Y.; Zeng, D.L.; Zhu, Y.S. Simulation and Evaluation of Flexible Enhancement of Thermal Power Unit Coupled with Flywheel Energy Storage Array. Energy 2023, 281, 128239. [Google Scholar] [CrossRef]
- Jiang, J.X.; Yan, X.W.; Li, T.C.; Wang, W.K.; Ma, H.B. Fast Frequency Regulation Strategy of PV Power System Assisted by Energy Storage Based on Improved Measurement Method of RoCoF. Trans. China Electrotech. Soc. 2022, 37, 93–105. [Google Scholar]
- Mousavi, G.S.M.; Faraji, F.; Majazi, A.; Al-Haddad, K. A Comprehensive Review of Flywheel Energy Storage System Technology. Renew. Sustain. Energy Rev. 2017, 67, 477–490. [Google Scholar] [CrossRef]
- Cao, J.; Xu, L.; Bian, X.Y. Droop Control of Isolated Island Microgrid Based on Logistic Exponential Function. Comput. Simul. 2023, 40, 125–129. [Google Scholar]
- Wu, T. Research on AGC of Two Area Interconnected Power Grid Based on Fuzzy Control Theory. Master’s Thesis, Changsha University of Science & Technology, Changsha, China, 2018. [Google Scholar]
- Ma, Z.H.; Li, X.R.; Tan, Z.X.; Huang, J.Y.; He, K. Integrated Control of Primary Frequency Regulation Considering Dead Band of Energy Storage. Trans. China Electrotech. Soc. 2019, 34, 2102–2115. [Google Scholar]
- Luo, Y.D.; Tian, L.J.; Wang, Y.; Li, J.; Li, J. Coordinated Control Strategy and Optimal Capacity Configuration for Flywheel Energy Storage Participating in Primary Frequency Regulation of Power Grid. Autom. Electr. Power Syst. 2022, 46, 71–82. [Google Scholar]
Disclaimer/Publisher’s Note: The statements, opinions and data contained in all publications are solely those of the individual author(s) and contributor(s) and not of MDPI and/or the editor(s). MDPI and/or the editor(s) disclaim responsibility for any injury to people or property resulting from any ideas, methods, instructions or products referred to in the content. |
© 2024 by the authors. Licensee MDPI, Basel, Switzerland. This article is an open access article distributed under the terms and conditions of the Creative Commons Attribution (CC BY) license (https://creativecommons.org/licenses/by/4.0/).