Research on Knowledge Tracing-Based Classroom Network Characteristic Learning Engagement and Temporal-Spatial Feature Fusion


Abstract
:1. Introduction
- For accurately assessing student learning engagement in smart classrooms, a learning engagement model utilizing student–student interactions, student head-up states, and classroom network characteristics is proposed.
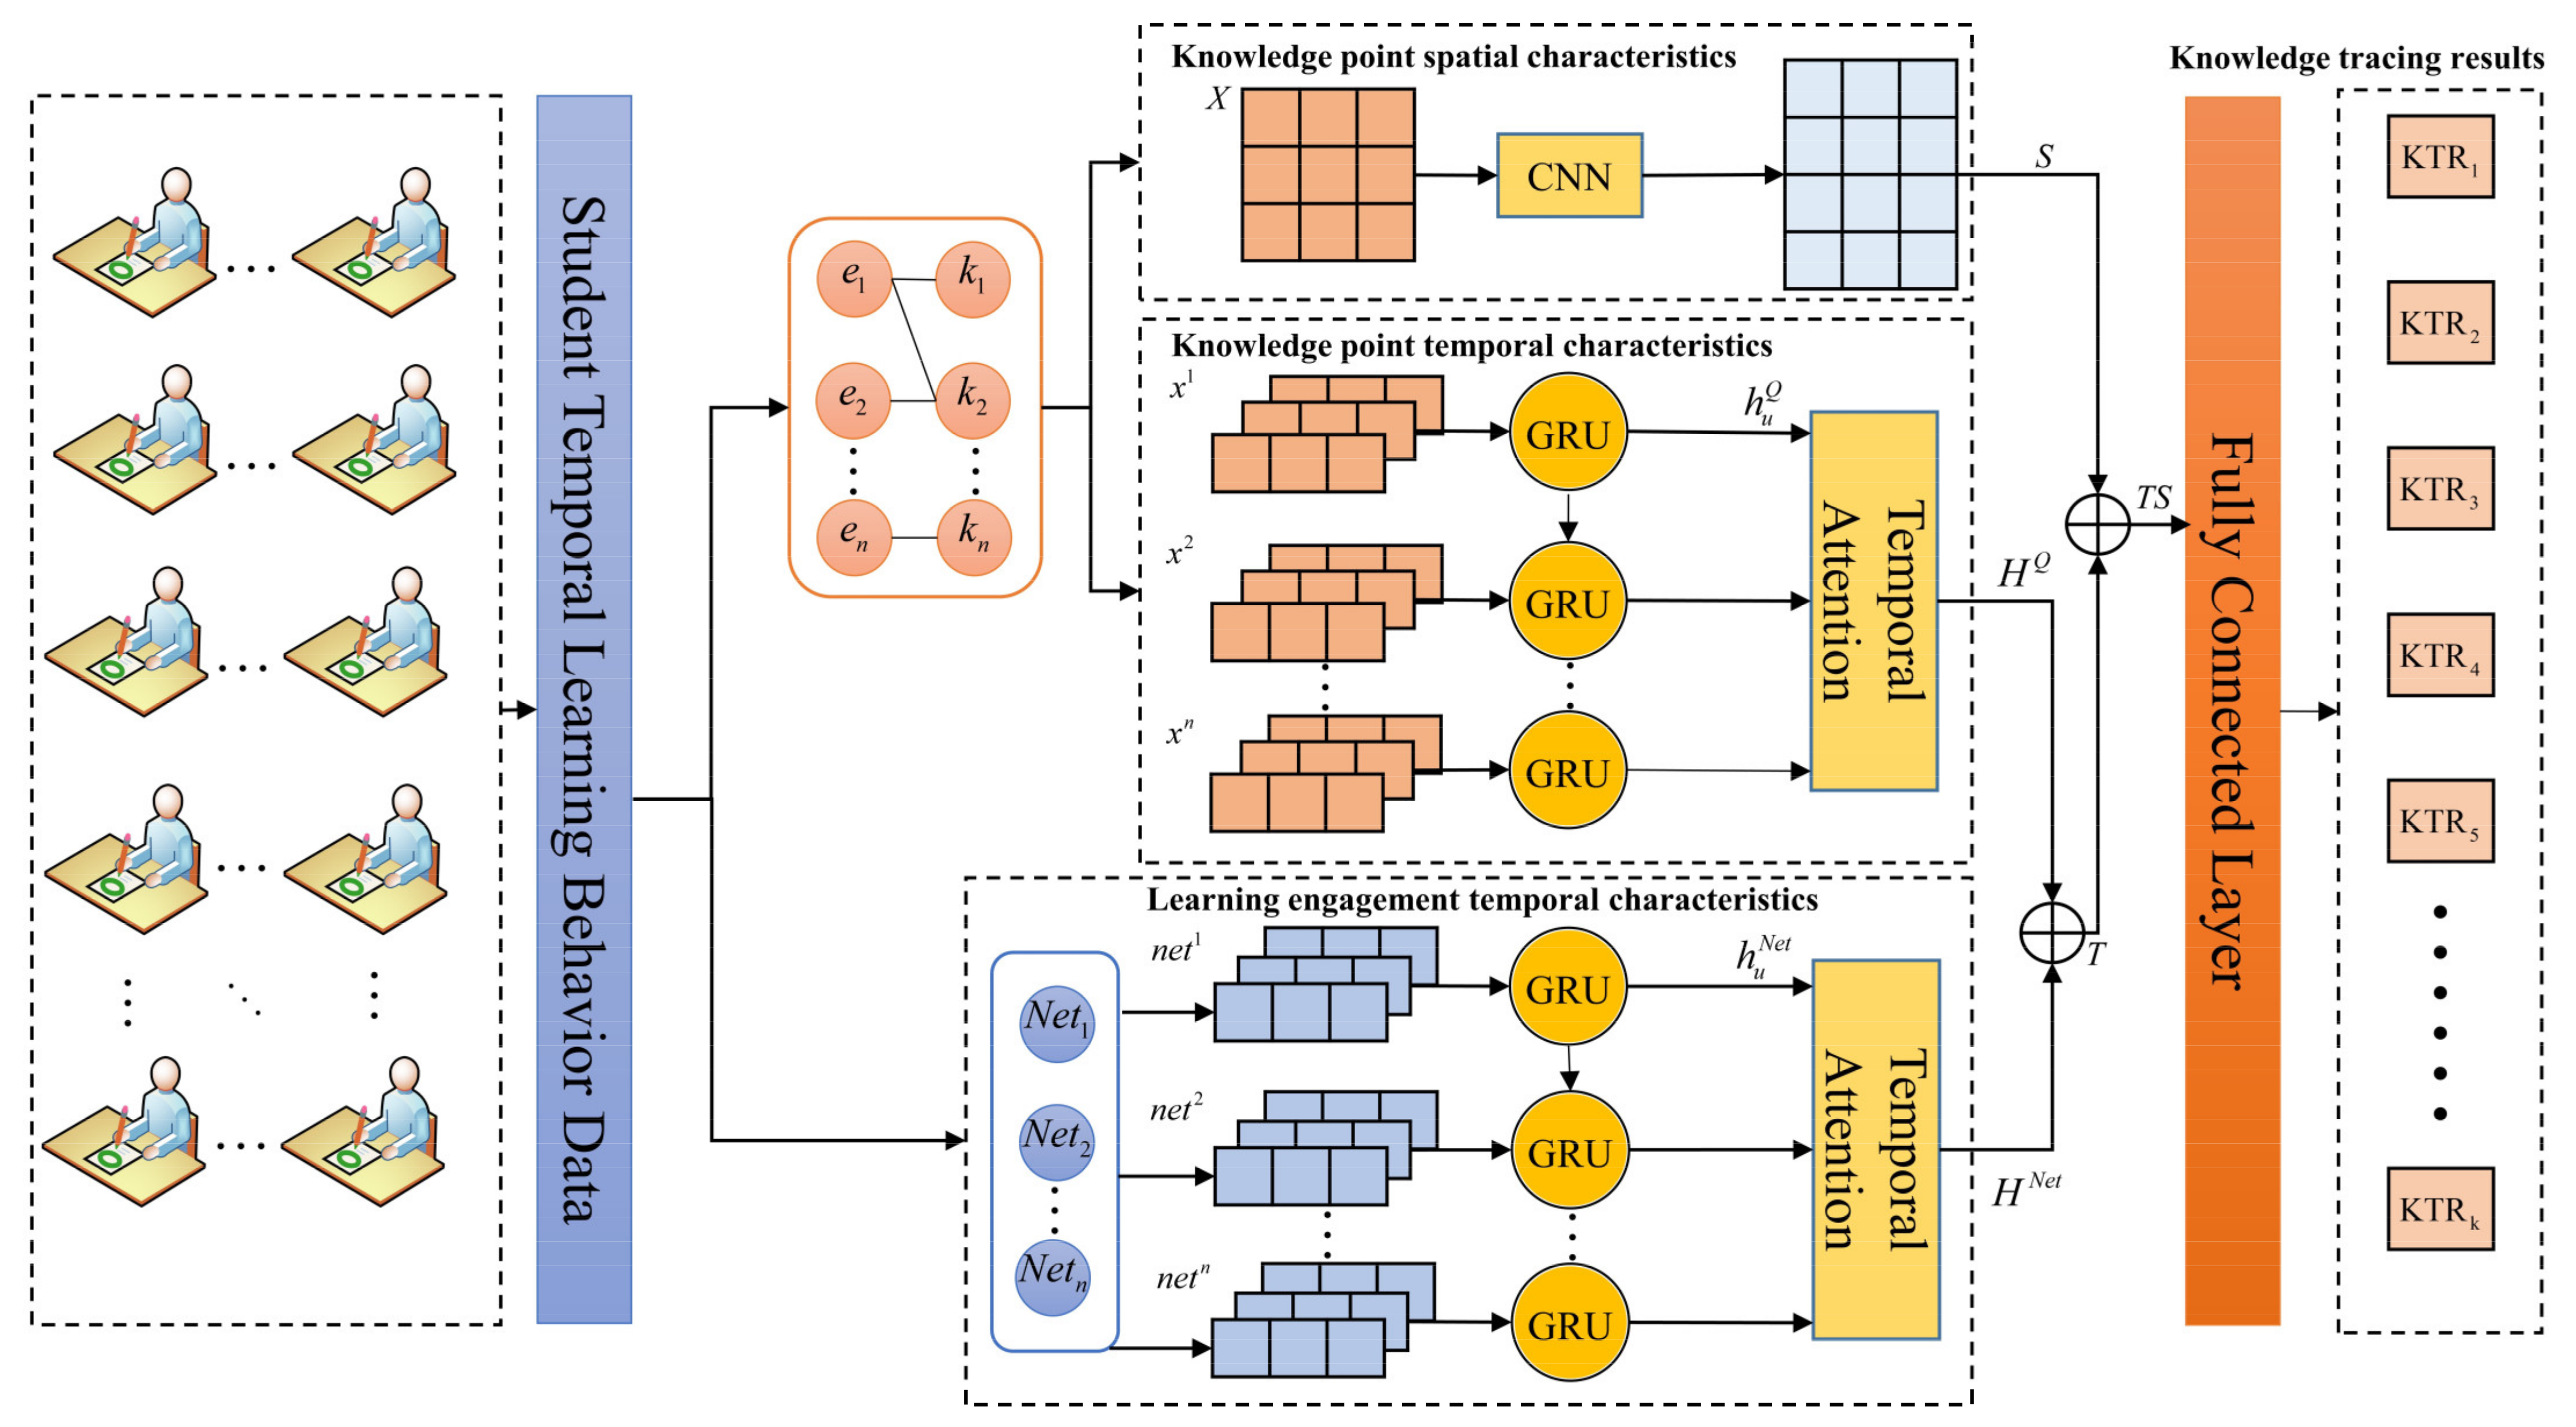
- A temporal-spatial feature fusion algorithm is proposed. A parallel temporal attention GRU network is designed which is utilized to extract the temporal features of knowledge points and learning engagement. They are fused to obtain the knowledge point-learning engagement temporal characteristics and their associated attributes. Meanwhile, a CNN is used to extract the knowledge point-knowledge point spatial features. We consider the associative properties of knowledge point-knowledge points from a spatial perspective and fuse the knowledge point-knowledge point spatial features with the knowledge point-learning engagement temporal features. To maintain the integrity of the characterization information, the model incorporates classroom network characteristic learning engagement and knowledge point test data to analyze the cognitive states. It avoids the limitations of single-dimensional data analysis and can more accurately characterize learners’ cognitive states.
- Extensive experiments are conducted on four real datasets. They show that the CL-TSKT model proposed in this paper has advantages over the state-of-the-art knowledge tracing algorithms.
2. Related Work
3. Problem Definitions
3.1. Symbol Definition
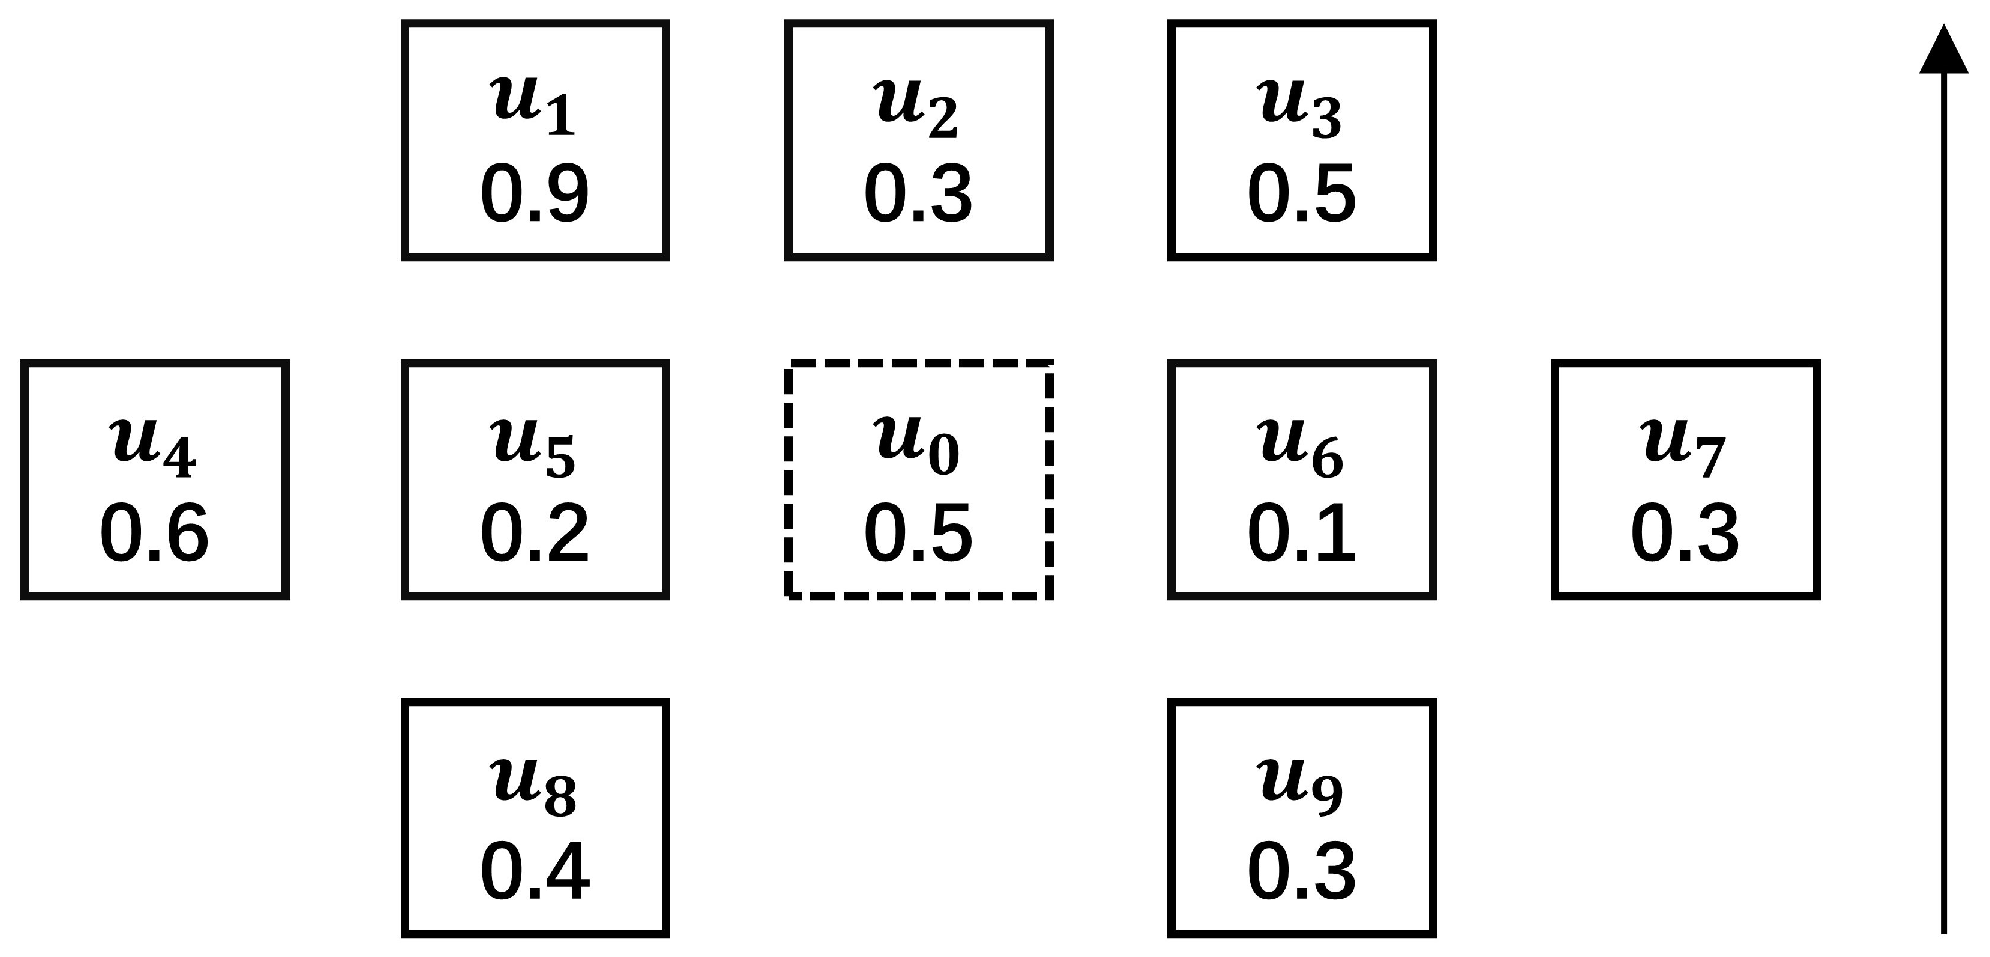
3.2. Modeling Learning Engagement Based on Classroom Network Characteristics
3.2.1. Learning Engagement
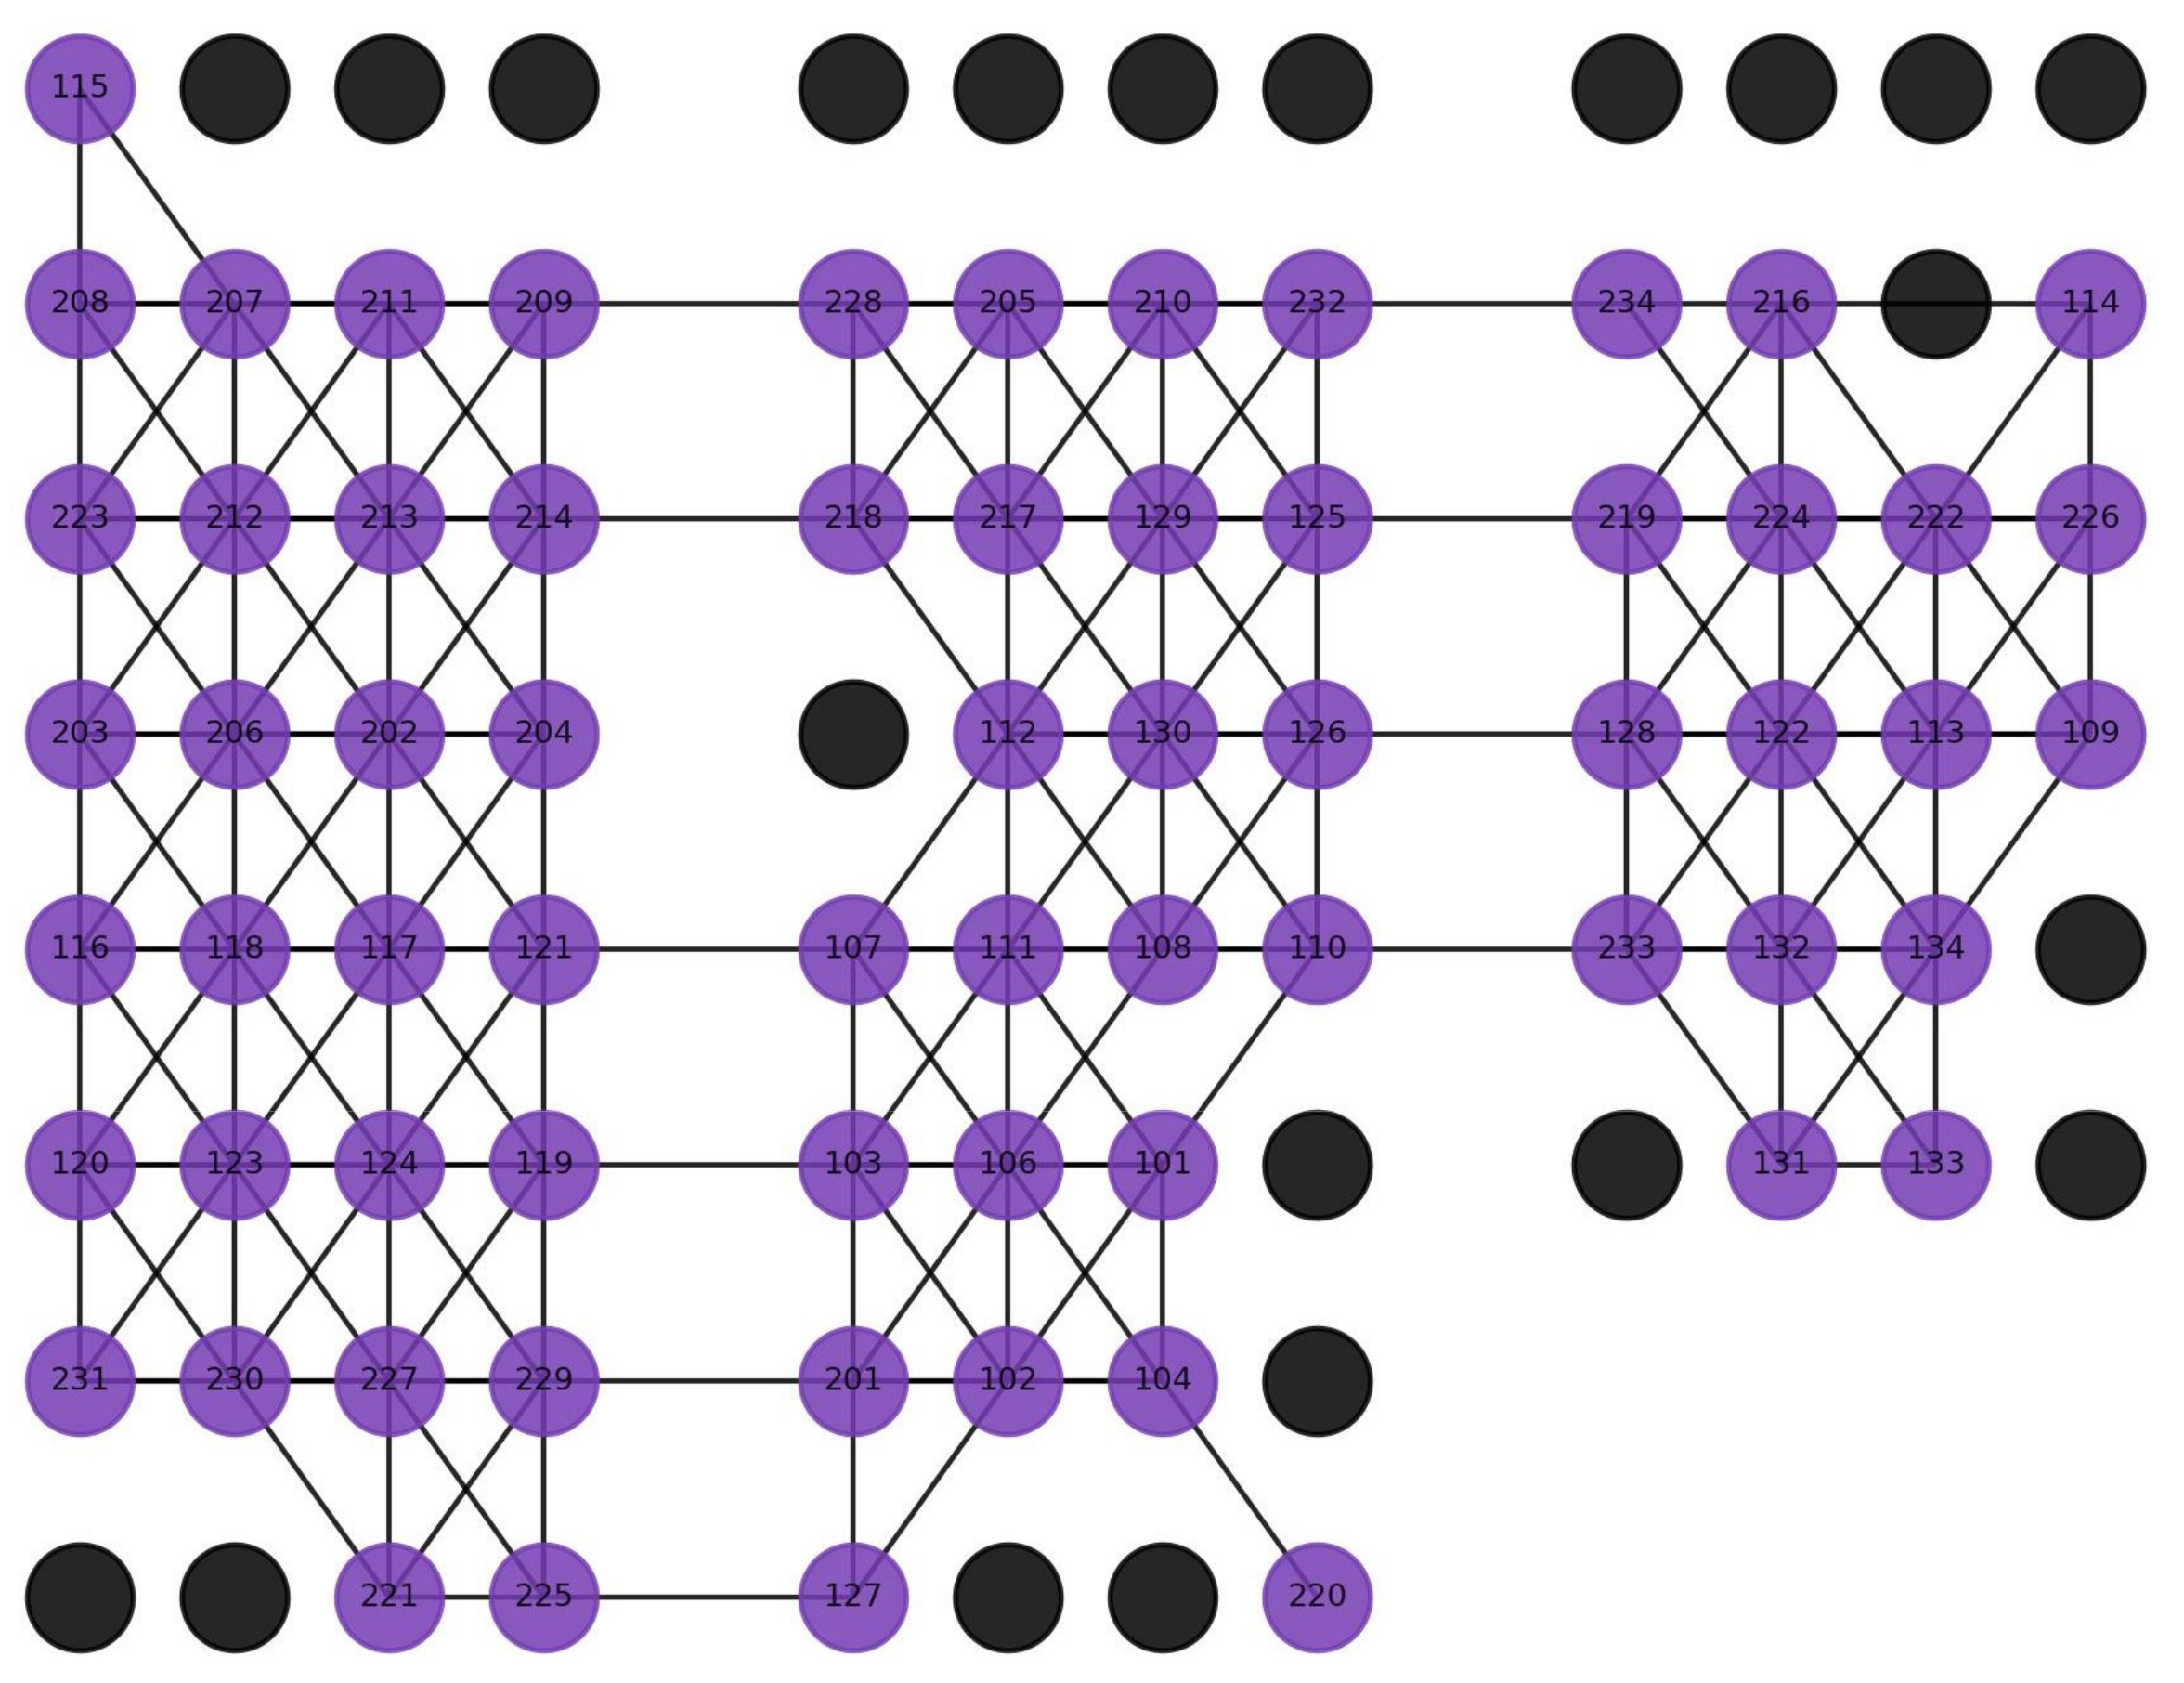
3.2.2. Learning Engagement Based on Classroom Network Characteristics
4. CL-TSKT Model
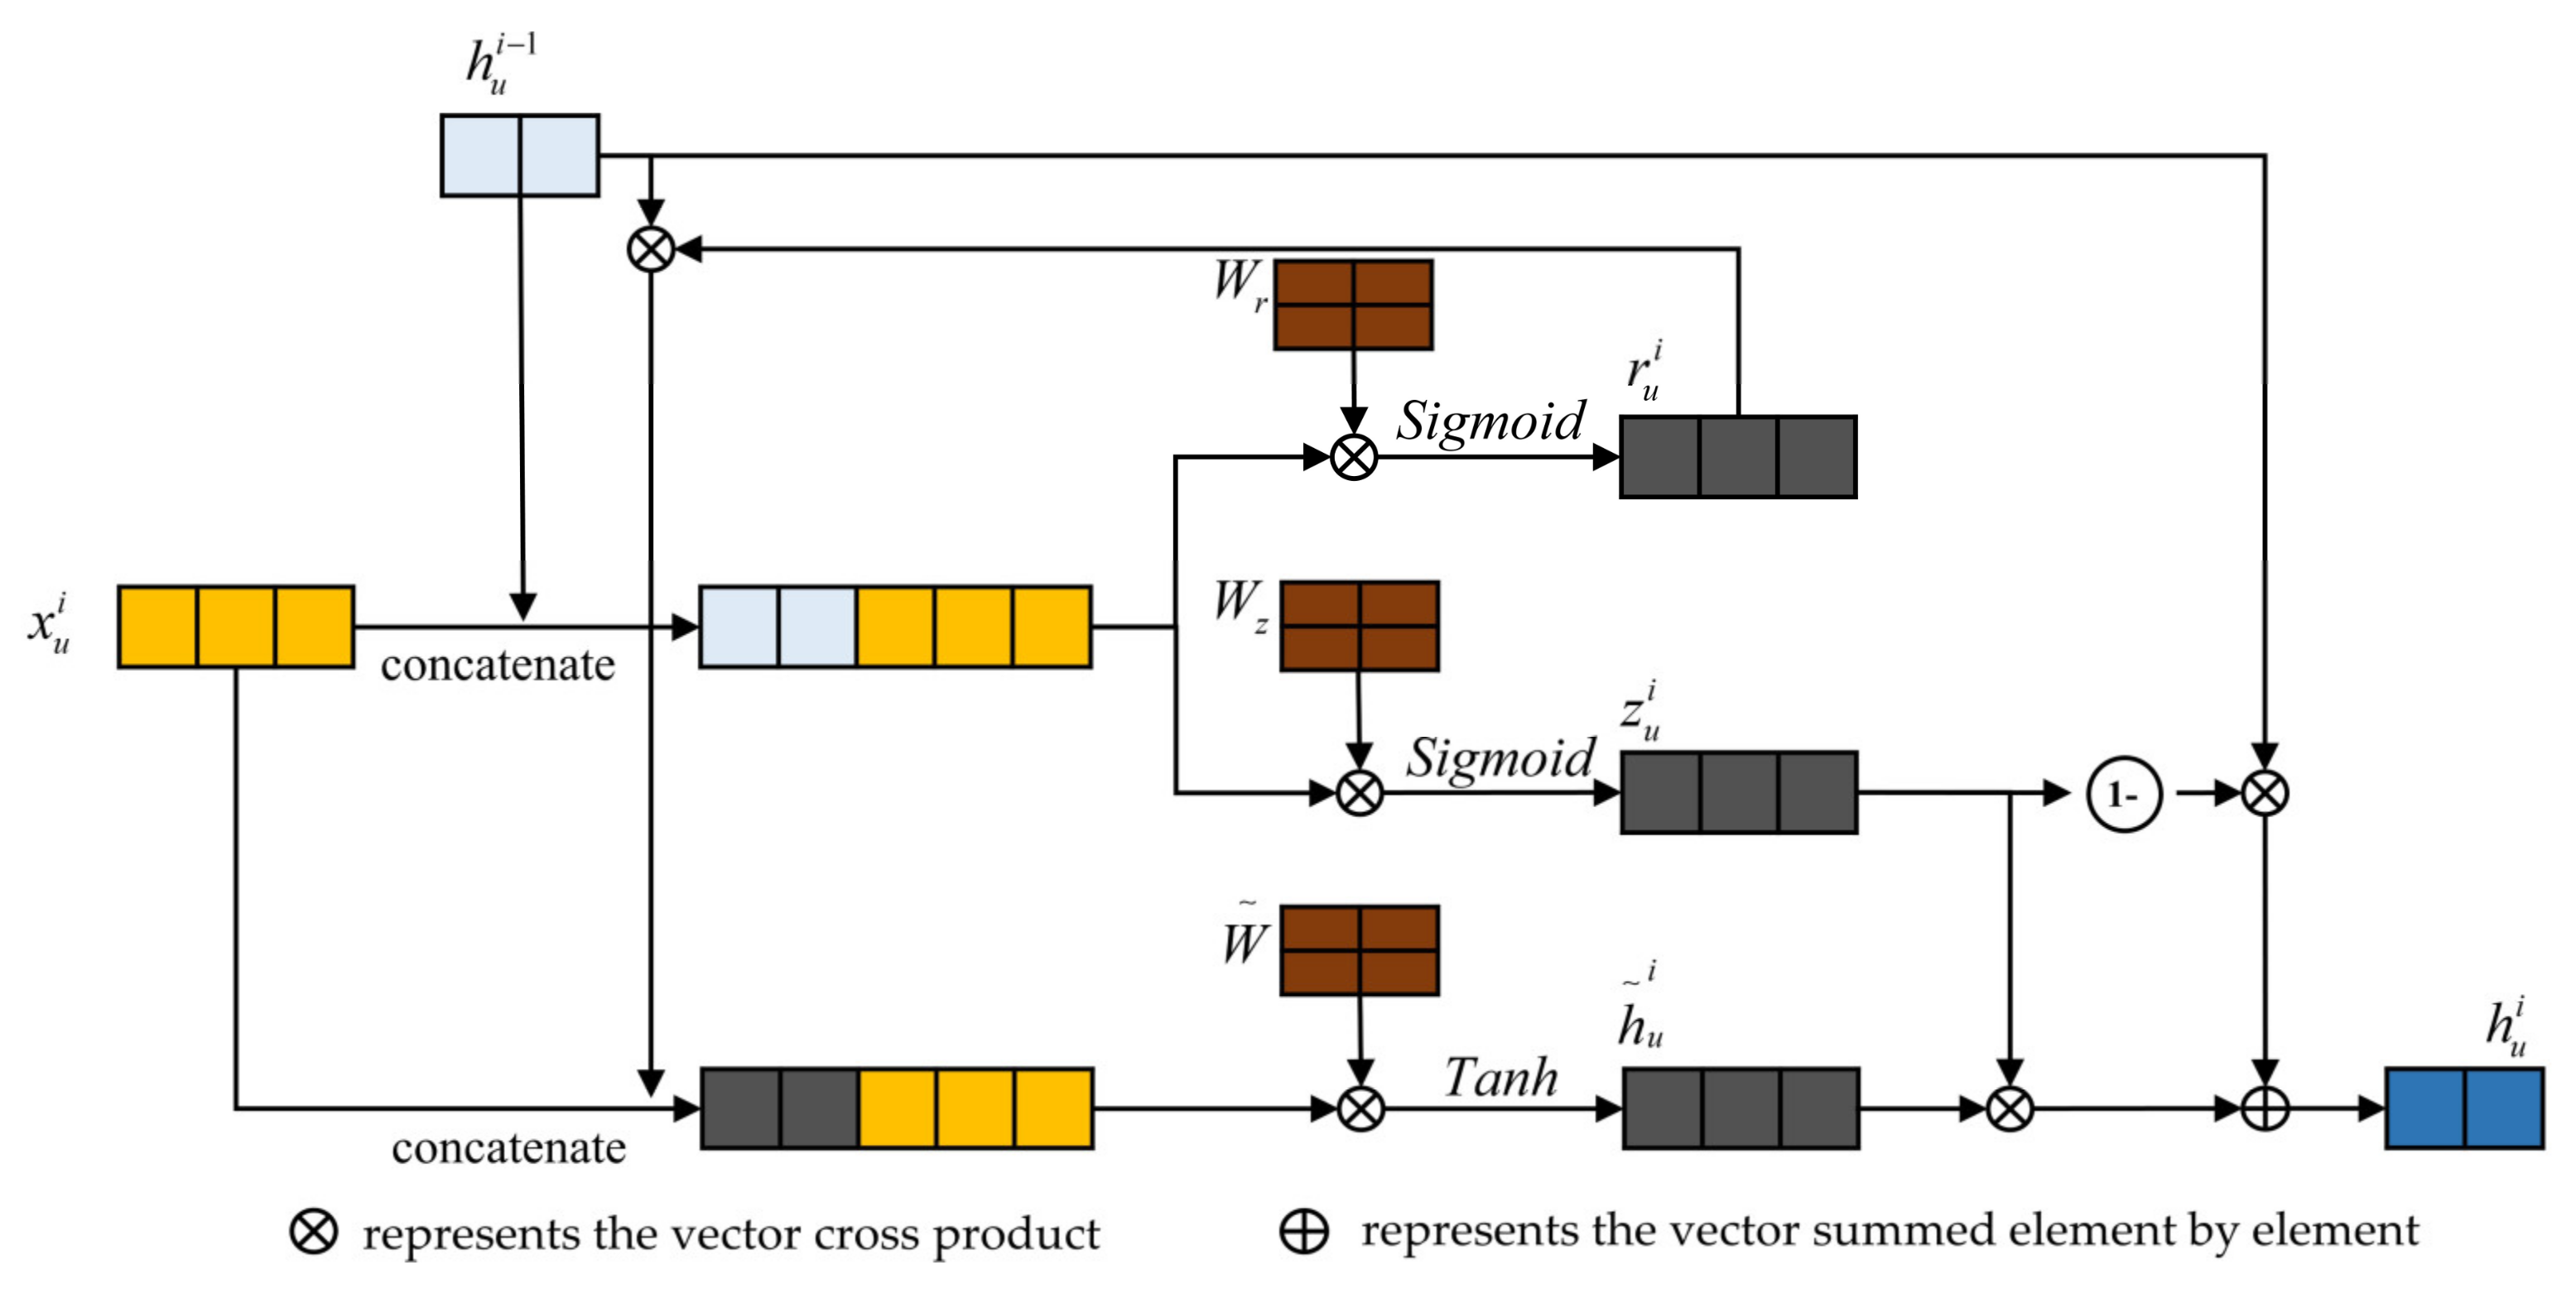
4.1. Temporal Attention-Based GRU Feature Tracking
4.1.1. GRU Feature Tracking
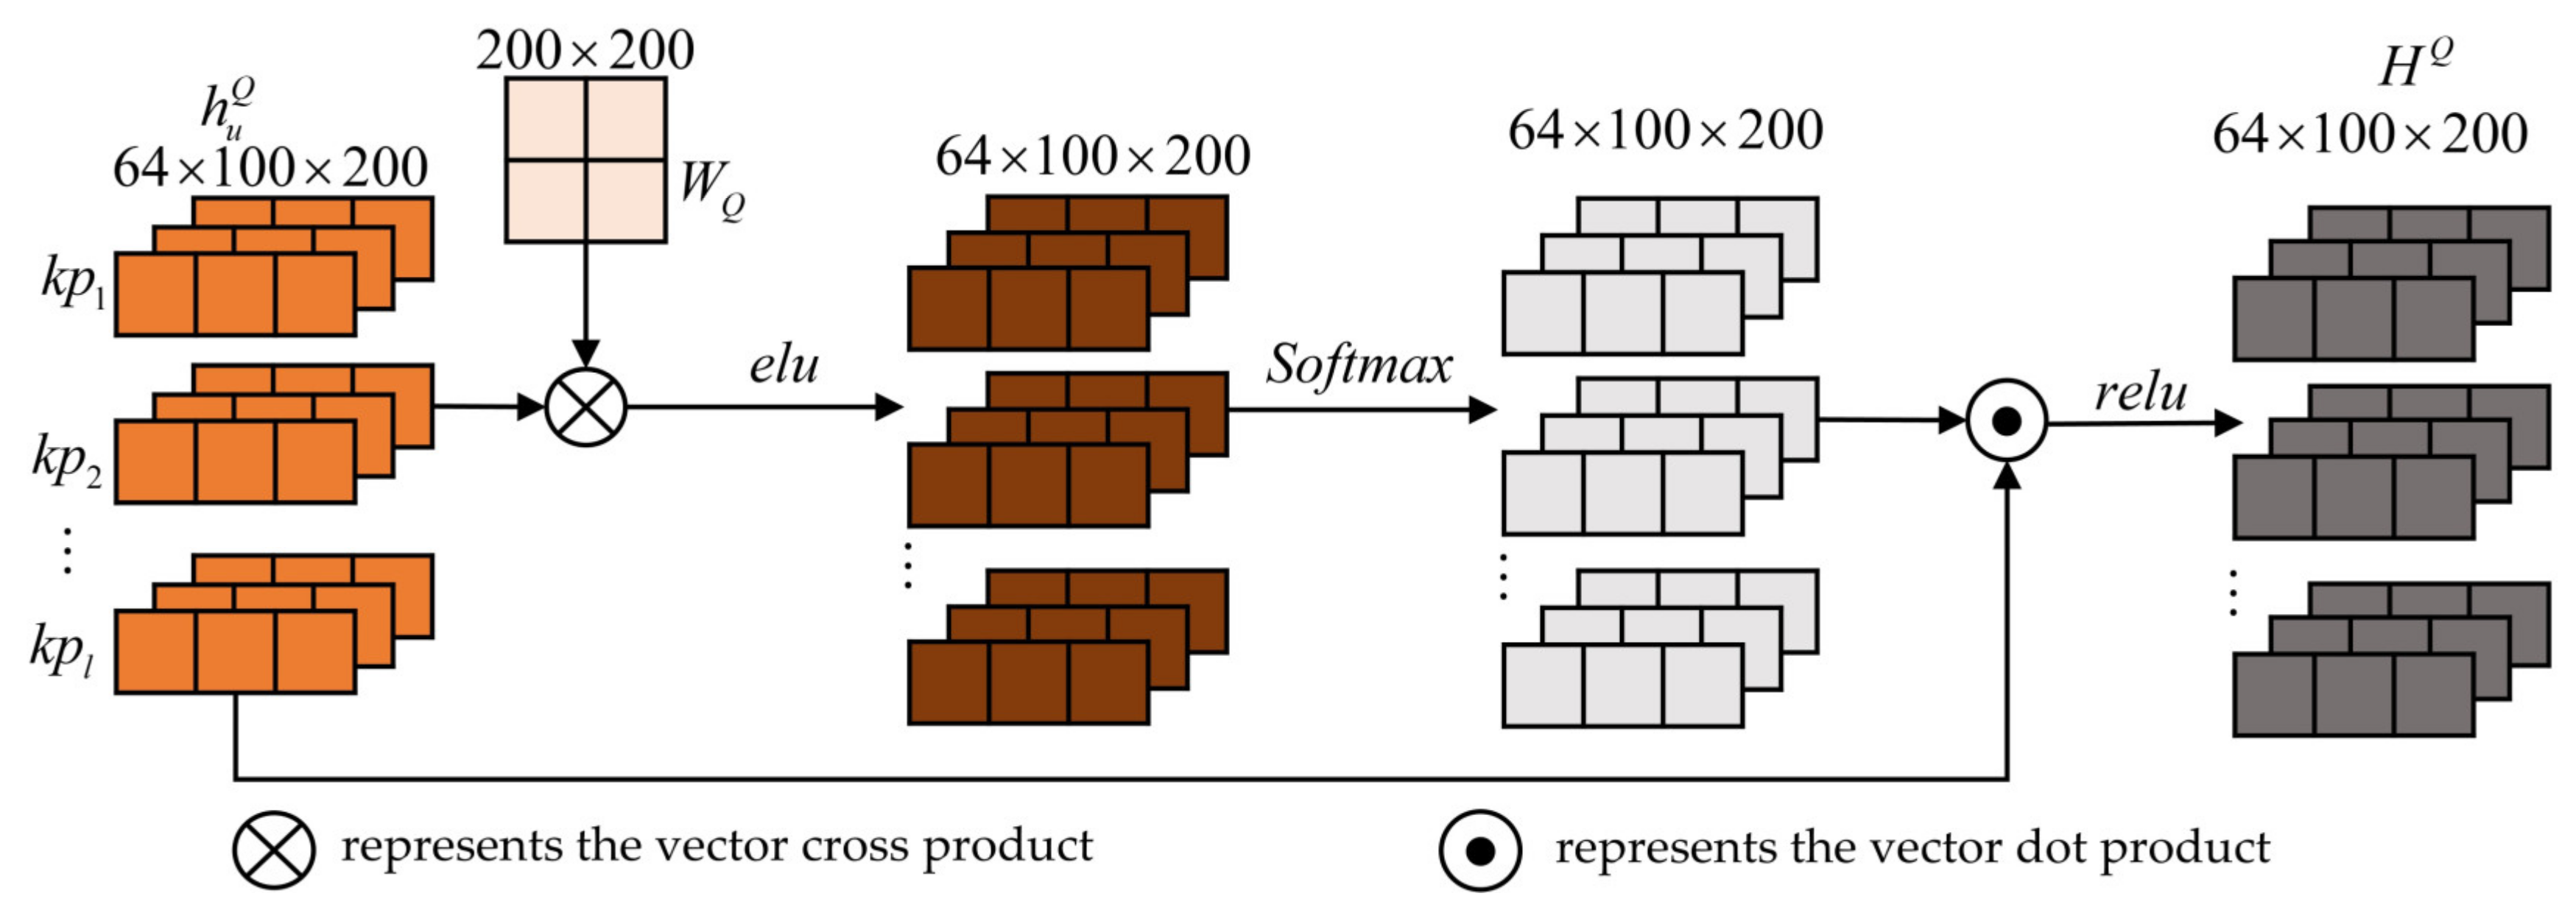
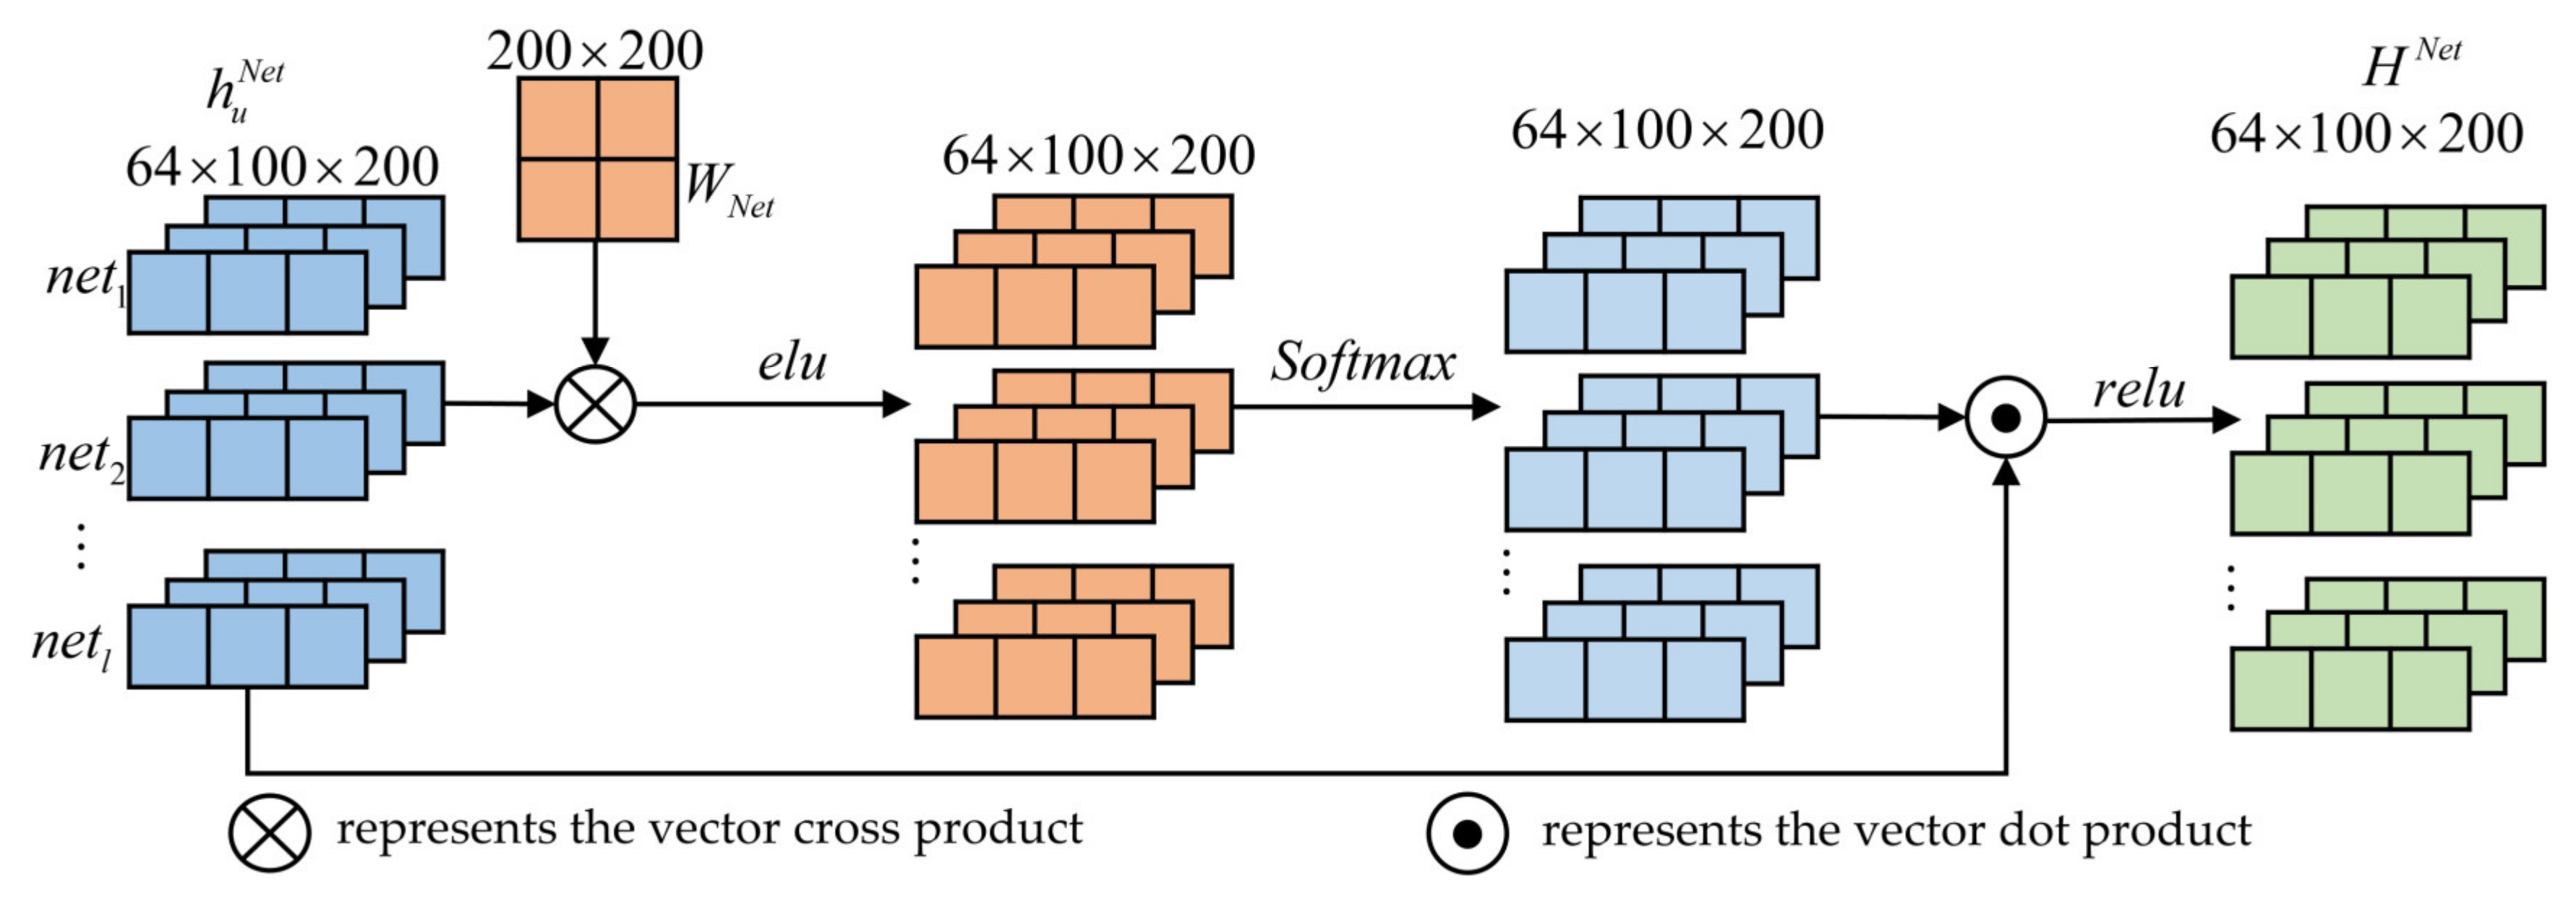
4.1.2. Temporal Attention Mechanism
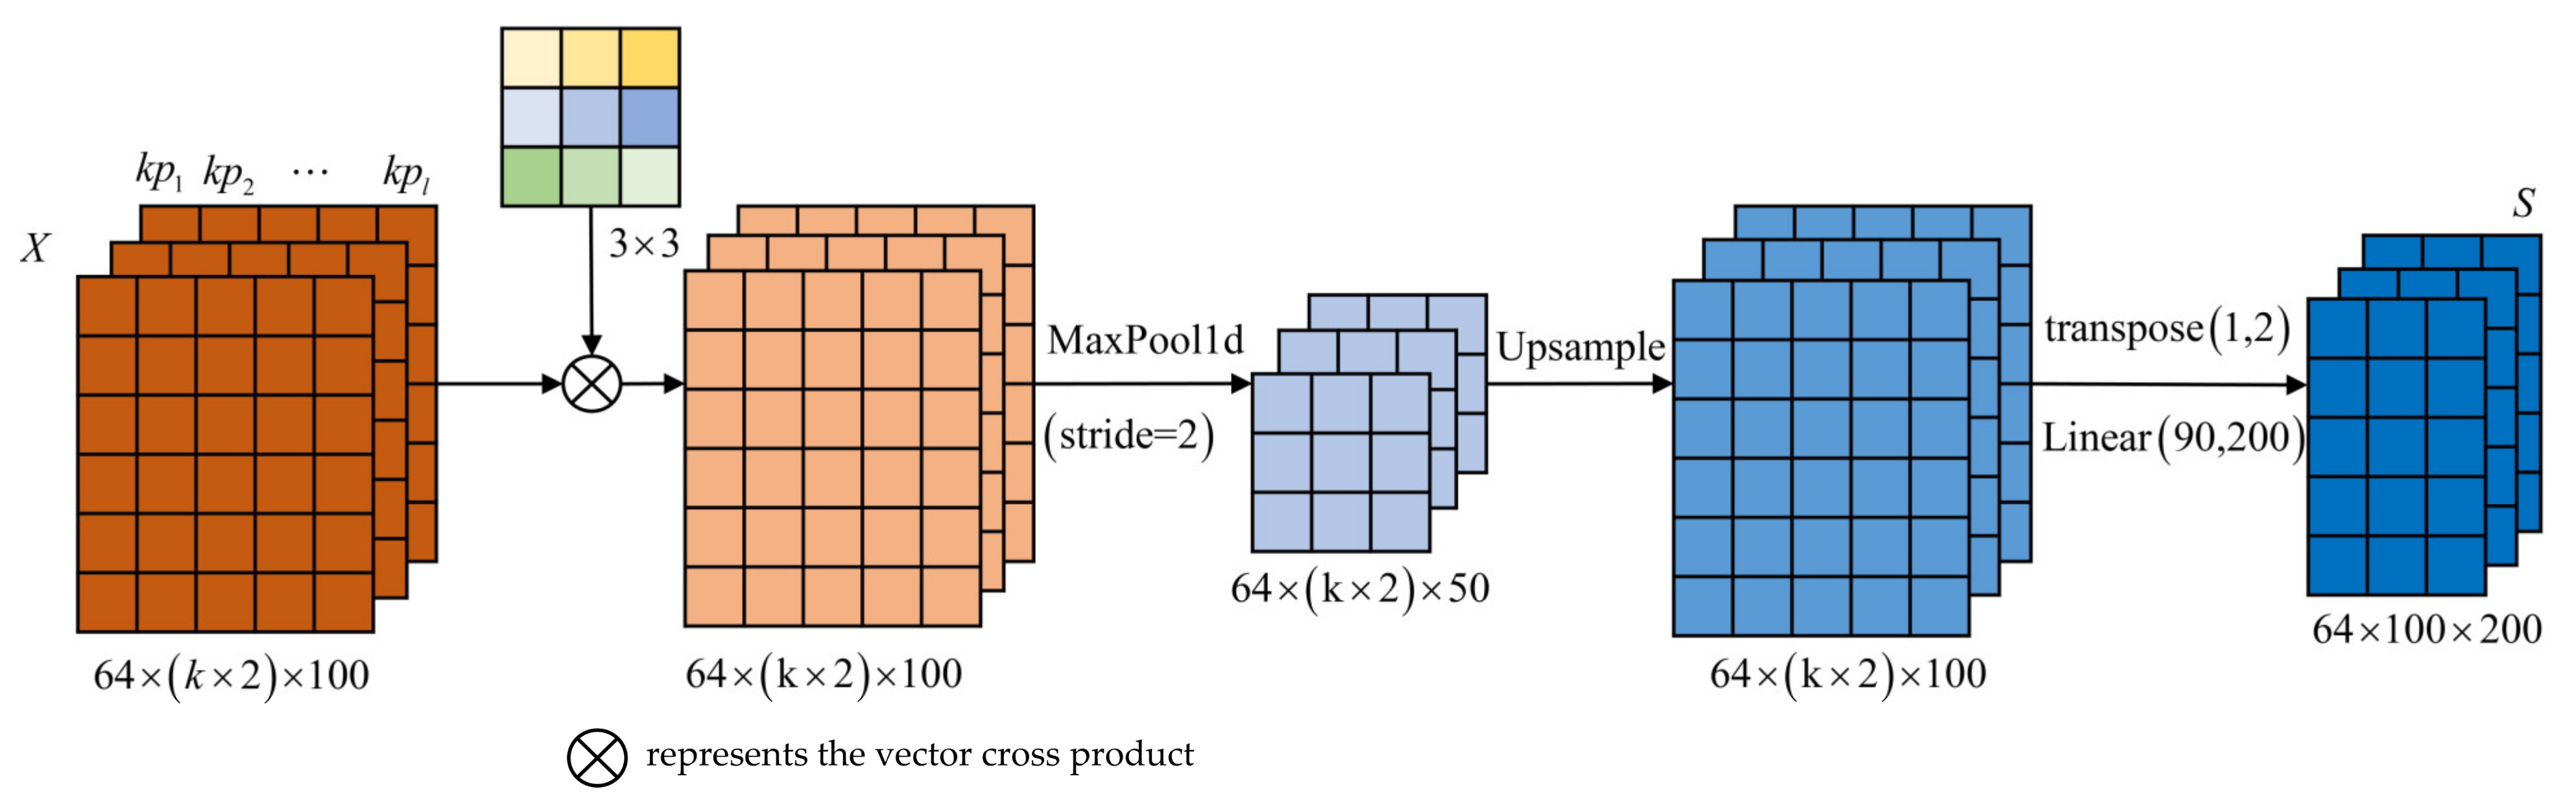
4.2. CNN-Based Spatial Feature Extraction
4.3. Nonlinear Mapping Based on Fully Connected Layers
| Algorithm 1 CL-TSKT algorithm |
|
5. Analysis of Experiments and Experimental Results
5.1. Datasets
5.2. Evaluation Metrics and Baseline Modeling
5.3. Experimental Environment and Model Parameters
5.4. Results
- (1)
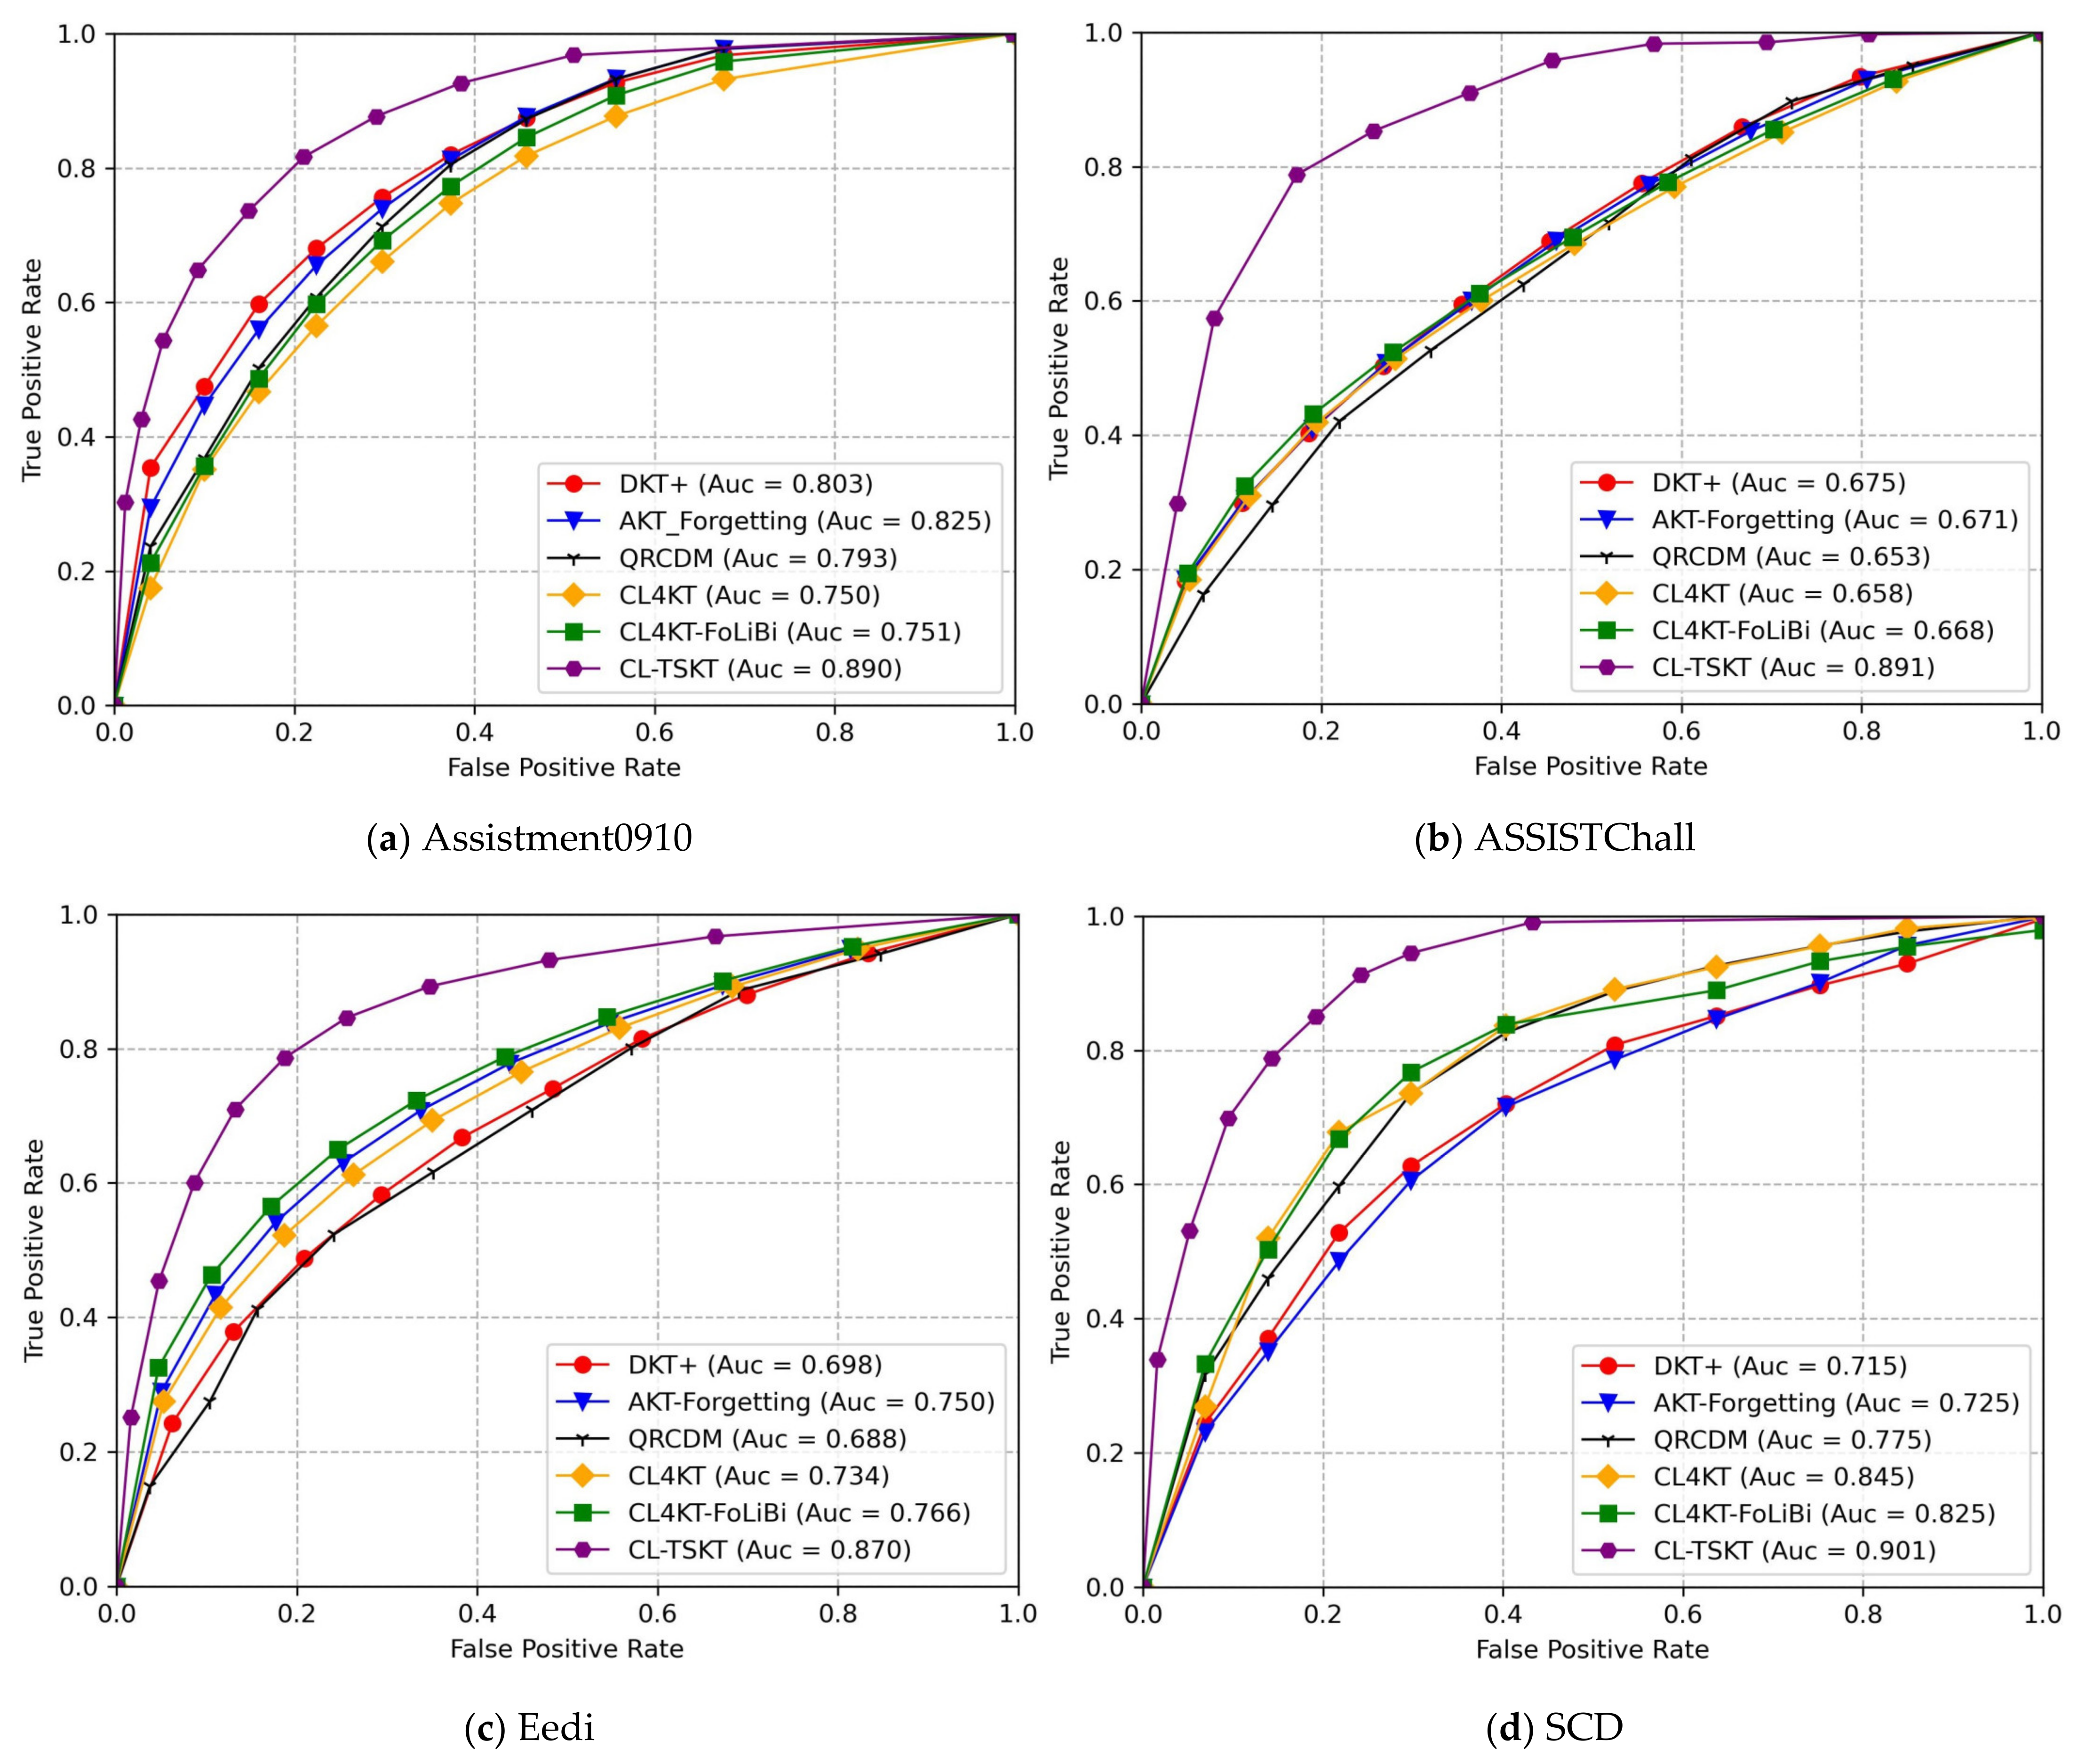
- The method proposed in this paper achieved the best performance on all four datasets. The evaluation metrics were all better than those of the baseline model on the SCD. It is shown that integrating classroom network characteristic learning engagement in smart classrooms can characterize students’ cognitive states more accurately.
- (2)
- Compared with the RNN-based DKT model and AKT + Forgetting based on contextual attention mechanism, CL-TSKT showed significant improvement. It proved the superiority of computing accumulation and forgetting based on GRU dynamic gate control.
- (3)
- CL4KT mainly uses a contrastive learning framework for knowledge tracing, and QRCDM mainly utilizes the cross-validation idea for feature extraction. CL-TSKT enhances feature extraction by using the temporal attention mechanism, and its obtained results outperformed CL4KT and QRCDM. This proves that the temporal attention mechanism can pay better attention to the important feature information and enhance the model prediction accuracy.
- (4)
- CL4KT-FoLiBi embedded with the forgetting linear deviation mechanism simulated students’ forgetting behavior, but it ignored that students’ knowledge processes are ambiguous and complex. In contrast, CL-TSKT started from the aspect of enhanced feature extraction, adopted a CNN to realize spatial feature extraction, strengthened the model feature extraction ability, and achieved better results.
- (5)
- In Table 5, the CL-TSKT model shows superior performance on all three online platform datasets and one smart classroom dataset. The distributions and quantities of the four datasets are different, as a demonstration of the greater robustness of the CL-TSKT model.
- (6)
- The poor performance of the RMSE value for CL-TSKT on the Eedi dataset was due to the high number of knowledge points contained in this dataset.
5.5. Ablation Experiment
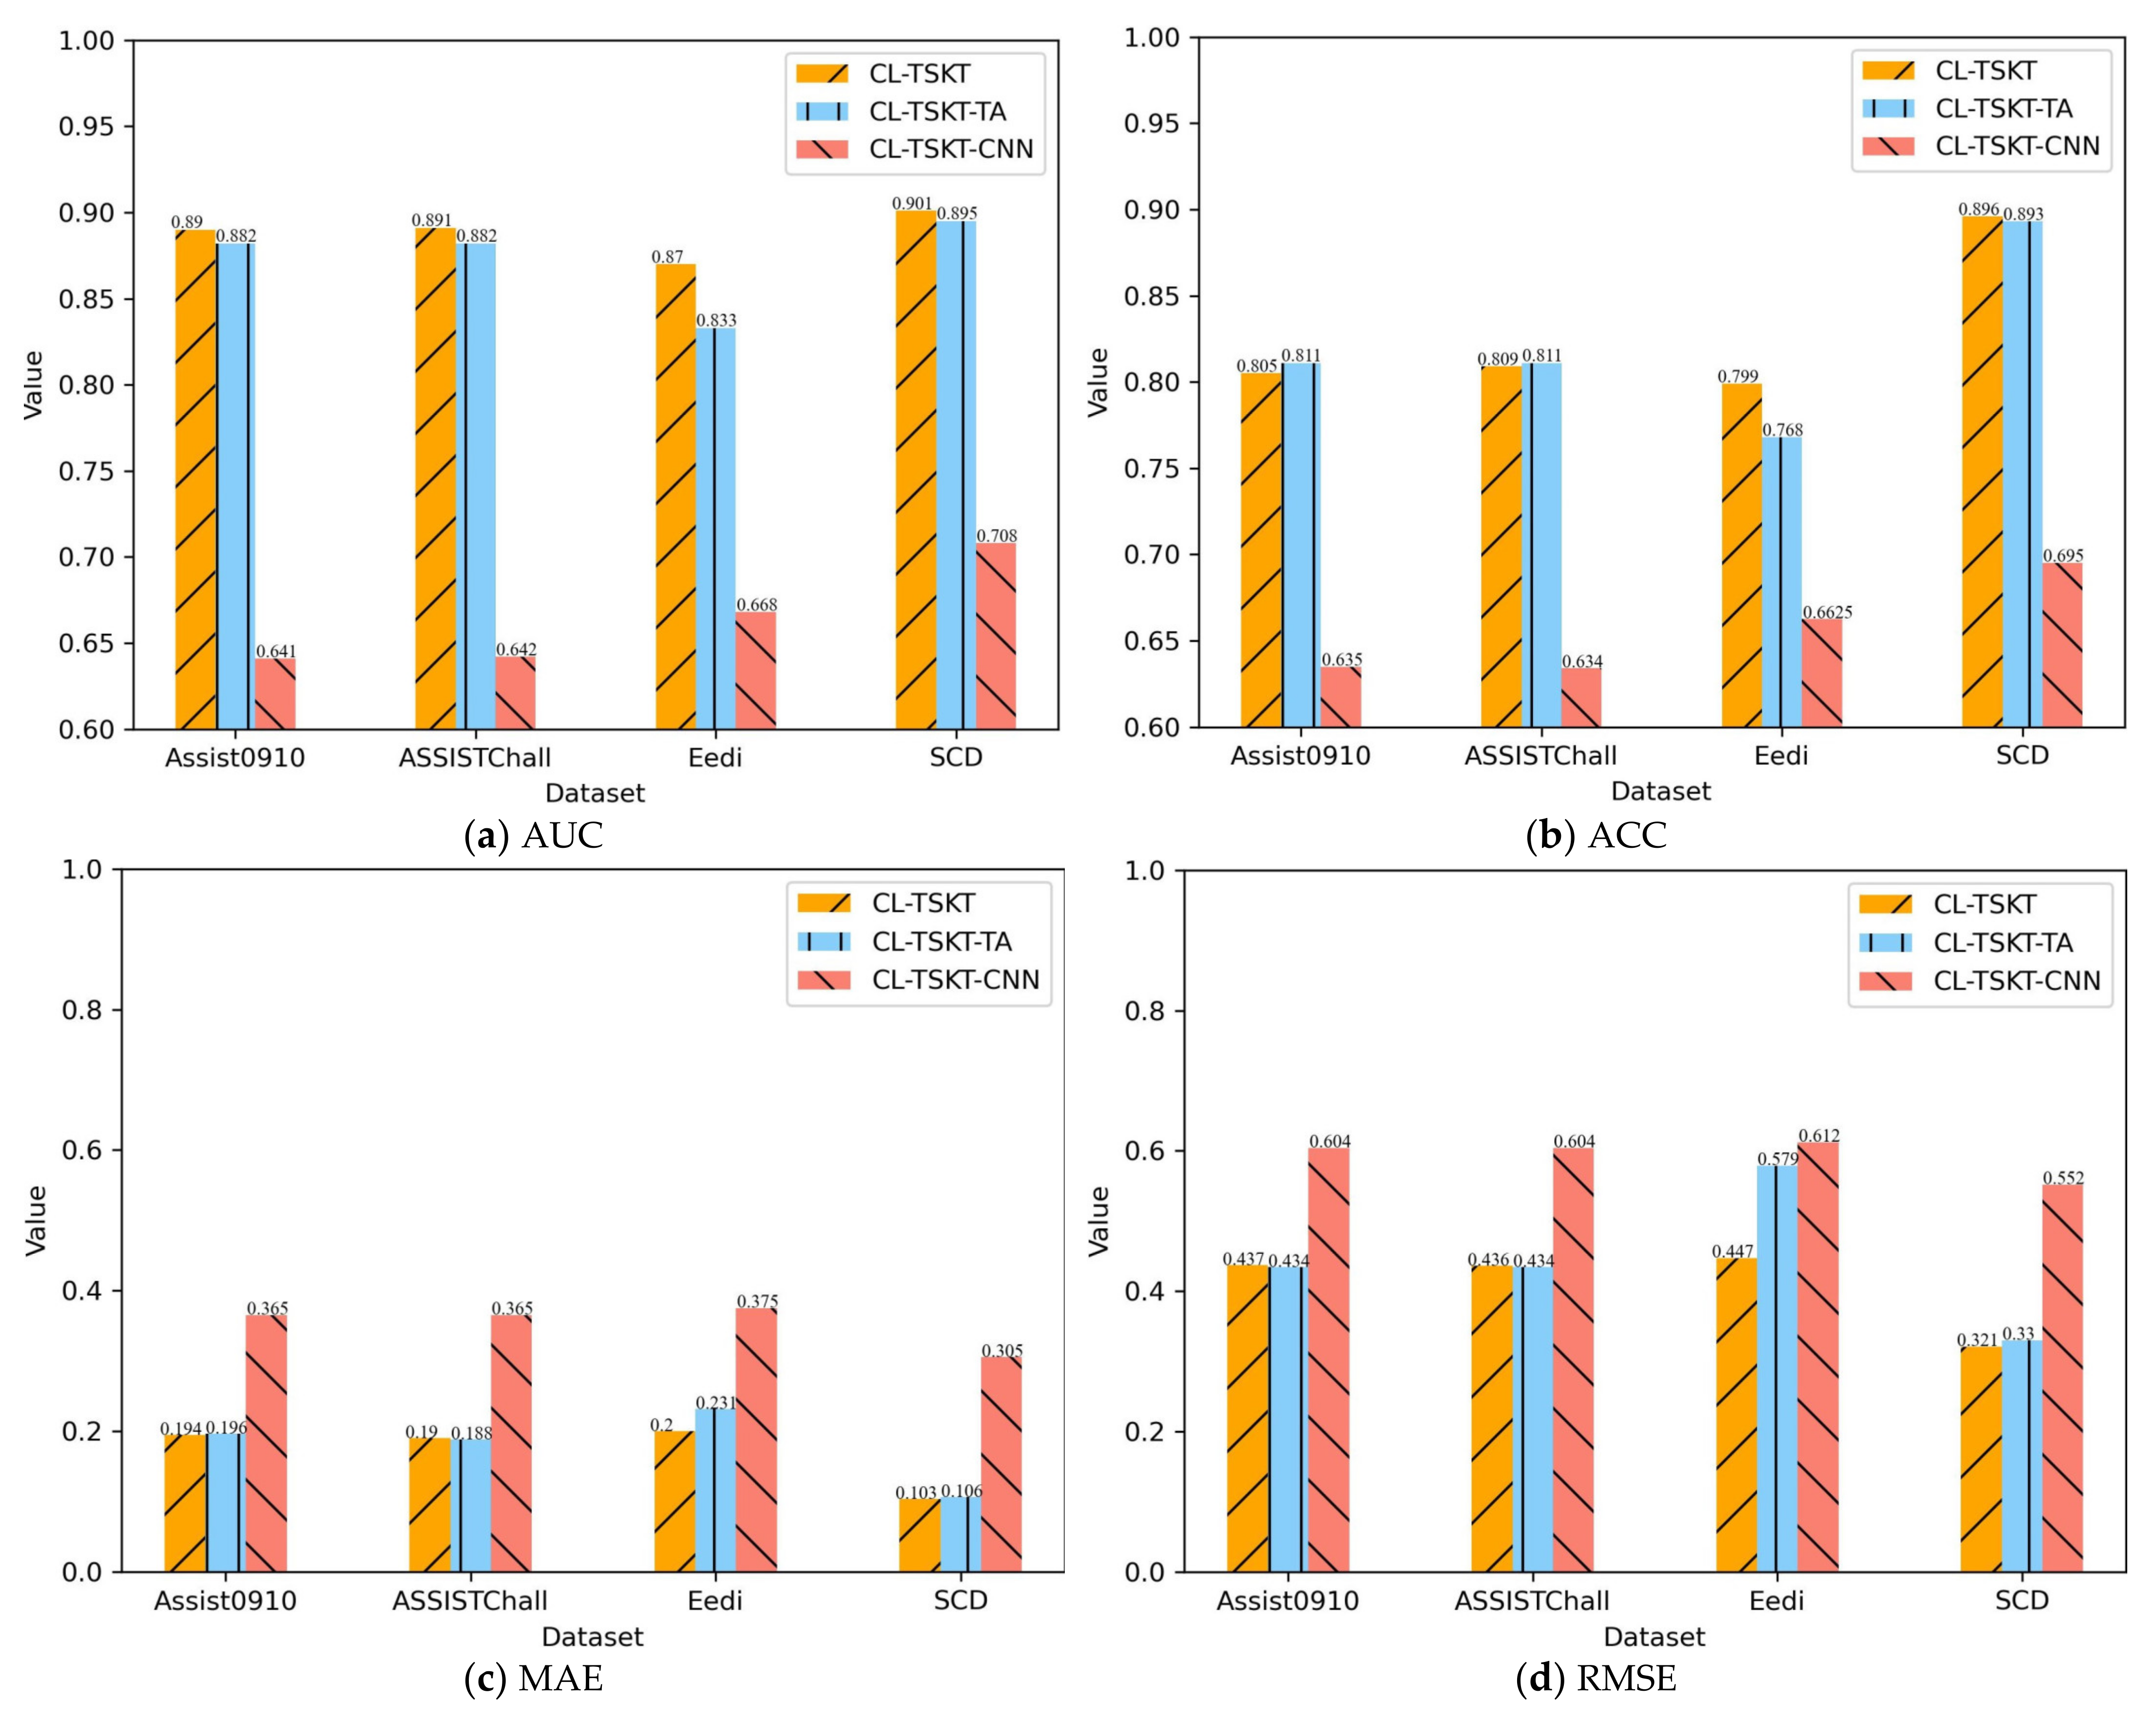
5.5.1. Ablation Experiments Based on the CNN’s Spatial Features and Temporal Attention Mechanisms
5.5.2. Ablation Experiments of Classroom Network Characteristic Learning Engagement
5.6. Analysis of Results
5.7. Discussion
6. Conclusions and Future Work
Author Contributions
Funding
Institutional Review Board Statement
Informed Consent Statement
Data Availability Statement
Conflicts of Interest
References
- Janssen, R.; Tuerlinckx, F.; Meulders, M.; De Boeck, P. A hierarchical IRT model for criterion-referenced measurement. J. Educ. Behav. Stat. 2000, 25, 285–306. [Google Scholar] [CrossRef]
- Li, L.; Wang, Z. Knowledge Relation Rank Enhanced Heterogeneous Learning Interaction Modeling for Neural Graph Forgetting Knowledge Tracing. PLoS ONE 2023, 18, e0295808. [Google Scholar] [CrossRef]
- Shi, Y.; Chen, L.; Qu, Z.; Xu, J.; Yang, H.H. Study on the Influencing Factors of Junior High School Students’ Learning Engagement Under the Smart Classroom Environment. In Proceedings of the International Conference on Blended Learning, Hong Kong, China, 17–20 July 2023; Springer Nature: Cham, Switzerland, 2023; pp. 47–58. [Google Scholar]
- Jiaming, N. A Study on the Learning Engagement Status and Influencing Factors of University Students in a Smart Classroom Environment: A Case Study of a Smart Classroom at Baise University. 2023. Available online: http://dspace.bu.ac.th/jspui/bitstream/123456789/5178/1/nong_jiam.pdf (accessed on 29 February 2024).
- You, W. Research on the relationship between learning engagement and learning completion of online learning students. Int. J. Emerg. Technol. Learn. 2022, 17, 102–117. [Google Scholar] [CrossRef]
- Hu, M.; Wei, Y.; Li, M.; Yao, H.; Deng, W.; Tong, M.; Liu, Q. Bimodal learning engagement recognition from videos in the classroom. Sensors 2022, 22, 5932. [Google Scholar] [CrossRef] [PubMed]
- Lu, G.; Liu, Q.; Xie, K.; Zhang, C.; He, X.; Shi, Y. Does the Seat Matter? The Influence of Seating Factors and Motivational Factors on Situational Engagement and Satisfaction in the Smart Classroom. Sustainability 2023, 15, 16393. [Google Scholar] [CrossRef]
- Putnik, G.; Costa, E.; Alves, C.; Castro, H.; Varela, L.; Shah, V. Analysing the correlation between social network analysis measures and performance of students in social network-based engineering education. Int. J. Technol. Des. Educ. 2016, 26, 413–437. [Google Scholar] [CrossRef]
- Xiang, T.; Ji, H.; Sheng, J. Analysis of Spatiotemporal Characteristics of Student Concentration Based on Emotion Evolution. Adv. Comput. Signals Syst. 2023, 7, 89–102. [Google Scholar]
- Van Rijsewijk, L.G.M.; Oldenburg, B.; Snijders, T.A.B.; Dijkstra, J.K.; Veenstra, R. A description of classroom help networks, individual network position, and their associations with academic achievement. PLoS ONE 2018, 13, e0208173. [Google Scholar] [CrossRef] [PubMed]
- Gutierrez, A. The Effects of Various Classroom Seating Arrangements on English Learners’ Academic Achievement. 2022. Available online: https://neiudc.neiu.edu/uhp-projects/31 (accessed on 12 May 2022).
- Li, J.; Shi, D.; Tumnark, P.; Xu, H. A system for real-time intervention in negative emotional contagion in a smart classroom deployed under edge computing service infrastructure. Peer Peer Netw. Appl. 2020, 13, 1706–1719. [Google Scholar] [CrossRef]
- De La Torre, J. DINA model and parameter estimation: A didactic. J. Educ. Behav. Stat. 2009, 34, 115–130. [Google Scholar] [CrossRef]
- Chiu, C.Y. Statistical refinement of the Q-matrix in cognitive diagnosis. Appl. Psychol. Meas. 2013, 37, 598–618. [Google Scholar] [CrossRef]
- Gu, Y.; Xu, G. The sufficient and necessary condition for the identifiability and estimability of the DINA model. Psychometrika 2019, 84, 468–483. [Google Scholar] [CrossRef]
- Ma, W.; de la Torre, J. An empirical Q-matrix validation method for the sequential generalized DINA model. Br. J. Math. Stat. Psychol. 2020, 73, 142–163. [Google Scholar] [CrossRef]
- Piech, C.; Bassen, J.; Huang, J.; Ganguli, S.; Sahami, M.; Guibas, L.J.; Sohl-Dickstein, J. Deep knowledge tracing. In Proceedings of the 28th International Conference on Neural Information Processing Systems, Montreal, QC, Canada, 7–12 December 2015; Volume 1, pp. 505–513. [Google Scholar]
- Ghosh, A.; Heffernan, N.; Lan, A.S. Context-aware attentive knowledge tracing. In Proceedings of the 26th ACM SIGKDD International Conference on Knowledge Discovery & Data Mining, Online, 6–10 July 2020; pp. 2330–2339. [Google Scholar]
- Yang, H.; Qi, T.; Li, J.; Guo, L.; Ren, M.; Zhang, L.; Wang, X. A novel quantitative relationship neural network for explainable cognitive diagnosis model. Knowl. Based Syst. 2022, 250, 109156. [Google Scholar] [CrossRef]
- Xiao, Y.; Xiao, R.; Huang, N.; Hu, Y.; Li, H.; Sun, B. Knowledge tracing based on multi-feature fusion. Neural Comput. Appl. 2023, 35, 1819–1833. [Google Scholar] [CrossRef]
- Liu, H.; Zhang, T.; Li, F.; Yu, M.; Yu, G. A probabilistic generative model for tracking multi-knowledge concept mastery probability. Front. Comput. Sci. 2024, 18, 183602. [Google Scholar] [CrossRef]
- Huang, C.; Wei, H.; Huang, Q.; Jiang, F.; Han, Z.; Huang, X. Learning consistent representations with temporal and causal enhancement for knowledge tracing. Expert Syst. Appl. 2024, 245, 123128. [Google Scholar] [CrossRef]
- Jiang, B.; Wei, Y.; Zhang, T.; Zhang, W. Improving the performance and explainability of knowledge tracing via Markov blanket. Inf. Process. Manag. 2024, 61, 103620. [Google Scholar] [CrossRef]
- Lee, W.; Chun, J.; Lee, Y.; Park, K.; Park, S. Contrastive learning for knowledge tracing. In Proceedings of the ACM Web Conference, Online, 25–29 April 2022; pp. 2330–2338. [Google Scholar]
- Im, Y.; Choi, E.; Kook, H.; Lee, J. Forgetting-aware Linear Bias for Attentive Knowledge Tracing. In Proceedings of the 32nd ACM International Conference on Information and Knowledge Management, Birmingham, UK, 21–25 October 2023; pp. 3958–3962. [Google Scholar]
- Ni, Q.; Wei, T.; Zhao, J.; He, L.; Zheng, C. HHSKT: A learner–question interactions based heterogeneous graph neural network model for knowledge tracing. Expert Syst. Appl. 2023, 215, 119334. [Google Scholar] [CrossRef]
- Wu, Z.; Huang, L.; Huang, Q.; Huang, C.; Tang, Y. SGKT: Session graph-based knowledge tracing for student performance prediction. Expert Syst. Appl. 2022, 206, 117681. [Google Scholar] [CrossRef]
- Huang, Q.; Su, W.; Sun, Y.; Huang, T.; Shi, J. NTM-based skill-aware knowledge tracing for conjunctive skills. Comput. Intell. Neurosci. 2022, 2022, 9153697. [Google Scholar] [CrossRef] [PubMed]
- Zhao, S.; Sahebi, S. Graph-Enhanced Multi-Activity Knowledge Tracing. In Proceedings of the Joint European Conference on Machine Learning and Knowledge Discovery in Databases, Turin, Italy, 18–22 September; Springer Nature: Cham, Switzerland, 2023; pp. 529–546. [Google Scholar]
- Shou, Z.; Tang, M.; Wen, H.; Liu, J.; Mo, J.; Zhang, H. Key Student Nodes Mining in the In-Class Social Network Based on Combined Weighted GRA-TOPSIS Method. Int. J. Inf. Commun. Technol. Educ. (IJICTE) 2023, 19, 1–19. [Google Scholar] [CrossRef]
- Rani, S.; Kumar, M. Influential Node Detection and Ranking with Fusion of Heterogeneous Social Media Information. IEEE Trans. Comput. Soc. Syst. 2022, 10, 1852–1874. [Google Scholar] [CrossRef]
- Bloch, F.; Jackson, M.O.; Tebaldi, P. Centrality measures in networks. Soc. Choice Welf. 2023, 61, 413–453. [Google Scholar] [CrossRef]
- Shang, Q.; Zhang, B.; Li, H.; Deng, Y. Identifying influential nodes: A new method based on network efficiency of edge weight updating. Chaos Interdiscip. J. Nonlinear Sci. 2021, 31, 033120. [Google Scholar] [CrossRef] [PubMed]
- Yamak, P.T.; Yujian, L.; Gadosey, P.K. A comparison between arima, lstm, and gru for time series forecasting. In Proceedings of the 2019 2nd International Conference on Algorithms, Computing and Artificial Intelligence, Sanya, China, 20–22 December 2019; pp. 49–55. [Google Scholar]
- Brauwers, G.; Frasincar, F. A general survey on attention mechanisms in deep learning. IEEE Trans. Knowl. Data Eng. 2021, 35, 3279–3298. [Google Scholar] [CrossRef]
- Basha, S.S.; Dubey, S.R.; Pulabaigari, V.; Mukherjee, S. Impact of fully connected layers on performance of convolutional neural networks for image classification. Neurocomputing 2020, 378, 112–119. [Google Scholar] [CrossRef]
- Feng, M.; Heffernan, N.T. Informing teachers live about student learning: Reporting in the assistment system. Technol. Instr. Cogn. Learn. 2006, 3, 63. [Google Scholar]
- Wang, Z.; Lamb, A.; Saveliev, E.; Cameron, P.; Zaykov, J.; Hernandez-Lobato, J.M.; Turner, R.E.; Baraniuk, R.S.; Barton, C.; Peyton, S.; et al. Results and insights from diagnostic questions: The NeurIPS 2020 education challenge. In Proceedings of the NeurIPS 2020 Competition and Demonstration Track, PMLR, Online, 9–12 December 2020; pp. 191–205. [Google Scholar]
- Rahayu, A. The analysis of students’ cognitive ability based on assesments of the revised Bloom’s Taxonomy on statistic materials. Eur. J. Multidiscip. Stud. 2018, 3, 80–85. [Google Scholar] [CrossRef]
- Nesayan, A.; Amani, M.; Gandomani, R.A. Cognitive profile of children and its relationship with academic performance. Basic Clin. Neurosci. 2019, 10, 165. [Google Scholar] [CrossRef]
- Tikhomirova, T.; Malykh, A.; Malykh, S. Predicting academic achievement with cognitive abilities: Cross-sectional study across school education. Behav. Sci. 2020, 10, 158. [Google Scholar] [CrossRef]
- Peng, P.; Kievit, R.A. The development of academic achievement and cognitive abilities: A bidirectional perspective. Child Dev. Perspect. 2020, 14, 15–20. [Google Scholar] [CrossRef]


| Models | Paper Numbers | Advantages | Limitations |
|---|---|---|---|
| Traditional KT models | [1,13,14,15,16] | Highly interpretable | Static diagnostics, multiple knowledge points difficult to interpret |
| Sequence modeling KT models | [17,18,19] | Improved prediction accuracy by fully utilizing test data | Single-dimensional data analysis, lack of consideration of other factors affecting students’ cognitive states |
| Text-aware KT models | [20,21,22] | Full consideration of exercise data, with different levels of difficulty associated with text content | Poor harmonization of datasets and difficulties in text tagging |
| Forgetting-aware KT models | [23,24,25,26] | Considering students’ presence of learning forgetting behaviors based on practice answer situations | Knowledge states in reality are often complex and ambiguous, and single-answer situation analysis of forgetting lacks reliability |
| Graph-based KT models | [2,27,28,29] | Considering the spatial relationship between knowledge point-knowledge points, automatically acquiring side rights, and updating cognitive abilities | The existence of data correlation needs to be pre-assumed, and limited scope of use |
| Dataset | Assistment0910 | ASSISTChall | Eedi | SCD |
|---|---|---|---|---|
| Number of learners | 4049 | 1709 | 4918 | 58 |
| Number of concepts | 110 | 102 | 948 | 37 |
| Number of exercises | 16,000 | 3000 | 948 | 45 |
| Number of interactions | 325,000 | 942,000 | 104,000 | 11,000 |
| Average length | 80 | 551 | 212 | 195 |
| Engage data | No | No | No | Yes |
| Baseline | Description |
|---|---|
| DKT+ [17] | A recurrent neural network (RNN) is used to track the state of students’ knowledge, and two regularization terms are added to solve the DKT model of the reconstruction and the consistency problem. |
| AKT + Forgetting [18] | Uses attention mechanisms with exponential decay and context-aware relative distance metrics and embeds forgetting linear deviations. |
| QRCDM [19] | A quantitatively interpretable cognitive diagnostic model based on explicit correlations between test questions and knowledge concepts, with implicit correlations between test questions and irrelevant knowledge concepts. |
| CL4KT [24] | A KT model for a contrastive learning framework that reveals semantically similar or dissimilar variables. |
| CL4KT-FoLiBi [25] | A KT model incorporating forgotten linear bias (FoLiBi) into CL4KT. |
| Experimental Environment | Environment Configuration |
|---|---|
| Operating Systems | Linux |
| CPU | Intel(R) Xeon(R) Gold 6330H |
| Video Cards | GeForce RTX 3090 |
| RAM | 32 GB |
| ROM | 1T SSD |
| Programming Languages | Python 3.7 |
| Framework | Pytorch |
| Dataset | Model | AUC | ACC | MAE | RMSE |
|---|---|---|---|---|---|
| Assistment0910 | DKT+ | 0.803 | 0.772 | 0.227 | 0.477 |
| AKT + Forgetting | 0.825 | 0.773 | 0.226 | 0.476 | |
| QRCDM | 0.793 | 0.748 | 0.252 | 0.502 | |
| CL4KT | 0.750 | 0.715 | 0.285 | 0.441 | |
| CL4KT-FoLiBi | 0.751 | 0.712 | 0.287 | 0.437 | |
| CL-TSKT | 0.890 | 0.805 | 0.194 | 0.437 | |
| ASSISTChall | DKT+ | 0.675 | 0.665 | 0.334 | 0.578 |
| AKT + Forgetting | 0.671 | 0.673 | 0.326 | 0.571 | |
| QRCDM | 0.653 | 0.619 | 0.381 | 0.617 | |
| CL4KT | 0.658 | 0.641 | 0.358 | 0.476 | |
| CL4KT-FoLiBi | 0.668 | 0.659 | 0.341 | 0.468 | |
| CL-TSKT | 0.891 | 0.809 | 0.190 | 0.436 | |
| Eedi | DKT+ | 0.698 | 0.648 | 0.351 | 0.593 |
| AKT + Forgetting | 0.750 | 0.688 | 0.312 | 0.450 | |
| QRCDM | 0.688 | 0.635 | 0.364 | 0.603 | |
| CL4KT | 0.734 | 0.673 | 0.326 | 0.457 | |
| CL4KT-FoLiBi | 0.766 | 0.698 | 0.301 | 0.443 | |
| CL-TSKT | 0.870 | 0.799 | 0.200 | 0.447 | |
| SCD | DKT+ | 0.715 | 0.736 | 0.264 | 0.514 |
| AKT + Forgetting | 0.725 | 0.753 | 0.246 | 0.496 | |
| QRCDM | 0.776 | 0.780 | 0.220 | 0.469 | |
| CL4KT | 0.845 | 0.845 | 0.154 | 0.340 | |
| CL4KT-FoLiBi | 0.825 | 0.834 | 0.165 | 0.354 | |
| CL-TSKT | 0.901 | 0.896 | 0.103 | 0.321 |
| Dataset | Model | AUC | ACC | MAE | RMSE |
|---|---|---|---|---|---|
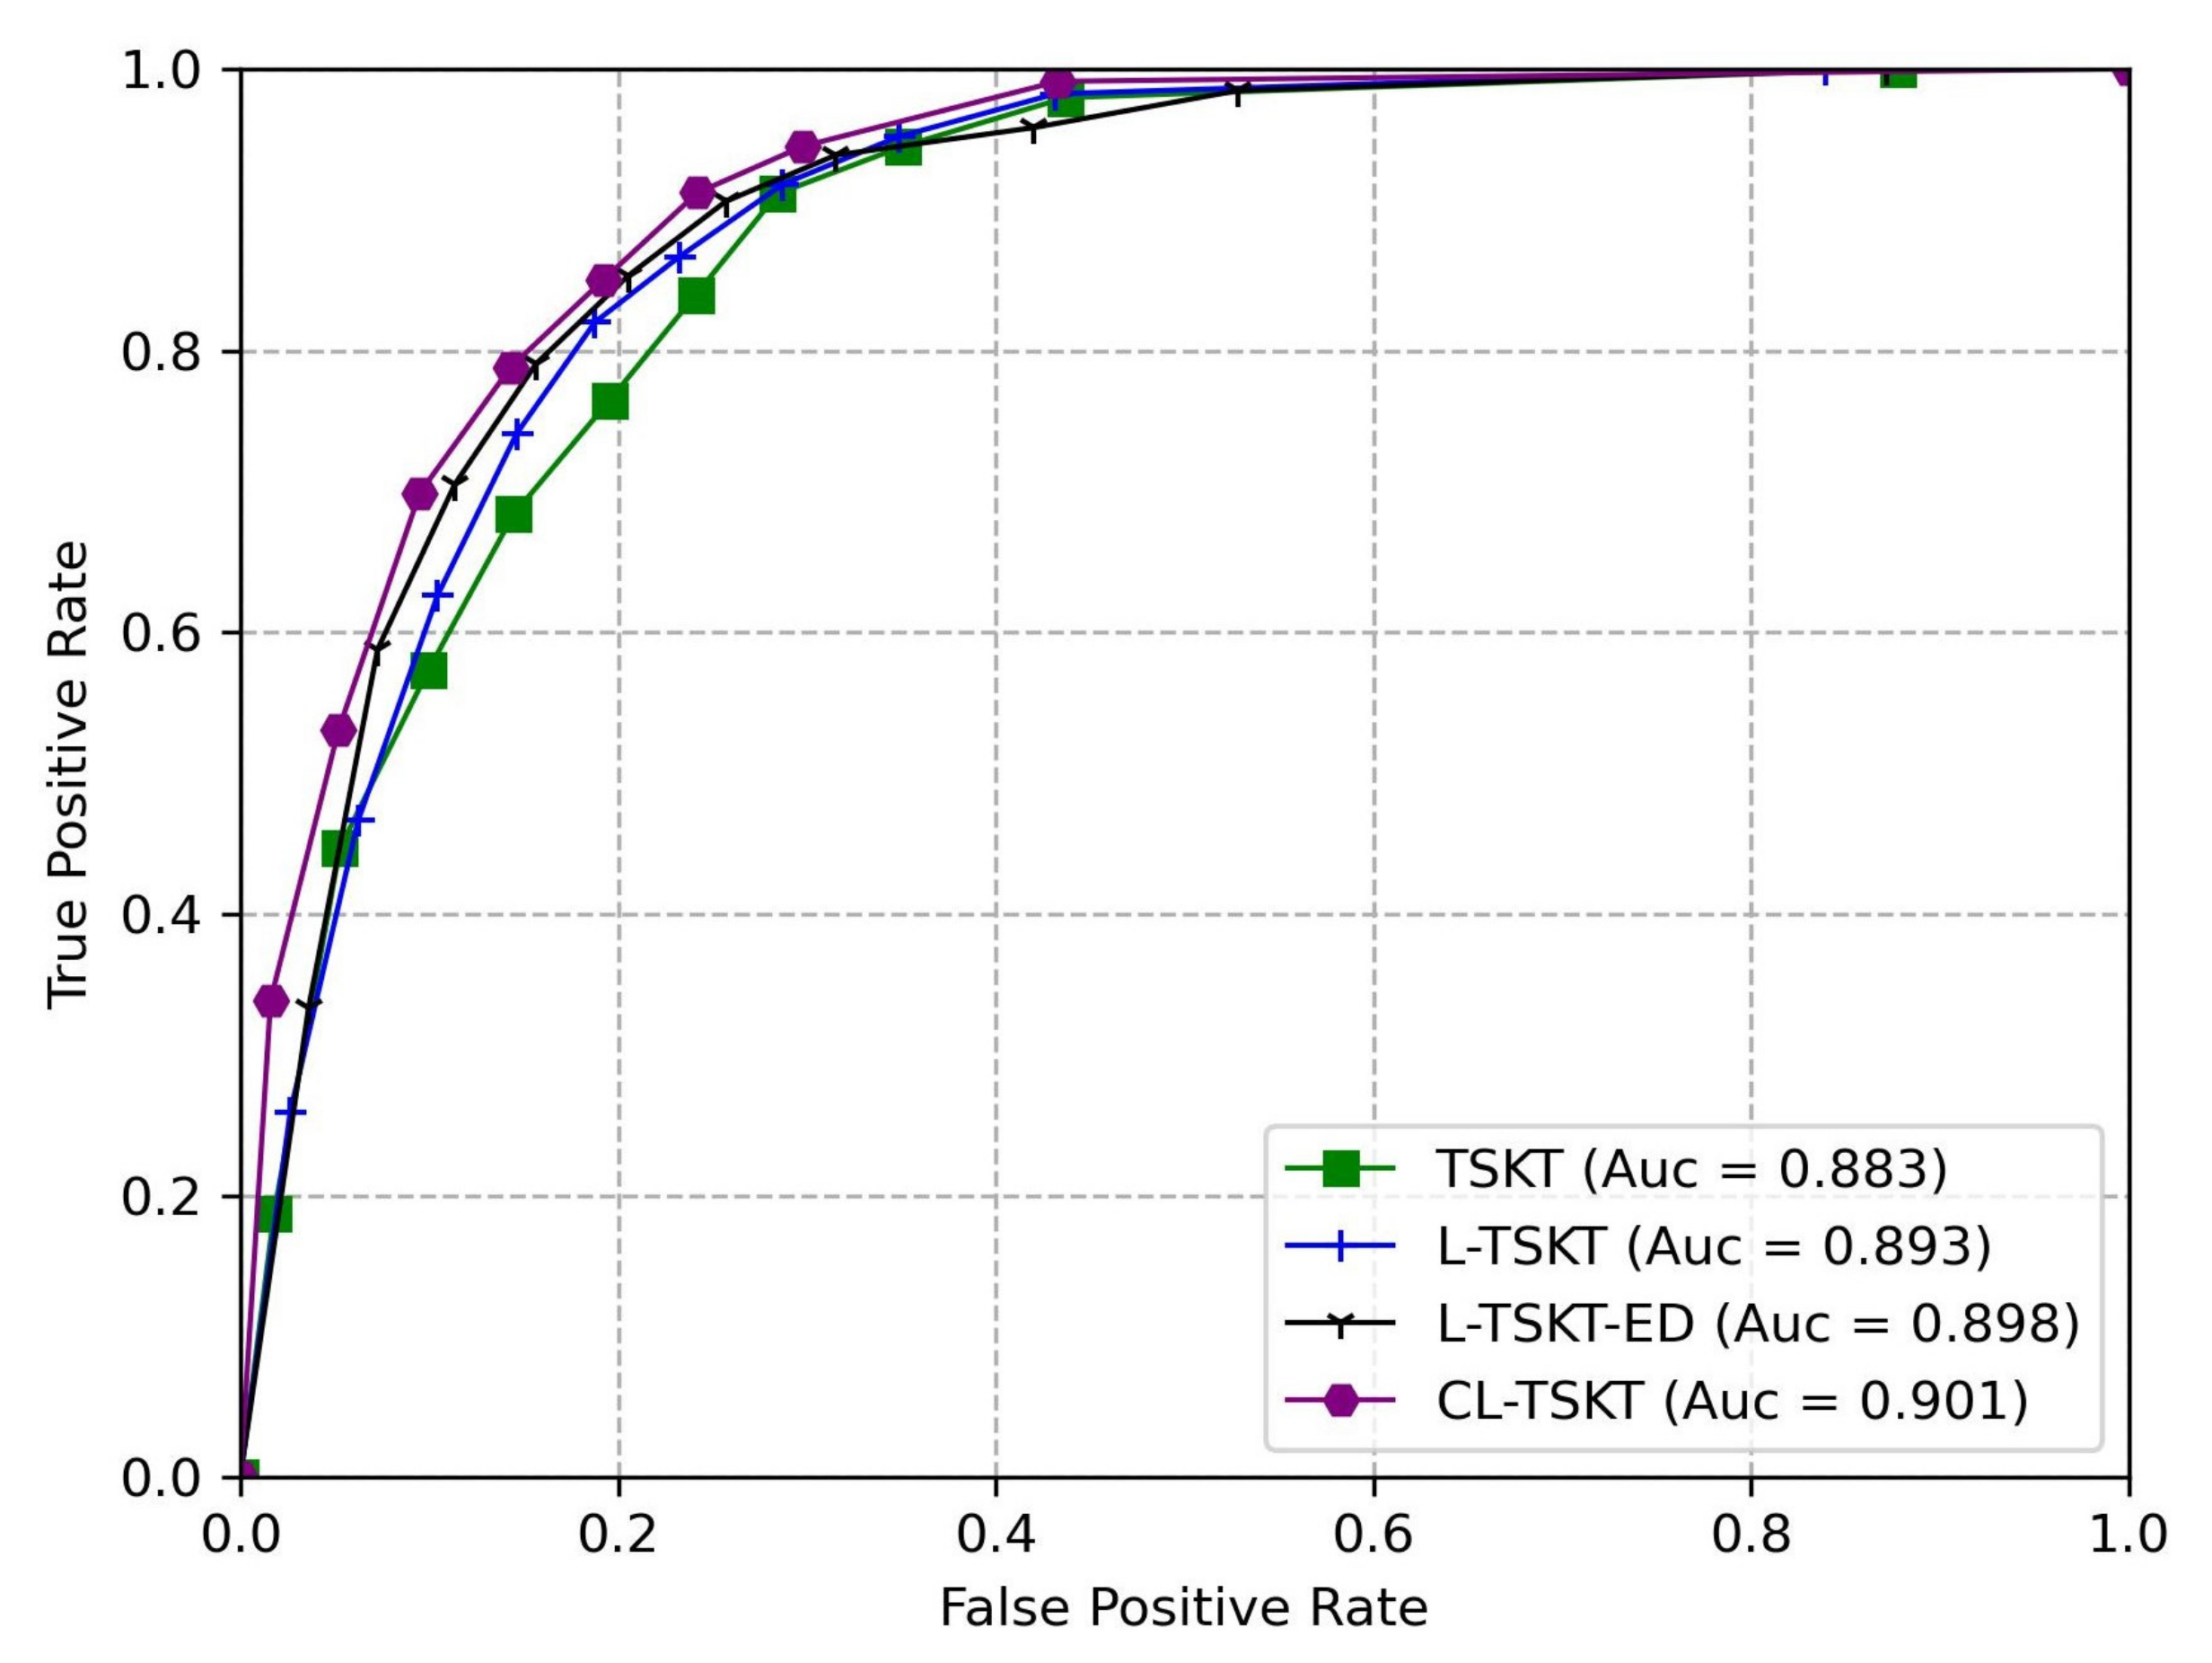
| SCD | TSKT | 0.883 | 0.883 | 0.116 | 0.341 |
| L-TSKT | 0.893 | 0.886 | 0.113 | 0.337 | |
| L-TSKT-ED | 0.898 | 0.878 | 0.121 | 0.348 | |
| CL-TSKT | 0.901 | 0.896 | 0.103 | 0.321 |
| ID | TSKT | L-TSKT | L-TSKT-ED | CL-TSKT |
|---|---|---|---|---|
| 123 | 89.0% | 89.1% | 89.0% | 89.9% |
| 127 | 92.3% | 92.4% | 92.4% | 93.9% |
| 134 | 88.2% | 88.3% | 88.4% | 92.5% |
| 214 | 89.8% | 89.7% | 89.9% | 92.3% |
| 216 | 77.9% | 78.3% | 78.4% | 84.3% |
| 224 | 86.7% | 86.7% | 86.8% | 92.0% |
| ID | kp1 | kp2 | kp3 | … | kpk−1 | kpk |
|---|---|---|---|---|---|---|
| 123 | 0.856 | 0.743 | 0.603 | … | 0.718 | 0.766 |
| 127 | 0.801 | 0.801 | 0.519 | … | 0.631 | 0.931 |
| 134 | 0.811 | 0.867 | 0.829 | … | 0.939 | 0.818 |
| 214 | 0.856 | 0.816 | 0.596 | … | 0.681 | 0.749 |
| 216 | 0.788 | 0.365 | 0.565 | … | 0.794 | 0.736 |
| 224 | 0.855 | 0.850 | 0.832 | … | 0.754 | 0.773 |
| ID | kp1 | kp2 | kp3 | … | kpk−1 | kpk |
|---|---|---|---|---|---|---|
| 123 | C | D | E | … | D | D |
| 127 | C | C | E | … | E | B |
| 134 | C | C | C | … | B | C |
| 214 | C | C | E | … | D | D |
| 216 | D | F | E | … | D | D |
| 224 | C | C | C | … | D | D |
| ID | Cognitive Grade | Test Performance | Test Grade |
|---|---|---|---|
| 123 | D | 79 | D |
| 127 | D | 78 | D |
| 134 | C | 82 | C |
| 214 | D | 65 | D |
| 216 | E | 43 | E |
| 224 | D | 80 | D |
Disclaimer/Publisher’s Note: The statements, opinions and data contained in all publications are solely those of the individual author(s) and contributor(s) and not of MDPI and/or the editor(s). MDPI and/or the editor(s) disclaim responsibility for any injury to people or property resulting from any ideas, methods, instructions or products referred to in the content. |
© 2024 by the authors. Licensee MDPI, Basel, Switzerland. This article is an open access article distributed under the terms and conditions of the Creative Commons Attribution (CC BY) license (https://creativecommons.org/licenses/by/4.0/).
Share and Cite
Shou, Z.; Li, Y.; Li, D.; Mo, J.; Zhang, H. Research on Knowledge Tracing-Based Classroom Network Characteristic Learning Engagement and Temporal-Spatial Feature Fusion. Electronics 2024, 13, 1454. https://doi.org/10.3390/electronics13081454
Shou Z, Li Y, Li D, Mo J, Zhang H. Research on Knowledge Tracing-Based Classroom Network Characteristic Learning Engagement and Temporal-Spatial Feature Fusion. Electronics. 2024; 13(8):1454. https://doi.org/10.3390/electronics13081454
Chicago/Turabian StyleShou, Zhaoyu, Yihong Li, Dongxu Li, Jianwen Mo, and Huibing Zhang. 2024. "Research on Knowledge Tracing-Based Classroom Network Characteristic Learning Engagement and Temporal-Spatial Feature Fusion" Electronics 13, no. 8: 1454. https://doi.org/10.3390/electronics13081454