Article

Impedance and Dielectric Analysis of Nickel Ferrites: Revealing the Role of the Constant Phase Element and Yttrium Doping

1
Department of Physics, Faculty of Sciences, University of Novi Sad, Trg Dositeja Obradovića 4, 21000 Novi Sad, Serbia
2
Faculty of Technical Sciences, University of Novi Sad, Trg Dositeja Obradovića 6, 21000 Novi Sad, Serbia
3
Institute of Information Technology, University of Dunaujvaros, Tancsics M. Str. 1/A, H-2401 Dunaujvaros, Hungary
4
Symbolic Methods in Material Analysis and Tomography Research Group, Faculty of Engineering and Information Technology, University of Pecs, Boszorkany Str. 6, H-7624 Pecs, Hungary
5
John von Neumann Faculty of Informatics, Óbuda University, Becsi Str. 96/B, H-1034 Budapest, Hungary
*
Author to whom correspondence should be addressed.
Electronics 2024, 13(8), 1496; https://doi.org/10.3390/electronics13081496
Submission received: 9 February 2024 / Revised: 27 March 2024 / Accepted: 11 April 2024 / Published: 15 April 2024
(This article belongs to the Section Microelectronics)

Abstract

:
This paper presents the analysis of electrical and dielectric properties of the yttrium-doped nickel ferrite nano-powders synthesized using the co-precipitation method. Impedance and dielectric measurements have been carried out as a function of frequency at different temperatures from 200 to 25 °C in the range of 0.1 kHz–1 MHz. In order to investigate the conduction mechanism and highlight the role of yttrium doping in different concentrations, impedance spectroscopy was employed. The obtained data were analyzed in terms of equivalent circuits made of resistor and capacitor components describing the contributions from different electrical active regions in a material. Further, this study highlights the importance of a single constant phase element (CPE) in the description of dispersion behavior of the impedance response of the investigated samples in the given frequency range. The use of this technique enabled the characterization of grain and grain boundaries contribution in overall conductivity mechanism. The dielectric dispersion nature of all investigated materials is reflected in this study. Very high values of the real part of permittivity at low frequencies are assigned to space-charge polarization. The dependence of the real part of dielectric permittivity values of the yttrium content was also discussed. Doping with yttrium in different concentrations that reflects in different electric and dielectric responses is concluded in this study. The greatest change is noticed for the sample with the minimum dopant content for a x = 0.05 atomic percent share of yttrium. To reveal the potential role of more than one ion contribution to the overall relaxation process in investigated compounds, a modified Debye’s equation was utilized.

1. Introduction

Due to their specific magnetic, electrical and optical properties, magnetic nanoparticles are considered as highly versatile materials of great importance with the significant potential for application in different areas such as medicine, cancer therapy, bio-sensing, catalysis and environment [1,2,3,4]. For the same reason, magnetic nanoparticles are recognized as promising materials for utilization in modern electronic devices. Their implementation in soft electronics and robotics enables many functions, such as the detection of intensity and direction of magnetic fields, measurements of mechanical deformations, manipulation at small scales, etc. Among these, transition metal ferrites of a general MFe2O4 formula (where M can be Ni, Co, Mn, Zn, Mg, etc.) are particularly important due to their chemical and thermal stability and unique physical properties providing them a wide potential for various technological applications [5,6,7,8].
The NiFe2O4 belongs to a group of soft ferrites, crystallized in a fully inverse spinel structure, where trivalent ions (Fe3+) are equally positioned at two interstitial sites A and B, and the octahedral sites B are filled by divalent cations [9]. The energy gap of NiFe2O4 is found to be 1.59 eV. Thanks to their high electrical resistivity and electrochemical stability, catalytic and magnetic behavior, the nickel ferrites found their use in photoelectric devices, catalysis, sensors and nano-devices [9,10]. Some of these properties can be further improved by the replacement of Ni2+ ions with divalent cations, or with the substitution of Fe3+ with trivalent cations [11,12,13,14,15,16].
Impedance spectroscopy (IS) [17] and dielectric spectroscopy (DS) [18] are the instrumental techniques most commonly used to characterize the electrical and dielectric response of the investigated materials using various formalisms. IS handles the frequency data sets of resistance (R) and capacity (C) parameters obtained at a specified temperature. Experimental data are analyzed in terms of the equivalent circuits made of components describing the contribution of the different electrical active regions in a material. This analysis is essential for materials that are inhomogeneous, such as ferrites [19]. DS is a well-established method for the analysis of dielectric materials that exhibit the dipolar reorientation processes [20]. The aim of the DS study is to determine the time constants using the peak maxima, either from frequency dependence at a given temperature, or from temperature variation at the selected frequency. Data are usually displayed via permittivity and dielectric loss parameters whose analysis enables the characterization of the different relaxation processes over measured temperature/frequency interval.
In impedance data, the time constants represent conducting components and parallel resistance–capacitance (RC) combinations, while in permittivity data, they represent dielectric processes and series RC combinations. The use of broadband data enables the determination of the best equivalent circuit to fit the experimental data, quantify resistance, capacitance and time constant parameters of different regions of the investigated material and to describe departures from ideality using appropriate circuit elements in the fit procedure. Using the fixed frequency and variable temperature data in either impedance or dielectric methodologies, it is possible to detect the presence of different electrical components that contribute to a data set.
In order to conduct a comprehensive study related to electrical inhomogeneity and carriers’ behaviors in yttrium doped nickel ferrites, the combined impedance and dielectric analysis is applied. Namely, in most cases, the low-frequency peak seen in the impedance spectra originates from the direct current (DC) component of the conductivity and therefore makes the real dielectric relaxation phenomena unable to be detected using this technique.
Henceforth, in this study, an attempt is made to comprehensively investigate the electric and dielectric properties of nickel ferrites doped with yttrium by implementing both the IS and DS methods. The impedance spectra and dispersion curves of the dielectric permittivity are analyzed in detail. The main contribution of this work is the establishment of the correlation between the polarization and conduction mechanism and perceiving the role of yttrium dopant by employing conductivity and dielectric models from the literature during the discussion of the reported results.
In the previous investigations of the electrical properties of N i F e 2 x Y x O 4   samples (where the yttrium atomic percent share is 0 ≤ x ≤ 0.3), it was reported that the doping with yttrium in small amounts (up to x = 0.15) reflects an increase in AC (alternating current) electrical conductivity. However, this trend becomes the opposite with the further addition of impurity atoms [21]. Such behavior was explained by the creation of vacancies due to the replacement of yttrium ions with Fe ions. This substitution can affect the number of Ni2+–Ni3+ and Fe2+–Fe3+ pairs and thus change the sample conductivity. It was also suggested that the presence of the secondary phase detected on the X-ray of samples with x ≥ 0.15 may have an influence on conductivity values. Therefore, further investigations of electric properties proved to be necessary for highlighting the consequences of yttrium doping on the structure modification.
In order to investigate the polarization mechanism in the studied samples and to establish the correlation with IS results, DS analysis is applied. It is known that the dielectric behavior of such materials is governed by mainly four types of polarization: dipolar, ionic, electronic and space charge polarization [22]. Thus, orientation and interfacial polarization are dominant in low frequency range and explore a significant dependence on temperature. The ionic and electronic polarizations contribute at higher frequencies and show no change with temperature.
The paper can be summarized as follows. The Section 1 presents the introduction and the main goal of the research. The Section 2 describes the employed methodology. The Section 3 contains experimental results and a detailed discussion of the results. The conclusion is given in the Section 4, and suggestions for future work are in the Section 5.

2. Method

2.1. Impedance Spectroscopy Studies

To obtain a better insight into the conductivity mechanism and reveal the potential role of the secondary phase in the investigated samples, impedance spectroscopy measurements were performed over a range of temperatures (200–25 °C) and frequencies. This analysis is very useful for the characterization of ferrites, since it enables the detection of electrical responses arising from different electrical active regions in a material.
Yttrium doped nickel ferrite nano-powders are synthesized using the co-precipitation method as described in [21]. The densities of all the samples are well above 90% of TD (theoretical density) and vary only slightly for varying Y3+ content, as confirmed using scanning electron microscope (SEM) images of the fresh fracture surfaces of the investigated samples [21]. The grain size was found to decrease with the increase in yttrium content, possibly due to the pinning of the grain growth using the secondary phases nucleated at the grain boundaries.
For the needs of the measurements of the electrical and dielectric properties, N i F e 2 x Y x O 4   samples (x = 0.05, 0.15 and 0.3 at. %) were prepared in the form of tablets, prepared using a cold press. The wires of the sample holder were connected to the silver electrodes and the whole sample holder was placed inside the furnace. After reaching the maximum temperature of 200 °C, the capacity and resistance were recorded in the cooling regime of the sample with 5 °C steps using the GW Instek LCR-8105G (Available online https://www.coleparmer.com/i/gw-instek-lcr-8105g-20-hz-to-5-mhz-precision-lcr-meter/2003658, accessed on 4 March 2024). 20 Hz to 5 MHz Precision LCR Meter [23]. Measurements were conducted in the frequency range from 0.1 kHz to 1 MHz.
From the experimentally determined values of the resistance Rp and the capacitance Cp connected in parallel, the complex impedance Z* was calculated according to the following relation:
Z * = Z r e a l j Z i m a g = ( 1 R p + j ω C p ) 1
where ω is the angular frequency of the field.
Impedance spectra were analyzed and simulated using the EIS Spectrum Analyzer software (Available online: www.abc.chemistry.bsu.by, accessed on 22 December 2023) [24]. The simulation procedure involves fitting the experimental data with an equivalent electrical circuit. Based on Rp and Cp parameters obtained from the fit, it was possible to determine the relaxation time using the expression:
τ = R p · C p
or the modified expression, where the CPE element instead of C is used for fitting:
τ = ( R p · C P E ) 1 1 n
where τ is the relaxation time, Rp and Cp are the fitting parameters and n is the parameter whose values lie between 0 and 1. The constant phase element CPE is used to accommodate the non-ideal behavior of the capacitance. The impedance of the CPE can be described with the following expression [25]:
Z C P E = C P E 1 ( j ω ) n
where ω is the angle frequency, the parameter CPE is independent of frequency and the values of n lie between 0 and 1. At n = 0, it is considered to be a pure resistor while for n = 1 it is regarded as a pure capacitor.
Further, following the Arrhenius law [26], the activation energy of the conductivity mechanism could be calculated. This parameter is significant for the identification of the type of charge carriers transfer.

2.2. Dielectric Spectroscopy Studies

In order to investigate the polarization mechanism in the studied samples and to establish a correlation with the IS results, DS analysis is used. Although this technique uses the same type of electrical information as impedance spectroscopy, it applies a different approach in data representation. The dielectric response is based on a concept of “energy storage” and results in the relaxation per release of this energy via the system’s individual components. The time required for this process to take place is called the relaxation time τ and can be described with the following relation [25]:
τ = 1 2 π f m a x
where fmax is the so-called critical relaxation frequency.
In the experiments, the relaxation time can be determined through detecting the frequency dependence of the complex permittivity ε*. This quantity is a function of two parameters: the real part ε′ and imaginary part ε″ of permittivity:
ε * = ε + ε = ε + ε 0 ε 1 + ( ω τ ) 2 + ( ε 0 ε ) ω τ 1 + ( ω τ ) 2
where ε and ε0 refer to dielectric permittivity at the highest and lowest frequencies, respectively, ω is the angular frequency of the field and τ is the Debye average relaxation time.
Based on the experimentally obtained dielectric permittivity values, the analysis is conducted over a frequency domain from 0.1 kHz to 1 MHz at selected temperatures in the range from 200 to 25 °C. The obtained results are analyzed considering the Maxwell–Wagner model according to which the polycrystalline sintered ferrites act as two-layer capacitors, consisting of large well-conducting grains separated by thin layers of resistive grain boundaries [27,28].
The dielectric behavior is also discussed by employing the modified Debye’s relaxation equation to confirm the potential role of more than one ion contribution to the overall relaxation process in investigated compounds. The used relation [29] can be expressed as:
ε = ε + ε 0 ε 1 + ( ω τ ) 2 ( 1 α )  
where α is the spreading factor of the actual relaxation times about the mean value.
In summary, the combined impedance and dielectric spectroscopy analysis should provide the deconvolution and characterization of different contributions in the impedance and dielectric response of investigated samples and therefore provide a better insight in the structure of the materials.

3. Results and Discussion

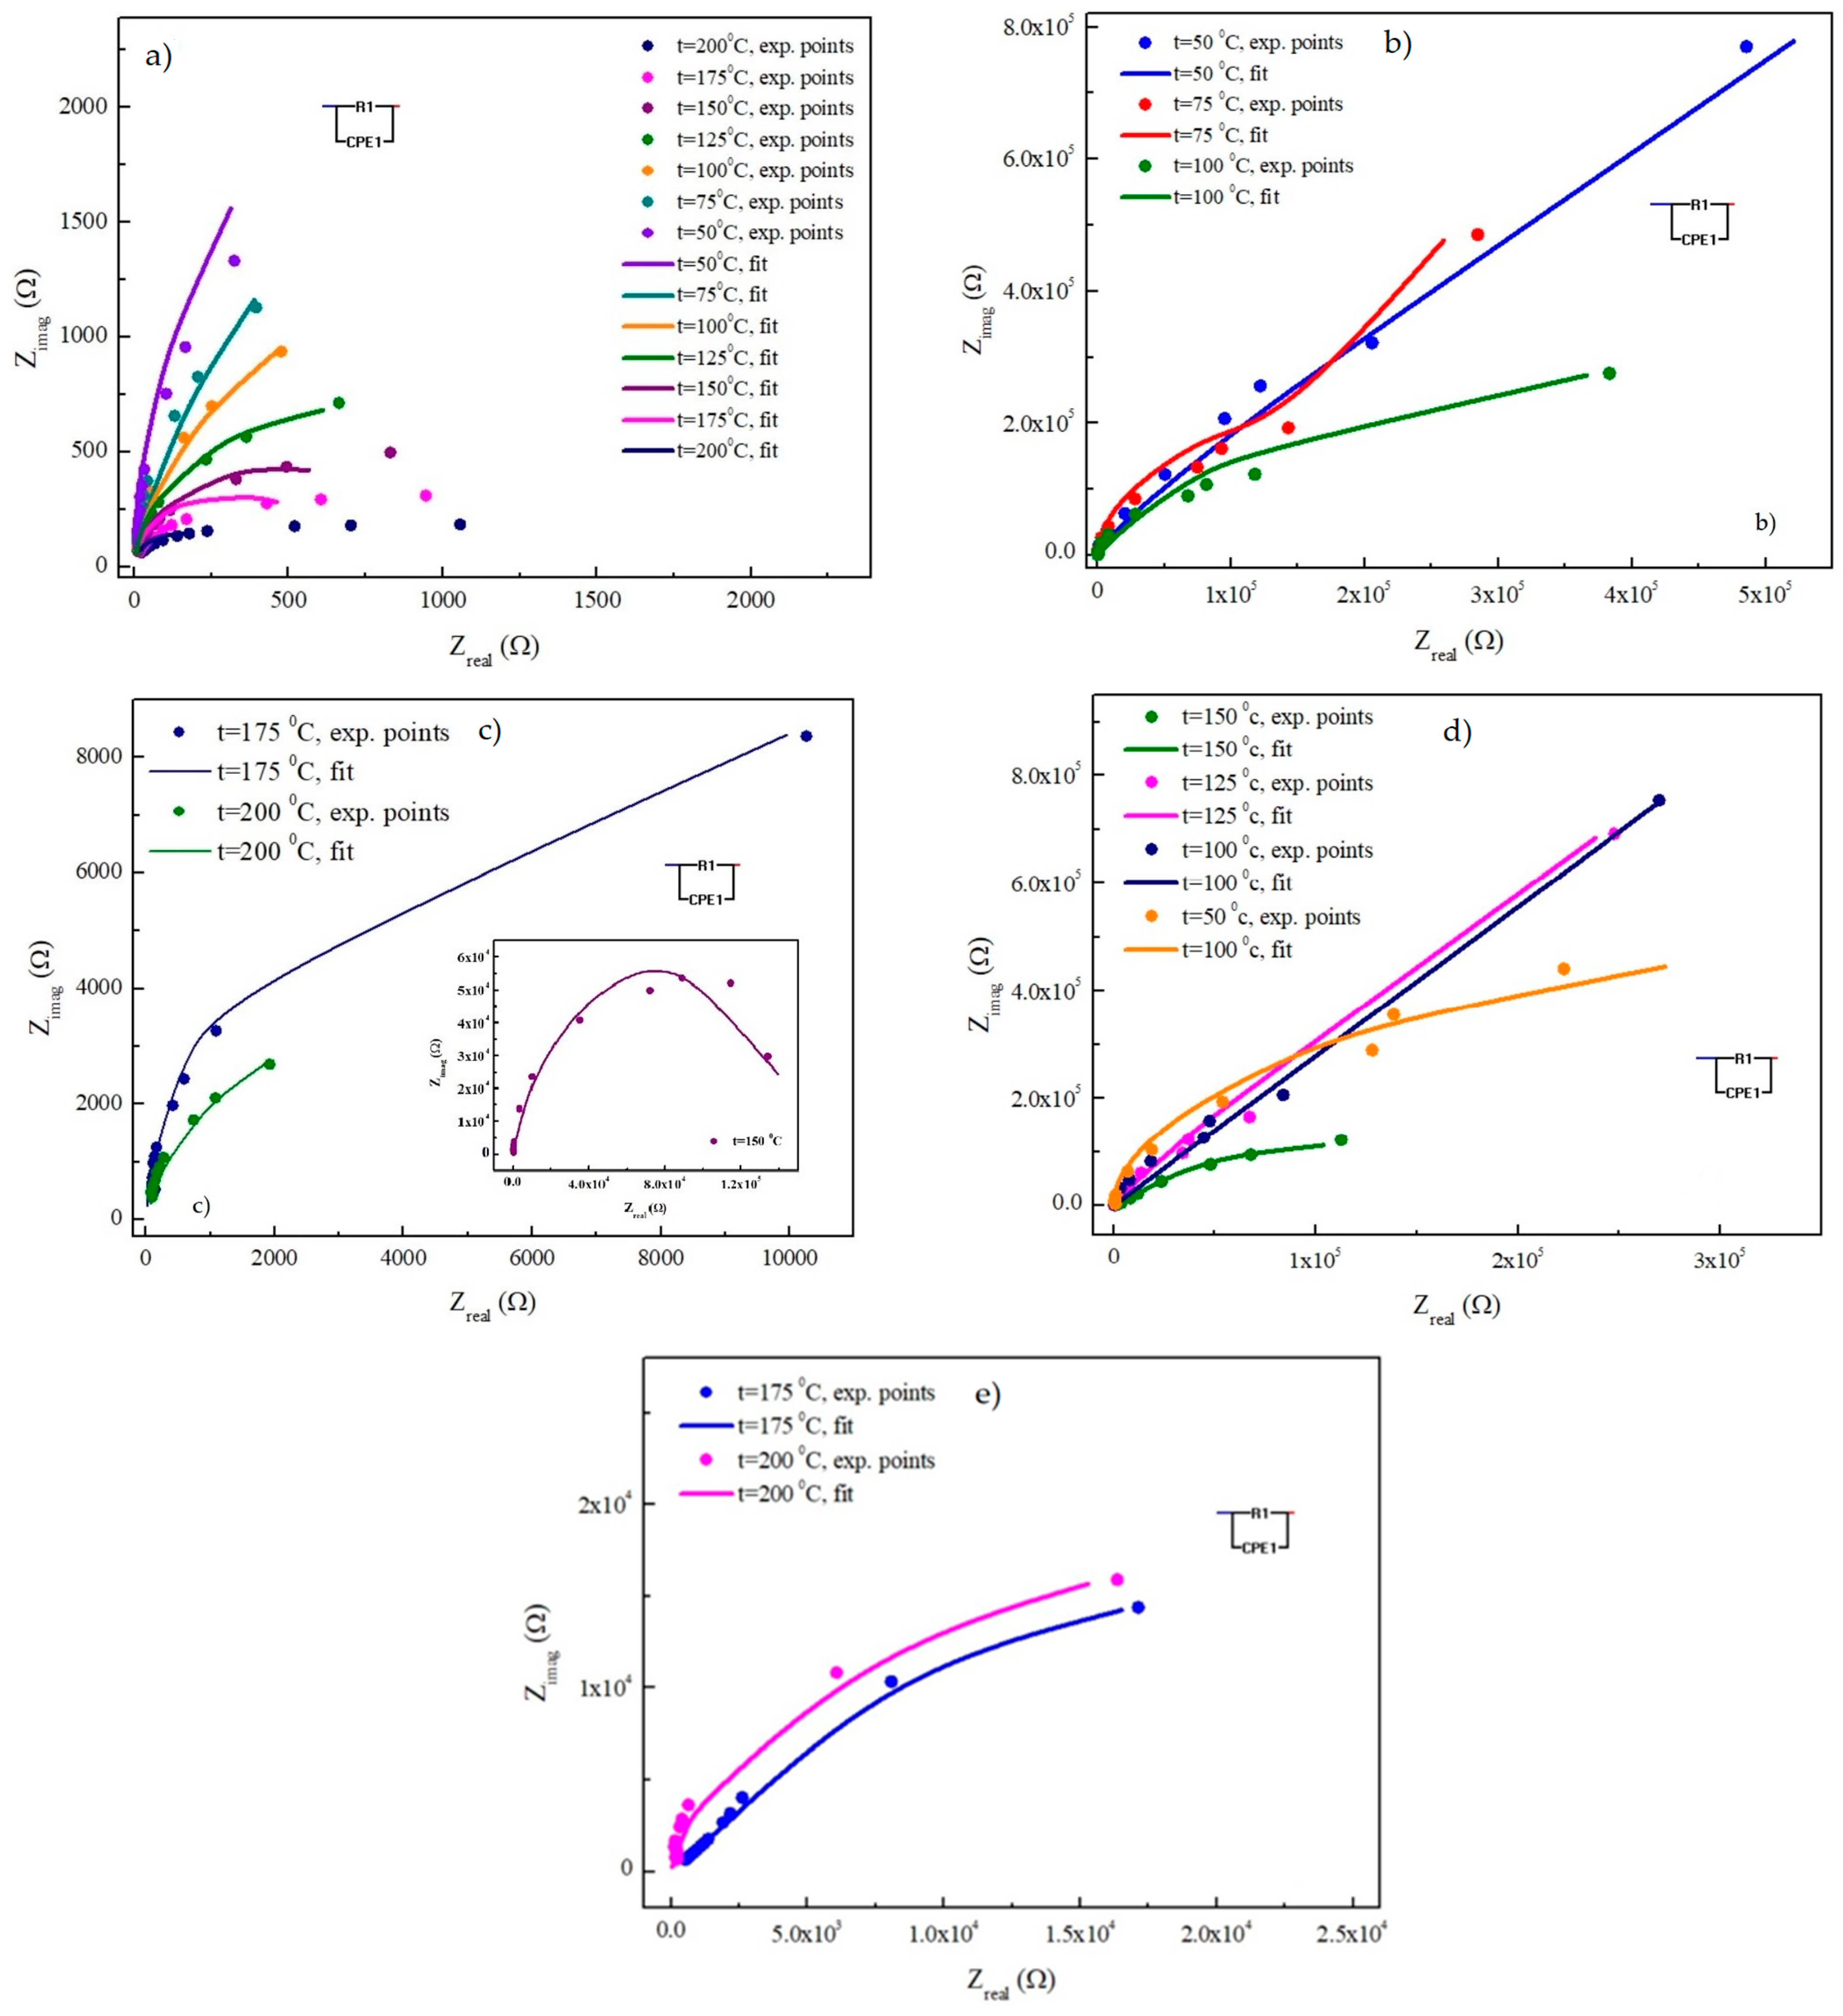
3.1. Impedances Analysis

The frequency dependence of the real part of the impedance in the temperature range from 50 to 200 °C for the N i F e 2 x Y x O 4   samples where x = 0.05, 0.15 and 0.3 is given in Figure 1a–d. All the plots display a monotonous decrease in the Zreal values with the increase in frequency and temperature which can be interpreted with the domination of electronic polarization in studied samples. Such dependence is in accordance with the previously established increase in alternate current (AC) conductivity and can be assigned to a negative temperature coefficient of the resistance [30]. Further, the impedance curves that merge at high frequencies show the independence of the measured parameter on temperature in this region, illuminating the conduction mechanism due to the short-range movement of charge carriers [31]. It is known that grain boundaries are active interfaces for the creation of such region [32]. Therefore, the observed temperature plot can be attributed to the accumulation of charge carriers at the grain boundaries and the reduction in the barrier resulting in the release of space charge. However, the change in the temperature behavior of Zreal values for the samples with x = 0.15 and 0.3 suggest a different contribution share in the conductivity mechanism at different temperature intervals.
In order to support this discussion and to assist in the interpretation of impedance spectra under limitations (failing to cover the entire set of relaxation frequencies of different microstructural contributions), as well as to possibly provide useful information such as the relaxation time, the dispersion curves of the imaginary part of impedance at given temperatures for the analyzed samples are shown in Figure 2a–d. The continuous decrease in Zimag values with the rise in frequency in the whole temperature range is noticed for the N i F e 0.85 Y 0.15 O 4 and N i F e 0.7 Y 0.3 O 4 samples. The graph of the N i F e 0.95 Y 0.05 O 4 sample indicates a dispersion behavior shift to higher frequencies with a rise in temperature that can be related to the relaxation effect being much more pronounced with temperature evaluation than in the other two samples [33,34].
In order to provide more details about the conduction mechanism in the studied samples and highlight the role of yttrium doping in different concentrations, experimental data are presented in the form of a Nyquist plot and are shown in Figure 3a–e.
In the case of the N i F e 0.95 Y 0.05 O 4 sample (Figure 3a), the impedance response for all the selected temperatures can be analyzed only in the high frequency domain, since the DC component of the conductivity is still dominant at lower frequencies and disables the detection of a low-frequency contribution in the overall conductivity. The appearance of a single semicircular arc at all temperatures means that the procedure follows a single relaxation appliance in the high frequency range. The arcs exhibit a change with temperature through decreasing the diameter which indicates the presence of a thermally activated conduction mechanism and the semiconducting character of the N i F e 0.95 Y 0.05 O 4   sample. The semicircles are also found to be depressed with their centers below the Zreal axis. Such characteristics indicate the existence of a non-ideal Debay behavior which can be attributed to several factors: interior grain, distribution of the grain size, grain boundaries, distribution of atomic defects, effect of stress–strain, etc. [35].
According to the Maxwell–Wagner model [27], the impedance spectra of polycrystalline ferrites, in general, can contain three overlapping semicircles [36]. The first one appearing at high frequencies corresponds to the resistance of grain only, while the semicircle in the intermediate frequency range refers the contribution of both grain and grain boundaries. The third semicircle at frequencies below 100 Hz is assigned to the electrode’s effect [37].
Considering the frequency area and the appearance of the graphs themselves, the impedance response of the sample with a minimum content of yttrium can be attributed to the considerable contribution of grains in the high frequency domain. To highlight the correlation of the electrical properties to the microstructure, the experimental data are fitted with an equivalent electrical circuit formed via a grain resistance (Rg) in parallel with the constant phase element (CPE). The CPE is used to accommodate the previously mentioned non-ideal behavior of the capacitance.
The analysis and simulation of impedance spectra were performed using the EIS Spectrum Analyzer software (Available online: www.abc.chemistry.bsu.by, accessed on 22 December 2023) [24]. Fitting errors were less than 10%. Based on the determined values for R and C, the relaxation time τ was also calculated. The obtained values of the parameters are given in Table 1. The low values of quantities Rg and τ confirm the correctness of the assumption about the grain dominance in the electric response of this sample in the high frequency domain.
Although the introduction of yttrium ions into the NiFe2O4 structure formally reduces the number of pairs of iron ions of different charge (participating in the hopping mechanism), the distances between them decrease, which can explain the improvement of the hopping mechanism and the increase in conductivity for the sample with x = 0.05 at. % of Y [38].
The Nyquist plots of the N i F e 0.85 Y 0.15 O 4 and N i F e 0.7 Y 0.3 O 4   samples at given temperatures (Figure 3b–e) clearly indicate the change in impedance response with the rise in temperature. In the impedance spectra at temperatures of 50 °C and 75 °C of the N i F e 0.85 Y 0.15 O 4 sample and 100 and 125 °C of the N i F e 0.7 Y 0.3 O 4   sample (Figure 3b,d) the curves tend to be linearly lined up towards the Zimag in the whole frequency range which refers to the high insulating nature of these compounds and the significant contribution of grain boundaries in the conduction process. The observed decrease in the conductivity can also be attributed to a decrease in oxygen vacancies [39], as already discussed in Section 2. Namely, in the case of a further increase in the amount of yttrium in the NiFe2O4 structure, the decrease in the distance between pairs of iron ions with different charges cannot compensate for the additional decrease in the number of pairs of mentioned iron ions, which negatively affects the jump mechanism and leads to a decrease in conductivity [40]. The semicircular pattern again appears at higher temperatures (Figure 3c,e) and points out the semiconducting behavior in this range due to a more pronounced contribution of grain interiors. These results confirm the previously derived assumptions about the change in the conductivity mechanism.
Therefore, it can be supposed that the impedance plots of both these samples consist of depressed semicircles assigned to the grain boundaries and grain interiors contribution in their electric response. This is supported by fitting the experimental data with an electrical equivalent circuit made of elements R and CPE in parallel. The obtained parameters, including the relaxation time values, are given in Table 1. The comparable values of resistivity and relaxation time indicate a significant similarity in the electric behavior of the samples with a greater amount of yttrium.
Also, the decrease in the R and τ parameters with the rise in temperature is obvious for all the samples. It is known that a disordered arrangement of atoms near the grain boundary region can caus1 the localization of electrons and enhance its scattering during the conduction process [41]. Therefore, at lower temperatures, the electric response of the studied samples is governed by highly resistive grain boundaries that disable electrons to jump and influence the charge mobility. Doping with yttrium, due to larger ionic radius of Y3+, increases the distance between a potential Fe2+–Fe3+ pair, making hopping between them less likely. With the rise in the temperature grain boundary, scattering decreases; therefore, the thermally activated localized charge carriers are encouraged to drift more freely and the trapped charge carriers are released. Similar behavior regarding the drop in conductivity was also noticed in [42].
It should be emphasized that the magnetic relaxations in nickel ferrites considered as soft magnetic materials might occur way beyond 1 MHz, which is the upper frequency where the measurements were performed in this research.
The activation energy related to grains and the grain boundary was determined by applying the Arrhenius law [26]. The obtained curves are illustrated in Figure 4. The activation energy value for grains is 0.3 eV. The grain boundary activation energy is found to be 0.43 eV for the N i F e 0.85 Y 0.15 O 4 sample. Similar results are also observed in the literature [38], such as in the previous research [30] where the activation energy of the hopping mechanism for investigated samples was experimentally and theoretically determined. However, a much lower value of 0.13 eV is obtained for the sample with the maximum yttrium content. This can be related to the percolation of larger grains and preferred orientation, facilitating the charge carriers motion along the conduction plane. The obtained value suggests the tunneling of the charge carriers as a dominant mechanism.

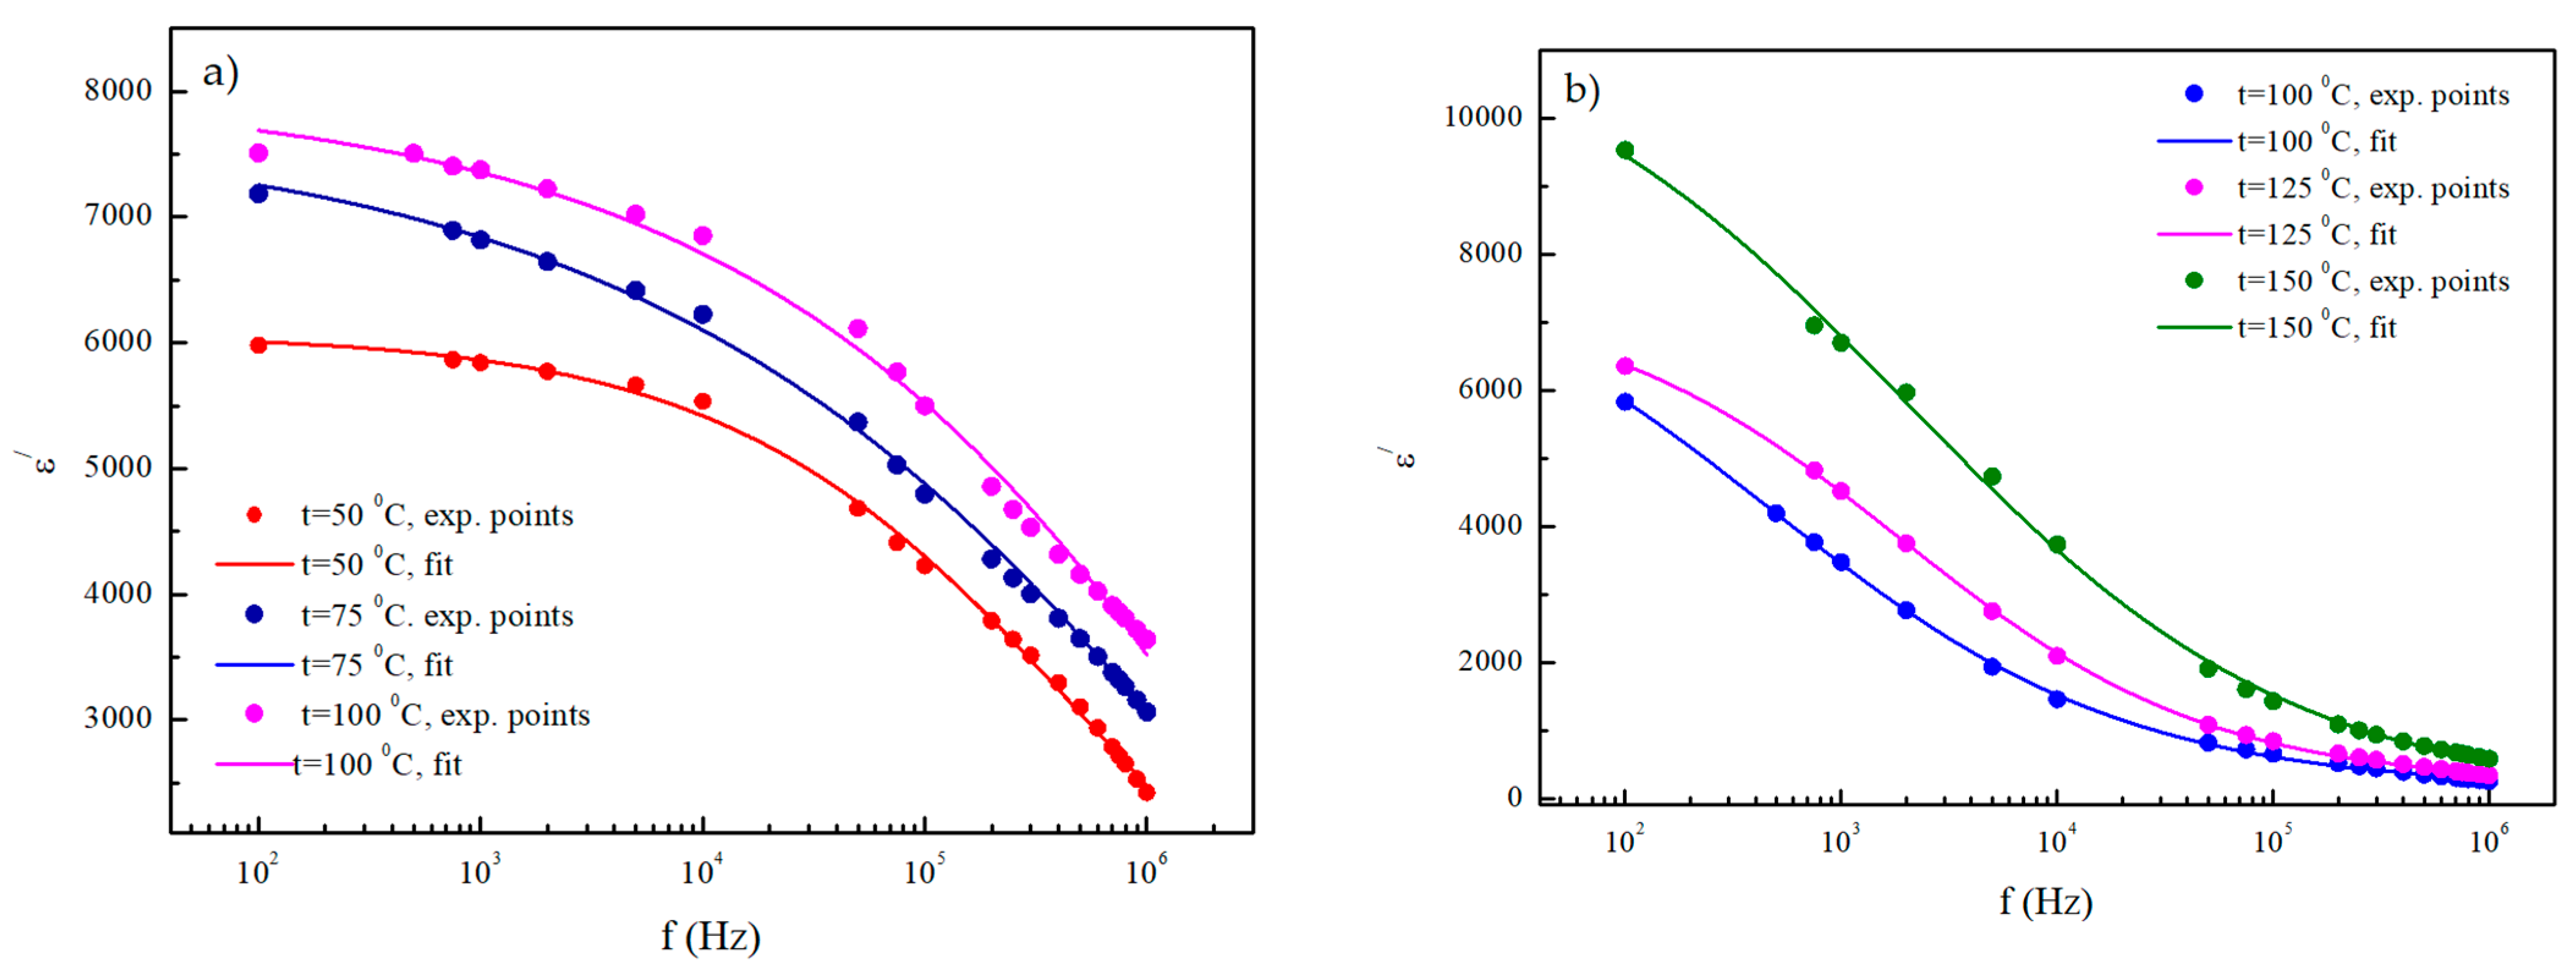
3.2. Dielectric Analysis

The variation in the real part of the dielectric permittivity ε′ with the frequency at selected temperatures for the studied samples is shown in Figure 5a–d. From the illustrated dispersion curves it appears that all the previously mentioned mechanisms can be attributed to the dielectric response of the investigated compounds. Furthermore, the IS study revealed a semi-conducting grain and insulating grain boundary resulting in the formation of surface and internal barrier layer capacitors which leads to the high value of the dielectric permittivity. Namely, in the external electric field, the flow of electrons between Fe2+ and Fe3+ ions at the same crystallographic position and the hopping of holes between Ni3+ and Ni2+ ions in the grains takes place in the direction of the field. When the charge carriers reach the insulating grain boundaries, they accumulate and induce the large number of space charge polarizations at these places which manifests in high values of this dielectric parameter in a low frequency interval [43,44]. This is especially pronounced in the dielectric response of the N i F e 0.95 Y 0.05 O 4   sample which is completely governed by the large capacitance of grain boundaries in almost the whole frequency range, while the grain contribution starts to appear above 10 kHz (see Figure 5b as an illustration, for randomly chosen temperatures). Further, in the middle frequency range at all the temperatures, the real part of the permittivity hardly depends on frequency, which is known as the static permittivity. Therefore, there are two stages of permittivity reduction for this sample. The low-frequency stage becomes more prominent as the temperature increases. The high-frequency stage changes much more slowly, which means that they differ not only in the values of the relaxation times, but also in the influence of the temperature values on them [45,46].
The sample with x = 0.15 shows the maximum value of the real part of dielectric permittivity as a consequence of Fe ions redistribution due to yttrium incorporation, which causes the enhancement of Fe3+ ions in the grains and assembles them in the grain boundaries. Further inclusion of yttrium in the system makes the hopping of electrons from Fe2+ to Fe3+ ions more difficult, since the interionic distance increases as a consequence of the incorporation of the larger Y3+ ions.
With the rise in the field frequency, the hopping of electric charge carrier’s increases due to more active grains, which reflects significantly lower values of ε′ in all three samples.
In order to reveal the potential role of more than one ion contribution to the overall relaxation process in investigated compounds, the modified Debye’s equation is employed [29]. For the sample with a minimum yttrium content, the analysis could be applied at temperatures of 50, 75 and 100 °C. The experimental data for the compound with x = 0.15 did not show an agreement with the proposed fit at any temperature. For the sample with x = 0.3, the results are obtained at temperatures of 100, 125 and 150 °C (Figure 6b).
The calculated values of the relaxation time τ and spreading factor α for these two samples are given in Table 2. For the sample with the maximum yttrium content, the values of the mean relaxation time are significantly higher than that of the N i F e 0.95 Y 0.05 O 4 sample, which is in line with the previous IS results. Namely, according to the Maxwell–Wagner model of the homogeneous double structure, the first layer is of fairly well conducting materials, which is separated by the second thin layers (grain boundaries) of the relatively poor conducting substance [19]. Between the grain boundaries, conductivity difference and high resistances increase the dielectric constant which is proportional to the polarization and accumulation of charge carriers in the separated boundaries. When the external alternating electric field of frequency increases, the polarization decreases and reaches a constant value since the electron exchange cannot follow the frequency. Thus, the grain boundaries relaxation time will be higher than that of the conducting grains. As already mentioned, another important factor that affects the electrical and dielectric property of investigated ferrites is the distribution of the Fe ions. The greater values of the relaxation time parameter of the grain boundaries can be explained by the greater length of hopping between the cation within the octahedral site, due to a greater interionic distance [47].

4. Conclusions

This paper presents an analysis of the electrical and dielectric parameters of nickel ferrite nano-powders doped with yttrium in a wide range of frequencies and temperatures. The impedance study revealed the presence of the distribution of relaxation time which is accommodated with the use of a CPE element, in fitting with the equivalent electrical circuit for all the samples. The Nyquist plots also confirmed the semiconducting behavior. The significant contribution of both grains and grain boundaries in the conduction process of the samples with x = 0.15 and 0.3 at. % of Y is established. The impedance response of the sample with the minimum content of yttrium is attributed to the considerable contribution of grains in the high frequency range. The low-frequency domain remained uncharacterized due to the domination of the DC conductivity component. The dispersion curves of the dielectric permittivity of all the investigated compounds exhibit consistency with the Maxwell–Wagner type interfacial polarization. However, the dielectric response of the N i F e 0.95 Y 0.05 O 4   sample was found to be completely governed by the large capacitance of grain boundaries in almost the whole frequency range, while the grain contribution starts to appear above 10 kHz, as also confirmed via the Nyquist plot. The high values of the dielectric parameter are explained with cation distribution that causes the enhancement of Fe3+ ions in the grains and assembles them in the grain boundaries. The obtained results imply the potential practical application of the investigated compounds as favorable materials for capacitors, energy storage and power applications.

5. Future Work

Future work will be focused on further investigations of electric properties in a low frequency range and will support the results with modulus spectroscopy measurements.

Author Contributions

Conceptualization, M.Š.; methodology, Ž.C. and M.Š., validation Ž.C. and D.H.; formal analysis, M.Š. and S.J.; investigation, M.Š., S.J. and E.T., resources, M.Š.; data curation, S.J. and E.T.; writing—original draft preparation, M.Š. and S.J.; writing—review and editing, M.Š. and Ž.C.; supervision, M.Š., S.J., Ž.C., S.J. and E.T.; review and editing, V.T. and D.H.; supervision, V.T. and P.O.; project administration M.Š. and Ž.C. All authors have read and agreed to the published version of the manuscript.

Funding

The authors gratefully acknowledge the financial support of the Ministry of Science, Technological Development and Innovation of the Republic of Serbia (Grants No. 451-03-66/2024-03/200125 & 451-03-65/2024-03/200125) and the Science Fund of the Republic of Serbia, 7383, in the frame of the project Processing of manganite thin film heterostructures and control of their physical properties by light stimuli—PROMTEH. This research was also funded by project 2020-1.1.2-PIACI-KFI-2020-00173 of the University of Dunaujvaros and by project GINOP_PLUSZ-2.1.1-21-2022-00249 of the Óbuda University, co-financed by the Hungarian State.

Data Availability Statement

Data are contained within the article.

Acknowledgments

The author would like to thank the editors and the anonymous reviewers for their valuable comments that significantly improved the quality of this paper.

Conflicts of Interest

The authors declare no conflicts of interest.

References

  1. Waris, A.; Din, M.; Ali, A.; Afridi, S.; Baset, A.; Khan, A.U.; Ali, M. Green fabrication of Co and Co3O4 nanoparticles and their biomedical applications: A review. Open Life Sci. 2021, 16, 14–30. [Google Scholar] [CrossRef] [PubMed]
  2. Zhao, S.; Yu, X.; Qian, Y.; Chen, W.; Shen, J. Multifunctional Magnetic Iron Oxide Nanoparticles: An Advanced Platform for Cancer Theranostics. Theranostics 2020, 10, 6278–6309. [Google Scholar] [CrossRef] [PubMed]
  3. Selim, M.M.; El-Safty, S.; Tounsi, A.; Shenashen, M. A review of magnetic nanoparticles used in nanomedicine. APL Mater. 2024, 12, 010601. [Google Scholar] [CrossRef]
  4. Kudr, J.; Haddad, Y.; Richtera, L.; Heger, Z.; Cernak, M.; Adam, V.; Zitka, O. Magnetic Nanoparticles: From Design and Synthesis to Real World Applications. Nanomaterials 2017, 7, 243. [Google Scholar] [CrossRef]
  5. Asghar, K.; Qasim, M.; Das, D. Preparation and characterization of mesoporous magnetic MnFe2O4@mSiO2 nanocomposite for drug delivery application. Mater. Today Proc. 2020, 26, 87–93. [Google Scholar] [CrossRef]
  6. Kaur, H.; Singh, A.; Kumar, V.; Ahlawat, D.S. Structural, thermal and magnetic investigations of cobalt ferrite doped with Zn2+ and Cd2+ synthesized by auto combustion method. J. Magn. Magn. Mater. 2019, 474, 505–511. [Google Scholar] [CrossRef]
  7. Özçelik, B.; Özçelik, S.; Amaveda, H.; Santos, H.; Borrell, C.; Sáez-Puche, R.; de la Fuente, G.; Angurel, L. High speed processing of NiFe2O4 spinel using a laser furnace. J. Materiomics 2020, 6, 661–670. [Google Scholar] [CrossRef]
  8. Naik, A.B.; Naik, P.P.; Hasolkar, S.S.; Naik, D. Structural, magnetic and electrical properties along with antifungal activity & adsorption ability of cobalt doped manganese ferrite nanoparticles synthesized using combustion route. Ceram. Int. 2020, 46, 21046–21055. [Google Scholar] [CrossRef]
  9. Abushad, M.; Arshad, M.; Naseem, S.; Ahmed, H.; Ansari, A.; Chakradhary, V.K.; Husain, S.; Khan, W. Synthesis and role of structural disorder on the optical, magnetic and dielectric properties of Zn doped NiFe2O4 nanoferrites. J. Mol. Struct. 2022, 1253, 132205. [Google Scholar] [CrossRef]
  10. Suresh, J.; Trinadh, B.; Babu, B.V.; Reddy, P.; Mohan, B.S.; Krishna, A.R.; Samatha, K. Evaluation of micro-structural and magnetic properties of nickel nano-ferrite and Mn2+ substituted nickel nano-ferrite. Phys. B Condens. Matter 2021, 620, 413264. [Google Scholar] [CrossRef]
  11. Dippong, T.; Levei, E.A.; Cadar, O.; Deac, I.G.; Lazar, M.; Borodi, G.; Petean, I. Effect of amorphous SiO2 matrix on structural and magnetic properties of Cu0.6Co0.4Fe2O4/SiO2 nanocomposites. J. Alloys Compd. 2020, 849, 156695. [Google Scholar] [CrossRef]
  12. Choudary, G.S.V.R.K.; Prameela, P.; Varma, M.C.; Kumar, A.M.; Rao, K.H. Contribution to Analysis of Co/Cu Substituted Ni-Zn Ferrites. Indian J. Mater. Sci. 2013, 2013, 350707. [Google Scholar] [CrossRef]
  13. Varma, M.C.; Bharadwaj, S.; Choudary, G.S.V.R.K.; Murthy, K.S.R.; Rao, K.H. Influence of magnesium-substituted Ni–Zn ferrites on magnetic and electric losses at lower frequency. Int. J. Mod. Phys. B 2017, 31, 1750063. [Google Scholar] [CrossRef]
  14. Chintala, J.N.P.K.; Varma, M.C.; Choudary, G.S.V.R.K.; Rao, K.H. Control of coercivity and magnetic anisotropy through cobalt substitution in Ni-Zn ferrite. J. Supercond. Nov. Magn. 2021, 34, 2357–2370. [Google Scholar] [CrossRef]
  15. Gangaswamy, D.R.S.; Choudary, G.S.V.R.K.; Varma, M.C.; Bharadwaj, S.; Rao, K.H. Enhanced Magnetic Permeability in Ni0.55−yCoyZn0.35Mg0.10Fe2O4 Synthesized by Sol-Gel Method. J. Supercond. Nov. Magn. 2018, 31, 3753–3760. [Google Scholar] [CrossRef]
  16. Jacobo, S.; Duhalde, S.; Bertorello, H. Rare Earth Influence on the Structural and Magnetic Properties of NiZn Ferrites. J. Magn. Magn. Mater. 2004, 272–276, 2253–2254. [Google Scholar] [CrossRef]
  17. Lvovich, V.F. Impedance Spectroscopy: Applications to Electrochemical and Dielectric Phenomena; John Wiley & Sons: Hoboken, NJ, USA, 2012. [Google Scholar]
  18. Kremer, F.; Schohals, A. Broadband Dielectric Spectroscopy; Springer: Berlin/Heidelberg, Germany, 2002. [Google Scholar]
  19. Varalaxmi, N. Impedance Spectroscopic Studies of NiMgCuZn Ferrites. J. Mater. Sci. Eng. 2019, 8, 1052. [Google Scholar]
  20. Henaish, A.M.A.; Zakaly, H.M.H.; Hemeda, O.M.; Weinstein, I.A.; El-Shahawy, M.M.; Darwish, K.A. Enhancing of Electrical and Dielectric Properties of Barium Zirconate Titanate/Poly (Vinylidene Fluoride) Nano-Composites. Electronics 2022, 11, 3855. [Google Scholar] [CrossRef]
  21. Ognjanovic, S.M.; Tokic, I.; Cvejic, Z.; Rakic, S.; Srdic, V.V. Structural and dielectric properties of yttrium substituted nickel ferrites. Mater. Res. Bull. 2014, 49, 259–264. [Google Scholar] [CrossRef]
  22. Mathe, V.; Kamble, R. Anomalies in Electrical and Dielectric Properties of Nanocrystalline Ni-Co Spinel Ferrite. Mater. Res. Bull. 2008, 43, 2160–2165. [Google Scholar] [CrossRef]
  23. GW Instek LCR-8105G 20 Hz to 5 MHz Precision LCR Meter. Available online: https://www.coleparmer.com/i/gw-instek-lcr-8105g-20-hz-to-5-mhz-precision-lcr-meter/2003658 (accessed on 4 March 2024).
  24. Bondarenko, A.S.; Ragoisha, G. EIS Spectrum Analyser. Available online: www.abc.chemistry.bsu.by (accessed on 22 December 2023).
  25. Martínez, R.; Kumar, A.; Palai, R.; Scott, J.F.; Katiyar, R.S. Impedance spectroscopy analysis of Ba0.7Sr03TiO3/La0.7Sr0.3MnO3 heterostructure. J. Phys. D Appl. Phys. 2011, 44, 105302. [Google Scholar] [CrossRef]
  26. Arrhenius, S. Über die Reaktionsgeschwindigkeit bei der Inversion von Rohrzucker durch Säuren. Z. Physik. Chem. 1889, 4, 226–248. [Google Scholar] [CrossRef]
  27. Maxwell, J. A Treatise on Electricity and Magnetism; Clarendon Press: Oxford, UK; London, UK, 1982. [Google Scholar]
  28. Koops, C.G. On the dispersion of resistivity and dielectric constant of some semiconductors at audio frequencies. Phys. Rev. B 1951, 83, 121–124. [Google Scholar] [CrossRef]
  29. Datt, G.; Abhyankar, A.C. Dopant driven tunability of dielectric relaxation in MxCo(1−x)Fe2O4 (M: Zn2+, Mn2+, Ni2+) nano-ferrites. J. Appl. Phys. 2017, 122, 0341. [Google Scholar] [CrossRef]
  30. Jankov, S.; Armaković, S.; Tóth, E.; Skuban, S.; Srdic, V.; Cvejic, Z. Understanding how yttrium doping influences the properties of nickel ferrite—Combined experimental and computational study. Ceram. Int. 2019, 45, 20290–20296. [Google Scholar] [CrossRef]
  31. Rajulu, K.C.V.; Tilak, B.; Rao, K.S. Impedance spectroscopy study of BNKLT polycrystalline ceramic. Appl. Phys. A 2012, 106, 533–543. [Google Scholar] [CrossRef]
  32. Rayssi, C.; ElKossi, S.; Dhahri, J.; Khirouni, K. Frequency and temperature-dependence of dielectric permittivity and electric modulus studies of the solid solution Ca0.85Er0.1Ti1−xCo4x/3O3 (0 ≤ x ≤ 0.1). R. Soc. Chem. 2018, 8, 17139–17150. [Google Scholar] [CrossRef] [PubMed]
  33. Lahouli, R.; Massoudi, J.; Smari, M.; Rahmouni, H.; Khirouni, K.; Dhahri, E.; Bessais, L. Investigation of annealing effects on the physical properties of Ni0.6Zn0.4Fe1.5Al0.5O4 ferrite. R. Soc. Chem. 2019, 9, 19949–19964. [Google Scholar] [CrossRef]
  34. Chen, W.; Zhu, W.; Tan, O.K.; Chen, X.F. Frequency and temperature dependent impedance spectroscopy of cobalt ferrite composite thick films. J. Appl. Phys. 2010, 108, 034101. [Google Scholar] [CrossRef]
  35. Arora, M.; Arora, V.; Kaur, S.; Kaur, J.; Kumar, S.; Singh, A. Evidence of non-debye behavior of Pb0.76Sm0.24Ti0.76Fe0.24O3 ceramics by complex impedance spectroscopy. Mater. Today Proc. 2023, 80, 1079–1085. [Google Scholar] [CrossRef]
  36. Rahman, T.; Ramana, C.V. Impedance spectroscopic characterization of gadolinium substituted cobalt ferrite ceramics. J. Appl. Phys. 2014, 116, 164108. [Google Scholar] [CrossRef]
  37. Karmakar, S.; Varma, S.; Behera, D. Investigation of structural and electrical transport properties of nano-flower shaped NiCo2O4 supercapacitor electrode materials. J. Alloys Compd. 2018, 757, 49–59. [Google Scholar] [CrossRef]
  38. Paswan, S.K.; Pradhan, L.K.; Kumar, P.; Kumari, S.; Kar, M.; Kumar, L. Electrical transport properties of nanocrystalline and bulk nickel ferrite using complex impedance spectroscopy: A comparative study. Phys. Scr. 2022, 97, 095812. [Google Scholar] [CrossRef]
  39. Behera, C.; Das, P.R.; Choudhary, R.N.P. Structural and electrical properties of mechanothermally synthesized NiFe2O4 nanoceramics. J. Electron. Mater. 2014, 43, 3539–3549. [Google Scholar] [CrossRef]
  40. Pradhan, D.K.; Misra, P.; Puli, V.S.; Sahoo, S.; Pradhan, D.K.; Katiyar, R.S. Studies on structural, dielectric, and transport properties of Ni0.65Zn0.35Fe2O4. J. Appl. Phys. 2014, 115, 243904. [Google Scholar] [CrossRef]
  41. Arenas, C.; Henriquez, R.; Moraga, L.; Muñoz, E.; Munoz, R.C. The effect of electron scattering from disordered grain boundaries on the resistivity of metallic nanostructures. Appl. Surf. Sci. 2015, 329, 184–196. [Google Scholar] [CrossRef]
  42. Nandihalli, N.; Pai, Y.-H.; Liu, C.-J. Fabrication and thermoelectric properties of Pb (Zn0.85Al0.15) Te-Te (y = 0, 0.04, 0.06, 0.08, and 0.11) nanocomposites. Ceram. Int. 2020, 46, 6443–6453. [Google Scholar] [CrossRef]
  43. Dar, M.A.; Majid, K.; Batoo, K.M.; Kotnala, R. Dielectric and impedance study of polycrystalline Li0.35−0.5Cd0.3Ni Fe2.350.5O4 ferrites synthesized via a citrate-gel auto combustion method. J. Alloy. Compd. 2015, 632, 307–320. [Google Scholar] [CrossRef]
  44. Zubkov, S.V.; Parinov, I.A.; Kuprina, Y.A. The Structural and Dielectric Properties of Bi3−xNdxTi1.5W0.5O9 (x = 0.25, 0.5, 0.75, 1.0). Electronics 2022, 11, 277. [Google Scholar] [CrossRef]
  45. Żukowski, P.; Gałaszkiewicz, P.; Bondariev, V.; Okal, P.; Pogrebnjak, A.; Kupchishin, A.; Ruban, A.; Pogorielov, M.; Kołtunowicz, T.N. Comparative Measurements and Analysis of the Electrical Properties of Nanocomposites TixZr1−xC+α-Cy (0.0 ≤ x ≤ 1.0). Materials 2022, 15, 7908. [Google Scholar] [CrossRef]
  46. Zukowski, P.; Koltunowicz, T.; Boiko, O.; Bondariev, V.; Czarnacka, K.; Fedotova, J.; Fedotov, A.; Svito, I. Impedance model of metal-dielectric nanocomposites produced by ion-beam sputtering in vacuum conditions and its experimental verification for thin films of (FeCoZr)x(PZT)(100−x). Vacuum 2015, 120, 37–43. [Google Scholar] [CrossRef]
  47. Bharathi, K.K.; Markandeyulu, G.; Ramana, C.V. Structural, magnetic, electrical, and magnetoelectric properties of Sm- and Ho-substituted nickel ferrites. J. Phys. Chem. C 2011, 115, 554–560. [Google Scholar] [CrossRef]
Figure 1. Frequency dependence of Zreal parameter for: (a) N i F e 0.95 Y 0.05 O 4 , (b) N i F e 0.85 Y 0.15 O 4 , (c) N i F e 0.85 Y 0.15 O 4 (high temperatures) and (d) N i F e 0.7 Y 0.3 O 4   samples. (Sign x on Zreal axis refers to multiplication).
Electronics 13 01496 g001
Figure 2. Frequency dependence of Zimag parameter for: (a) N i F e 0.95 Y 0.05 O 4 , (b) N i F e 0.85 Y 0.15 O 4 , (c) N i F e 0.85 Y 0.15 O 4 (high temperatures) and (d) N i F e 0.7 Y 0.3 O 4   samples. (Sign x on Zimag axis refers to multiplication).
Electronics 13 01496 g002
Figure 3. Nyquist plot for: (a) N i F e 0.95 Y 0.05 O 4 , (b) N i F e 0.85 Y 0.15 O 4 (low temperatures), (c) N i F e 0.85 Y 0.15 O 4 (high temperatures), (d) N i F e 0.7 Y 0.3 O 4 , (e) N i F e 0.7 Y 0.3 O 4 (high temperatures) samples. (Sign x on both axis refers to multiplication).
Electronics 13 01496 g003
Figure 4. Temperature dependence of lnR for: (a) N i F e 0.95 Y 0.05 O 4 (b), N i F e 0.85 Y 0.15 O 4 and N i F e 0.7 Y 0.3 O 4 samples.
Electronics 13 01496 g004
Figure 5. Frequency dependence of ε′ for: (a) N i F e 0.95 Y 0.05 O 4 ; (b) N i F e 0.95 Y 0.05 O 4 (selected temperatures); (c) N i F e 0.85 Y 0.15 O 4 ; (d) N i F e 0.7 Y 0.3 O 4 samples. (Sign x on ε/ axis refers to multiplication).
Electronics 13 01496 g005
Figure 6. Frequency dependence of ε′ for: (a) N i F e 0.95 Y 0.05 O 4 and (b) N i F e 0.7 Y 0.3 O 4 .
Electronics 13 01496 g006
Table 1. Parameters of the equivalent electric circuits.
x = 0.05 x = 0.15 x = 0.3
t (°C)Rg (103 Ω)CPE
(nF)
nτg (10−6 s)Rgb (105 Ω)CPE
(nF)
nτgb (10−5 s)Rgb (105 Ω)CPE
(nF)
nτgb
(10−5 s)
508086.31.96115.85101.930.8670.1100.6440.9959.84
756533.57.480.9118.426.191.80.952.739.942.080.8996.66
1003122.86.950.939.703.095.120.7419.835.611.230.9859.65
1251453.63.910.973.961.441.910.9212.94.481.560.9756.20
150933.585.130.952.590.534.150.855.253.275.720.8456.70
175632.422.0411.290.181.250.961.450.5324.190.77.41
200284.51.9910.570.084.080.870.70.383.30.94.67
Table 2. Parameters of fit using modified Debye’s relaxation equation.
x = 0.05x = 0.3
t (°C)τ (s)αt (°C)τ (s)α
502.6 × 10−71.471003.42 × 10−41.48
750.91 × 10−81.721250.84 × 10−41.39
1000.36 × 10−81.691500.8 × 10−41.51
Disclaimer/Publisher’s Note: The statements, opinions and data contained in all publications are solely those of the individual author(s) and contributor(s) and not of MDPI and/or the editor(s). MDPI and/or the editor(s) disclaim responsibility for any injury to people or property resulting from any ideas, methods, instructions or products referred to in the content.

