Article

Analysis of Pressure Characteristics of Ultra-High Specific Energy Lithium Metal Battery for Flying Electric Vehicles

School of Electrical Engineering, Beijing Jiaotong University, Beijing 100044, China
*
Author to whom correspondence should be addressed.
Electronics 2024, 13(8), 1505; https://doi.org/10.3390/electronics13081505
Submission received: 14 March 2024 / Revised: 8 April 2024 / Accepted: 12 April 2024 / Published: 16 April 2024

Abstract

:
The lithium metal battery is likely to become the main power source for the future development of flying electric vehicles for its ultra-high theoretical specific capacity. In an attempt to study macroscopic battery performance and microscopic lithium deposition under different pressure conditions, we first conduct a pressure cycling test proving that amplifying the initial preload can delay the battery failure stage, and the scanning electron microscope (SEM) shows that the pressure is effective in improving the electrode’s surface structure. Secondly, we analyze how differing pressure conditions affect the topography of lithium deposits by coupling the nonlinear phase-field model with the force model. The results show that the gradual increase in the external pressure is accompanied by a drop in the length of the dendrite and the migration curvature in the diaphragm, and the deposition morphology is gradually geared towards smooth and thick development, which can significantly reduce the specific surface area of lithium dendrite. However, as cyclic charging and discharging continue, the decrease in the electrolyte diffusion coefficient results in higher internal stress inside the battery, and thus the external pressure must be increased so as to achieve marked inhibitory effects on the growth of the lithium dendrite.

1. Introduction

With the acceleration of the global urbanization process, the traditional ground transportation system has become increasingly congested, which not only consumes time and wastes energy but exacerbates environmental pollution as well [1,2]. Electric Vertical Take-off and Landing (eVTOL), commonly known as an electric flying car and an innovative vehicle, is seen as one of the potential solutions to ease urban traffic congestion. At present, lithium-ion batteries used in eVTOL applications are limited by their energy density, which affects the range and load capacity of eVTOL. As shown in Figure 1, the mature aerospace battery is basically about 300 Wh•g−1 [3], and with the rapid development of battery technology, using lithium metal batteries with ultra-high specific energy for future flying electric vehicles has become a research hotspot. However, some key factors such as low safety and the short life of batteries stand in the way of industrial application for lithium metal batteries. When the surface of the electrode exceeds the deposition overpotential of the lithium metal, the solid phase lithium crystal core arises on the corresponding electrode surface of the electrode. The crystal core grows with the charging process and eventually grows into visible dendritic or needle-shaped dendrites [4,5,6,7,8]. Problems like the uncontrollable growth of lithium dendrites and the consumption of an electrolyte by the side reaction of lithium and an electrolyte add to the difficulties in the practical application of lithium metal batteries.
In recent years, advances in characterization techniques and theoretical methods have allowed researchers to make various experimental and theoretical calculations [9,10,11]. There is strong scholarly interest in the stability of the lithium anode and the growth mechanism and morphology of the lithium dendrite, and a method of inhibiting the dendrite is proposed [12,13,14,15]. Monroe et al. [16] conducted a series of pioneering model theoretical studies to discuss the growth and deformation of lithium protrusions, which laid a solid foundation for force–electrochemical studies in polymer systems. Chen et al. [17] proposed a nonlinear phase-field model to simulate the electrodeposition process and to contrast the morphology distribution of lithium dendrites at different voltages. Hong et al. [18] introduced the temperature field into the total free energy function and analyzed the effects of temperature on the lithium deposition process by correlating the diffusion coefficient with the temperature. Zhang et al. [19] conducted a quantitative study on the effects of different initial lithium nucleation spacing on the growth morphology and the surface area of lithium deposition using the phase-field model. Shen et al. [20] quantified the mechanism of the influence of external pressure on growth and presented the phase diagram of the effect of external pressure in various conventional electrolyte environments. The experiment by Zhang et al. [21] showed that applying external pressure can significantly improve the complex interface environment between the electrolyte and the electrode and thus improve batteries’ cycle performance. Yurkiv et al. [22] considered the influence of the solid electrolyte interface on lithium dendrites, and the study showed that reducing the stress field at the root of lithium dendrites could inhibit the growth of lithium dendrites.
Based on the current research on the growth characteristics of lithium dendrites on the anode surface of lithium metal batteries, this paper uses a battery pressure measurement device of a thin-film pressure sensor to track the pressure changes in soft-wrapped lithium metal batteries in real time and explore the influence of different initial pressure forces on batteries’ cycle performance. Then, the regulation mechanism of the external pressure on the morphology of lithium deposition is analyzed through the scanning electron microscopic and nonlinear phase-field model system. The pressure increase improves the cycle life of lithium metal, reduces lithium’s migration curvature in the diaphragm, and avoids direct contact between the positive and anode electrodes that can cause internal short circuit in the battery.

2. Experiments

2.1. Experiment Subjects and Experiment Platforms

The flying electric vehicle combines aviation and electric vehicle technologies and is regarded as an innovative means of transport in the field of future transportation. The flying electric vehicle industry is in a rapid development stage, but the current battery energy density does not meet the demand of long range. Therefore, this paper takes the lithium metal battery as the research object and improves the cycle life of the lithium metal battery by regulating the pressure through fixture, so as to further promote the development of the flying electric vehicle. As shown in Figure 2a, the rechargeable solid-state lithium metal battery is selected for the experiment, which adopts the laminated combination mode, with a positive electrode of nickel–cobalt–manganese ternary material and an anode electrode of lithium metal, and is packaged with aluminum plastic film. Combined with Figure 2b,c, it can be seen that the battery weight is 97.8 g, and the energy density is as high as 449.78 mWh•g−1, which is far greater than the currently used lithium-ion batteries with graphite as the anode electrode.
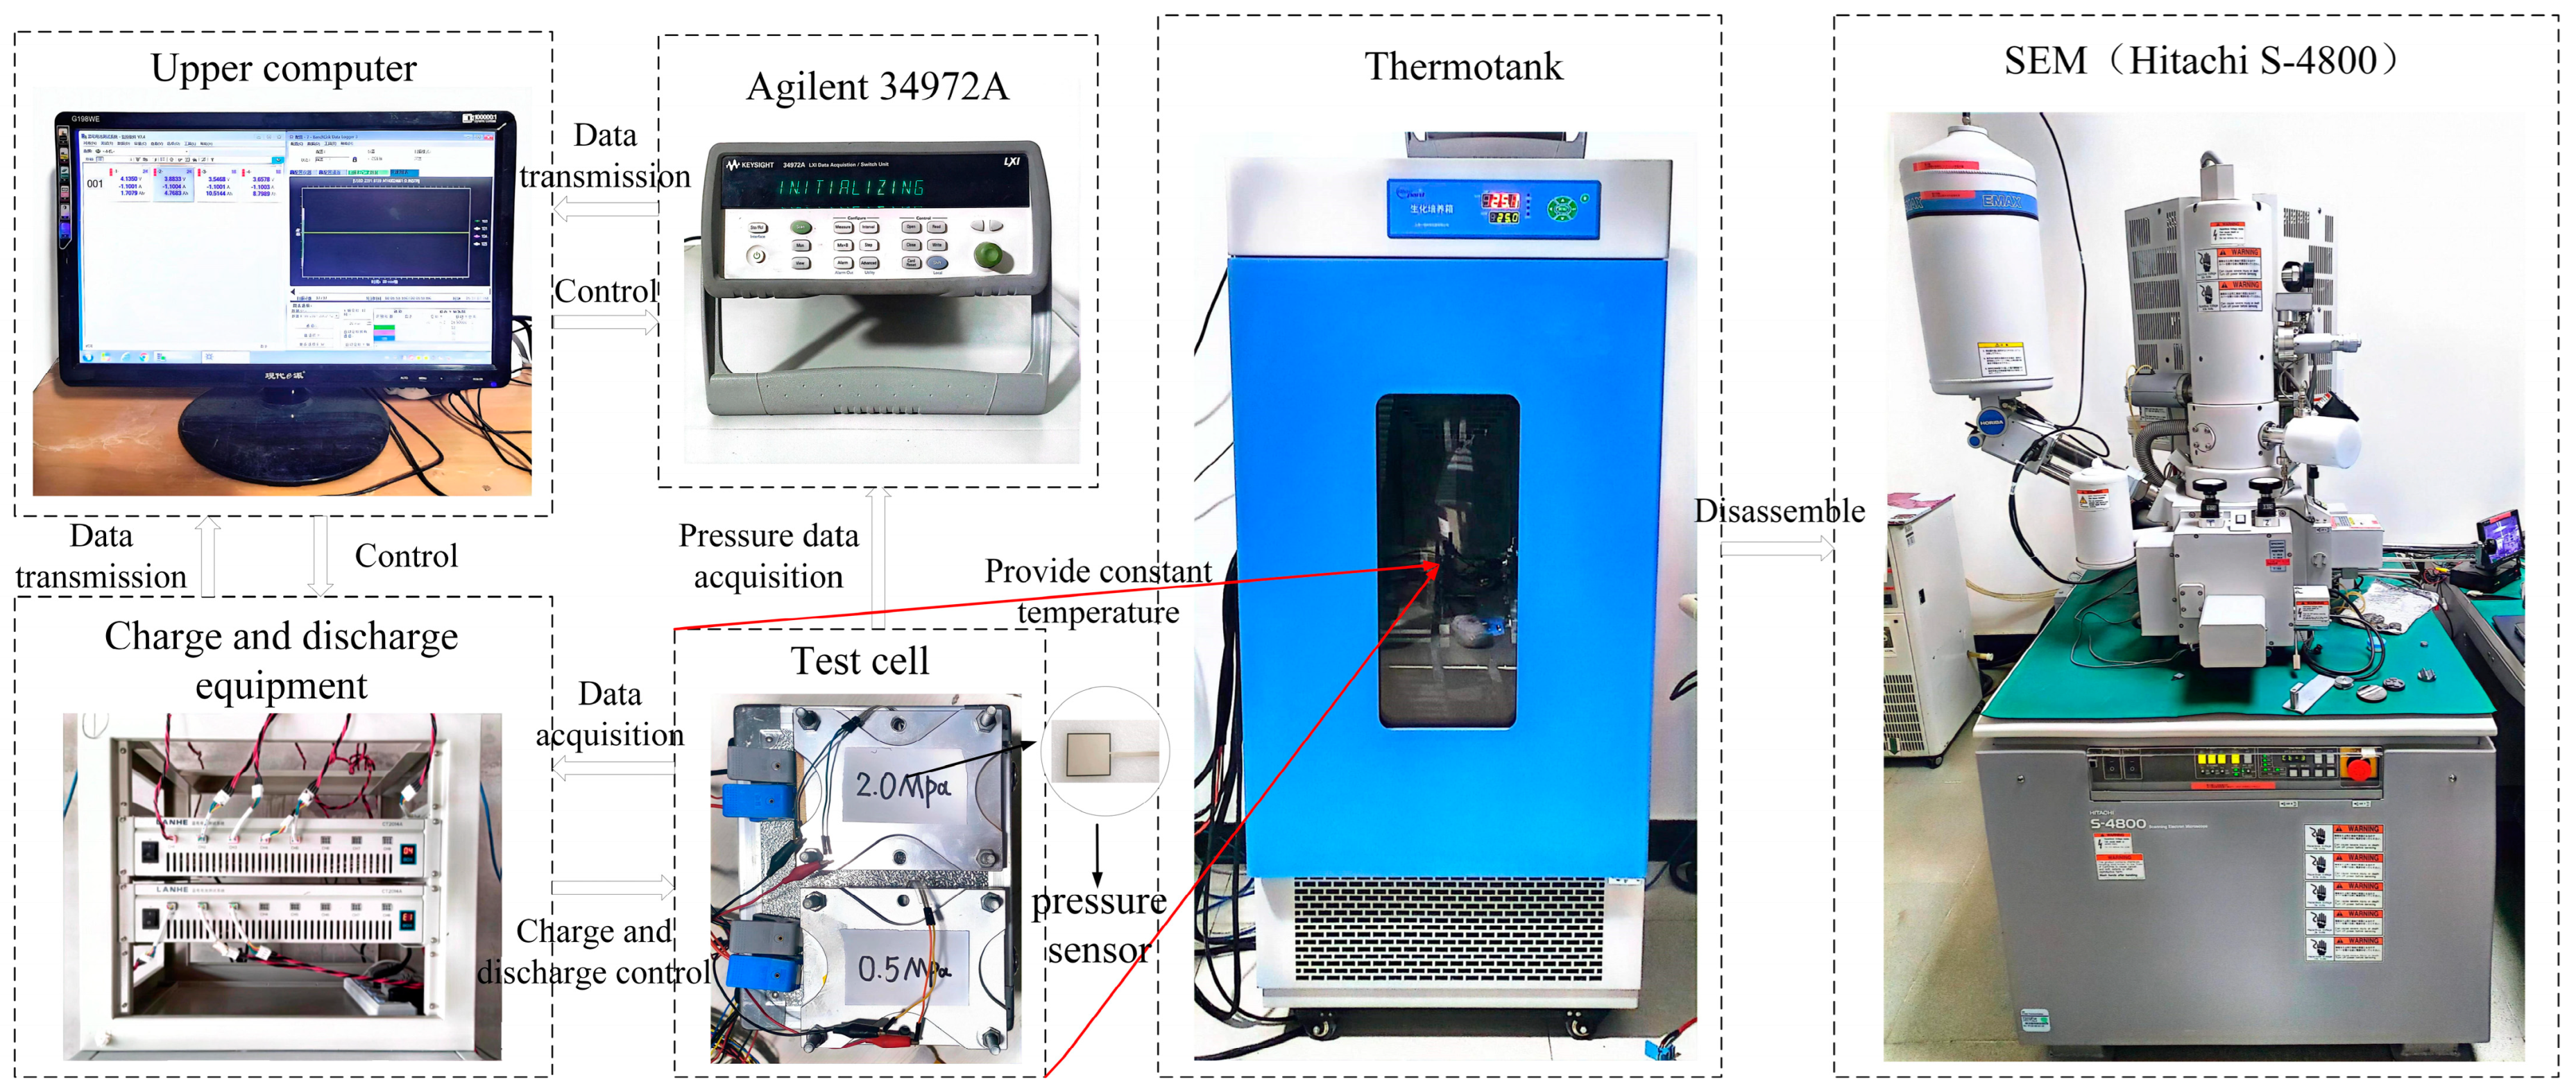
Lithium metal batteries differ from lithium-ion batteries with graphite as the anode. Lithium metal anodes are not porous electrodes and thus cannot hold lithium ions. Therefore, when the lithium ion moves to the anode electrode in the charging process, an electrochemical reaction will occur which works with electrons to generate lithium metal deposits on the surface of the anode electrode to form lithium metal dendrites or needle-like lithium, accompanied by volume expansion. As a result, the stress distribution inside the battery becomes disproportionately uneven, which may trigger chain reactions such as the rupture or failure of the solid electrolyte interface (SEI) film on the surface and eventually shorten the battery’s cycle life and increase the internal resistance. As shown in Figure 3, even if the lithium metal battery with better performance is selected, the battery still faces the challenges of the serious capacity diving and internal resistance increasing. The soft-coated lithium metal battery with a good ductility of aluminum–plastic film generates small cumulative stress, so the soft-coated battery with the corresponding fixture to control the pressure can effectively make up for the performance gap caused by volume expansion. In order to verify the improvement effect of pressure on the performance of lithium metal batteries, the experimental platform as shown in Figure 4 was established. Firstly, the battery core was placed between two parallel plates with smooth surfaces, and two different initial pressures (0.5 MPa and 2.0 MPa) were applied to the battery core by adjusting the spacing between the plates. The battery test system was set to charge and discharge the battery core at a rate of 0.2 C, and the pressure sensor data were collected by Agilent 34972A, manufactured by Agilent Corporation in Santa Clara, CA, USA. After the experiment, the S-4800SEM produced by Hitachi in Tokyo, Japan, was used to observe the surface morphology changes in the lithium anode electrode under different pressures, and the maximum resolution of the instrument was accurate to 1–1.5 nm.

2.2. An Analysis of the Experimental Results

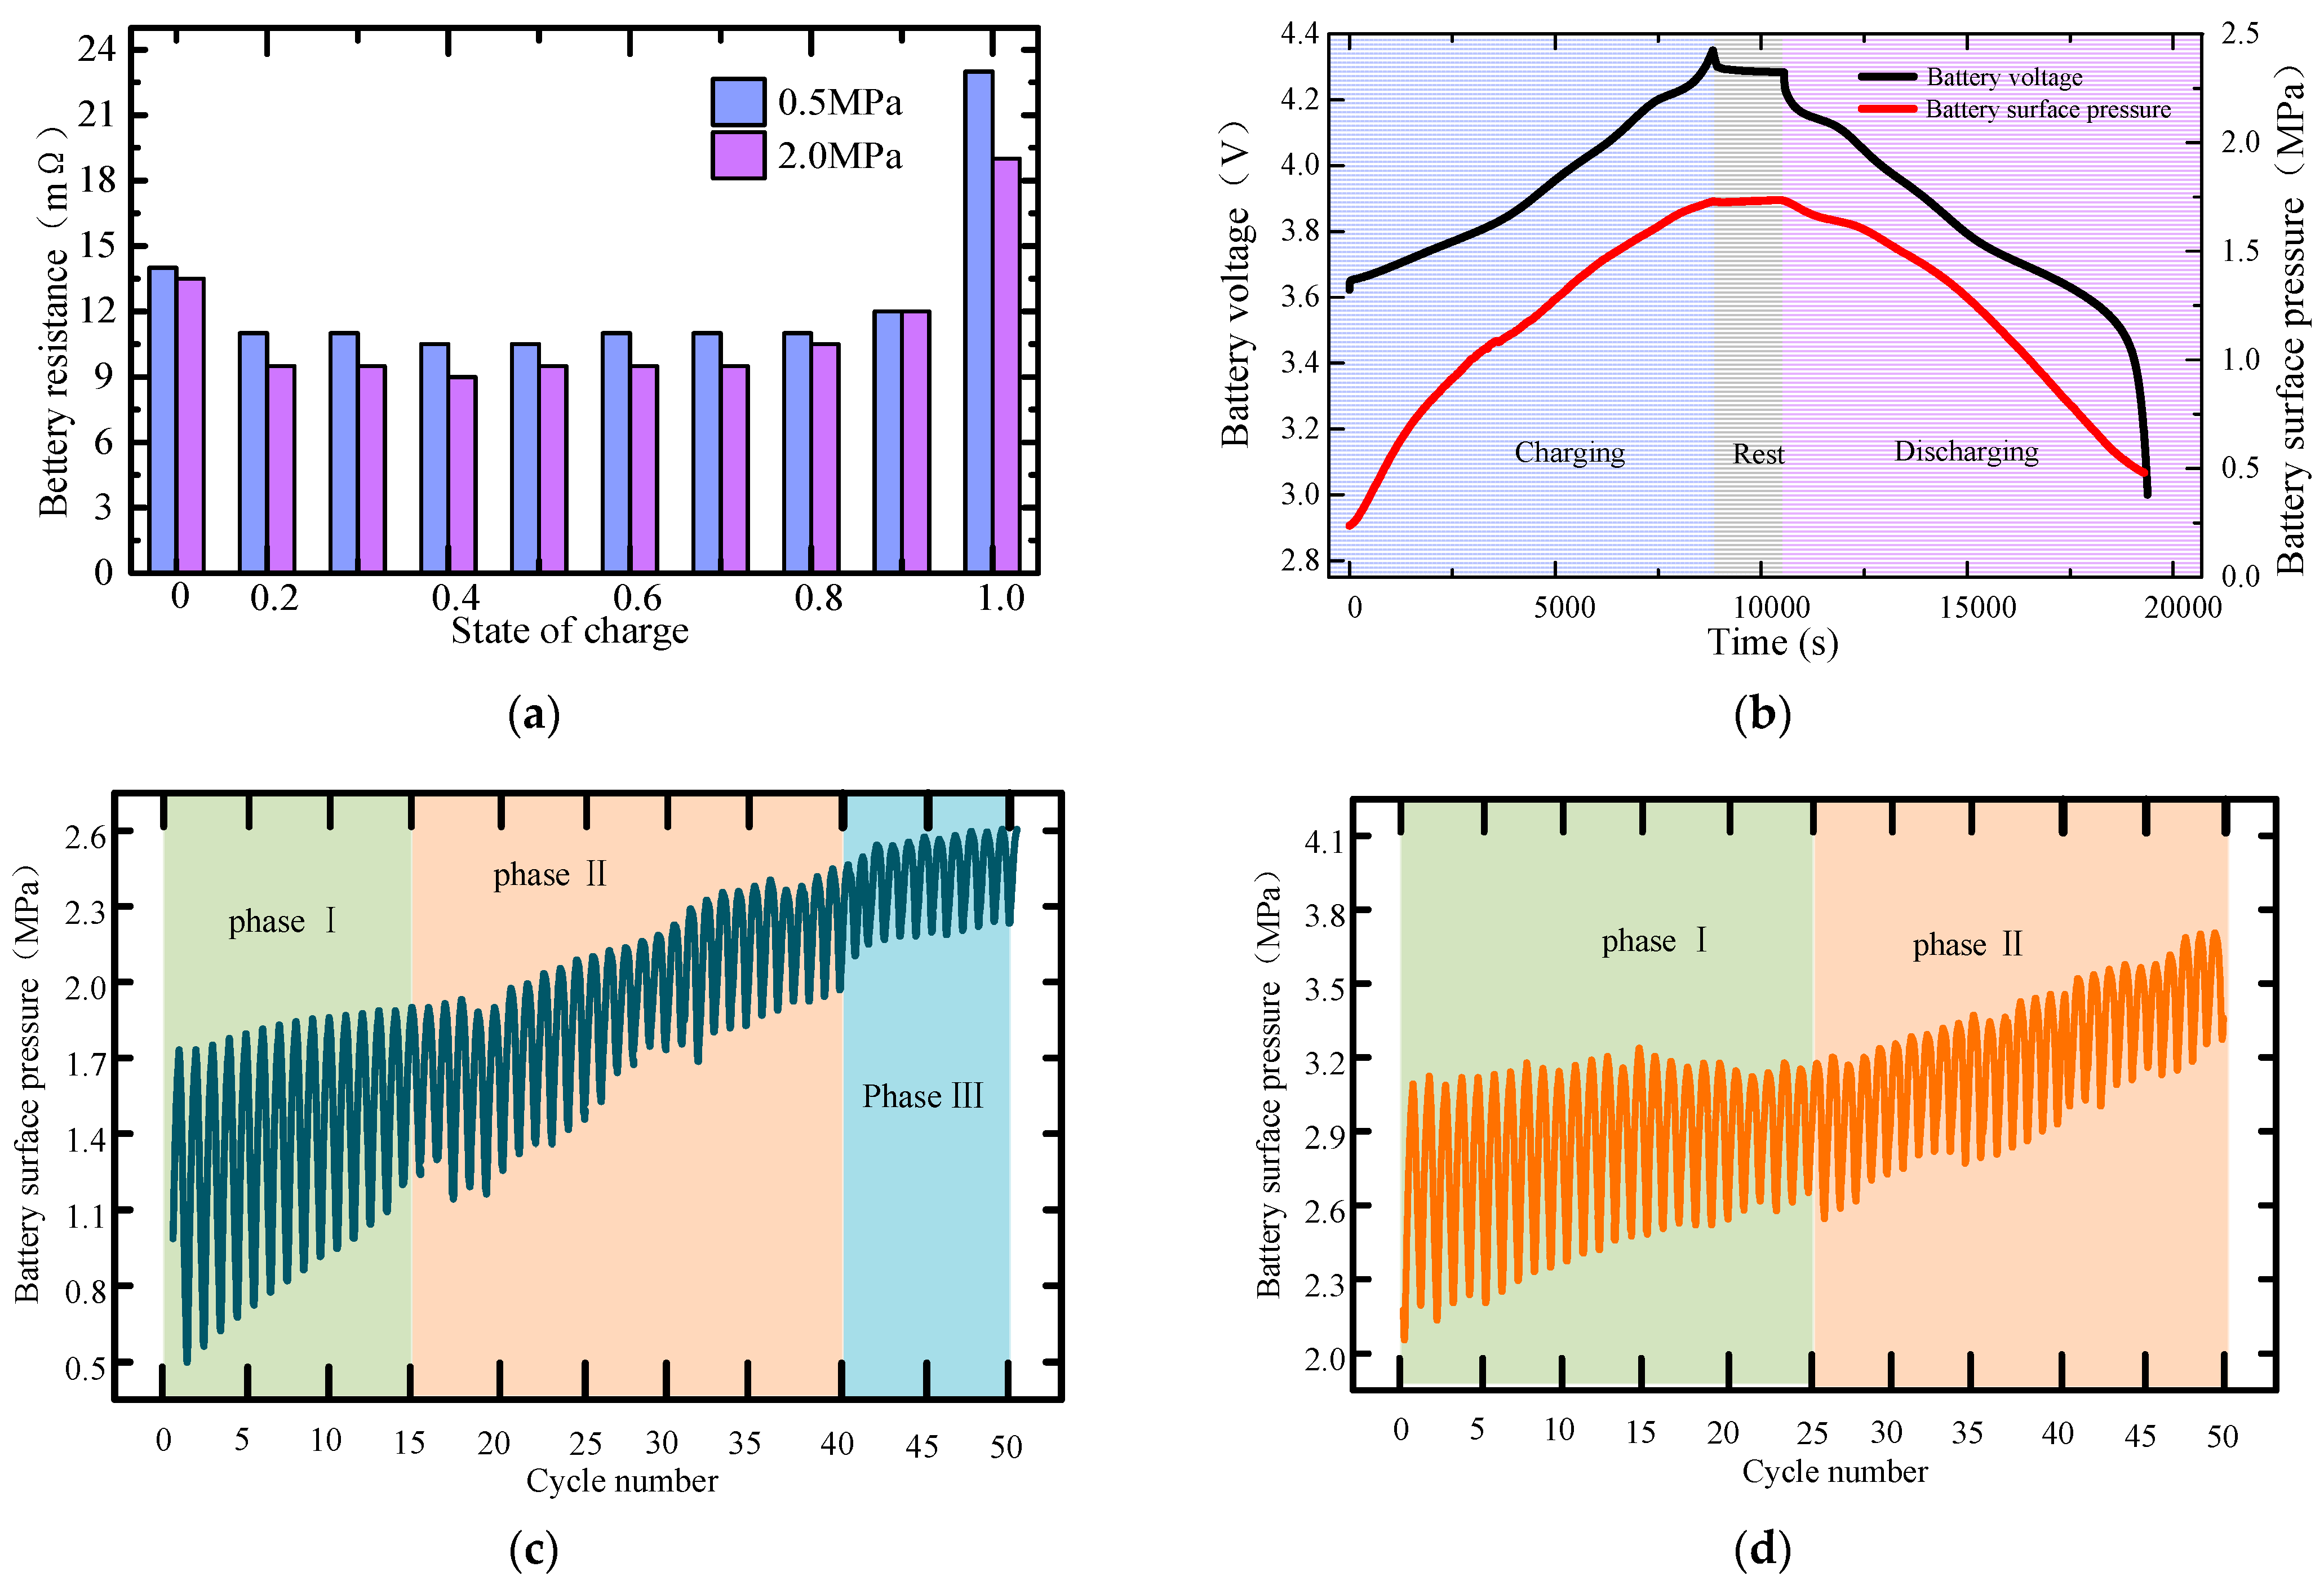
Applying external pressure can compress the electrode structure of the lithium metal battery and bring the electrode particles into closer contact with each other, and the interface impedance between the electrode and the electrolyte is thus reduced. As shown in Figure 5a, increasing the initial pressure of the battery can improve the transmission efficiency of lithium ions between the electrode and the electrolyte, thereby reducing the internal resistance of the battery.
In order to further explain the regulation effect of pressure on the lithium metal battery, the surface pressure data of the lithium metal battery were collected by a pressure sensor during the whole cycle life. As shown in Figure 5b, the surface pressure of a lithium metal battery changes positively with the voltage during the entire charge–discharge cycle. Under the restraint of the fixture, the surface pressure of the battery increases with the plating of lithium during the charging process. During the discharge process, as the lithium metal is stripped from the electrode surface and dissolved into the electrolyte, the lithium metal layer on the anode electrode surface is continuously reduced, and this dissolution process causes volume contraction inside the battery and the reduction in the surface pressure.
The surface pressure changes during the battery cycle are shown in Figure 5c. The overall pressure change trend during the battery’s entire cycle life is divided into three stages, namely the initial slow growth stage, the mid-term linear growth stage, and the later stable stage. The surface pressure is relatively low during the initial use stage of lithium metal batteries. This is because the material and structure of the battery have not yet experienced huge stress and deformation when used initially, and the deposition of lithium metal on the electrode surface is relatively stable in the initial stage, and the side reaction phenomenon is weak. As battery recycling starts, there is a gradual rise in the surface pressure of lithium metal batteries. This is because the deposition and dissolution of lithium metal during the cycle can cause the stress to change inside the battery, which in turn affects the surface pressure. The surface pressure also further increases because of the reactions inside the battery and the volume changes in the material. In the stage of high cycle life, the surface pressure of lithium metal batteries tends to stabilize or slightly increase after many cycles. This is because the battery has gone through many deposition and dissolution processes in the high cycle life stage, and the material and structure may have undergone some plastic deformation, making the surface pressure relatively stable.
The above experimental results reveal that the maximum pressure on the surface of the lithium metal battery is strongly correlated with the aging state of the battery. Imposing a higher pretension force normally causes the surface pressure of lithium metal batteries to increase. This is because the pretension force enables the components inside the battery to come into closer contact, increasing the contact pressure between the surfaces. It is this increased contact pressure that helps to enhance the conduction performance of the electric current and the battery’s response efficiency. As shown in Figure 5d, the application of a higher pretension force extends the period of phase I and thus delays the occurrence of phase Ⅲ. This is mainly because the increase in external pressure allows the lithium metal battery to maintain a relatively stable interface structure, reducing the extrusion and destruction of the SEI membrane and the occurrence of a side reaction and delaying the continuous thickening of the SEI, which makes phase Ⅲ occur late. In addition, under the initial pressure of 0.5 MPa, the maximum increment of the surface pressure reaches 0.9 MPa, while under the initial pressure of 2.0 MPa, the maximum increment of the surface pressure is 0.65 MPa. This indicates that when the initial pressure is small, the surface of the electrode may be convex and concave with the progress of the cyclic charge and discharge. These irregular surface features lead to a concentration of local pressure, which increases the surface pressure.
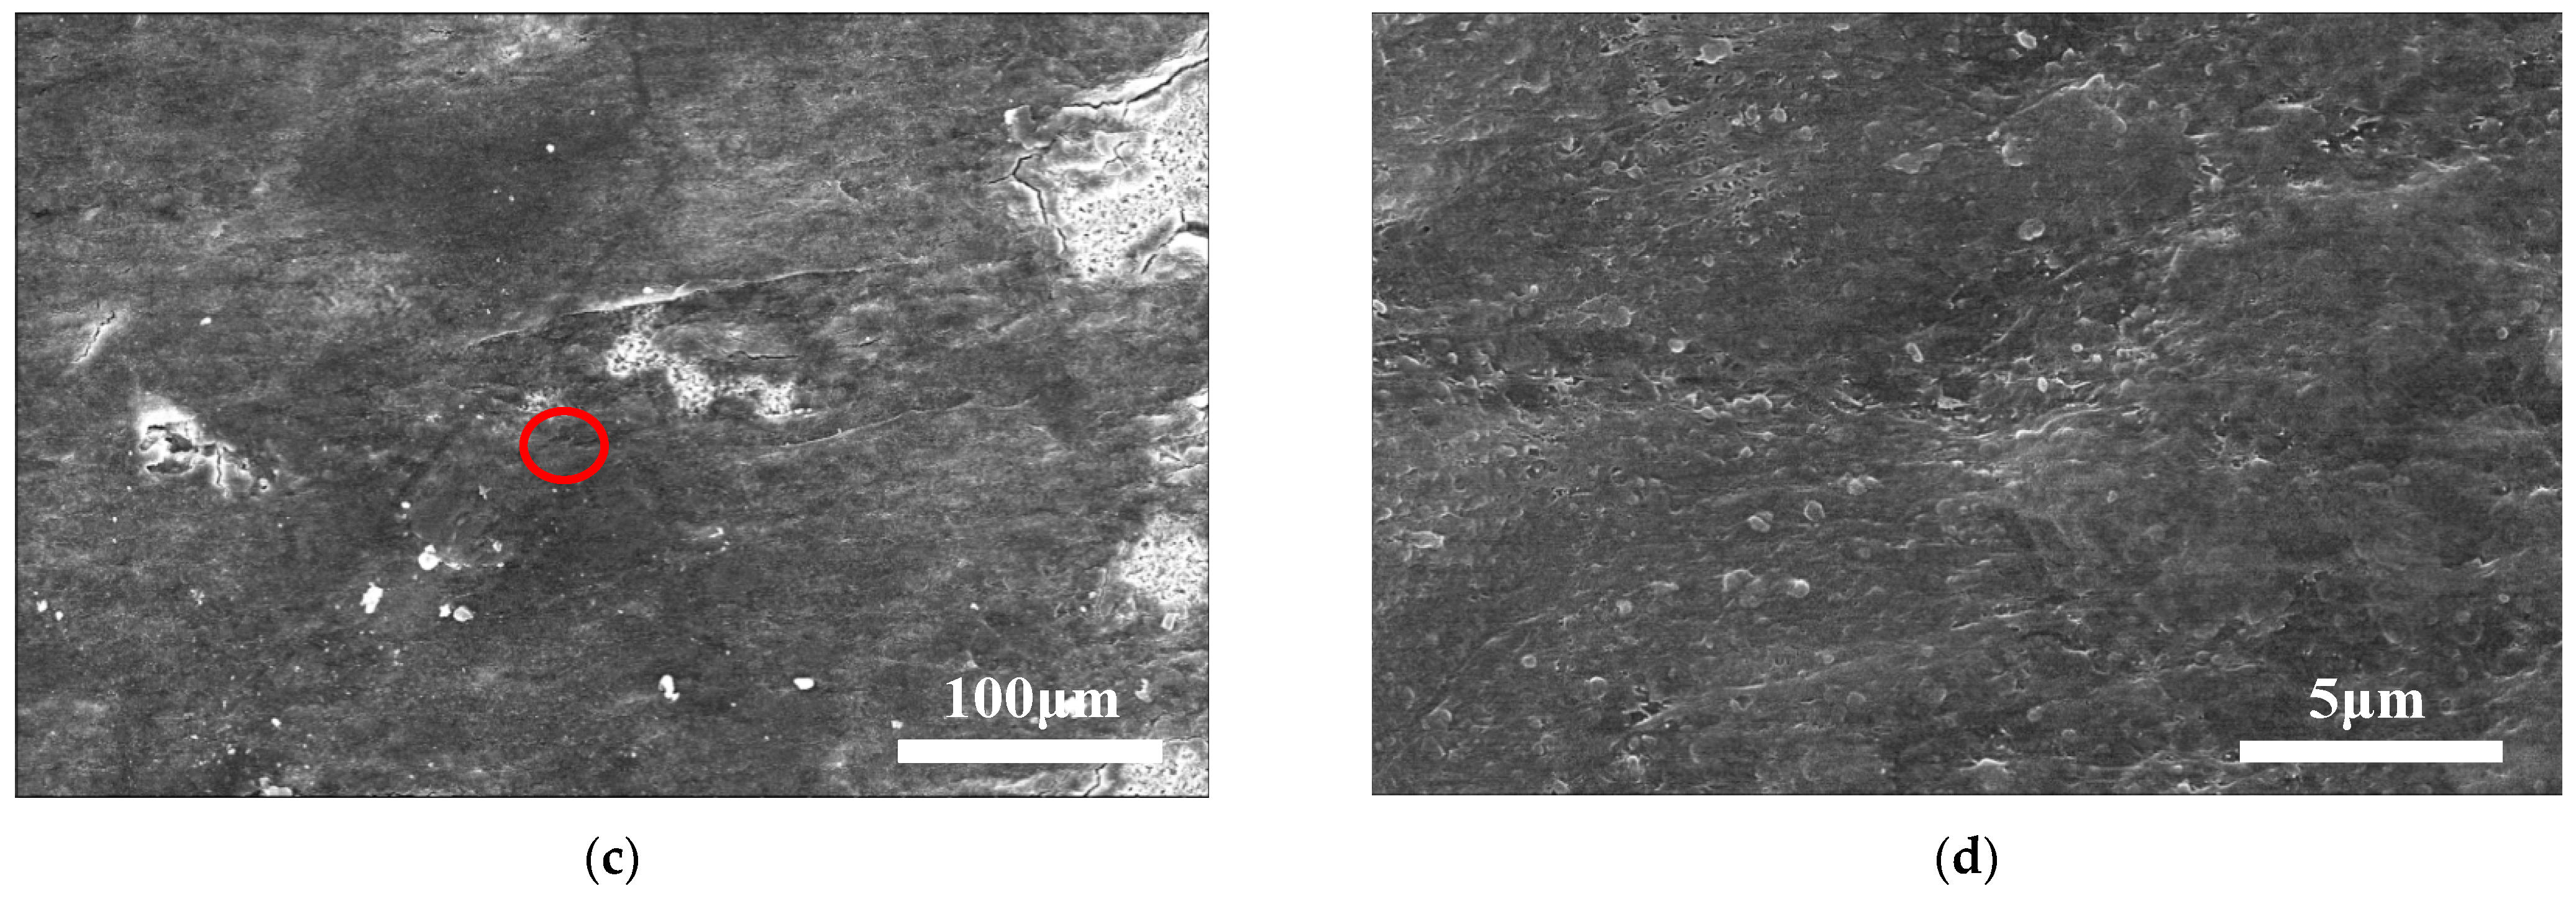
In order to further verify the influence of external pressure on the morphology of the lithium negative electrode, the batteries with the same number of cycles under the initial pressure of 0.5 MPa and 2.0 MPa were disassembled, and the results as shown in Figure 4 were obtained by the SEM. Figure 6b,d show the results of enlarging the images in the red circles by 20 times in (a) and (b), respectively. The SEM top view shows that the surface of the lithium metal electrode is seriously damaged under the initial pressure of 0.5 MPa, and the dendrite structure is clearly visible. At the initial pressure of 2.0 MPa, the surface of the lithium metal electrode is compact and flat, which further confirms the regulatory effect of external pressure on the lithium metal battery from a microscopic point of view. Although the experimental results have confirmed the effect of external pressure on the surface morphology of the lithium metal anode, the mechanism cannot be revealed. Meanwhile, the experimental testing workload is tremendous, and different electrolyte systems have a great influence on the test results. Therefore, using the numerical simulation method to investigate the growth of lithium dendrites in lithium metal batteries has great advantages.

3. Methods

Based on the experiments, a phase-field model is introduced to probe into the evolution of lithium deposition microscopically. The core idea of the phase-field approach is to replace the traditional sharp interface model with one or more continuously varying order parameters that describe different phase regions of the system. Set the order parameter ξ to distinguish the metal electrode, diaphragm, and electrolyte phases in the whole system domain, where ( ξ 1 = 1 , ξ 2 = 0 ) represents the metal electrode, ( ξ 1 = 0 , ξ 2 = 0 ) represents the electrolyte, and ( ξ 1 = 0 , ξ 2 = 1 ) represents the diaphragm. The phase-field model can quantitatively analyze the kinetic process of grain growth and predict the morphological evolution of the crystals.
During the microstructure evolution of cell systems, the free energy function is a multivariable function about the order parameter ξ and the molar concentration c i , which describes the system’s stability and equilibrium state. The Ginzburg–Landau free energy function is expressed as follows:
F ( ξ m , c i , ϕ ) = V [ f c h ( ξ m , c i ) + f g r a d ( ξ m ) + f e l e c ( c i , ϕ ) + f e l s ( ξ m ) ] d V
where ϕ is the electrostatic potential, and c i ( i = L i , L i + , A ) represents the lithium, lithium, and anion concentrations, respectively; m is the number of ξ .
In the first term f c h ( ξ m , c i ) is the Helmholtz free energy density, which consists of the local free energy density f 0 ( ξ m ) and the ion mixing energy f i o n ( ξ 1 ) , namely:
f c h ( ξ m , c i ) = f 0 ( ξ m ) + f i o n ( c i )
f 0 ( ξ m ) = w ξ 1 ξ 1 2 ( 1 ξ 1 ) 2 + w ξ 2 ξ 2 2 ( 1 ξ 2 ) 2 + w ξ 12 / 2 ξ 1 2 ξ 2 2
f i o n ( c ¯ i ) = c 0 R T i ( c ¯ i ln c ¯ i i ) = c 0 R T ( c ¯ + ln c ¯ + + c ¯ ln c ¯ )
For a double-well potential energy function f 0 ( ξ m ) , used to represent the equilibrium state of the three phase without driving, c ¯ i = { c ¯ = c / c s , c ¯ + = c + / c 0 , c ¯ = c / c 0 } represents the dimensionless lithium atoms’, lithium ion’s, and electrolyte anion’s concentration, respectively, c s and c 0 represent the solid lithium metal mole volume density and the electrolyte reference mole volume concentration, respectively, w ξ 1 , w ξ 2 , and w ξ 12 are the barrier height, R is the gas constant, and T is temperature.
The second term f g r a d ( ξ m ) is the gradient energy density, which is related to the interface energy of the lithium dendrite and electrolyte. The expression is given as follows:
f g r a d ( ξ m ) = 1 2 k ξ 1 ( ξ 1 ) 2 + 1 2 k ξ 2 ( ξ 2 ) 2
k ξ 1 = k 0 ( 1 + δ cos ( n θ ) )
where f g r a d ( ξ ) is the gradient energy density, k 0 is the front coefficient, δ and ω represent the anisotropic strength and modulus, respectively, θ is the angle between the normal vector and the reference axis, k ξ 1 is the energy gradient coefficient, and k ξ 2 is the assumed interfacial energy constant of the diaphragm phase.
The third term f e l e c ( c i , ϕ ) is the electrostatic energy density, which can be expressed as follows:
f e l e c ( c i , ϕ ) = 1 2 ρ ϕ
where ρ = z i F c ¯ + is the local current density; z i is the valence of matter i .
The fourth term f e l s ( ξ m ) is the elastic capacity density. The key to coupling the force field model and the phase-field model is to take the elastic energy density into the total Gibbs free energy of the system [23,24] to simulate the solid phase deformation caused by the elastic energy density during dendrite growth.
C i j k l ( ξ m ) = E ( ξ m ) 2 ( 1 + v ) ( δ i l δ j k + δ i k δ j l ) + E ( ξ m ) v ( 1 + v ) ( 1 2 v ) δ i j δ k l
f e l s ( ξ m ) = 0 . 5 C i j k l ( ξ m ) ε k l E ε i j E
where C i j k l ( ξ m ) is the elastic stiffness tensor; ε k l E = ε k l t o t ε k l 0 is the elastic strain tensor, ε k l t o t is the total elastic strain, and ε k l 0 is the inelastic strain; v = v e h ( ξ m ) + v s [ 1 h ( ξ m ) ] is the effective Poisson ratio, and E ( ξ m ) = E e h ( ξ m ) + E S [ 1 h ( ξ m ) ] is the effective Young’s modulus.
The evolution of the phase-field order parameter ξ in the total free energy equation over time can be represented by the nonlinear Allen–Cahn equation to drive the interface migration through the interface free energy as well as the electrode reaction.
ξ 1 t = L 1 [ f 0 ( ξ 1 ) + f g r a d ( ξ 1 ) + f e l s ( ξ 1 ) ] L η h ( ξ 1 ) ( e ( 1 α ) n F η R T c ^ + e α n F η R T )
ξ 2 t = L 2 [ f 0 ( ξ 2 ) + f g r a d ( ξ 2 ) ]
where L 1 is the electrode interface mobility; L 2 is the diaphragm interface mobility; L η is the reaction constant; α is a symmetry constant; n is the number of electrons involved in the reaction; η = φ e φ s E e q is the overpotential, among which φ e is the lithium metal anode potential, φ s is the electrolyte potential, and E e q is the equilibrium potential of the electrochemical reaction; h ( ξ 1 ) is the first derivative of the interpolation function h ( ξ 1 ) = ξ 1 3 ( 10 15 ξ 1 + ξ 1 2 ) .
During the whole deposition process, only the migration of lithium ions in the electrolyte is considered, with the influence of electron transport ignored. The evolution of lithium ions in the electrolyte can be described using the Nernst–Planck equation, namely
c ^ + t = ( D e f f c ^ + + D e f f c ^ + n F R T φ ) r ξ 1 t
where D e f f = D e h ( ξ 1 ) + D s [ 1 h ( ξ 1 ) ] is the effective diffusion coefficient, D e is the diffusion coefficient of L i + in the lithium metal, and D s is the diffusion coefficient of L i + in the electrolyte. The last term in the equation represents the consumption or accumulation of lithium ions that results from chemical reactions on the surface of the electrode, with r being the ratio constant.
Since the applied potential is to drive the electrodeposition reaction, and the whole system is electroneutral, the Poisson equation is used to solve the potential, and a source term is added to describe the total charge generated or consumed by the electrochemical reaction on the electrode surface.
[ σ e f f ( φ ( r , t ) ) ] = F C s ξ 1 t
where σ e f f = σ e h ( ξ 1 ) + σ s [ 1 h ( ξ 1 ) ] is the effective conductivity, σ e is the conductivity of the lithium metal, and σ s is the conductivity of the electrolyte; C s is the solid lithium concentration.
An electrochemical–force coupling phase-field model was constructed using COMSOL Multiphysics 6.1 to simulate the process of lithium deposition during plating. An adaptive mesh refinement method was used to improve the convergence and accuracy of the simulation. Adiabatic boundary conditions are used for the four boundaries of the phase-field variables and the left and right boundaries of the concentration and potential. The upper and lower boundaries of the Li ion concentrations were set to c 0 and 0, and the potentials of the upper and lower boundaries were set to 0.1 V and 0 V, respectively. Specific parameters are shown in Table 1.

4. Results and Discussion

4.1. Initial Lithium Dendrite Morphology

The temporal phase-field evolution rates in the model as well as the interfacial motion are considered to be nonlinear relative to the thermodynamic driving force and are used to model microstructural evolution in highly nonequilibrium processes [27,28,29,30]. Figure 7 shows that when the boundary potential is 0.1 V, the initial electrolyte concentration is 1000 mol/m3. Then, the nonlinear phase-field model is used to obtain the distribution of the lithium metal deposition morphology, lithium-ion concentration, and electric potential at different times.
During the charging process, lithium ions migrate from the electrolyte to the electrode surface and participate in the deposition reaction to transform into solid phase lithium. Due to the anisotropy of the surface energy of the electrode, the initial core breaks up due to instability and the tip takes shape. Meanwhile, the anisotropy of the surface energy also affects the deposition morphology and growth rate of lithium. The aggregation effect of the electric field allows the tip to generate a large current density, which leads to the massive migration of nearby Li ions and aggregation at the tip, further promoting the deposition of lithium ions and making the tip growth rate much higher than that of the surroundings. Through the phase-field parameters in Figure 5a, it can be seen that as the charging time increases, the lithium deposition gradually forms thick lithium dendrite and gradually expands outward, and the final 100 s lithium dendrite growth height is 2.54 μm. Figure 5b,c show that there is an obvious concentration gradient and electric potential gradient at the junction between the lithium metal and electrolyte, and the overpotential brought by the electric potential gradient around the dendrite drives the further growth of the lithium dendrite, which theoretically proves that concentration difference overpotential is an important factor for dendrite growth.

4.2. Crystal Morphology of Lithium Branches at Different Cycle Stages

After the lithium metal battery has been used cyclically over an extended period, part of the solution and solvent in the electrolyte is continuously consumed with the side reaction. On the one hand, with the consumption of the electrolyte, the change in solute and solvent concentration affects the movement ability of molecules in the electrolyte, slowing down the transmission rate of the lithium ion between the electrolyte and the electrode; on the other hand, a long period of cyclical use causes the surface area of the anode electrode surface to expand, which lengthens the diffusion path of the electrolyte and lowers the diffusion rate. Therefore, the growth state of the dendrite in different cycle stages is simulated by reducing the diffusion coefficient.
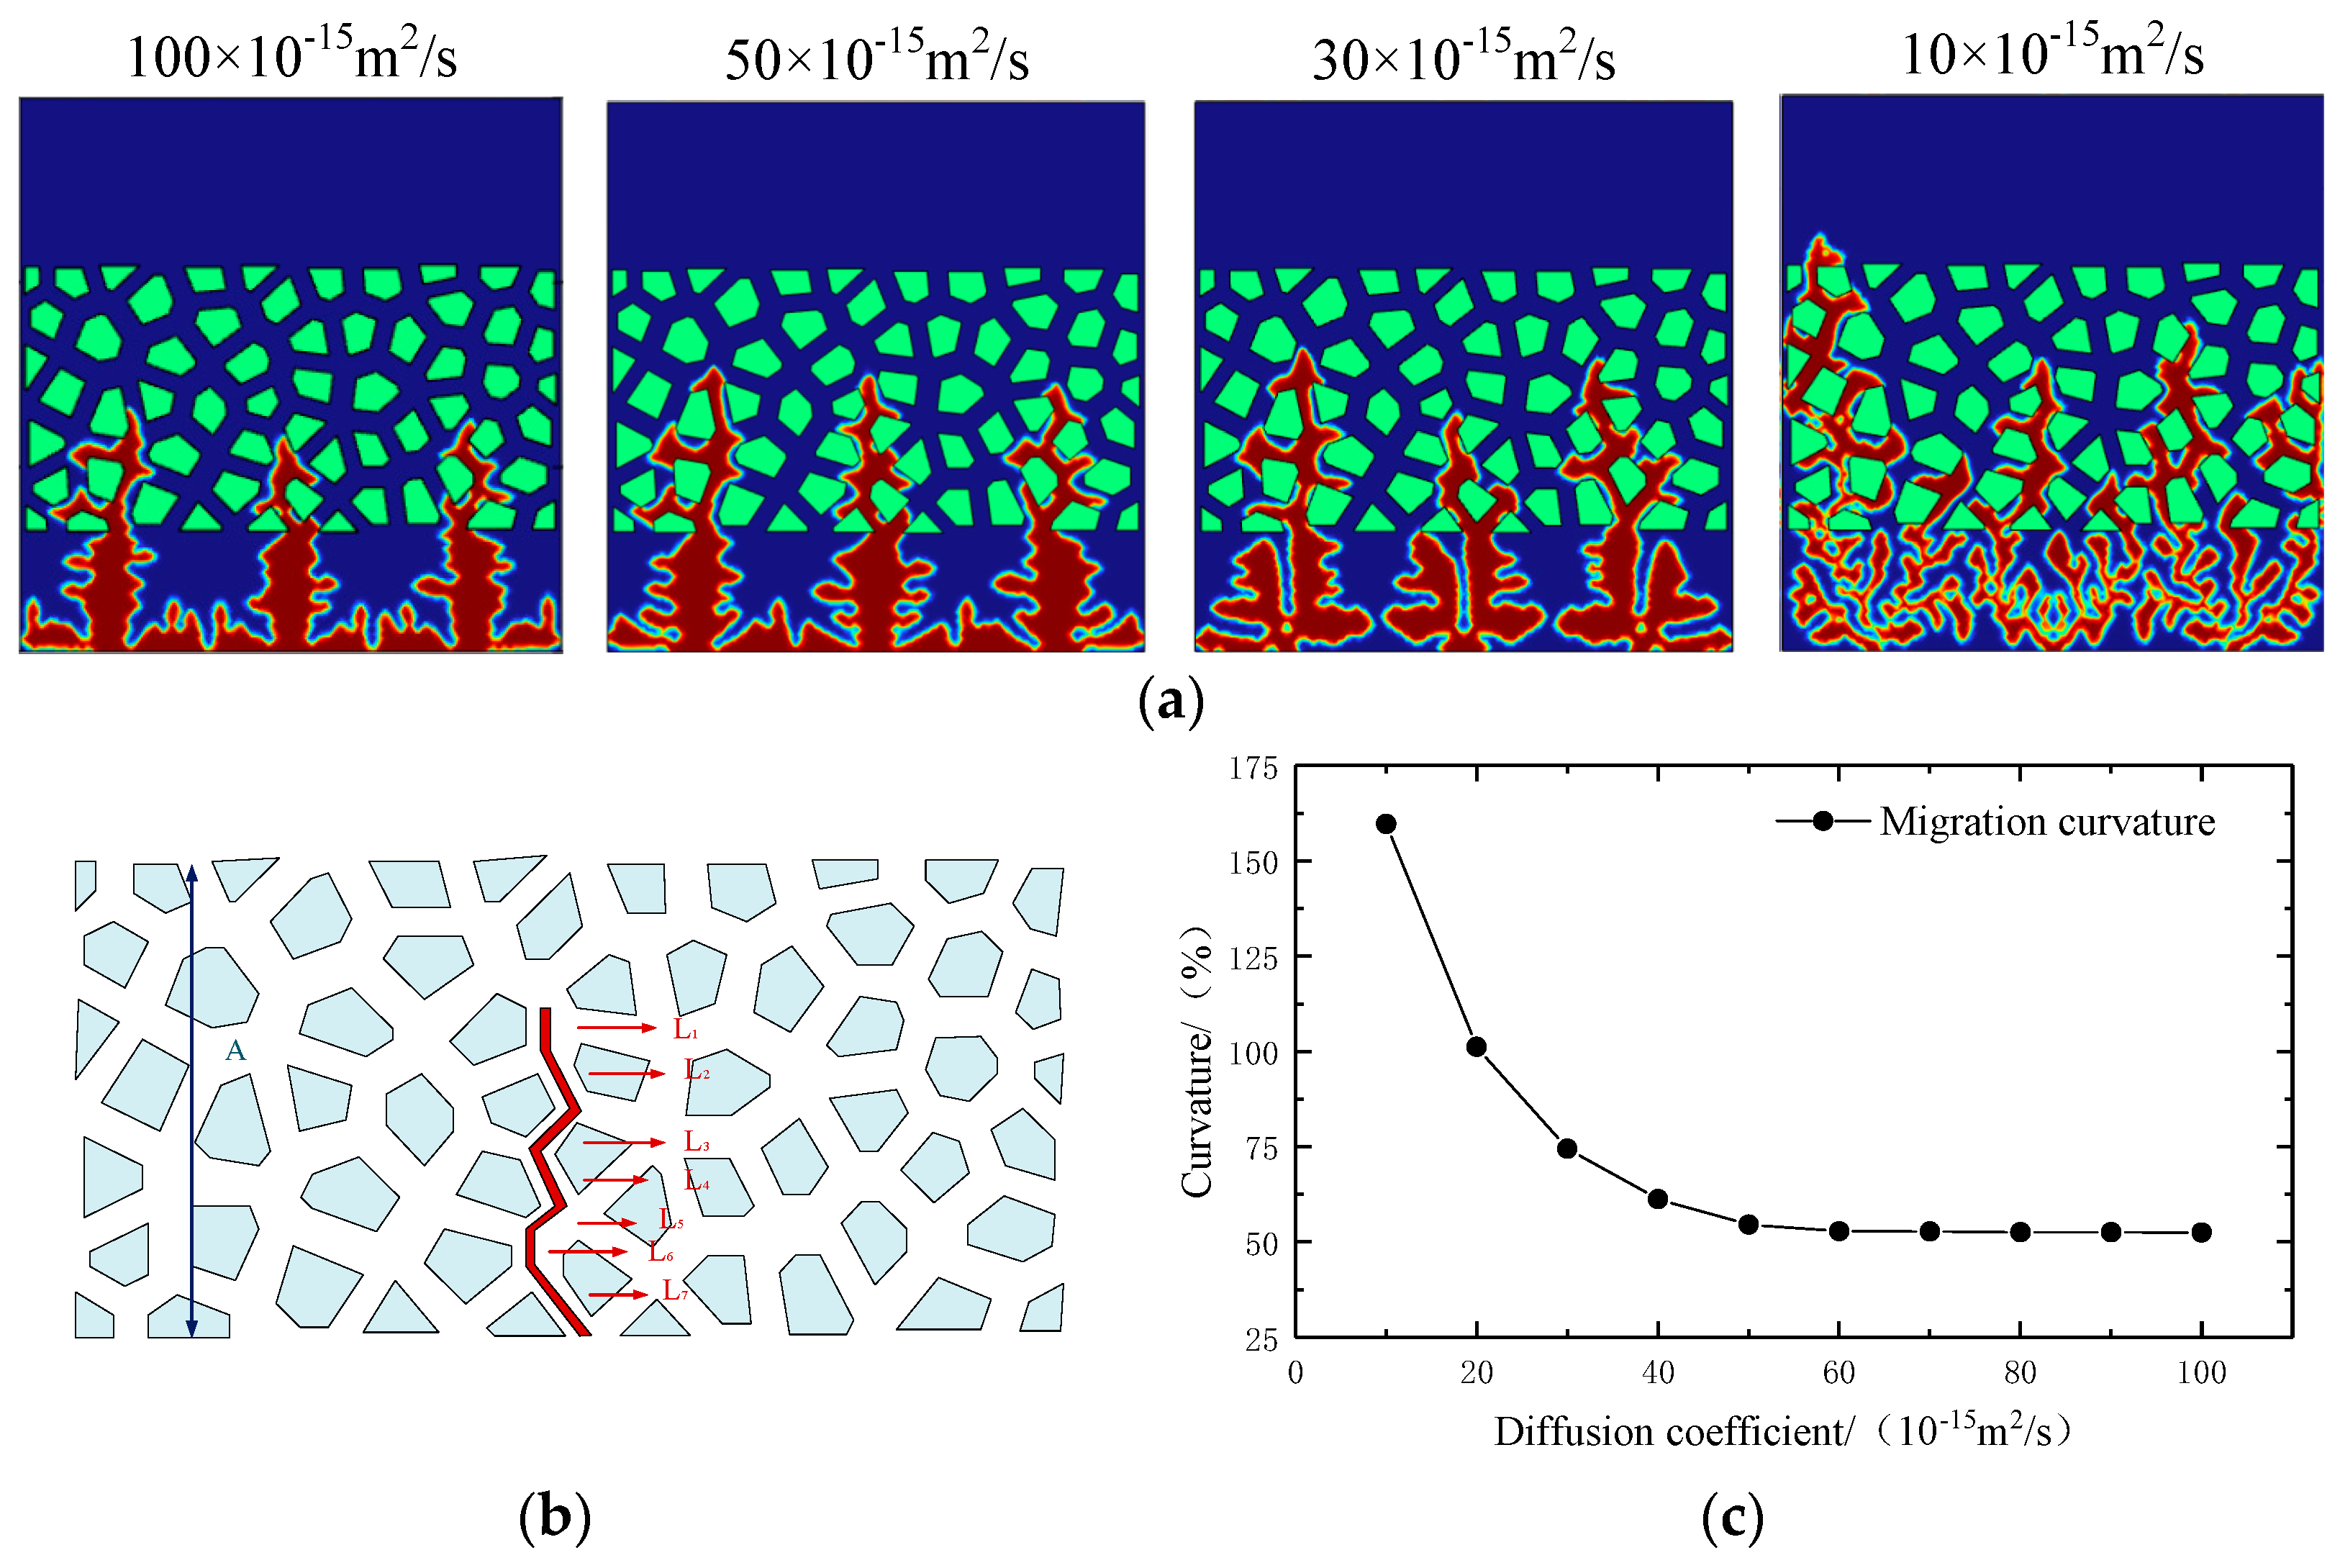
The drop in the diffusion coefficient of the electrolyte results in an uneven deposition of lithium on the electrode surface, affecting the battery performance and posing safety risks. As shown in Figure 8a, in the initial stage, lithium dendrites are generated on the electrode surface and then gradually extended to the intermediate phase area. The lithium deposition is relatively stable in this stage. With charging and discharging proceeding over a period of time, the electrolyte is consumed continuously, which causes the erosion coefficient to drop. In the meantime, the lithium dendrites gradually spread outward and become slenderer. These slender dendrites grow continuously on the electrode surface to form a more complex dendritic structure. This is mainly because the lithium ions in the electrolyte diffusion rate slow, which means that ions are consumed immediately as soon as they are diffused to the electrode and electrolyte interface. At this time, the deposition reaction of lithium-ion consumption outstrips the supply capacity of diffusion, and the large concentration gradient between the dendrite tip and the electrolyte prompts the dendrite to grow further. The formation of a slender branch morphology increases the pressure inside the battery. When the diffusion coefficient is reduced to 10 × 10−15 m2/s, the lithium dendrite has punctured the diaphragm and the opposite electrode short circuit, thus causing safety problems.
In order to better analyze the evolution process of the lithium deposition morphology in different cycle stages, as shown in Figure 6b, we introduced migration curvature ξ r :
ξ r = i = 1 n L i A
where i = 1 n L i is the migration length of the lithium dendrite in the diaphragm, n is the number of twists in the diaphragm, L is the tortuous length of each time, and A is the thickness of the diaphragm. The increase in curvature can qualitatively reflect the uncontrollable growth of the lithium dendrite and the risk of internal short circuit.
As shown in Figure 6c, when the diffusion coefficient of the electrolyte drops from 100 × 10−15 m2/s to 10 × 10−15 m2, the migration curvature of lithium in the diaphragm first remains basically unchanged and then rises slowly before increasing sharply. This is because the electrolyte diffusion coefficient is reduced to such an extent that the supply of lithium ions in the electrolyte cannot fuel dendrite growth. Thus, a large concentration difference overpotential builds up in the local area of the electrode surface, which in turn drives the dendrite to migrate rapidly inside the diaphragm. Therefore, as the electrolyte is consumed in huge amounts in the later stage of the cycle, the risk of the dendrite penetrating into the diaphragm rises dramatically. It is, therefore, necessary to alleviate the disordered outward diffusion of the dendrite and avoid a short circuit inside the battery.

4.3. Effect of Pressure on Lithium Deposition Morphology

Due to the ductility of lithium, applying external pressure on lithium metal batteries can affect the morphology of the lithium dendrite and inhibit its growth during electrochemical deposition [31,32,33,34,35,36].
To better explain the inhibitory effect of external pressure on lithium deposition, we introduce the Ginzburg–Landau free energy function in the model to assist the understanding; namely, we describe the effect of pressure on the phase-field parameters with the contribution rate of the elastic energy density f e l s ( ξ ) to the total Gibbs free energy f c h ( ξ , c i ) + f g r a d ( ξ , ϕ ) + f e l e c ( c i , ϕ ) + f e l s ( ξ ) of the system. In the case of small external pressure, the contribution of the elastic energy density term is negligible because it cannot significantly change the internal stress distribution of the battery. As the external pressure rises, f e l s ( ξ ) starts to increase rapidly. When the elastic energy density far outstrips the other three terms in the total Gibbs free energy of the system, the pressure on the phase-field parameter begins to change linearly. However, when the external pressure continues to increase, the influence of the elastic energy density term reaches its peak, that is, the internal stress change caused by the external pressure reaches its limit and f e l s ( ξ ) no longer changes. At this time, increasing the external pressure does not have marked inhibitory effects on the phase-field parameters.
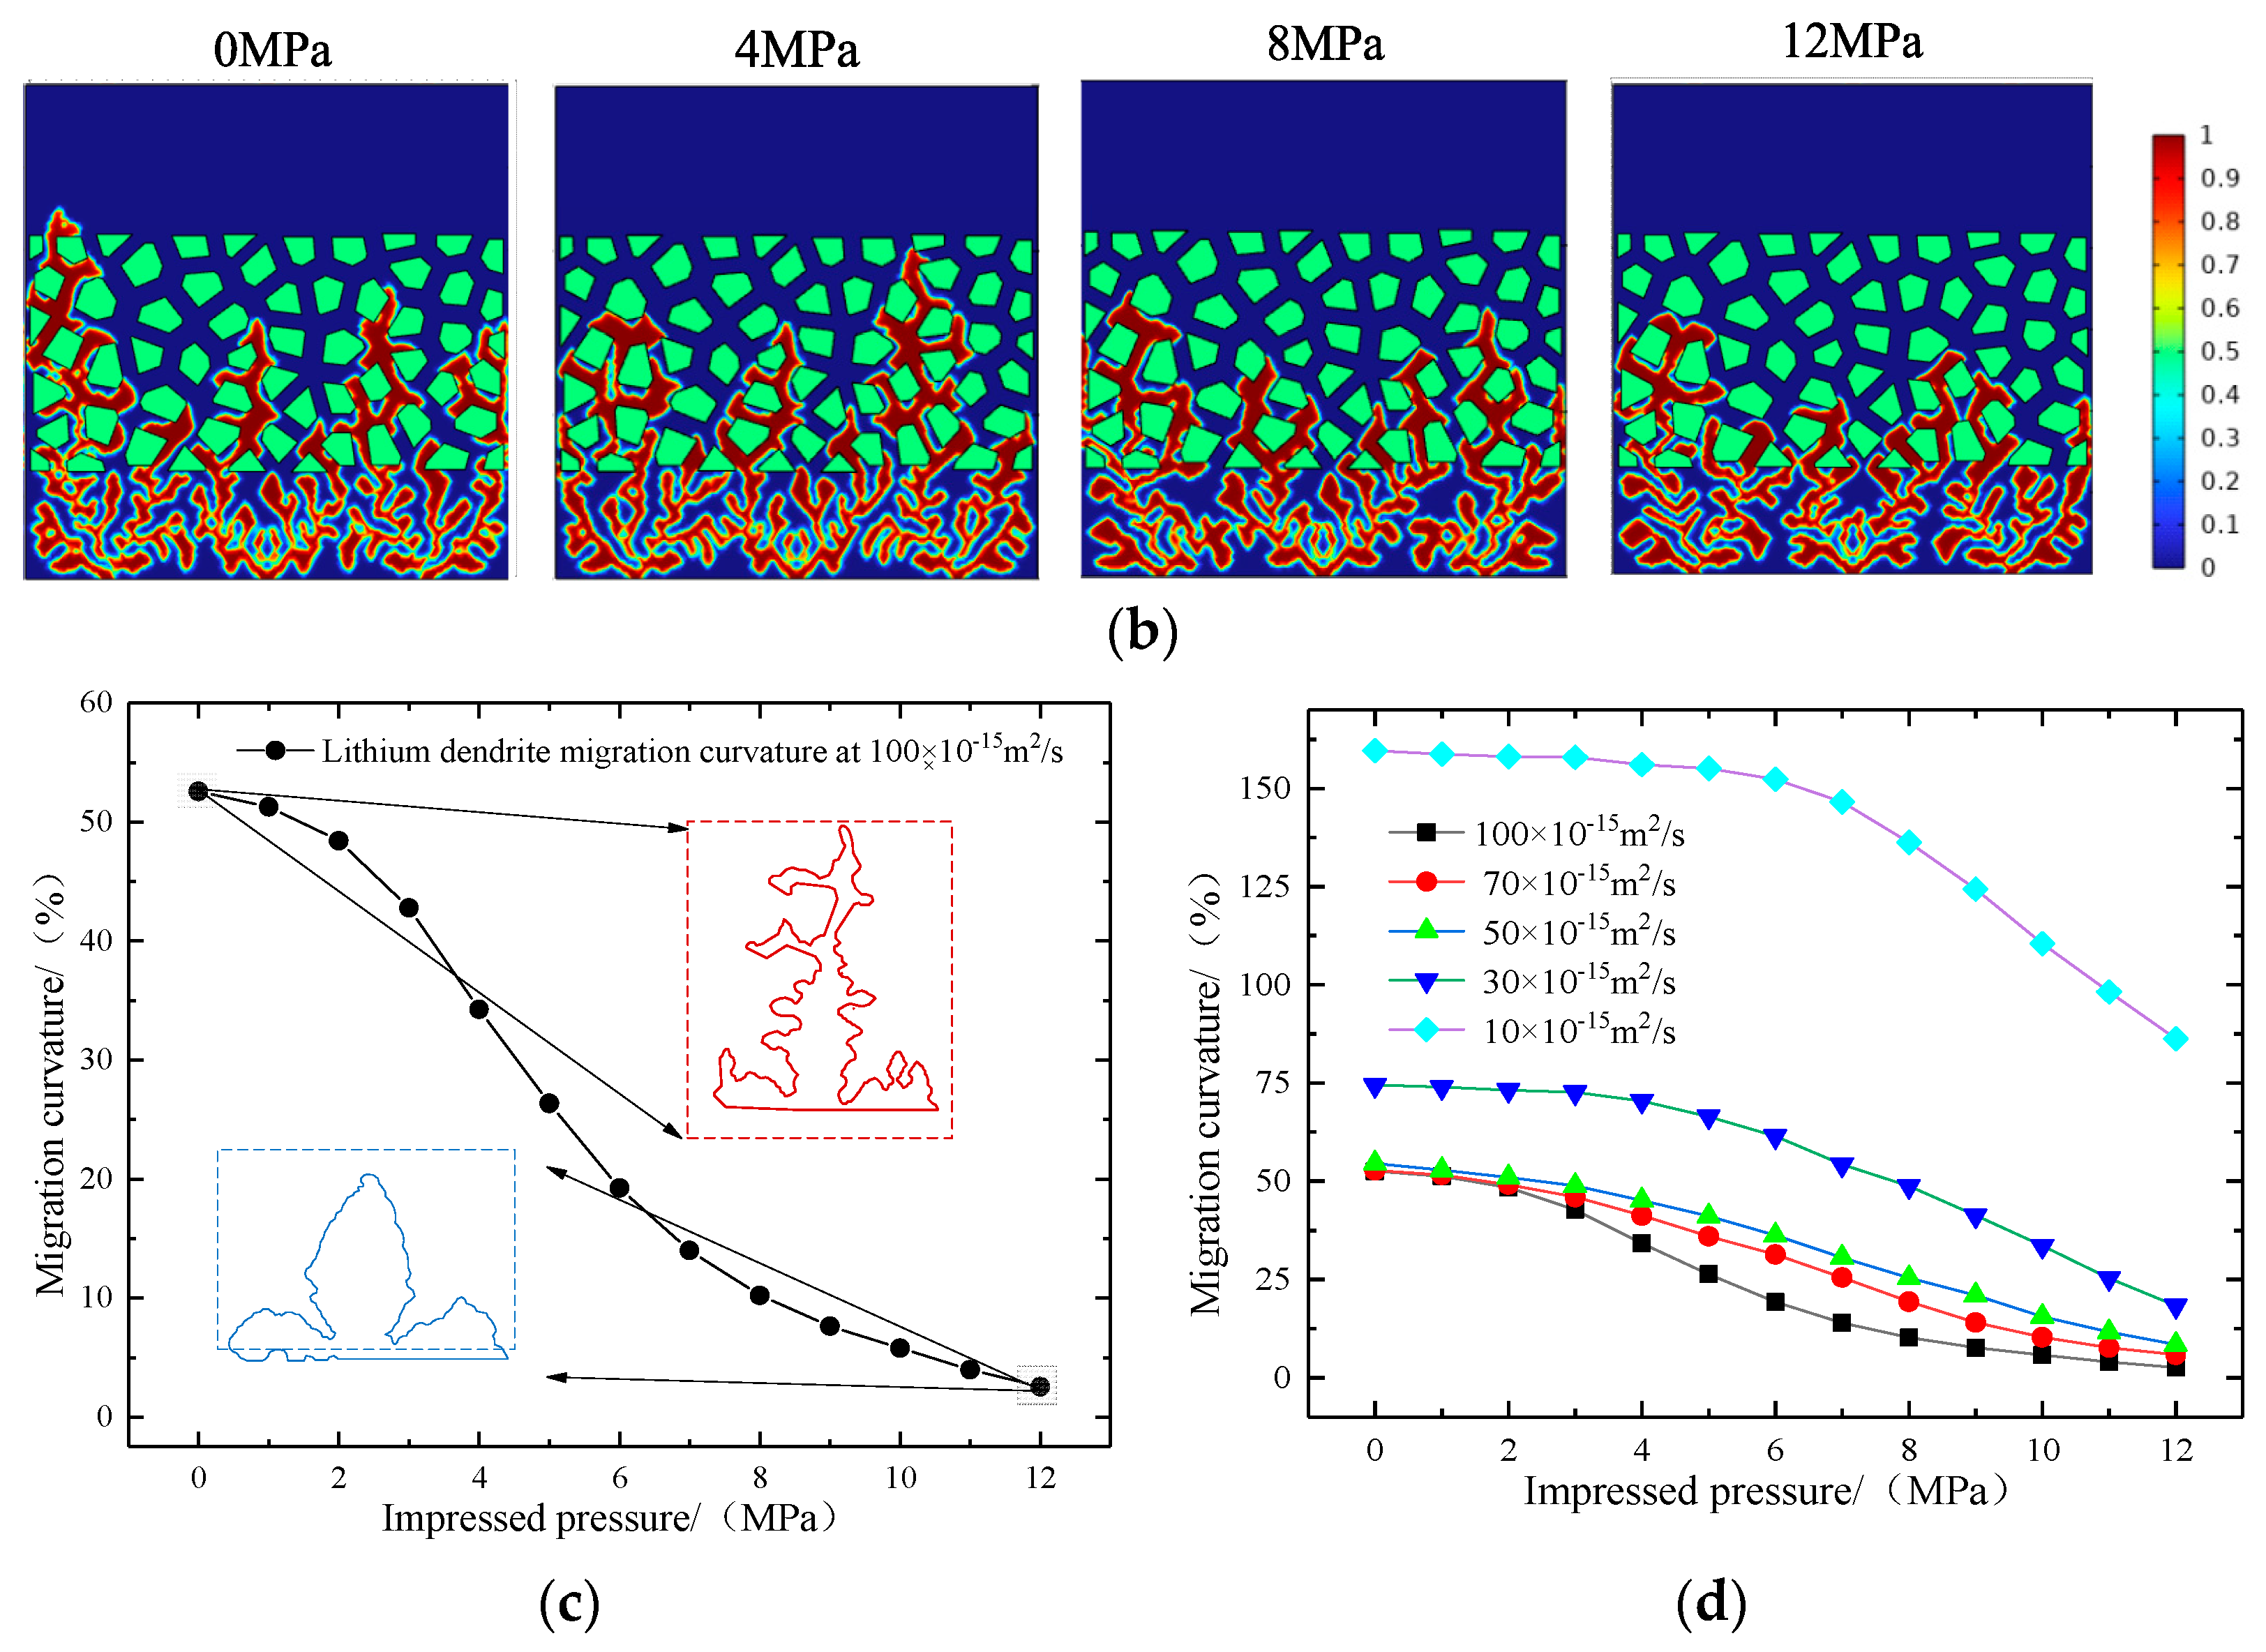
Figure 9a shows the electrolyte diffusion coefficient of 100 × 10−15 m2/s, the process of the growth of the lithium dendrite with external pressure. With the increase in external pressure, the spindle tip length and the migration curvature in the diaphragm in the same charging time are constantly shortened, the number of lateral branches also decreases, and the deposition morphology gradually develops toward smoothness and thickness. This is mainly due to the continuous extrusion of the battery by the external pressure, which further increases the internal stress, reduces the deposition rate of the lithium metal, affects the reaction driving force of the contact surface between the electrode and the electrolyte, and suppresses the further growth of the dendrite tip. As shown in Figure 9c, when the diffusion coefficient is 100 × 10−15 m2/s, in the initial cycle stage, the electrolyte is not greatly consumed by the side reaction. The influence of external pressure on the morphology of lithium deposition can be roughly divided into three intervals, and the initial inhibition effect on the dendrite is low in the initial stage; with the increase in external pressure, the inhibition effect on the lithium dendrite approaches a linear change; when the pressure increases to a certain extent, the application of external pressure cannot effectively inhibit the further growth of the dendrite. The simulation results are in agreement with those obtained by the formula.
The decrease in the diffusion coefficient of the electrolyte means that the transmission speed of lithium ions in the electrolyte is reduced, which in turn limits the transmission of lithium ions inside the battery. In this case, more lithium-ion deposition will accumulate in the large local concentration gradient, thus increasing the stress inside the battery. The internal stress of the battery is increasing due to the decreased diffusion coefficient, and the small external pressure imposed cannot overcome the huge internal stress. As shown in Figure 9b,d, when the diffusion coefficient is 100 × 10−15 m2/s, a pressure of 2–6 MPa can effectively inhibit the growth of the dendrite; when the diffusion coefficient is reduced to 10 × 10−15 m2/s, a pressure of 2–6 MPa no longer works. Therefore, as the battery’s cyclical charging and discharging cause the electrolyte diffusion coefficient to drop gradually, greater external pressure is needed to have a significant inhibitory effect on the growth of lithium dendrite.

5. Conclusions

The electrochemical–force coupling phase-field model and the experimental platform of pressure conditions are established to study the regulation mechanism of external pressure on the lithium metal anode battery. On this basis, the pressure characteristics of lithium metal batteries under different pretension forces are studied, and the growth mechanism and morphology changes in the lithium dendrite under different external pressure conditions are simulated. The following conclusions are drawn:
(1)
The maximum pressure on the surface of the lithium metal battery presents three different stages along with the gradual aging of the battery. A large pretension force can extend the cycle of initial stage I, delay the occurrence of stage Ⅲ battery failure, and then improve the battery’s cycle life. The scanning electron microscope further proves that the external pressure can effectively improve the surface structure of the electrode.
(2)
With the passage of time and the proceeding of continuous charging and discharging, the diffusion coefficient of the electrolyte gradually decreases. At this time, the lithium dendrite gradually diffuses from the intermediate phase area to produce slender branches and extend on the electrode surface, further increasing the risk of short circuit in the battery.
(3)
The increase in external pressure shortens the spindle tip length of the lithium dendrite and the migration curvature in the diaphragm, which promotes the morphology of lithium deposition to develop in a smooth and thick direction. However, as the battery life drops, the diffusion coefficient of the electrolyte goes down, and the battery’s internal stress increases gradually, thus greater external pressure is needed to exert a significant inhibitory effect on the growth of the lithium dendrite.
The lithium metal battery, as a type of battery with high energy density, has a great application prospect in the field of flying electric vehicles. Applying external pressure to the lithium metal soft-pack battery can compress the internal structure of the battery, reduce the formation and accumulation of dendrites, reduce the stress and damage during the battery cycle, and then extend the service life of the flying electric vehicle and reduce the risk of battery short circuit, which has significant significance for the further development of the flying electric vehicle industry. With the continuous development and advancement of technology, the solid electrolyte has become an effective way to solve the problem of the anode dendrite growth of lithium metal batteries, but further research and engineering practices are still needed to overcome the existing challenges.

Author Contributions

Investigation, W.S.; methodology, W.S., J.C. and R.X.; validation, W.S. and J.C.; writing, J.C. and R.X.; supervision, W.S. All authors have read and agreed to the published version of the manuscript.

Funding

The completion of this manuscript is supported by the project “Research and Engineering Demonstration of a safe, autonomous and controllable Intelligent Control System for ten-kilowatt clean energy”. The project number is GINY-22-108.

Data Availability Statement

Data are contained within the article.

Conflicts of Interest

The authors declare no conflicts of interest.

References

  1. Hammadi, M.A.; AlMesafri, N.; Zafar, S.; Santos, G. Design and Analytical Analyses of eVTOL UAV Performance Calculator for Power and Energy. In Proceedings of the 2023 10th International Conference on Recent Advances in Air and Space Technologies (RAST), Istanbul, Turkey, 7–9 June 2023; pp. 1–6. [Google Scholar]
  2. Wang, F.; Bai, J.; Yang, L.; Rao, B.; Huang, L.B. Analysis of urban air traffic development by exploring new modes of flying car commuting. J. Beijing Inst. Technol. 2023, 43, 665–675. [Google Scholar]
  3. Liu, W.X.; Hou, C.; Yang, Y.L.; Chen, Z.H.; Han, J.; Hu, X.S. Analysis of key performance indicators of electric flying vehicles for urban air traffic. J. Mech. Eng. 2024, 60, 1–19. [Google Scholar]
  4. Xu, K. Nonaqueous liquid electrolytes for lithium-based rechargeable batteries. Chem. Rev. 2004, 104, 4303–4418. [Google Scholar] [CrossRef] [PubMed]
  5. Machín, A.; Morant, C.; Márquez, F. Advancements and Challenges in Solid-State Battery Technology: An In-Depth Review of Solid Electrolytes and Anode Innovations. Batteries 2024, 10, 29. [Google Scholar] [CrossRef]
  6. Cheng, X.B.; Zhang, R.; Zhao, C.Z.; Wei, F.; Zhang, J.G.; Zhang, Q. A review of solid electrolyte interphases on lithium metal anode. Adv. Sci. 2016, 3, 1500213. [Google Scholar] [CrossRef] [PubMed]
  7. Li, G.; Wang, S.; Fu, J.; Liu, Y.; Chen, Z. Manufacturing High-Energy-Density Sulfidic Solid-State Batteries. Batteries 2023, 9, 347. [Google Scholar] [CrossRef]
  8. Ni, J.; Lei, Y.; Han, Y.; Zhang, Y.; Zhang, C.; Geng, Z.; Xiao, Q. Prefabrication of a Lithium Fluoride Interfacial Layer to Enable Dendrite-Free Lithium Deposition. Batteries 2023, 9, 283. [Google Scholar] [CrossRef]
  9. Ramasubramanian, A.; Yurkiv, V.; Foroozan, T.; Ragone, M.; Shahbazian-Yassar, R.; Mashayek, F. Lithium diffusion mechanism through solid–electrolyte interphase in rechargeable lithium batteries. J. Phys. Chem. C 2019, 123, 10237–10245. [Google Scholar] [CrossRef]
  10. Mu, W.; Liu, X.; Wen, Z.; Liu, L. Numerical simulation of the factors affecting the growth of lithium dendrites. J. Energy Storage 2019, 26, 100921. [Google Scholar] [CrossRef]
  11. Verma, P.; Puravankara, S.; Nandanwar, M.N.; Chakraborty, J. Insights into the Morphological Evolution of Mossy Dendrites in Lithium Metal Symmetric and Full Cell: A Modelling Study. J. Electrochem. Soc. 2023, 170, 030529. [Google Scholar] [CrossRef]
  12. Cheng, F.; Hu, Y.; Zhao, L. Analysis of weak solutions for the phase-field model for lithium-ion batteries. Appl. Math. Model. 2020, 78, 185–199. [Google Scholar] [CrossRef]
  13. Ren, Y.; Zhou, Y.; Cao, Y. Inhibit of lithium dendrite growth in solid composite electrolyte by phase-field modeling. J. Phys. Chem. C 2020, 124, 12195–12204. [Google Scholar] [CrossRef]
  14. Arguello, M.E.; Gumulya, M.; Derksen, J.; Utikar, R.; Calo, V.M. Phase-field modeling of planar interface electrodeposition in lithium-metal batteries. J. Energy Storage 2022, 50, 104627. [Google Scholar] [CrossRef]
  15. Jing, H.; Xing, H.; Dong, X.; Han, Y. Nonlinear phase-field modeling of lithium dendritic growth during electrodeposition. J. Electrochem. Soc. 2022, 169, 032511. [Google Scholar] [CrossRef]
  16. Monroe, C.; Newman, J. The impact of elastic deformation on deposition kinetics at lithium/polymer interfaces. J. Electrochem. Soc. 2005, 152, A396. [Google Scholar] [CrossRef]
  17. Chen, L.; Zhang, H.W.; Liang, L.Y.; Liu, Z.; Qi, Y.; Lu, P.; Chen, J.; Chen, L.-Q. Modulation of dendritic patterns during electrodeposition: A nonlinear phase-field model. J. Power Sources 2015, 300, 376–385. [Google Scholar] [CrossRef]
  18. Hong, Z.; Viswanathan, V. Prospect of thermal shock induced healing of lithium dendrite. ACS Energy Lett. 2019, 4, 1012–1019. [Google Scholar] [CrossRef]
  19. Zhang, R.; Shen, X.; Cheng, X.-B.; Zhang, Q. The dendrite growth in 3D structured lithium metal anodes: Electron or ion transfer limitation? Energy Storage Mater. 2019, 23, 556–565. [Google Scholar] [CrossRef]
  20. Shen, X.; Zhang, R.; Shi, P.; Chen, X.; Zhang, Q. How does external pressure shape Li dendrites in Li metal batteries? Adv. Energy Mater. 2021, 11, 2003416. [Google Scholar] [CrossRef]
  21. Zhang, X.; Wang, Q.J.; Harrison, K.L.; Roberts, S.A.; Harris, S.J. Pressure-driven interface evolution in solid-state lithium metal batteries. Cell Rep. Phys. Sci. 2020, 1, 100012. [Google Scholar] [CrossRef]
  22. Yurkiv, V.; Foroozan, T.; Ramasubramanian, A.; Shahbazian-Yassar, R.; Mashayek, F. Phase-field modeling of solid electrolyte interface (SEI) influence on Li dendritic behavior. Electrochim. Acta 2018, 265, 609–619. [Google Scholar] [CrossRef]
  23. Ganser, M.; Hildebrand, F.E.; Klinsmann, M.; Hanauer, M.; Kamlah, M.; McMeeking, R.M. An extended formulation of butler-volmer electrochemical reaction kinetics including the influence of mechanics. J. Electrochem. Soc. 2019, 166, H167. [Google Scholar] [CrossRef]
  24. Geng, X.B.; Li, D.G.; Xu, B. Mechanical stress-thermodynamic phase-field simulation of lithium dendrite growth in solid electrolyte battery. Acta Phys. Sin. 2023, 72, 220201. [Google Scholar] [CrossRef]
  25. Li, Y.; Sha, L.; Lv, P.; Qiu, N.; Zhao, W.; Chen, B.; Hu, P.; Zhang, G. Influences of separator thickness and surface coating on lithium dendrite growth: A phase-field study. Materials 2022, 15, 7912. [Google Scholar] [CrossRef] [PubMed]
  26. Chen, B.; Li, Y.; Wang, D.; Zhao, W.; Zhang, G.; Yu, J.; Sha, L.; Shi, S. Understanding the separator pore size inhibition effect on lithium dendrite via phase-field simulations. Chin. Chem. Lett. 2022, 33, 3287–3290. [Google Scholar]
  27. Jana, A.; García, R.E. Lithium dendrite growth mechanisms in liquid electrolytes. Nano Energy 2017, 41, 552–565. [Google Scholar] [CrossRef]
  28. Gao, X.; Zhou, Y.-N.; Han, D.; Zhou, J.; Zhou, D.; Tang, W.; Goodenough, J.B. Thermodynamic understanding of Li-dendrite formation. Joule 2020, 4, 1864–1879. [Google Scholar] [CrossRef]
  29. Sharon, D.; Bennington, P.; Patel, S.N.; Nealey, P.F. Stabilizing dendritic electrodeposition by limiting spatial dimensions in nanostructured electrolytes. ACS Energy Lett. 2020, 5, 2889–2896. [Google Scholar] [CrossRef]
  30. Qiao, D.; Liu, X.; Wen, Z.; Dou, R.; Zhou, W. Numerical analysis of the inhibition of heating and pulse charging on the growth of lithium dendrites. Energy Storage Sci. Technol. 2022, 11, 1008–1018. [Google Scholar]
  31. Wilkinson, D.; Wainwright, D. In-situ study of electrode stack growth in rechargeable cells at constant pressure. J. Electroanal. Chem. 1993, 355, 193–203. [Google Scholar] [CrossRef]
  32. Louli, A.J.; Genovese, M.; Weber, R.; Hames, S.; Logan, E.; Dahn, J. Exploring the impact of mechanical pressure on the performance of anode-free lithium metal cells. J. Electrochem. Soc. 2019, 166, A1291–A1299. [Google Scholar] [CrossRef]
  33. McDowell, M.T.; Cortes, F.J.Q.; Thenuwara, A.C.; Lewis, J.A. Toward High-Capacity Battery Anode Materials: Chemistry and Mechanics Intertwined. Chem. Mater. 2020, 32, 8755–8771. [Google Scholar] [CrossRef]
  34. Tang, Y.; Zhang, L.; Chen, J.; Sun, H.; Yang, T.; Liu, Q.; Huang, Q.; Zhu, T.; Huang, J. Electro-chemo-mechanics of lithium in solid state lithium metal batteries. Energy Environ. Sci. 2021, 14, 602–642. [Google Scholar] [CrossRef]
  35. Wang, M.J.; Kazyak, E.; Dasgupta, N.P.; Sakamoto, J. Transitioning solid-state batteries from lab to market: Linking electro-chemo-mechanics with practical considerations. Joule 2021, 5, 1371–1390. [Google Scholar] [CrossRef]
  36. Shen, X.; Zhang, R.; Zhao, C.; Wu, P.; Zhang, Y.T.; Zhang, J.D.; Fan, L.Z.; Liu, Q.B.; Chen, A.B.; Zhang, Q. Progress in the medium force-electrochemical mechanism of lithium metal batteries. Energy Storage Sci. Technol. 2022, 11, 2781–2797. [Google Scholar]
Figure 1. Energy density roadmap for aerospace battery products.
Electronics 13 01505 g001
Figure 2. Test battery parameters, (a) battery anode and cathode materials, (b) battery weight, (c) battery energy density.
Electronics 13 01505 g002
Figure 3. Cycle characteristics of lithium metal batteries. (a) Changes in battery capacity and energy attenuation, (b) changes in battery internal resistance.
Electronics 13 01505 g003
Figure 4. Experimental platform.
Electronics 13 01505 g004
Figure 5. The test results of lithium metal batteries under different initial pressures. (a) The internal resistance of the battery under different pressures, (b) the surface pressure change during the battery charging and discharging process, (c) the maximum pressure change in the battery surface at 0.5 MPa initial pressure, (d) the maximum pressure change in the battery surface at 2.0 MPa initial pressure.
Electronics 13 01505 g005
Figure 6. SEM scanning results of the cells at different pressures. (a,c) are the surface morphologies of the lithium metal anode under the initial pressure of 0.5 MPa and 2.0 MPa, respectively; (b,d) are morphologies with the red region enlarged by 20 times in (a,c), respectively.
Electronics 13 01505 g006aElectronics 13 01505 g006b
Figure 7. Field simulation results of lithium dendrites without external pressure. (a) Phase-field parameters, (b) lithium-ion concentration, (c) potential.
Electronics 13 01505 g007
Figure 8. Phase-field simulation results of lithium dendrites under different electrolyte diffusion coefficients. (a) Lithium deposition morphology under different electrolyte diffusion coefficients, (b) schematic diagram of diaphragm and migration process, (c) migration curvature of lithium dendrite in diaphragm under different diffusion coefficients.
Electronics 13 01505 g008
Figure 9. The results of the influence of pressure on lithium deposition morphology under different electrolyte diffusion coefficients. (a,b) represent the variation in lithium dendrite growth morphology with external pressure when the electrolyte diffusion coefficient is 100 × 10−15 m2/s and 10 × 10−15 m2/s, respectively. (c) is the change in lithium dendrite migration curvature with external pressure when the electrolyte diffusion coefficient is 100 × 10−15 m2/s. (d) is the variation in lithium dendrite migration curvature with external pressure under different electrolyte diffusion coefficients.
Electronics 13 01505 g009aElectronics 13 01505 g009b
Table 1. Coupled model parameter values.
ParameterSymbolNumeric ValueReferences
Electrode interface mobility L 1 10−6 [m3·(J*s)−1][25,26]
Mobility at the diaphragm interface L 2 5 × 10⁻⁷ [m3·(J*s)−1][26]
Constant of action L η 0.5 [s−1][25,26]
Energy gradient coefficient k 0 1.5 × 10⁻⁶ [J·m−1][25,26]
Barrier height w ξ 1   w ξ 2   w ξ 12 3.5 × 10⁵ [J·m−3][25,26]
Intensity of anisotropy δ 0.03[25,26]
Anisotropic modulus ω 4[25,26]
Symmetric factor α 0.5[25,26]
Initial electrolyte concentration c 0 1 × 10³ [mol·m−3][25,26]
Initial lithium atom concentration in lithium metal c s 7.69 × 10⁴ [mol·m−3][25,26]
Electrode diffusion coefficient D e 1 × 10⁻¹³ [m2·s−1][25,26]
Electrolyte diffusion coefficient D s 1 × 10⁻¹³ [m2·s−1][25,26]
Electrode conductivity σ e 107 [S·m−1][25,26]
Electrolytic conductivity σ s 0.1 [S·m−1][25,26]
Electrode Young’s modulus E e 7.8 [GPa][20]
Electrolyte Young’s modulus E s 1.0 [GPa][20]
Electrode Poisson ratio V e 0.42[20]
Electrolyte Poisson ratio V s 0.3[20]
Vegard Strain coefficient λ i −8.66 × 10⁻⁴
−7.73 × 10⁻⁴
−5.29 × 10⁻⁴
[20]
Disclaimer/Publisher’s Note: The statements, opinions and data contained in all publications are solely those of the individual author(s) and contributor(s) and not of MDPI and/or the editor(s). MDPI and/or the editor(s) disclaim responsibility for any injury to people or property resulting from any ideas, methods, instructions or products referred to in the content.