Article

Several Approaches for the Prediction of the Operating Modes of a Wind Turbine

by
Hannah Yun
1,
Ciprian Doru Giurcăneanu
1,* and
Gillian Dobbie
2
1
Department of Statistics, University of Auckland, Auckland 1142, New Zealand
2
School of Computer Science, University of Auckland, Auckland 1142, New Zealand
*
Author to whom correspondence should be addressed.
Electronics 2024, 13(8), 1504; https://doi.org/10.3390/electronics13081504
Submission received: 29 February 2024 / Revised: 3 April 2024 / Accepted: 10 April 2024 / Published: 15 April 2024

Abstract

:
Growing concern about climate change has intensified efforts to use renewable energy, with wind energy highlighted as a growing source. It is known that wind turbines are characterized by distinct operating modes that reflect production efficiency. In this work, we focus on the forecasting problem for univariate discrete-valued time series of operating modes. We define three prediction strategies to overcome the difficulties associated with missing data. These strategies are evaluated through experiments using five forecasting methods across two real-life datasets. Two of the forecasting methods have been introduced in the statistical literature as extensions of the well-known context algorithm: variable length Markov chains and Bayesian context tree. Additionally, we consider a Bayesian method based on conditional tensor factorization and two different smoothers from the classical tools for time series forecasting. After evaluating each pair prediction strategy/forecasting method in terms of prediction accuracy versus computational complexity, we provide guidance on the methods that are suitable for forecasting the time series of operating modes. The prediction results that we report demonstrate that high accuracy can be achieved with reduced computational resources.

1. Introduction

1.1. Background and Previous Works

Over the last few decades, efforts for transition to renewable energy have intensified due to growing concern about climate change [1]. As a result, renewable power has continuously grown its competitiveness in pricing and electricity generation [2,3]. Wind energy, in particular, is recognized as a leading renewable power, followed by hydropower [3].
The graph that represents electrical power output (expressed in k W or M W ) versus wind speed (expressed in m / s ), which is termed power curve, has a crucial role in the assessment of the performance of a wind turbine. While the nominal power curve is provided by the manufacturer of the wind turbine [4], in practice, the power curve is estimated from the measurements that are available. For example, in the version of the standard IEC61400-12-1 [5] from 2005, it was recommended that at least 180 h of 10 min averaged data shall be used for estimating the power curve. In order to reduce the measurement period, it was proposed in [6] a method that utilizes high-frequency data and is based on the Langevin differential equations for diffusive Markov processes. The results of an extensive empirical study that evaluates the so-called Langevin method can be found in [7].
The estimation procedure from the IEC standard [5] is simple and relies on the binning of the data. More precisely, the positive quadrant of the plane is partitioned into bins for which the width of the horizontal edge equals 0.5   m / s . Each such bin can be further partitioned into smaller bins whose height is fixed, for example, to a value in the range 10– 50 k W . For each such bin, the average power is estimated as the mean of the measurements that lie on that bin (see also [7]).
Numerous studies have shown that the use of one single variable (wind speed) in the modeling of the power curve leads to inaccurate results (see [8] and the version of the standard IEC61400-12-1 from 2017 [5]). Hence, it was proposed that wind direction, air density, turbulence intensity, and other environmental parameters be included in the model. The interested reader can find in [9] and the references therein an extensive discussion on the use of those variables. In the same work, it was pointed out that the generating capacity of the wind turbine is also influenced by the equipment’s health deterioration.
Apart from the aspect that the traditional method for the estimation of the power curve does not take into consideration all the relevant variables, it has another limitation, which comes from the fact it was designed to evaluate the performance of an isolated wind turbine. As many wind turbines operate under waked conditions because of the way in which they are clustered in the wind farms, the model for the isolated wind turbine is sub-optimal. A possible solution to this problem is presented in [10].
There exists an impressive body of research works that are focused on the estimation of the power curve from the data. As it is not possible to discuss all of them here, we pay special attention to some of the recent works that make use of Supervisory Control and Data Acquisition (SCADA) data. In such cases, the challenges stem from the difficulty of analyzing, for each wind turbine, tens or hundreds of time series that are collected for the endogenous variables (related to the equipment health) as well as for the exogenous variables (related to the environmental parameters).
According to the method that was proposed in [11] and further extended in [12], an involved discretization procedure can be employed for converting the information from a large number of available time series into a set of discrete-valued time series. Another discretization scheme, whose core component is the polynomial least absolute shrinkage and selection operator (LASSO) regression, was introduced in [13].
The set of the discrete-valued time series comprises exactly one time series for each wind turbine in the fleet. We emphasize that the discrete-valued time series for a particular wind turbine is obtained by considering the measurements for that wind turbine as well as the measurements that are available for the other wind turbines from the fleet. Each discrete-valued time series is a sequence of symbols from an alphabet that contains a small number of letters, usually three or four letters. Moreover, each such letter (or, equivalently, label) represents one of the operating modes of the wind turbine.
For a better understanding of the notion of operating mode, we resort to the traditional interpretation of various regions of the power curve. For instance, according to [4], the first region corresponds to the values of the wind speed that are too low for the wind turbine to produce electricity. After the wind speed reaches a minimum threshold (cut-in speed), the electrical power output increases in a nonlinear manner when the wind speed rises to the point where it reaches a maximum threshold (cut-out speed). This is the second region of the power curve. The third region corresponds to the values of the wind speed that are greater than the maximum threshold. In this region, the electrical power output is capped for the safety of the wind turbine. For the sake of clarity, we mention that the minimum threshold is approximately 5 m / s and the maximum threshold is approximately 9 m / s (see, for example, [13]).
It is remarkable that the control problem for the wind turbines is also formulated by considering these regions. We refer to [14] for the formulation of the control problem. Note that, in [14], the number of regions is four instead of three. The most important point is that the operating modes found by the discretization process resemble the regions used in the wind turbine control.

1.2. Forecasting Problem

Interestingly enough, the time series of symbols, which represent the operating modes of the wind turbine, have been used so far mainly as a visualization tool. In this work, we investigate how the future operating mode can be predicted from the present and the past operating modes. To this end, we apply forecasting methods that are suitable for univariate time series. It is well known that the family of forecasting methods devised for the discrete-valued time series is much smaller than the family of methods for real-valued time series. For more clarifications on this point, we refer to [15].
The time series that are of interest to us can be regarded as categorical time series. We note that Reference [15] suggests the use of parsimoniously parameterized Markov chains for the predictive modeling of the time series of this type; it mentions explicitly variable-length Markov chains (VLMC) [16]. However, the VLMC is based on the context algorithm (CA), which was invented by Rissanen and was originally presented in the information theory literature as a device for data compression [17]. In this study, we apply the VLMC as well as a new method, which was recently introduced in [18]. The method is termed the Bayesian context tree (BCT) and combines the features of the CA with those of the Bayesian statistics. Another Bayesian method that we employ is conditional tensor factorization (CTF), which was originally proposed in [19].
We extend the class of the methods that we use by considering two classical smoothing methods: the exponential smoother (ETS) [20] and the version of the Whittaker smoother (WS) from [21]. We mention that the two smoothers have not been designed for discrete-valued time series. We have selected them because ETS has been previously used in many practical applications, and WS has been designed for time series with missing data.
The most important challenge in the forecasting of the operating modes arises from the fact that the data sequences used in prediction are not complete. Apart from WS, all the methods listed above cannot be applied straightforwardly to time series with missing data. In order to address this problem, we propose three different prediction strategies.

1.3. Main Contributions and the Organization of the Paper

According to the best of our knowledge, the problem of prediction for the sequences of operating modes has not been addressed so far. In this study, we propose solutions to this problem as follows:
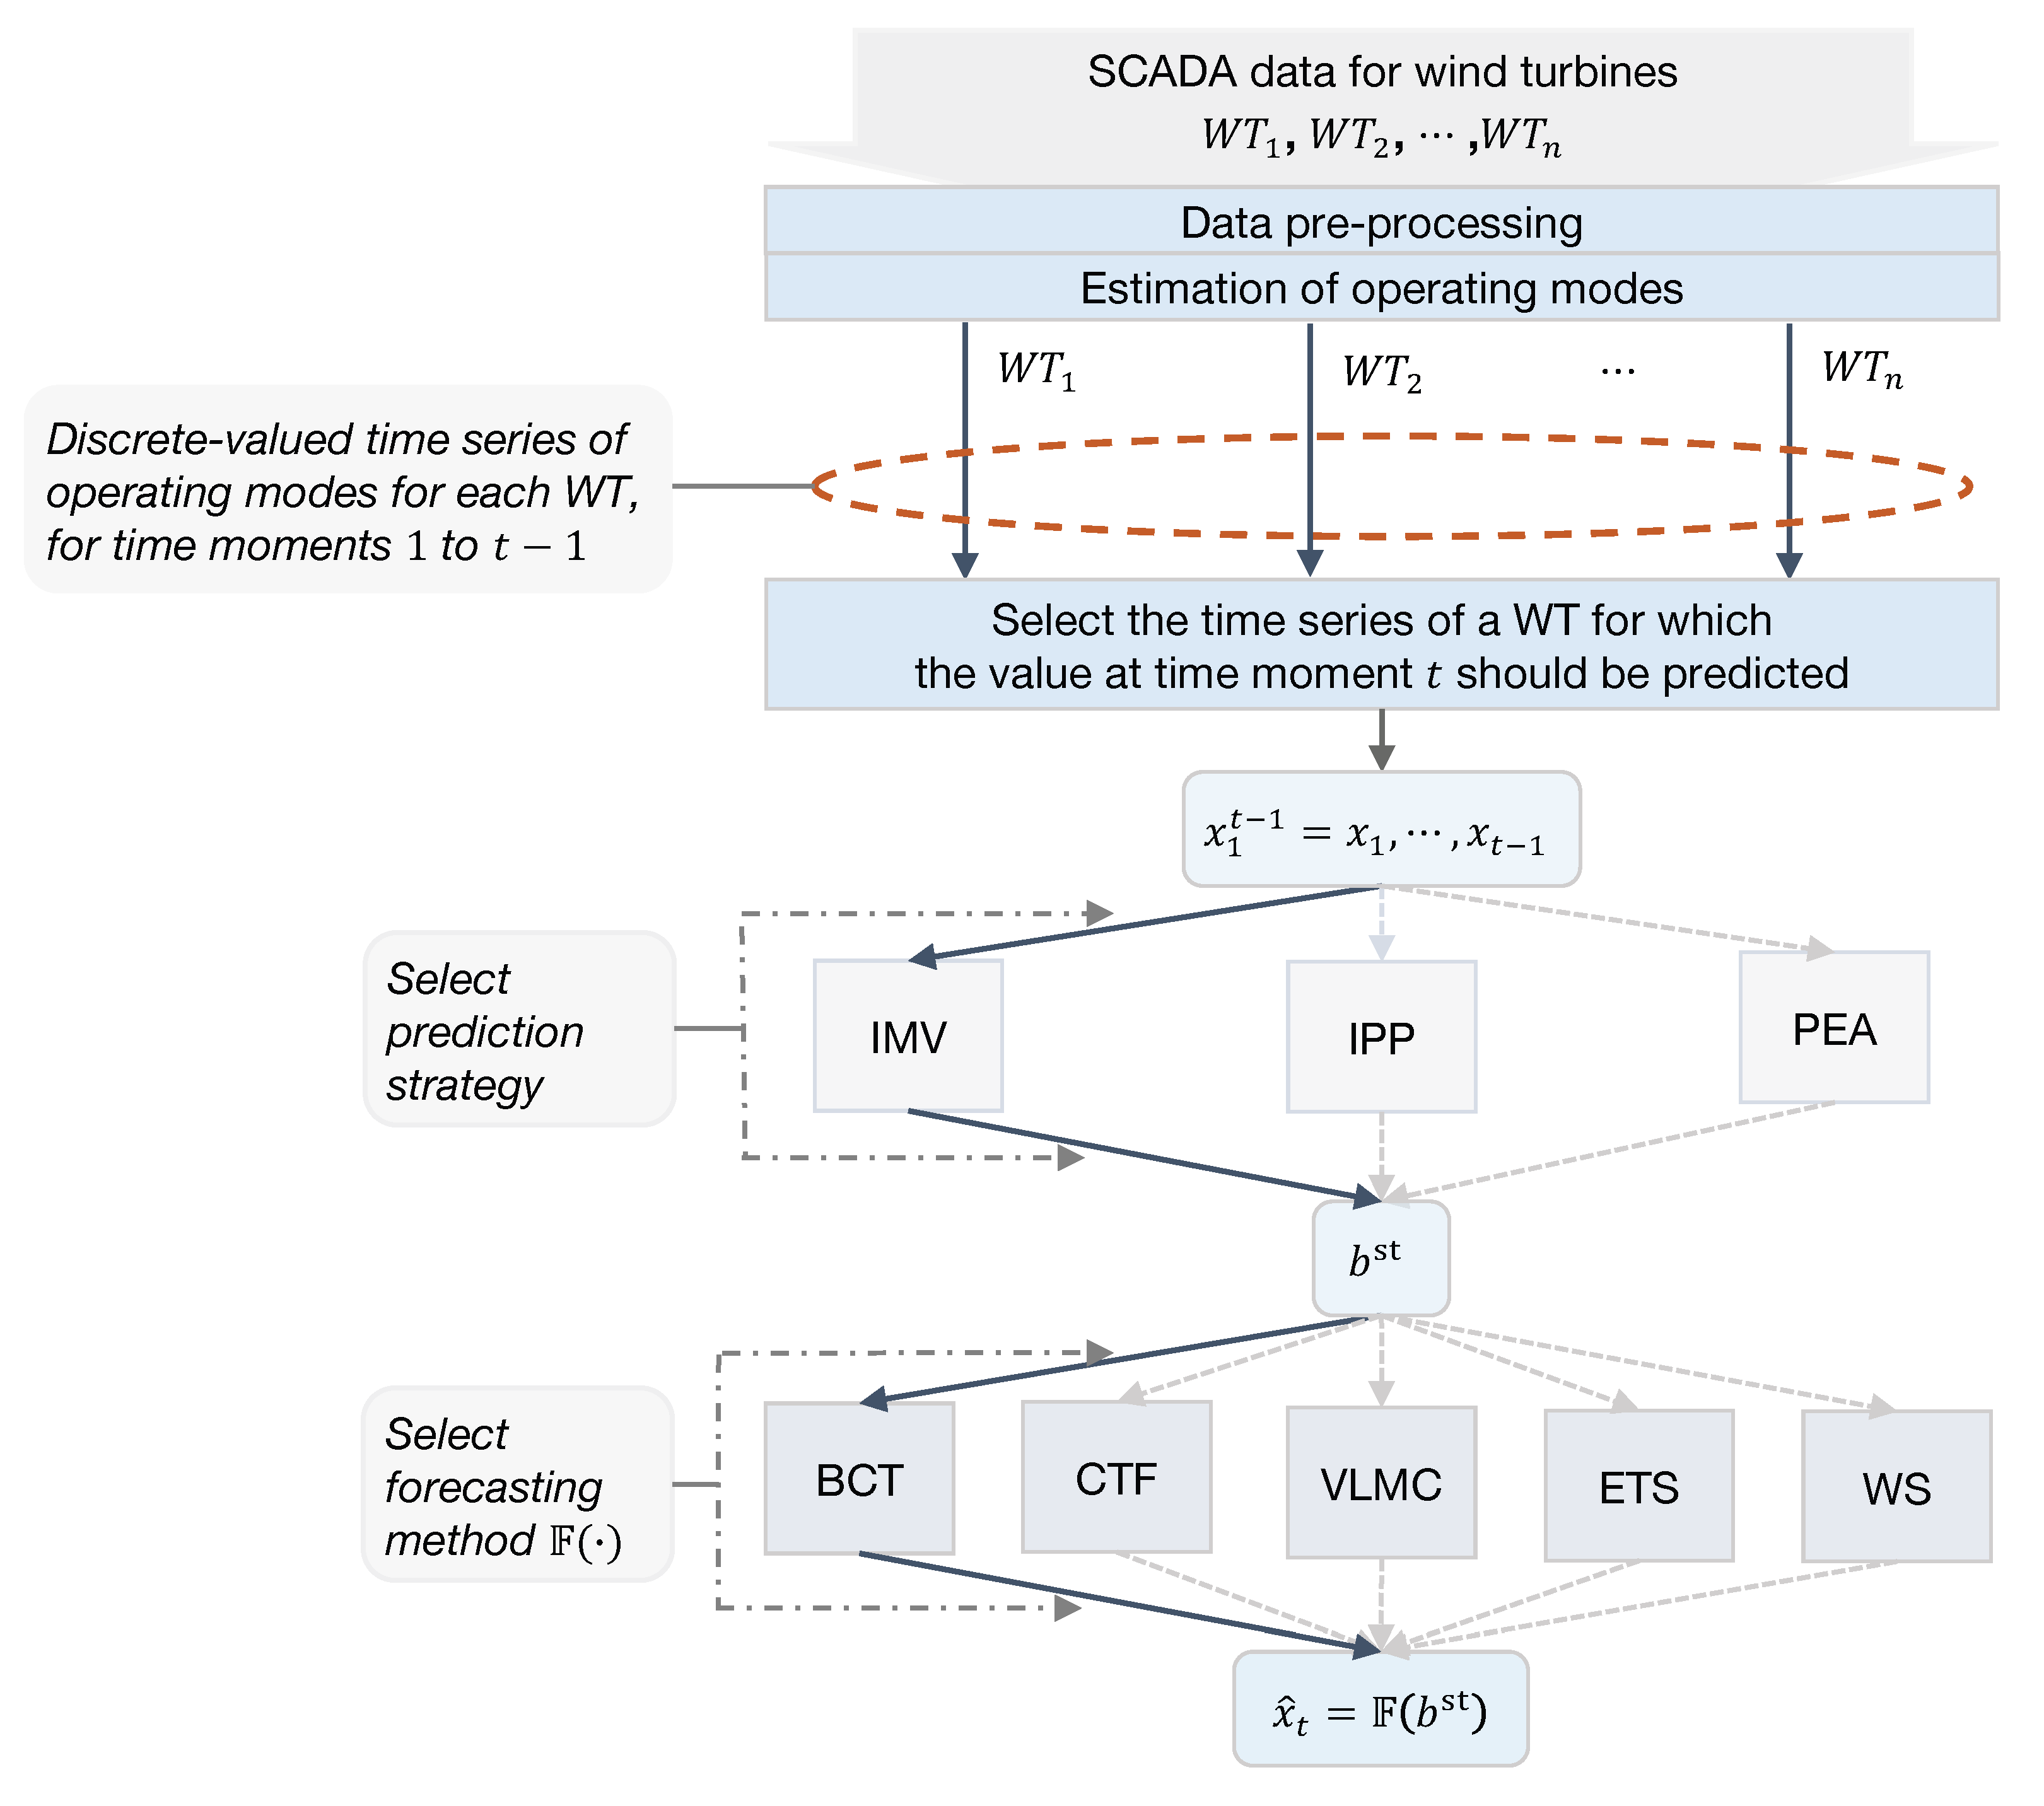
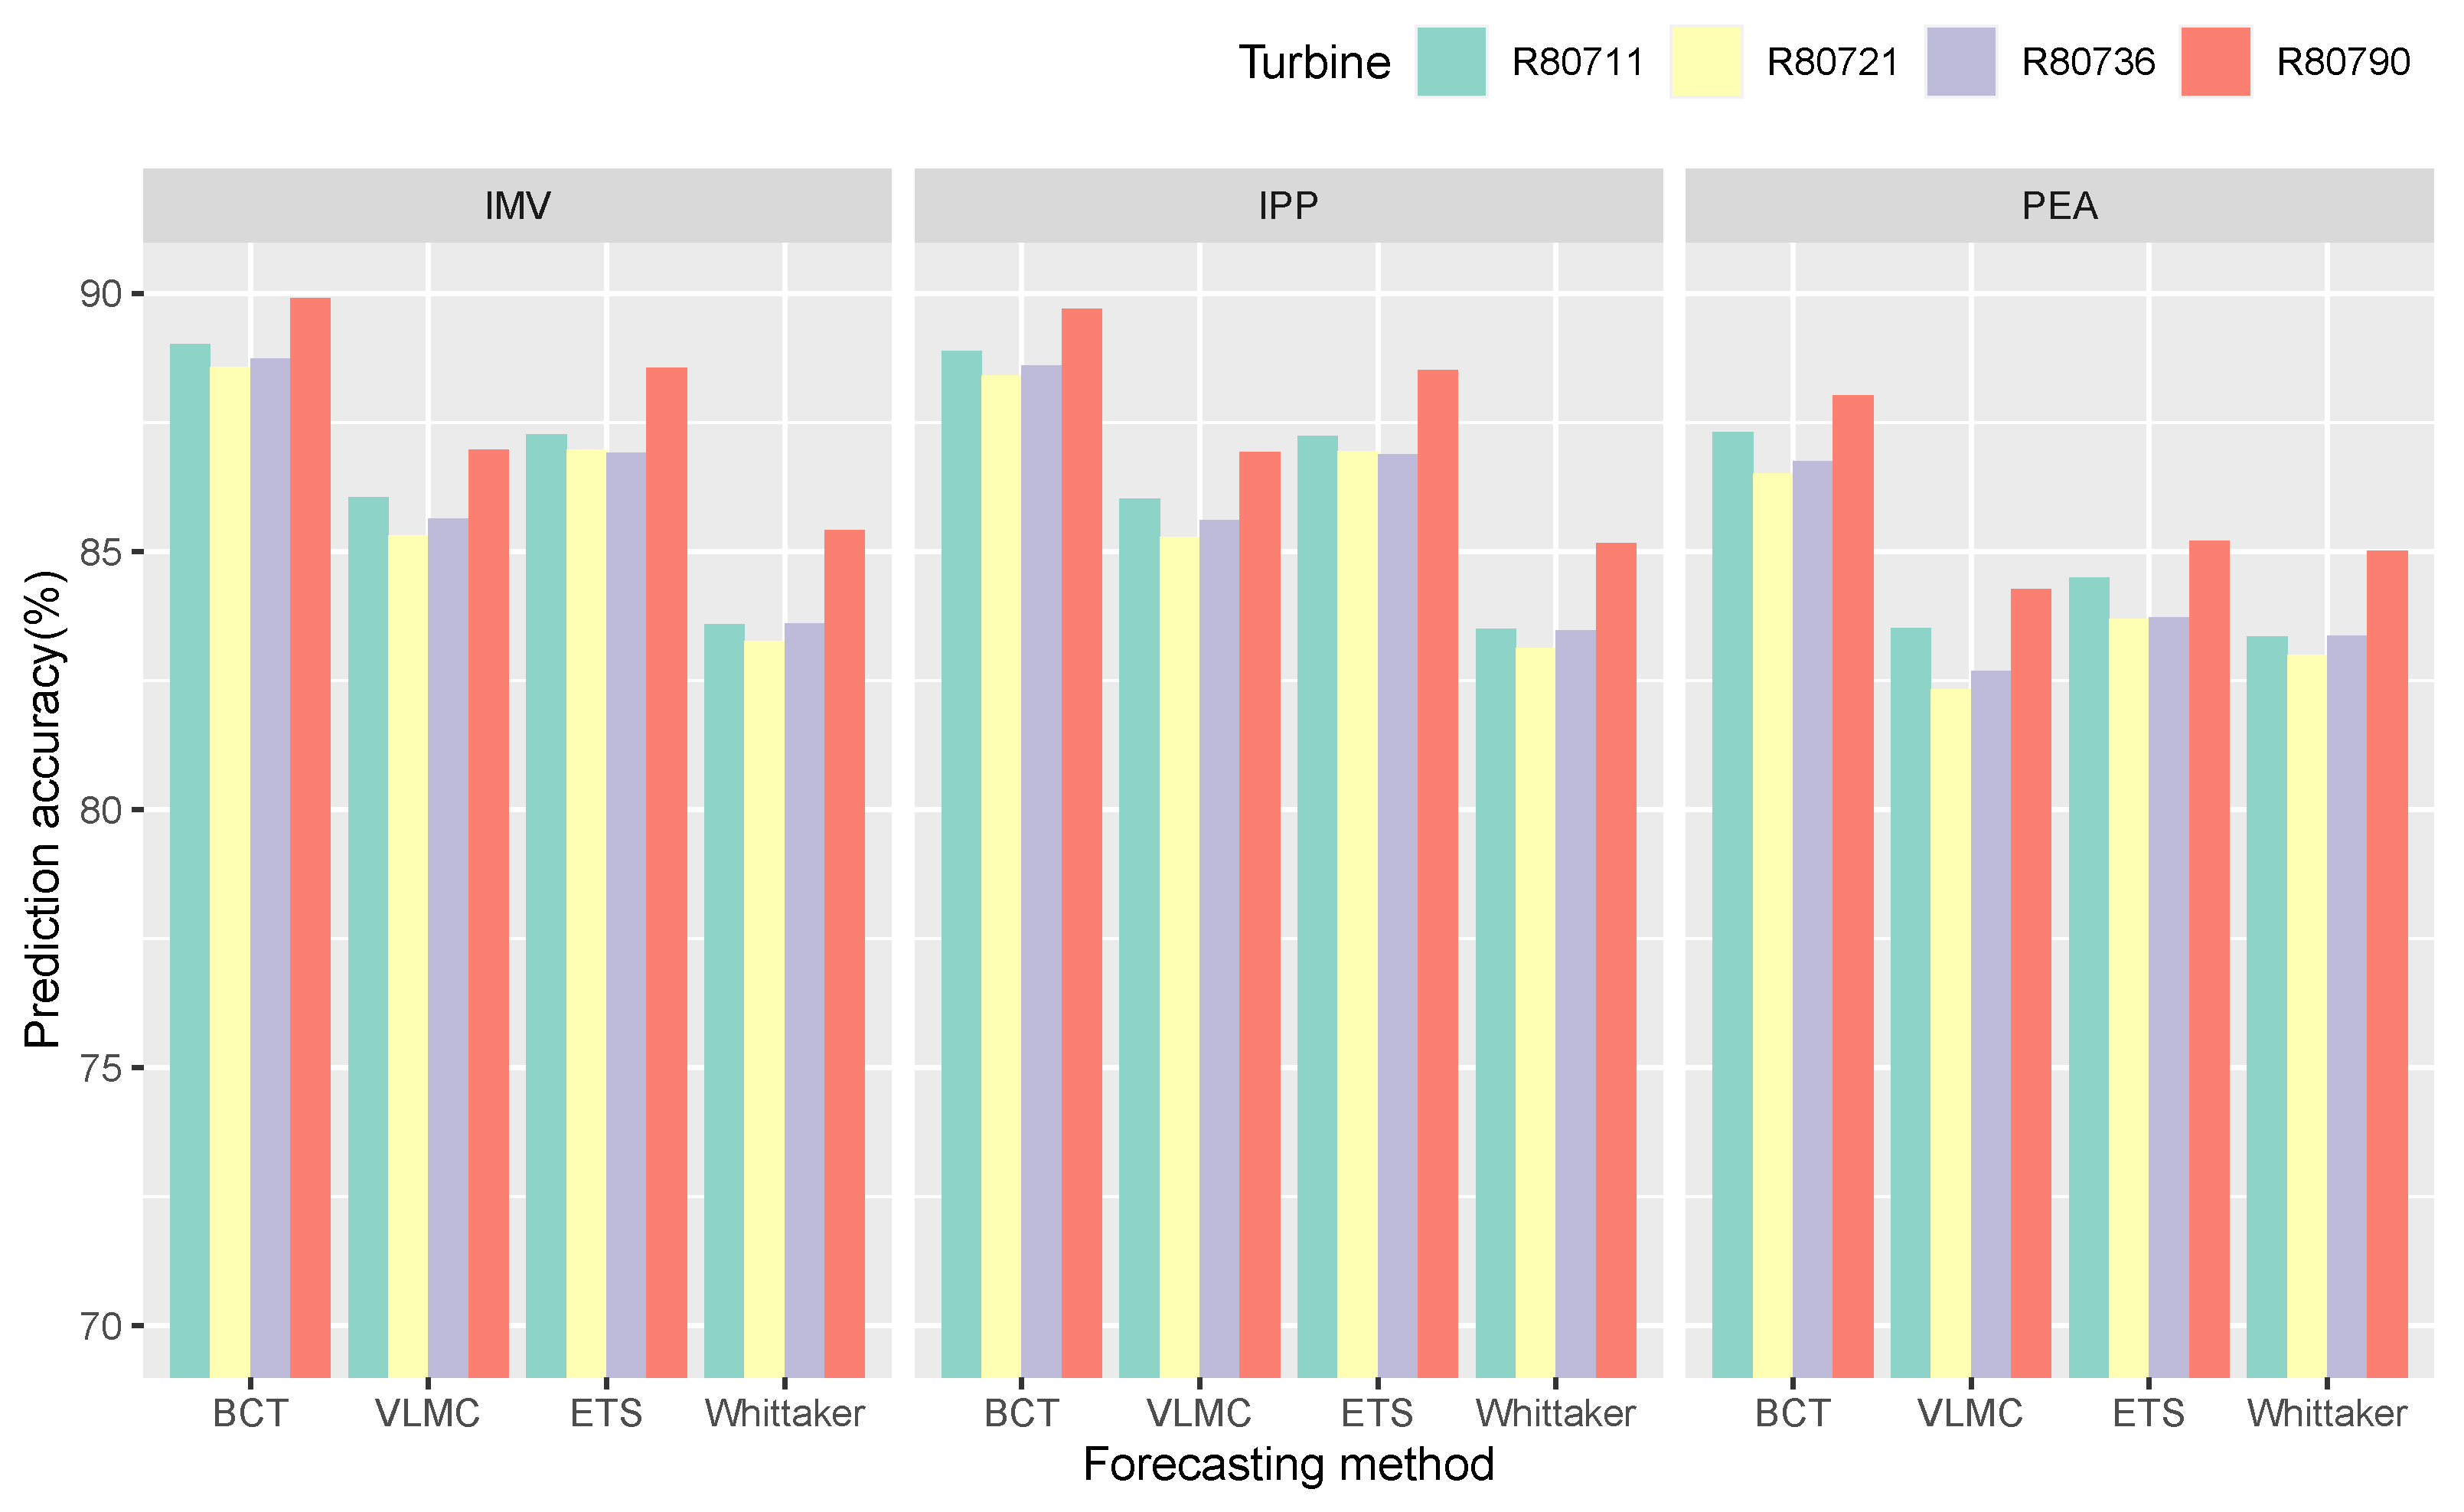
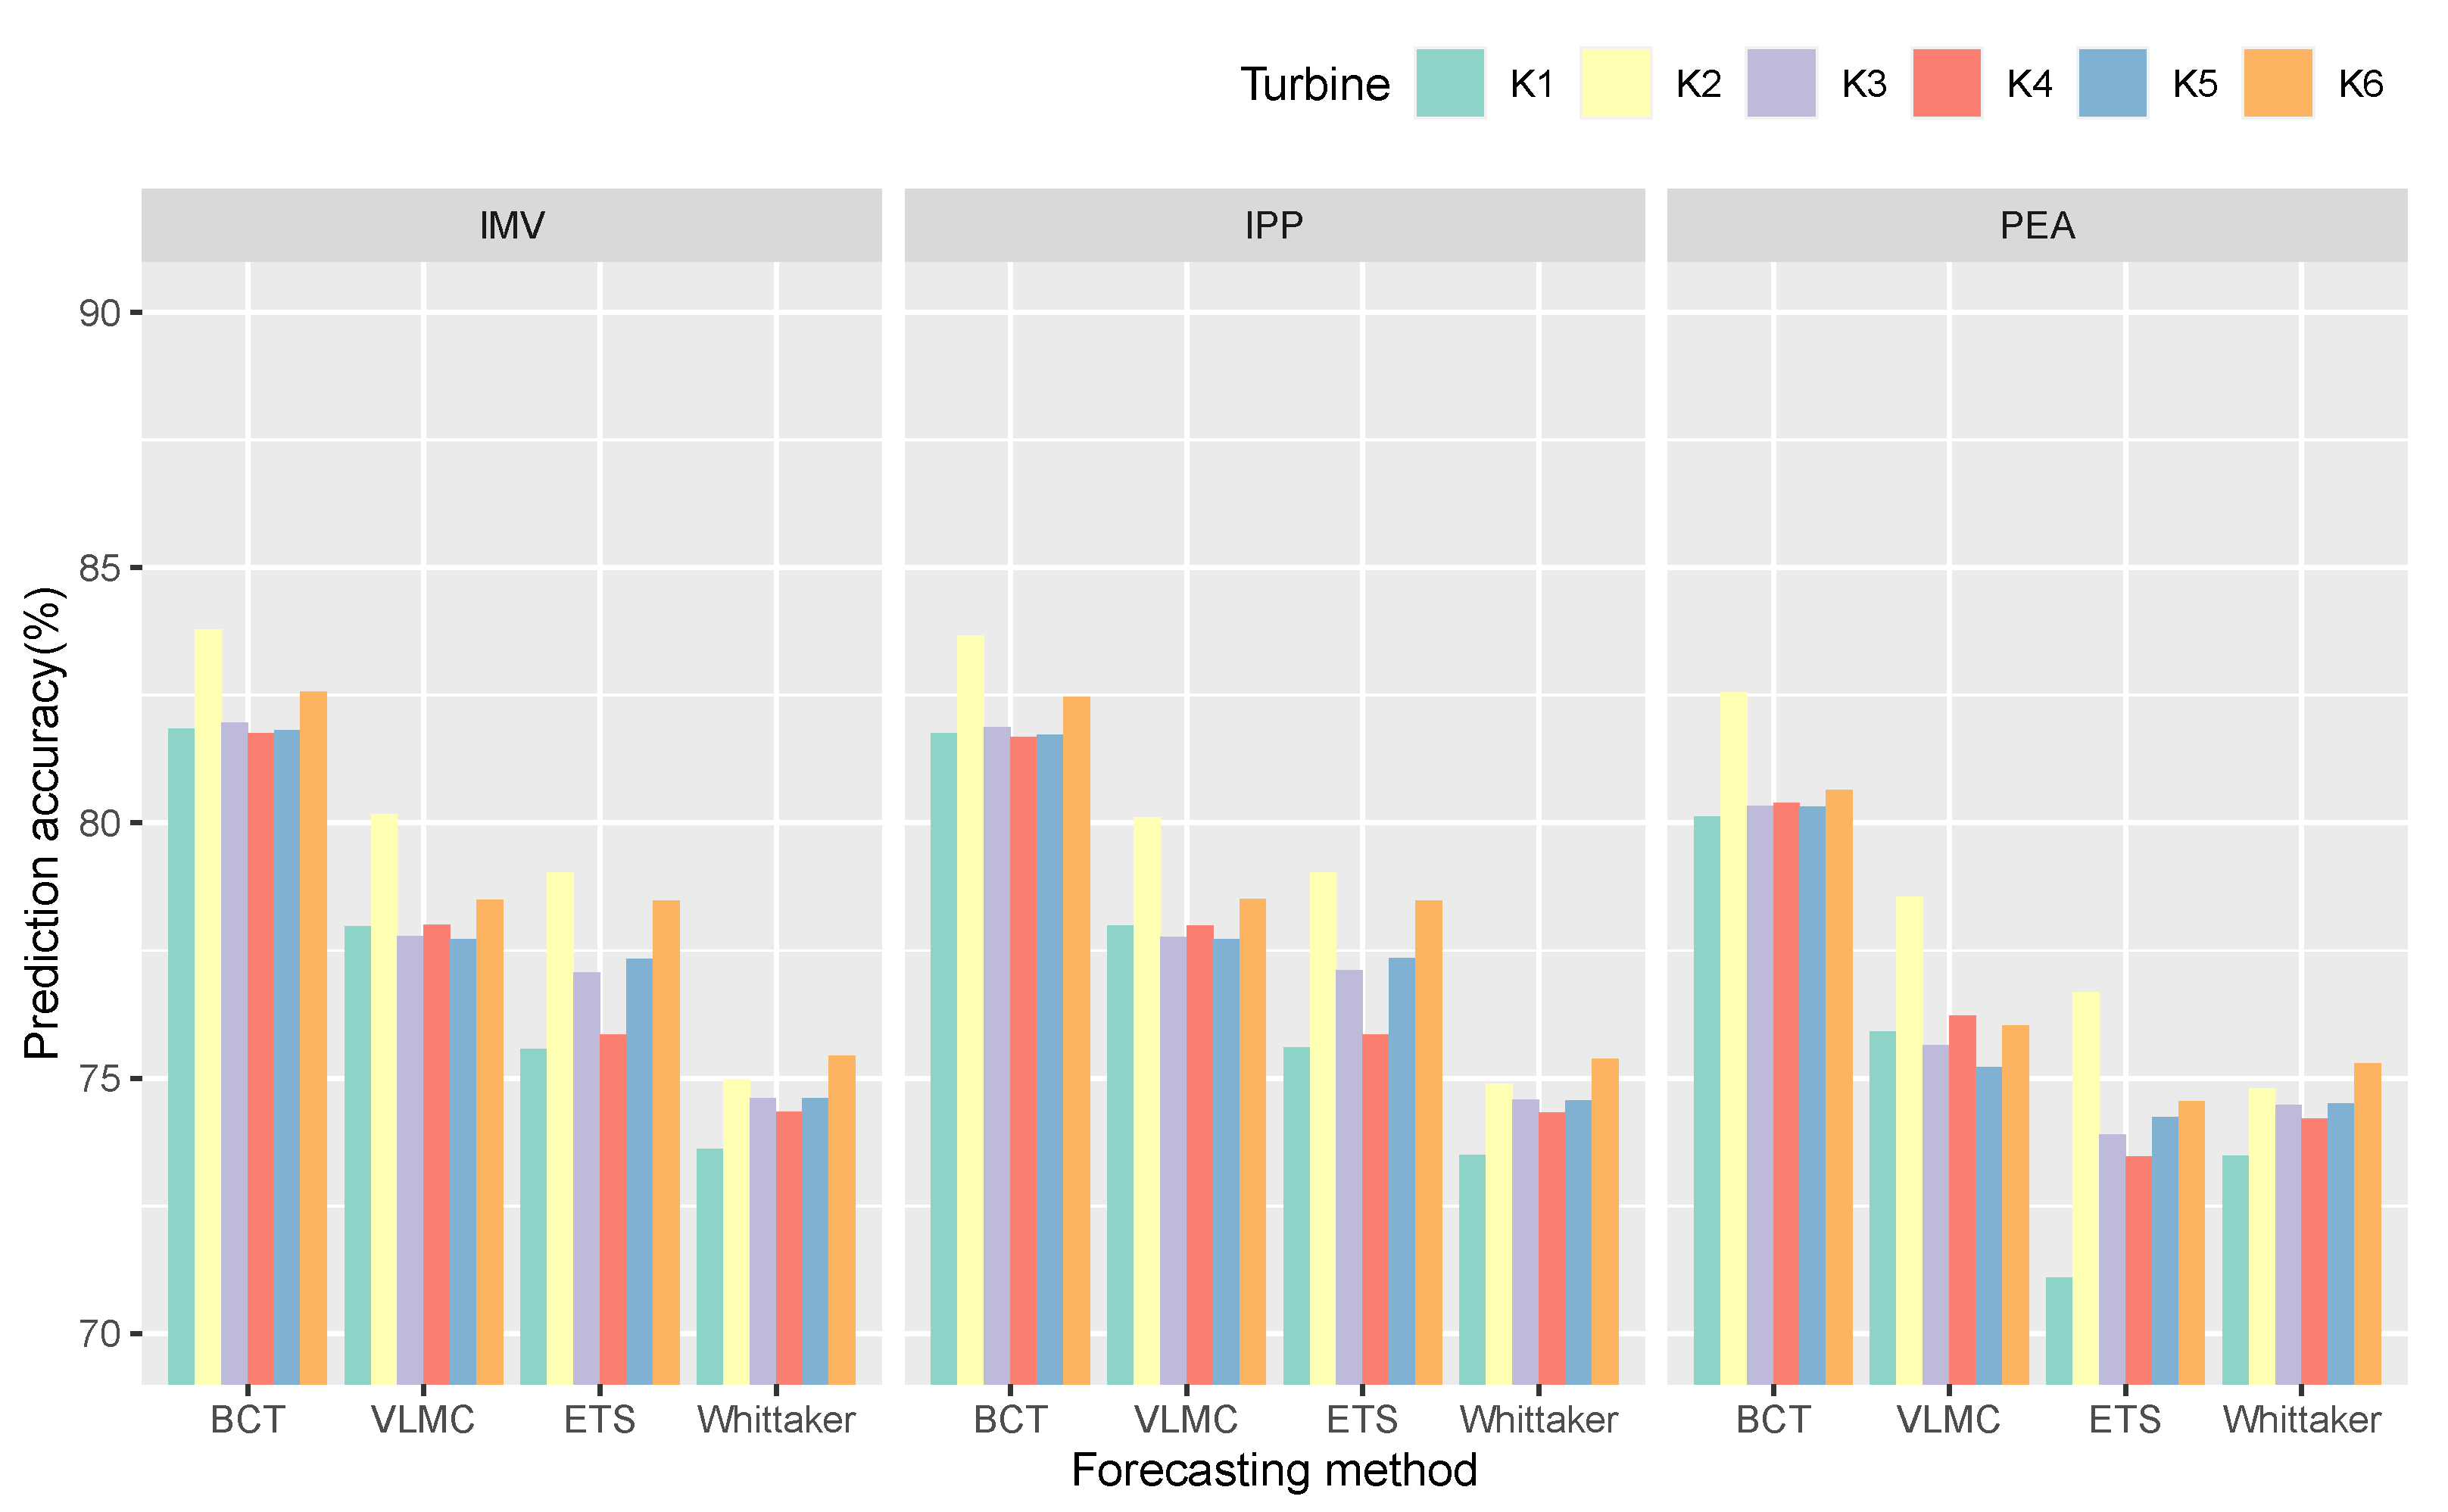
  • To circumvent the difficulties related to missing data, we define three prediction strategies, which are dubbed as follows: ignore missing values (IMV), imputation and prediction (IPP), and prediction with extended alphabet (PEA). The main difference between strategies consists in the way in which they use the past samples x 1 t 1 = x 1 , , x t 1 of a discrete-valued time series with missing values for predicting the value of x t . In practice, each strategy st selects in a different manner the most relevant samples from the past that should be used in the forecasting of x t and stores them in the buffer b st . The length of the buffer is the same for all strategies, but the data stored in the buffer are different.
  • These strategies are applied in conjunction with five different forecasting methods (BCT, VLMC, CTF, ETS, WS) in experiments conducted on two datasets. If we suppose that the operator F ( · ) stands for the forecasting method that we apply, then the predicted value is x ^ t = F ( b st ) . For clarity, we provide in Figure 1 a graphical representation of the steps that are needed for finding the predicted operating mode x ^ t for a particular turbine starting from the SCADA data available for the turbines in the wind farm.
  • The comparison of the prediction results allows us to draw conclusions on the prediction accuracy and computational burden for each pair strategy/method.
The rest of this paper is organized as follows. In Section 2.1, we describe the real-life datasets that we use. Then, we present the pre-processing data stage in Section 2.2 and explain in Section 2.3 how the estimates of the operating modes are obtained. This gives a clear picture of the percentage of the missing data and their patterns in the sequences of the operating modes. The prediction strategies are outlined in Section 2.4, and the forecasting methods are presented briefly in Section 2.5. Section 3 is devoted to the experimental results and their interpretation. Section 4 concludes the paper.

2. Materials and Methods

2.1. Data

We utilize data from two distinct wind farm datasets. The first dataset is from the La Haute Borne wind farm in France, which is owned by Engie [22]. This dataset features four wind turbines named R80711, R80721, R80736, and R80790. For each turbine, the dataset contains measurements for a total of 137 endogenous and exogenous parameters, such as wind speed, torque, rotor speed, and ambient temperature. These measurements were recorded at 10 min intervals from January 2013 to December 2016. It is observed that each turbine occasionally experiences recording failures, resulting in missing data. A point to note is that R80790 includes a significant data loss between 2013 and 2014.
The second dataset is from the Kelmarsh wind farm, located in the United Kingdom and owned by Blue Energy [23]. The dataset comprises measurements for a total of 299 parameters, including energy export, power factor, and hub temperature, spanning from January 2017 to June 2021. The sampling period is also 10 min. Therefore, the number of available data points for this dataset is larger than for the first dataset. This dataset features six wind turbines. Since the turbines in the dataset are not named, we call them K 1 , , K 6 in our analysis.

2.2. Data Pre-Processing

Prior to implementing an approach for deriving the operating modes, it is essential to pre-process the data to obtain a clean dataset for the experiment. We adopt the method proposed by Dhont et al. [11], which highlights three main techniques for data pre-processing: (i) eliminating parameters that are similar, (ii) removing measurements that are deemed to be outliers, and (iii) standardizing data. While the approach remains fundamentally the same, its application is tailored to each dataset to accommodate variables in different formats, resulting in variation in the specific processing details.
(i)
Eliminating similar parameters: (1) A variable may be represented by various attributes. For example, the wind speed variable encompasses its mean, maximum, minimum, and standard deviation. We discard parameters that do not align with our purpose of the analysis, which is forecasting operating modes. Consequently, we retain only the mean value; (2) Multiple sensors monitor the same variable. For example, two anemometers are installed on the nacelle of a wind turbine to monitor the wind speed. In this case, we use the average value of the two anemometers, which is also given in the dataset; (3) Within a wind turbine, certain variables, like generator converter speed, generator speed, and rotor speed, are interconnected. Including all these parameters can lead to over-fitting, so one variable from each group of similar data is chosen when estimating the operating modes. A point to note is that the ‘torque’ variable is absent in the Kelmarsh wind farm dataset. To rectify this, we generate the values for the torque variable, T, using power P and rotor speed ω (expressed in radians/s), with the following formula: T = P / ω [14]. This ensures consistent comparisons across datasets.
(ii)
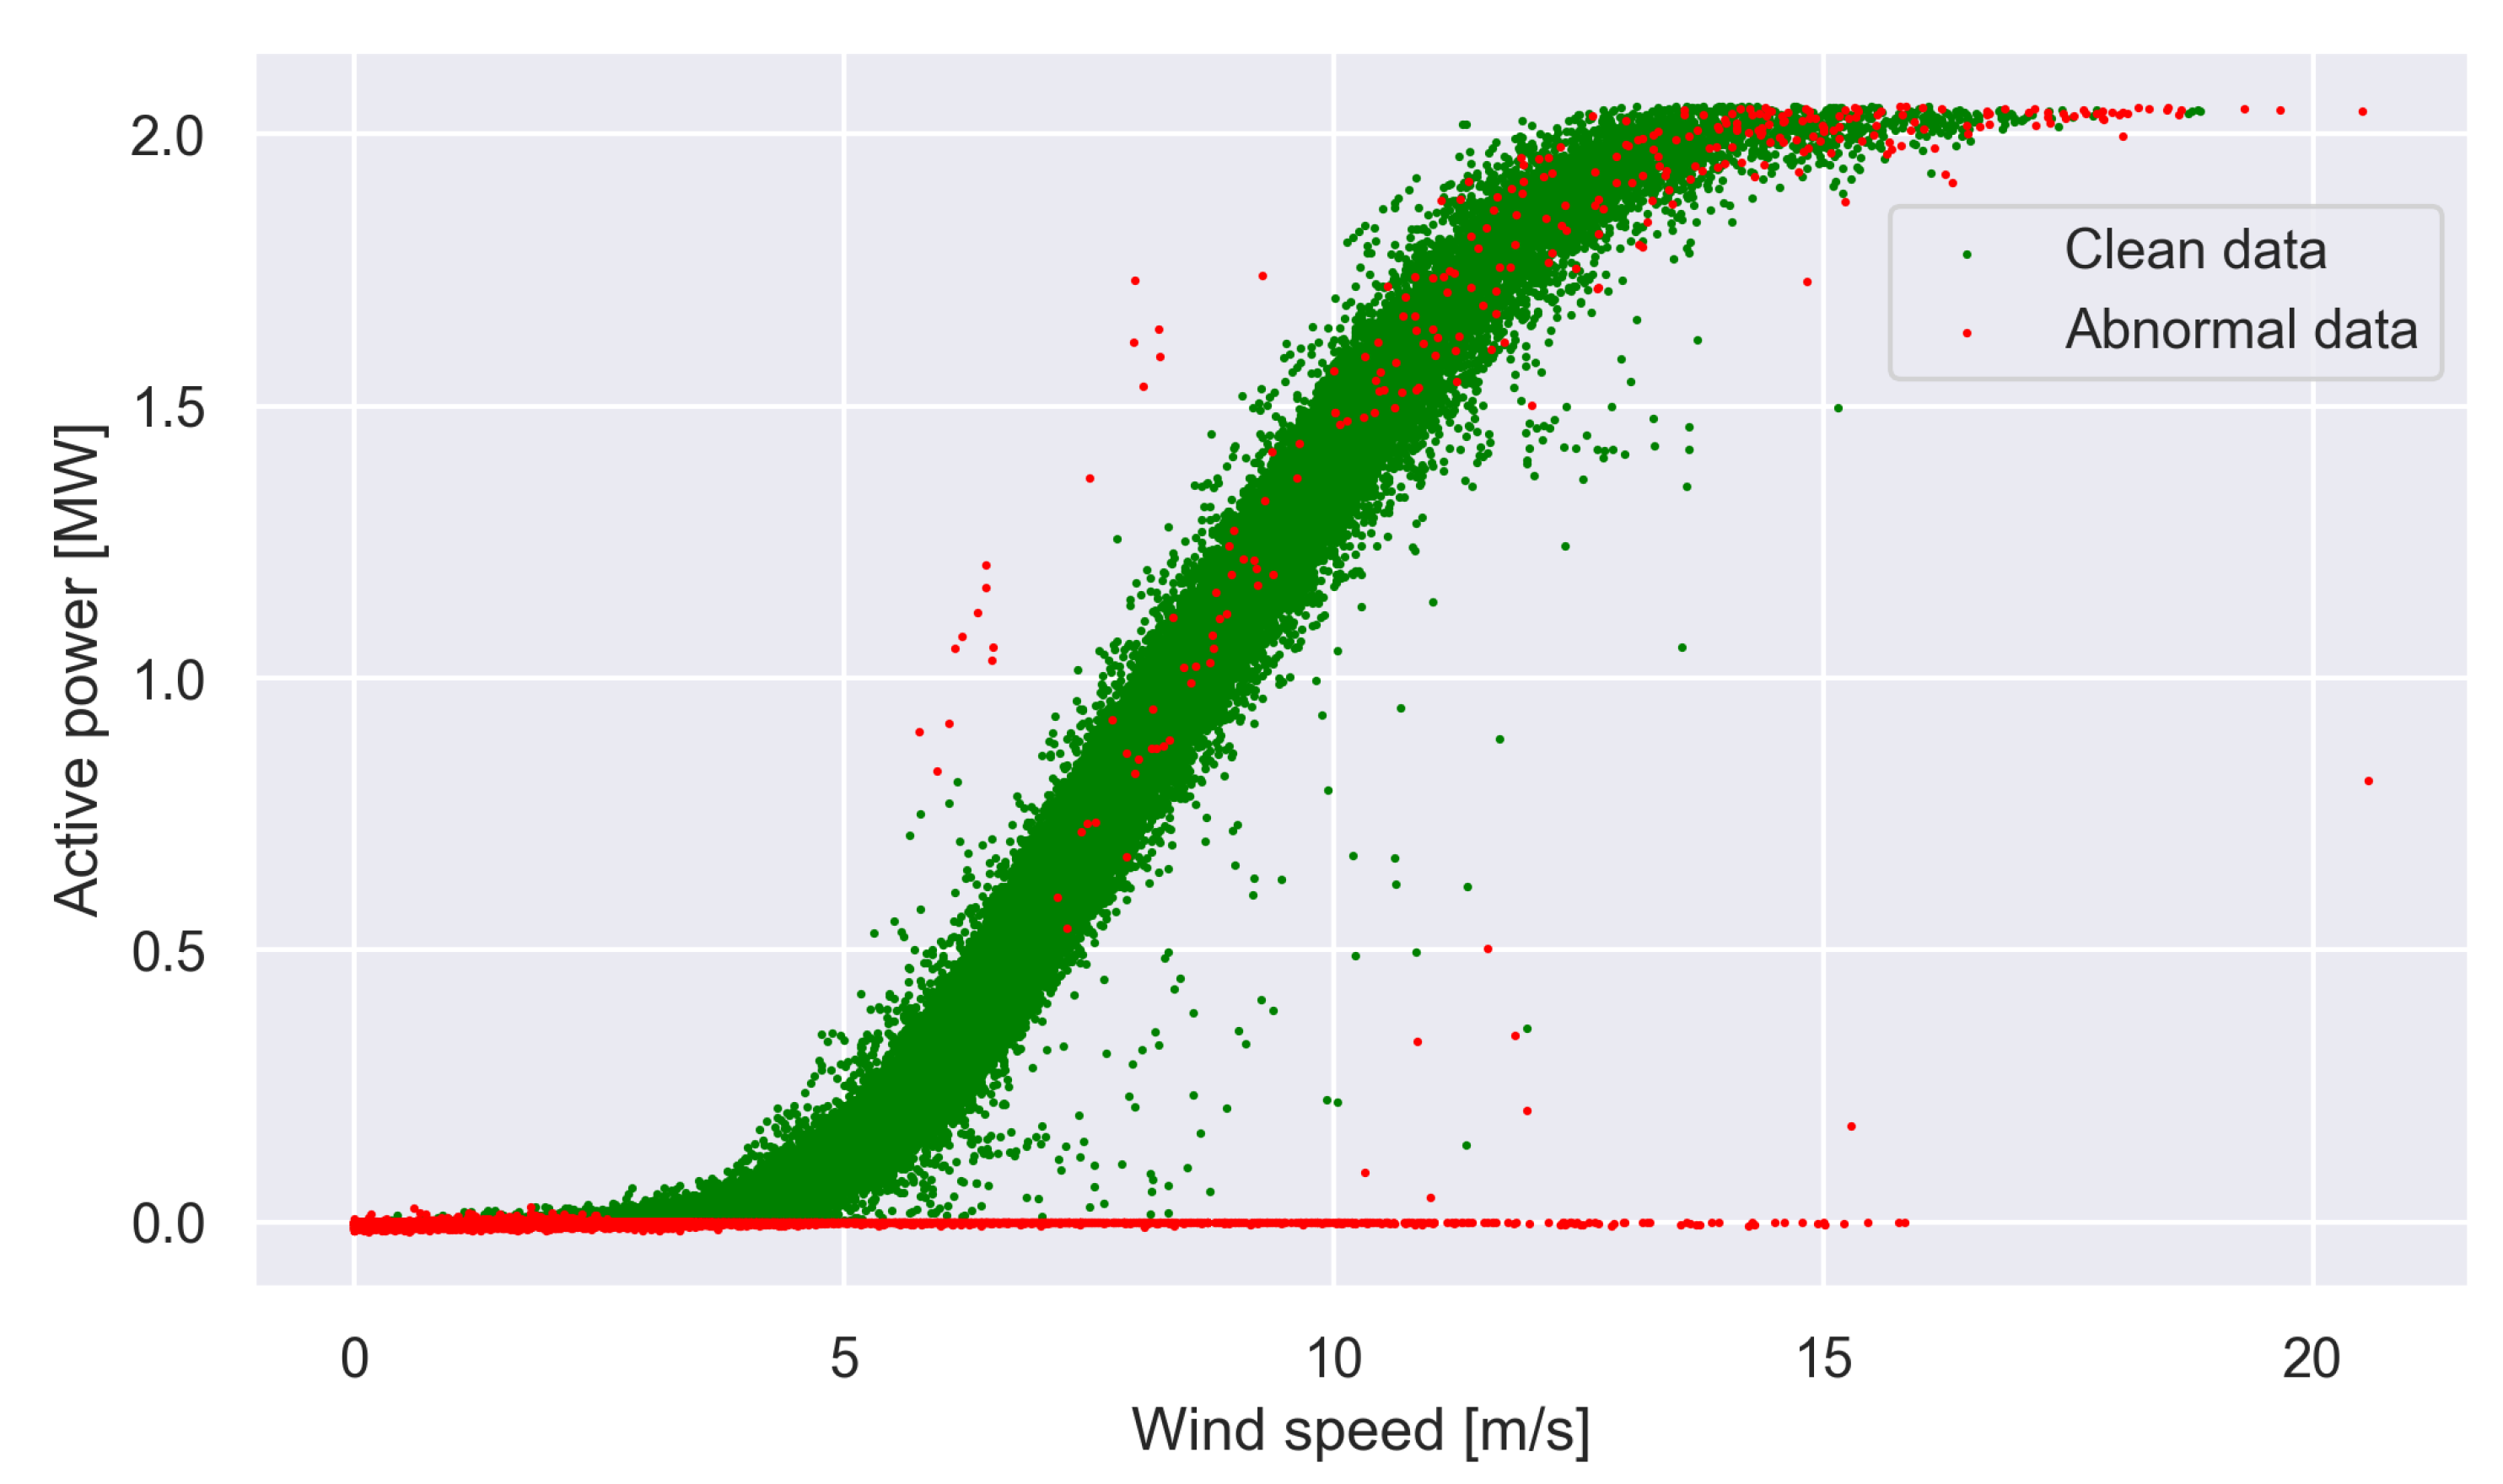
Removal of measurements deemed outliers: The data are anticipated to exhibit a range of irregularities because these datasets have been automatically recorded by the system. These irregularities can adversely affect the accuracy of operating mode estimations. Therefore, procedures are applied to eliminate measurements deemed to be outliers. More precisely, the following procedures are applied to each wind turbine individually: (1) Exclude data entries that show negative active power values as these indicate times when the turbine is not in operation; (2) Remove data points that exhibit substantial deviation from a two-dimensional binning of wind speed and wind direction. Firstly, a point is discarded if a bin contains only one point. Secondly, remove data points that exhibit substantial deviation from the anticipated active power. The effect of removing these measurements is illustrated in Figure 2.
(iii)
Data standardization: The dataset records are a combination of angular and nonangular variables; thus, this diversity complicates the analysis. Angular variables in the dataset, like blade angle and wind direction, need to be converted by applying the sine and cosine transforms to become nonangular. Moreover, we normalize the selected parameters such that they are scaled between 0 and 1.
After applying these techniques, sixteen variables are selected for each turbine, including four exogenous variables: “active power” for La Haute Borne, “power” for Kelmarsh, and wind speed, wind direction, and ambient temperature for both farms. The rest are endogenous variables. Note that the names of a few variables in the dataset differ for each farm, as follows:
  • La Haute Borne farm: generator bearing 1 temperature, generator bearing 2 temperature, pitch angle (sine), pitch angle (cosine), torque, rotor bearing temperature, gearbox oil sump temperature, gearbox inlet temperature, gearbox bearing 1 temperature, gearbox 2 temperature, generator stator temperature, generator speed.
  • Kelmarsh farm: front bearing temperature, rear bearing temperature, gear oil inlet temperature, generator bearing front temperature, generator bearing rear temperature, gear oil temperature, stator temperature 1, torque, rotor bearing temp, generator RPM, blade angle (sine), blade angle (cosine).

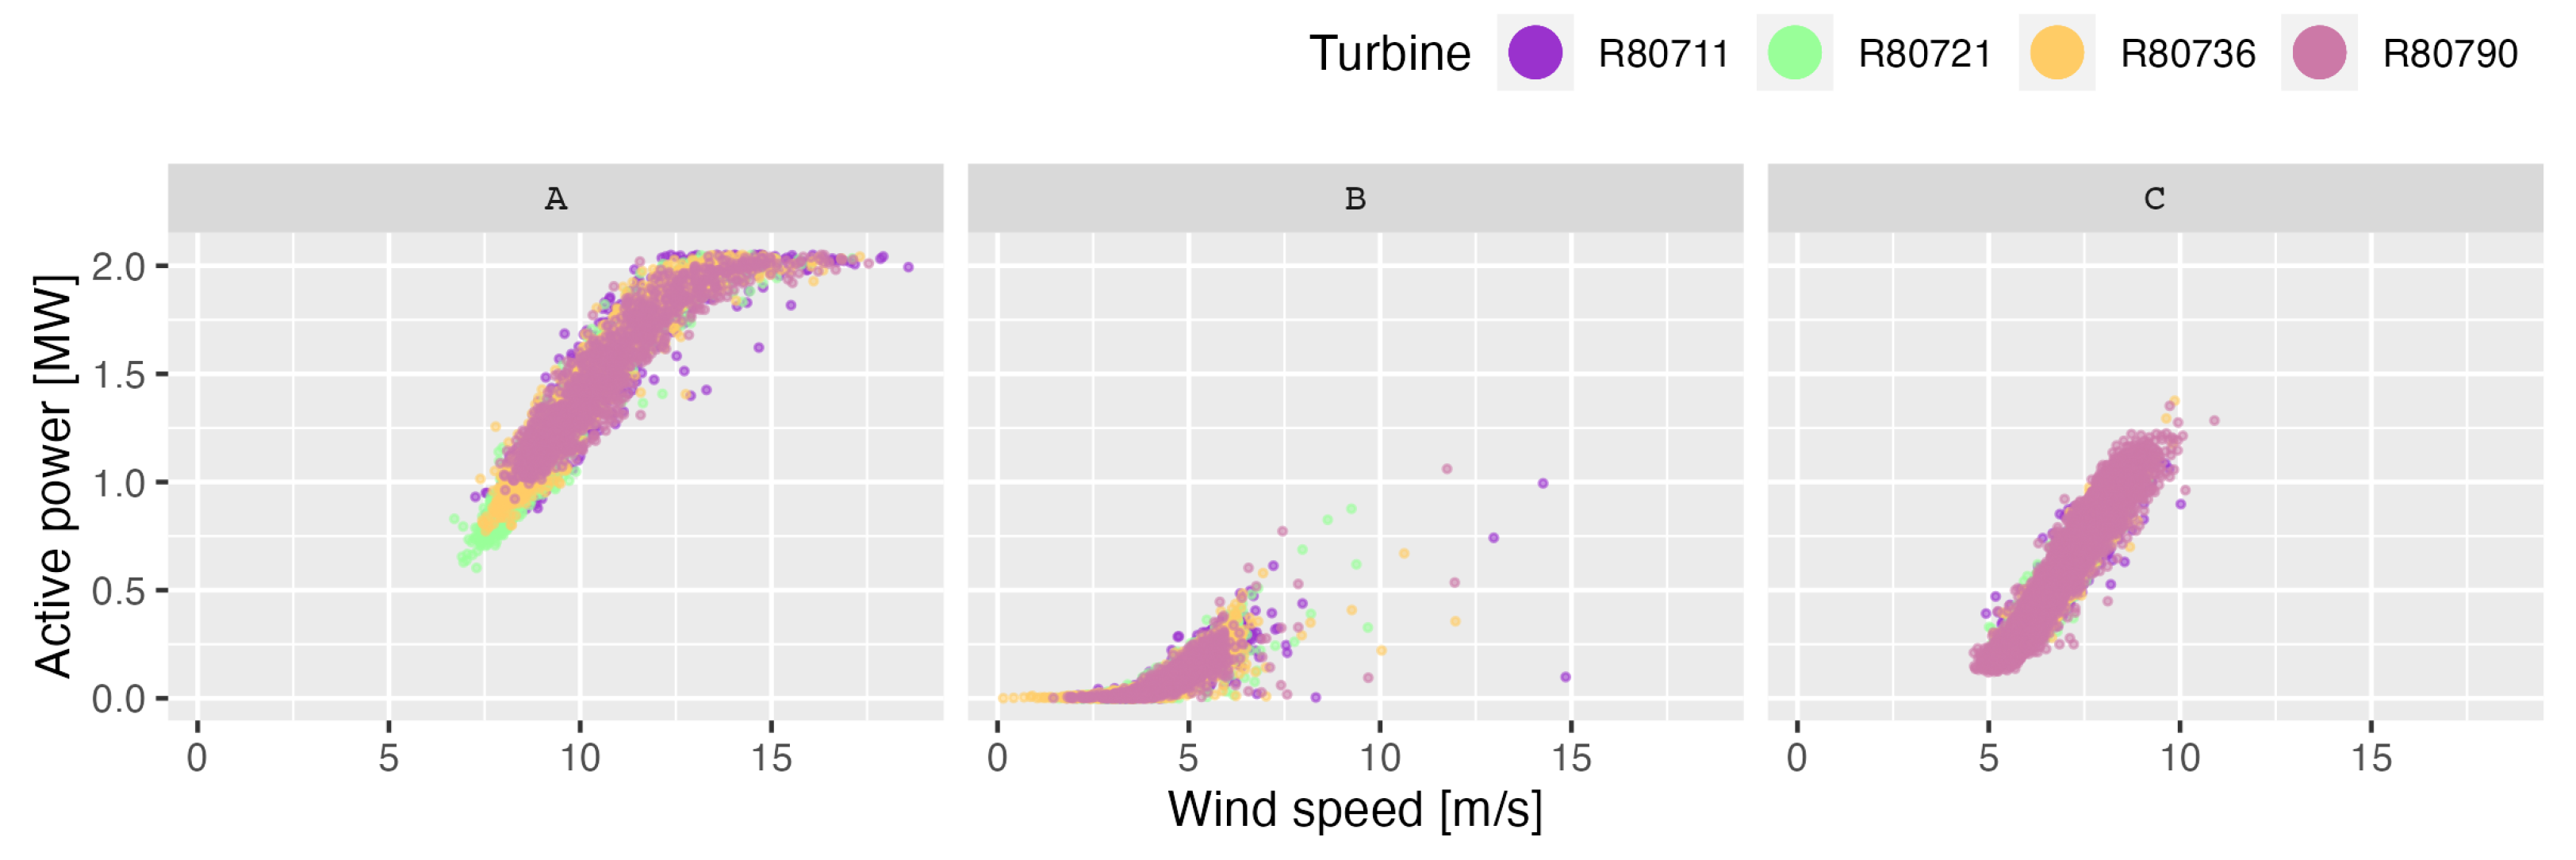
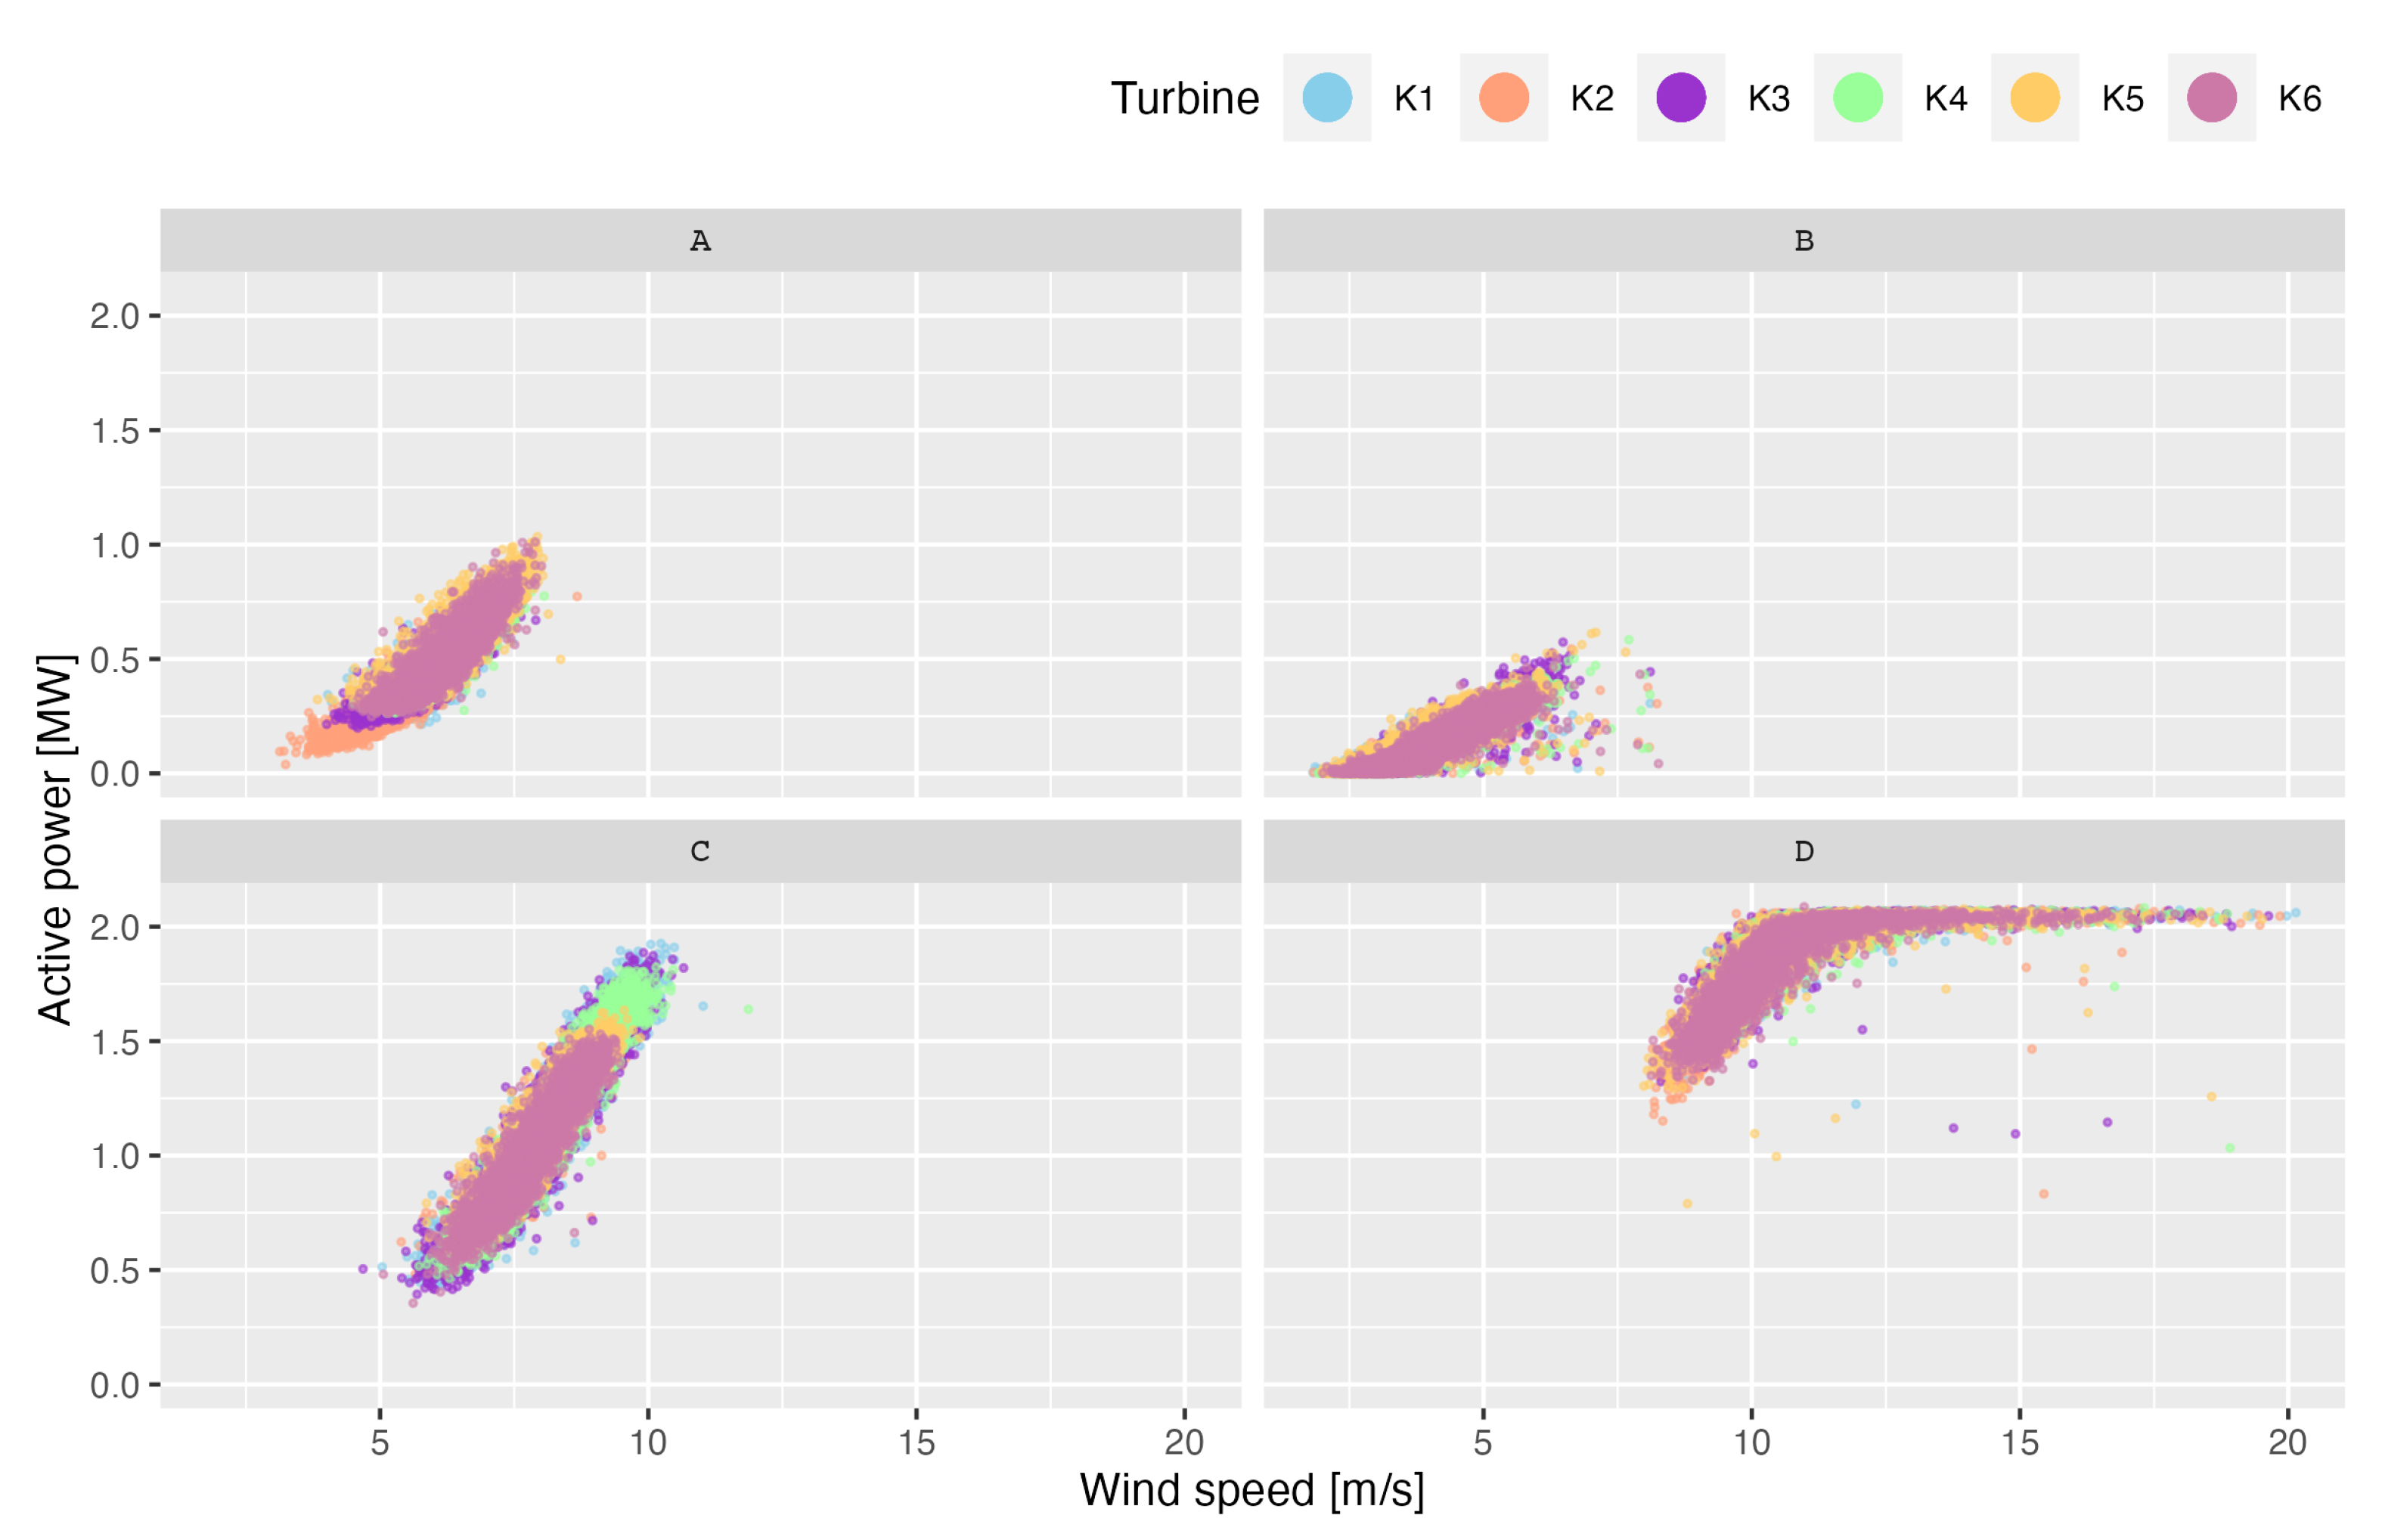
2.3. Operating Modes

We apply the procedure from [11]. For completeness, we briefly describe the main steps of the procedure.
The initial step for estimating the operating modes is to apply the k-means clustering algorithm [24] for each wind turbine by considering the twelve endogenous variables that have been selected. Five validation techniques are used to find the number of clusters: elbow method, connectivity [25], silhouette index [26], Caliński–Harabasz index [27], and Davies–Bouldin index [28]. The most plausible number of clusters for each wind turbine is determined using a majority voting approach based on these five techniques.
The second step enhances the analysis by incorporating exogenous variables, such as wind speed, wind direction, and outdoor temperature, with the active power. Performance profiles are determined as mixture probability distributions for each cluster from the first step.
The final step applies k-means clustering to consolidate the identified operating modes from the initial and second steps. In this phase, we also use the five validation techniques applied in the first step to find the optimal number of clusters. After executing all the steps, we obtain for the La Haute Borne wind farm three clusters, or equivalently, three discretized wind farm level operating modes: A , B , and C . The clusters are shown in Figure 3. The number of clusters for the Kelmarsh wind farm is four. They are labeled A , B , C , and D (see Figure 4). The plots in Figure 3 and Figure 4 demonstrate that each cluster (operating mode) corresponds to a distinct status of the wind turbines, although some overlaps exist between the clusters for the same wind farm.
After estimating the operating modes for each turbine, we investigate the missing data in the time series, and the statistics are presented in Table 1 and Table 2. The time series of operating modes for the Kelmarsh dataset are longer than those for the La Haute Borne dataset. We have mentioned in Section 2.1 that the wind turbine R80790 in the La Haute Borne dataset had significant data loss between 2013 and 2014. This makes the mean value of the length of the sequence of missing data for this turbine to be double that of the other three turbines, whereas the median values are the same for all four turbines. Considering the dataset without the longest missing sequence for each turbine, the proportions of the missing data for the turbines in the La Haute Borne farm become 18.4 % for R80711, 22.1 % for R80721, 21.5 % for R80736, and 20.0 % for R80790. Turbines R80711 and R80790 exhibit lower proportions than the other two turbines. This observation suggests that, aside from the data loss in R80790, more data are available for R80711 and R80790, which could impact forecasting performance. In contrast, the changes in proportions after excluding the longest missing sequence from each time series are not significant for the Kelmarsh farm. The proportions of missing values in the Kelmarsh farm are smaller than in La Haute Borne. For both datasets, median values indicate that half of the missing value sequences are very short in length.

2.4. Prediction Strategies

It follows from the analysis above that, for a wind turbine, the sequence of operating modes is a discrete-valued time series with missing values. We represent the time series as { x t } and make the convention that the entries of the time series are symbols from the alphabet A = { s 1 , , s β + 1 } . It is evident that the cardinality | A | of A is β + 1 . The symbol s β + 1 is a placeholder for missing values. For example, according to Figure 3, the operating modes for the turbines from the La Haute Borne wind farm are coded with the symbols s 1 = A , s 2 = B and s 3 = C . For the missing data, we use the symbol s 4 = D , which means that A = { A , , D } . Similarly, in the case of the time series for the turbines from the Kelmarsh wind farm, we have A = { A , , E } , where E is the symbol for the missing values (see also Figure 4). According to Table 1 and Table 2, the length of each time series from La Haute Borne is L = 210 , 384 , whereas the length of the time series from Kelmarsh is L = 236 , 448 . Observe that the index t in { x t } takes values from 1 to L.
With this notation, we formulate the forecasting problem as follows. For a fixed integer > 0 and for each t with the property that < t L , we wish to forecast the value of x ^ t by using the measurements x t , , x t 1 . For ease of writing, we denote x t t 1 the observations employed in forecasting. In our settings, = 144 , which amounts to utilizing in forecasting the measurements collected during the previous 24 h. Recall that the sampling period is 10 min. If we suppose that the operator F ( · ) stands for the forecasting method that we apply, then x ^ t = F ( x t t 1 ) (see also Section 1.3). The challenges arise because most of the forecasting methods are designed for time series data that are complete. To address this issue, we propose the strategies described below. In all three strategies, we assume that there are no missing values in x 1 , the first entries of the time series. When some of the entries of x 1 are missing, we replace them with the symbol from A { s β + 1 } that occurs most often in x 1 .
The strategies are the following:
(i)
Ignore Missing Values (IMV): The first strategy is the most straightforward and consists of producing a new time series { y t } by discarding from { x t } all the occurrences of the symbol s β + 1 . Let L ˜ be the length of the resulting time series and let F ( · ) be the operator defined in Section 1.3. For each t in the set { + 1 , , L ˜ } , we obtain without difficulties y ^ t = F ( y t t 1 ) . It is clear that y t t 1 contains measurements collected before the last 24 h whenever the set of measurements from the last 24 h is not complete. This approach simplifies the prediction process as it only focuses on available data.
(ii)
Imputation and Prediction (IPP): In this strategy, we impute the missing values as follows. For each t { + 1 , , L } , we compute x ^ t = F ( x t t 1 ) , which is guaranteed to be a symbol from A { s β + 1 } . If x t = s β + 1 , then we replace in the time series the symbol x t with the estimate x ^ t . Apart from the particular case when t = L , this will have an important effect on the predicted values x ^ min ( t + 1 , L ) , , x ^ min ( t + , L ) because the imputed symbol x ^ t will be employed in the calculations involved by the application of the operator F ( · ) .
(iii)
Prediction with Extended Alphabet (PEA): The last strategy addresses missing values by treating them as an additional mode, so the symbol s β + 1 is recognized as a distinct mode within the predictive framework. As a result, the time series { x t } is not altered during the prediction process, which is different from IPP. Remark that for both IPP and PEA, the number of time points for which the predictions are produced is the same: L . For each such time point, the operating mode predicted by PEA can potentially be s β + 1 (which is not possible for IMV and IPP). This can be regarded as a capability of PEA to anticipate scenarios where the next observation may not be recorded or exhibit significant deviations from the standard operation of a wind turbine. We do not adopt this viewpoint in our work. Because of that, we use PEA only for the prediction of valid entries of the time series.
For each strategy st , we do not consider the missing data when we evaluate the accuracy of the prediction. Hence, we focus on the time moments that are the entries of the set T = { + 1 t L : x t s β + 1 } . Then, for the strategy st , we define M st = { t T : x ^ t st = x t } . The accuracy of the prediction (expressed as a percentage) is computed with the formula
PA = 100 | M st | | T | ,
where the symbol | · | denotes the cardinality of the set in the argument. The computation of the prediction accuracy for all three strategies is presented in Algorithm 1. Remark in the algorithm that we use the notation b st 2 s for the concatenation of the string obtained after removing the first entry of the buffer b st and the symbol s.
Algorithm 1: Evaluation of accuracy for various prediction strategies
Input:  x 1 L [discrete-valued univariate time series], 144 [ < L and x 1 is complete],
F ( · ) [operator forecasting method]
Initialisation:   | T | 0 , | M st | 0 , for st { IMV , IPP , PEA } ,
b st x 1 , for st { IMV , IPP , PEA }
for   t = + 1 : L   do
                  x ^ t IPP F ( b IPP )
   if  x t is a missing value then
                  b IPP b IPP 2 x ^ t IPP b PEA b PEA 2 s β + 1
   else
     for  st { IMV , PEA }  do
                  x ^ t st F b st
     end for
                  | T | | T | + 1
     for  st { IMV , IPP , PEA }   do
                  b st b st 2 x t
        if  x ^ t st = x t  then
                  | M st | | M st | + 1
        end if
     end for
   end if
end for
for   st { IMV , IPP , PEA } do
                  PA st 100 | M st | | T |
end for
Output:  PA IMV , PA IPP and PA PEA

2.5. Forecasting Methods

2.5.1. Bayesian Context Tree (BCT)

The models considered in this section are variable-length Markov chains for which the memory length is not larger than a constant D 0 . The presentation below is based on [18]. For simplicity, we do not give all technical details, and we assume that the models are used for inference and prediction of the time series { x t } , whose entries are letters of the alphabet A = { A , B , C } .
Each such model can be represented as a ternary tree (for illustration, see Figure 5). An interesting property of the tree shown in the figure is that each internal node has exactly three children. We restrict our attention to the family of the trees with this property, which are termed proper trees. We dub T D this family of trees. Remark in the figure that a label is displayed for each leaf of the tree. Sometimes, the labels assigned to the leaves are called contexts. For instance, let us consider the leaf labeled BBC . To understand the significance of the contexts, we mention that D = 5 for the tree in the figure, which means that the probability that the current entry of the time series is, for example, the letter A depends only on the previous five symbols in the time series. We now consider all the strings of the type CBB . Disregarding the letters from A that occur in the positions marked with ♣ and ♠, the probability of observing A after such a string is the same because BBC is a leaf. Therefore, we assign to this label (context) two probabilities: the probability of observing in the time series the letter A after the string CBB and the probability of observing B after CBB . It is evident that one can calculate straightforwardly the probability of observing C after CBB if the probabilities above are known. Hence, it suffices to have two parameters for each leaf of the tree. We group in θ the parameters assigned to all the leaves of the tree T.
According to the Bayesian methodology, a prior distribution π ( T ) is defined for the models T that belong to T D . This is chosen to penalize the large models. Furthermore, for any T T D , the prior on the parameters is defined as follows: (i) the prior for the parameters assigned to each leaf is a Dirichlet distribution with parameters ( 1 / 2 , 1 / 2 ) ; (ii) all the distributions placed on the leaves are assumed to be independent.
Suppose that we observe the entries of the time series, which is denoted x o . In order to make the connection with the definitions from the previous section, we can take x o to be x t t 1 . The inference problem is to find the maximum a posteriori probability (MAP) model tree, which amounts to finding T for which π ( T | x o ) is maximized. Note that
π ( T | x o ) = P ( x o | T ) π ( T ) P ( x o ) ,
where the marginal likelihood is given by
P ( x o | T ) = P ( x o | θ , T ) π ( θ | T ) d θ
and the prior predictive likelihood has the expression
P ( x o ) = T π ( T ) P ( x o | T ) .
A key point is that there exists a closed-form formula for the marginal likelihood P ( x o | T ) , and it involves the counts for how many times each letter of A appears after a certain context in x o . Interestingly enough, both P ( x o | T ) and P ( x o ) can be easily computed by using a version of the context tree weighting (CTW) algorithm [29,30]. The CTW algorithm firstly builds a tree, say T max , for which the leaves are all the contexts of length D from x o . The algorithm comprises a step that guarantees that the resulting tree is proper. Then, all the counts that are needed are computed for each node of the tree. BCT uses the tree built by CTW and visits its nodes from the leaves to the root in order to compute the so-called maximal probabilities for each node of the tree. Then, starting from the root to the leaves, the maximal probabilities are employed to decide for each node if its children are pruned or if they are kept in the tree. The resulting tree is proven to be the MAP tree (or one of the MAP trees in the case when the result is not unique).
Again, according to the Bayes methodology, the problem of predicting the next measurement, x t , is solved by considering the posterior predictive distribution,
P ( x t | x o ) = T P ( x t | x o , θ , T ) π ( θ , T | x o ) d θ ,
which can be computed as P ( x o x t ) / P ( x o ) . We use the notation x o x t for the string produced by the concatenation of string x o and symbol x t . We have already mentioned above how P ( x o ) can be evaluated by employing CTW. The calculation of P ( x o x t ) is carried out similarly, which implies that P ( x t | x o ) can be computed exactly. Observe that, for prediction, model averaging is used instead of model selection. In our experiments, we use the implementation from the R package BCT for D = 5 . The selection of D was carried out by taking into consideration that the length of the string x o is 144 in our case.

2.5.2. Conditional Tensor Factorization (CTF)

In the previous section, we how the number of parameters of the model can be reduced by BCT. For example, the tree in Figure 5 has only 13 leaves, whereas a full ternary tree for which the depth is D = 5 has 3 5 = 243 leaves. It follows that the model corresponding to the tree in the figure has only 2 × 13 = 26 parameters, which is much smaller than the number of parameters of the full tree 2 × 243 = 486 .
A different approach for finding a sparse model is considered in [19], where given an upper bound (say D) for the order of the Markov model for the time series { x t } , the Bayesian nonparametric method proposed in there finds a maximum order (say D * D ) and identifies from the set of variables { x t 1 , , x t D * } those that are deemed to be important in the prediction of x t . To this end, the transition probability P ( x t | x t 1 , , x t D ) is organised into a tensor with dimension | A | × × | A | (obviously, the number of factors equals D + 1 ). Recall that | A | denotes the cardinality of the alphabet A . Most importantly, the tensor can be represented as follows:
P ( x t | x t j , j = 1 , , D ) = h 1 = 1 k 1 h D = 1 k D λ h 1 , , h D ( x t ) j = 1 D π h j ( j ) ( x t j ) ,
where k 1 , , k D are from the set { 1 , , | A | } . Moreover, λ h 1 , , h D ( x t ) 0 and
x t A λ h 1 , , h D ( x t ) = 1 for all D - uples ( h 1 , , h D ) .
Similarly, π h j ( j ) ( x t j ) 0 and h j = 1 k j π h j ( j ) ( x t j ) = 1 for all pairs ( j , x t j ) .
In [19], it is pointed out that the identity in (2) can be regarded as a predictor-dependent mixture model for distributions whose support is { 1 , , | A | } (slight abuse of notation), with the understanding that the vectors [ λ h 1 , , h D ( 1 ) , , λ h 1 , , h D ( | A | ) ] are the kernels of the mixture model and the product j = 1 D π h j ( j ) ( x t j ) gives the mixture weights. This observation is further used in [19] to reduce the number of parameters of the model. We do not give here all the technical details, but we only mention that after defining the priors, the authors of [19] design efficient Markov chain Monte Carlo (MCMC) algorithms for posterior computation.
In our experiments, we set the upper bound D = 10 , following the recommendations from [19]. Additionally, the MCMC algorithm is configured to run for 5000 iterations with an initial burn-in of 1000 to achieve stable results for each training sequence. We use in MATLAB 2023b the code provided by the authors, which can be found at https://github.com/david-dunson/bnphomc (accessed on 2 October 2023). When CTF is applied to the same training sequence as the one used to produce the tree in Figure 5, it finds that the number of important variables to be included in the model is two, and those variables are x t 1 and x t 5 .

2.5.3. Variable-Length Markov Chains (VLMC)

The method that we briefly discuss in this section is the one from [16] and is implemented in the R package vlmc (see also [31]). We call it VLMC mainly because of the name of the package. It is obvious that the VLMC method was developed long before BCT was introduced. As in BCT, a large tree ( T max ) is built in the first step of the VLMC algorithm; T max is constructed so that it contains all the contexts that occur at least twice in the observed time series. Then, the pruning is carried out by examining each leaf of the tree. More precisely, a statistic is computed for each leaf, and if the statistic is smaller than a threshold κ , then the leaf is pruned. The process continues until further pruning is no longer necessary. It is possible to give an interpretation for the statistic used in pruning by resorting either to Kullback–Leibler divergence or to the likelihood ratio test. Relying on asymptotic arguments, the value of κ is chosen as Q ( 0.95 ) , where Q ( · ) is the quantile function of 1 2 χ ν 2 and χ ν 2 denotes the chi-square distribution with ν degrees of freedom. We have ν = | A | 1 . This is based on [16,31], where a more elaborate discussion on the selection of κ can be found.
In our experiments, we calculate κ as described above. For the training sequence of length 144 that was used to generate the BCT tree in Figure 5, we have ν = 2 and κ 2.996 . The resulting VLMC tree is shown in Figure 6. The comparison of the two trees helps us to remark a characteristic of the VLMC trees that makes them different from the BCT trees, namely, the VLMC trees are not proper trees. In our example, this can be easily observed if we consider the children of the internal node C in the two figures. The same can also be observed by comparing in the figures the subtrees that descend from the internal node B . Interestingly, the node A is a leaf in both trees. At the end of this short description, we note that the VLMC tree is used to forecast future observation x ^ t as the symbol of the alphabet A , which has the highest probability in the most recently observed context. The difference between the forecasting mechanisms in BCT and VLMC is obvious.

2.5.4. Exponential Smoothing (ETS)

For applying the methods from this class, we convert the symbols s i A to numerical values by applying the mapping s i i . For ease of notation, we still denote { x t } the time series obtained after employing this transform. According to [20], there are 30 different models used in exponential smoothing. Taking into consideration the peculiarities of the time series that we analyze and based on some preliminary experiments, we have decided to use one single model: the simple exponential smoother with additive error. This model produces good prediction results and requires moderate computational resources.
For j { t , , t } , each entry x j of the time series is modeled as follows:
x j | μ , α = ( 1 α ) j t + μ + α i = t j 1 ( 1 α ) j i 1 x i ,
where μ denotes the initial “level” and α is a parameter that controls the values of the weights for the past observations. The estimates μ ^ and α ^ are found by minimizing the sum of squared errors j = t t 1 ( x j x j | μ , α ) 2 (see [20]). Then, the formula in (3) is used for computing x t | μ ^ , α ^ , which is rounded to the nearest integer in order to obtain the predicted value x ^ t .

2.5.5. Whittaker Smoother (WS)

We term Whittaker smoother the method introduced by Eilers in [21], based on the ideas proposed by Whittaker [32]. Given x t t , which represents the entries x t , , x t of the time series that is of interest for us, the Whittaker smoother fits a smooth time series z t t to x t t . The values of z t , , z t are found by minimizing the objective function:
j = t t w j ( x j z j ) 2 + λ j = t + m t w j ( m z j ) 2 ,
where m 1 is an integer. The symbol m denotes the mth-order difference, which is recursively computed as follows: z j = 1 z j = z j z j 1 and m z j = ( m 1 z j ) for m 2 . It is easy to verify that m z j = i = 0 m ( 1 ) i m i z j i [33]. The second term in (4) quantifies the roughness of the time series z t t , whereas the first term measures the goodness-of-fit to the data. The parameter λ > 0 ensures the balance between the two terms.
A particular feature of the method is given by the weights w j that can only take values zero or one. For instance, because we wish to forecast the value of x t , we take w t = 0 , and we use in (4) an arbitrary value for x t . The predicted value x ^ t is computed by rounding z t to the nearest integer. One can choose w j = 0 for all indices j { t , , t 1 } , for which the measurements x j are missing. However, this is not equivalent to the IMV strategy. The difference comes from the number of valid observations in x t t : in IMV this number equals , whereas in this approach is less than .
The solution to the optimization problem in (4) is easily obtained via linear algebra. Additionally, the selection of the parameter λ can be performed by using a computationally efficient variant of cross-validation (see [21] for technical details). In our implementation, we use in MATLAB 2023b the code provided by the author of Reference [21]. The parameter λ = 10 g is selected via cross-validation from the set generated by allowing g to take values on a uniform grid on [ 3 , 10 ] , for which the grid step equals 0.2 . The value of m equals 3.

3. Experimental Results

3.1. Preamble

We present the prediction results produced by the strategies outlined in Section 2.4 when they are applied to the datasets that are described in Section 2.1. In each case, the prediction accuracy is computed with the formula from (1). The values of the parameters used in experiments for each forecasting method are presented in Table A1 (see Appendix A). The first forecasting method that we consider is BCT. Then, we compare the results of BCT with those yielded by CTF. Due to the high computational requirements of CTF, this comparison is carried out only for a segment of each time series from the datasets. Then, the prediction performances of the other three forecasting methods (VLMC, ETS, and WS) are compared with BCT for the entire time series. We also provide information about the runtime of the algorithms that we compare. We executed the codes on a computer equipped with Intel® i5, 1.30 GHz processor with 16 GB RAM and a 512 GB SSD hard disk. More information about the computational complexity of the forecasting methods can be found in the references where they have been originally presented. In our experiments, we wanted to show that good prediction results can be obtained with reduced computational resources. A more detailed discussion on the necessity of using frugal algorithms can be found, for example, in [34].

3.2. BCT

According to the results shown in Table 3, in the case of La Haute Borne wind farm, across all four turbines, the three strategies lead to relatively high prediction accuracy within the range from 86 % to 89 % . The differences between turbines are minimal. In the same table, one can see that the overall prediction accuracy for Kelmarsh is lower than for La Haute Borne. This is because the cardinality of the alphabet for the operating modes of the former is larger than for the latter. For Kelmarsh, the accuracy achieved for various turbines is within the range from 80 % to 84 % . Turbine K2, whose time series has the smallest proportion of missing data, attains the highest prediction accuracy.
For both datasets, the ranking of the prediction strategies is the same. IMV is the best, and IPP comes in the second position. The difference in accuracy between IMV and IPP is about 0.1 % , whereas the difference between IPP and PEA is more than 1 % . Unsurprisingly, PEA has difficulties in predicting the next value after a relatively long sequence of missing data. In general, IPP works better in such situations, but it has other limitations that we explain by considering the following example. Assume that the time series contains the string x 1 , , x ( = 144 ) that is complete (no missing data). This is followed by q positions with missing data (say q = 10 ). If BCT predicts the symbol s for x ^ + 1 , then it is possible that the next predictions will be x ^ + 2 = = x ^ + q + 1 = s . Because IMV ignores the missing values from the positions + 1 , , + q , it also predicts x ^ + q + 1 = s . This means that IMV and IPP predict the same value for x l + q + 1 . The difference is that IPP uses more computational resources to do that.
As IPP must predict each entry of the time series (disregarding if it is a valid entry or a missing value), its execution time for all time series within a dataset is about the same because all of them have the same length. For instance, the execution time of IPP + BCT is about 45 min for each time series in the La Haute Borne dataset and about 52 min for each time series in the Kelmarsh dataset. It is clear that the computation complexity of IPP is higher than the computation complexity of IMV and PEA, which produce predictions only for the valid entries. The execution time for IMV + BCT is reported in Table 3; it varies from one turbine to another because the number of valid entries is different for each turbine.

3.3. Comparison between BCT and CTF

As we have already mentioned, CTF is a computationally intensive forecasting method. This makes us consider in the comparative analysis only IMV and PEA and run the algorithms only for a time period of one month for each turbine. The results are reported in Table 4, where the average execution time for IMV + CTF is about 500 min for the La Haute Borne dataset and about 620 min for the Kelmarsh dataset. The use of IMV + BCT is much faster, with an average execution time of 2.12 s for La Haute Borne and 3.31 s for Kelmarsh. The discrepancy in execution times is caused by the 5000 iterations of the MCMC algorithm that are executed by CTF.
For each prediction strategy, BCT consistently demonstrates better predictive performance than CTF, although both forecasting methods have good performances for data for a one-month period. Between the two wind farms, CTF delivers better forecast results for La Haute Borne than for Kelmarsh, which is similar to the pattern that we have seen in Section 3.2. Regarding the prediction accuracy gap between PEA and IMV, the increase in accuracy from PEA to IMV is approximately 2 % for BCT and 2.7 % for CTF. Given the results for the prediction accuracy and for the execution times, it is clear that the forecasting of the operating modes can be carried out more efficiently by BCT than by CTF.

3.4. Comparison between BCT and Other Forecasting Methods

The results concerning the prediction accuracy are displayed in Figure 7 and Figure 8. More detailed results can be found in Table A2 (see Appendix A).

3.4.1. Comparison with VLMC

The plots in the figures show that VLMC produces comparable results but does not surpass BCT. For the La Haute Borne farm, the mean difference between BCT and VLMC is around 3 % for IMP and IPP, and 4 % for PEA. The difference increases for the Kelmarsh farm: around 3.9 % for IMV and IPP, and 4.5 % for PEA. The lower accuracy predictions of VLMC (in comparison with BCT) can be attributed to the default value of cut-off parameter κ , which is determined by χ 2 -quantiles, as detailed in Section 2.5.3. The prediction accuracy of VLMC can be potentially improved by selecting the optimal cut-off value κ with information theoretic criteria, but this leads to an increase in the computational burden (see the discussion in [18]).
Among the three strategies, PEA always provides the poorest performance. In the analysis of IMV and IPP in connection with VLMC, we observe that IMV is not always superior to IPP, which is different from what we have noticed for BCT. For instance, for the Kelmarsh farm, the turbines K1 and K6 show slightly higher accuracy for IPP than for IMV. However, the differences between the two strategies are minimal.
We note an interesting relationship between VLMC and ETS. For the La Haute Borne farm, the results of ETS are superior to those of VLMC across all turbines, regardless of the prediction strategy. Conversely, for the Kelmarsh farm, ETS outperforms VLMC for every turbine. Next, we focus on the analysis of the results yielded by ETS.

3.4.2. Comparison with ETS

The prediction accuracy of ETS is slightly worse than that of BCT. Across the two wind farms, the difference in prediction accuracy between the two forecasting methods is small for the La Haute Borne farm (approximately 1.5 % for IMV and IPP, and 2.9 % for PEA) and becomes more evident for the Kelmarsh farm (approximately 5 % for IMV and IPP, and 6.7 % for PEA). Note that IPP + ETS occasionally performs better than IMV + ETS, albeit by marginal differences. This characteristic is particularly noticeable for the Kelmarsh farm.
We have observed experimentally that the execution time for ETS is approximately 10 % greater than that of BCT. In our experiments, we have used only the simple exponential smoothing with an additive error, as discussed in Section 2.5.4. However, depending on the time series, this model is not guaranteed to be superior to the other 29 models employed in exponential smoothing. At the same time, the option of automatic selection of one of the 30 models is computationally expensive.

3.4.3. Comparison with WS

The feature that makes WS different from the other methods is the intrinsic mechanism that allows it to circumvent the difficulties related to missing data. As we have already pointed out in Section 2.5.5, the missing data are ignored by forcing the weights w j , t j t 1 , to be equal to zero for the indices j that correspond to missing values. We have found experimentally that this approach leads to better prediction results than PEA, which replaces the missing values with a letter from the extended alphabet. With slight abuse of notation, for WS, we term PEA the strategy that consists of turning to zero some of the w j -weights and not the strategy defined in Section 2.5.5. From Figure 7 and Figure 8 (and Table A2 in Appendix A), one can see that the performance of WS is not superior to the performance of BCT or VLMC. An interesting observation is that the WS results are almost the same across the prediction strategies. As mentioned in Section 2.5.5, the value of λ is selected via cross-validation, a process that affects the execution time. In our experiments, when setting λ at a specific value, the execution time is reduced to less than 3 min for each turbine. However, fixing λ is not a good practice because it can potentially deteriorate the prediction accuracy.

4. Conclusions, Limitations, and Future Research

In this work, we have investigated the forecasting problem for the discretized operating modes of a wind turbine. The problem is challenging because the time series of operating modes is not complete. In order to address this issue, we have proposed three different strategies, and the IMV strategy was proven to be the most successful. The strategies have been used in conjunction with five forecasting methods. Among these methods, the best results have been achieved by BCT, which attains a high level of prediction accuracy while using limited computational resources. Additionally, BCT and VLMC have the advantage that they implicitly produce tree models for the time series of operating modes. The evolution in time of these models can be used by operators and engineers for identifying the deterioration of the health of the equipment. This is a possible topic for future research. CTF can also yield good prediction results, but its computational complexity is so high in comparison with other forecasting methods that discourages its use in practical applications. Both smoothers that we have employed in our experiments produce results that are surprisingly good, given that they have not been designed for discrete-valued time series. The very promising results that we have obtained create the premise of applying this type of forecasting together with other techniques for improving the power prediction for a wind turbine. It follows from the short descriptions provided for the forecasting methods in Section 2.5 that the models that we use have a high degree of interpretability. It remains to further investigate the uncertainty associated with these models. To this end, one may use techniques similar to those employed in [20,31].
The key problem that remains to be solved is how to perform imputation to improve the prediction. The imputation method that we have applied suffers from the fact it is entirely based on the data from the past of the missing values. More precisely, whenever we have predicted the value of x t , we have used for imputing x t j , where j 1 , only the data available at the time moments t j 1 , t j 2 , . However, if j > 1 , then in the imputation of x t j can also be used the data available at the time moments t j + 1 , , t 1 . This can be carried out by defining a double-sided context centered on x t j . For example, one can consider the double-sided context x t j 1 , , x t j + 1 , where ♣ is an arbitrary symbol from the alphabet A . Then, search in the data collected before the time moment t (without limiting the search to x t , , x t 1 ) all the occurrences of the double-sided context x t j 1 , , x t j + 1 and count how many times each letter of the alphabet appears in the position marked as ♣. The letter that appears most often can be used to impute x t j . The double-sided contexts have been used previously in a more sophisticated manner for denoising (see, for example, [35]). This approach is not suitable for imputing missing data that occur in bursts. In such situations, it is recommended to use imputation methods for multivariate time series (see [36]). The problem is that most of these techniques have been developed for real-valued time series.

Author Contributions

Conceptualization, H.Y. and C.D.G.; methodology, H.Y. and C.D.G.; software, H.Y. and C.D.G.; validation, H.Y.; investigation, H.Y.; data curation, H.Y.; writing—original draft preparation, H.Y.; writing—review and editing, H.Y., C.D.G. and G.D.; supervision, C.D.G. and G.D.; project administration, C.D.G. All authors have read and agreed to the published version of the manuscript.

Funding

This research received no external funding.

Data Availability Statement

We have used the SCADA data from [22,23].

Acknowledgments

The work of H.Y. was supported by the scholarship offered by the University of Auckland, New Zealand.

Conflicts of Interest

The authors declare no conflicts of interest.

Abbreviations

The following abbreviations are used in this manuscript:
CAcontext algorithm
CTWcontext tree weighting
LASSOleast absolute shrinkage and selection operator
IMVignoring missing values
IPPimputation and prediction
PEAprediction with extended alphabet
BCTBayesian context tree
MAPmaximum a posteriori
VLMCvariable-length Markov chains
CTFconditional tensor factorization
ETSexponential smoother
WSWhittaker smoother

Appendix A

Table A1. For each forecasting method, we list the values of the parameters used in our experiments. Note that all forecasting methods are applied to the entries of the buffer b st that contains symbols from an alphabet with cardinality | A | .
Forecasting
Method
User-Selected OptionValues Used in Experiments
BCTMaximum memory length (D)5
CTFMaximum order Markov model (D)10
Number of iterations MCMC5000
for posterior computation(initial burn-in 1000)
VLMCThreshold used in pruning ( κ )Quantile function Q ( 0.95 ) of 1 2 χ | A | 1 2
ETSETS modelSimple exponential smoother
with an additive error (ANN)
WSOrder of differences (m)3
Range smoothing parameter ( λ = 10 g )g take values on a uniform grid on [ 3 , 10 ] ,
grid step 0.2
Table A2. Comparison of the prediction results for all the forecasting methods (except CTF) when the prediction strategies are applied to the entire time series from La Haute Borne and Kelmarsh datasets. In each row of the table, the bold font is used for the best prediction accuracy. For the IMV strategy, it is also reported the runtime. Note that PEA stands for a different type of strategy when used together with WS in comparison with the case when employed with other forecasting methods (see Section 3.4.3).
Wind FarmForecasting
Method
TurbineIMVIPP
Accuracy
(%)
PEA
Accuracy
(%)
Accuracy
(%)
Time (min)
La Haute
Borne
BCTR8071189.0229.8988.8987.32
R8072188.5827.6488.4286.51
R8073688.7427.9688.6086.75
R8079089.9120.0589.7188.03
VLMCR8071186.0632.8186.0283.52
R8072185.3132.5385.2982.33
R8073685.6433.6585.6182.68
R8079086.9724.3786.9384.27
ETSR8071187.2739.5387.2484.50
R8072186.9836.6586.9583.70
R8073686.9237.5886.8883.73
R8079088.5627.3788.5185.21
WSR8071183.5925.0883.5083.36
R8072183.2624.4983.1383.00
R8073683.6124.6683.4783.37
R8079085.4120.7685.1785.02
KelmarshBCTK181.8538.8281.7580.13
K283.7941.4683.6782.56
K381.9639.1881.8780.34
K481.7640.5081.6880.39
K581.8139.7881.7380.32
K682.5736.4382.4780.65
VLMCK177.9840.9077.9975.91
K280.1751.9080.1178.56
K377.7841.4877.7675.64
K478.0150.4877.9976.23
K577.7349.7577.7275.22
K678.5045.8178.5176.03
ETSK175.5745.3175.6071.09
K279.0348.3579.0376.69
K377.0745.7577.1273.90
K475.8650.9975.8673.46
K577.3347.4477.3574.23
K678.4842.7678.4874.55
WSK173.6129.7973.5073.48
K274.9830.6874.8974.80
K374.6130.8174.5874.47
K474.3430.2374.3274.21
K574.6130.9174.5774.51
K675.4429.5275.3875.29

References

  1. IPCC. Summary for Policymakers. In Climate Change 2023: Synthesis Report. Contribution of Working Groups I, II and III to the Sixth Assessment Report of the Intergovernmental Panel on Climate Change; Lee, H., Romero, J., Eds.; IPCC: Geneva, Switzerland, 2023; pp. 1–34. [Google Scholar] [CrossRef]
  2. IRENA. Renewable Power Generation Costs in 2022; International Renewable Energy Agency: Abu Dhabi, United Arab Emirates, 2023; Available online: https://www.irena.org/Publications/2023/Aug/Renewable-Power-Generation-Costs-in-2022 (accessed on 30 January 2024).
  3. IRENA. Renewable Energy Statistics 2023; International Renewable Energy Agency: Abu Dhabi, United Arab Emirates, 2023; Available online: https://www.irena.org/Publications/2023/Jul/Renewable-energy-statistics-2023 (accessed on 30 January 2024).
  4. Ding, Y. Data Science for Wind Energy; CRC Press: Boca Raton, FL, USA, 2019; p. 95. ISBN 978-04-2995-651-5. [Google Scholar]
  5. IEC 61400-12-1:2022. Available online: https://iss.rs/en/project/show/iec:proj:17046 (accessed on 29 May 2023).
  6. Anahua, E.; Barth, S.; Peinke, J. Markovian power curves for wind turbines. Wind. Energ. 2007, 11, 219–232. [Google Scholar] [CrossRef]
  7. Pedersen, T.F.; Wagner, R.; Demurtas, G. Wind Turbine Performance Measurements by Means of Dynamic Data Analysis; DTU Wind Energy: Roskilde, Denmark, 2016; ISBN 978-87-93278-28-8. [Google Scholar]
  8. Janssens, O.; Noppe, N.; Devriendt, C.; Van de Walle, R.; Van Hoecke, S. Data-driven multivariate power curve modeling of offshore wind turbines. Eng. Appl. Artif. Intell. 2016, 55, 331–338. [Google Scholar] [CrossRef]
  9. Qiao, Y.; Han, S.; Zhang, Y.; Liu, Y.; Yan, J. A multivariable wind turbine power curve modeling method considering segment control differences and short-time self-dependence. Renew. Energy 2024, 222, 119894. [Google Scholar] [CrossRef]
  10. Sebastiani, A.; Peña, A.; Troldborg, N. Numerical evaluation of multivariate power curves for wind turbines in wakes using nacelle lidars. Renew. Energy 2022, 202, 419–431. [Google Scholar] [CrossRef]
  11. Dhont, M.; Tsiporkova, E.; Boeva, V. Layered Integration Approach for Multi-view Analysis of Temporal Data. In Advanced Analytics and Learning on Temporal DataIn Advanced Analytics and Learning on Temporal Data—5th ECML PKDD Workshop AALTD 2020 Revised Selected Papers; Lemaire, V., Malinowski, S., Bagnall, A., Guyet, T., Tavenard, R., Ifrim, G., Eds.; Springer International Publishing AG: Cham, Switzerland, 2020; Volume 12588, pp. 138–154. [Google Scholar] [CrossRef]
  12. Dhont, M.; Tsiporkova, E.; Boeva, V. Advanced Discretisation and Visualisation Methods for Performance Profiling of Wind Turbines. Energies 2021, 14, 6216. [Google Scholar] [CrossRef]
  13. Astolfi, D.; Pandit, R. Multivariate Wind Turbine Power Curve Model Based on Data Clustering and Polynomial LASSO Regression. Appl. Sci. 2022, 12, 72. [Google Scholar] [CrossRef]
  14. Zhang, X.; Jia, J.; Zheng, L.; Yi, W.; Zhang, Z. Maximum Power Point Tracking Algorithms for Wind Power Generation System: Review, Comparison, and Analysis. Energy Sci. Eng. 2023, 11, 430–444. [Google Scholar] [CrossRef]
  15. Weiss, C.H. An Introduction to Discrete-Valued Time Series; John Wiley & Sons Ltd.: Hoboken, NJ, USA, 2018; ISBN 978-11-19097-01-3. [Google Scholar]
  16. Bühlmann, P.; Wyner, A.J. Variable length Markov chains. Ann. Stat. 1999, 27, 480–513. [Google Scholar] [CrossRef]
  17. Rissanen, J. A Universal Data Compression System. IEEE Trans. Inf. Theory 1983, 29, 656–664. [Google Scholar] [CrossRef]
  18. Kontoyiannis, I.; Mertzanis, L.; Panotopoulou, A.; Papageorgiou, I.; Skoularidou, M. Bayesian Context Trees: Modelling and Exact Inference for Discrete Time Series. J. R. Stat. Soc. B. 2022, 84, 1287–1323. [Google Scholar] [CrossRef]
  19. Sarkar, A.; Dunson, D.B. Bayesian Nonparametric Modeling of Higher Order Markov Chains. J. Am. Stat. Assoc. 2016, 111, 1791–1803. [Google Scholar] [CrossRef]
  20. Hyndman, R.; Koehler, A.B.; Ord, J.K.; Snyder, R.D. Forecasting with Exponential Smoothing: The State Space Approach; Springer Science & Business Media: Berlin, Germany, 2008. [Google Scholar] [CrossRef]
  21. Eilers, P.H.C. A perfect smoother. Anal. Chem. 2003, 75, 3631–3636. [Google Scholar] [CrossRef] [PubMed]
  22. La Haute Borne Wind Farm. Available online: https://opendata-renewables.engie.com/explore/ (accessed on 3 April 2023).
  23. Plumley, C. Kelmarsh Wind Farm Data. Zenodo, 2022. Available online: https://doi.org/10.5281/zenodo.5841833 (accessed on 29 May 2023).
  24. MacQueen, J. Some methods for classification and analysis of multivariate observations. In Proceedings of the Fifth Berkeley Symposium on Mathematical Statistics and Probability, Oakland, CA, USA, 21 June–18 July 1967; Volume 1, pp. 281–297. [Google Scholar]
  25. Handl, J.; Knowles, J.; Kell, D.B. Computational Cluster Validation in Post-Genomic Data Analysis. Bioinformatics 2005, 21, 3201–3212. [Google Scholar] [CrossRef] [PubMed]
  26. Rousseeuw, P.J. Silhouettes: A graphical aid to the interpretation and validation of cluster analysis. J. Comput. Appl. Math. 1987, 20, 53–65. [Google Scholar] [CrossRef]
  27. Caliński, T.; Harabasz, J. A dendrite method for cluster analysis. Commun. Stat.-Theory Methods 1974, 3, 1–27. [Google Scholar] [CrossRef]
  28. Davies, D.L.; Bouldin, D.W. A Cluster Separation Measure. IEEE Trans. Pattern Anal. Mach. Intell. 1979, PAMI-1, 224–227. [Google Scholar] [CrossRef]
  29. Tjalkens, T.J.; Willems, F.M.J.; Shtarkov, Y.M. Multi-alphabet universal coding using a binary decomposition context tree weighting algorithm. In Proceedings of the 15th Symposium on Information Theory in the Benelux, Louvain-la-Neuve, Belgium, 30–31 January 1994; pp. 259–265. [Google Scholar]
  30. Willems, F.; Shtarkov, Y.; Tjalkens, T. The context-tree weighting method: Basic properties. IEEE Trans. Inf. Theory 1995, 41, 653–664. [Google Scholar] [CrossRef]
  31. Mächler, M.; Bühlmann, P. Variable length Markov chains: Methodology, computing, and software. J. Comput. Graph. Stat. 2004, 13, 435–455. [Google Scholar] [CrossRef]
  32. Whittaker, E.T. On a New Method of Graduation. Proceedings of the Edinburgh Mathematical Society. Proc. Edinburgh Math. Soc. 1923, 41, 63–75. [Google Scholar] [CrossRef]
  33. Shumway, R.H.; Stoffer, D.S. Time Series Analysis and Its Applications: With R Examples, 4th ed.; Springer: Cham, Switzerland, 2017; ISBN 978-3-319-52452-8. [Google Scholar]
  34. Evchenko, M.; Vanschoren, J.; Hoos, H.H.; Schoenauer, M.; Sebag, M. Frugal Machine Learning. arXiv 2021, arXiv:2111.03731. [Google Scholar]
  35. Weissman, T.; Ordentlich, E.; Seroussi, G.; Verdú, S.; Weinberger, M.J. Universal discrete denoising: Known channel. IEEE Trans. Inf. Theory 2005, 51, 5–28. [Google Scholar] [CrossRef]
  36. Zheng, X.; Dumitrescu, B.; Liu, J.; Giurcăneanu, C.D. Multivariate Time Series Imputation: An Approach Based on Dictionary Learning. Entropy 2022, 24, 1057. [Google Scholar] [CrossRef] [PubMed]
Figure 1. From SCADA data for a wind farm to the predicted operating mode x ^ t for a turbine in the farm.
Electronics 13 01504 g001
Figure 2. Effect of discarding the abnormal data from the measurements available for the wind turbine R80736 from La Haute Borne wind farm. The removed data points are represented in red, and those retained are represented in green.
Electronics 13 01504 g002
Figure 3. Clustering of the data from La Haute Borne wind farm. In the subfigures (AC), the titles correspond to the labels of the clusters. Each of the three clusters represents a region of the power curve or, equivalently, an operating mode for the turbines. The scatter plots illustrate a 10 % sample of each operating mode from all turbines. In the plots, we use a different color for each turbine (see the legend).
Electronics 13 01504 g003
Figure 4. Clustering of the data from Kelmarsh wind farm. In the subfigures (AD), the titles correspond to the labels of the clusters. Note that the number of clusters is four. All other conventions are the same as in Figure 3.
Electronics 13 01504 g004
Figure 5. The BCT tree model for a sequence of operating modes of length 144 from the wind turbine R80721 (La Haute Borne wind farm). The vertical line represents the time axis.
Electronics 13 01504 g005
Figure 6. The VLMC tree model for the same sequence of operating modes as in Figure 5. The vertical line represents the time axis.
Electronics 13 01504 g006
Figure 7. Prediction accuracy for La Haute Borne dataset: The plots are generated using the results reported in Table A2 (see Appendix A).
Electronics 13 01504 g007
Figure 8. Prediction accuracy for Kelmarsh dataset: The plots are generated using the results reported in Table A2 (see Appendix A).
Electronics 13 01504 g008
Table 1. Statistics concerning the missing values in the time series of operating modes for the La Haute Borne wind farm.
DescriptionR80711R80721R80736R80790
Time-series length210,384
Missing values
   Total number39,84047,10745,49171,147
   Percentage18.9%22.4%21.6%34.0%
   Sequence length
         Longest134180029336,358
         Second Longest397724277499
         Shortest1111
         Mean12.3812.9012.6224.58
         Median3333
Table 2. Statistics concerning the missing values in the time series of operating modes for the Kelmarsh wind farm.
DescriptionK1K2K3K4K5K6
Time-series length236,448
Missing Values
   Total number32,53726,47231,65628,14029,73838,954
   Percentage13.8%11.2%13.4%12.0%12.6%16.5%
   Sequence Length
         Longest234421092109210921094064
         Second Longest210915381675153915372110
         Shortest111111
         Mean6.798.868.348.718.209.02
         Median122222
Table 3. Prediction accuracy calculated with the formula from (1) for the case when the prediction strategies are used together with the forecasting method BCT. For IMV + BCT, it is also reported the runtime.
Wind FarmTurbineIMVIPPPEA
Accuracy (%)Time (min)Accuracy (%)Accuracy (%)
La Haute
Borne
R8071189.0229.8988.9987.32
R8072188.5827.6488.4286.51
R8073688.7427.9688.6086.75
R8079089.9120.0589.7188.03
KelmarshK181.8538.8281.7580.13
K283.7941.4683.6782.56
K381.9639.1881.8780.34
K481.7640.5081.6880.39
K581.8139.7881.7380.32
K682.5736.4382.4780.65
Table 4. Comparison of the BCT and CTF prediction results when PEA and IMV strategies are applied to the data collected over the course of one month: January 2013 for the La Haute Borne farm and January 2017 for the Kelmarsh farm. Note that the execution time for CTF is expressed in minutes, whereas the execution time for BCT is expressed in seconds.
Wind FarmForecasting
Method
TurbineIMVPEA
Accuracy (%)TimeAccuracy (%)
La Haute
Borne
BCTR8071191.672.4290.14
R8072191.502.1389.43
R8073692.012.0689.97
R8079092.941.8690.64
CTFR8071191.35540.4488.39
R8072191.13484.0588.42
R8073691.60495.0989.18
R8079092.17481.1389.55
KelmarshBCTK183.323.3981.49
K284.483.5183.47
K385.603.1883.83
K484.273.2482.77
K583.223.1280.96
K683.773.4081.47
CTFK181.69611.6678.07
K282.82615.9280.36
K383.86636.2681.57
K481.85631.4879.55
K581.42592.1678.12
K682.23635.4078.67
Disclaimer/Publisher’s Note: The statements, opinions and data contained in all publications are solely those of the individual author(s) and contributor(s) and not of MDPI and/or the editor(s). MDPI and/or the editor(s) disclaim responsibility for any injury to people or property resulting from any ideas, methods, instructions or products referred to in the content.

