Article

Synthetic Dataset Generation Using Photo-Realistic Simulation with Varied Time and Weather Axes

1
School of Electrical and Electronic Engineering, Technological University Dublin, Grangegorman Campus, Grangegorman Lower, D07 ADY7 Dublin, Ireland
2
School of Computer Science, Technological University Dublin, Grangegorman Campus, Grangegorman Lower, D07 ADY7 Dublin, Ireland
*
Author to whom correspondence should be addressed.
Electronics 2024, 13(8), 1516; https://doi.org/10.3390/electronics13081516
Submission received: 26 February 2024 / Revised: 1 April 2024 / Accepted: 8 April 2024 / Published: 17 April 2024
(This article belongs to the Special Issue Emerging Technologies in Digital Twins)

Abstract

:
To facilitate the integration of autonomous unmanned air vehicles (UAVs) in day-to-day life, it is imperative that safe navigation can be demonstrated in all relevant scenarios. For UAVs using a navigational protocol driven by artificial neural networks, training and testing data from multiple environmental contexts are needed to ensure that bias is minimised. The reduction in predictive capacity when faced with unfamiliar data is a common weak point in trained networks, which worsens the further the input data deviates from the training data. However, training for multiple environmental variables dramatically increases the man-hours required for data collection and validation. In this work, a potential solution to this data availability issue is presented through the generation and evaluation of photo-realistic image datasets from a simulation of 3D-scanned physical spaces which are theoretically linked in a digital twin (DT) configuration. This simulation is then used to generate environmentally varied iterations of the target object in that physical space by two contextual variables (weather and daylight). This results in an expanded dataset of bicycles that contains weather and time-varied components of the same images which are then evaluated using a generic build of the YoloV3 object detection network; the response is then compared to two real image (night and day) datasets as a baseline. The results reveal that the network response remained consistent across the temporal axis, maintaining a measured domain shift of approximately 23% between the two baselines.

1. Introduction

Over the years, activity within the UAV autonomy research space has led to a steady increase in published research on novel solutions for autonomous navigation features. Many of these projects use trained models to infer a solution to autonomous UAV tasks [1,2,3,4]. Previous reviews of state-of-the-art solutions in the autonomous navigation research space revealed that, of the classified autonomous features, collision avoidance, obstacle detection, and object distinction (including object detection) were the most popular research topics. Only approximately 7.7% of the projects examined over the 5 years prior to this review considered operation in more than one environment [5]. A suspected reason for this is the lack of training datasets that are of appropriate size and quality (e.g., varied and with key elements present) to achieve good generalisation in multiple environments [6,7]. One of the biggest challenges for autonomous UAV navigation training is the availability of training data; even common environments such as urban, suburban, forested, or rural areas have so much variation in terms of environmental contexts that it is not feasible to manually gather a dataset on all variations. Additionally, environments do not have binary transitions, but shift from one to the other over a gradient, such as a suburban area shifting into a rural area as one travels from one environment to the other. This issue is compounded when considering other environmental factors such as daylight level, weather variation, or outdoor/indoor contexts (e.g., artificial light, reflective surfaces, and types of obstacles). The results of these issues are that autonomous systems perform well inside a specific environment, but the performance (e.g. precision, recall) drops off as the parameters of the environment deviate further from the average used for the training set. While it is possible to use augmentation methods to make up for a lack of samples, and doing so is known to prevent overfitting [8,9], the issue with these methods is that samples are created by mostly recycling old information. If a dataset of colour images contains N samples and a theoretical amount of unique information, defined as M, then the average unique information per sample is defined as L = M / N . This implies that if augmentation is used to inflate a dataset through the injection of noise, image skewing, or other common transformative methods, the number of samples in the dataset increases but the amount of unique information in the dataset remains the same, unless new information is injected during the process. This results in more samples, but less unique information per sample, which is a problem that is solvable through simulation. By using a simulated area, a researcher is capable of creating new samples while maintaining the amount of unique information per sample up to a theoretical limit L = M / N ; 0 < M M m a x , where M m a x is the maximum unique information contained within the simulation. Using this project as an example, M m a x can be considered as the information from the 3D scan data and textures, all the possible environmental contexts the simulation can create, and all the possible object and camera positions and configurations, with no repeating information. The proposed solution intended to utilise simulation and 3D scanning, with the potential use of the spatial elements of the physical object to maintain a DT link (a method where a simulation of a subject is used in tandem with a physical subject in order to model in ways that are more informative than traditional experimentation [10]) in the simulation. The simulator shown in Figure 1 demonstrates how the Unity game engine can be used to rapidly create a simulator that uses a combination of 3D scanning techniques to reconstruct an area. The method outlined in Section 3 details the construction of this simulation and the generation of an entirely artificial dataset that could be analogous to a real-life counterpart. This artificial dataset is then tested on a publicly available, pretrained version of the YoloV3 object detection model with no retraining in order to gauge the response of a dataset that is trained on realistic data [11]. The benefit of this approach is that it can generate not just realistic image samples with unique content, but samples with the same content under unique environmental conditions, notably weather and daylight variations, which this work demonstrates in Section 4. The full process for this approach can be found in Figure 2.
Testing synthetic data via a popular object detection model provides an accurate gauge of the domain shift present in the simulation, given the environmental variance introduced in the simulation; this allows for the measurement of the domain shift across each dimension, as long as it is compared to a valid baseline. To summarise, the contributions of this paper are as follows:
  • It outlines a novel method for the generation of synthetic samples for image-based training by using 3D scanning and a photo-realistic game engine.
  • It simulates weather and light changes to create a contextually varied image dataset for the potential training and testing of image-based autonomous navigators.
  • It tests the environmentally varied dataset against a commonly used generic YoloV3 object detection model and compares it to a realistic baseline to demonstrate the consistency in simulation performance against real image data.

1.1. Autonomous Navigation

Autonomous navigation tasks tend to be complex, requiring physics calculations [12], state estimations [13,14,15], perception [16,17,18], and decision making [19,20]. However, the problem of autonomous UAV navigation is partially solvable through the implementation of rule-based solutions. For example, collision avoidance can be achieved through the use of lidar-based sensors and an autonomous navigator programmed to maintain a certain distance from nearby detected obstacles. The downside of this is that it must be developed, tested, and maintained manually, usually on a per drone basis. These solutions are typically reliant on onboard hardware which increases the cost of implementation alongside potential patent and licensing costs. With this in mind, using a trained network to read the input from a monocular camera as a navigator is an attractive option, despite the scalability issues discussed in the following section. These issues may not hinder autonomous UAV implementations mechanically, but could hinder them in terms of legislation. As an example, the European Union Aviation Safety Agency Special Condition guidelines [21] state that: “Certification of light Unmanned Aerial Systems with highly integrated systems will be fundamentally based on a safety assessment that includes thrust/lift/power systems and also interaction with structures”, which implies investigation into specific navigational features.

1.2. Specificity

Image-based neural networks will typically have issues maintaining accuracy in environments which the autonomous navigator is not trained for [22]; in certain cases, these issues are considered to be the trade-off for performance (i.e., network response time) in a solution based on how specific the task is [23,24]. By restricting the scope down to a single environment, the requirements in terms of data acquisition, training, and optimisation can be reduced in both time and complexity. However, it should be expected that this also impacts the robustness of the solution, a problem which is referred to as “specificity”. A network that is trained on data that are too specific will inevitably be unable to perform well near or beyond the edge cases of that scope. Specificity is often considered to be a subset issue when a network is overfit to its given task. The reduction in task-specific performance in generalised models is especially important to be aware of with perception-based UAV navigation [25] given that the task carries inherent risk to the hardware and surroundings.

1.3. Areas as Digital Twins

The DT concept originates from the manufacturing industry [26,27,28], and states that insights, i.e., previously unknown information regarding a specific topic, can be extracted through the use of a simulated replica of a product [10,29]. The most valuable component of this concept is that the transference of data between the physical and simulated model is bi-directional, meaning that as the simulated object can provide insights into the physical object, so to can the physical object provide insights into the simulated object. As an example, if one were to simulate a box of specific weight and dimensions in digital space as a DT by tracking the box using a camera, the physical box provides insight into the position of the box in digital space, and the DT provides insight into the velocity and predicted position of the box in the physical space. Additionally, effects applied to the DT will inform the researcher as to how the physical product will respond without having to risk damage to the physical product, which is of specific value to UAV research. The DT concept can be expanded to include multiple simulated components, referred to as a digital twin domain, with the benefit of this being that insights can be gleaned not just from the simulated components but from the interactions between them [30]. More recently, in the referenced paper, the author highlights the recent expansion of the DT concept as it enters into new areas beyond manufacturing, and specifically how the term has branched into various contextual types based on what is wanted or designed from a given DT, whether that is physical accuracy, low response times, or a high level of parameter control [31]. In terms of implementing DT concepts in autonomous UAV navigation, one could consider the drone components, including the rotors, PWM controllers, FMU, Telemetry Radio, GPS, and frame, as elements of this simulated domain. However, this research focuses on considering the spatial region around the drone as a component of the DT for simulation, which could allow for a digital twin domain that is spatially linked to a physical one in which a researcher could generate training samples with any environmental variation for use in a navigational network. Furthermore, the parameters of the environment would be controllable, allowing for quantitative implementation of non-ideal situations such as low light levels, poor weather, or obstacles while maintaining the link to the physical space. Without this physical link, results from any of the above approaches would not be quantifiable to reality, which is the key advantage a DT approach has over standard simulations [32,33,34].

2. Background

Historical debate argues that simulation is inherently unfeasible due to the inability to model all possible aspects of a natural scenario [35]. While this statement is mostly true, it forms the basis of a false equivalence that simulation is not accurate for realistic tasks because the simulation will not be a perfect model of that realistic scenario, and any visible domain shift seen in academic results is too easily attributed to this and less so to the approach of the researcher. As rendering technology improves, the task of data simulation and the concept of using simulated data as training data for neural networks needs to be re-evaluated. Current tools utilised in modern academic simulations for autonomous navigation are often built from retrofit rendering engines that are decades old [36,37]. There is little investigation as to the benefit of modern simulation features or the growing availability of 3D-scanned assets, which could have a considerable impact on the success of trained-on-simulation networks [27,38]. Prior research demonstrated the potential for bespoke simulations constructed from the shell of cutting-edge game engines and integrated development environments for the purposes of synthetic data generation that are analogous to reality [10,39].

2.1. Trained Autonomous Features

Previous work compiled the literature from several academic sources on the advances in autonomous UAV navigation with the purposes of aligning autonomous UAV navigation with the “Levels of Autonomy” typically used for autonomous driving terrestrial vehicles [5]. From this review, a taxonomy was developed to assist with the definition of a viable research space in order to determine what areas are actively being researched and which, if any, are open for further investigation. Of these features, the most popular as research topics were found to be autonomous movement (57.14%), collision avoidance (53.85%), and object distinction (34.07%). Conversely the least popular by a wide margin was environmental distinction (7.69%). Of these papers, Deep-Learning-based solutions to tasks related to autonomous UAV navigation are more common than those of any other approach. The specific approaches that these projects took differed in task but were related to common Deep Learning techniques applied in other fields; for example, papers related to object distinction typically utilised classification or object detection models to achieve this [40,41,42]. Unsupervised or reinforcement learning was largely unseen in the aforementioned papers on autonomous UAV navigation [43]. Surprisingly, no projects with the environmental distinction feature considered environmental contexts (such as specific weather events or climate) beyond those of specific region types such as urban or suburban. This is likely due to a lack of quality training samples for multiple environment navigation; therefore, the development of a method for generating samples in multiple environments has considerable potential for the advancement of partially generalised autonomous UAV navigation.

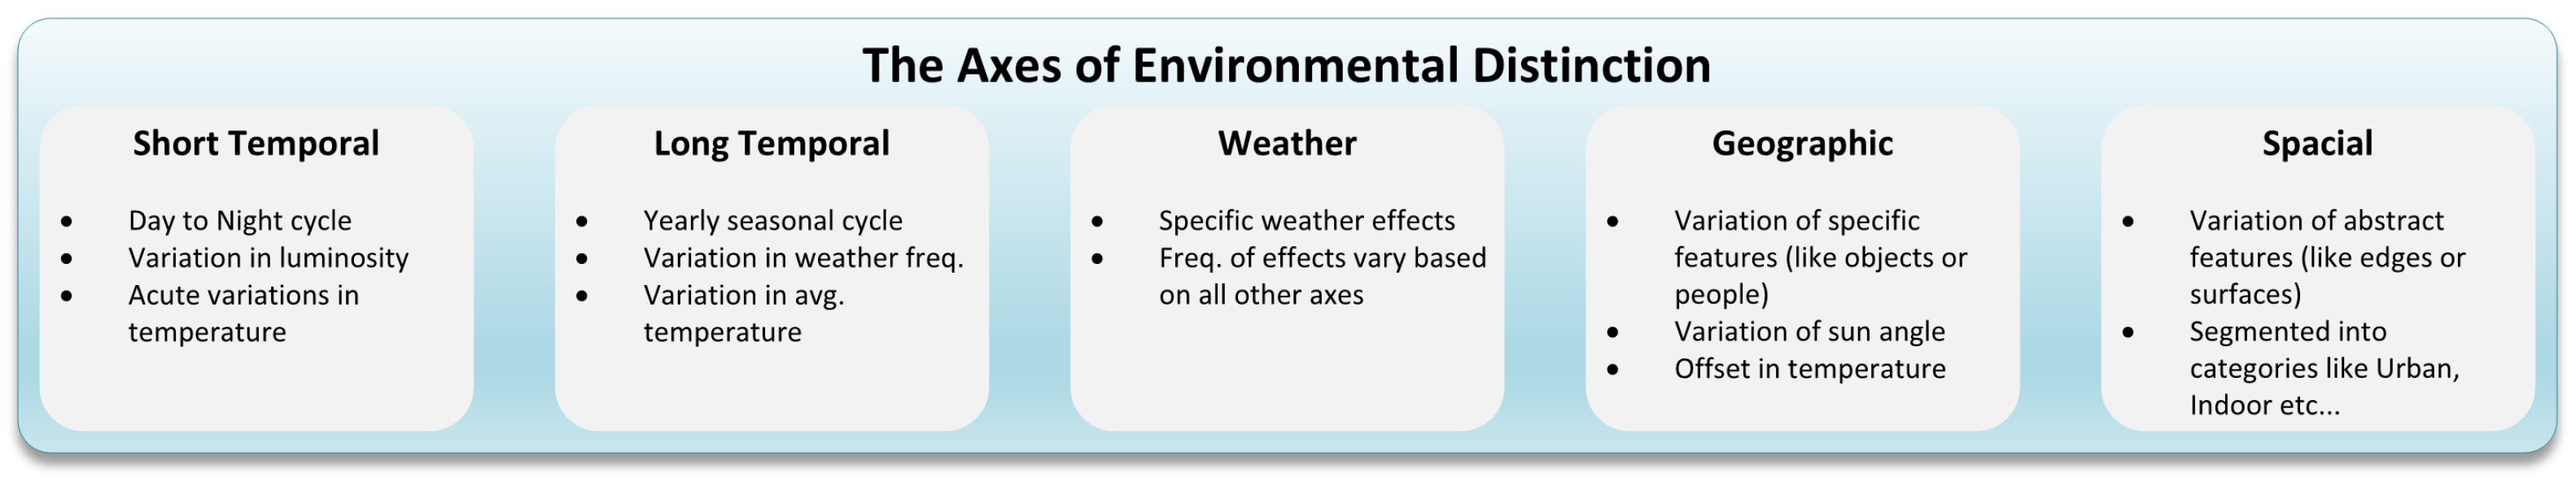
2.2. Environmental Variation

The most common method for dataset generation is session-based sampling with expert annotation occurring at the time of sampling or post-session, with large datasets taking multiple sessions to generate [7]. Due to this, it is guaranteed that environment variables will change, both between sessions and during sessions (depending on collection methods). This issue is exacerbated in image-based data gathering, as the complexity of the data naturally biases the information to the many environment parameters of the sampled area (e.g., an image dataset created at noon during cloudy weather in Ireland will naturally bias the trained network to that time, weather type, and location). Figure 3 describes some of the environment-specific parameters that can affect an image. Each “axis” of variation is based on frequency, time, or location. Even when assisted electronically, sampling the entire gamut of change for multiple environments manually is unfeasible due to an exponential increase in the information needed to be collected and stored and the effort of sampling when considering multiple axes together. This explains why the vast majority of modern autonomous navigation solutions found in the literary review make up partial solutions for only the “spatial” and “geographic” axes [5]. A significant portion of the possible variation in an image is attributed to “short temporal” and “weather” axes, which are unrepresented in most datasets and solutions. With this in mind, this research seeks to resolve this exponential scaling issue through simulation while also exploring these two less considered parameters.

2.3. Simulating Data

The use of artificial data as training data is becoming more common with the popularisation of general adversarial network (GAN)-type models [44]; artificial data have been previously employed for the training of base models which were then later fine-tuned with manually collected real data [45]. This shows that certain tasks benefit from the information that simulation can provide [46,47,48], especially when dealing with unknown areas or scenarios. One of the major benefits of using simulated data is that they allow for a greater degree of control during the collection phase, aside from environmental variance [49,50]. As an example, when generating synthetic data, to pause the simulation runtime and generate all the samples before resuming, this effectively negates the passage of time in the simulation and removes usually uncontrollable elements such as delays introduced by the relocation of sampling equipment or the internal or external operation of physical hardware. However, simulation does introduce a measure of domain shift, which can be mitigated but will likely always be present to some degree. Additionally, this work involved in the creation of bespoke simulations can often be more effort than simply manually gathering the data; as such, it is recommended only for situations where the benefits can outweigh the costs of development, which modern optimised development software such as game engines reduce significantly.

3. Method

The core of this solution relies on the utilisation of three-dimensional scenes which are accurate reconstructions of physical locations created via a process such as photogrammetry, lidar scanning, or both. These are referred to in this paper generally as “3D scans”, as some more common terms for these are trademarked. The process of finding, selecting, or creating suitable 3D Scans for use in sample generation is challenging, especially for the task of training autonomous UAVs for navigation. The 3D scan cannot simply be a ground-level representation; downward angles and high points such as rooves and treetops must also be represented accurately, and, as is the case with any 3D scan, it is likely necessary to sample well beyond what would be expected inside the use case. The 3D scan must of sufficient resolution to not cause artifacts in the resultant captured mesh. However, the scan must also have enough physical size to be able to gather a valid dataset of the scene without overexposure to any of the model’s artifacts or errors, while also being of an acceptable filesize to be loaded into system memory for the duration of the sampling run. Additionally, as it is with image data, the sampled scene will be effected by the previously stated intensity and frequency of environmental parameters and effects. It is recommended that, for sampling an area for the creation of a 3D scan, sampling is performed on an overcast day at midday as this will result in a bright, softly lit model with fewer sharp shadows which can affect the accuracy of simulated time and weather.

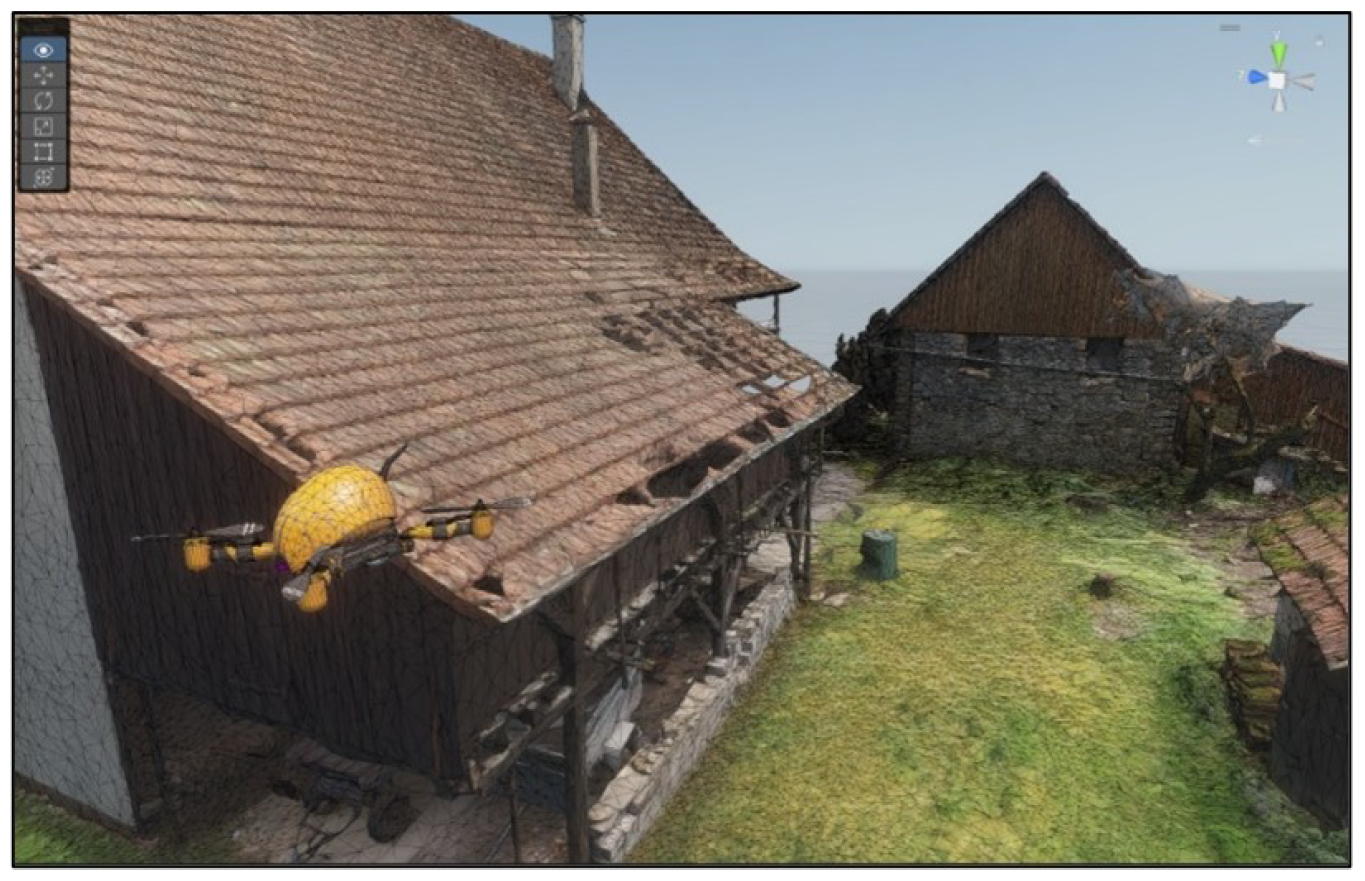
3.1. Three-Dimensional Area Scans

While it is possible to recreate large area scans without expensive equipment through the use of commercially available or open source photogrammetry tools such as Meshroom and decent smartphone cameras [51], due to time constraints, this was considered outside the achievable scope of this project. The potential for maintaining a DT approach in the simulation remains possible by using spatial measurements of physically accessible locations as a DT link, and is intended for future expansions on this project. For this proof of concept, the referred 3D scan from Sketchfab [52] was used as a placeholder. Six areas were originally selected, ranging from various locations to structural archetypes such as urban, suburban, and rural areas. Only one of these scenes was used during testing, with the intention to bring in additional environments over time as the project develops. While some scans were discarded due to quality issues, the size and the proportion of natural to artificial structures were of particular interest. The scan that was chosen for this experiment was taken so that it contains a good mix of buildings and greenery alongside a good resolution quality and area size. Generally, the area scan quality is considered to be a trade-off for area scan size. For most scans, a researcher will select several points from which the scanning hardware will sample the area, and it is expected that the quality will decline as the distance from the nearest sampling location increases. Creating a scan of a large area with a consistent high resolution can be achieved with many sampling locations and by combining different sampling hardware, but this can cause other quality issues with the texture and accuracy of the scan (for outdoor areas) due to the increased sampling session time. Additionally, since scans are sampled from physical areas, the lighting information and some weather effects from the time of sampling become baked into the scan. To mitigate this, it is recommended to sample around midday and in overcast weather for the most even lighting and minimal weather impact on the resultant mode, although it may be viable to create multiple scans for common weather types in order to achieve more realistic weather simulations. Even with bespoke scene creation, it is unrealistic to expect to gather high-resolution scans of a large area; in most cases, the scenes are composed of high-resolution point clouds which diminish in resolution the further they are from the source of the sampling device. Though it is not impossible to create a scan of an area with a consistently high resolution by using multiple sampling points and techniques, longer scan times increase the deviation in lighting and texture (for outdoor scans), which may require post-processing to repair (potentially affecting the connection between the simulation and the real scene).

3.2. Scene Configuration
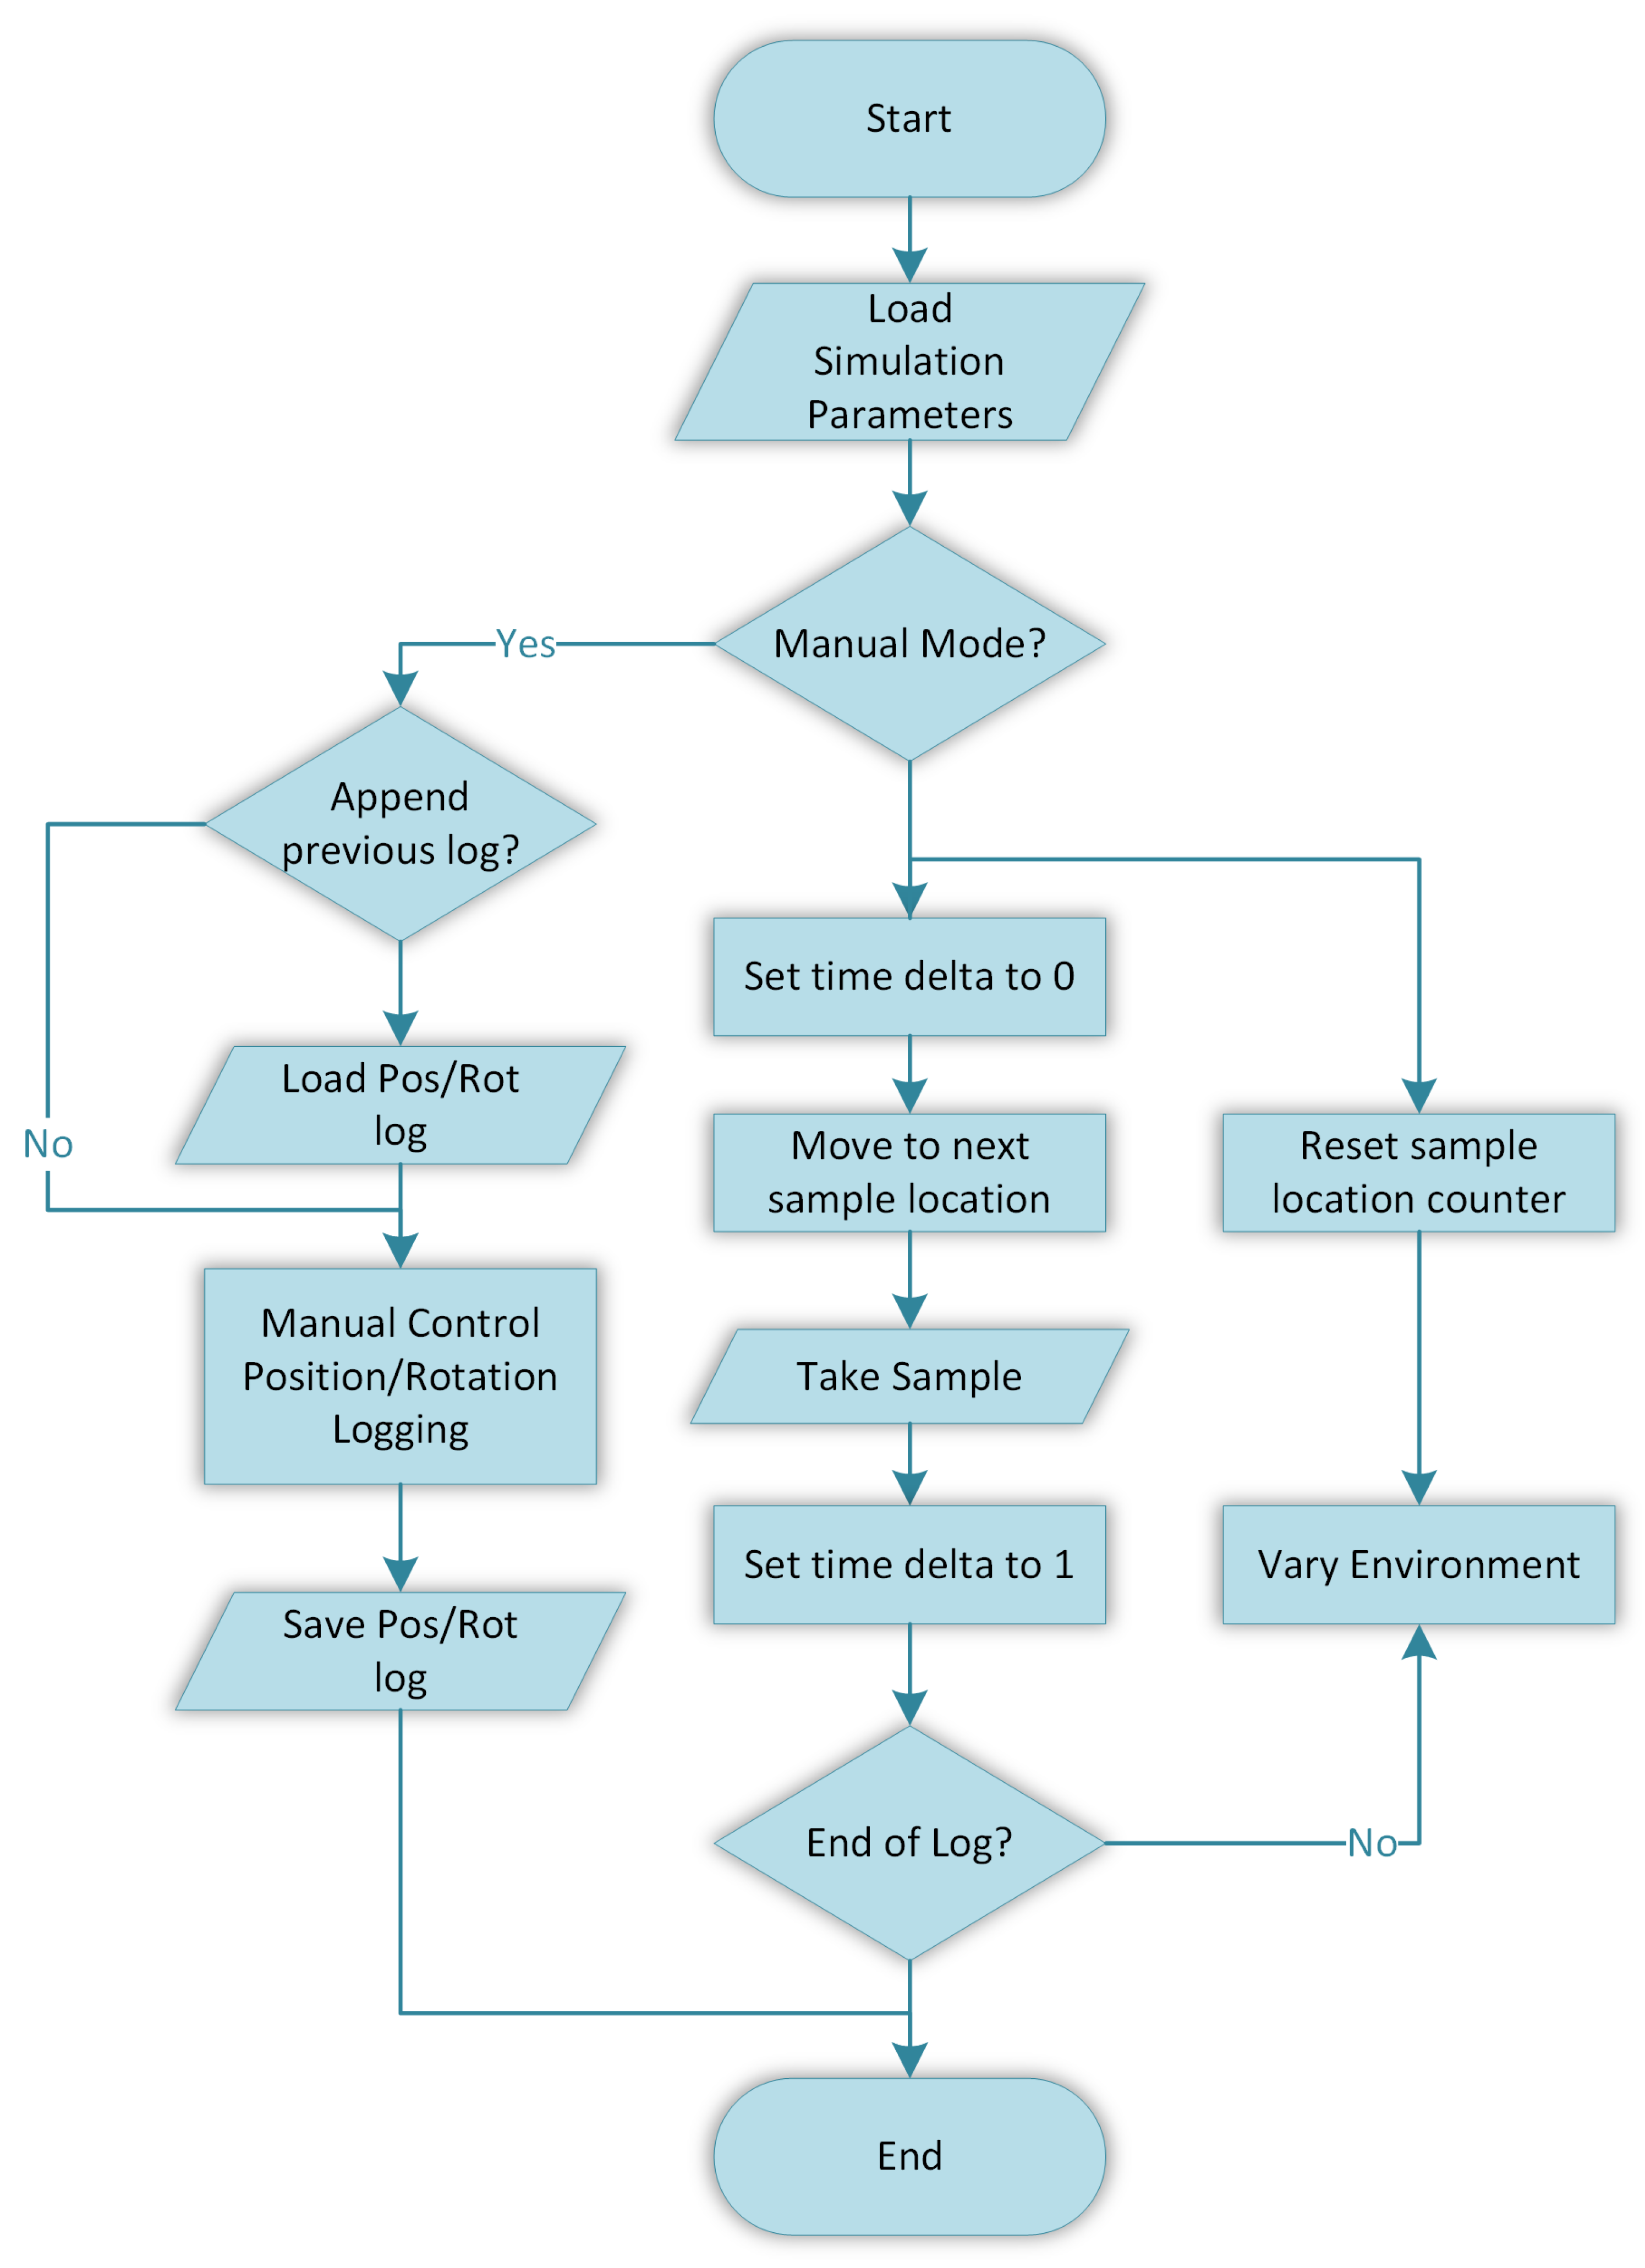
For this synthetic dataset to be generated, first it was necessary to gather appropriate 3D-scanned assets fitting the “bicycle” class. This class was chosen specifically due to it being a detectable object by the YoloV3 algorithm and the ease of finding real image datasets and 3D scans of the object. Note that this method is not object-specific and could be completed on any object. For example, canine animals are another popular classifiable object that were considered for testing this method; however, quality 3D scans were harder to find and generally of a lower quality than those of more static objects. For this experiment, five assets were sourced from the same repository as the scene geometry [53,54,55,56]; a description of these assets can be found in Table 1. They represent an acceptable spread of different bicycle types by two defining factors, these being the frame size and tires of the object. Each asset was placed in an independent area within the scene; a visual comparison of each object can be found in Figure 4. It is important to note that while each bicycle is a unique asset, Bike 3 and Bike 4 are the same model of children’s bicycle but in different colours. Once the 3D scans were imported though the user interface, they were configured in a similar fashion to prior research. Area scans that were web sourced were calibrated to match the approximate average size of a European door frame width at 0.8 m, while bicycle assets were scaled to approximately match either an adult- or child-sized bicycle. For ease of operation during the manual collection phase and for future research in autonomous navigation, the simulation was equipped with a UAV drone control scheme from previous work, which was modified with the features needed for location logging. A gamepad input control was included to streamline the manual collection process and enable the rapid generation of new lists of sample locations. For this, a standard Xbox One gamepad device was used, as it has a high similarity to a UAV control transmitter. The control scheme was programmed into the simulation using the Unity Input System, which is preferable as the C# functions are created by the manager and are then applied to any number of chosen control inputs. For example, the horizontal movement function is tied to the left control stick on the gamepad, or the ‘w’, ‘s’, ‘a’, and ‘d’ keys on the keyboard, and can be rebound at any time without rewriting the function. For the dynamic weather system, a popular package was acquired on the Unity asset store [57]. This weather package was chosen for its high level of documentation, its integration with other useful packages for expanded simulator functionality down the line, and for the high level control of time and weather configurations. With this system in place, six different weather configurations were developed for generating a weather-varied and time-varied dataset.

3.3. Sampling

As previously stated, because temporal flow can be adjusted in real time while the simulation is running, it is possible to remove any deviation between samples recorded in different locations within a cycle. Figure 5 is an amended flowchart designed to maximise the benefit of this property and outline the general sampling process. The process consists of a manual phase, which is first used to collect the position and rotations of the camera for each sample, and an automated phase, which moves the camera to each position and rotation, which then generates the images at that iteration. This process then repeats for every iteration defined in the simulation. The result of this process is a dataset that can be sliced in more dimensions than normal manual collection would allow. Prior work [39] used a recording system which manually logged simulation elements such as the drone’s position and rotation for each sample, as well as miscellaneous data such as the sample ID, which was then retained for use over multiple simulations. This approach enables environment variation when generating data while maintaining the same perspectives, since the positional information of the drone is the same between cycles. When generating data through simulation, hardware is often considered as “ideal” (i.e., perfect operation with no sampling delay). This effect is generally considered as a negative trait; however, it can prove advantageous in this use case, since the relationship between the simulation and reality is baked into the dimensions of the already scanned area, and as such there is no need for realistic hardware simulation. Aside from the manual phase of location logging and defining the weather and time configurations, the rest of the process is automated and will run until all samples are generated. For later reference, each sample is tagged with valuable metadata, namely the cycle iteration number and sample ID which is encapsulated in the filename.

4. Results

For this round of image generation, a manually defined position and rotation log containing 410 unique positions was iterated over four weather configurations (described in Table 2 and shown visually in Figure 6) and twelve time settings covering a 24 h period, equally spaced at 2 h per setting (see Figure 7). This created a dataset which contains 19,680 images. Each new position in the simulation log creates 48 unique images which are exact to that position but varied in time and weather. This makes it possible to slice the data in ways that are unfeasible in traditional sampling (see Figure 8). As an example of the image total stated above, each slice of the weather axis contains 4920 images, and each slice of the temporal axis contains 1680 images. For the generation of the rotation/position log, consideration was taken to sample at realistic angles and distances, varying from very close (within 1 m of the object) to a “background” distance (approximately 15 m), and angles were varied in terms of pitch to include low-pitch shots similar to a pedestrian photo and high-pitch shots similar to that of a UAV drone or security camera. Additionally, for some images, angles and distances were chosen to include several objects within the frame. As a comparison to this simulated dataset, two additional datasets of real bicycle images were sourced online [58,59] and manually trimmed to create a “day” and “night” image dataset. To minimise the effect of real images whose contexts sit outside the scope of the simulation, the datasets were screened to remove images that did not fit the qualitative criteria (e.g., images of interior environments and exterior environments with excessive artificial lighting, overly stylised images and artistic composites, and images where bicycles were tightly stacked together such as overcrowded bike racks). Since YoloV3 detects multiple objects within a single image, multiple bike images were accounted for in the simulation, and so they were allowed as long as bicycles were not stacked on top of each other. It is important to note that the virtual daylight cycle is out of phase by approximately 2 h, which results in a virtual “sunrise” at 04:00 h and virtual “sunset” at 18:00 h; since the daylight axis is cyclical, this phase shift has no meaningful impact on the results.

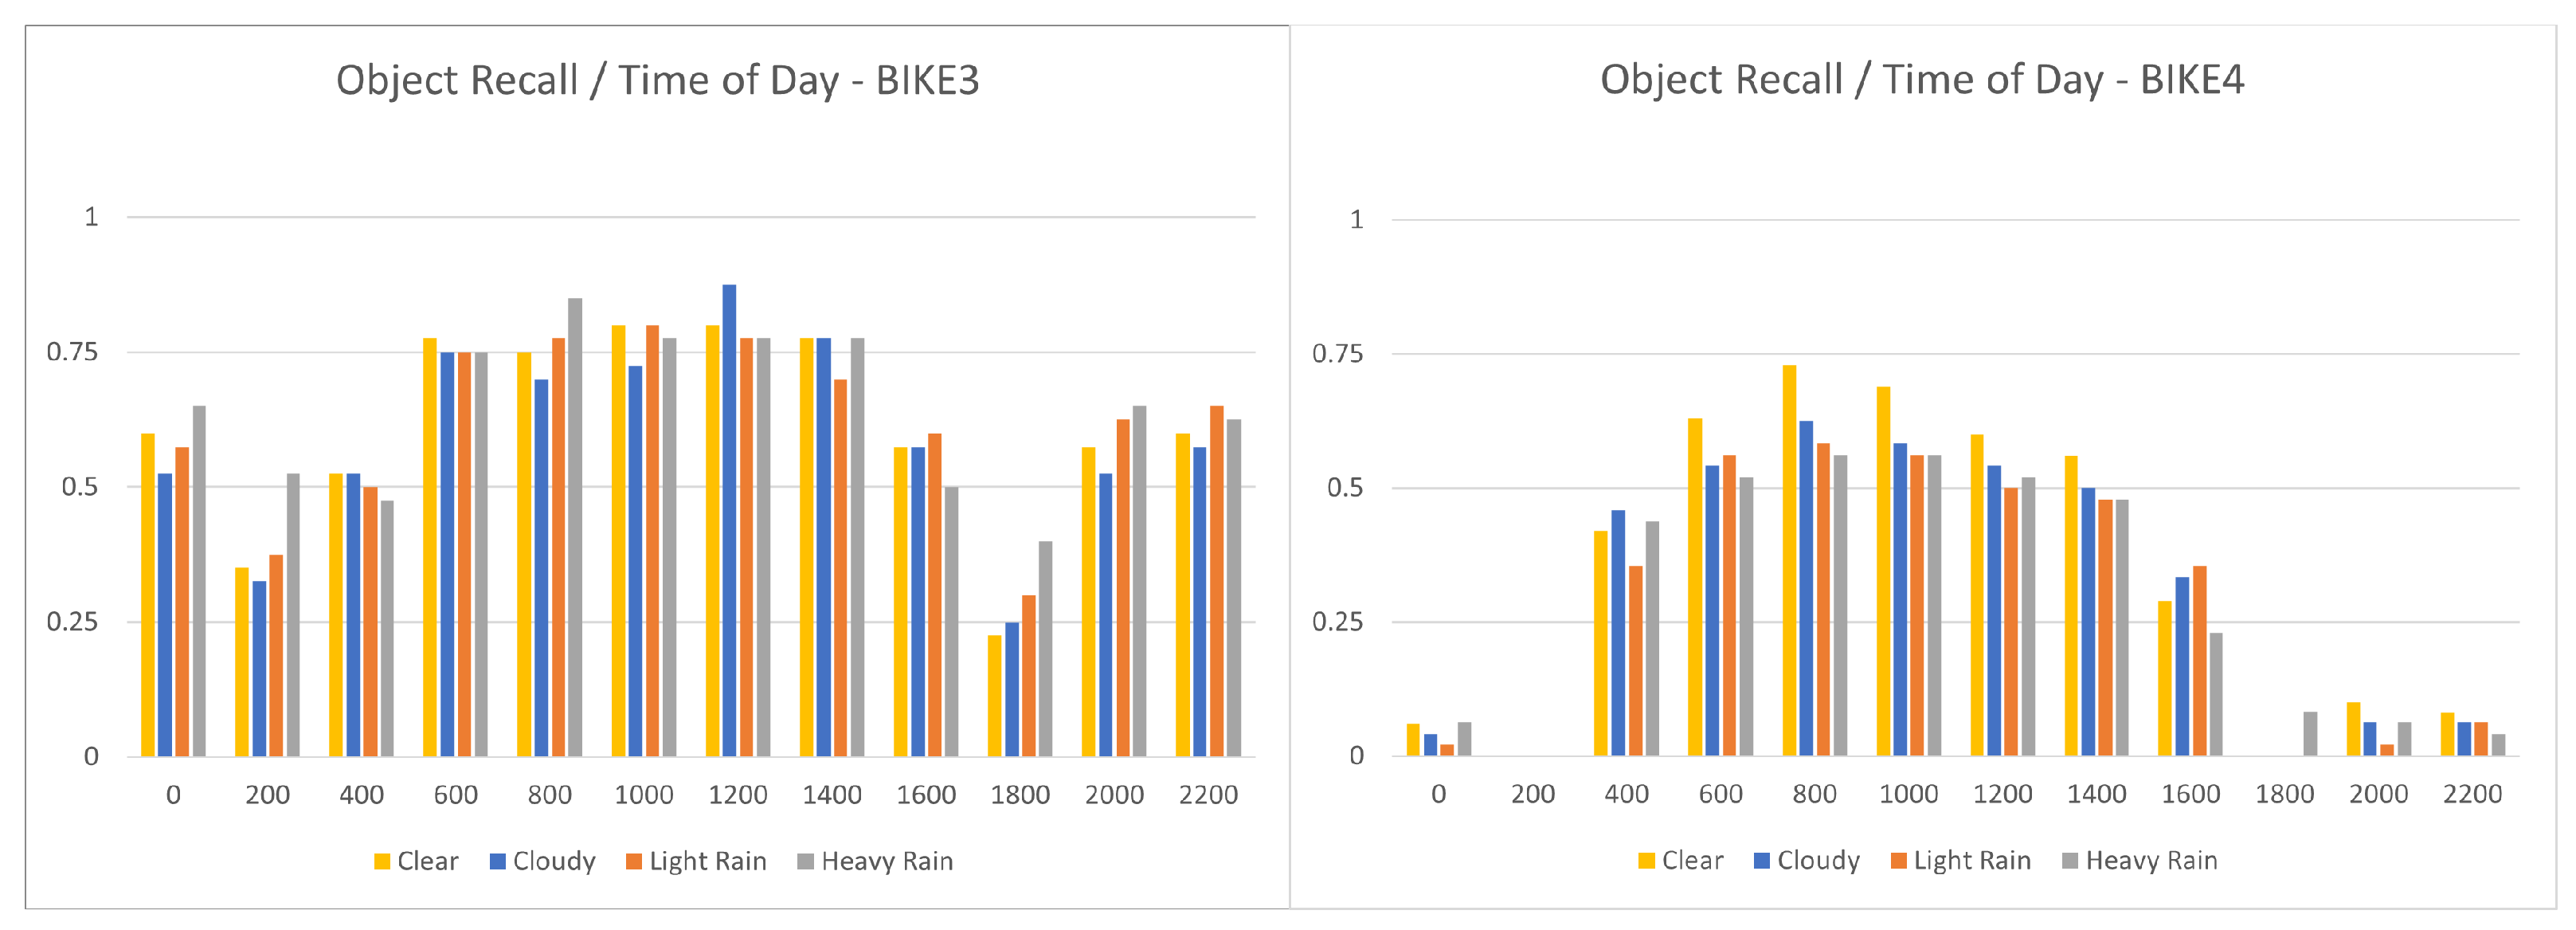
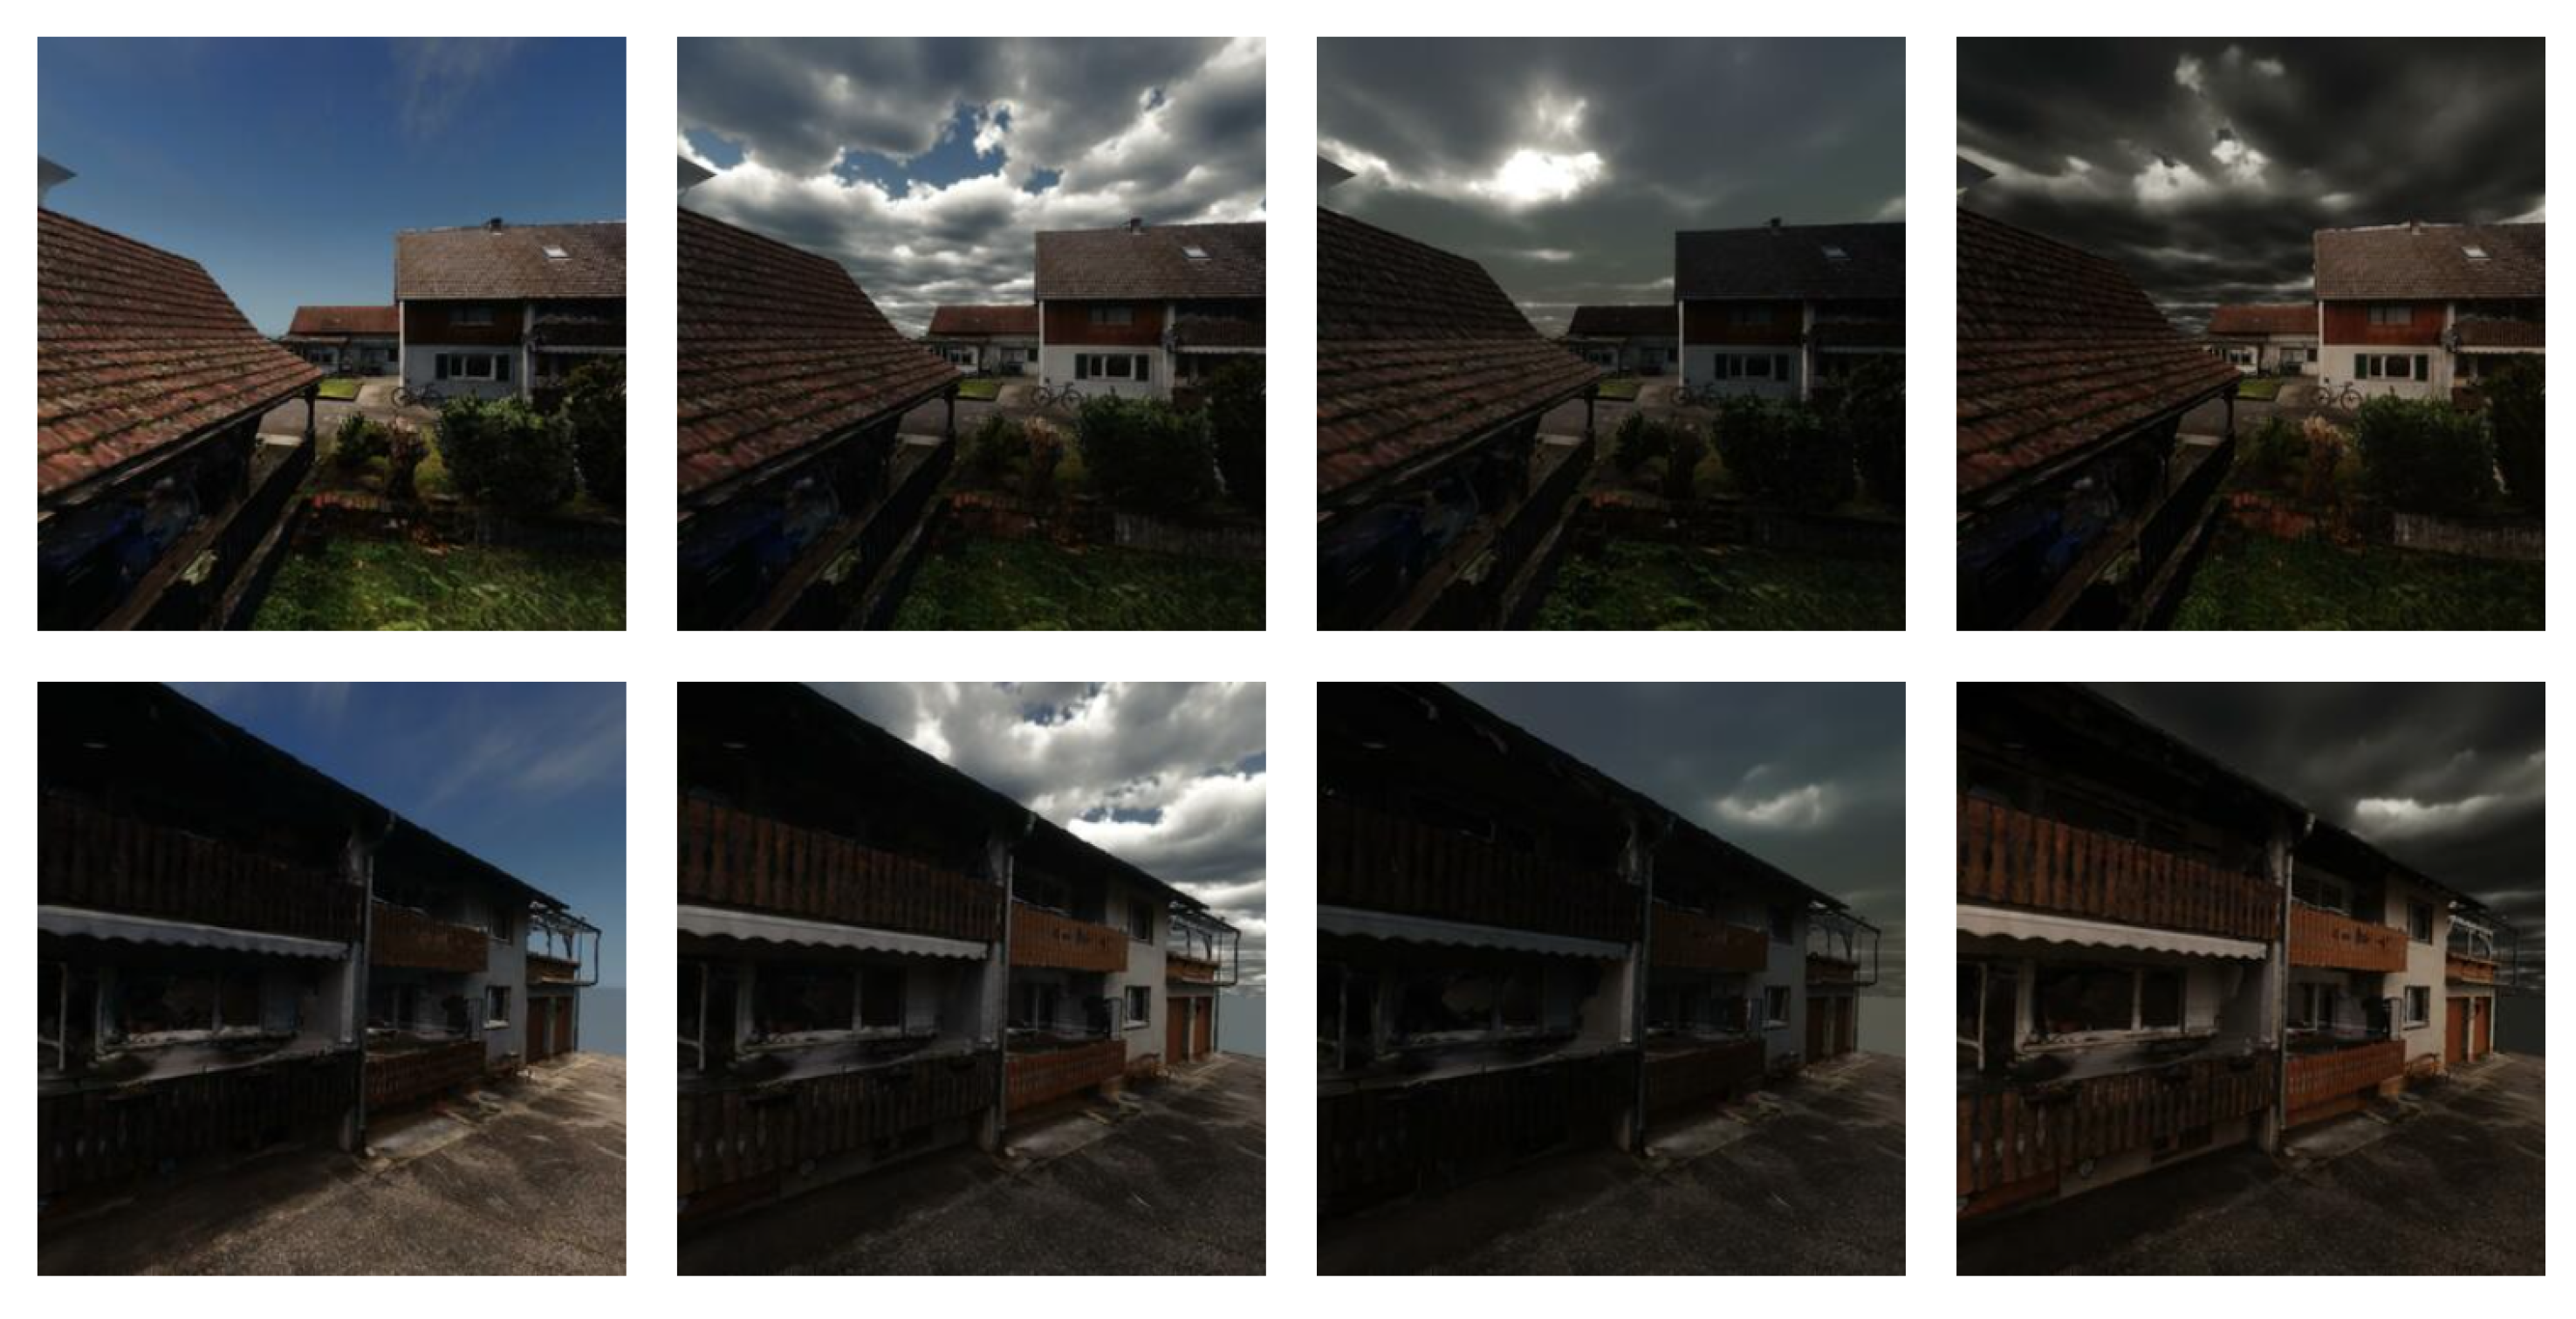
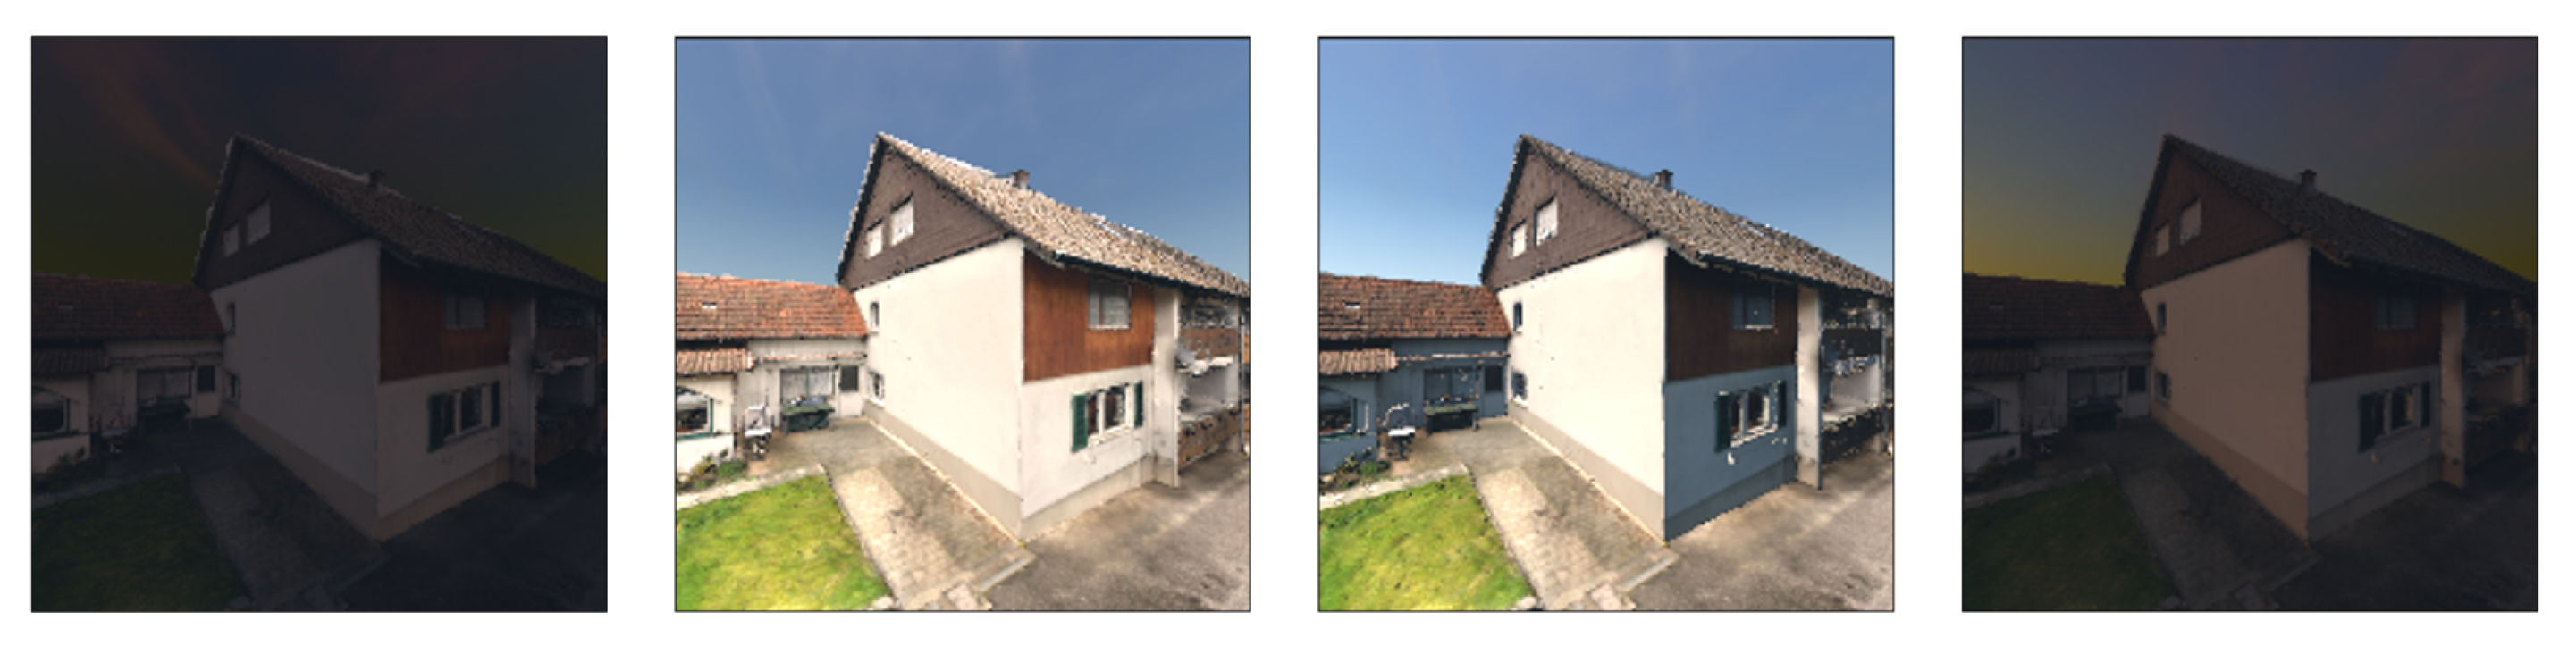
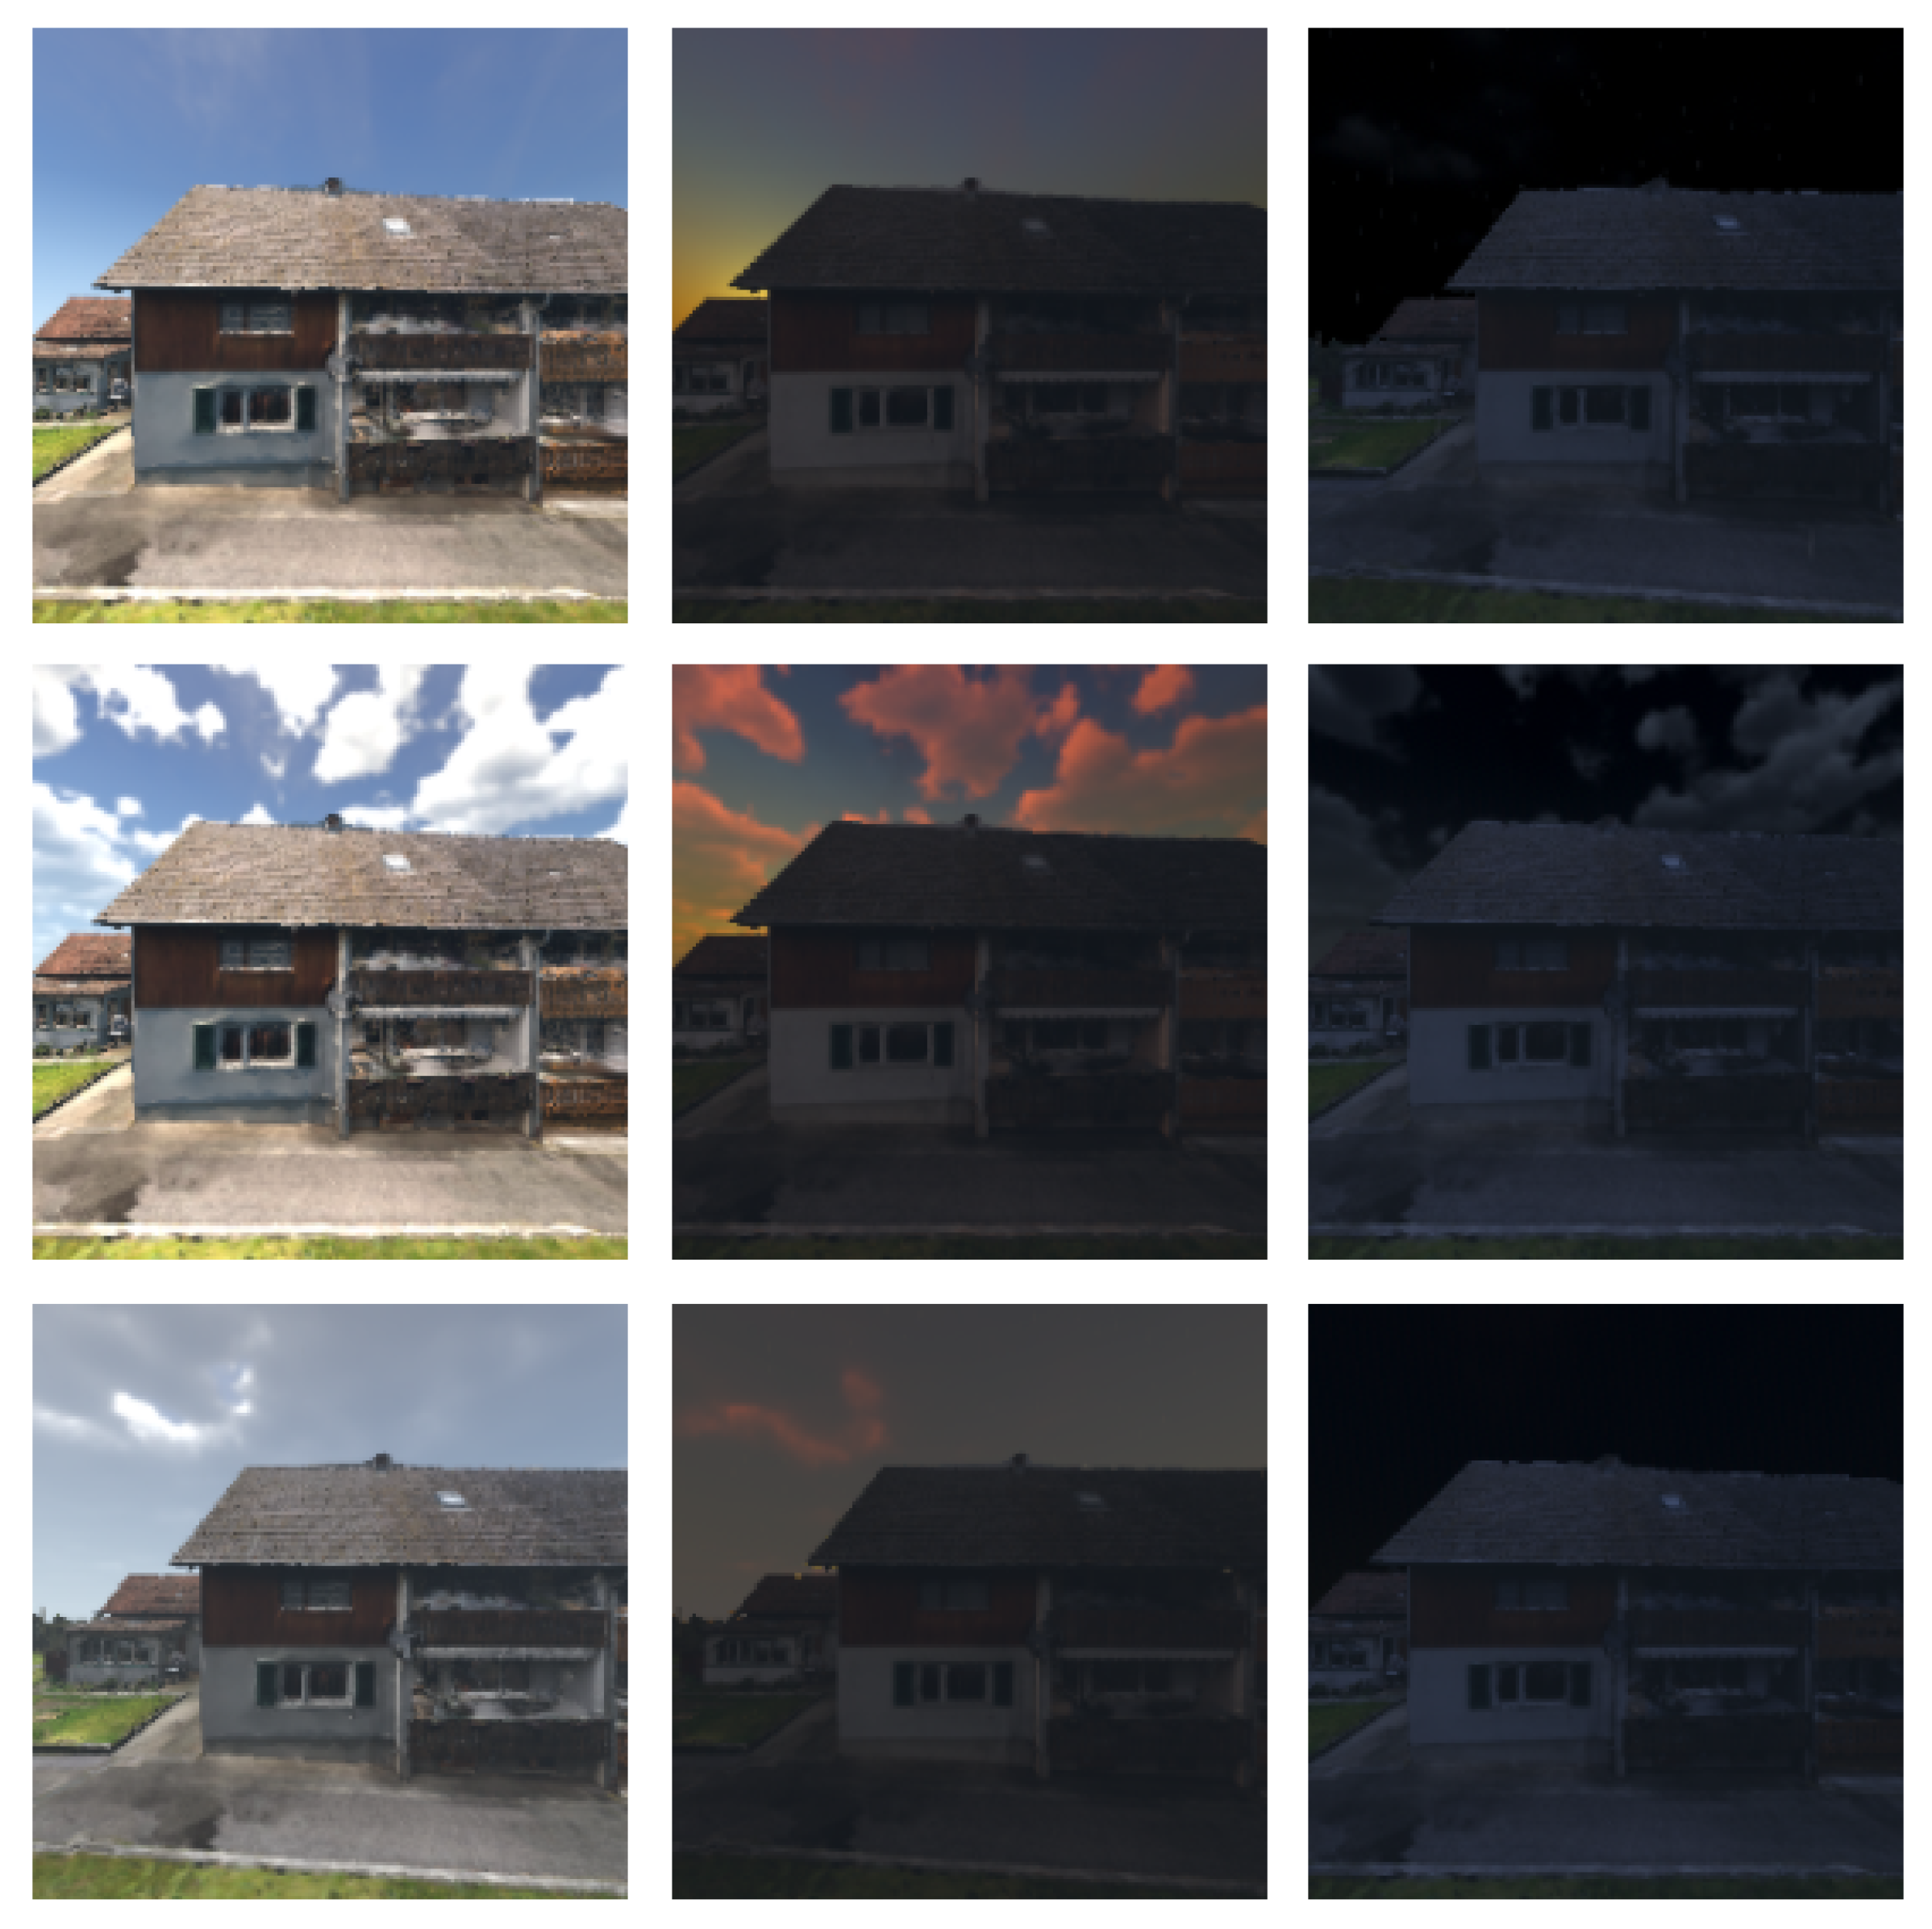
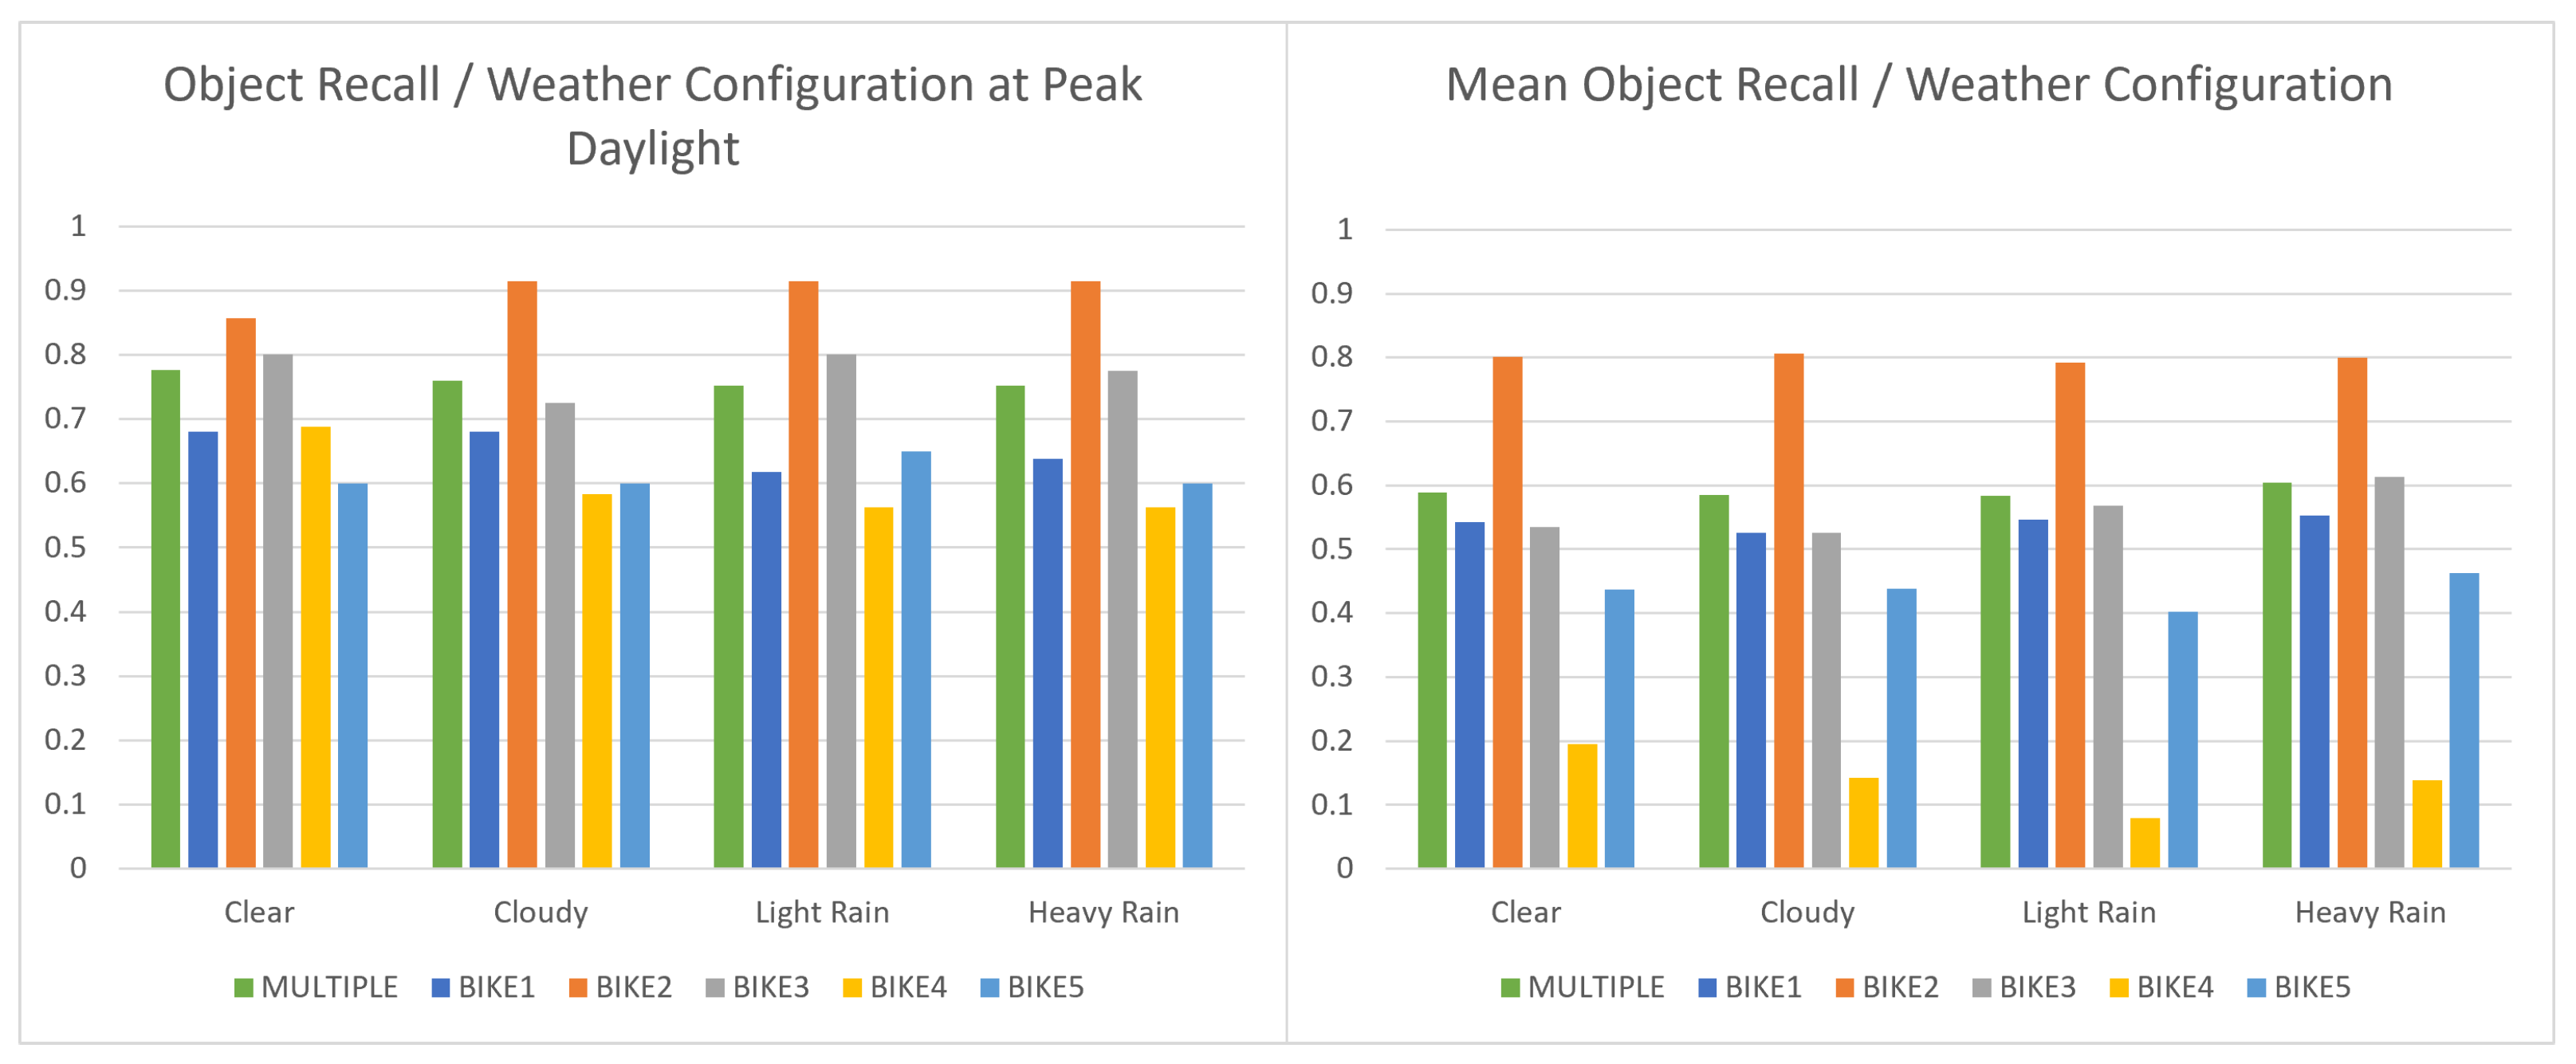
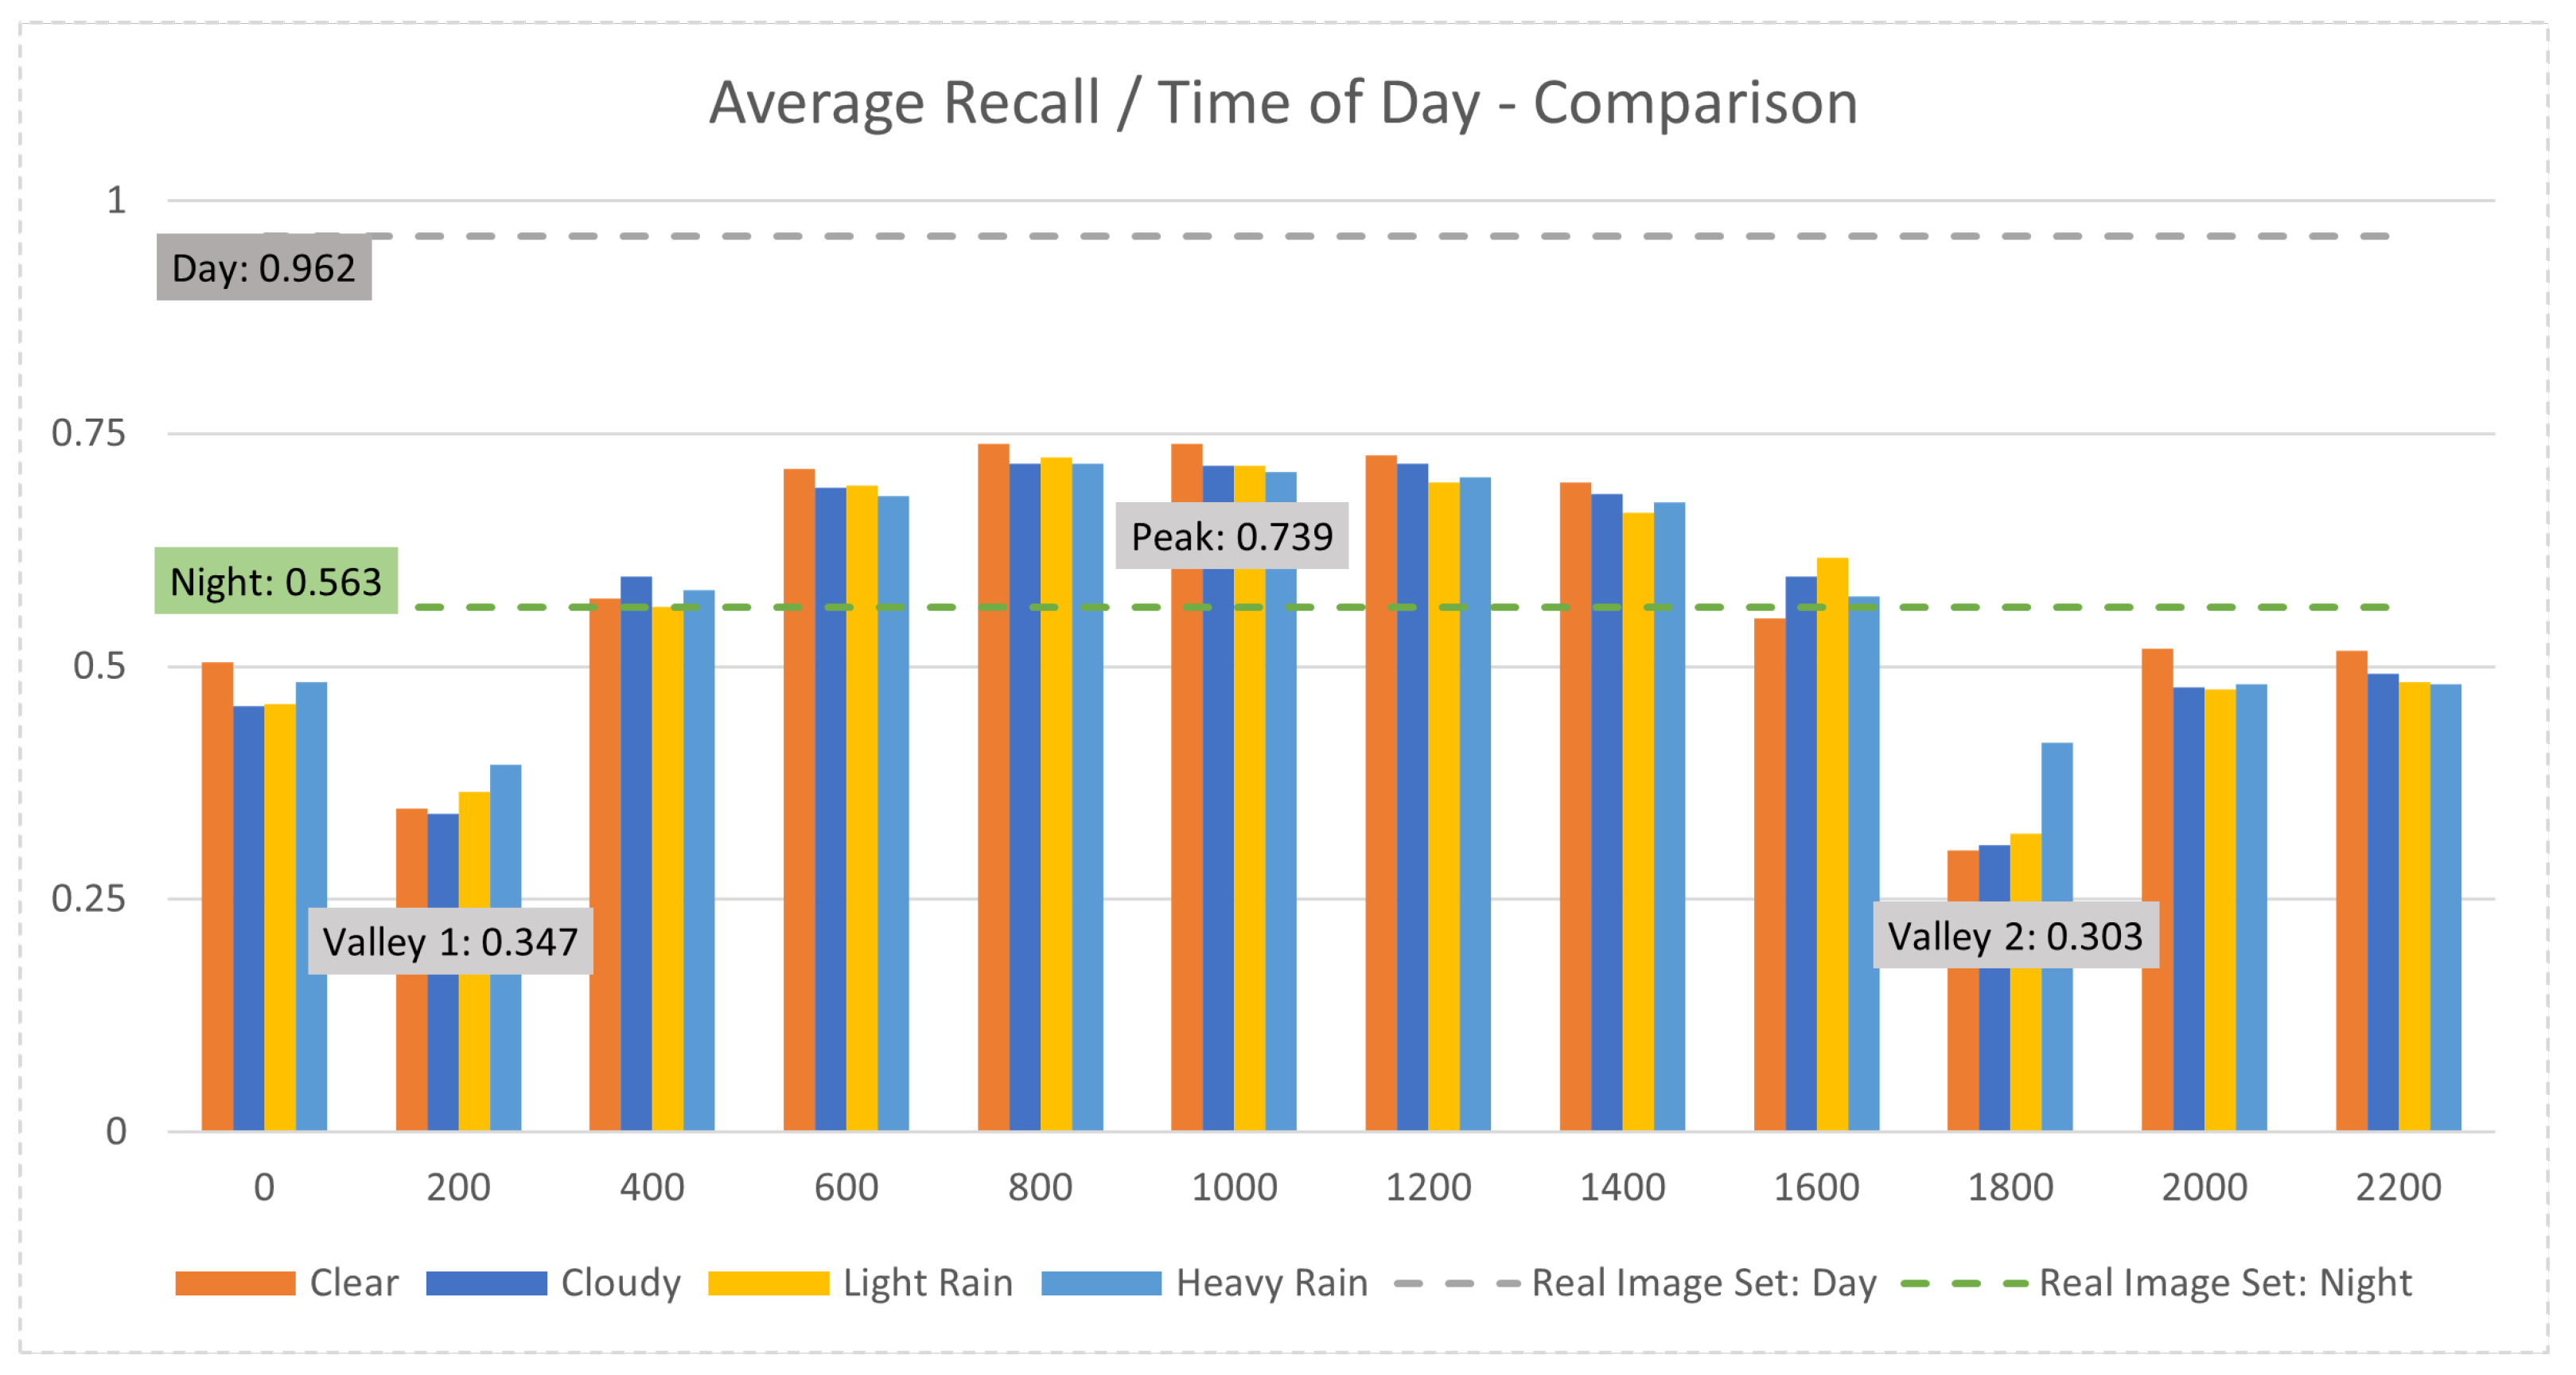
4.1. Weather/Time Variation

Exhibiting different time and weather effects in a realistic manner is key to the value of this dataset. With sufficiently realistic particle and fog simulations combined with adjustments to the average scene lighting and skybox cloud density, four different visual estimations of weather conditions were used. The average light level in an given outdoor scene is primarily impacted by the time of day, with the season and location having smaller but not insignificant impacts. While the Mean Average Precision (mAP) is a popular metric for the evaluation of object detection models, it requires ground truth bounding boxes to calculate the metric, which were not available in the real or simulated datasets. Additionally, since false negatives occur more frequently than false positives in object detection, precision is less valuable as a metric. For these reasons, recall and average recall were chosen as metrics for the evaluation of the experiment. By aligning the average light in a scene with a cyclical axis, the transition from day to night can be simulated. Figure 9 demonstrates an unexpected result in the YoloV3 model used for this analysis. Unexpectedly, the performance of worse weather conditions is slightly better in lower light conditions than the clearer configurations. This is potentially due to the light diffusion in images simulated in cloudy or rainy conditions assisting with dark object detection. At peak conditions, the model detects as normal; when the harmonic mean is considered, Bike 4 was drastically harder to detect than the others. This is not a surprising result by itself; however, the response for Bike 3 is normal. This is strange given that Bike 3 and Bike 4 are the same model of children’s bicycle, with green and pink frames, respectively.
Figure 10 shows the object Recall over the simulated day for Bike 3 compared to Bike 4 at each weather configuration. This result is interesting, as the prediction confidence remains consistent with most objects, such as Bikes 1, 2, 3, and 5, which provided similar curves in most time/weather configurations. The outlier object, however, demonstrates a completely different response over the changing light level to that of what would be expected of a perception-based task at a lower confidence (the prediction drops as it becomes darker and as the weather becomes less clear). This implies that from this simulated test data, the YoloV3 model has lower confidence with certain colours of children’s bicycles and that simulated test data can be potentially used to probe for such weaknesses. Figure 11 shows the results of the harmonic mean recall for the full set over the simulated day/night cycle compared to a baseline of 96% for real images in the day and 56% for real images at night. The simulated results clearly show a performance reduction as the light level in the scene reduces to an average of 32% for the valleys at 02:00 h and 18:00 h. The peak prediction for clear weather can be seen around simulated midday (10:00 h) at 74%. By comparing the delta between the simulated peak and real day image baseline to the delta between the average valleys and the real night image baseline, the domain shift can be calculated for night and day at 24% and 22%, respectively.

4.2. Issues

For initial experiments, four equidistant points on the time axis: 6 h, 12 h, 18 h and 24 h, respectively. The resolution of this initial set was too poor to provide an adequate analysis over the temporal spectrum. In order to generate more informative samples, the resolution was increased to 12 equidistant points (2 h between each). Additionally, the imported area mesh contained errors and voids due to missing visual angles when the mesh was created. This issue is considered to be fixable with additional images for a bespoke mesh. However, for online-sourced assets this is unavoidable. Though initially included in prior work, ‘Fog’ and ‘Snow’ weather configurations were not included in the simulation or subsequent simulated datasets due to poor simulation performance and a lack of realistic image samples for comparison; however, more bespoke simulation attempts could consider these elements along with many other environmental factors as variables to be combined with other effects, and as such, this is considered a viable topic for future research. Following analysis, there were some unexpected results which merited investigation into the image data, one such being the rebounding curve in predictions after 18:00 and before 02:00 h, which was expected to lower to a single valley representing the darkest point in the cycle. Upon investigation, this was attributed to an issue within the simulator lighting engine, which caused completely dark scenes to illuminate visibly. This again demonstrates how simulation errors are not inherent, but an issue of implementation caused by the researcher’s skill set or platform limitations. While the lighting issue can be solved through changing some parameters in rendering or the daylight gradient, for this project, the decision was made to minimise changes to account for these issues, as this is a proof of concept to demonstrate that simulations for this application can be effective for testing even with a simulation bias.

5. Conclusions

Previous work sought to determine if it is viable to use a high-fidelity rendering engine in conjunction with 3D scans of a physical space to create an environmentally varied synthetic dataset for neural network testing [39]. When this was found to be feasible, successive work determined the viability of using the generated image samples to observe the response from a pretrained network which was trained for any environmental variance regarding the task (bicycle detection) in different contexts across one dimension of variance [60]. For this work, issues from the previous project were addressed; a larger-sample-size and higher-resolution dataset was created, which was then used to evaluate a pre-trained network response in different contexts across multiple dimensions of variance in the same task against a baseline comparison of two real datasets consisting of day and night images, respectively. The results of this comparison imply that the domain shift (i.e., a decrease in a chosen performance metric between real and simulated test sets) remains fairly constant (2% measured change in domain shift), even when critical environmental factors are modified in the simulation. As a result, we estimated the domain shift in an accurate manner and accounted for it via an offset; the remaining impact on the performance metrics can be considered as a likely result of these environmental factors being changed, leading to a potentially quantifiable uncertainty analysis and weakness testing via simulations. Additionally, it was found that although, generally, the impact of simulated weather variance at a ±2.5% average was small relative to the impact of daylight variance, the average Recall in clear weather was better during simulated daylight hours, but the opposite was true outside of daylight hours, where cloudy, overcast, and rain configurations performed better. Additionally, the network response to the dataset identified areas of low predictive confidence within the YoloV3 network, namely around outlier object types such as the pink version of the children’s bicycle object (Bike 3) or predictably in darker objects (Bike 5) or darker environments such as the times between simulated 16:00 h and 04:00 h. While the results above demonstrate that this approach can be used to evaluate the response of object detection networks, further research and evaluation would be required before the same can be said for other tasks such as semantic segmentation or motion analysis.

Future Work

This project contributes to a greater research goal: a system and an approach for generating photo-realistic samples where the environment is varied yet made measurable through the implementation of digital twin areas. This could potentially form an avenue to develop partially generalised navigation in the UAV drone research space, potentially through two topics for future research: the first being the training of a generalised network via a simulated dataset that contains all realistic environmental variations, and the second being the use of a simulated environmentally varied dataset to train a network to distinguish between these environments, feeding that information forward into more specific optimised autonomous navigator networks for these environments. This project demonstrates the validity of using a 3D-scanned environment for the creation of photo-realistic synthetic datasets. However, the creation of a bespoke, linked mesh of a known area which is accessible to researchers would add quantitative evidence to the experiment. Since the dataset is created within a repeatable simulation, there are other potential ways to introduce more dynamic elements into the dataset, such as programming object movements within the simulation for motion prediction training or using multiple meshes and textures for the objects or the world geometry in order to generate datasets with domain randomisation, which are also viable topics for future research. More immediate research aims to reinforce the “digital twin” link in the simulation to a known physical space for further experimentation. Further testing of neural networks’ responsiveness to the artificial datasets is also required, which is likely to involve research performed in the area of uncertainty estimation for neural networks.

Author Contributions

Conceptualisation, T.L.; Data curation, T.L.; Formal analysis, T.L.; Investigation, T.L.; Methodology, T.L.; Supervision, S.M. and J.C.; Visualisation, T.L.; Writing—original draft, T.L.; Writing—review and editing, T.L., S.M. and J.C. All authors have read and agreed to the published version of the manuscript.

Funding

This publication has emanated from research conducted with the financial support of Science Foundation Ireland under grant number 18/CRT/6222. For the purpose of Open Access, the author has applied a CC BY public copyright licence to any Author-Accepted Manuscript version arising from this submission.

Data Availability Statement

The data presented in this study are available in this article.

Conflicts of Interest

The authors declare no conflicts of interest.

Abbreviations

The following abbreviations are used in this manuscript:
DTDigital Twin
UAVUnmanned Aerial Vehicle
GPUGraphics Processing Unit
GANGenerative Adversarial Network
SFIScientific Foundation Ireland

References

  1. Shukla, P.; Sureshkumar, S.; Stutts, A.C.; Ravi, S.; Tulabandhula, T.; Trivedi, A.R. Robust Monocular Localization of Drones by Adapting Domain Maps to Depth Prediction Inaccuracies. In Proceedings of the ICASSP 2023—2023 IEEE International Conference on Acoustics, Speech and Signal Processing (ICASSP), Rhodes Island, Greece, 4–10 June 2022; pp. 1–5. [Google Scholar] [CrossRef]
  2. Samma, H.; Sama, A.S.B. Optimized deep learning vision system for human action recognition from drone images. Multimed. Tools Appl. 2023, 83, 1143–1164. [Google Scholar] [CrossRef] [PubMed]
  3. Gandhi, D.; Pinto, L.; Gupta, A. Learning to fly by crashing. In Proceedings of the IEEE International Conference on Intelligent Robots and Systems, Vancouver, BC, Canada, 24–28 September 2017; Institute of Electrical and Electronics Engineers Inc.: Piscataway, NJ, USA, 2017; pp. 3948–3955. [Google Scholar]
  4. Rojas-Perez, L.O.; Martinez-Carranza, J. DeepPilot: A CNN for Autonomous Drone Racing. Sensors 2020, 20, 4524. [Google Scholar] [CrossRef] [PubMed]
  5. Lee, T.; Mckeever, S.; Courtney, J. Flying Free: A Research Overview of Deep Learning in Drone Navigation Autonomy. Drones 2021, 5, 52. [Google Scholar] [CrossRef]
  6. Udacity. Udacity, “Become a Self-Driving Car Engineer”. 2016. Available online: https://www.udacity.com/course/self-driving-car-engineer-nanodegree–nd013 (accessed on 23 April 2020).
  7. Deng, J.; Dong, W.; Socher, R.; Li, L.J.; Li, K.; Li, F.-F. ImageNet: A large-scale hierarchical image database. In Proceedings of the 2009 IEEE Conference on Computer Vision and Pattern Recognition, Miami, FL, USA, 20–25 June 2009; pp. 248–255. [Google Scholar]
  8. Shorten, C.; Khoshgoftaar, T.M. A survey on Image Data Augmentation for Deep Learning. J. Big Data 2019, 6, 60. [Google Scholar] [CrossRef]
  9. Takahashi, R.; Matsubara, T.; Uehara, K. Data Augmentation Using Random Image Cropping and Patching for Deep CNNs. IEEE Trans. Circuits Syst. Video Technol. 2020, 30, 2917–2931. [Google Scholar] [CrossRef]
  10. Wu, F.; Zou, D. Learning Visual Navigation System in Simulation for Autonomous Ground Vehicles in Real World. In Proceedings of the 2023 4th International Conference on Artificial Intelligence in Electronics Engineering, Haikou, China, 6–8 January 2023; pp. 16–23. [Google Scholar] [CrossRef]
  11. Redmon, J.; Farhadi, A. YOLOv3: An Incremental Improvement. arXiv 2018, arXiv:1804.02767. [Google Scholar]
  12. Khan, A.; Hebert, M. Learning safe recovery trajectories with deep neural networks for unmanned aerial vehicles. In Proceedings of the 2018 IEEE Aerospace Conference, Big Sky, MT, USA, 3–10 March 2018; pp. 1–9. [Google Scholar]
  13. Al-Sharman, M.K.; Zweiri, Y.; Jaradat, M.A.K.; Al-Husari, R.; Gan, D.; Seneviratne, L.D. Deep-learning-based neural network training for state estimation enhancement: Application to attitude estimation. IEEE Trans. Instrum. Meas. 2020, 69, 24–34. [Google Scholar] [CrossRef]
  14. Dai, X.; Zhou, Y.; Meng, S.; Wu, Q. Unsupervised Feature Fusion Combined with Neural Network Applied to UAV Attitude Estimation. In Proceedings of the 2018 IEEE International Conference on Robotics and Biomimetics, ROBIO 2018, Kuala Lumpur, Malaysia, 12–15 December 2018; pp. 874–879. [Google Scholar]
  15. Matthews, M.T.; Yi, S. Model Reference Adaptive Control and Neural Network Based Control of Altitude of Unmanned Aerial Vehicles. In Proceedings of the 2019 SoutheastCon, Huntsville, AL, USA, 11–14 April 2019; pp. 1–8. [Google Scholar]
  16. Giusti, A.; Guzzi, J.; Ciresan, D.C.; He, F.L.; Rodriguez, J.P.; Fontana, F.; Faessler, M.; Forster, C.; Schmidhuber, J.; Caro, G.D.; et al. A Machine Learning Approach to Visual Perception of Forest Trails for Mobile Robots. IEEE Robot. Autom. Lett. 2016, 1, 661–667. [Google Scholar] [CrossRef]
  17. Zhang, Y.; Xiao, X.; Yang, X. Real-Time object detection for 360-degree panoramic image using CNN. In Proceedings of the 2017 International Conference on Virtual Reality and Visualization, ICVRV 2017, Zhengzhou, China, 21–22 October 2017; Institute of Electrical and Electronics Engineers Inc.: Piscataway, NJ, USA, 2017; pp. 18–23. [Google Scholar]
  18. Yang, R.; Wang, X. UAV Landmark Detection Based on Convolutional Neural Network. In Proceedings of the 2nd IEEE Eurasia Conference on IOT, Communication and Engineering 2020, ECICE 2020, Yunlin, Taiwan, 23–25 October 2020; pp. 5–8. [Google Scholar]
  19. Shiri, H.; Park, J.; Bennis, M. Remote UAV Online Path Planning via Neural Network-Based Opportunistic Control. IEEE Wirel. Commun. Lett. 2020, 9, 861–865. [Google Scholar] [CrossRef]
  20. Han, X.; Wang, J.; Xue, J.; Zhang, Q. Intelligent Decision-Making for 3-Dimensional Dynamic Obstacle Avoidance of UAV Based on Deep Reinforcement Learning. In Proceedings of the 2019 11th International Conference on Wireless Communications and Signal Processing, WCSP 2019, Xi’an, China, 23–25 October 2019. [Google Scholar]
  21. European Union Aviation Safety Agency. Special Condition for Light Unmanned Aircraft Systems—Medium Risk INTRODUCTORY; Technical Report; European Union Aviation Safety Agency: Cologne, Germany, 2020.
  22. Loquercio, A.; Maqueda, A.I.; Del-Blanco, C.R.; Scaramuzza, D. DroNet: Learning to Fly by Driving. IEEE Robot. Autom. Lett. 2018, 3, 1088–1095. [Google Scholar] [CrossRef]
  23. Alshehri, A.; Member, S.; Bazi, Y.; Member, S. Deep Attention Neural Network for Multi-Label Classification in Unmanned Aerial Vehicle Imagery. IEEE Access 2019, 7, 119873–119880. [Google Scholar] [CrossRef]
  24. Csillik, O.; Cherbini, J.; Johnson, R.; Lyons, A.; Kelly, M. Identification of Citrus Trees from Unmanned Aerial Vehicle Imagery Using Convolutional Neural Networks. Drones 2018, 2, 39. [Google Scholar] [CrossRef]
  25. Loquercio, A.; Kaufmann, E.; Ranftl, R.; Dosovitskiy, A.; Koltun, V.; Scaramuzza, D. Deep Drone Racing: From Simulation to Reality With Domain Randomization. IEEE Trans. Robot. 2020, 36, 1–14. [Google Scholar] [CrossRef]
  26. Jones, D.; Snider, C.; Nassehi, A.; Yon, J.; Hicks, B. Characterising the Digital Twin: A systematic literature review. CIRP J. Manuf. Sci. Technol. 2020, 29, 36–52. [Google Scholar] [CrossRef]
  27. Wang, Z.; Han, K.; Tiwari, P. Digital twin simulation of connected and automated vehicles with the unity game engine. In Proceedings of the 2021 IEEE 1st International Conference on Digital Twins and Parallel Intelligence, DTPI 2021, Beijing, China, 15 July–15 August 2021; pp. 180–183. [Google Scholar]
  28. Wenna, W.; Weili, D.; Changchun, H.; Heng, Z.; Feng, H.; Yao, Y. A digital twin for 3D path planning of large-span curved-arm gantry robot. Robot. Comput.-Integr. Manuf. 2022, 76, 102330. [Google Scholar] [CrossRef]
  29. Stark, R.; Damerau, T. Digital Twin in CIRP Encyclopedia of Production Engineering; Springer: Berlin, Germany, 2019; pp. 1–8. [Google Scholar]
  30. Kahlen, F.J.; Flumerfelt, S.; Alves, A. Transdisciplinary Perspectives on Complex Systems: New Findings and Approaches; Springer International Publishing: Berlin, Germany, 2016; pp. 1–327. [Google Scholar]
  31. Liu, M.; Fang, S.; Dong, H.; Xu, C. Review of digital twin about concepts, technologies, and industrial applications. J. Manuf. Syst. 2021, 58, 346–361. [Google Scholar] [CrossRef]
  32. Buyuksalih, I.; Bayburt, S.; Buyuksalih, G.; Baskaraca, A.P.; Karim, H.; Rahman, A.A. 3D Modelling and Visualization Based on the Unity Game Engine—Advantages and Challenges. ISPRS Ann. Photogramm. Remote Sens. Spat. Inf. Sci. 2017, 4, 161–166. [Google Scholar] [CrossRef]
  33. Meng, W.; Hu, Y.; Lin, J.; Lin, F.; Teo, R. ROS+unity: An efficient high-fidelity 3D multi-UAV navigation and control simulator in GPS-denied environments. In Proceedings of the IECON 2015—41st Annual Conference of the IEEE Industrial Electronics Society, Yokohama, Japan, 9–12 November 2015; pp. 2562–2567. [Google Scholar]
  34. Fuller, A.; Fan, Z.; Day, C.; Barlow, C. Digital Twin: Enabling Technologies, Challenges and Open Research. IEEE Access 2020, 8, 108952–108971. [Google Scholar] [CrossRef]
  35. Frigg, R.; Reiss, J. The philosophy of simulation: Hot new issues or same old stew? Synthese 2009, 169, 593–613. [Google Scholar] [CrossRef]
  36. Hussein, A.; Garcia, F.; Olaverri-Monreal, C. ROS and Unity Based Framework for Intelligent Vehicles Control and Simulation. In Proceedings of the 2018 IEEE International Conference on Vehicular Electronics and Safety, ICVES 2018, Madrid, Spain, 12–14 September 2018. [Google Scholar]
  37. Koenig, N.; Howard, A. Design and use paradigms for gazebo, an open-source multi-robot simulator. In Proceedings of the IEEE/RSJ International Conference on Intelligent Robots and Systems (IROS) (IEEE Cat. No. 04CH37566), Sendai, Japan, 28 September–2 October 2004; Volume 3, pp. 2149–2154. [Google Scholar]
  38. Codd-Downey, R.; Forooshani, P.M.; Speers, A.; Wang, H.; Jenkin, M. From ROS to unity: Leveraging robot and virtual environment middleware for immersive teleoperation. In Proceedings of the 2014 IEEE International Conference on Information and Automation, ICIA 2014, Hailar, China, 28–30 July 2014; pp. 932–936. [Google Scholar]
  39. Lee, T.; Mckeever, S.; Courtney, J. Generating Reality-Analogous Datasets for Autonomous UAV Navigation using Digital Twin Areas. In Proceedings of the 2022 33rd Irish Signals and Systems Conference (ISSC), Cork, Ireland, 9–10 June 2022; pp. 1–6. [Google Scholar]
  40. Hartawan, D.R.; Purboyo, T.W.; Setianingsih, C. Disaster victims detection system using convolutional neural network (CNN) method. In Proceedings of the 2019 IEEE International Conference on Industry 4.0, Artificial Intelligence, and Communications Technology, IAICT 2019, Bali, Indonesia, 1–3 July 2019; pp. 105–111. [Google Scholar]
  41. Sulistijono, I.A.; Imansyah, T.; Muhajir, M.; Sutoyo, E.; Anwar, M.K.; Satriyanto, E.; Basuki, A.; Risnumawan, A. Implementation of Victims Detection Framework on Post Disaster Scenario. In Proceedings of the 2018 International Electronics Symposium on Engineering Technology and Applications, IES-ETA 2018, Bali, Indonesia, 29–30 October 2018; pp. 253–259. [Google Scholar]
  42. Yong, S.P.; Yeong, Y.C. Human Object Detection in Forest with Deep Learning based on Drone’s Vision. In Proceedings of the 2018 4th International Conference on Computer and Information Sciences: Revolutionising Digital Landscape for Sustainable Smart Society, ICCOINS 2018, Kuala Lumpur, Malaysia, 13–14 August 2018; pp. 1–5. [Google Scholar]
  43. Rodriguez-Ramos, A.; Sampedro, C.; Bavle, H.; Moreno, I.G.; Campoy, P. A Deep Reinforcement Learning Technique for Vision-Based Autonomous Multirotor Landing on a Moving Platform. In Proceedings of the 2018 IEEE/RSJ International Conference on Intelligent Robots and Systems (IROS), Madrid, Spain, 1–5 October 2018; pp. 1010–1017. [Google Scholar]
  44. Rasyad, F.; Kongguasa, H.A.; Onggususilo, N.C.; Anderies; Kurniawan, A.; Gunawan, A.A.S. A Systematic Literature Review of Generative Adversarial Network Potential in AI Artwork. In Proceedings of the 2023 International Conference on Computer Science, Information Technology and Engineering (ICCoSITE), Jakarta, Indonesia, 16 February 2023; pp. 853–857. [Google Scholar] [CrossRef]
  45. Vierling, A.; Sutjaritvorakul, T.; Berns, K. Dataset Generation Using a Simulated World. In International Conference on Robotics in Alpe-Adria Danube Region; Springer: Cham, Switzerland, 2020; pp. 505–513. [Google Scholar]
  46. Richter, S.R.; Vineet, V.; Roth, S.; Koltun, V. Playing for data: Ground truth from computer games. In Lecture Notes in Computer Science (Including Subseries Lecture Notes in Artificial Intelligence and Lecture Notes in Bioinformatics); Springer: Cham, Switzerland, 2016; Volume 9906, pp. 102–118. [Google Scholar]
  47. Ros, G.; Sellart, L.; Materzynska, J.; Vazquez, D.; Lopez, A.M. The SYNTHIA Dataset: A Large Collection of Synthetic Images for Semantic Segmentation of Urban Scenes. In Proceedings of the IEEE Computer Society Conference on Computer Vision and Pattern Recognition, Las Vegas, NV, USA, 27–30 June 2016; pp. 3234–3243. [Google Scholar]
  48. Dionisio-Ortega, S.; Rojas-Perez, L.O.; Martinez-Carranza, J.; Cruz-Vega, I. A deep learning approach towards autonomous flight in forest environments. In Proceedings of the 2018 International Conference on Electronics, Communications and Computers (CONIELECOMP), Cholula, Mexico, 21–23 February 2018; pp. 139–144. [Google Scholar]
  49. Perri, D.; Simonetti, M.; Gervasi, O. Synthetic data generation to speed-up the object recognition pipeline. Electronics 2022, 11, 2. [Google Scholar] [CrossRef]
  50. Song, Y.; Shi, K.; Penicka, R.; Scaramuzza, D. Learning Perception-Aware Agile Flight in Cluttered Environments. In Proceedings of the 2023 IEEE International Conference on Robotics and Automation (ICRA), London, UK, 29 May–2 June 2022; pp. 1989–1995. [Google Scholar] [CrossRef]
  51. Griwodz, C.; Gasparini, S.; Calvet, L.; Gurdjos, P.; Castan, F.; Maujean, B.; Lillo, G.D.; Lanthony, Y. AliceVision Meshroom: An open-source 3D reconstruction pipeline. In Proceedings of the 12th ACM Multimedia Systems Conference—MMSys ’21, Istanbul, Turkey, 28 September–1 October 2021; ACM Press: New York, NY, USA, 2021. [Google Scholar] [CrossRef]
  52. Nedo. Small Town Draft Modus. Available online: https://skfb.ly/YGyC (accessed on 27 September 2021).
  53. Neo_minigan. Bike. Available online: https://sketchfab.com/3d-models/bike-429aceab4aa84a8d8e66a85c015070fb (accessed on 27 April 2022).
  54. Alban. Cinelli Bike. Available online: https://sketchfab.com/3d-models/cinelli-bike-d9dac9f5af5e4c0990bad44e13cd7d85 (accessed on 27 April 2022).
  55. Coldesina, F. Mini Bike. Available online: https://sketchfab.com/3d-models/mini-bike-9603f6fb503140bf9c5da898dd2b55e2 (accessed on 27 April 2022).
  56. Design, L. Jamis Coda Sport Bicycle 3D Scan with Artec Leo. Available online: https://sketchfab.com/3d-models/jamis-coda-sport-bicycle-3d-scan-with-artec-leo-ff5cd417826247ad825efcf3f3b8f8cf (accessed on 27 April 2022).
  57. Haupt, H. Enviro—Sky and Weather. Unity Asset Store. Available online: https://assetstore.unity.com/packages/tools/particles-effects/enviro-sky-and-weather-33963 (accessed on 15 January 2022).
  58. Sanagapati, P. Images Dataset. Available online: https://www.kaggle.com/datasets/pavansanagapati/images-dataset (accessed on 24 September 2022).
  59. Chan, C.S. Exclusively Dark Image Dataset. Available online: https://github.com/cs-chan/Exclusively-Dark-Image-Dataset (accessed on 5 January 2023).
  60. Lee, T.; McKeever, S.; Courtney, J. Reality Analagous Synthetic Dataset Generation with Daylight Variance for Deep Learning Classification. In Proceedings of the 24th Irish Machine Vision and Image Processing Conference, Irish Pattern Recognition and Classification Society, Belfast, Ireland, 31 August 2022; pp. 181–188. [Google Scholar]
Figure 1. Screenshot of the simulator constructed for photo-realistic data synthesis.
Electronics 13 01516 g001
Figure 2. A sequential block diagram summarising the project approach, from the simulator construction to data analysis phases.
Electronics 13 01516 g002
Figure 3. A taxonomic diagram of several example environmental axes that make up a given environment; each axis contains descriptions of the mechanics from which axial variation derives.
Electronics 13 01516 g003
Figure 4. Visual comparison of bicycle assets used to populate the simulator scene, ordered left to right from Bike 1 to Bike 5 (see Table 1 for descriptions of each object).
Electronics 13 01516 g004
Figure 5. A workflow detailing the strategy used for the generation of the artificial datasets from simulations, including the manual position logging and environmental variance loops.
Electronics 13 01516 g005
Figure 6. A visual comparison of the four configurations used for the weather dimension component of the dataset in order of appearance: Clear, Cloudy, Light Rain, and Heavy Rain.
Electronics 13 01516 g006
Figure 7. A visual comparison of daylight variation in the synthetic dataset arranged in ascending order at: 06:00, 10:00, 14:00, and 18:00 simulated hours.
Electronics 13 01516 g007
Figure 8. A sample, sliced with time on the X axis and weather on the Y axis (truncated to nine images for readability), demonstrating how a single position can yield much more information and even provide a level of validation to the other linked data samples.
Electronics 13 01516 g008
Figure 9. The Recall at peak daylight of scene objects across simulated weather variations compared to the harmonic mean recall of scene objects identifying which scene object performs worse on average.
Electronics 13 01516 g009
Figure 10. Object Recall graph varied by time and weather for Bike 4, demonstrating how low-confidence prediction differs from that of high-confidence prediction.
Electronics 13 01516 g010
Figure 11. Graph of avg. object Recall by weather variation and time of day, with baselines for night and day real image sets included and simulated peak and valleys labelled for comparison.
Electronics 13 01516 g011
Table 1. Description of the object assets used for simulator configuration.
Asset LabelDescription
Bike 1Mountain bicycle with green frame, off road tires
Bike 2Racing bicycle with white frame, thin racing tires
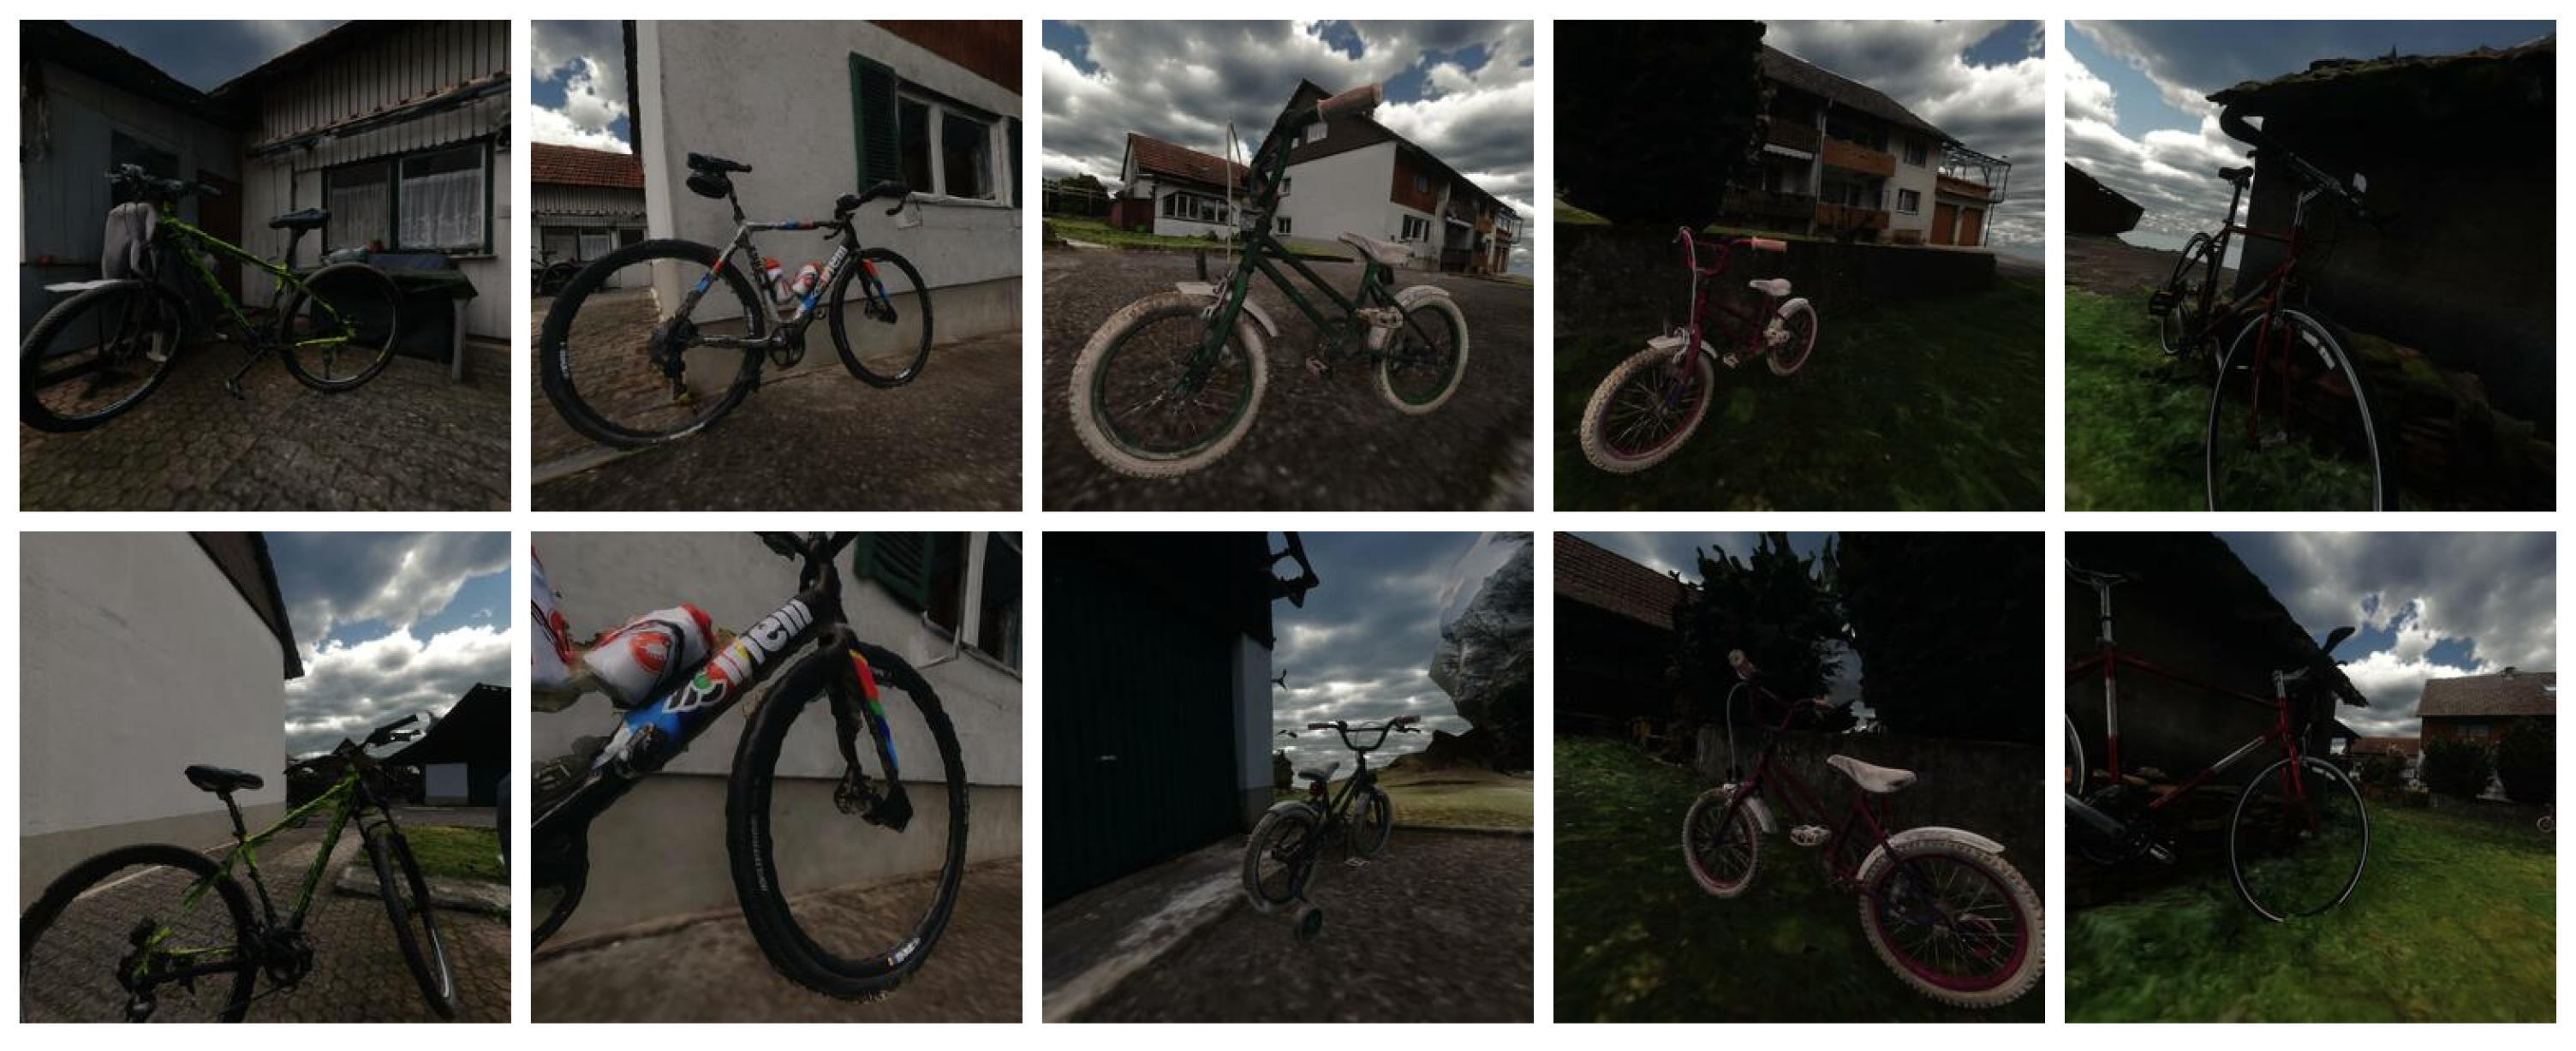
Bike 3Children’s bicycle with small green frame, white tires
Bike 4Children’s bicycle with small pink frame, white tires
Bike 5City bicycle with red frame, road tires
Table 2. Weather configuration by effect presence.
-ClearCloudyLight RainHeavy Rain
CloudsNoneLightMediumHeavy
SkyVisiblePartly ObscuredObscuredObscured
RainNoneNoneLightHeavy
Disclaimer/Publisher’s Note: The statements, opinions and data contained in all publications are solely those of the individual author(s) and contributor(s) and not of MDPI and/or the editor(s). MDPI and/or the editor(s) disclaim responsibility for any injury to people or property resulting from any ideas, methods, instructions or products referred to in the content.

