

Parkinson’s Disease Severity Index Based on Non-Motor Symptoms by Self-Organizing Maps

 , and
, and 
Abstract
:1. Introduction
2. Materials and Methods
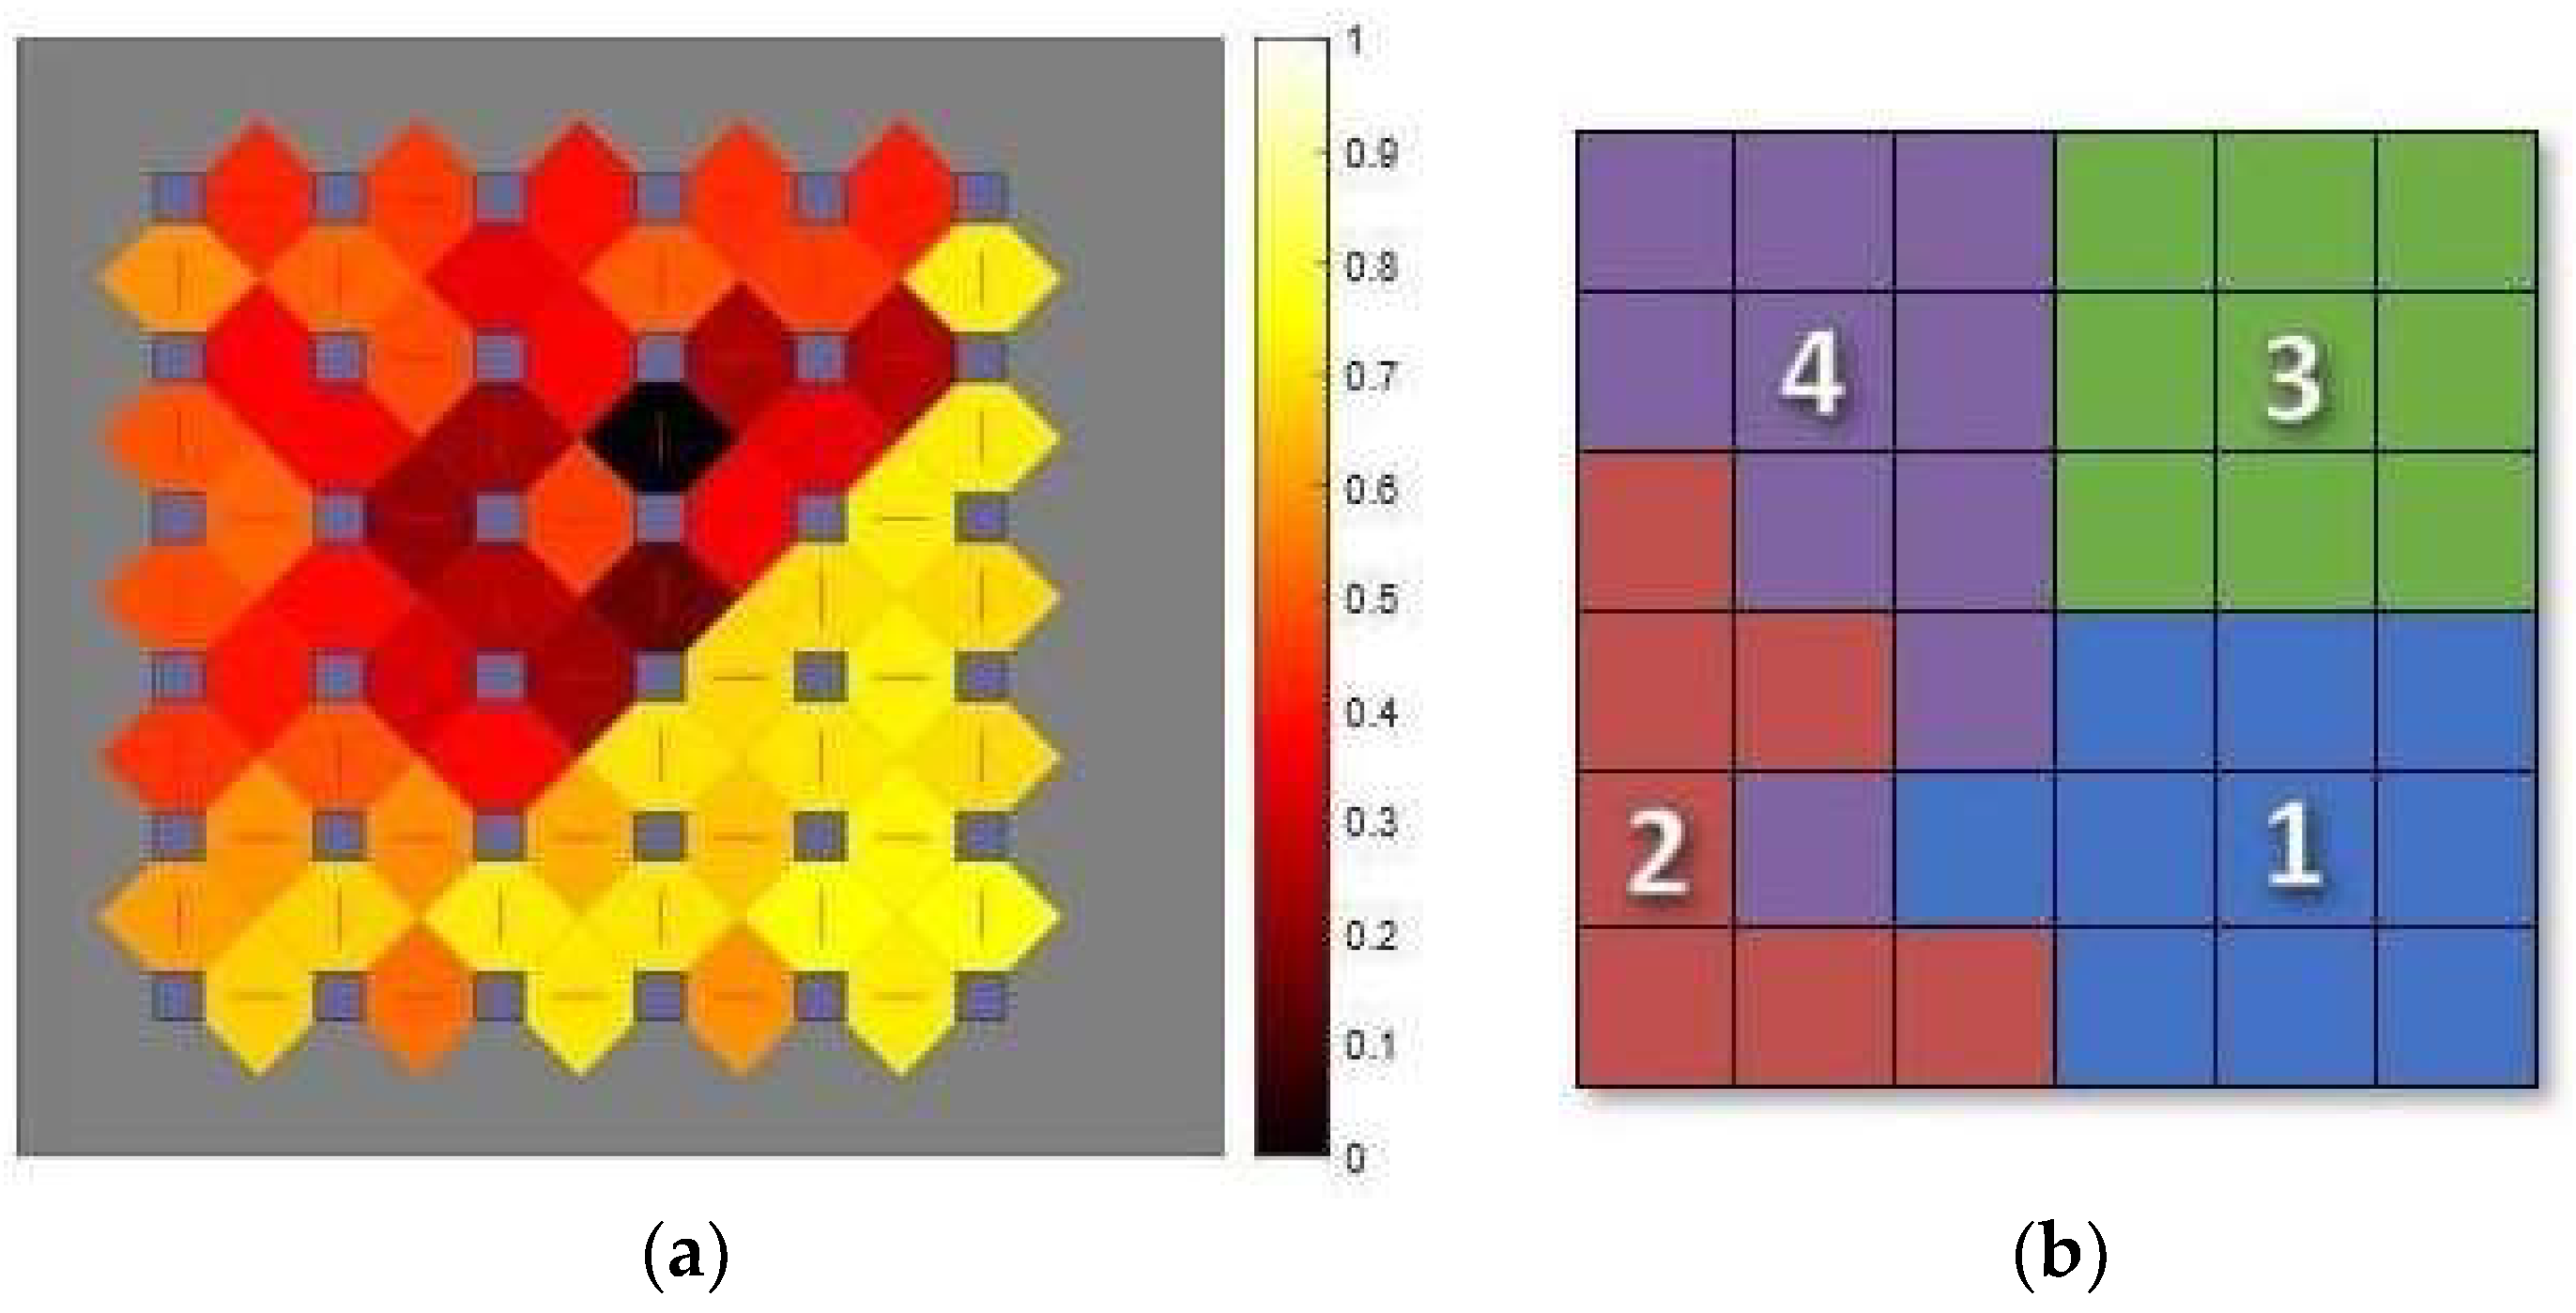
2.1. Model Development
2.2. Selection of Variables from Fox Insight
2.3. Coding the Data into Numerical Variable
2.4. Data Included and Excluded
2.5. Algorithm
Choice of Data Processing Strategy
2.6. Mapping of Subsequent Queries and Validation
3. Results
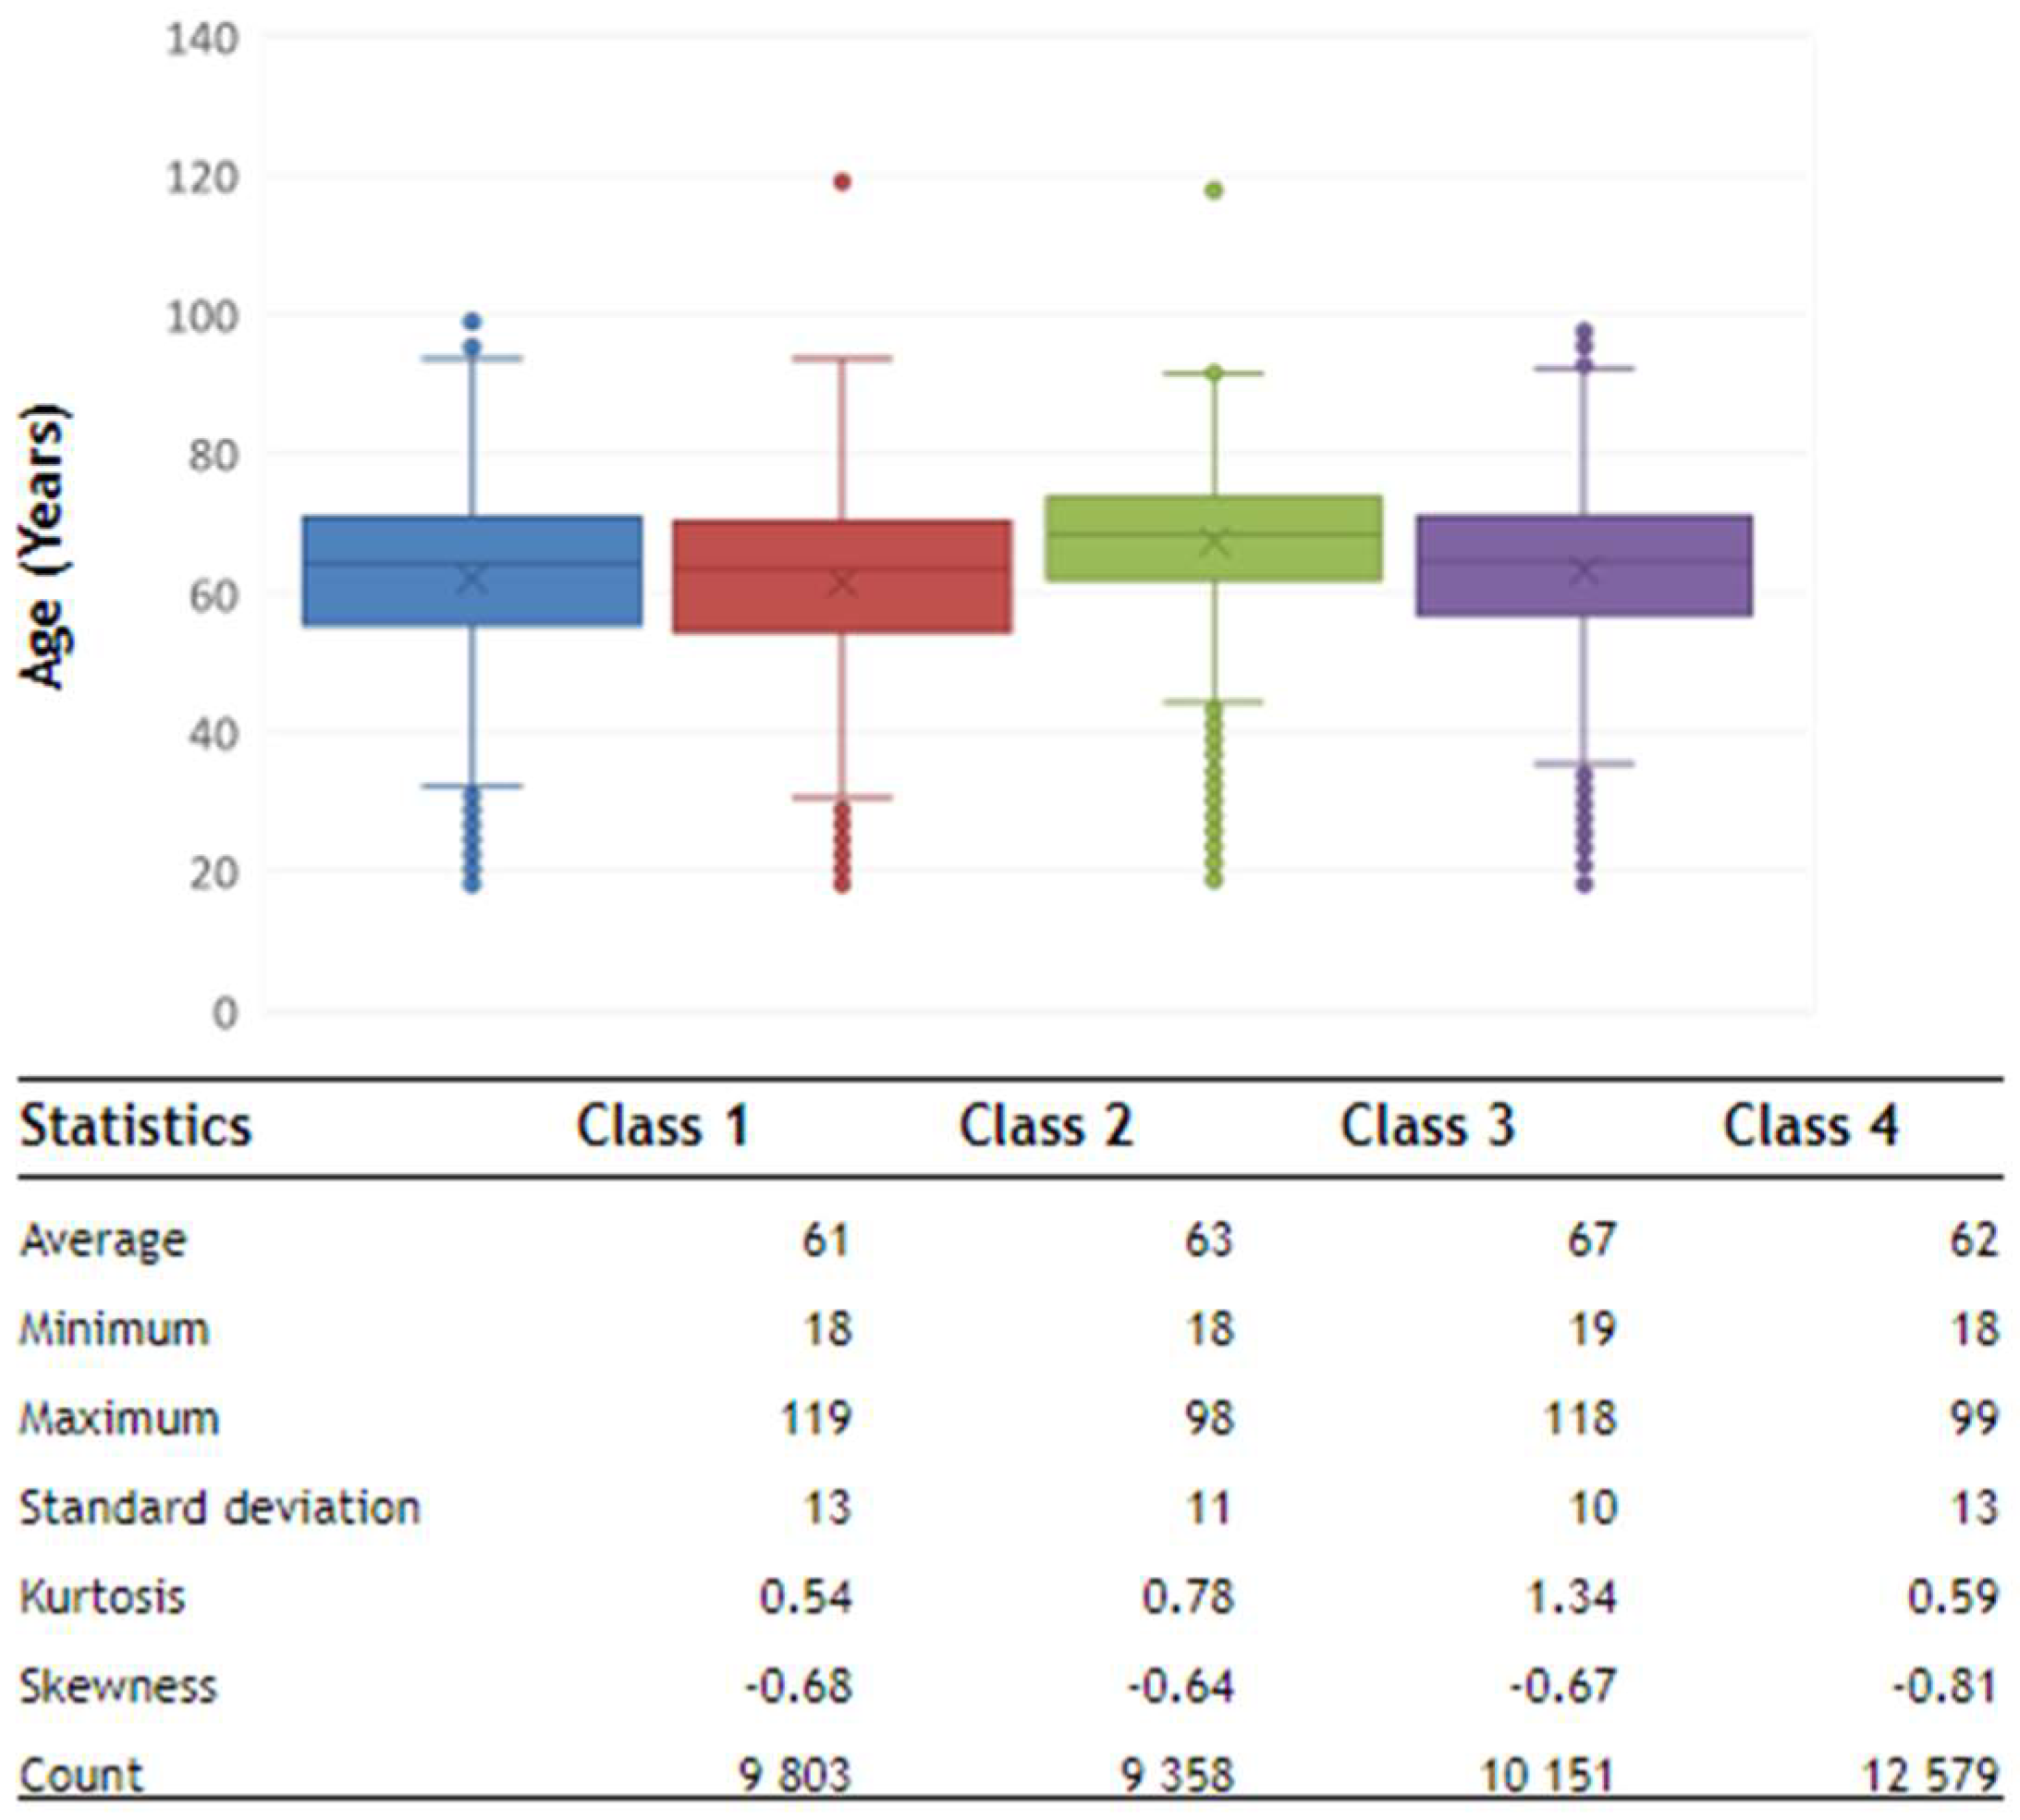
3.1. Age Analysis
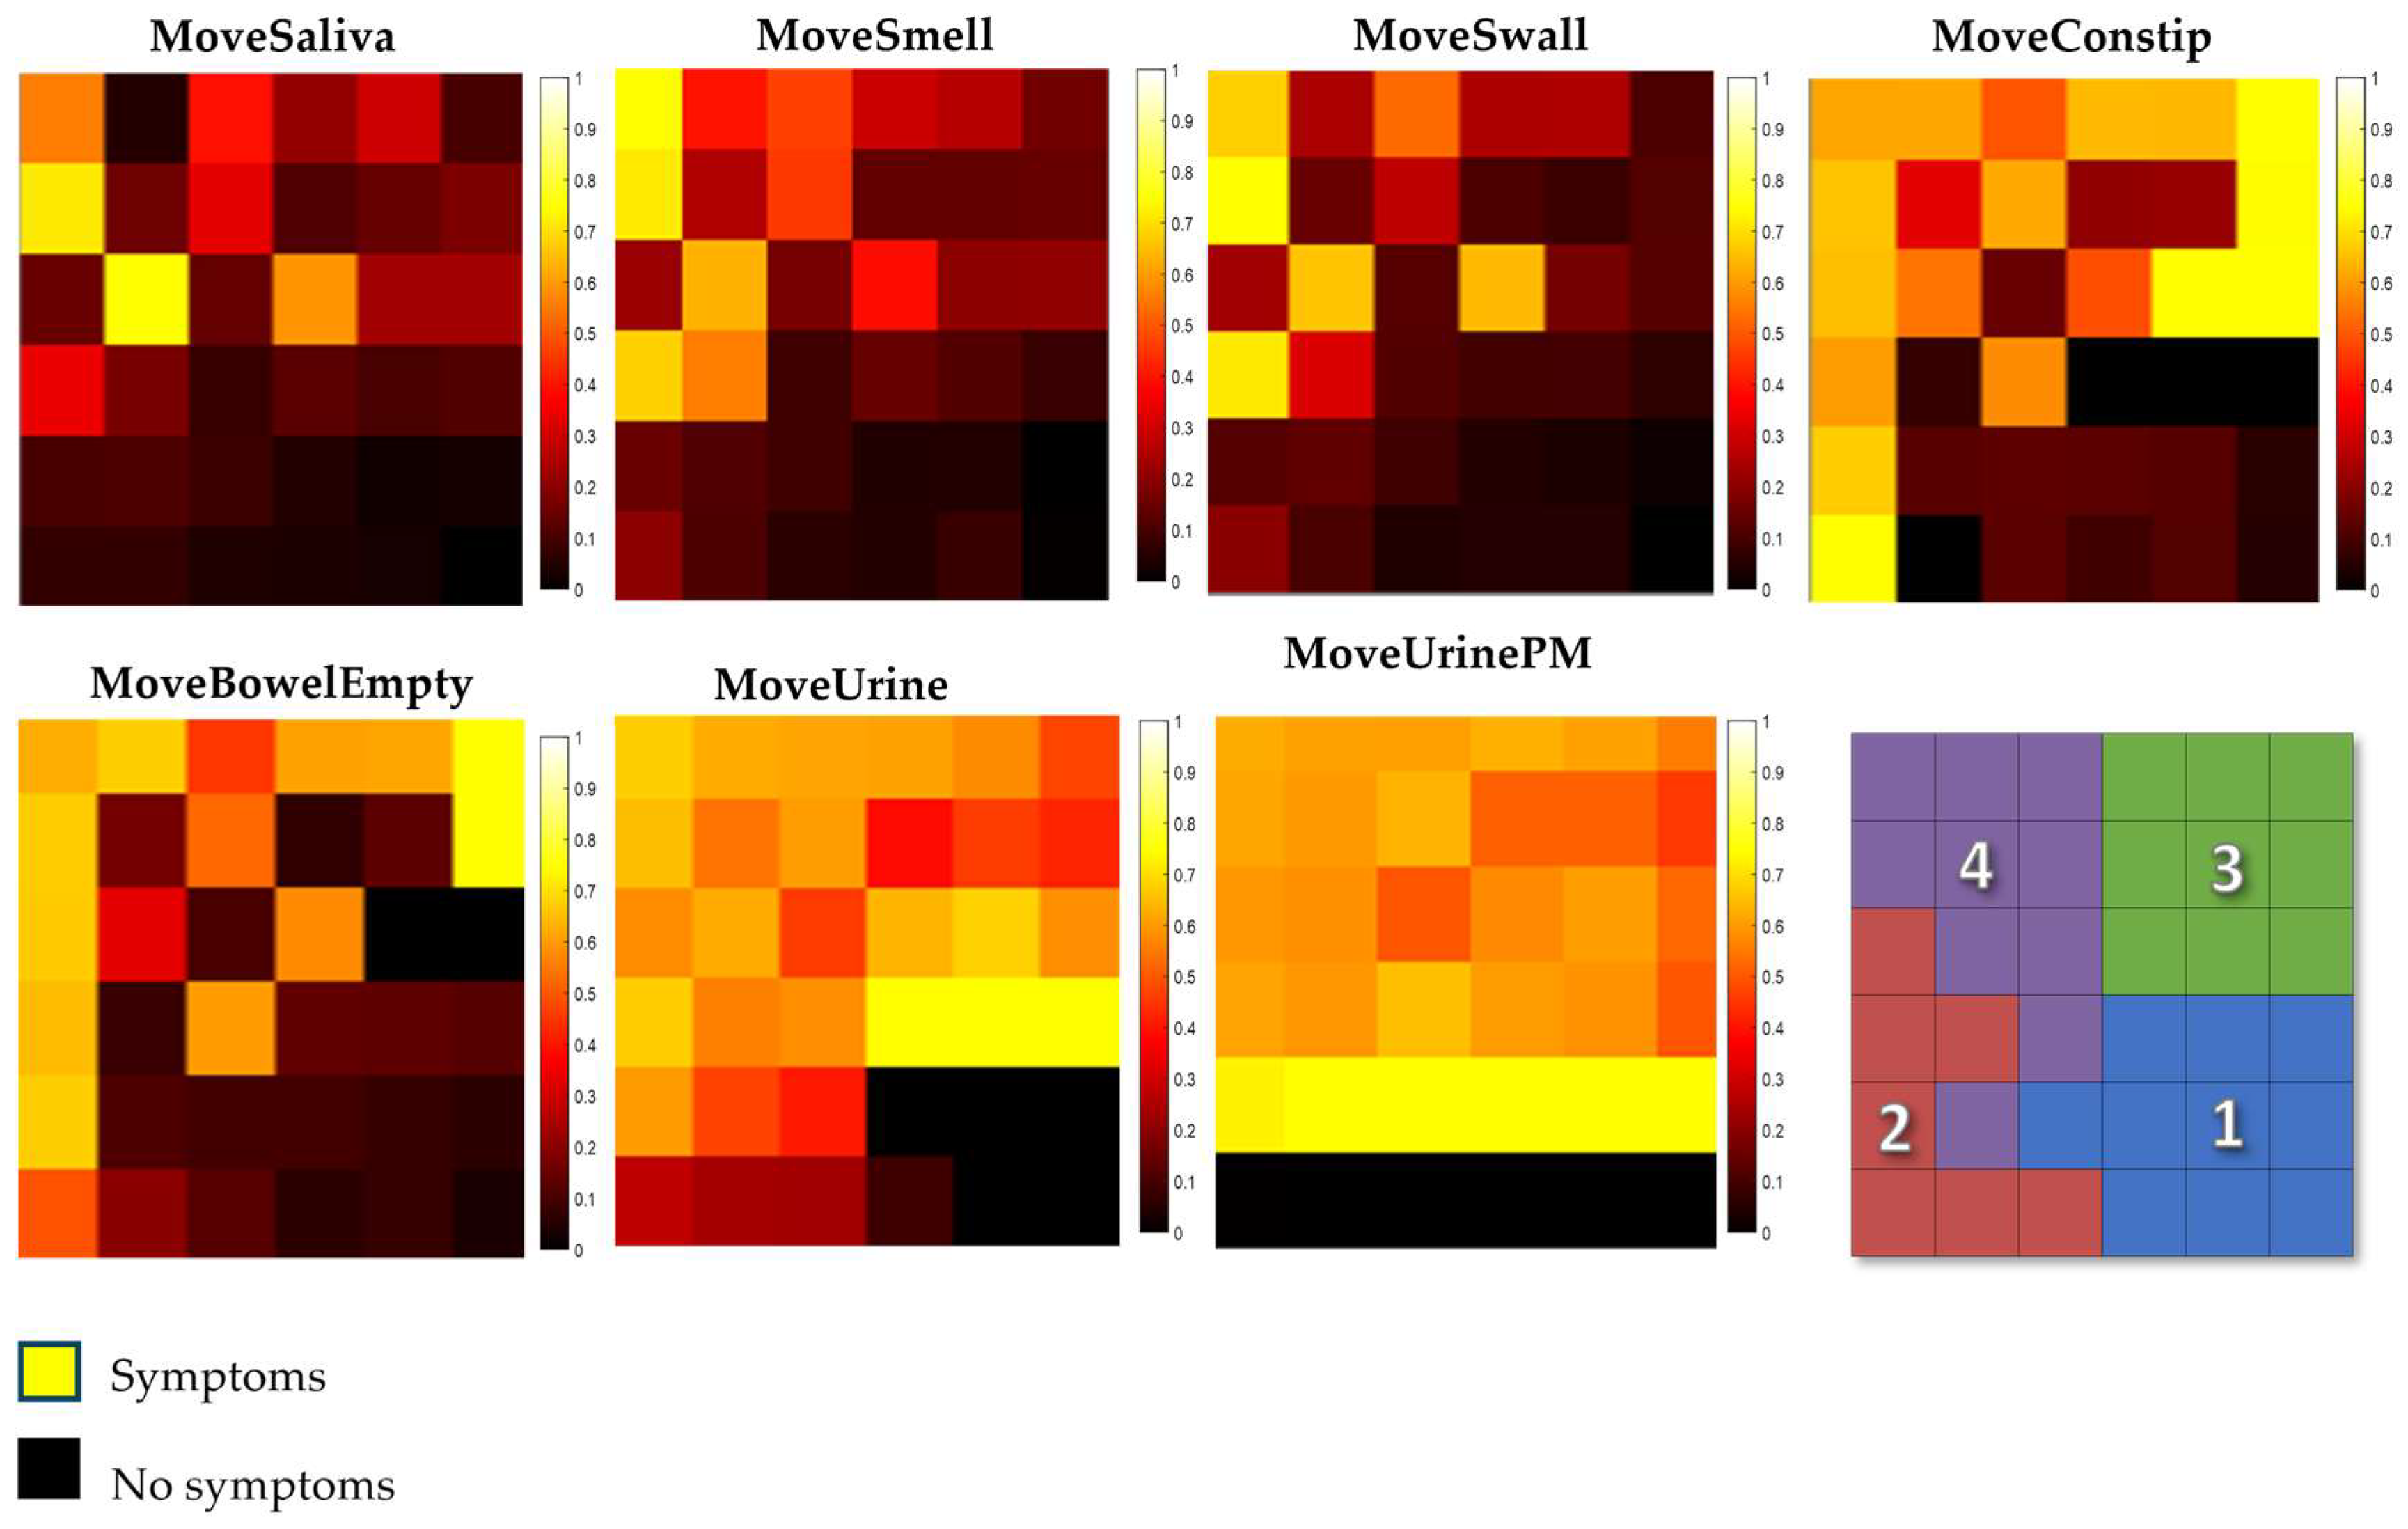
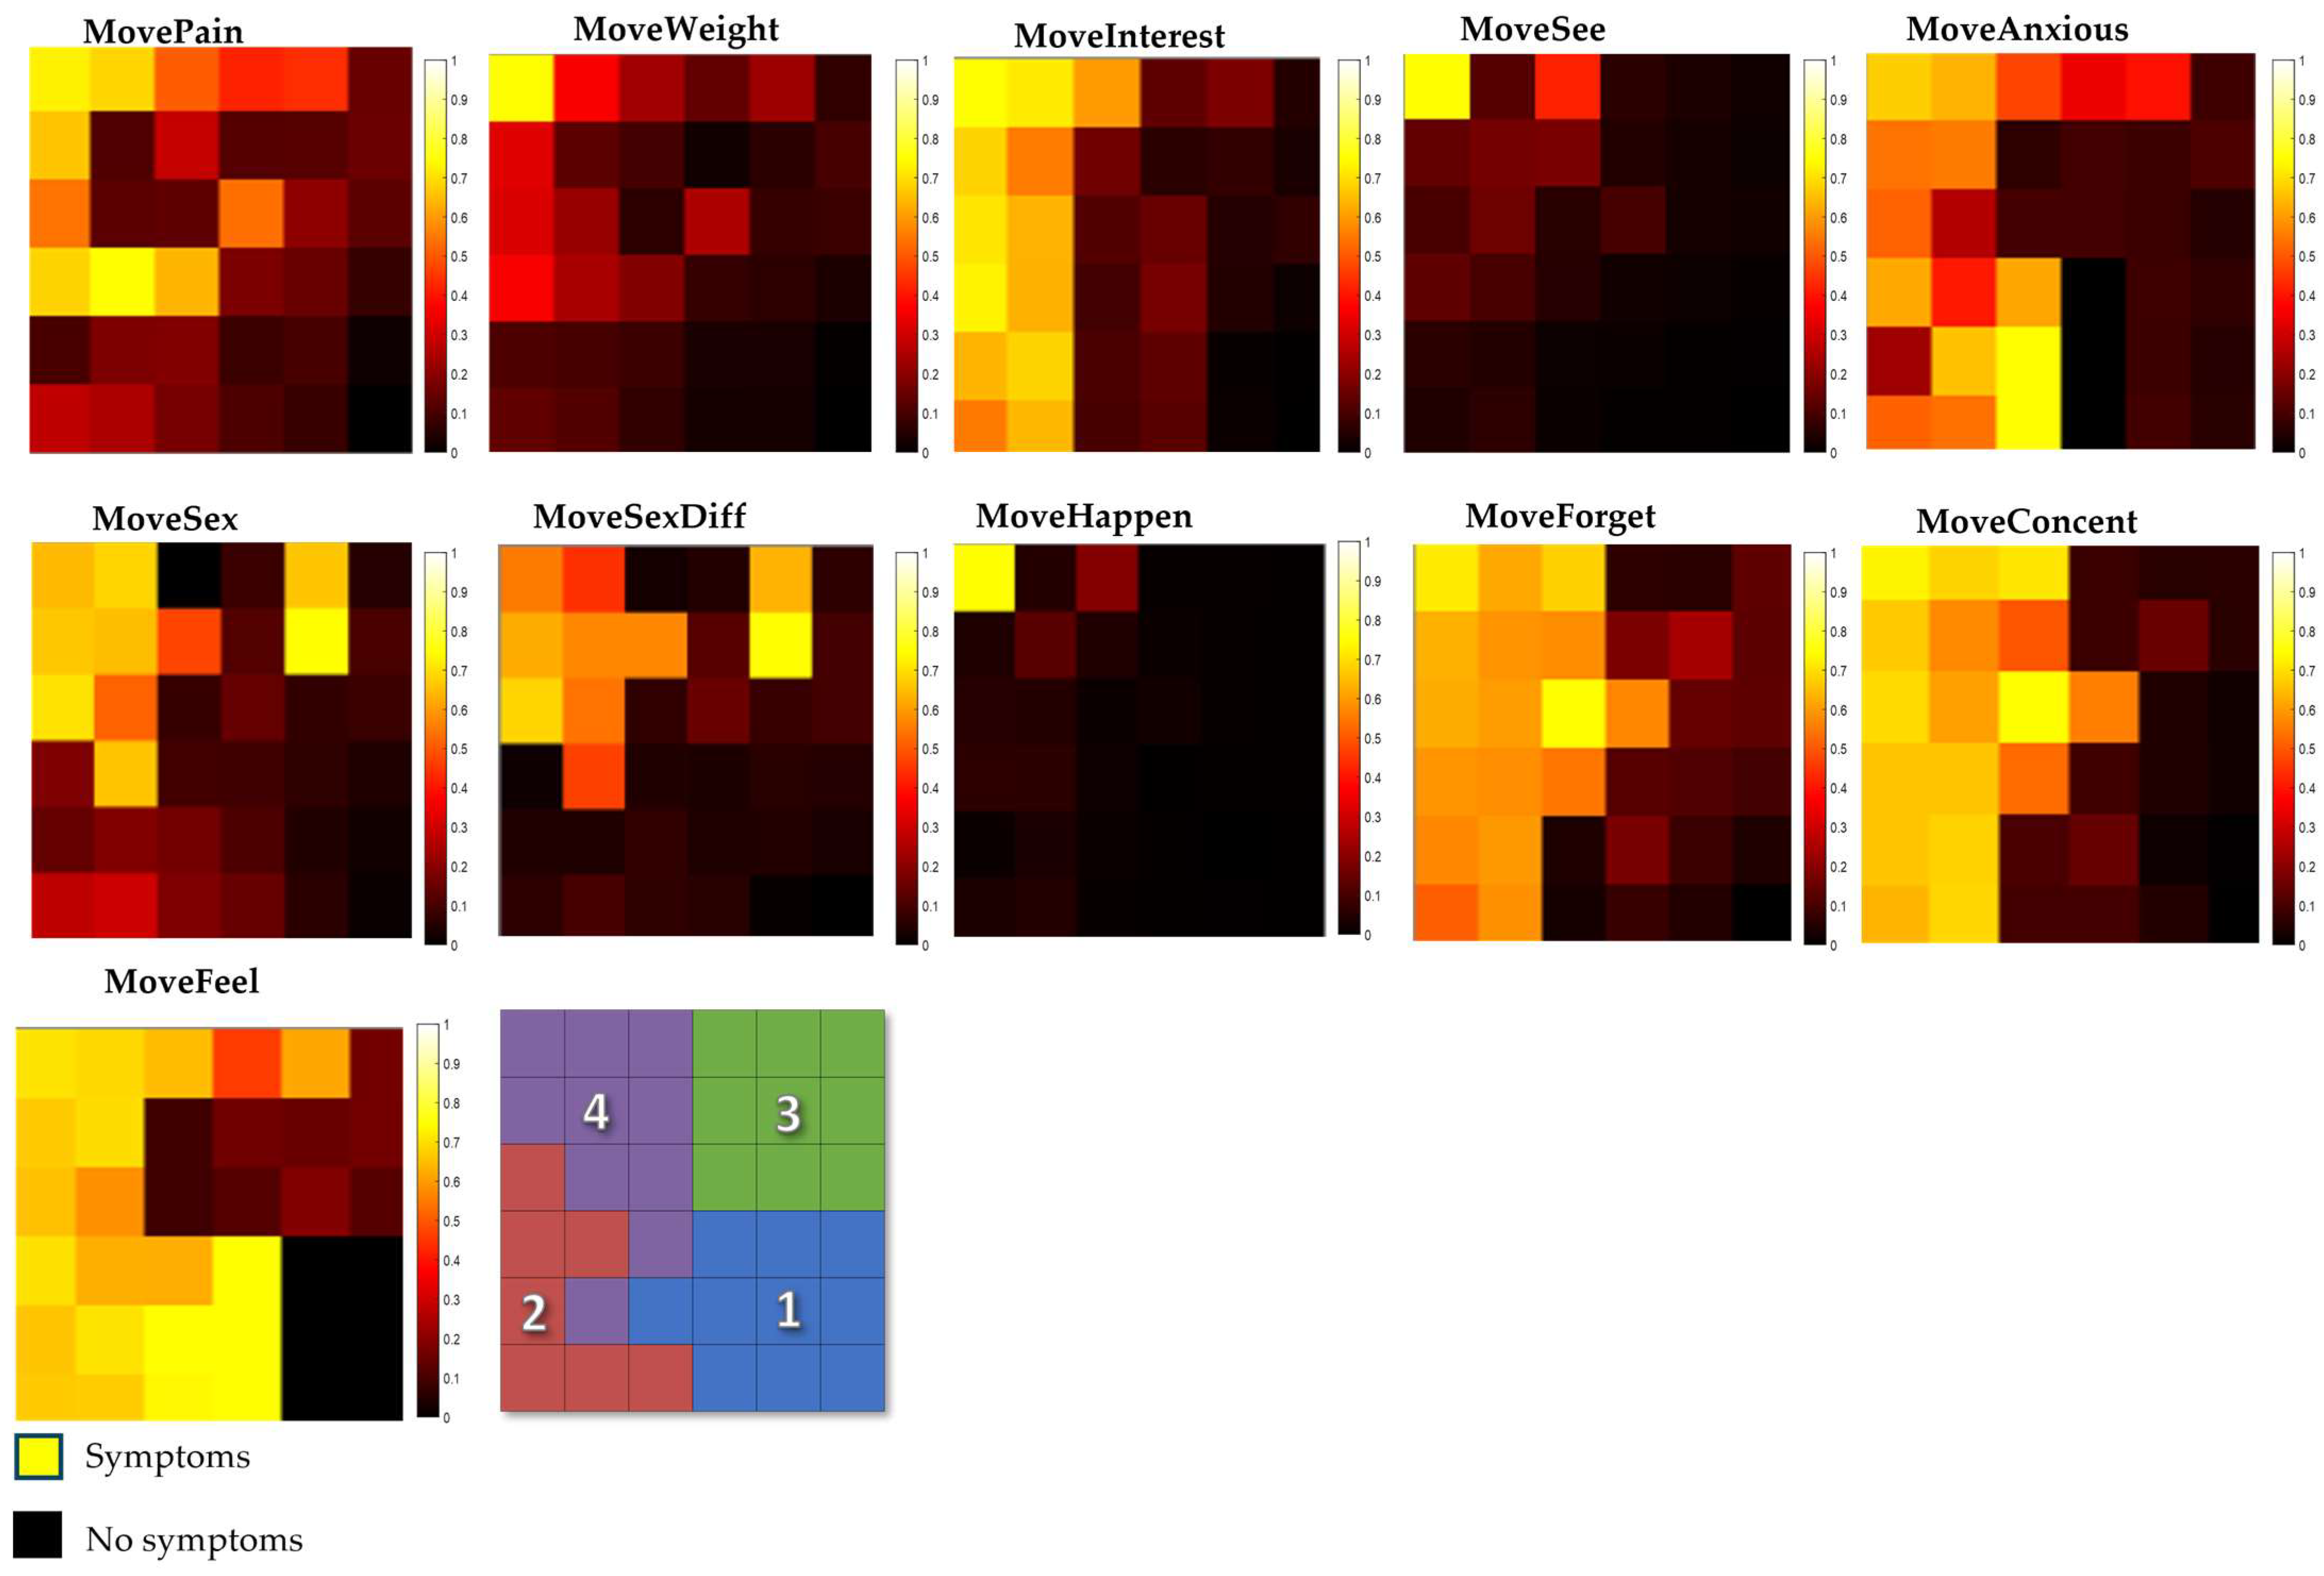
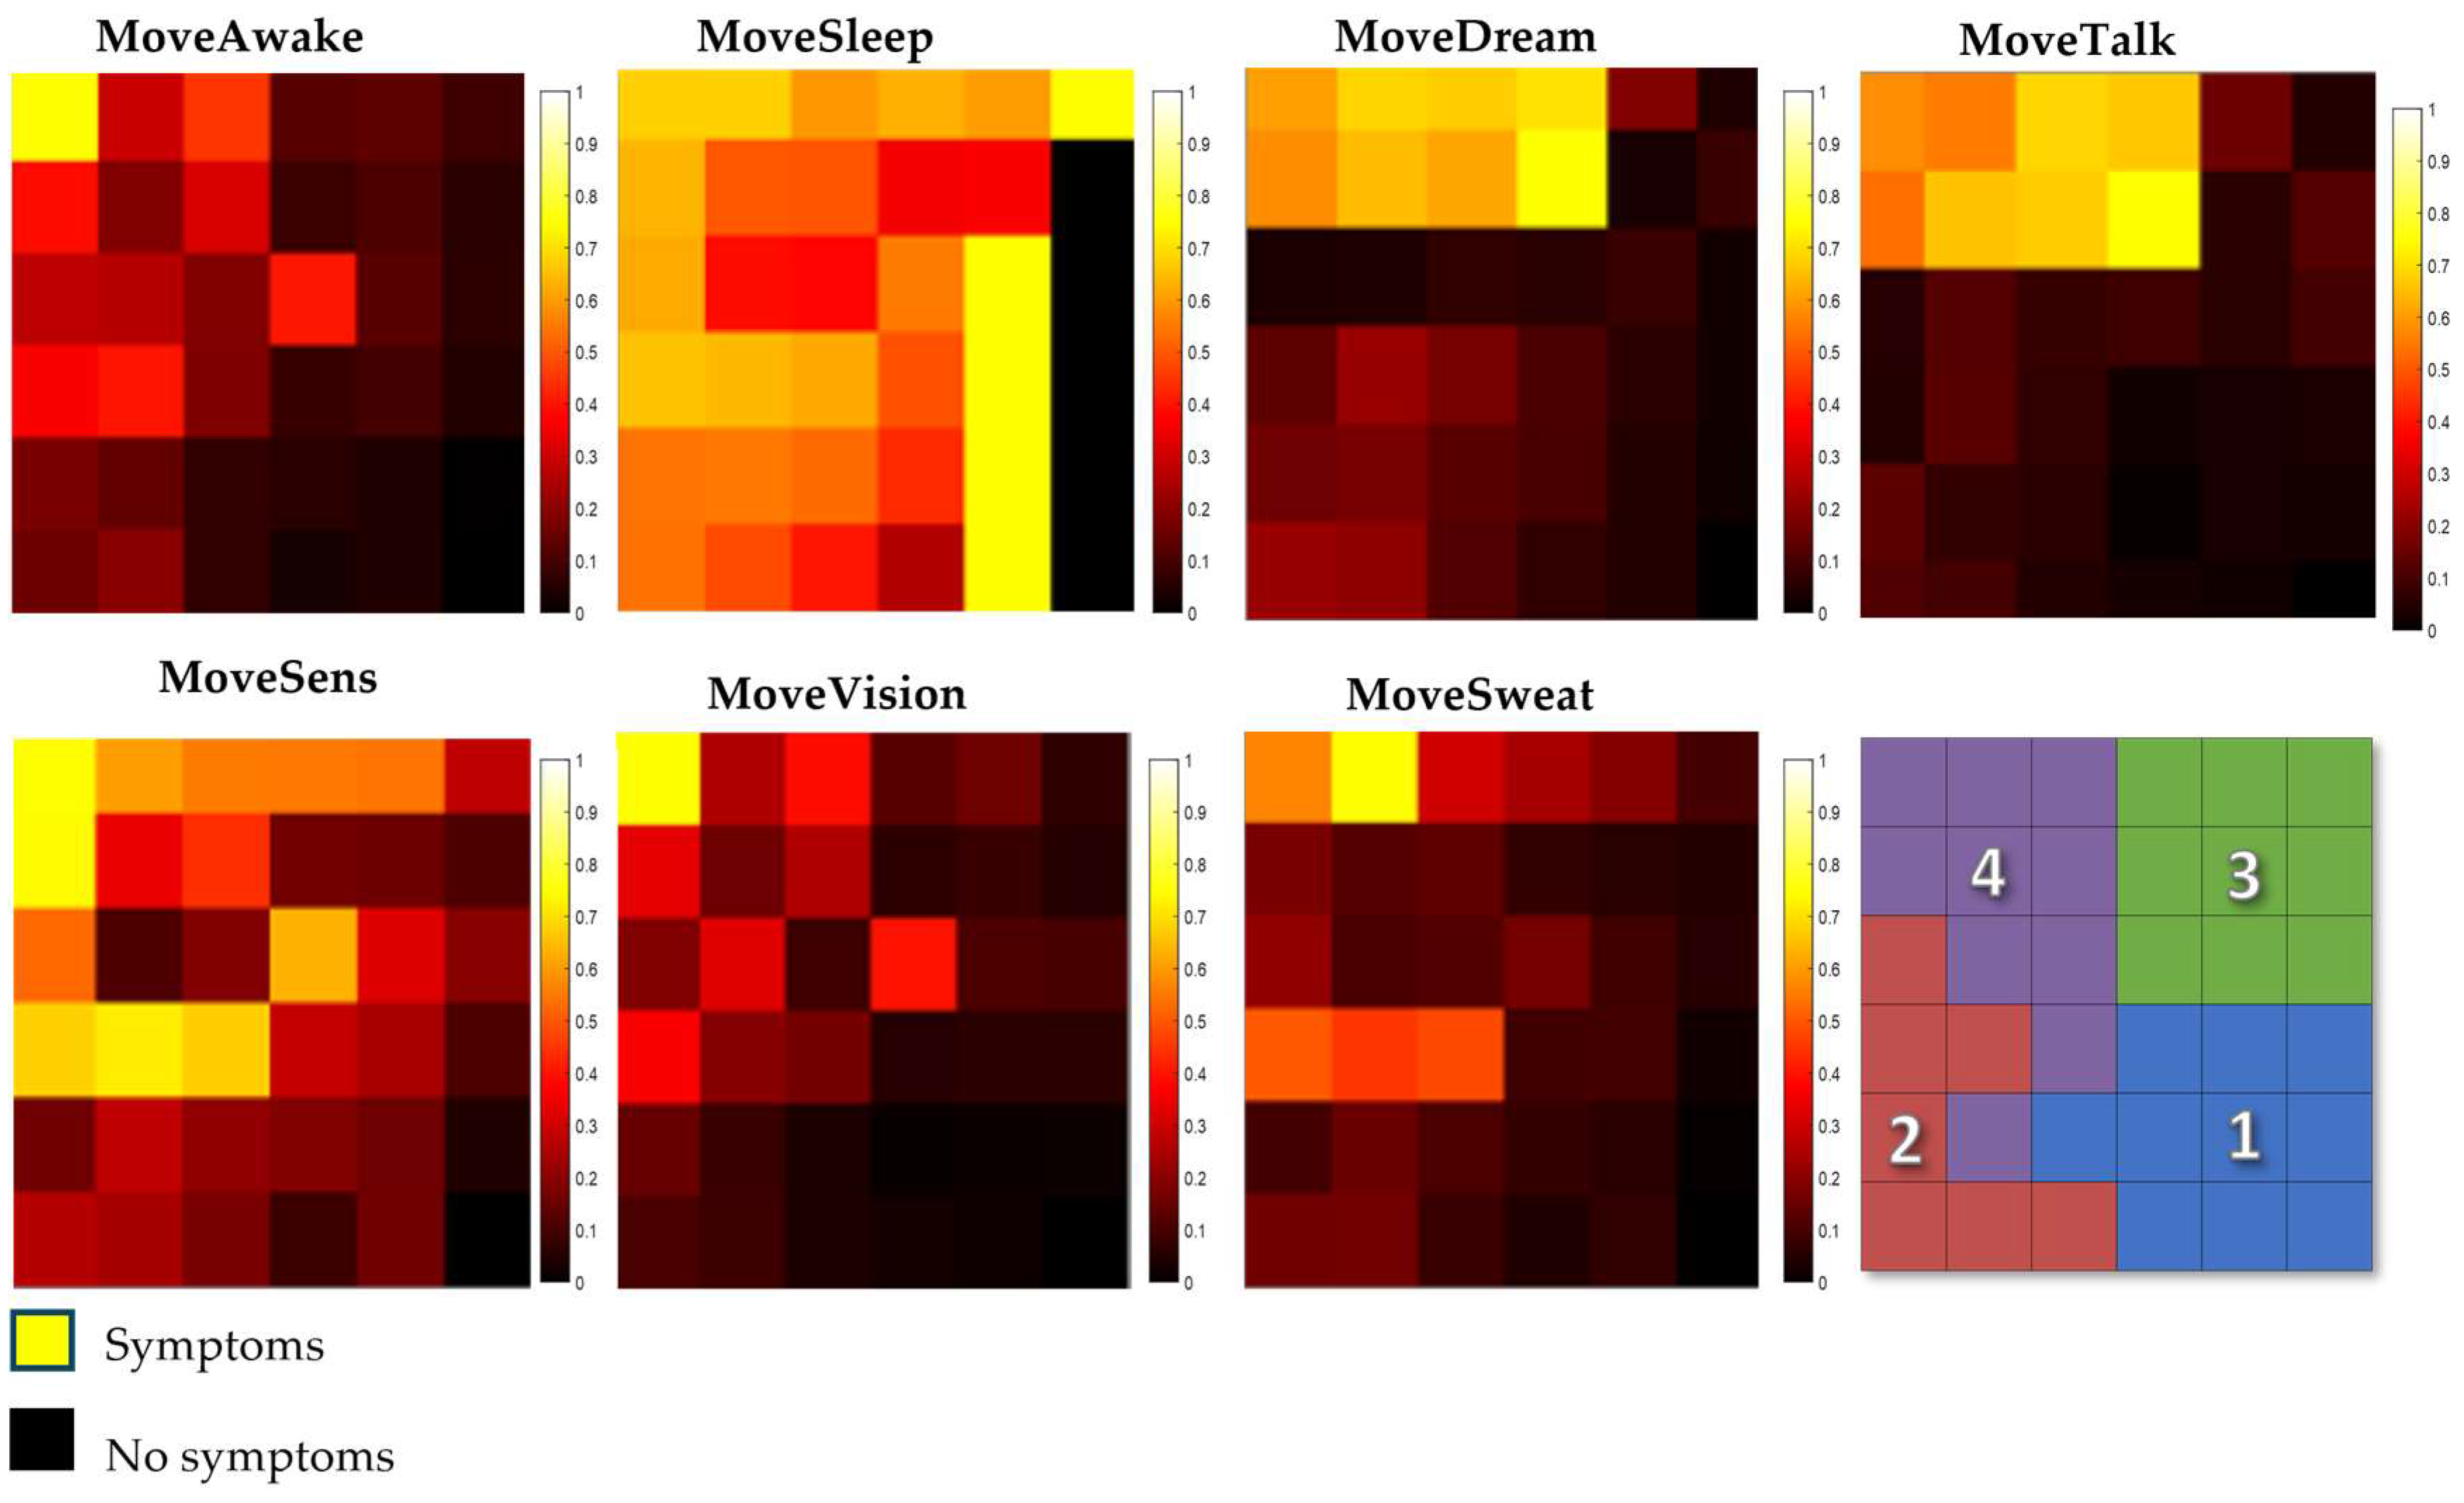
3.2. Component Maps
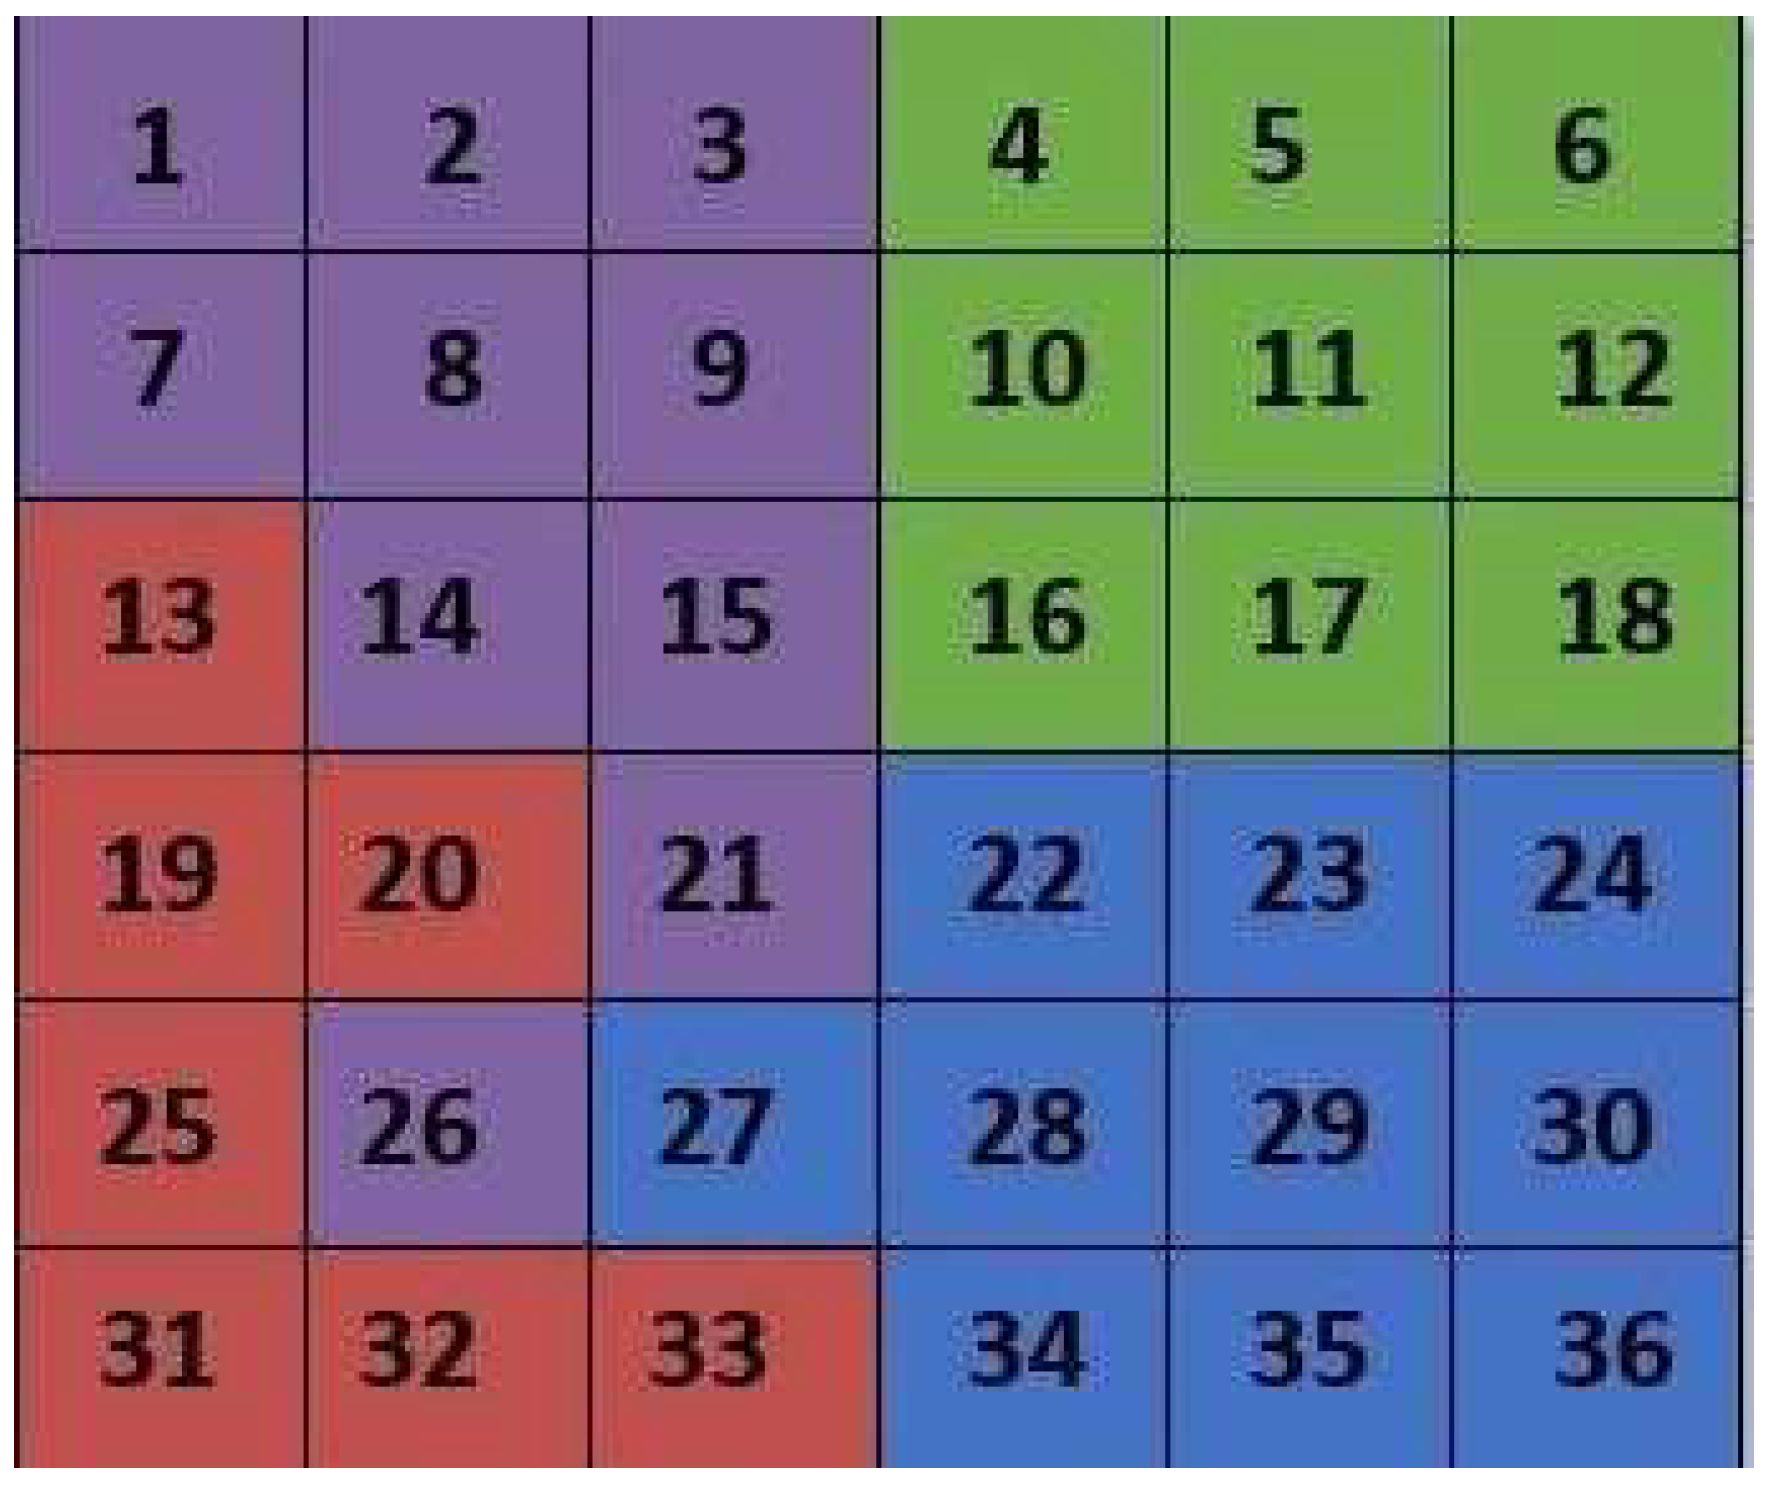
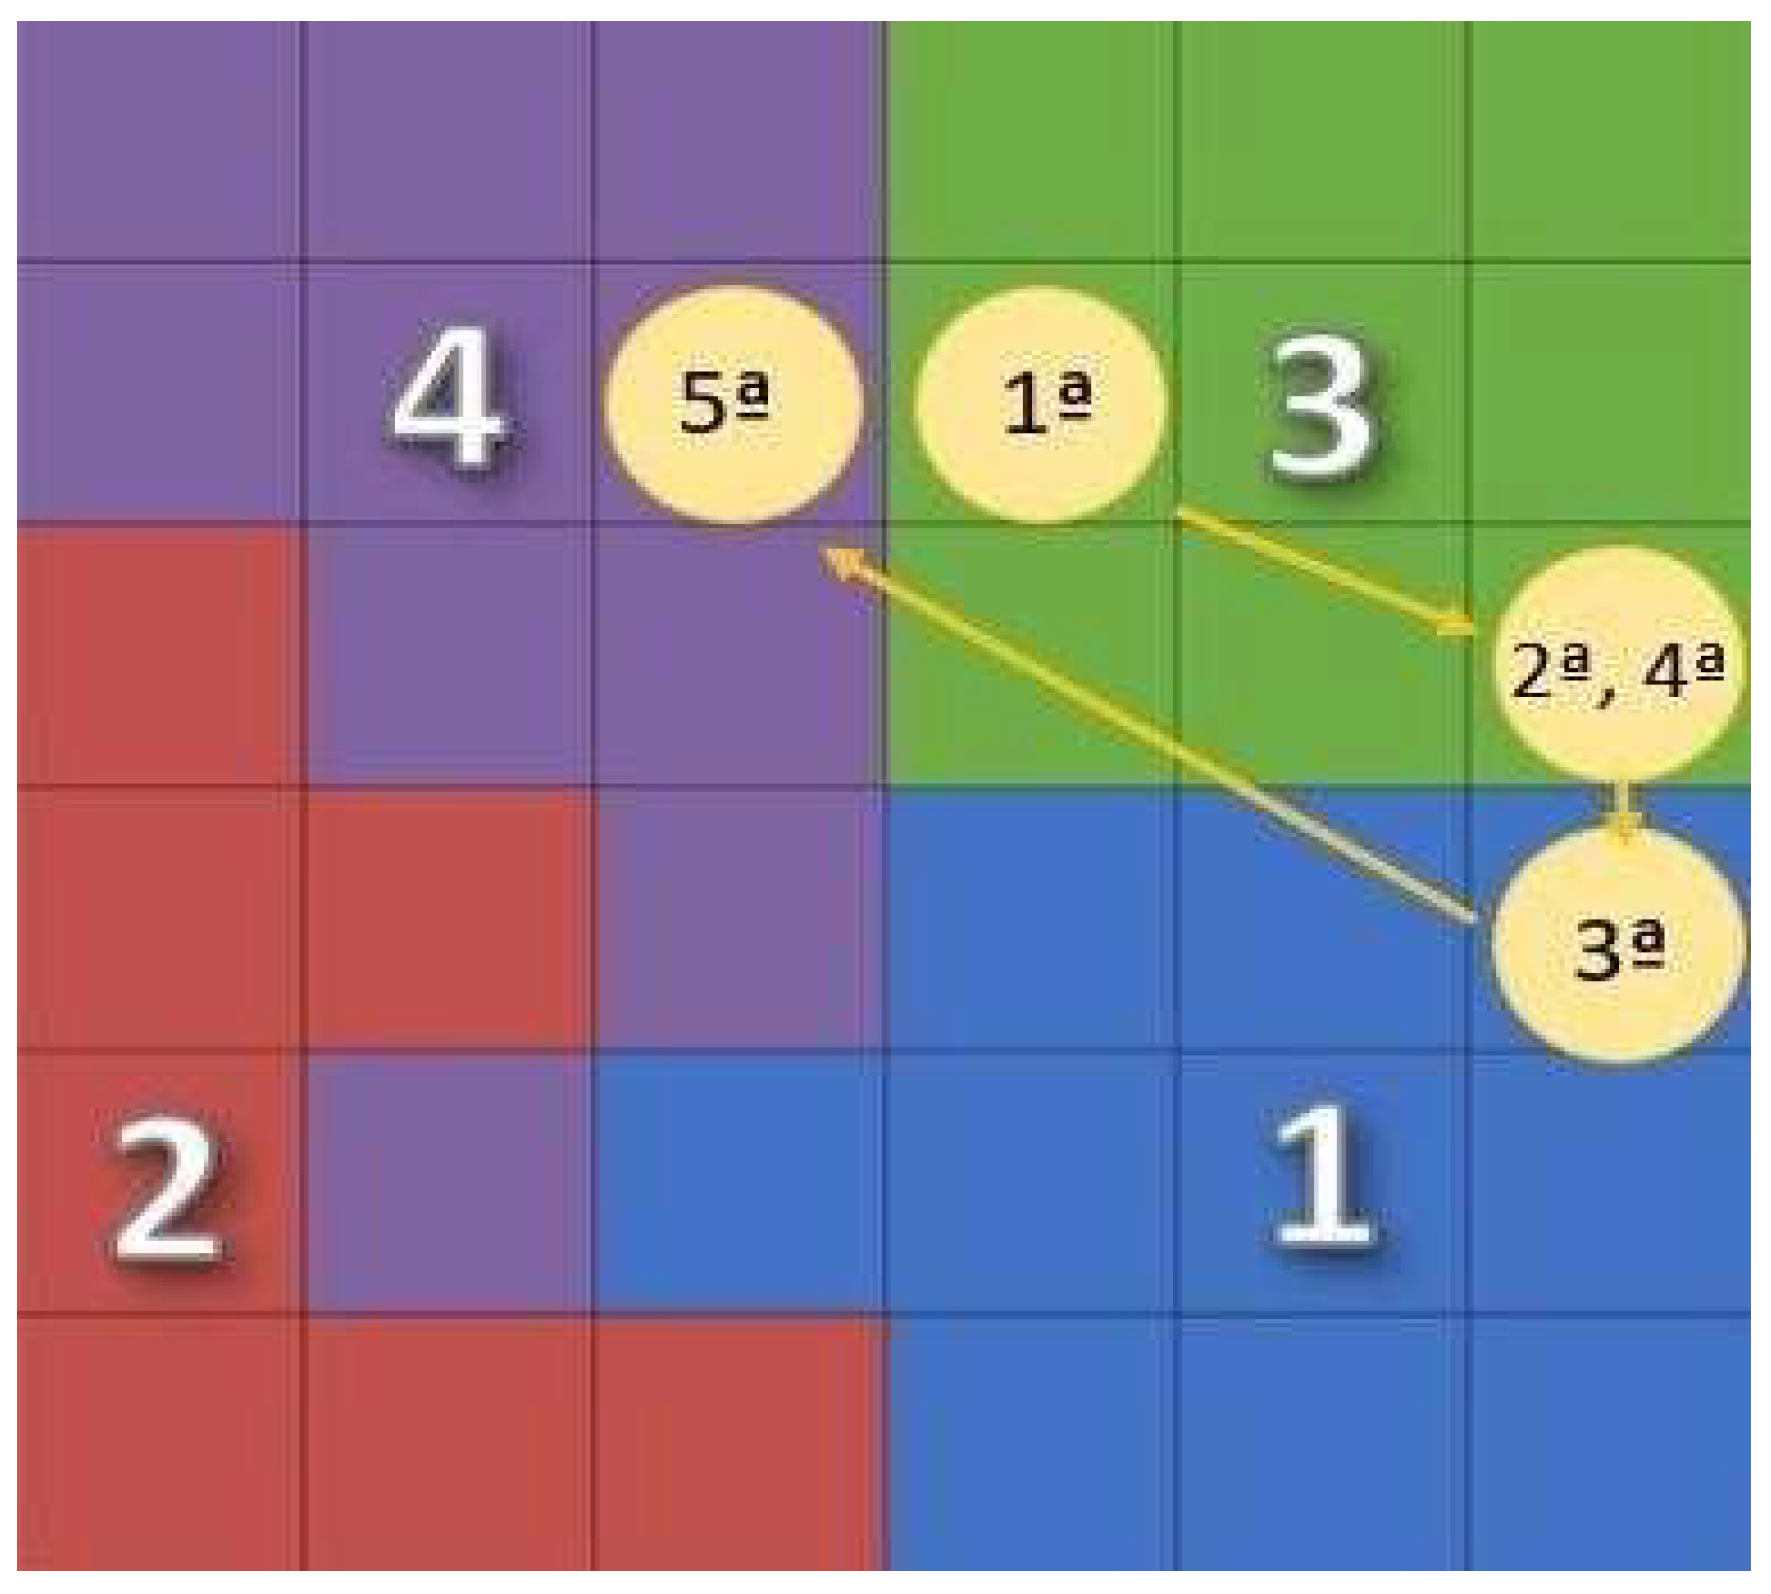
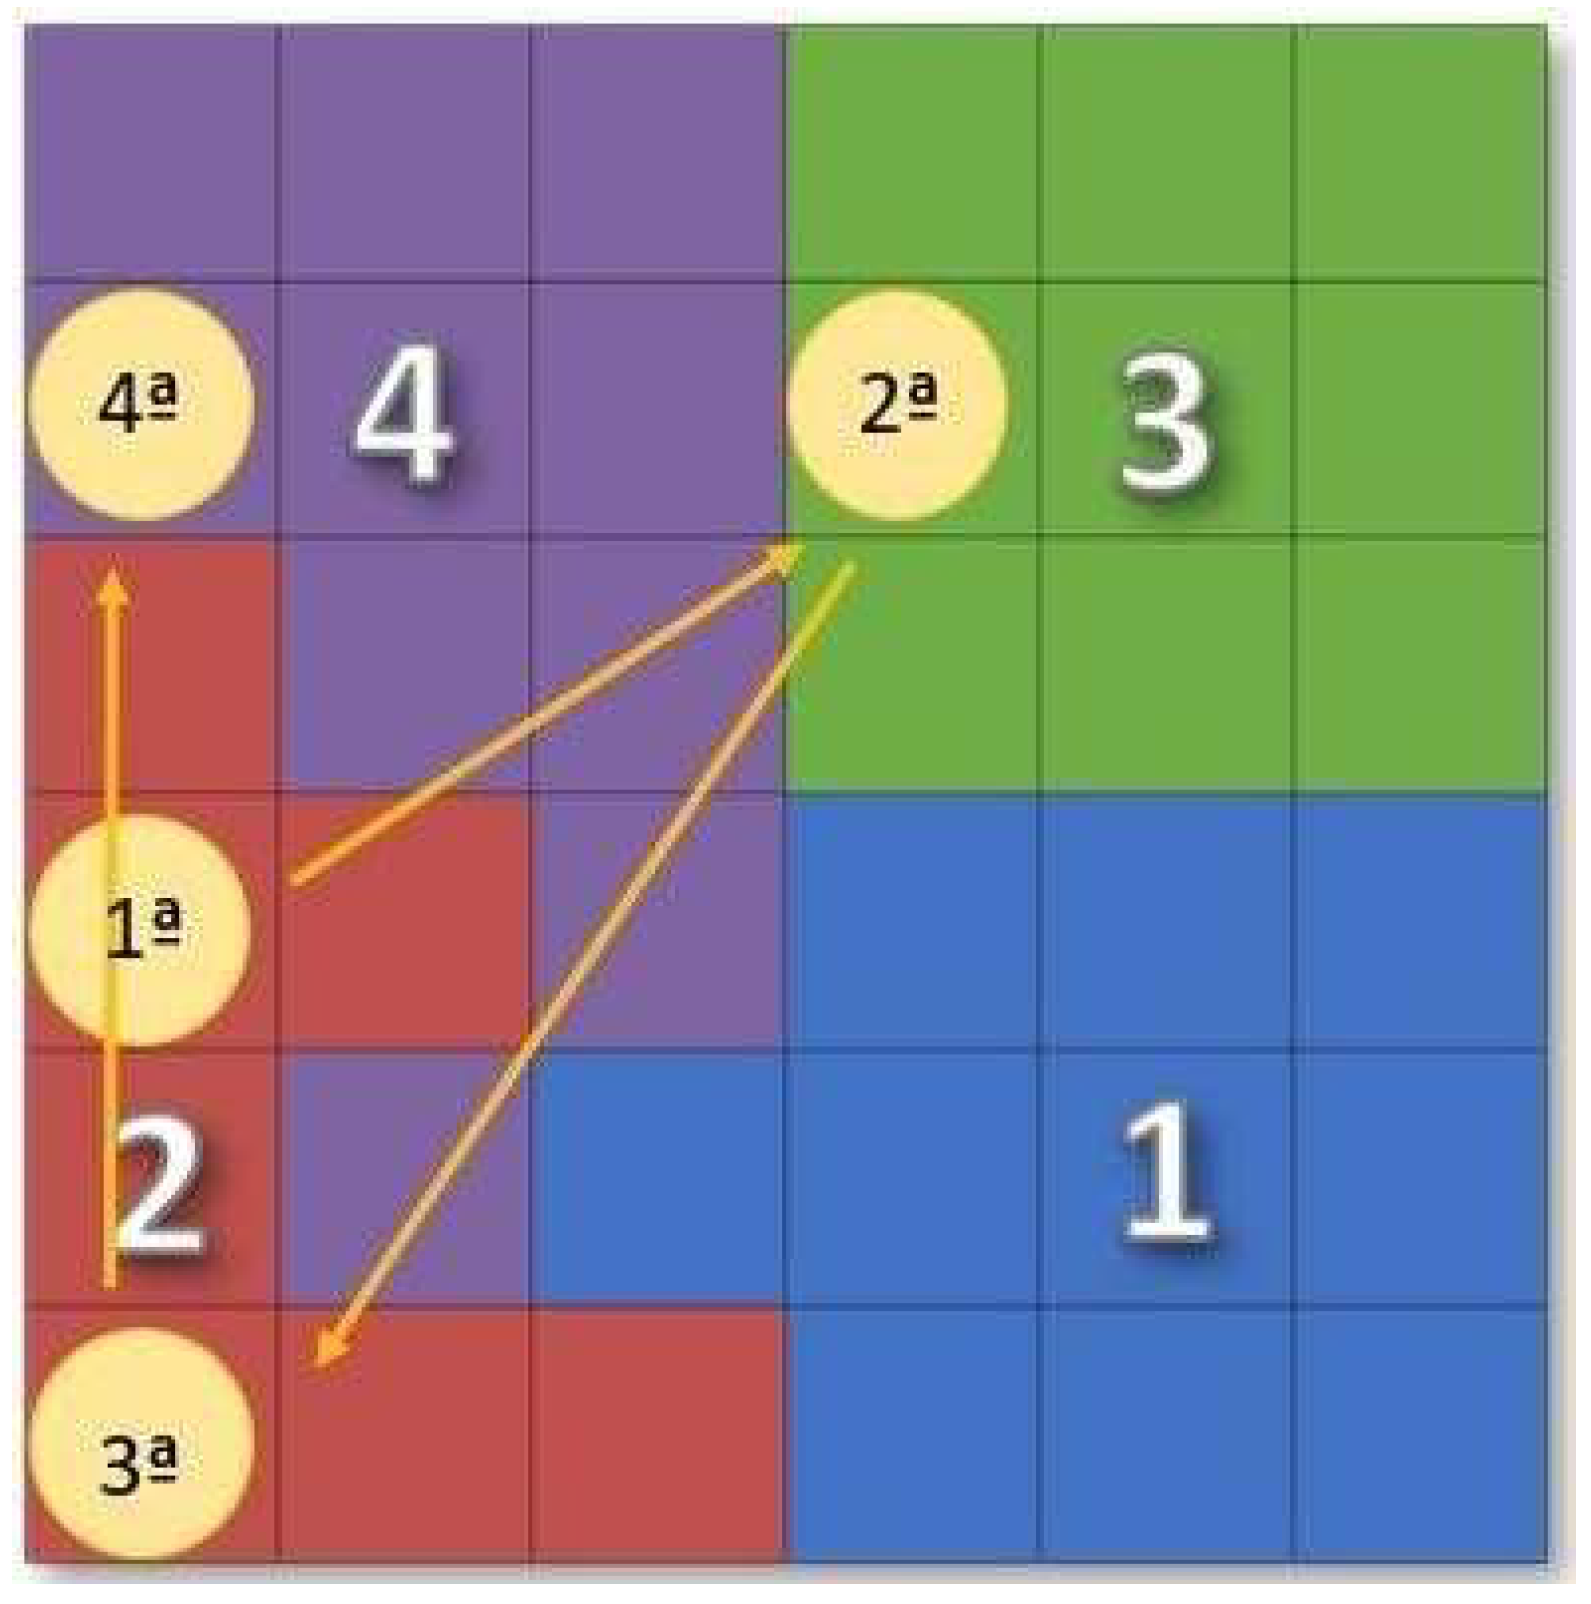
3.3. Moving Patients around the Map
Migration Trends
3.4. Validation of Results
4. Conclusions
Author Contributions
Funding
Data Availability Statement
Conflicts of Interest
References
- Ou, Z.; Pan, J.; Tang, S.; Duan, D.; Yu, D.; Nong, H.; Wang, Z. Global Trends in the Incidence, Prevalence, and Years Lived with Disability of Parkinson’s Disease in 204 Countries/Territories from 1990 to 2019. Front. Public Health 2021, 9, 776847. [Google Scholar] [CrossRef]
- Simon, D.K.; Tanner, C.M.; Brundin, P. Parkinson Disease Epidemiology, Pathology, Genetics, and Pathophysiology. Clin. Geriatr. Med. 2020, 36, 1–12. [Google Scholar] [CrossRef] [PubMed]
- World Health Organization (WHO). Parkinson Disease. Available online: https://www.who.int/news-room/fact-sheets/detail/parkinson-disease (accessed on 15 October 2023).
- Ferreira, M.; Massano, J. An updated review of Parkinson’s disease genetics and clinicopathological correlations. Acta Neurol. Scand. 2016, 135, 273–284. [Google Scholar] [CrossRef] [PubMed]
- Souza, R.A.; Vieira, I.T.V.; Silva, J.P. Biomarcadores clínicos de sintomas não motores na doença de Parkinson. Rev. Neurociências 2021, 29, 1–14. [Google Scholar] [CrossRef]
- de Oliveira e Silva, V.; Karollyne de Siqueira Mendes, J.; Augusto de Barros Filho, V.; das Graças Loureiro das Chagas Campêlo, M.; Torres Pereira, E. Uso de Redes Neurais para a Predição de Diagnóstico de AVE: Uma Revisão Sistemática. Rev. Bras. Neurol. 2022, 58, 21. [Google Scholar]
- Myszczynska, M.; Ojamies, P.; Lacoste, A.; Neil, D.; Saffari, A.; Mead, R.; Hautbergue, G.; Holbrook, J.; Ferraiuolo, L. Applications of machine learning to diagnosis and treatment of neurodegenerative diseases. Nat. Rev. Neurol. 2020, 16, 440–456. [Google Scholar] [CrossRef]
- Shastry, K.A.; Janyani, N.; Greeshma, G.; Kruthina, U.; Patil, L. Advanced Deep Learning Techniques for Predicting Neurodegenerative Diseases. In Proceedings of the 2023 International Conference on Network, Multimedia and Information Technology (NMITCON), Bengaluru, India, 1–2 September 2023; pp. 1–8. [Google Scholar] [CrossRef]
- Yagis, E.; Herrera, A.; Citi, L. Generalization Performance of Deep Learning Models in Neurodegenerative Disease Classification. In Proceedings of the 2019 IEEE International Conference on Bioinformatics and Biomedicine (BIBM), San Diego, CA, USA, 18–21 November 2019; pp. 1692–1698. [Google Scholar] [CrossRef]
- Lee, G.; Nho, K.; Kang, B.; Sohn, K.; Kim, D. Predicting Alzheimer’s disease progression using multi-modal deep learning approach. Sci. Rep. 2019, 9, 1952. [Google Scholar] [CrossRef]
- Lavin, A. Neuro-symbolic Neurodegenerative Disease Modeling as Probabilistic Programmed Deep Kernels. arXiv 2020, arXiv:2009.07738. [Google Scholar]
- Watts, J.; Khojandi, A.; Shylo, O.; Ramdhani, R. Machine Learning’s Application in Deep Brain Stimulation for Parkinson’s Disease: A Review. Brain Sci. 2020, 10, 809. [Google Scholar] [CrossRef]
- Sahu, L.; Sharma, R.; Sahu, I.; Das, M.; Sahu, B.; Kumar, R. Efficient detection of Parkinson’s disease using deep learning techniques over medical data. Expert Syst. 2021, 39, e12787. [Google Scholar] [CrossRef]
- Wingate, J.; Kollia, I.; Bidaut, L.; Kollias, S. A Unified Deep Learning Approach for Prediction of Parkinson’s Disease. IET Image Process. 2019, 14, 1980–1989. [Google Scholar] [CrossRef]
- Shubhangi, D.C.; Gundagurti, P. Deep Learning Based Diagnosis of Parkinson’s Disease Using CNN. Int. J. Sci. Res. Comput. Sci. Eng. Inf. Technol. 2020, 6, 351–355. [Google Scholar] [CrossRef]
- Alagdeve, V.; Thatipudi, J.; Roy, P.; Nithya, R.N.A.; Ramesh, B. Deep Learning-based Prediction of Parkinson’s Disease Progression using Voice Recordings. In Proceedings of the 2023 7th International Conference on I-SMAC (IoT in Social, Mobile, Analytics and Cloud) (I-SMAC), Kirtipur, Nepal, 11–13 October 2023; pp. 843–847. [Google Scholar] [CrossRef]
- Araújo, S.M.; Nery, S.B.M.; Magalhães, B.G.; Almeida, K.J.; Gaspar, P.D. Disease Severity Index in Parkinson’s Disease Based on Self-Organizing Maps. Appl. Sci. 2023, 13, 10019. [Google Scholar] [CrossRef]
- Bock, M.A.; Brown, E.G.; Zhang, L.; Tanner, C.C. Association of Motor and Nonmotor Symptoms with Health-Related Quality of Life in a Large Online Cohort of People with Parkinson’s Disease. Neurology 2022, 98, e2194–e2203. [Google Scholar] [CrossRef]
- Pandove, D.; Shivan, G.; Rinkl Rani, E. Systematic Review of Clustering High-Dimensional and Large Datasets. ACM Trans. Knowl. Discov. Data 2018, 12, 1–68. [Google Scholar] [CrossRef]
- Figueiredo, E.; Macedo, M.; Siqueira, H.V.; Santana, C.J.; Gokhale, A.; Bastos-Filho, C.J.A. Swarm intelligence for clustering—A systematic review with new perspectives on data mining. Eng. Appl. Artif. Intell. 2019, 82, 313–329. [Google Scholar] [CrossRef]
- Kohonen, T. Self-Organizing Maps; Springer: Berlin/Heidelberg, Germany, 2001. [Google Scholar] [CrossRef]
- Santos, P.; Macedo, M.; Figueiredo, E.; Santana, C.J.; Soares, F.; Siqueira, H.; Maciel, A.; Gokhale, A.; Filho, C.J.A.B. Application of PSO-based clustering algorithms on educational databases. In Proceedings of the IEEE Latin American Conference on Computational Intelligence (LA-CCI), Arequipa, Peru, 8–10 November 2017. [Google Scholar] [CrossRef]


| Group | Designation | Description of Questions |
|---|---|---|
| Group 1 | MoveSaliva | Have you had saliva dripping during the day in the last month? |
| MoveSmell | Have you experienced a loss or change in your ability to taste or smell in the last month? | |
| MoveSwall | Have you had difficulty swallowing food or drinks or had problems choking in the last month? | |
| MoveConstip | Have you had constipation (less than three bowel movements per week) or had to strain to defecate in the last month? | |
| MoveBowelEmpty | Have you had the feeling that your bowel emptying was incomplete after going to the bathroom in the last month? | |
| MoveUrine | Have you had a feeling of urgency to urinate that made you run to the bathroom in the last month? | |
| MoveUrinePM | Have you gotten up regularly at night to urinate in the last month? | |
| Group 2 | MovePain | Have you had unexplained pain (not caused by known conditions such as arthritis) in the last month? |
| MoveWeight | Have you had an unexplained weight change (not due to dietary changes) in the last month? | |
| MoveInterest | Have you lost interest in what is happening around you or in doing things in the last month? | |
| MoveSee | Have you seen or heard things that you know or have been told do not exist in the last month? | |
| MoveAnxious | Have you felt anxious, scared, or panicked in the last month? | |
| MoveSex | Have you felt less interested in sex or more interested in sex in the last month? | |
| MoveSexDiff | Did you have difficulty having sex when you tried in the last month? | |
| MoveHappen | Have you believed that things are happening to you that other people say are not happening in the last month? | |
| MoveForget | Have you had trouble remembering things that happened recently or forgotten to do things in the last month? | |
| MoveConcent | Had difficulty concentrating or staying focused on the last month? | |
| MoveFell | Have you felt “depressed” or “sad” in the last month? | |
| Group 3 | MoveAwake | Have you had difficulty staying awake during activities such as working, driving, or eating in the last month? |
| MoveSleep | Had difficulty sleeping at night or staying awake | |
| MoveDream | sleep through the night in the last month? | |
| MoveTalk | Have you had vivid or frightening intense dreams in the last month? | |
| MoveSens | Have you had the experience of talking or moving in your sleep as if you were “playing out” a dream in the last month? | |
| MoveVision | Have you had unpleasant sensations in your legs at night or while | |
| MoveSweat | rested and the feeling that you needed to move in the last month? |
| Class 1 | Class 2 | Class 3 | Class 4 |
|---|---|---|---|
| 8329 patients | 6098 patients | 7034 patients | 5294 patients |
| LAST CONSULTATION | |||||
| BASELINE | Class 1 | Class 2 | Class 3 | Class 4 | |
| Class 1 | 55% (4585 patients) | 17% (1430 patients) | 24% (1995 patients) | 4% (319 patients) | |
| Class 2 | 15% (929 patients) | 44% (2685 patients) | 19% (1137 patients) | 22% (1347 patients) | |
| Class 3 | 15% (1085 patients) | 18% (1298 patients) | 48% (3393 patients) | 18% (1258 patients) | |
| Class 4 | 2% (116 patients) | 20% (1080 patients) | 17% (902 patients) | 60% (3196 patients) | |
Disclaimer/Publisher’s Note: The statements, opinions and data contained in all publications are solely those of the individual author(s) and contributor(s) and not of MDPI and/or the editor(s). MDPI and/or the editor(s) disclaim responsibility for any injury to people or property resulting from any ideas, methods, instructions or products referred to in the content. |
© 2024 by the authors. Licensee MDPI, Basel, Switzerland. This article is an open access article distributed under the terms and conditions of the Creative Commons Attribution (CC BY) license (https://creativecommons.org/licenses/by/4.0/).
Share and Cite
Nery, S.B.M.; Araújo, S.M.; Magalhães, B.G.; de Almeida, K.J.S.; Gaspar, P.D. Parkinson’s Disease Severity Index Based on Non-Motor Symptoms by Self-Organizing Maps. Electronics 2024, 13, 1523. https://doi.org/10.3390/electronics13081523
Nery SBM, Araújo SM, Magalhães BG, de Almeida KJS, Gaspar PD. Parkinson’s Disease Severity Index Based on Non-Motor Symptoms by Self-Organizing Maps. Electronics. 2024; 13(8):1523. https://doi.org/10.3390/electronics13081523
Chicago/Turabian StyleNery, Sabrina B. M., Suellen M. Araújo, Bianca G. Magalhães, Kelson J. S. de Almeida, and Pedro D. Gaspar. 2024. "Parkinson’s Disease Severity Index Based on Non-Motor Symptoms by Self-Organizing Maps" Electronics 13, no. 8: 1523. https://doi.org/10.3390/electronics13081523
APA StyleNery, S. B. M., Araújo, S. M., Magalhães, B. G., de Almeida, K. J. S., & Gaspar, P. D. (2024). Parkinson’s Disease Severity Index Based on Non-Motor Symptoms by Self-Organizing Maps. Electronics, 13(8), 1523. https://doi.org/10.3390/electronics13081523