Abstract
Emotion monitoring technologies leveraging detection of facial expressions have gained important attention in psychological and social research due to their ability of providing objective emotional measurements. However, this paper addresses a gap in the literature consisting of the correlation between emotional facial response and sentiment analysis of written texts, developing a system capable of recognizing real-time emotional responses. The system uses a Raspberry Pi 4 and a Pi Camera module in order to perform real-time video capturing and facial expression analysis with the DeepFace version 0.0.80 model, while sentiment analysis of texts was performed utilizing Afinn version 0.1.0. User secure authentication and real-time database were implemented with Firebase. Although suitable for assessing psycho-emotional health in test takers, the system also provides valuable insights into the strong compatibility of the sentiment analysis performed on texts and the monitored facial emotional response, computing for each testing session the “compatibility” parameter. The framework provides an example of a new methodology for performing comparisons between different machine learning models, contributing to the enhancement of machine learning models’ efficiency and accuracy.
1. Introduction
The number of IoT (Internet of Things) systems has increased in a fast and almost exponential manner in recent years, utilizing edge computing and cloud capabilities in order to store, process, and send data gathered by a large variety of sensors. Internet of Things projects implement a large variety of protocols such as MQTT, HTTPS, LoRaWAN, Zigbee, and many others.
In the landscape of such technologies, machine learning algorithms and models are highly valued due to their ability to drastically enhance the usability of Internet of Things systems. One case of machine learning meeting the Internet of Things is in emotion monitoring methodologies, which have increased significantly in number and quality over the last years, allowing for a vast differentiation of applicability. In particular, objective measurements of emotions can be achieved through facial emotion recognition systems.
Emotion measurement is a complex task, as highlighted by the discrepancies between self-reported emotions and the facial emotion recognition models presented in [1,2]. Facial emotion recognition methodologies are particularly relevant in autism research due to the increased difficulty that individuals with autism may have in complex emotion recognition or expressiveness, as studied in [3,4,5,6].
Although there is a great deal of literature surrounding the topic of facial emotion recognition, there is still an important gap in research on the relationship and compatibility between such models and sentiment analysis in texts, which could further enhance the accuracy of emotion assessments. This study solves the gap by presenting an integrated IoT framework system combining both real-time facial emotion recognition with the DeepFace model and sentiment analysis integrating Afinn in written texts, proposing a multimodal method of emotion monitoring. Afinn and DeepFace were arbitrarly chosen as the two models to be compared, with the proposed framework being adjustable to a large variety of other different models in order to enhance modularity and facilitate further research. This system may also be used in transportation to improve road safety as seen in articles [7,8] or in business to monitor the emotional engagement of consumers to develop adequate market strategies as seen in [9].
The system also compares two machine learning models from different domains, introducing the parameter “Compatibility”. This is quite an innovative comparison due to the fact that although there are many articles comparing facial emotion recognition models [10,11,12,13,14] and sentiment analysis models [15,16,17,18], there is a lack of intertwining models from different domains. In addition, our research could be further implemented in the study of social media analysis as presented in articles [19,20,21].
2. Related Work
A large variety of emotion monitoring systems is presented in the literature, each of them having particular sets of sensors, specifications, and machine learning algorithms for data processing. In the following Table 1, some key characteristics regarding the systems were highlighted in order to differentiate each product and find gaps in the field of emotion monitoring. The key factors taken into account are as follows:

Table 1.
Related works targeting emotion monitoring systems.
- Includes sentiment analysis of written texts, considering if the systems include or not the analysis of written texts in their emotion monitoring process.
- Utilizes Afinn scores, a specific sentiment analysis lexicon developed by Finn Årup Nielsen that classifies words by a level of sentimental positivity and negativity.
- Includes facial emotion recognition with machine learning models made for detecting facial expressions by various parameters such as movement of eyebrows, lips, forehead, and other sections of the face.
- Utilizes DeepFace version 0.0.80 for real-time emotion recognition, an open-source facial attribute analysis Python-based framework (Python 3.11.0 was utilized for the present system).
- Measures emotional response using two or more sensors due to the possibility of measuring emotion via different methodologies, such as brain waves or sweat production.
- Computes the compatibility of two cross-field models, taking two machine learning models from different fields such as facial emotion monitoring algorithms and written text sentiment analysis algorithms in order to compare their results and enhance models’ reliability in real-life use scenarios.
- Leverages cloud services from different potential cloud providers such as Firebase, AWS, or Microsoft Azure for a multitude of different tasks such as real-time databases, storage, hosting, analytics or functions.
Various parameters were taken into account when monitoring emotions in the article [22], where, in addition to the EEG headset, both a heart rate variability sensor and a galvanic skin response sensor were implemented for higher accuracy. As such, IoT-based systems such as the brain were demonstrated to be capable of monitoring emotions and have the potential to improve emotional awareness and propose valid solutions to increase positive emotions.
A general model of a standalone robotic device capable of understanding human emotions is proposed in article [23] with the goal of facilitating human–machine interaction. The model gathers data from both video and audio but includes sentiment analysis of data due to translating it from audio to text.
A large variety of sensors such as respiratory sensors, galvanic skin response sensors, electrocardiogram sensors, electromyography sensors, skin temperature sensors, and blood volume pulse sensors were implemented in the system presented in article [24]. An IoT framework enabling sending physiological signals to hubs processing data that perform LSTM (long short-term memory)-based emotion recognition is used to further improve distance learning during the pandemic period.
The relevance of improving the accuracy of such emotion monitoring systems is reinforced in article [25], where a wearable IoT system that utilizes the Bluetooth connection to a mobile application is implemented. The proposed accuracy being approximately 80%, the product includes a mobile system used for the detection of a personalized mental crisis.
IoT-based emotion monitoring systems have high applicability in the modern world, with one such example being the Smart Baby Monitoring System proposed in the article [26]. The proposed smart cradle implements the use of facial detection algorithms and facial emotion recognition to alert caregivers of eventual tantrums, crying, or distress in babies, facilitating high-distance monitoring.
Although our proposed system performs facial emotion monitoring, various other methodologies of emotion monitoring can be applied, such as the capture of brain waves, as shown in the article [26]. The proposed IoMT system utilizes electroencephalography sensors to gather data that are then analyzed using the ADAM algorithm, a feedforward neutral network that also has first-order stochastic optimization. Emotional inputs are finally improved by a second layer of monitoring involving the analysis of touch behavior.
The system presented in [27] is designed for monitoring well-being during daily activities in older adults. The system leverages cloud technology and employs a photoplethysmogram sensor for measuring the blood volume and pulse, an electodermal activity sensor for the electrical conductance of the skin’s variations influenced by sweat secretion, an infrared thermophile sensor gathering the variations in skin temperature, and a three-axis accelerometer recording wrist motions over the three x-, y-, and z-axes.
Another applicability of facial emotion recognition systems can be seen in the article [28], where the driver’s level of fatigue can be quickly identified so that an alerting system can increase attention or suggest rest. The proposed model was trained to have an accuracy of more than 95% in emotion monitoring even in harsh conditions for image processing, such as poor lighting or with different head poses of the monitored drivers. The paper proposes an attention-based model that is both multi-modal and multi-view and implements near-infrared, depth-maps, and RGB.
The SPIDERS+ platform presented in article [29] includes a wireless wearable system based on glasses. The product monitors emotion by pupillometry and detecting head movements, zygomatic muscle movements, and eyebrow and eye shapes. The proposed algorithms utilize infrared images and optical flow for the classification of facial expressions.
Determining the attributes of each emotion monitoring system was crucial in identifying industrial and research gaps, such as the lack of sentiment analysis of written text implementation and so also particularly of the Afinn score methodology in emotion-monitoring-oriented studies; the DeepFace framework for facial recognition and classification of facial attributes; and finally, the compatibility of cross-field machine learning models.
Our proposed system solves these gaps by:
- Introducing the dimension of sentiment analysis to improve the reliability of facial monitoring algorithms by comparing the two results.
- Using DeepFace for emotion monitoring and so testing its performance through computing the compatibility.
- Computing the compatibility parameter between the positivity and negativity ratio found in the written texts using Afinn score-based sentiment analysis machine learning models and the positivity and negativity ratio revealed from the facial emotion recognition model using the DeepFace framework that was computed and transformed in specific percentages by particularly crafted equations.
3. Research Method
The proposed research method includes the following subsections: System architecture, Raspberry Pi and Pi Camera module setup, text analysis, preparing the text for the analysis, filtering the text, counting different words’ usage in the text, sentiment analysis of the text, most relevant verbs in the text, real-time recording and emotion monitoring, real-time video recording, emotional analysis of each frame, displaying the video in real time in Tkinter, and Firebase cloud services integration.
3.1. System Architecture
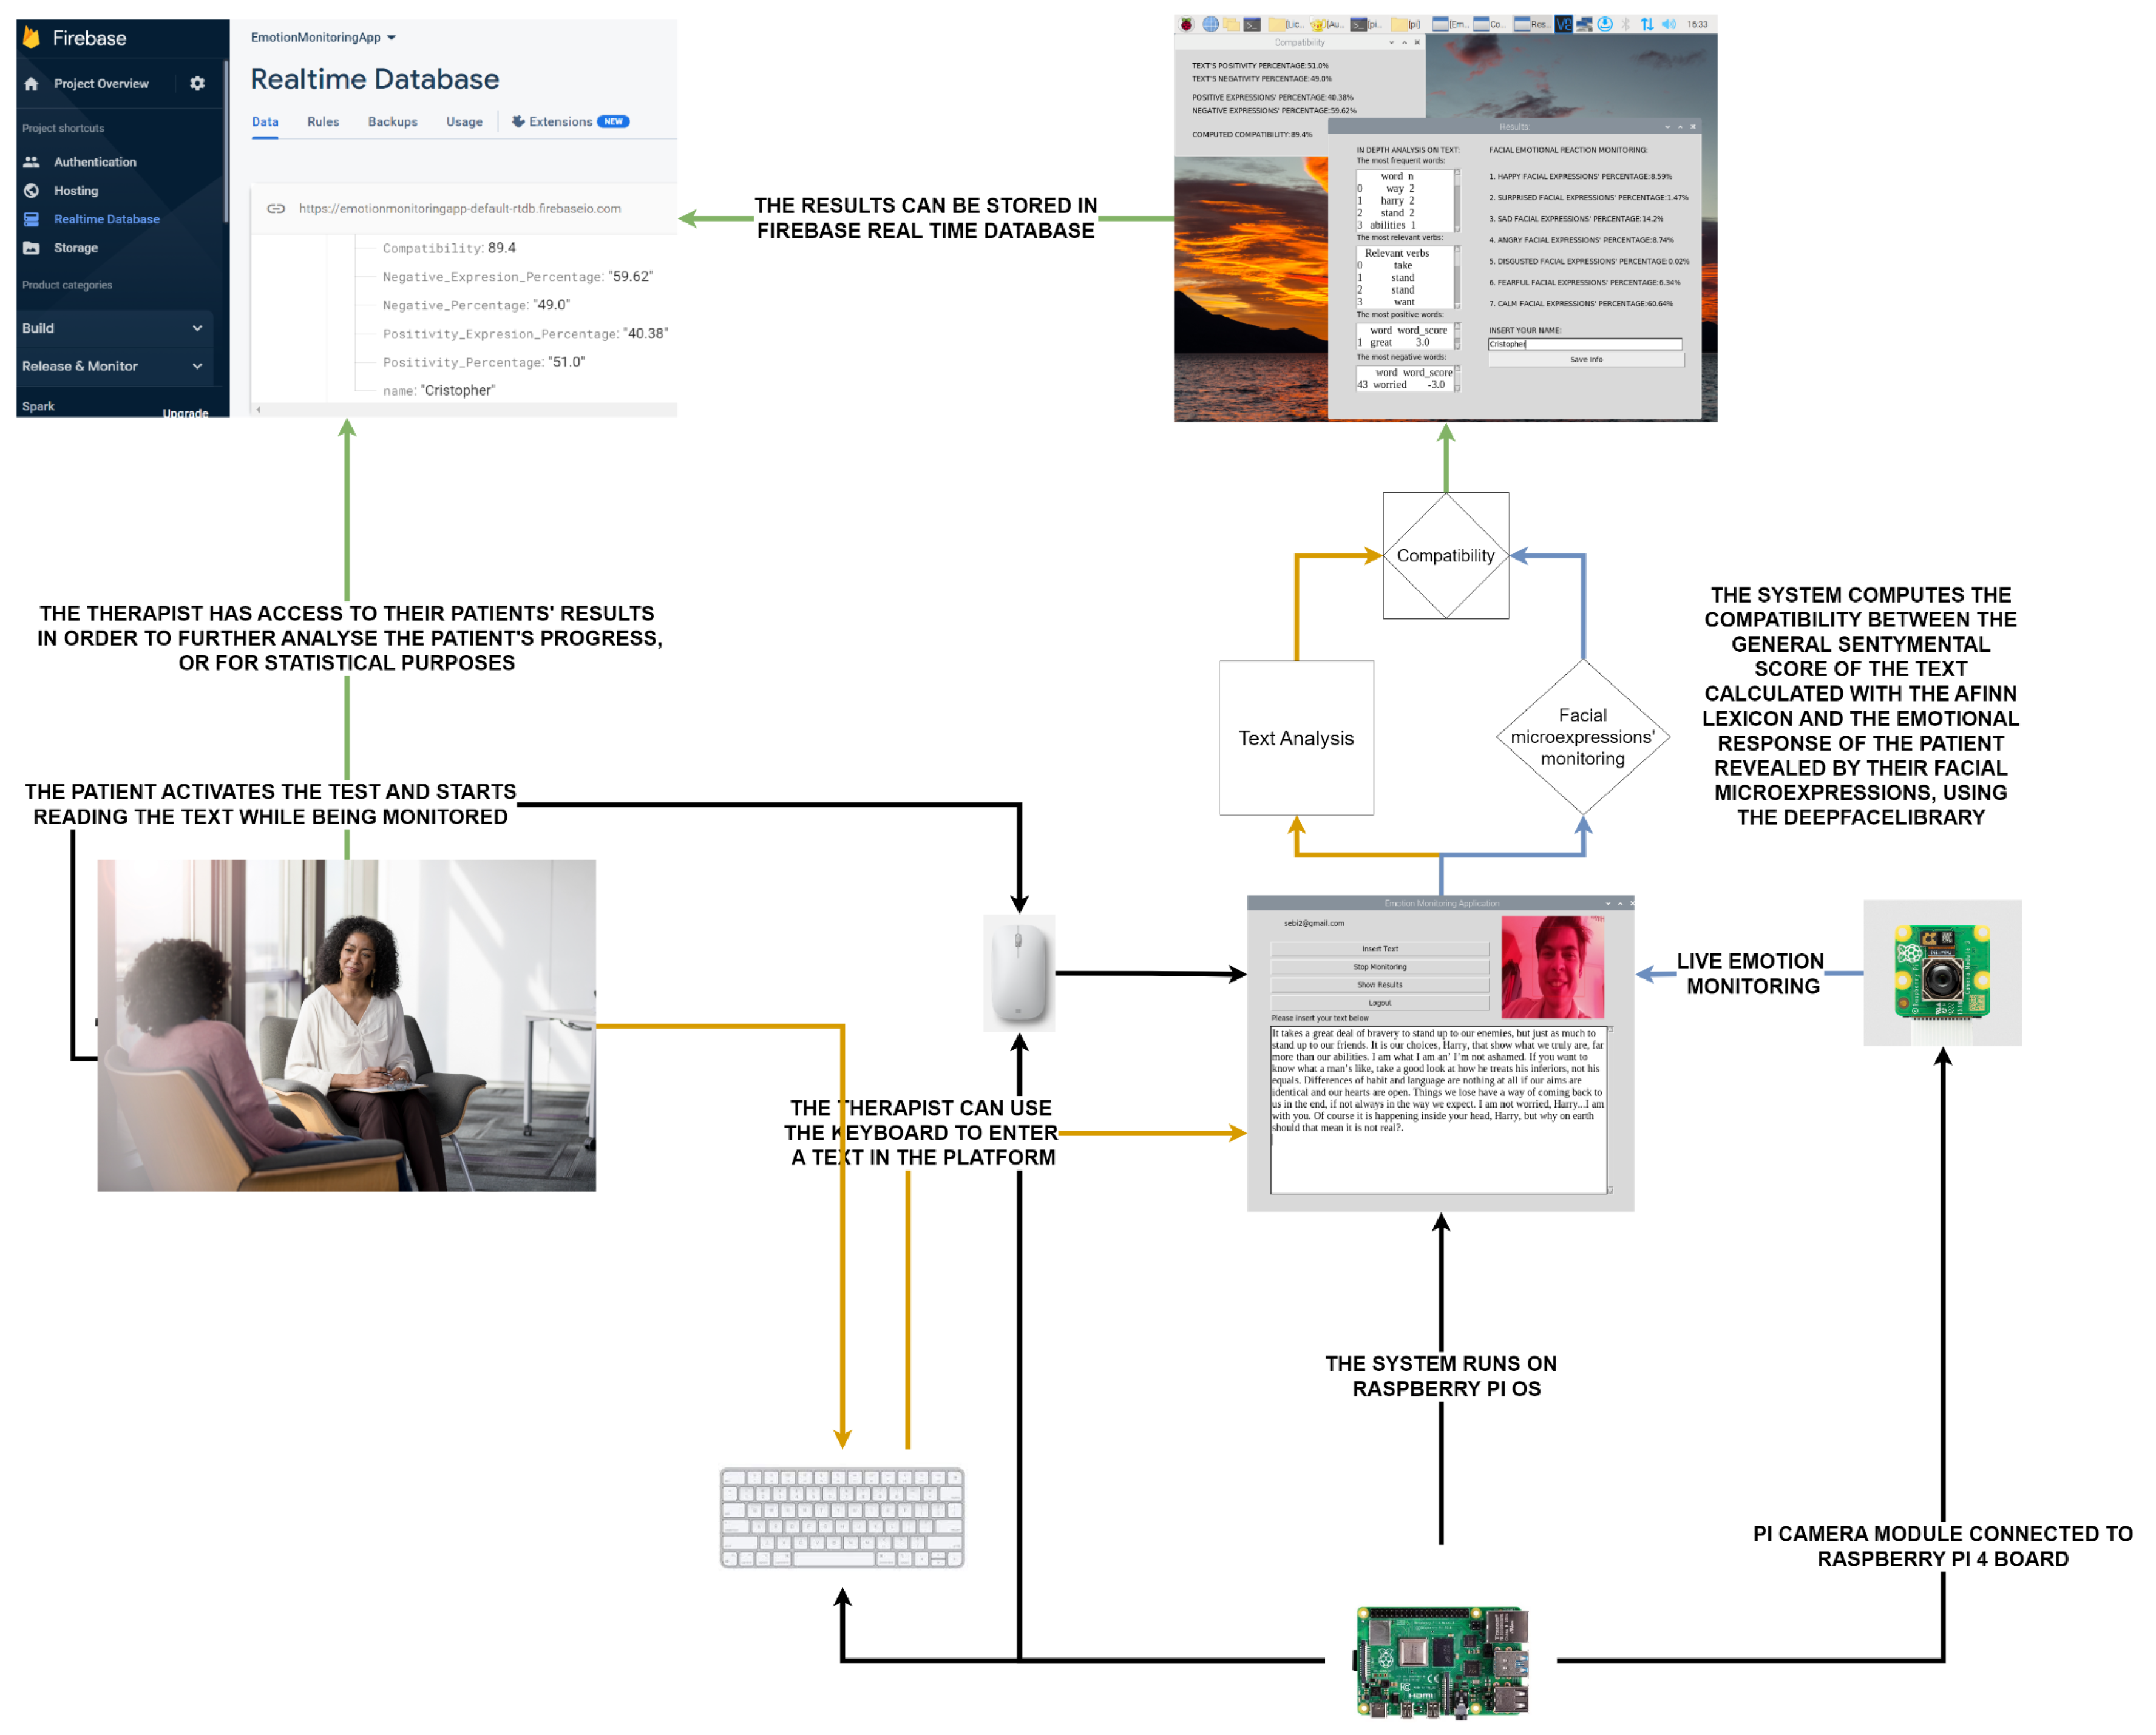
The main component of the system architecture is the Raspberry Pi 4 board (Raspberry Pi Foundation, Cambridge, UK), used not only for the development of the entire system but also for the connectivity to the Pi camera module, as presented in Figure 1. After opening the application, the examiner will introduce a text to be analyzed either writing it down using the keyboard or copying it and pasting it into the field of the text. This feature offers the examiner the freedom to use any text considered relevant for the specific case of the test taker, choosing, for example, texts with meanings and contents that may be connected to the test taker’s situation.
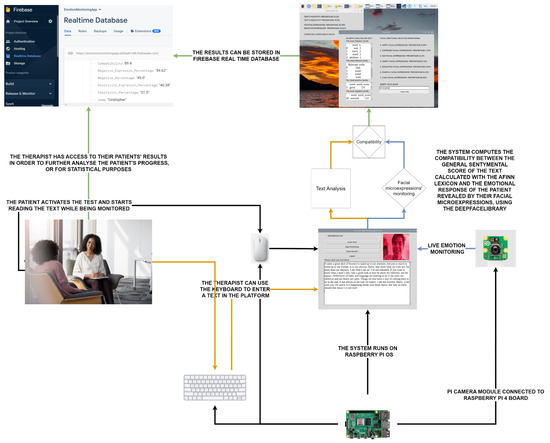
Figure 1.
System architecture diagram showing the system’s hardware setup and the flowchart of its usage in a use case scenario.
The test taker will start the monitoring by pressing the appropriate buttons on the platform and will also start reading the text. Once activated, the camera will monitor the facial expressions of the test taker in real time. At the end of the test, the test taker will press the ‘Show Results’ button to open two new windows, one containing the in-depth analysis of the text on the left and the in-depth analysis of the emotional response on the right, and the other containing the general conclusions of the computed test and the compatibility between the sentiments revealed using the Afinn list and the emotions revealed using the DeepFace system, 0.0.80 version. Finally, all conclusive information can be sent to the Firebase real-time database together with the test taker’s name under the examiner’s account. The system is built on the concept of connectivity between different analysis models, centered on user needs and comparing their separate results to gather new types of statistical data.
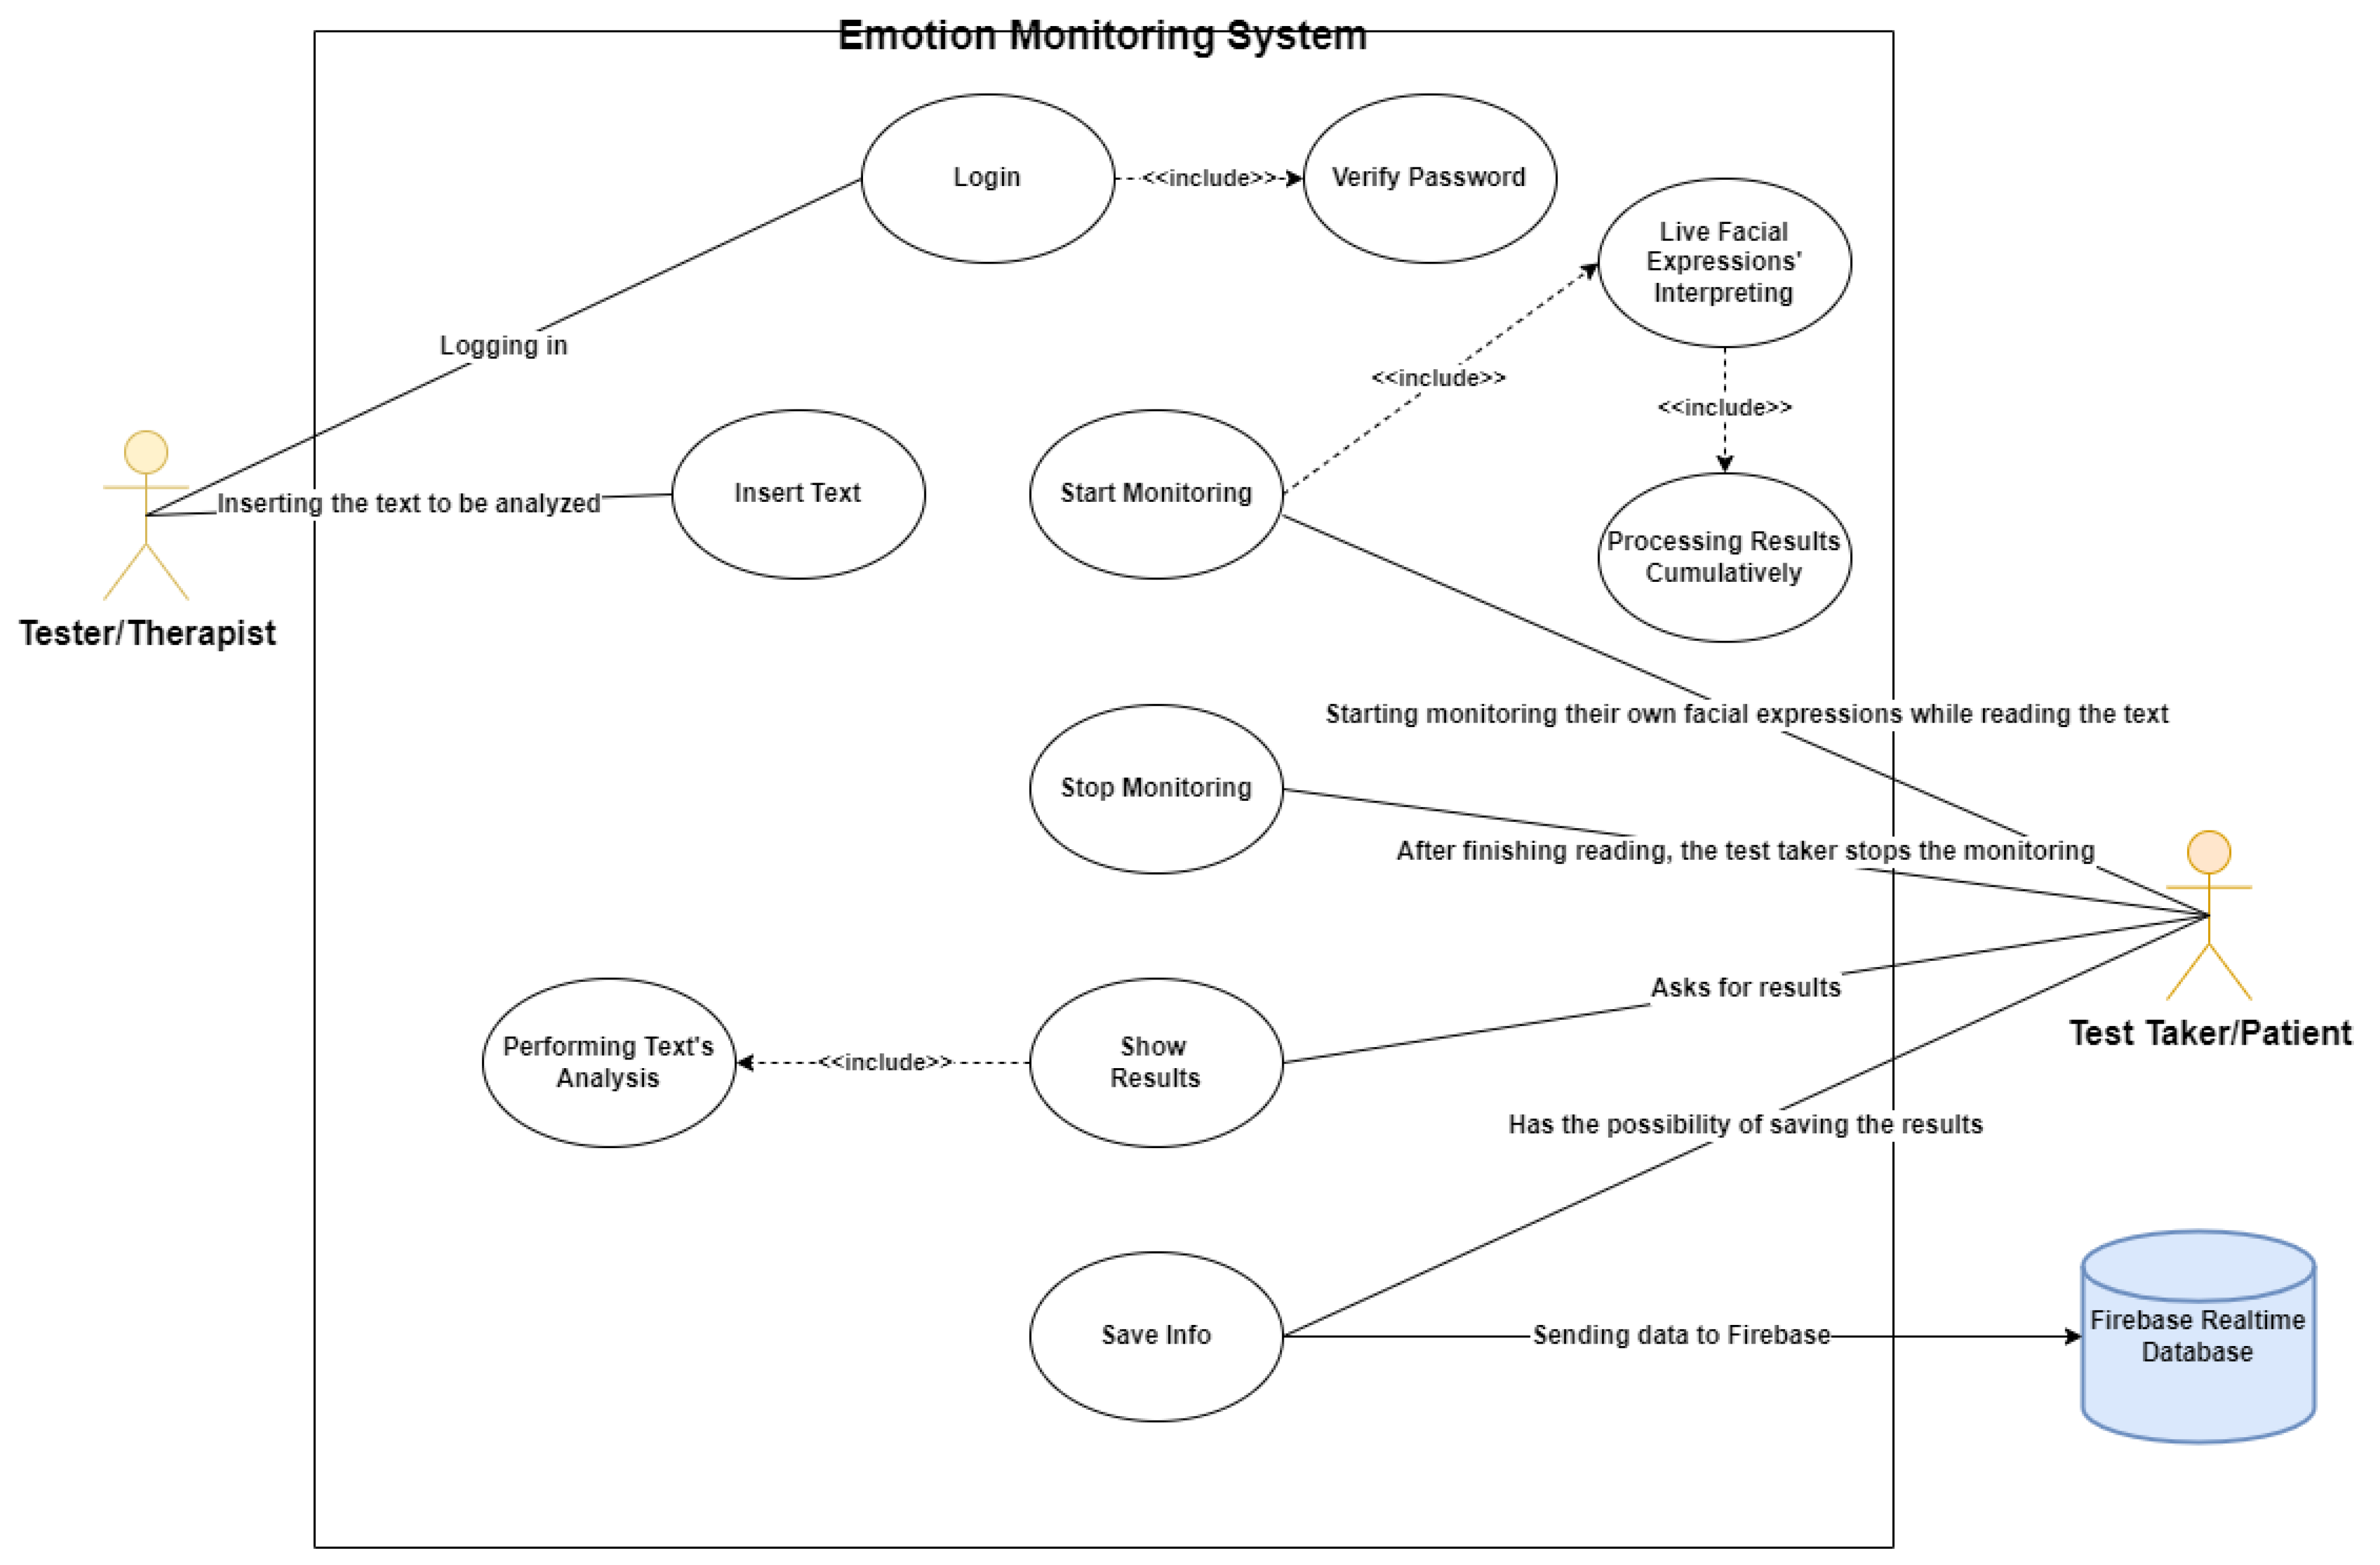
The application was built for the conjunctive use of two actors, as shown in Figure 2: both the examiner and the tester play a fundamental role in their workflow.

Figure 2.
Use case diagram showing: actor 1 (left)—examiner; actor2 (right)—test taker; system’s functionalities per actor.
The two main functionalities regarded by the examiner are ‘Login’ and ‘Insert Text’:
- ‘Login’ includes verifying the examiner’s credentials and provides to the application the necessary privacy of a mental health system while also being useful to record the test taker’s results and access them when needed through the Firebase authentication service.
- ‘Insert Text’ provides the examiner with a Tkinter scrolled text widget in order to enter the text to be analyzed.
The majority of functionalities are built for being used by the test taker:
- ‘Start Monitoring’, being one of the most important functionalities of the system, starts the real-time video capturing with the help of the openCV library while at the same time initializing the process of frame-by-frame analysis using the DeepFace system and computing the sums of each of the seven revealed emotions, their respective means, and the total positivity and total negativity revealed by the facial expressions cumulatively.
- ‘Stop Monitoring’ will be used by the test taker once the reading of the text has been terminated.
- ‘Show Results’, creates the results and compatibility windows while also calling the sentimentAnalysis() function in order to identify the most used words in the text, the most relevant verbs, the most positive and most negative words, and the total positivity and total negativity of the text in percentages (using the ‘computePositivity()’ function). ’Show Results’ will then display all information in the two windows while also computing compatibility.
- ‘Save Info’ is meant for the usage of the test taker in the case they would like to send their test results to the database. The test taker has the liberty to choose to send them or not and can even send the results anonymously.
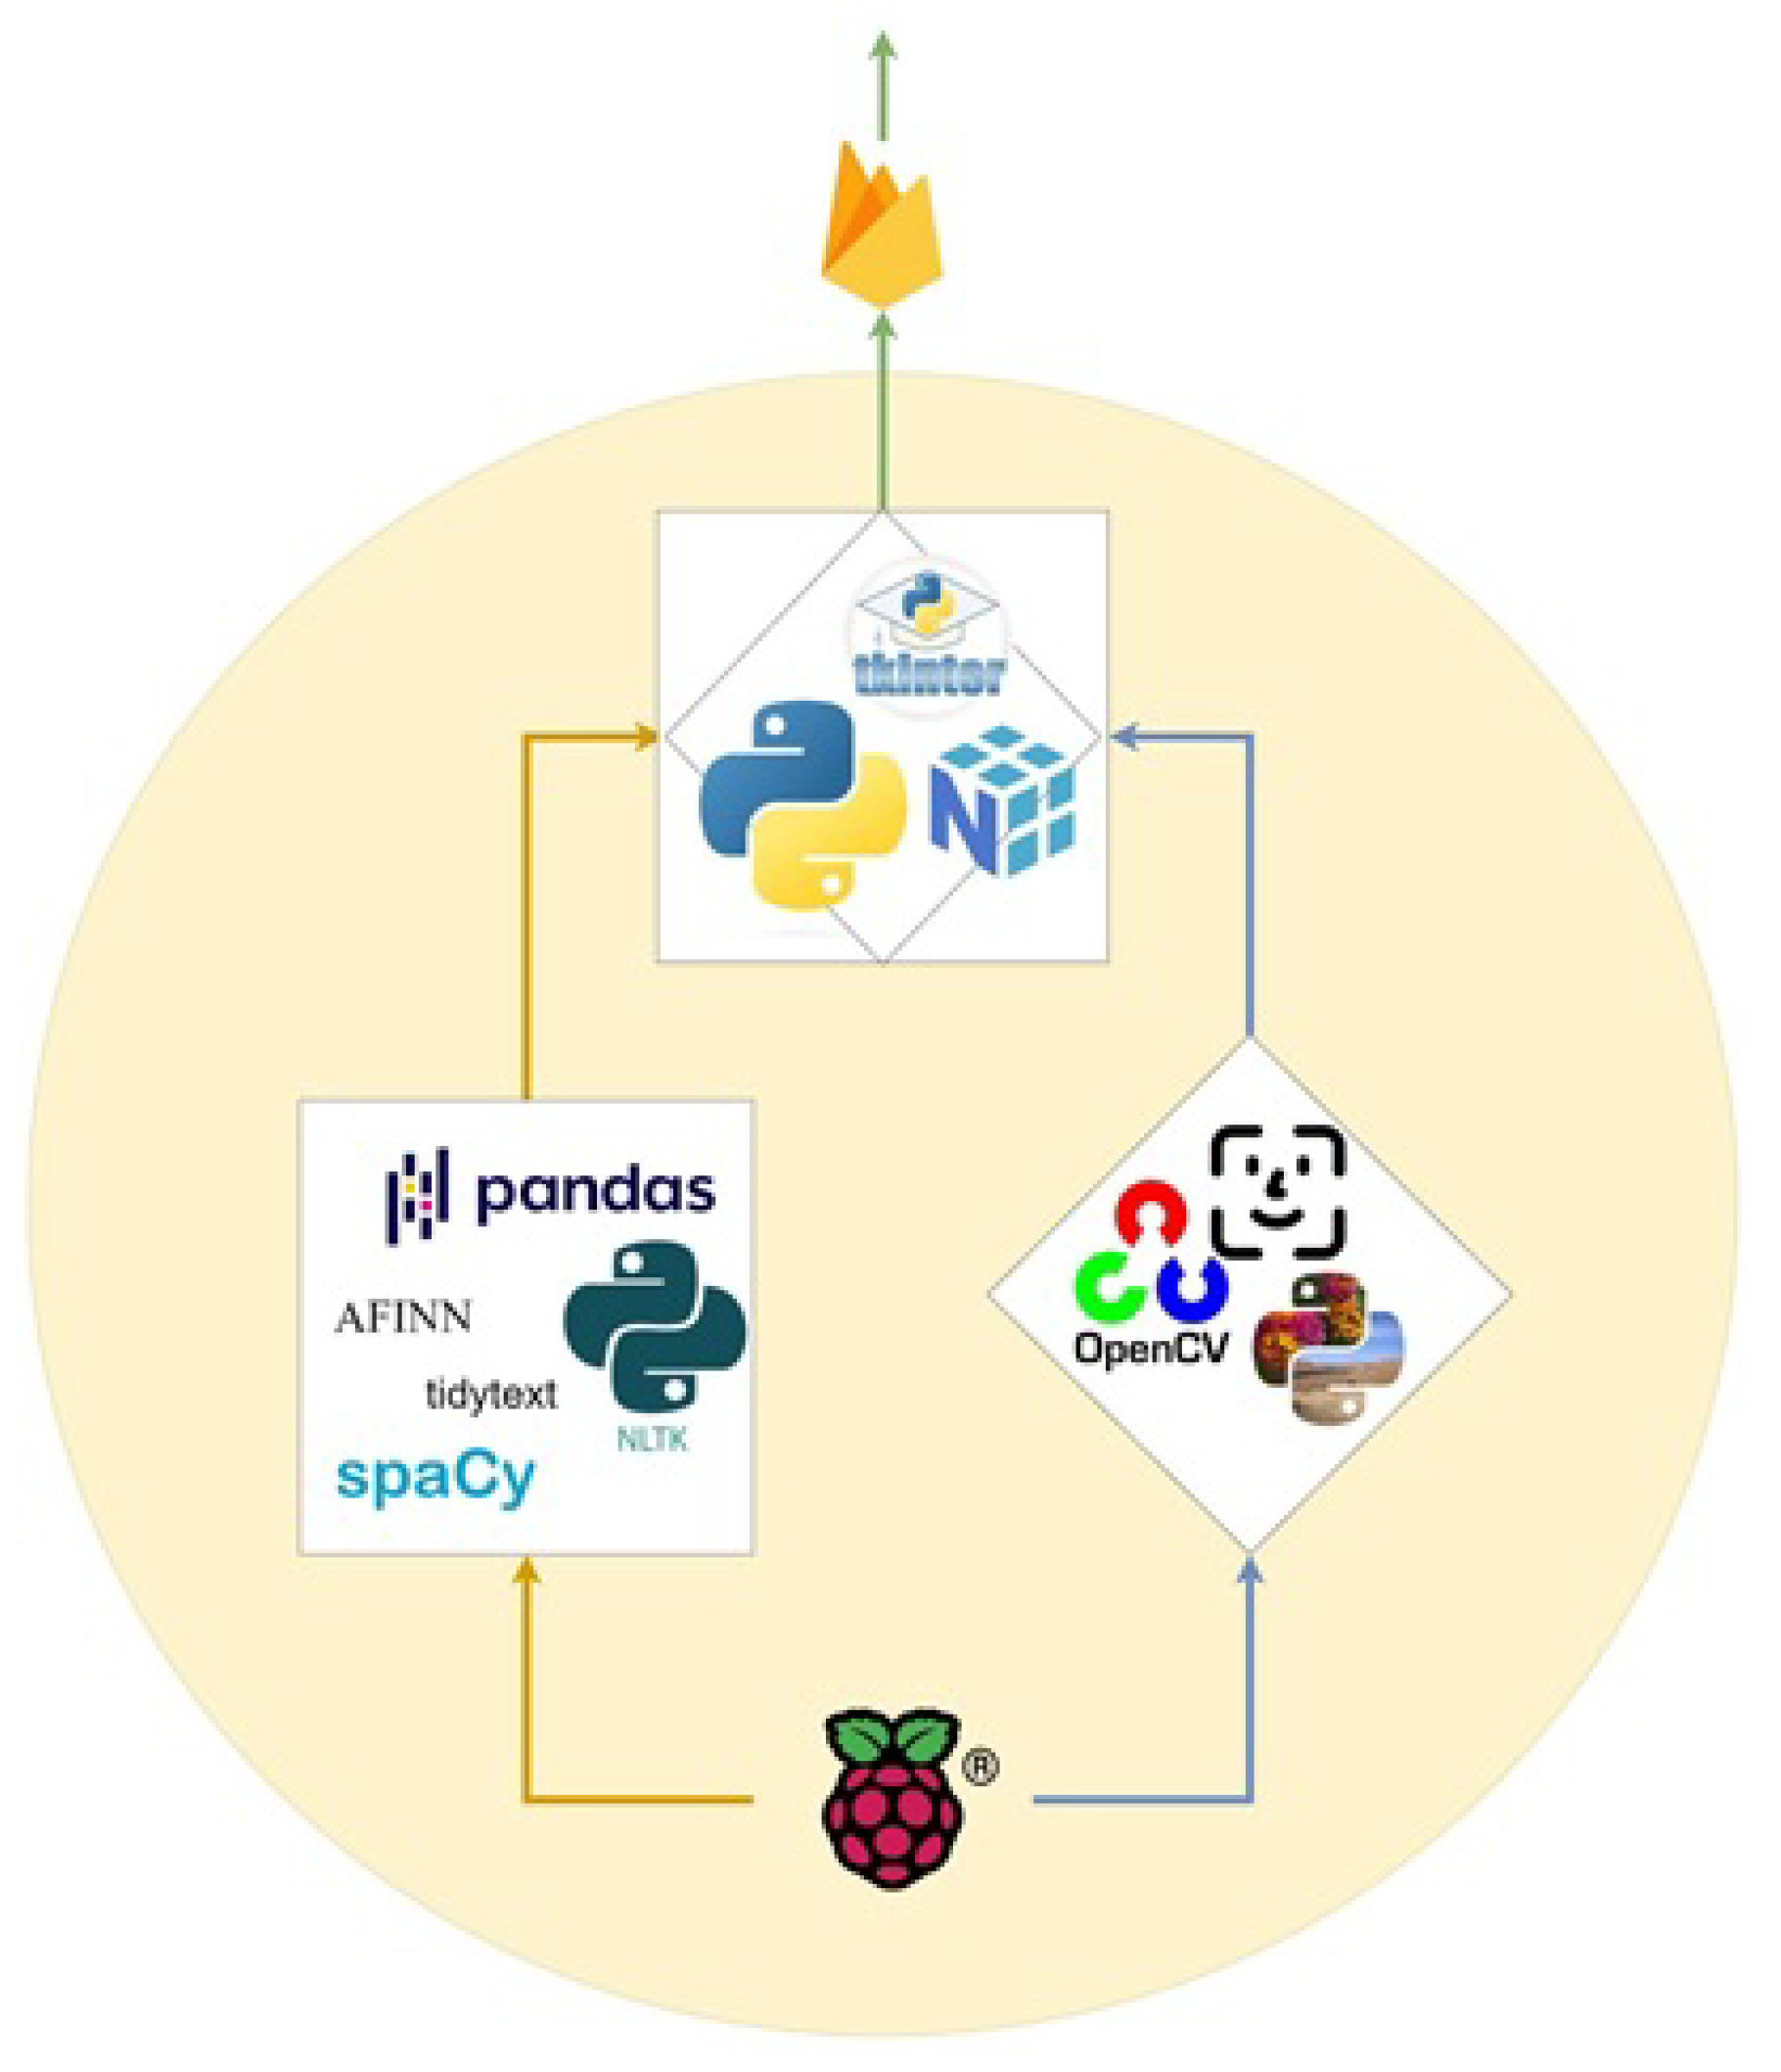
Due to the multifaceted nature of the system, a diagram consisting of all technologies used and their interconnection is proposed in Figure 3.
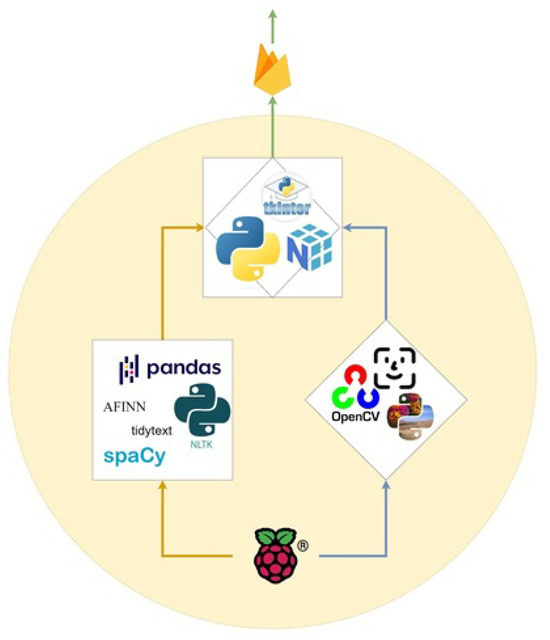
Figure 3.
Diagram of technologies used showing (a) technologies used for sentiment analysis (left); (b) technologies used for facial emotion recognition (right); (c) technologies used for the system’s interface (top of circle); (d) Firebase Realtime Database (top, outside the circle), and (e) Raspberry Pi board (bottom).
3.2. Raspberry Pi and Pi Camera Module Setup
When working within the Raspberry Pi ecosystem, it is of primary importance to appropriately set up the Raspberry Pi board, which is not provided with internal storage due to its restricted size. For this reason, a micro SD card is used to install the operating system on the board. In the case of this system, the card chosen was SanDisk Ultra (SanDisk, Milpitas, CA, USA) with 32GB of memory.
The OS installation process consists of the following steps:
- Inserting the micro SD card in a personal computer and downloading the Raspberry Pi operating system from the Raspberry Pi Foundation webpage;
- Using the Raspberry Pi Imager for the installation process, selecting the desired OS and the storage location from the provided interface;
- Managing the various possible settings, such as enabling SSH connection and WiFi (this was the preferred connection option for the present system);
- Inserting the micro SD card into the board, once the installation process has finished;
- Connecting the Raspberry Pi board to a Raspberry Pi 15W USB-C power supply;
- Connecting the Raspberry Pi board to the network;
- Installing the RealVNC Server on the Raspberry Pi, using the following command in the board’s terminal: ‘sudo apt-get install realvnc-vnc-server’;
- Obtaining the IP address of the Raspberry Pi board either by using the following terminal command: ‘hostname -I’, or by using the Fing mobile application;
- Installing RealVNC on the personal computer and downloading the appropriate version of RealVNC for your specific operating system;
- Launching RealVNC Viewer and entering the Raspberry Pi’s IP address in the “VNC Server” field;
- Manually initializing the connection and inserting the proper board username and password in order to finally launch and display the Raspberry Pi’s desktop on the personal computer.
The connection and setup process of the Pi Camera module may be summarized by the following steps:
- Physically connecting the camera module on the Raspberry Pi 4 board, using the small connector of the ribbon cable. The connector is specifically designed to be liftable in order to let the ribbon cable enter the port and to block it in that position by pressing the plastic clip back into its place;
- Enabling the camera interface by typing into the terminal the ‘sudo raspi-config’ command and manually selecting in the displayed menu: “Interfacing Options”, “Camera”, “Yes”. It will be necessary to also reboot the board in order to save the changes made;
- Verifying that the camera module is detected by running in the terminal the ‘vcgencmd get_camera’ command and assuring that the output is “supported = 1” and “detected = 1”
- Testing the camera module by running ‘raspistill -o imagefilename.jpg’ and checking for the file of the picture taken.
3.3. Text Analysis
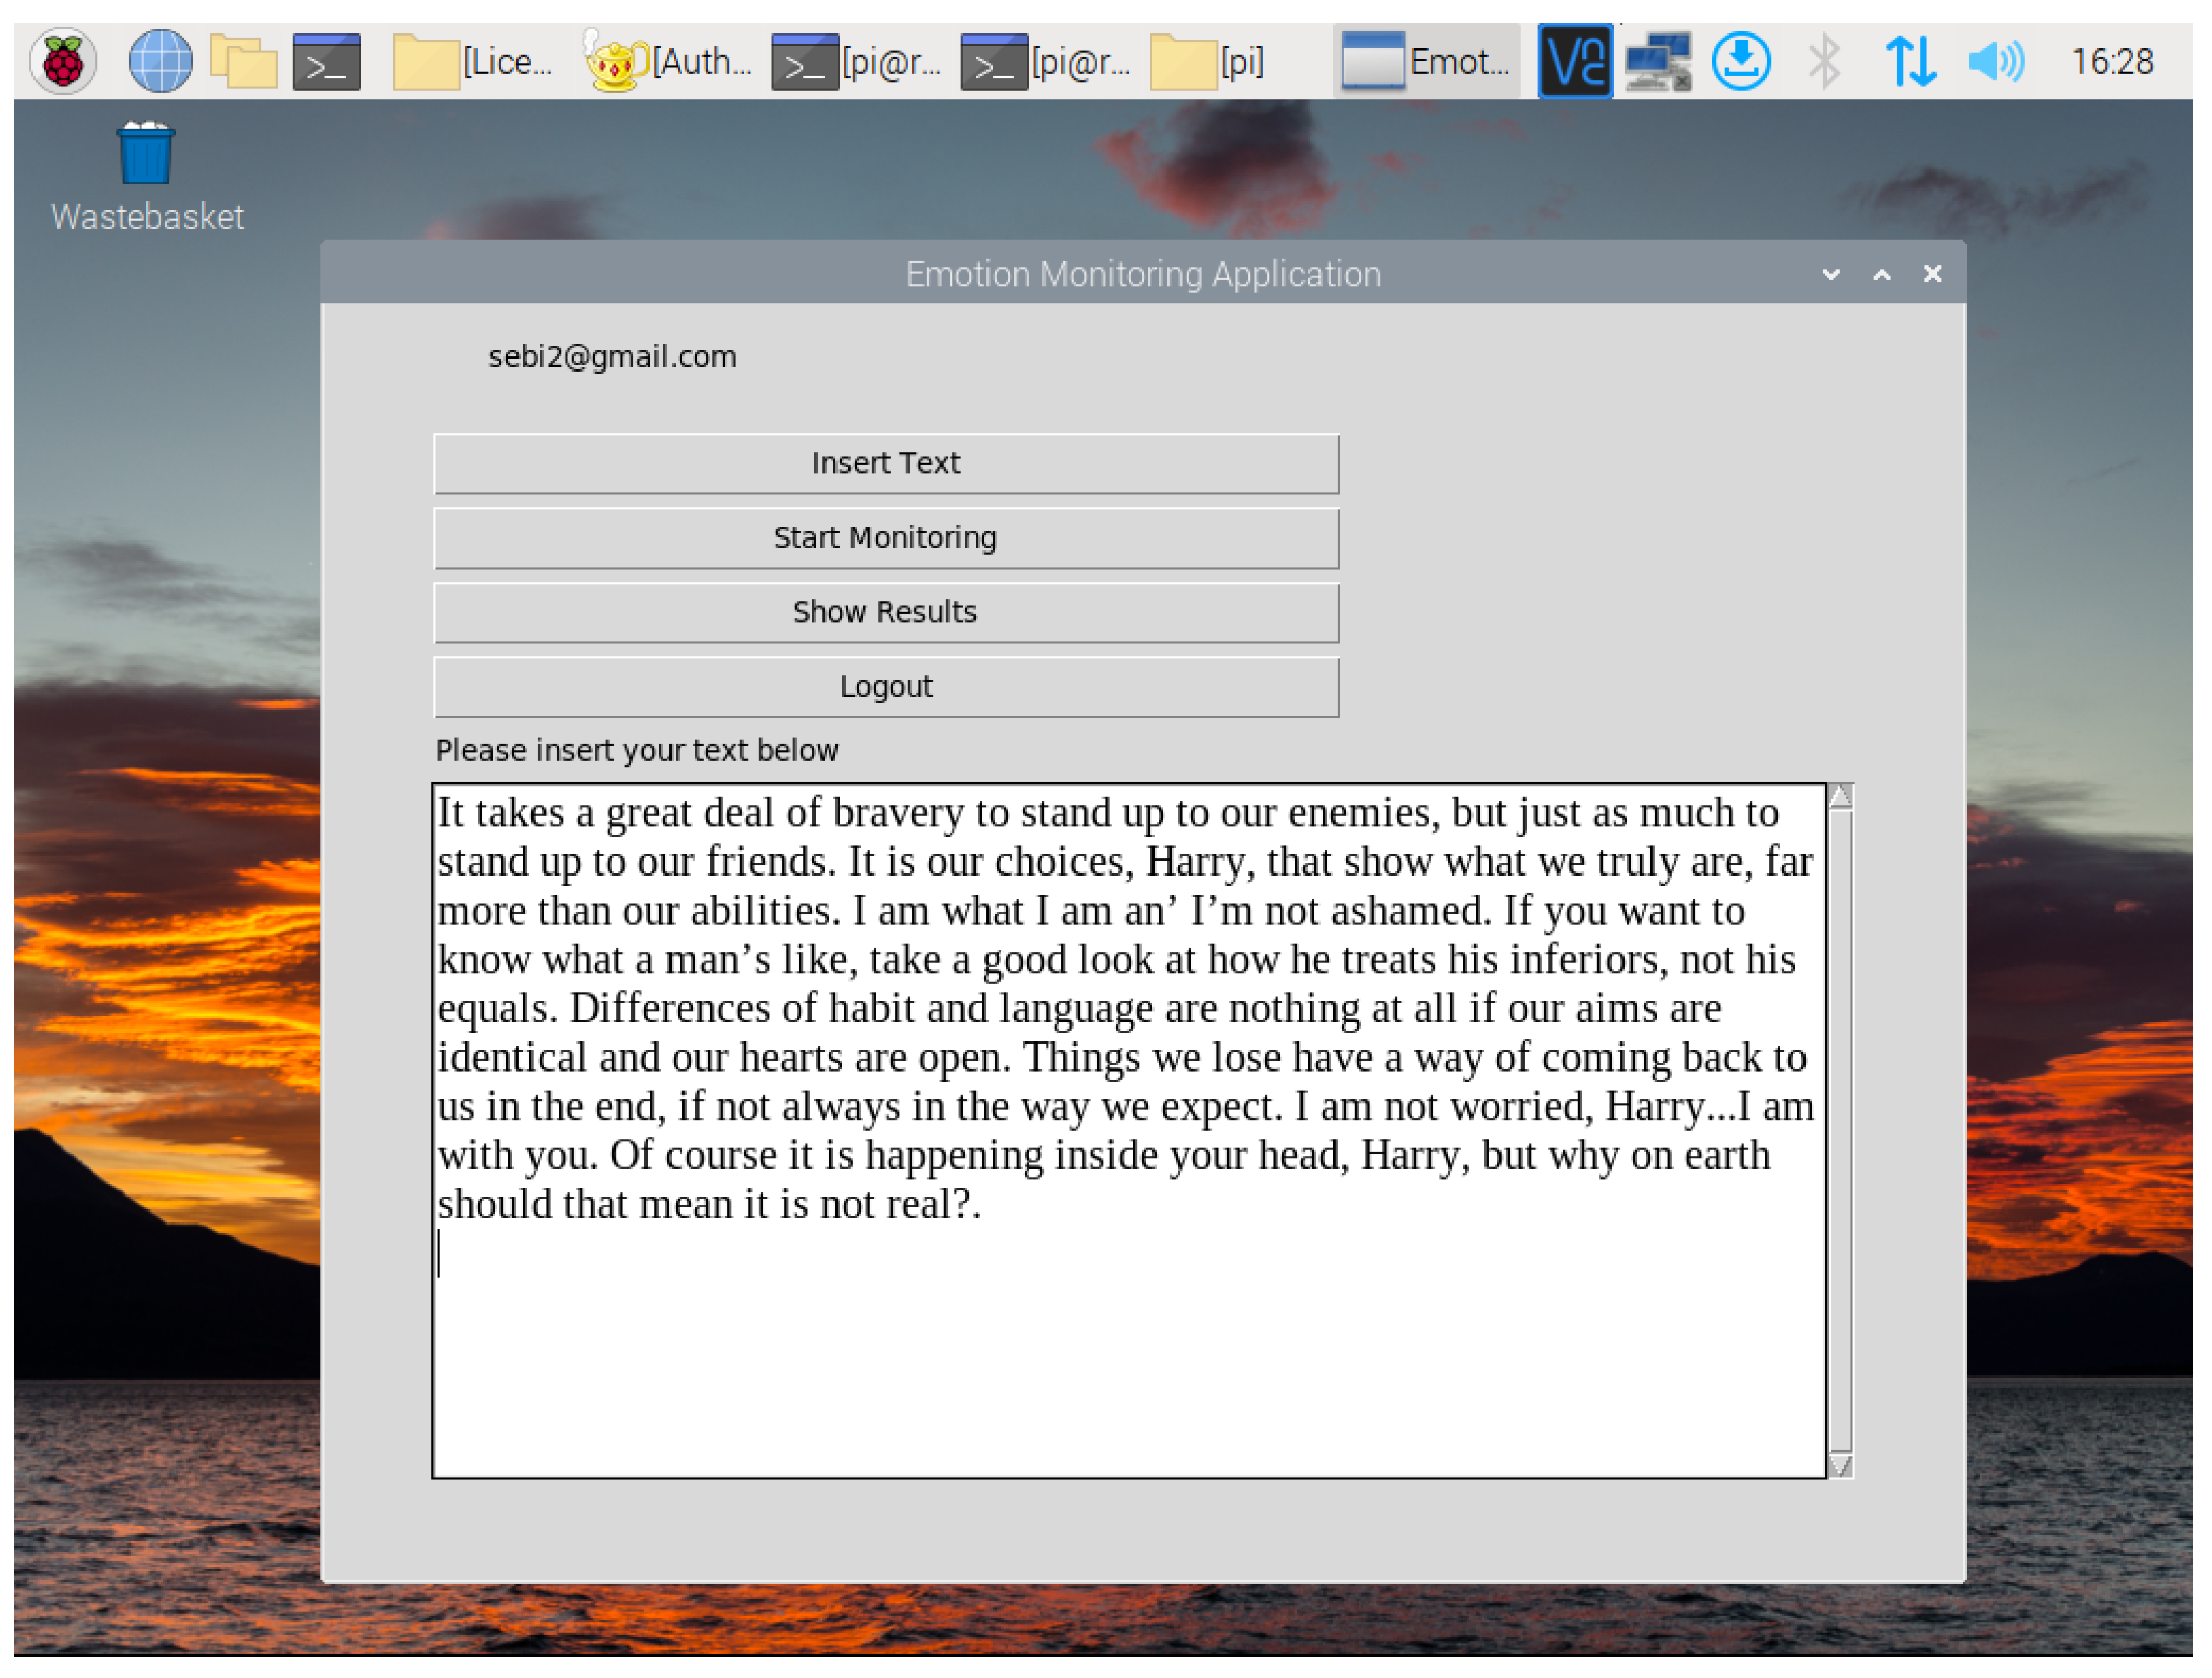
Undoubtedly, a major role in this system is played by the analysis performed on the entered text (Figure 4). The system’s thesis implies the need for such an analysis in order to have a model comparable to the one built on facial microexpressions. As such, the text analysis performed is not only ‘the other half’ of this dual-nature system but the basis on which there will be the possibility of building comparable models and thus making the desired observations regarding the gathered results. All text processing is performed entirely in the sentimentAnalysis() function, which ended with the five most relevant analysis parameters: ‘mostusedwords’, ‘positivityscoreoftext’, ‘mostpositivewords’, ‘mostnegativewords’, and ‘relevantverbs’.
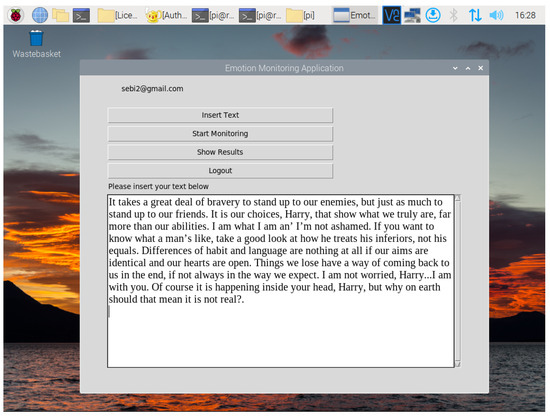
Figure 4.
System window for inserting the desired text.
3.3.1. Preparing the Text for the Analysis
In order to perform the text sentiment analysis, it is necessary first to properly organize the input text. The text is retrieved entirely from the ‘textboxinserttext’ widget, assigned to the ‘inputtextbox’ variable. It is highly important to emphasize the fact that the system offers the user the possibility of entering any desired text and performs the text analysis in real time, without the need for specific prior preparation.
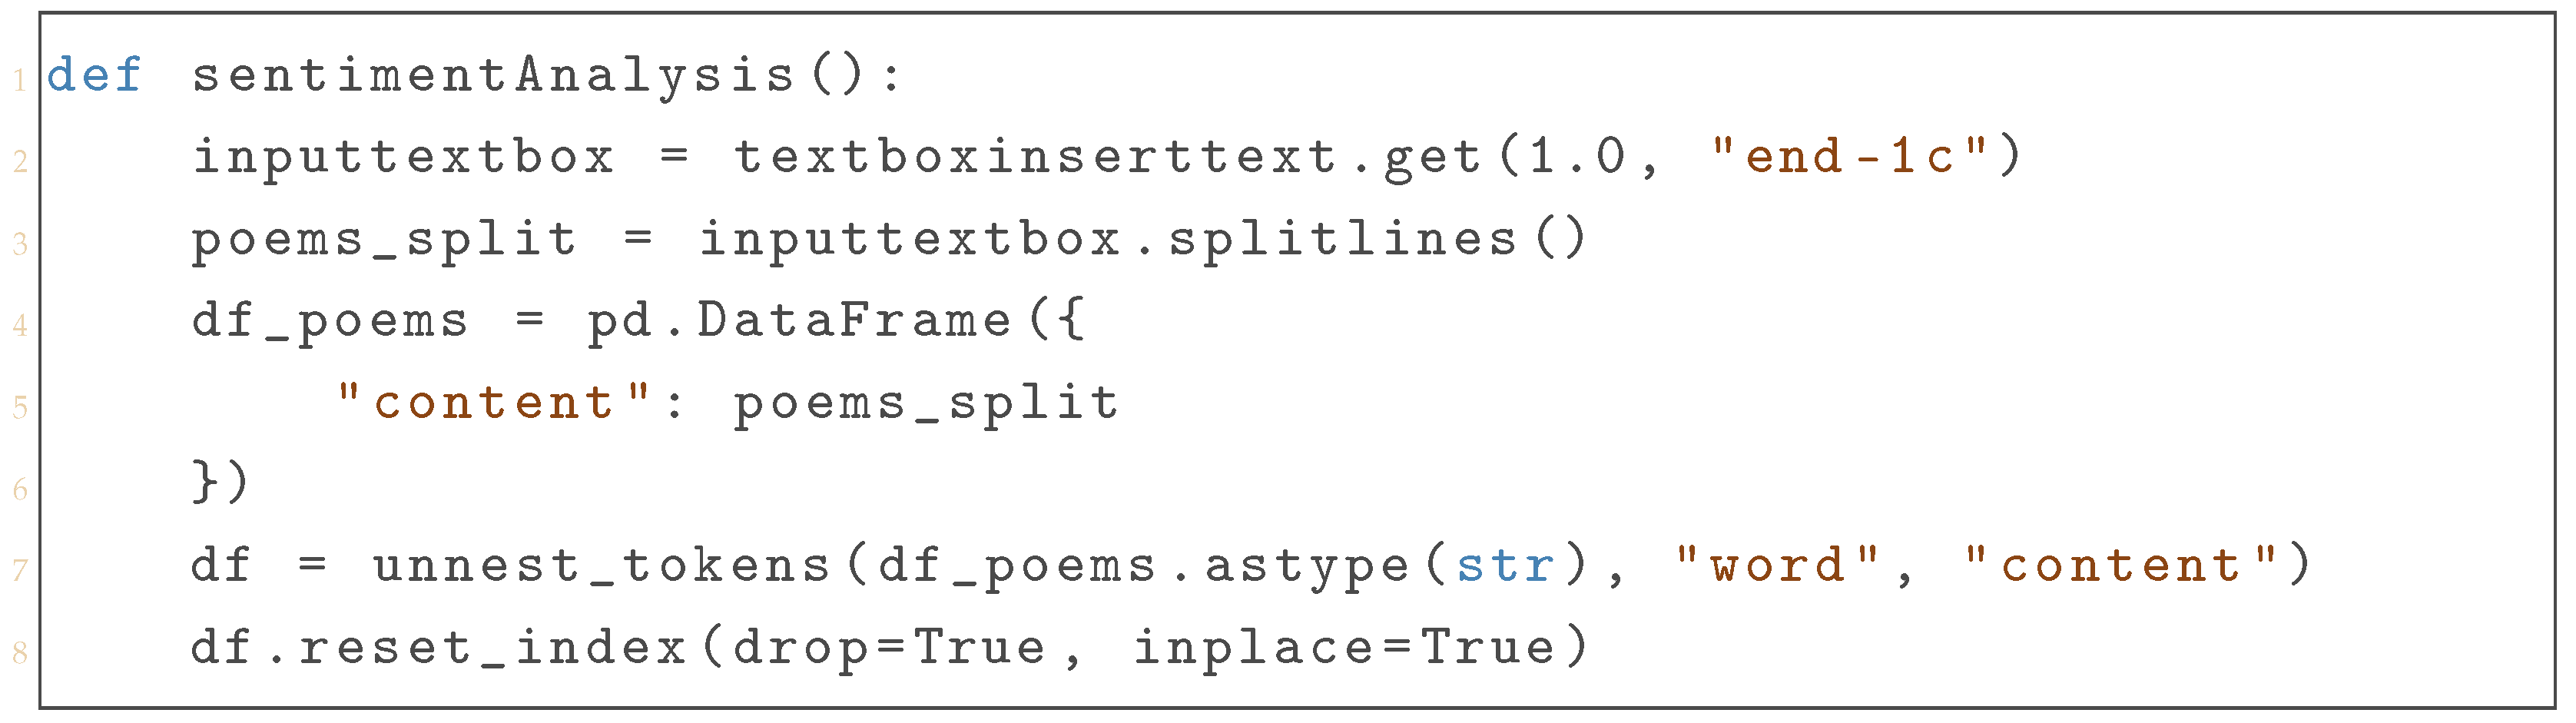
Using the splitlines() method, each entered line of text becomes a unique element in the poems_split list, as shown in Listing 1. After creating a one-column pandas dataframe named ‘df_poems’, the text, tokenized in words, is placed in the word column and the indexes of the elements of the data frame are reset.
| Listing 1. Sentiment Analysis Function: Tokenizing and Preparing Text Data. |
 |
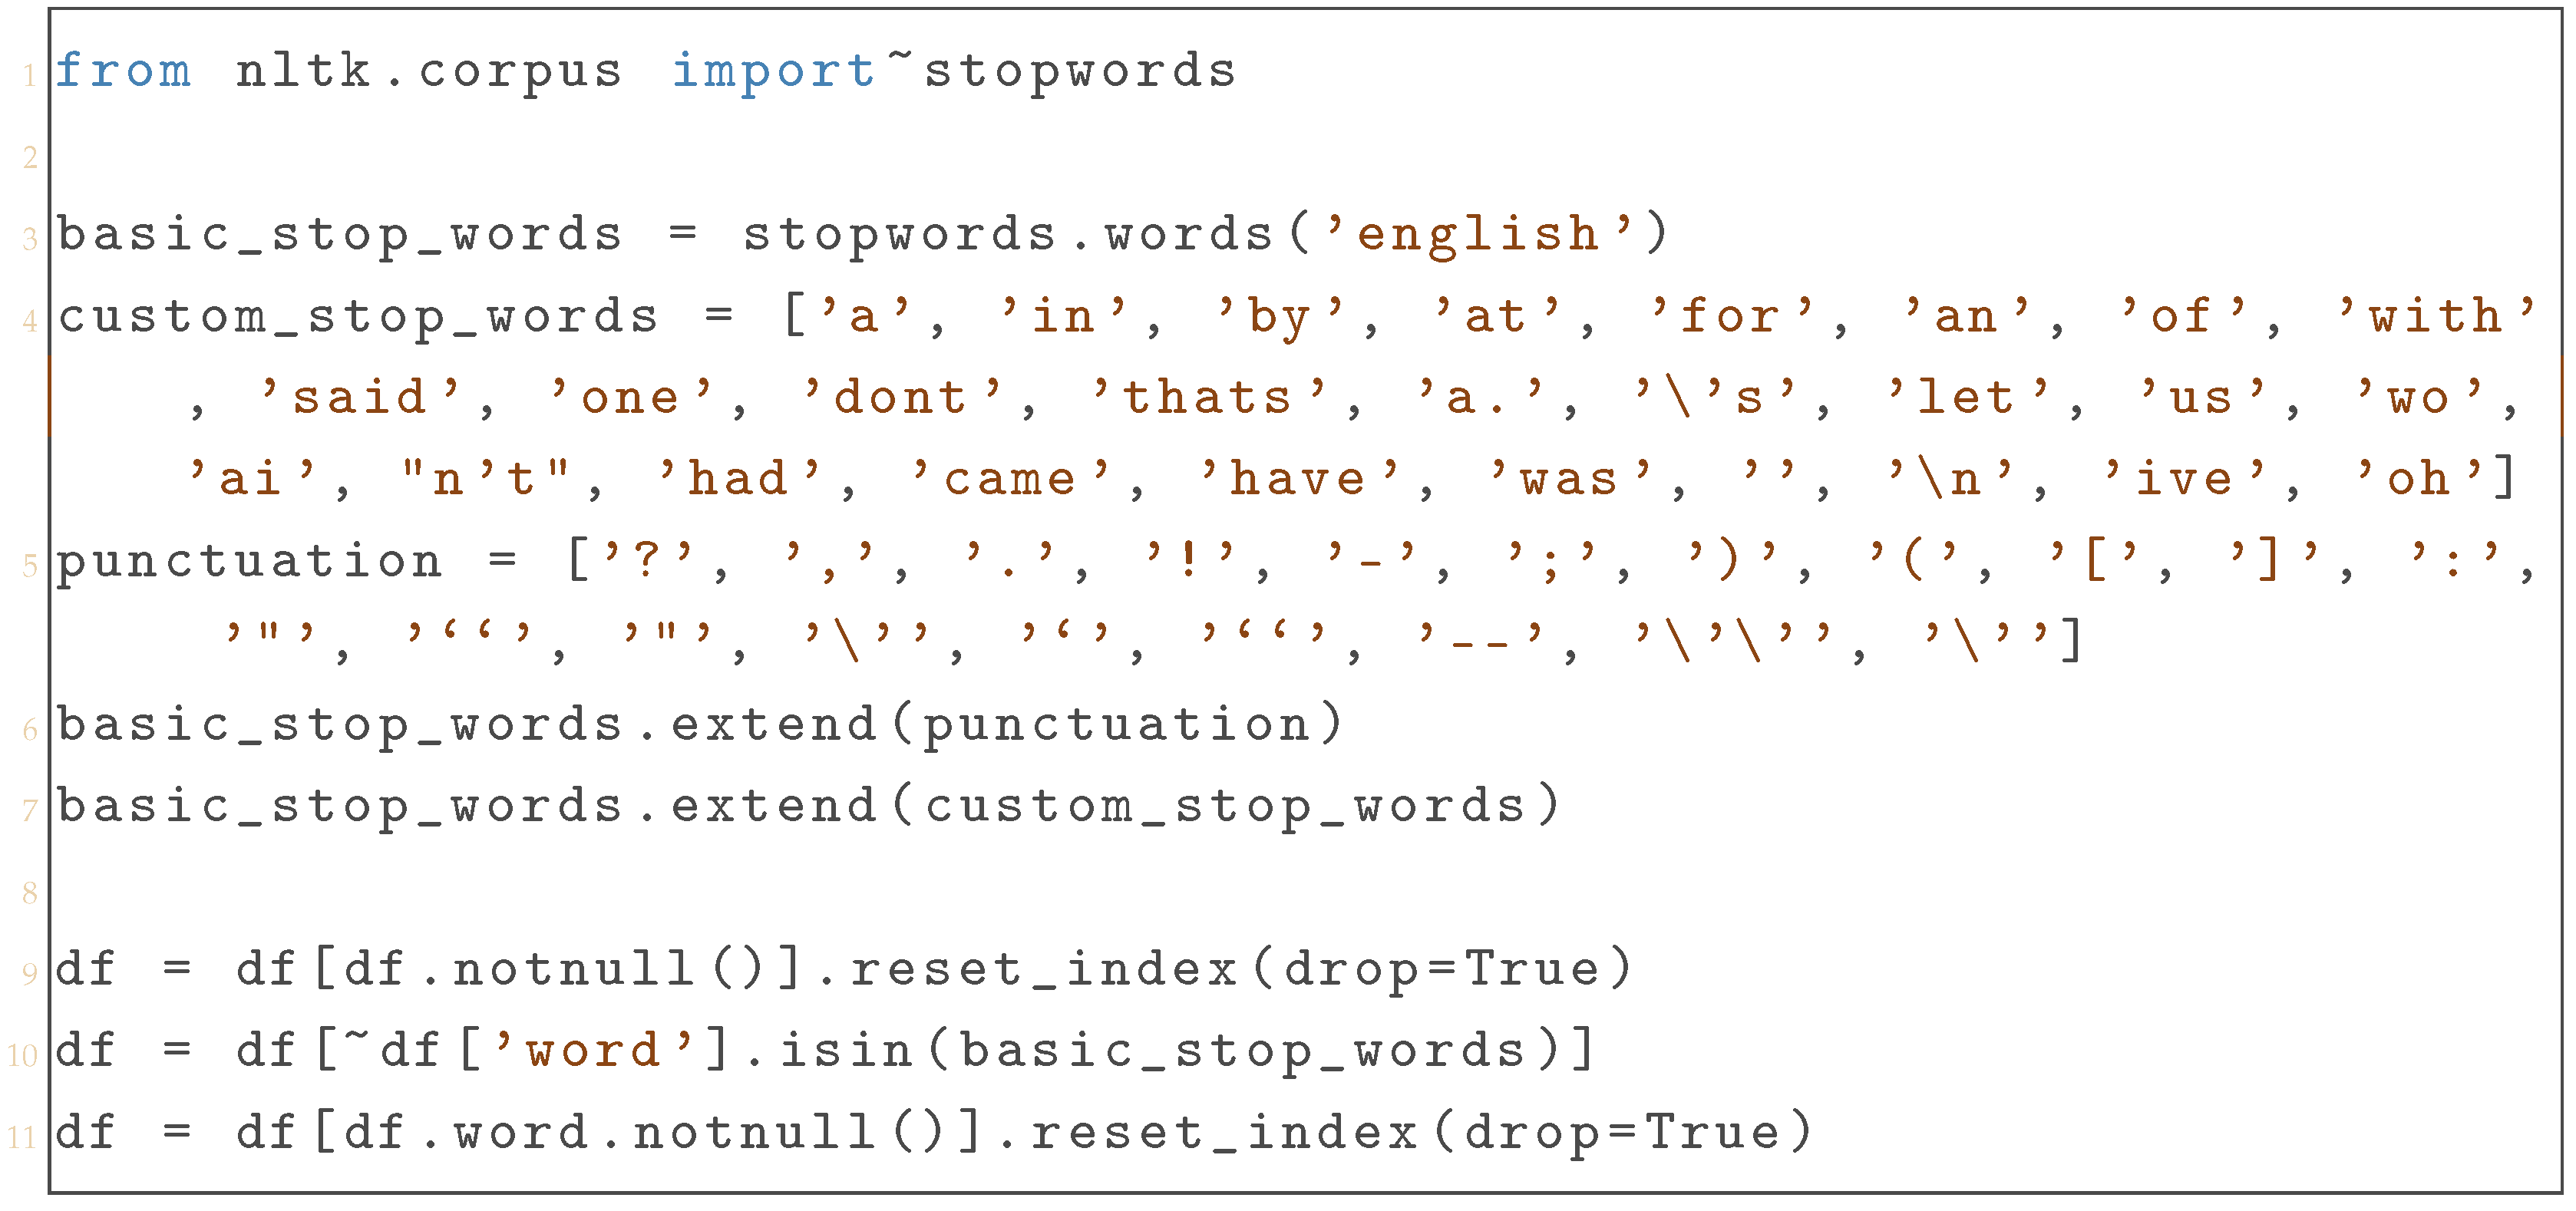
3.3.2. Filtering the Text
In order to facilitate the analysis of the text, it is of great utility to filter it from all words or punctuation marks that may be considered superfluous for the purpose of this text study. The NLTK library already offers an abundant list of such words of neutral sentimental value, popularly called ‘stopwords’, although developers have the possibility of expanding this list with customizable ones. As is observable in Listing 2, the expansion of the basic_stop_words list was made utilizing the extend() function to append custom_stop_words and the punctuation lists. Such techniques may be particularly helpful in the possible future development of this system in the case of data adjustments based on a large number of test results to eliminate words considered not important for analysis. Text filtering plays a central role in optimizing text sentiment analysis times and making the entire system more efficient.
| Listing 2. Filtering Words in Dataframe. |
 |
3.3.3. Counting Different Words’ Usage in the Text
The first data to be collected from text analysis that is deemed valuable in the context of the system is the number of apparitions of each unique word. This is due to the possible correlation between facial emotional response and the most used words in a specific text. Word counting is performed by the count function presented in Listing 3 in the word column of the df dataframe and stored in the result variable, only the first 22 entries being taken into account.
| Listing 3. Counting and Extracting Most Frequently Used Words. |
 |
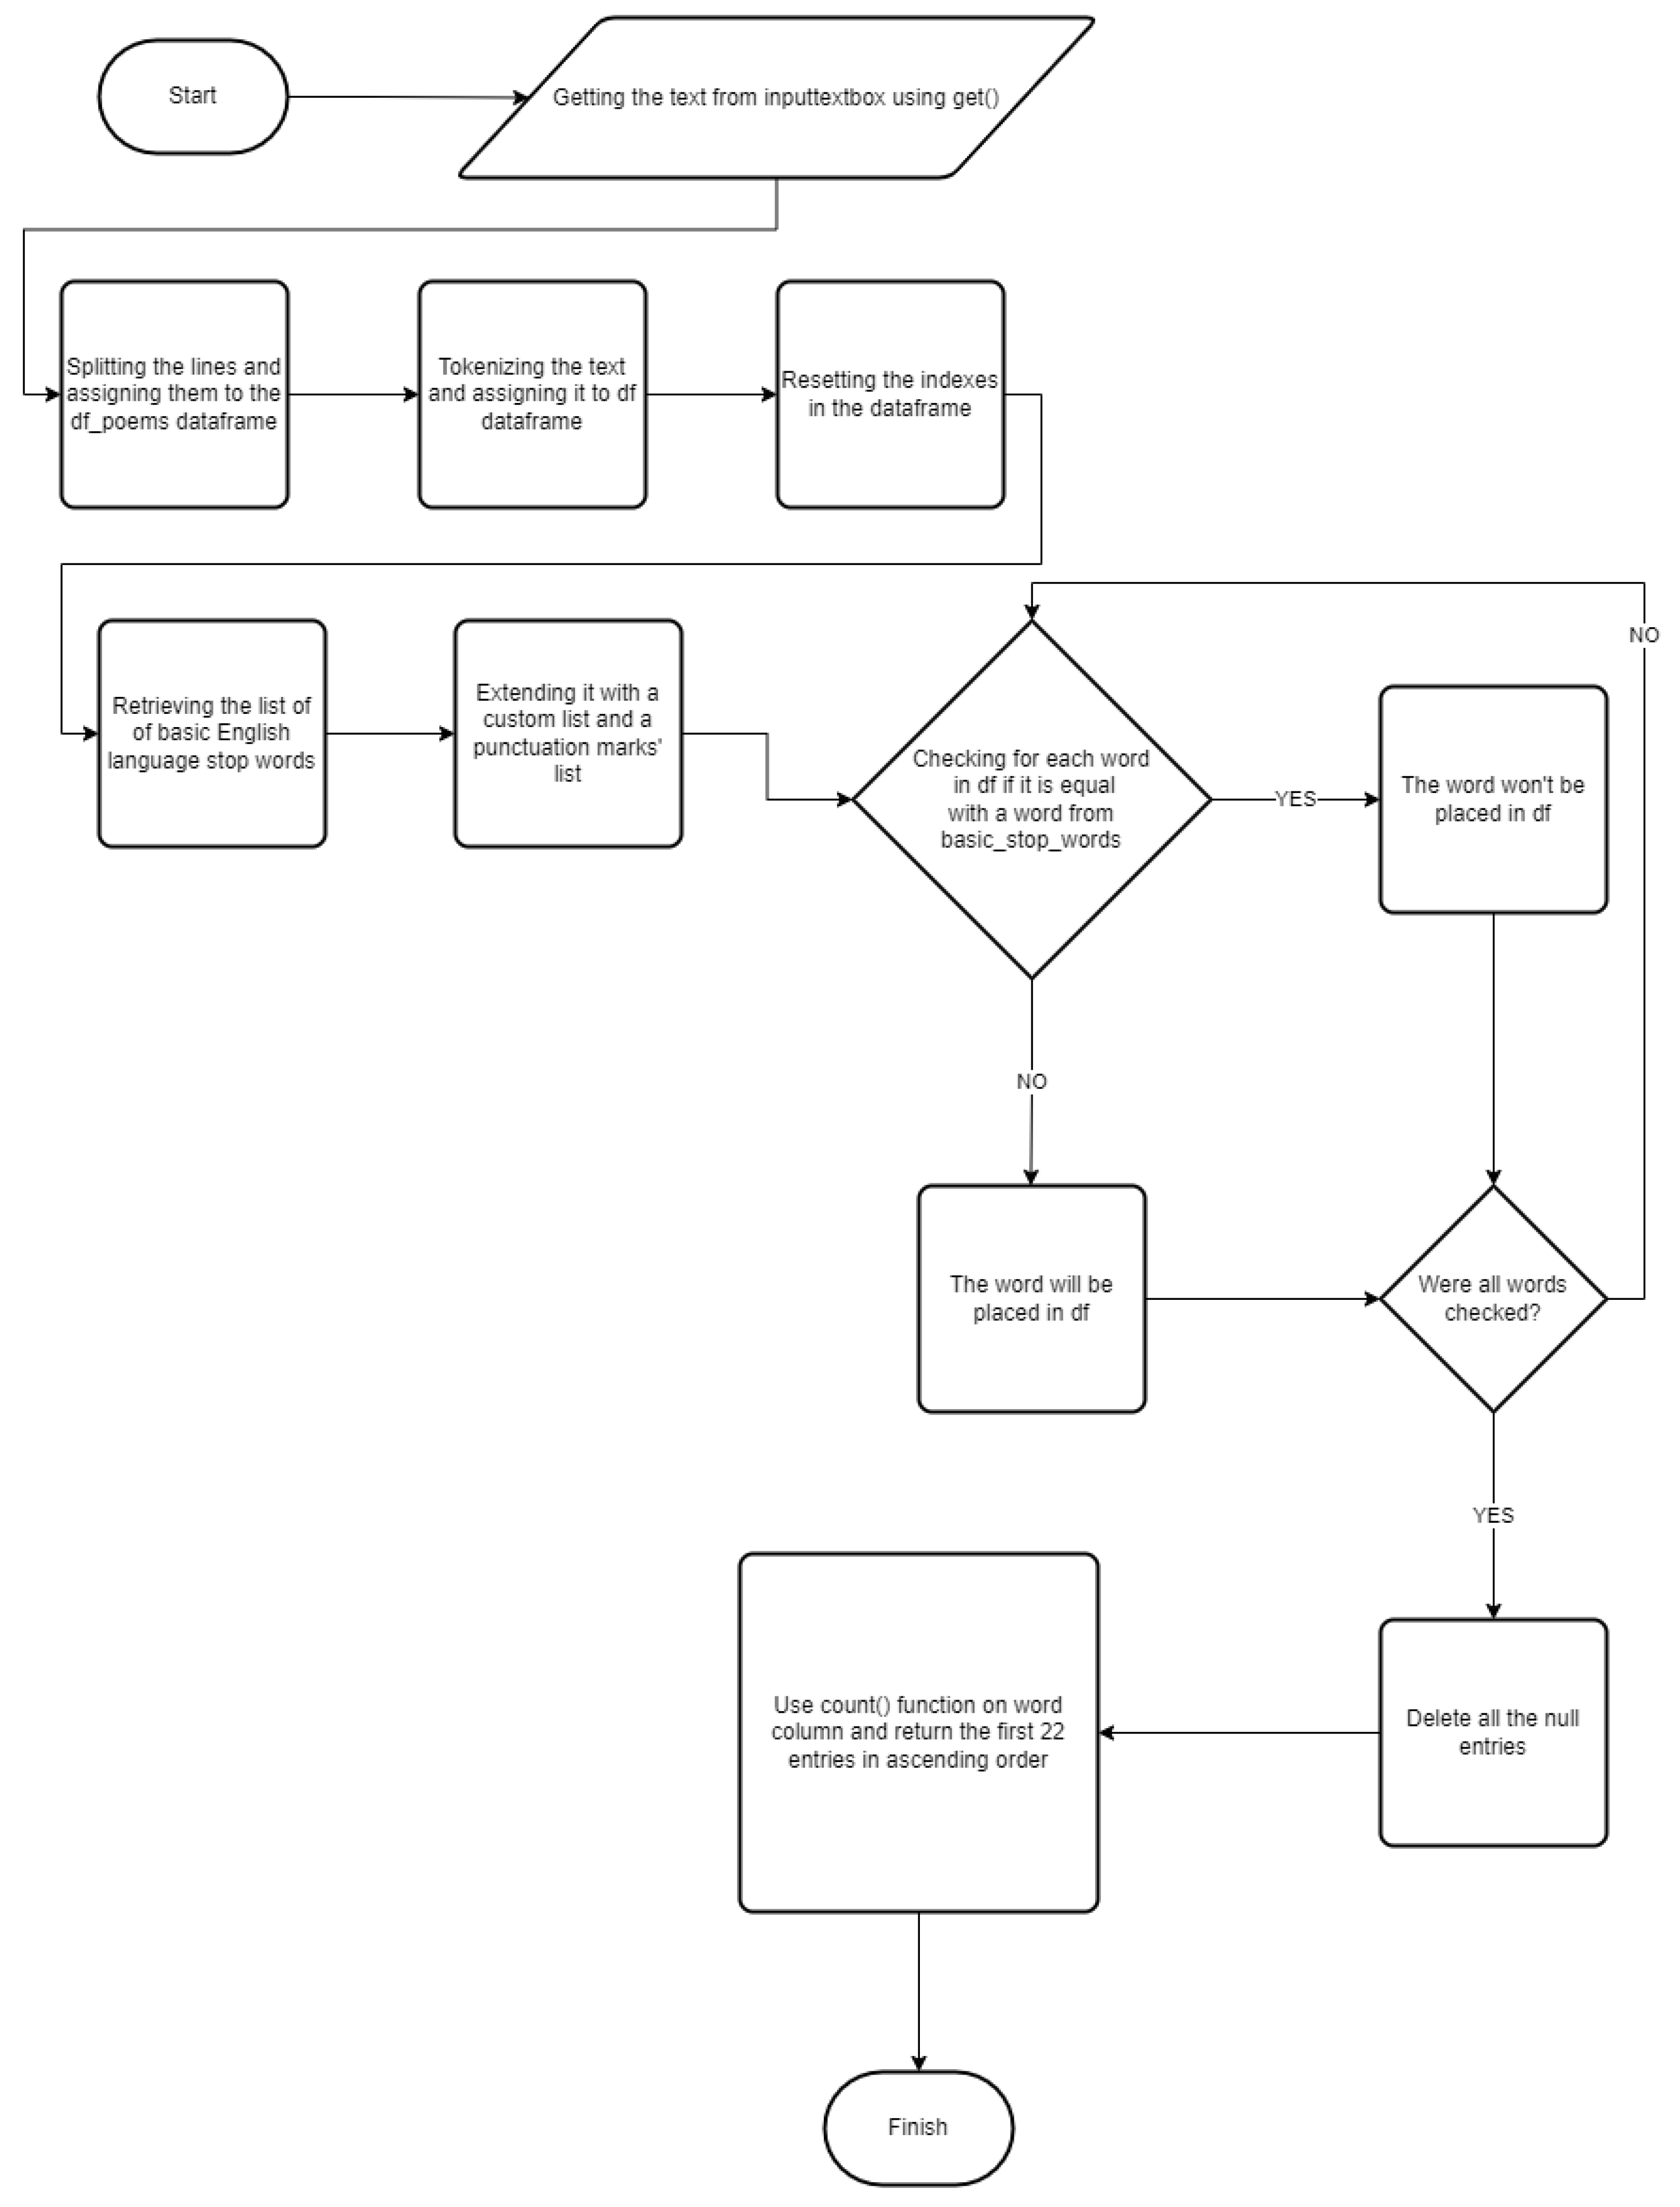
A detailed flow chart that shows the process of counting unique words in any introduced text is presented in Figure 5.
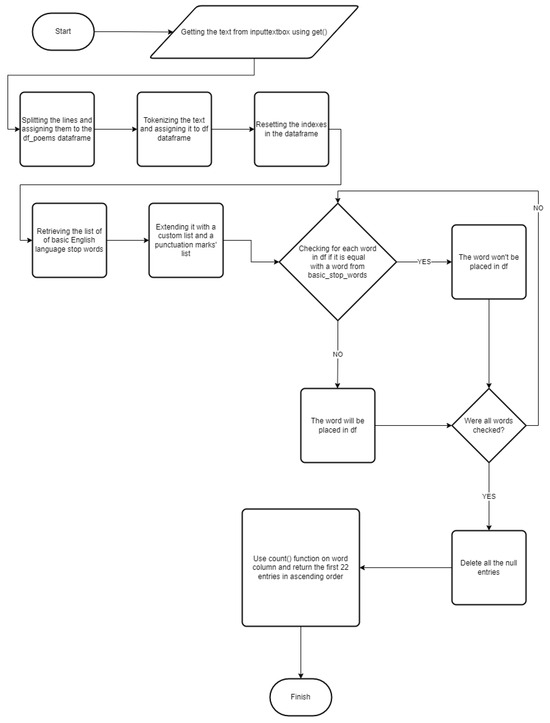
Figure 5.
Flowchart for counting words.
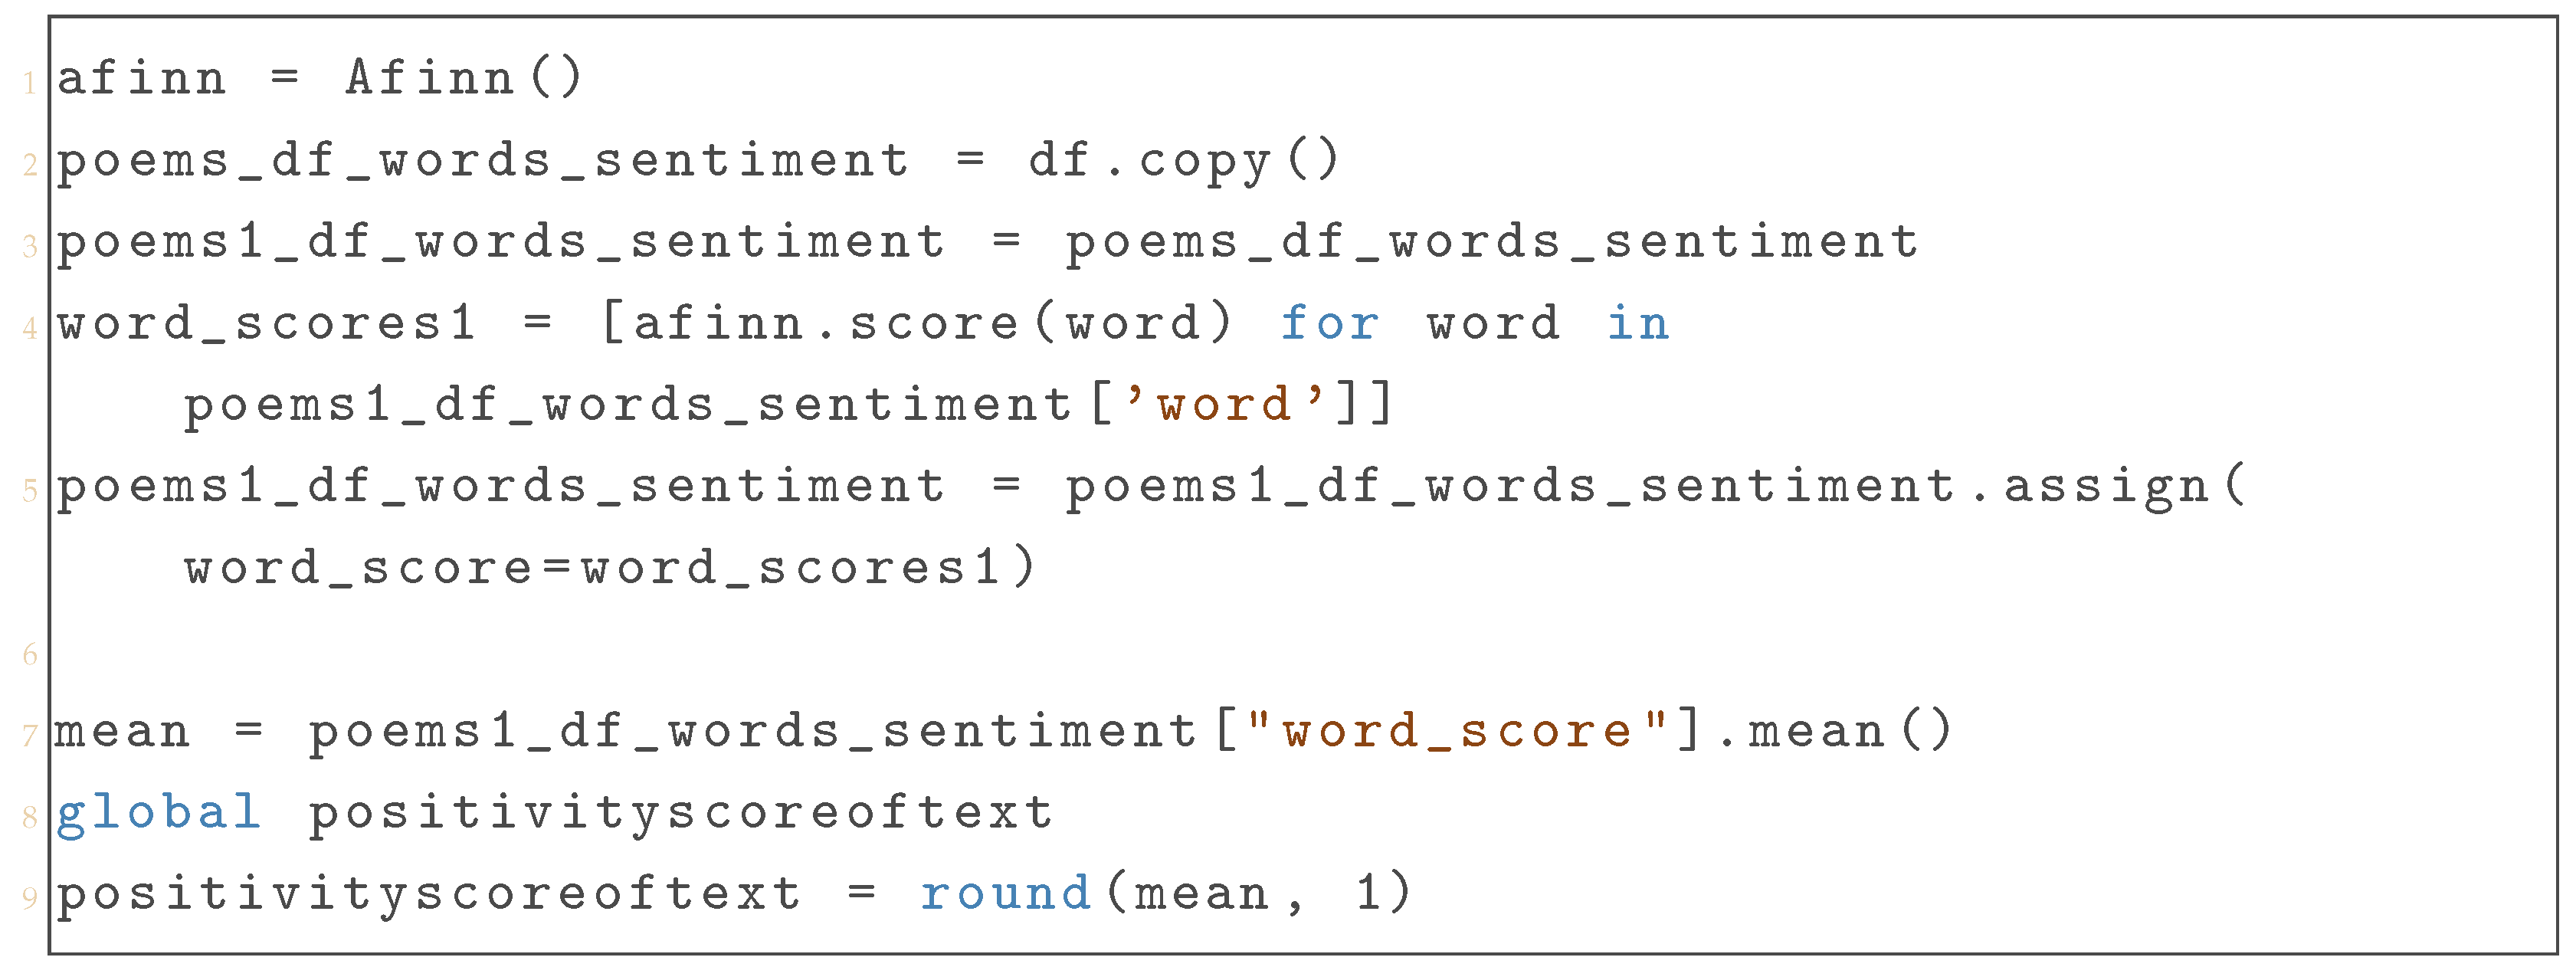
3.4. Sentiment Analysis of the Text
The main purpose of the system revolves around sentiment analysis due to the need to study the emotional impact of a text whose sentimental Afinn score is well known, thus making the portion of the system presented in Listing 4 particularly important. After initializing an Afinn class instance to perform the analysis, the df dataframe was copied into poems_df_words_sentiment in order to avoid changing the original dataframe, enhancing the overall computer system reliability in the process. Using the score() method, the Afinn score was calculated for every word in the word column, which was then stored in a new word_score column.
Finally, the total estimated Afinn score was found by computing the arithmetic mean of all the scores of the words and storing it in the mean variable. The value of the rounded mean was also assigned to positivityscoreoftext to be subsequently returned and passed to the showResults method.
| Listing 4. Calculating Sentiment Scores and Mean Positivity of Text. |
 |
Impactful information in the study of the emotional effect of a sentiment-analyzed text may surely be represented by the words with the maximum or with the minimum Afinn score from the entered text.
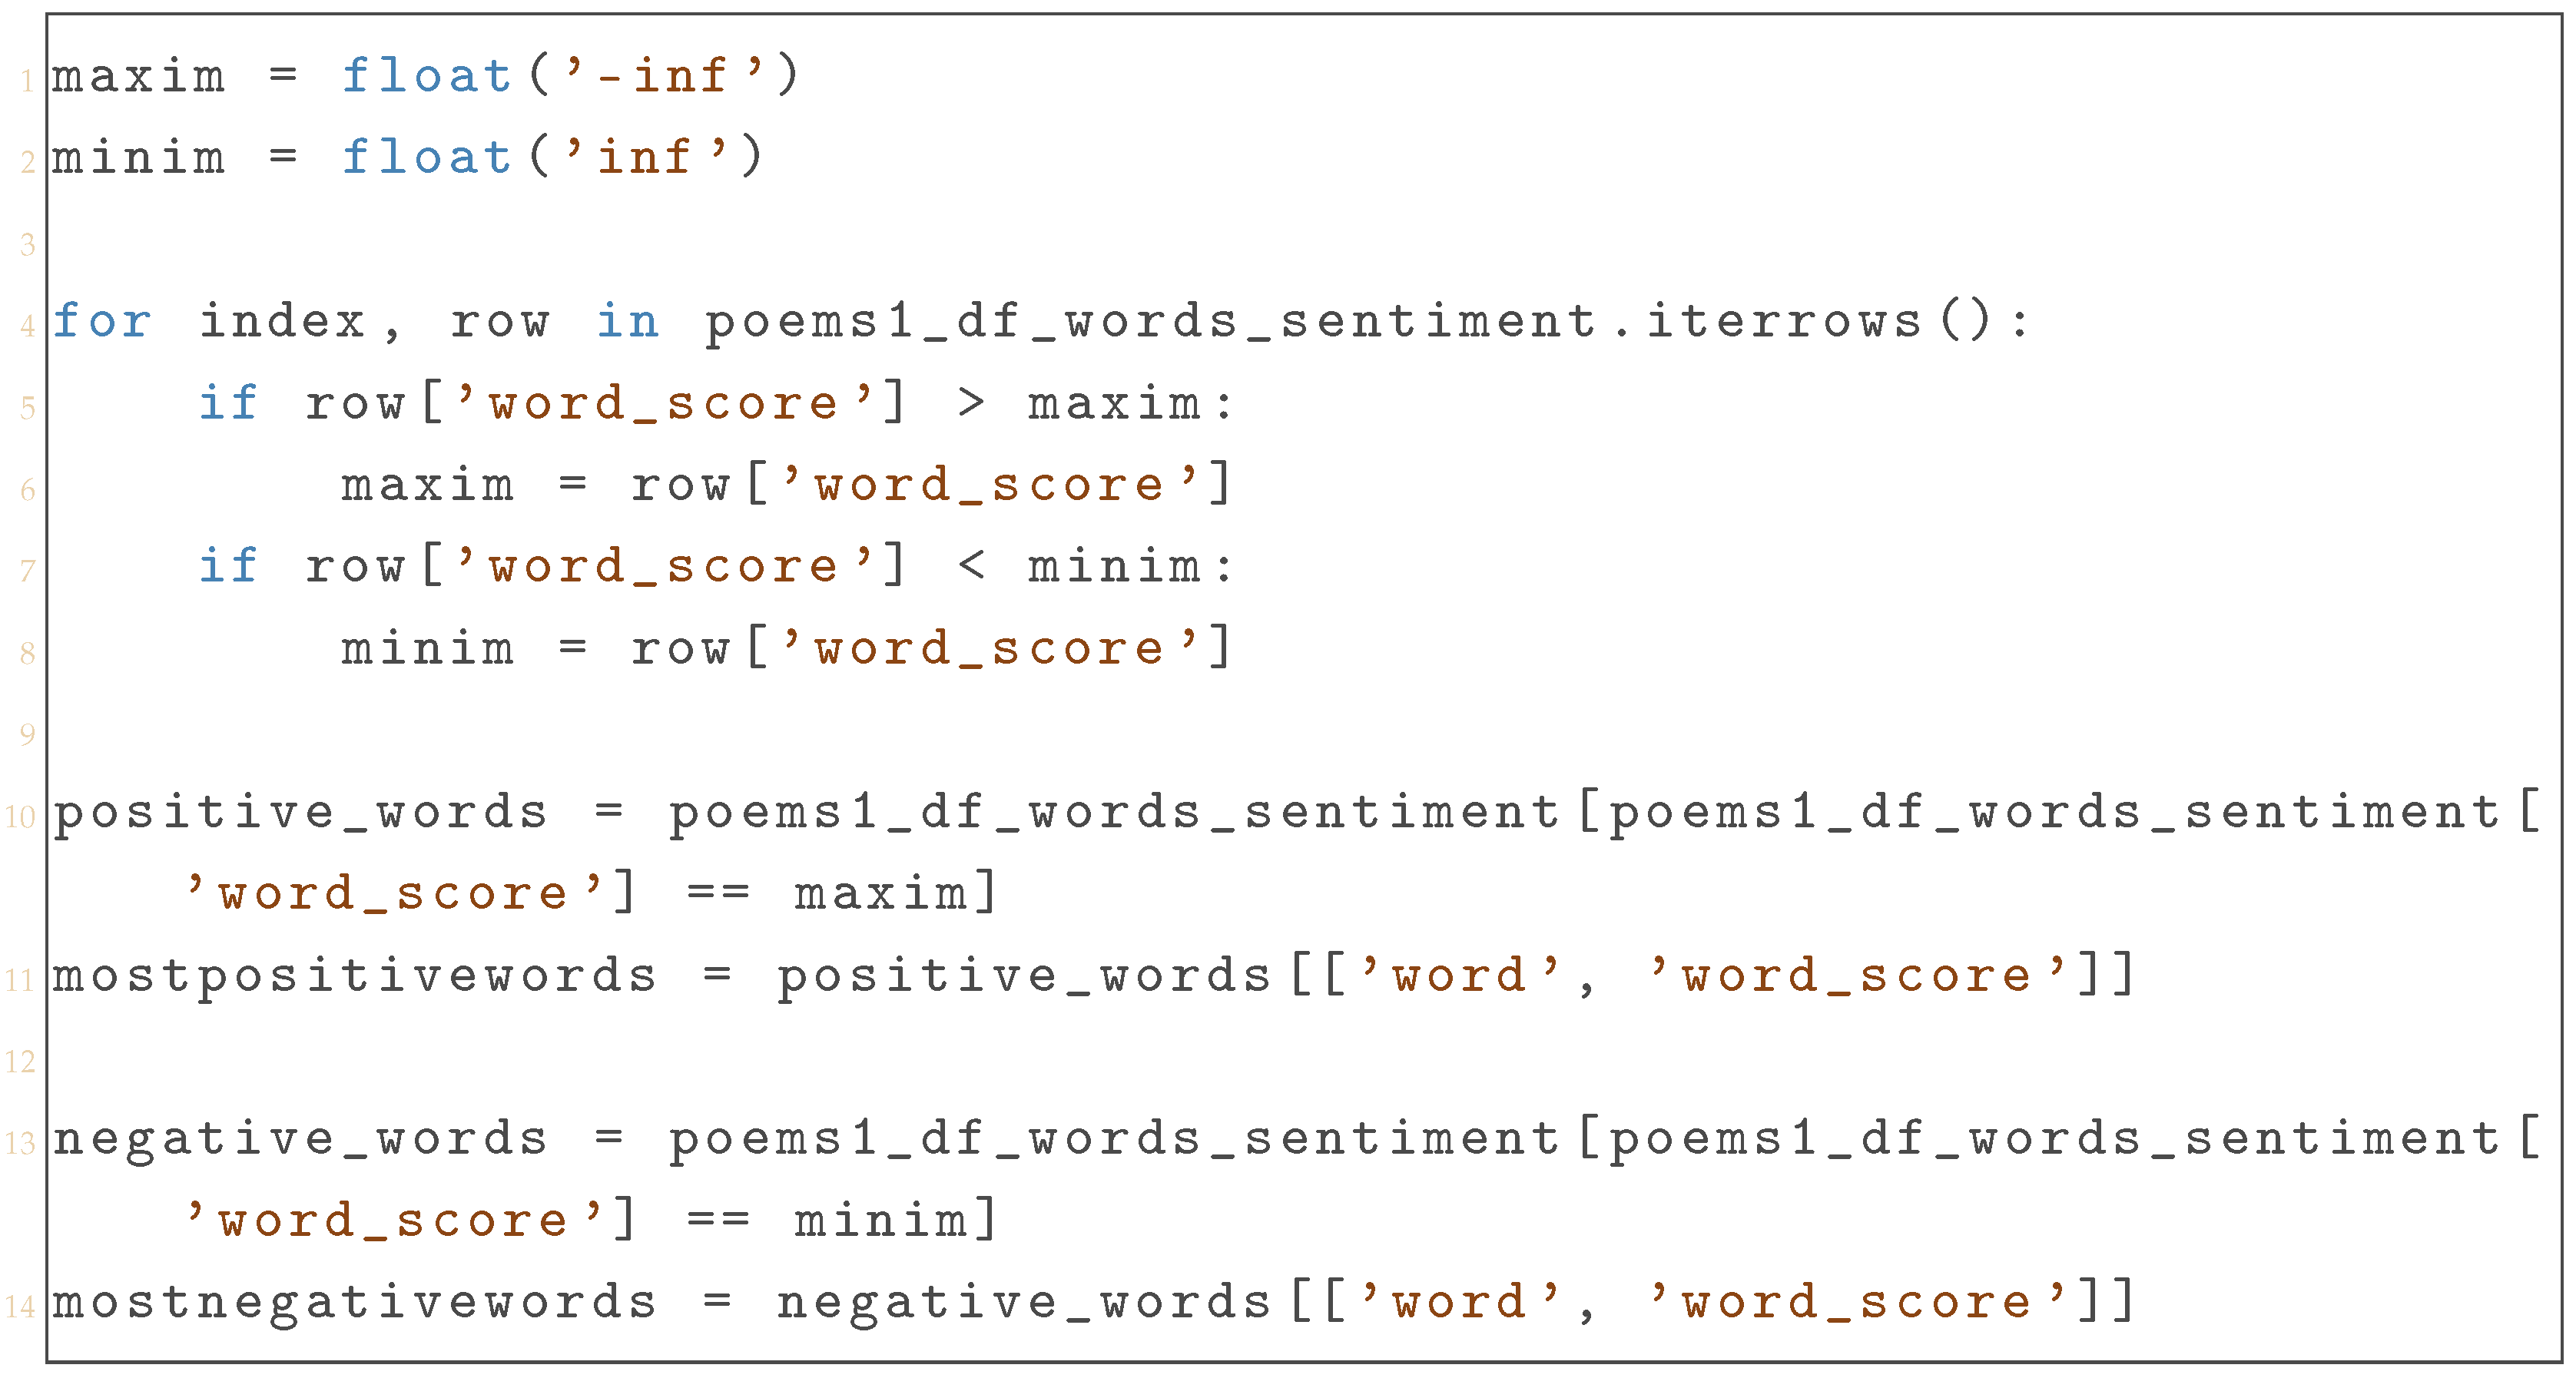
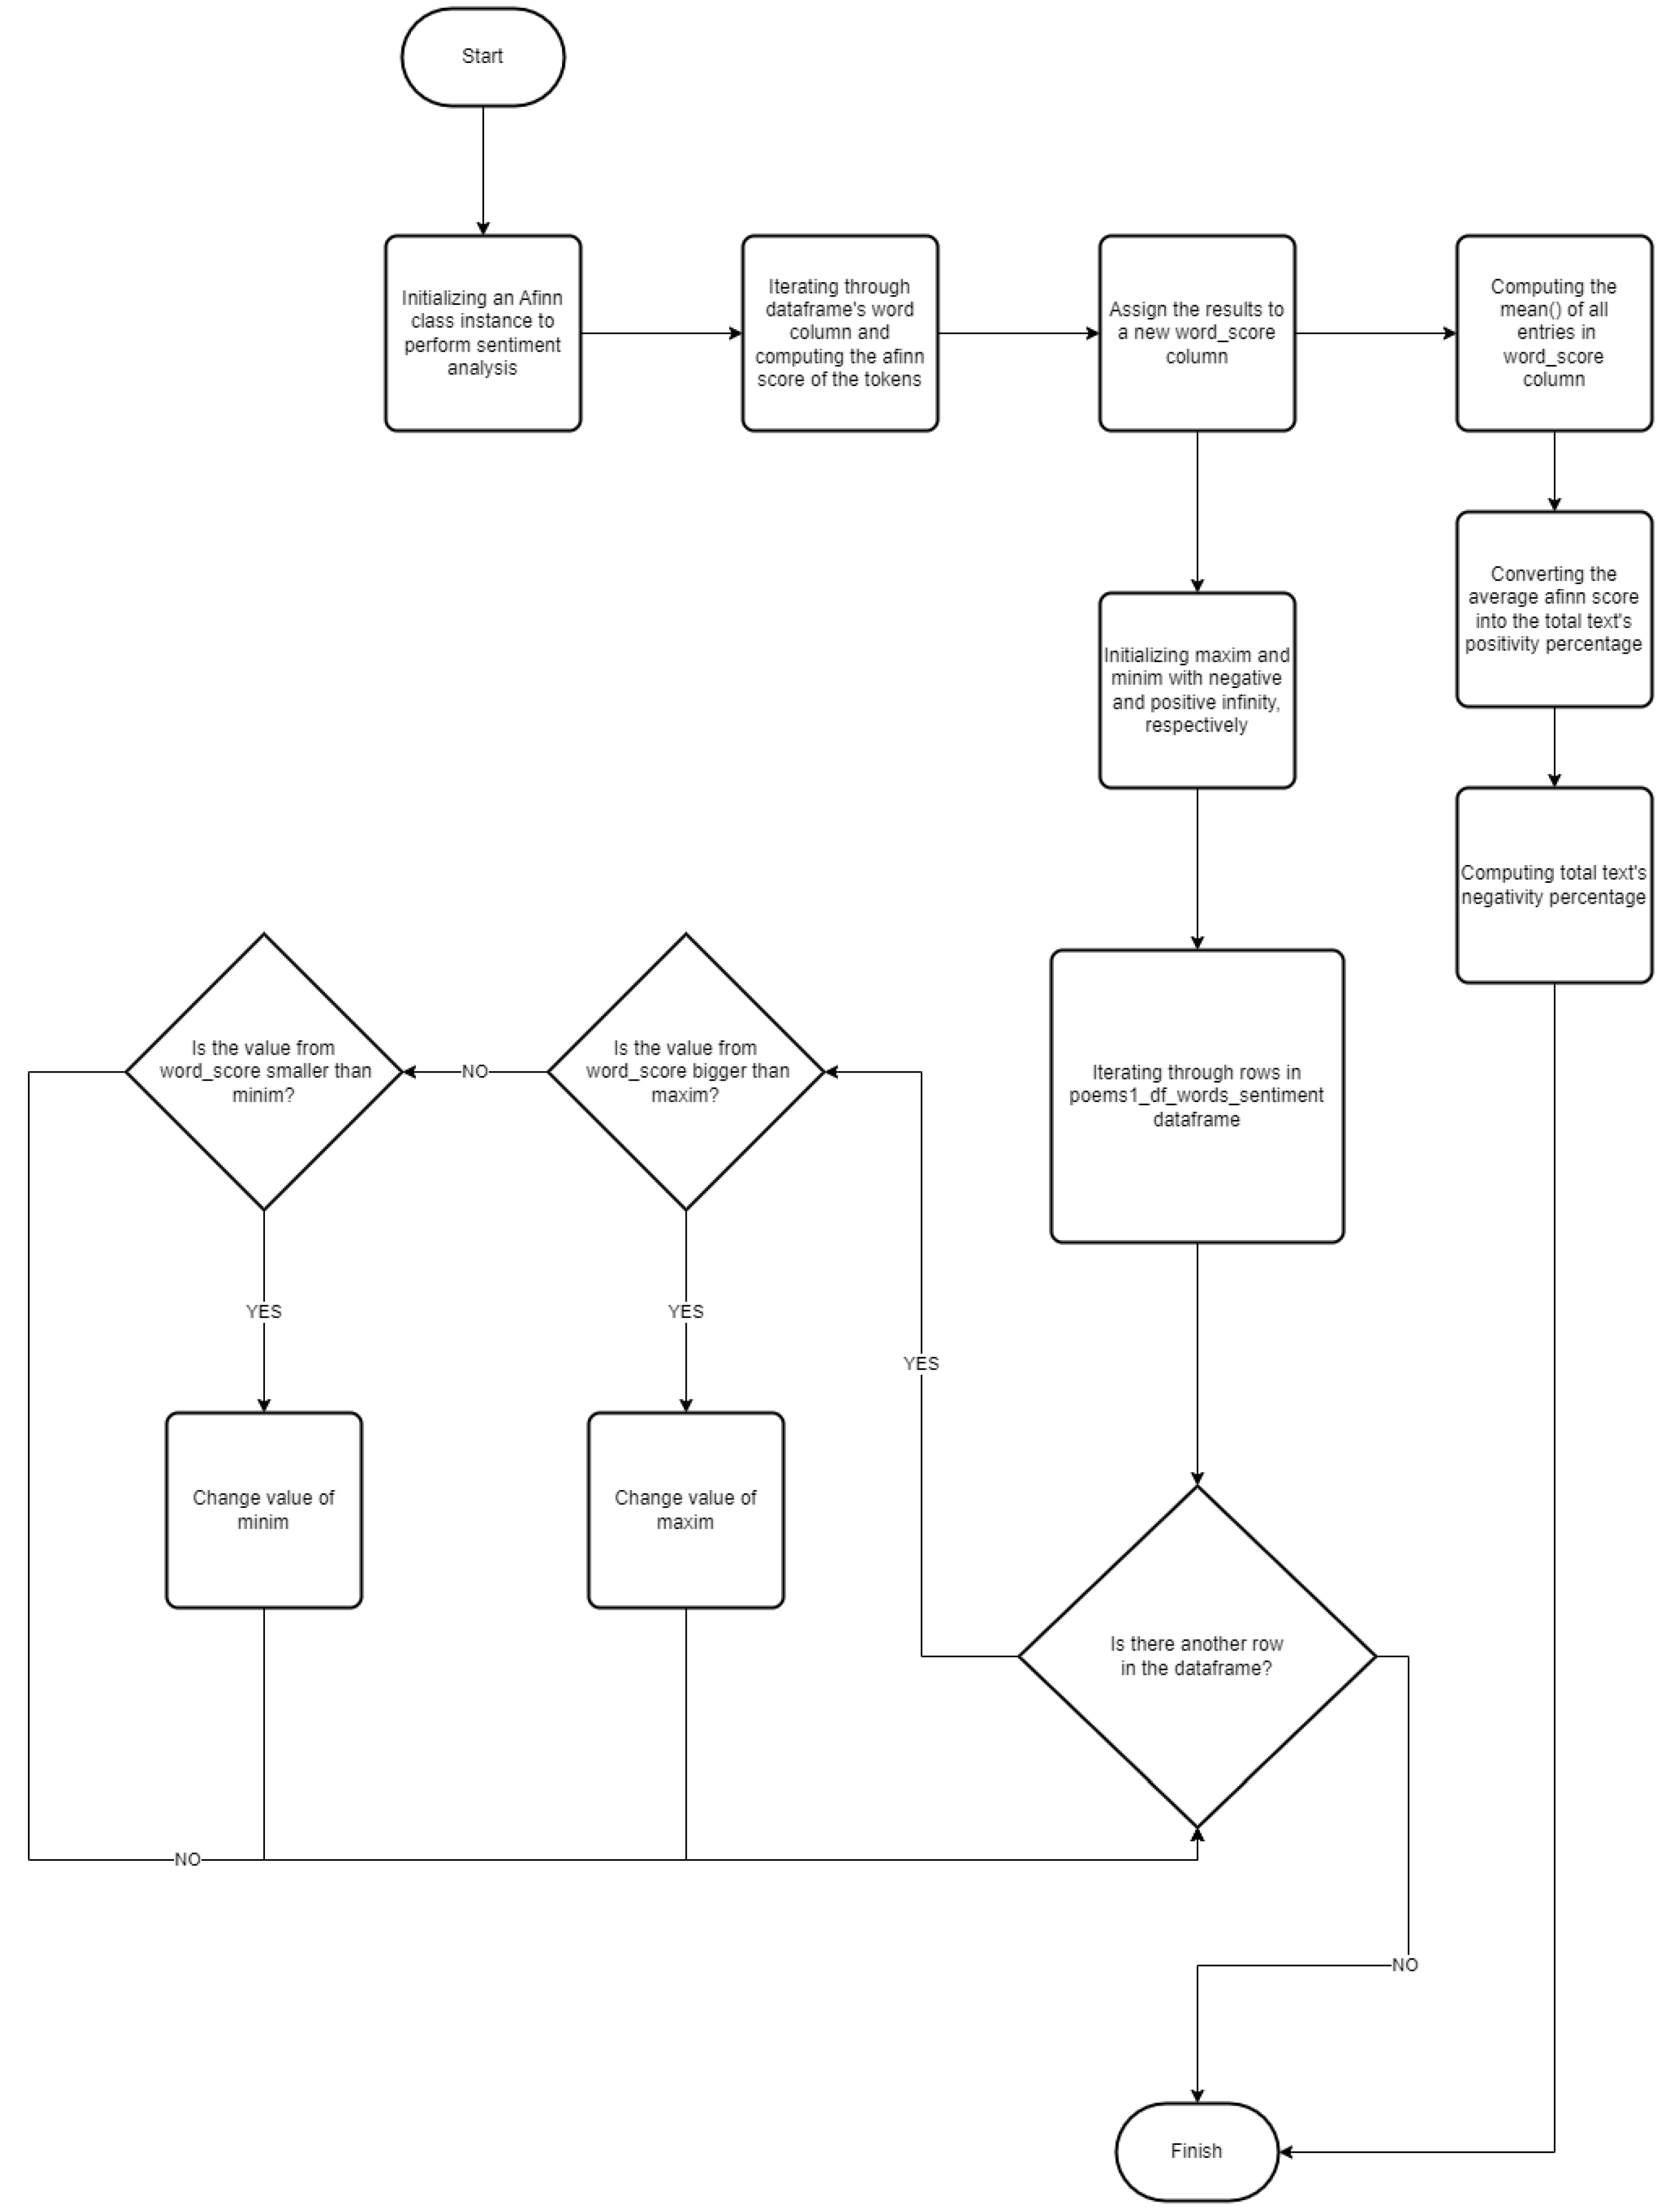
To find such words, two variables were initialized with positive and negative infinity and a for loop was used to iterate through all scores in the word_score column of the poems1 _df_words_sentiment dataframe as seen in Listing 5. The algorithm checked, with each iteration, if the newly selected score was higher than the maxim variable or lower than the minim variable to update the values of the variables. Two new dataframes were created, positive_words retaining the words having their Afinn score equal to the maxim variable and negative_words retaining the words having their Afinn score equal with the minim variable. The creation of these dataframes was implemented in order to find the list of all the most positive or most negative words and not only one arbitrarily chosen word for each category. The dataframes were then passed to mostpositivewords and mostnegativewords in order to be displayed later in the Results window.
The flowchart representing each step performed in the sentiment analysis is presented in Figure 6.
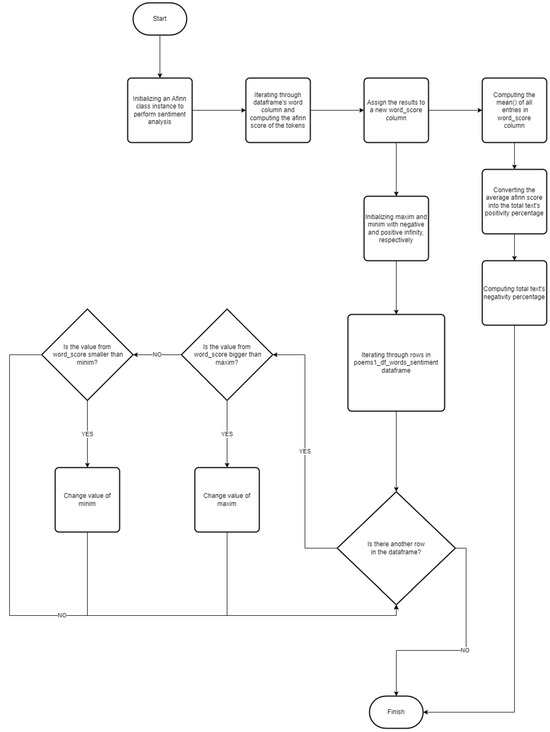
Figure 6.
Flowchart of the performed sentiment analysis of texts.
| Listing 5. Finding the Most Positive and Negative Words Based on Sentiment Scores. |
 |
Most Relevant Verbs in the Text
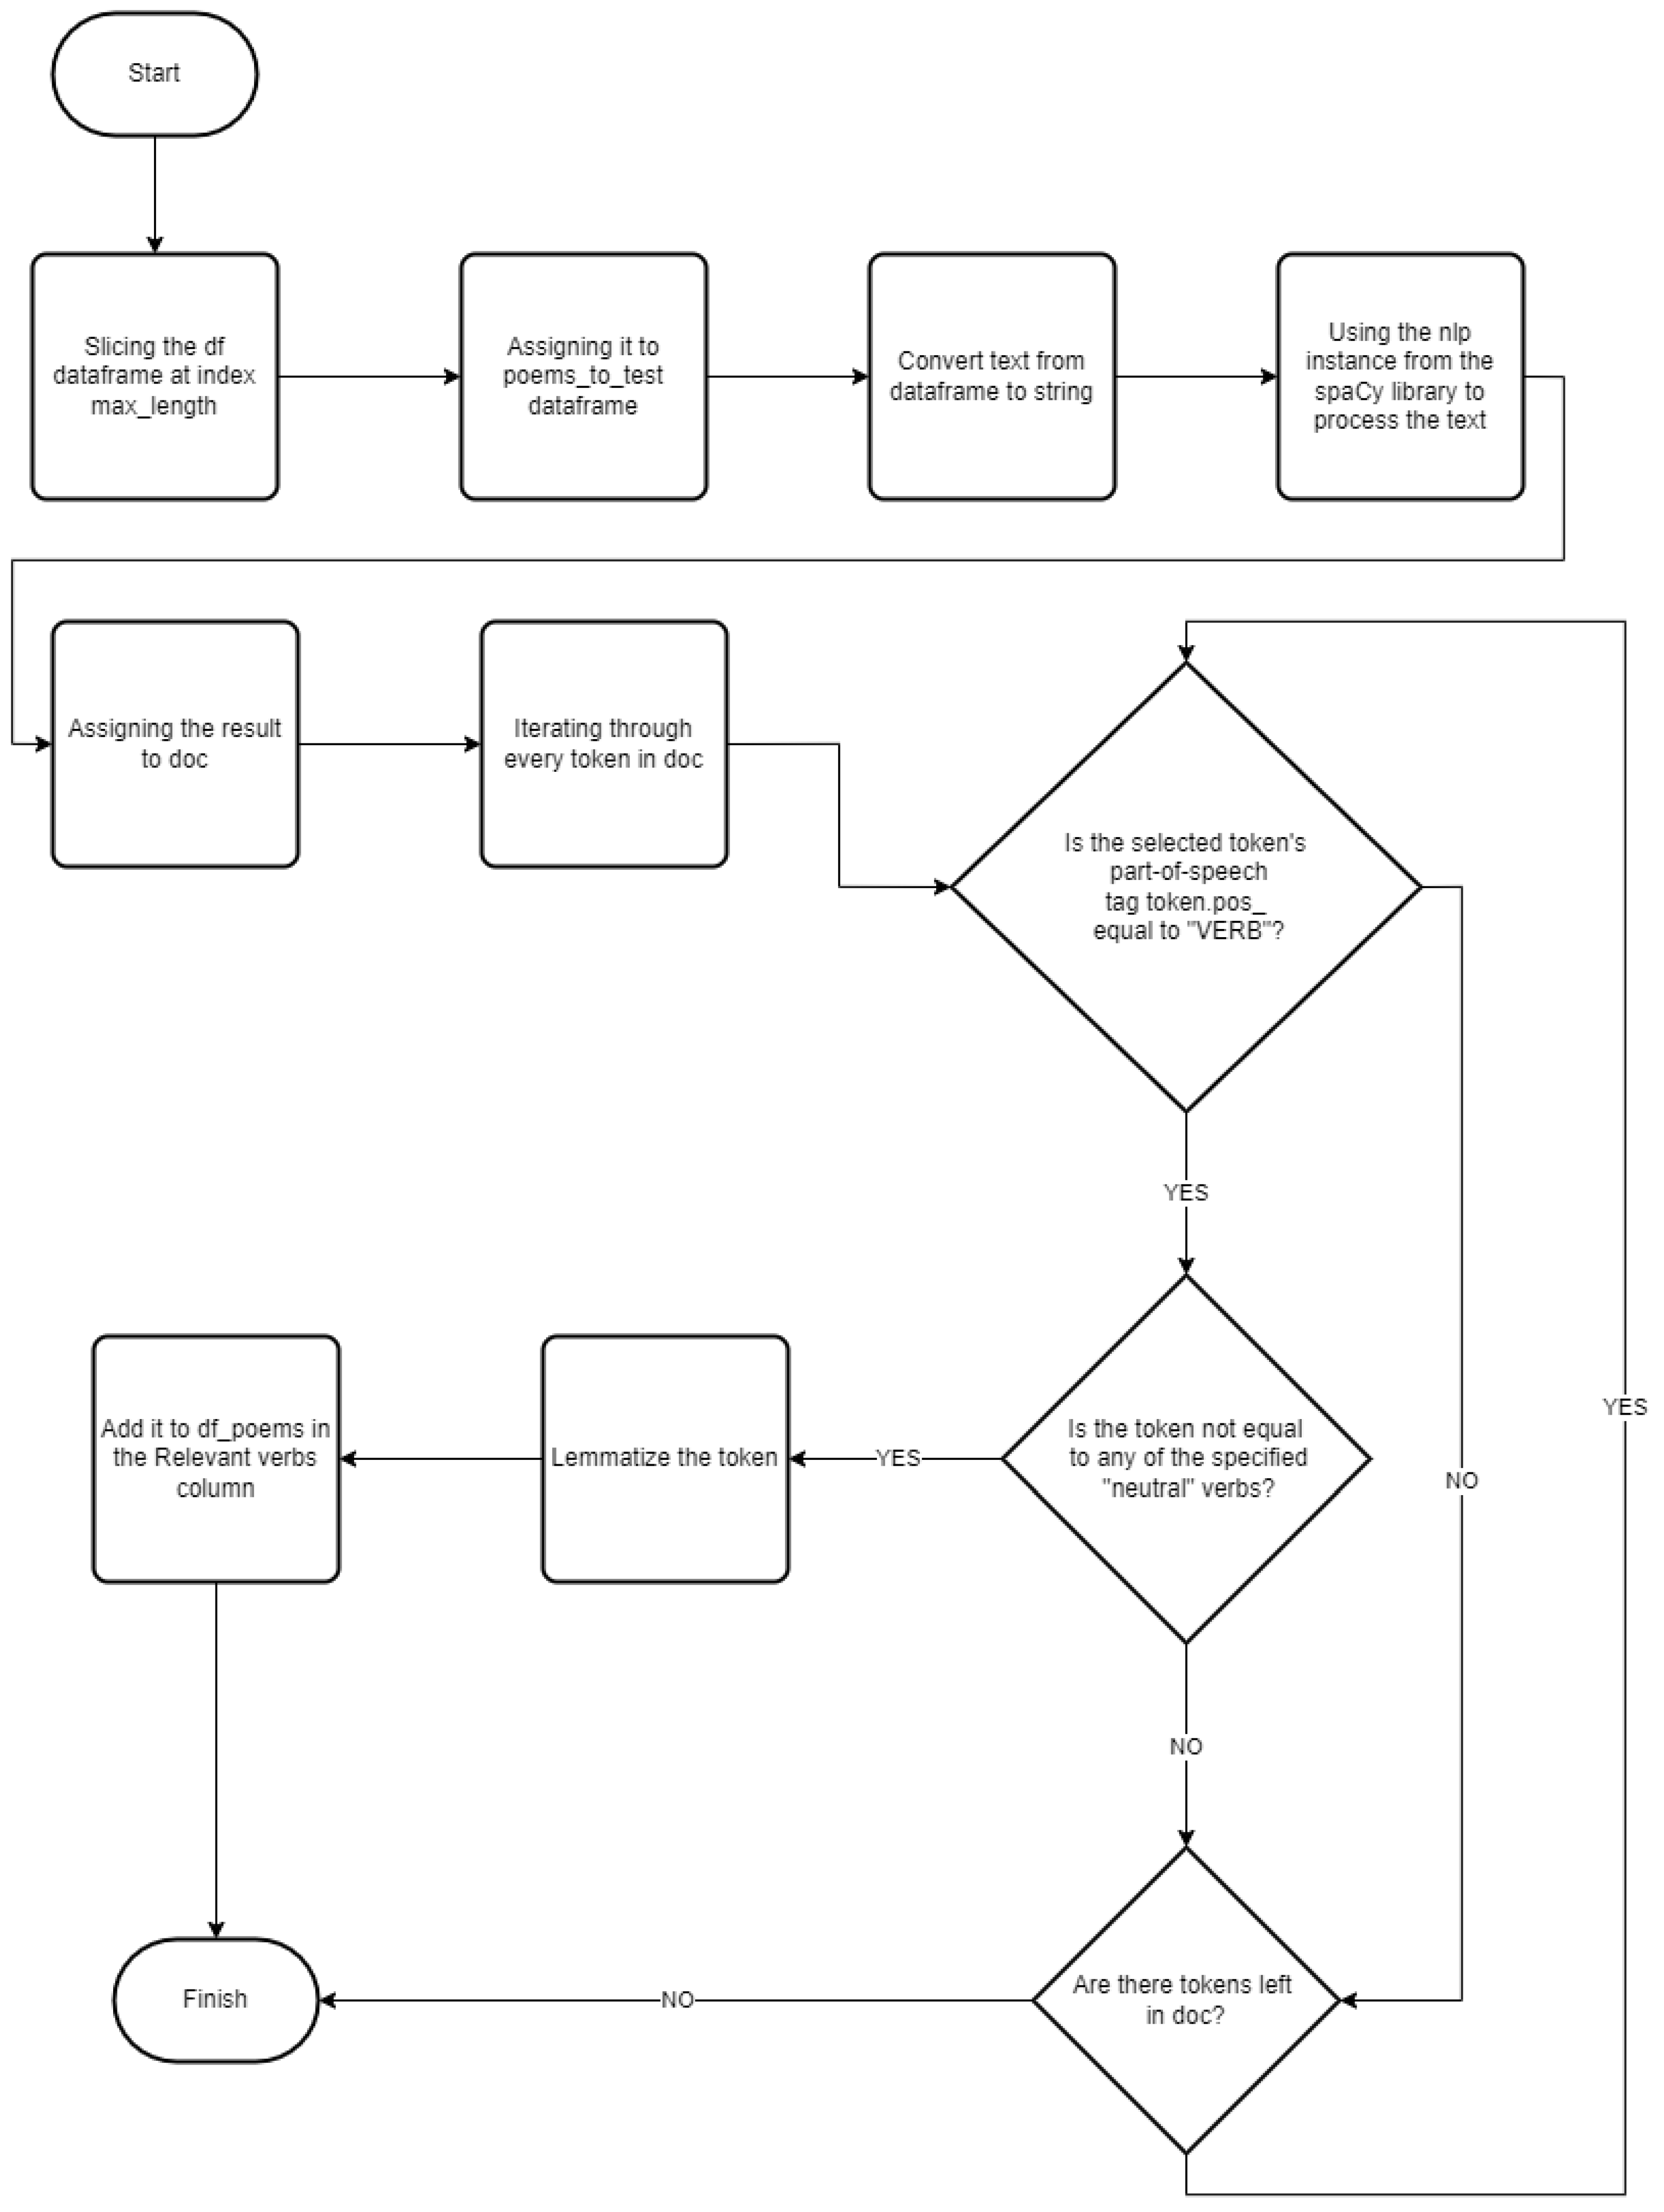
The overall feel of a written text and its average sentimental value is closely related to the collection of utilized verbs in the said text, with verbs being one of the most powerful and valuable changers of meaning in any literary work. As such, their study was only natural for the sake of the validity of this system, in particular finding the most relevant verbs from the entered text (intended as those verbs that would change the most drastically or influence the narrative of the text), returning them to their original form, and classifying them by frequency of use.
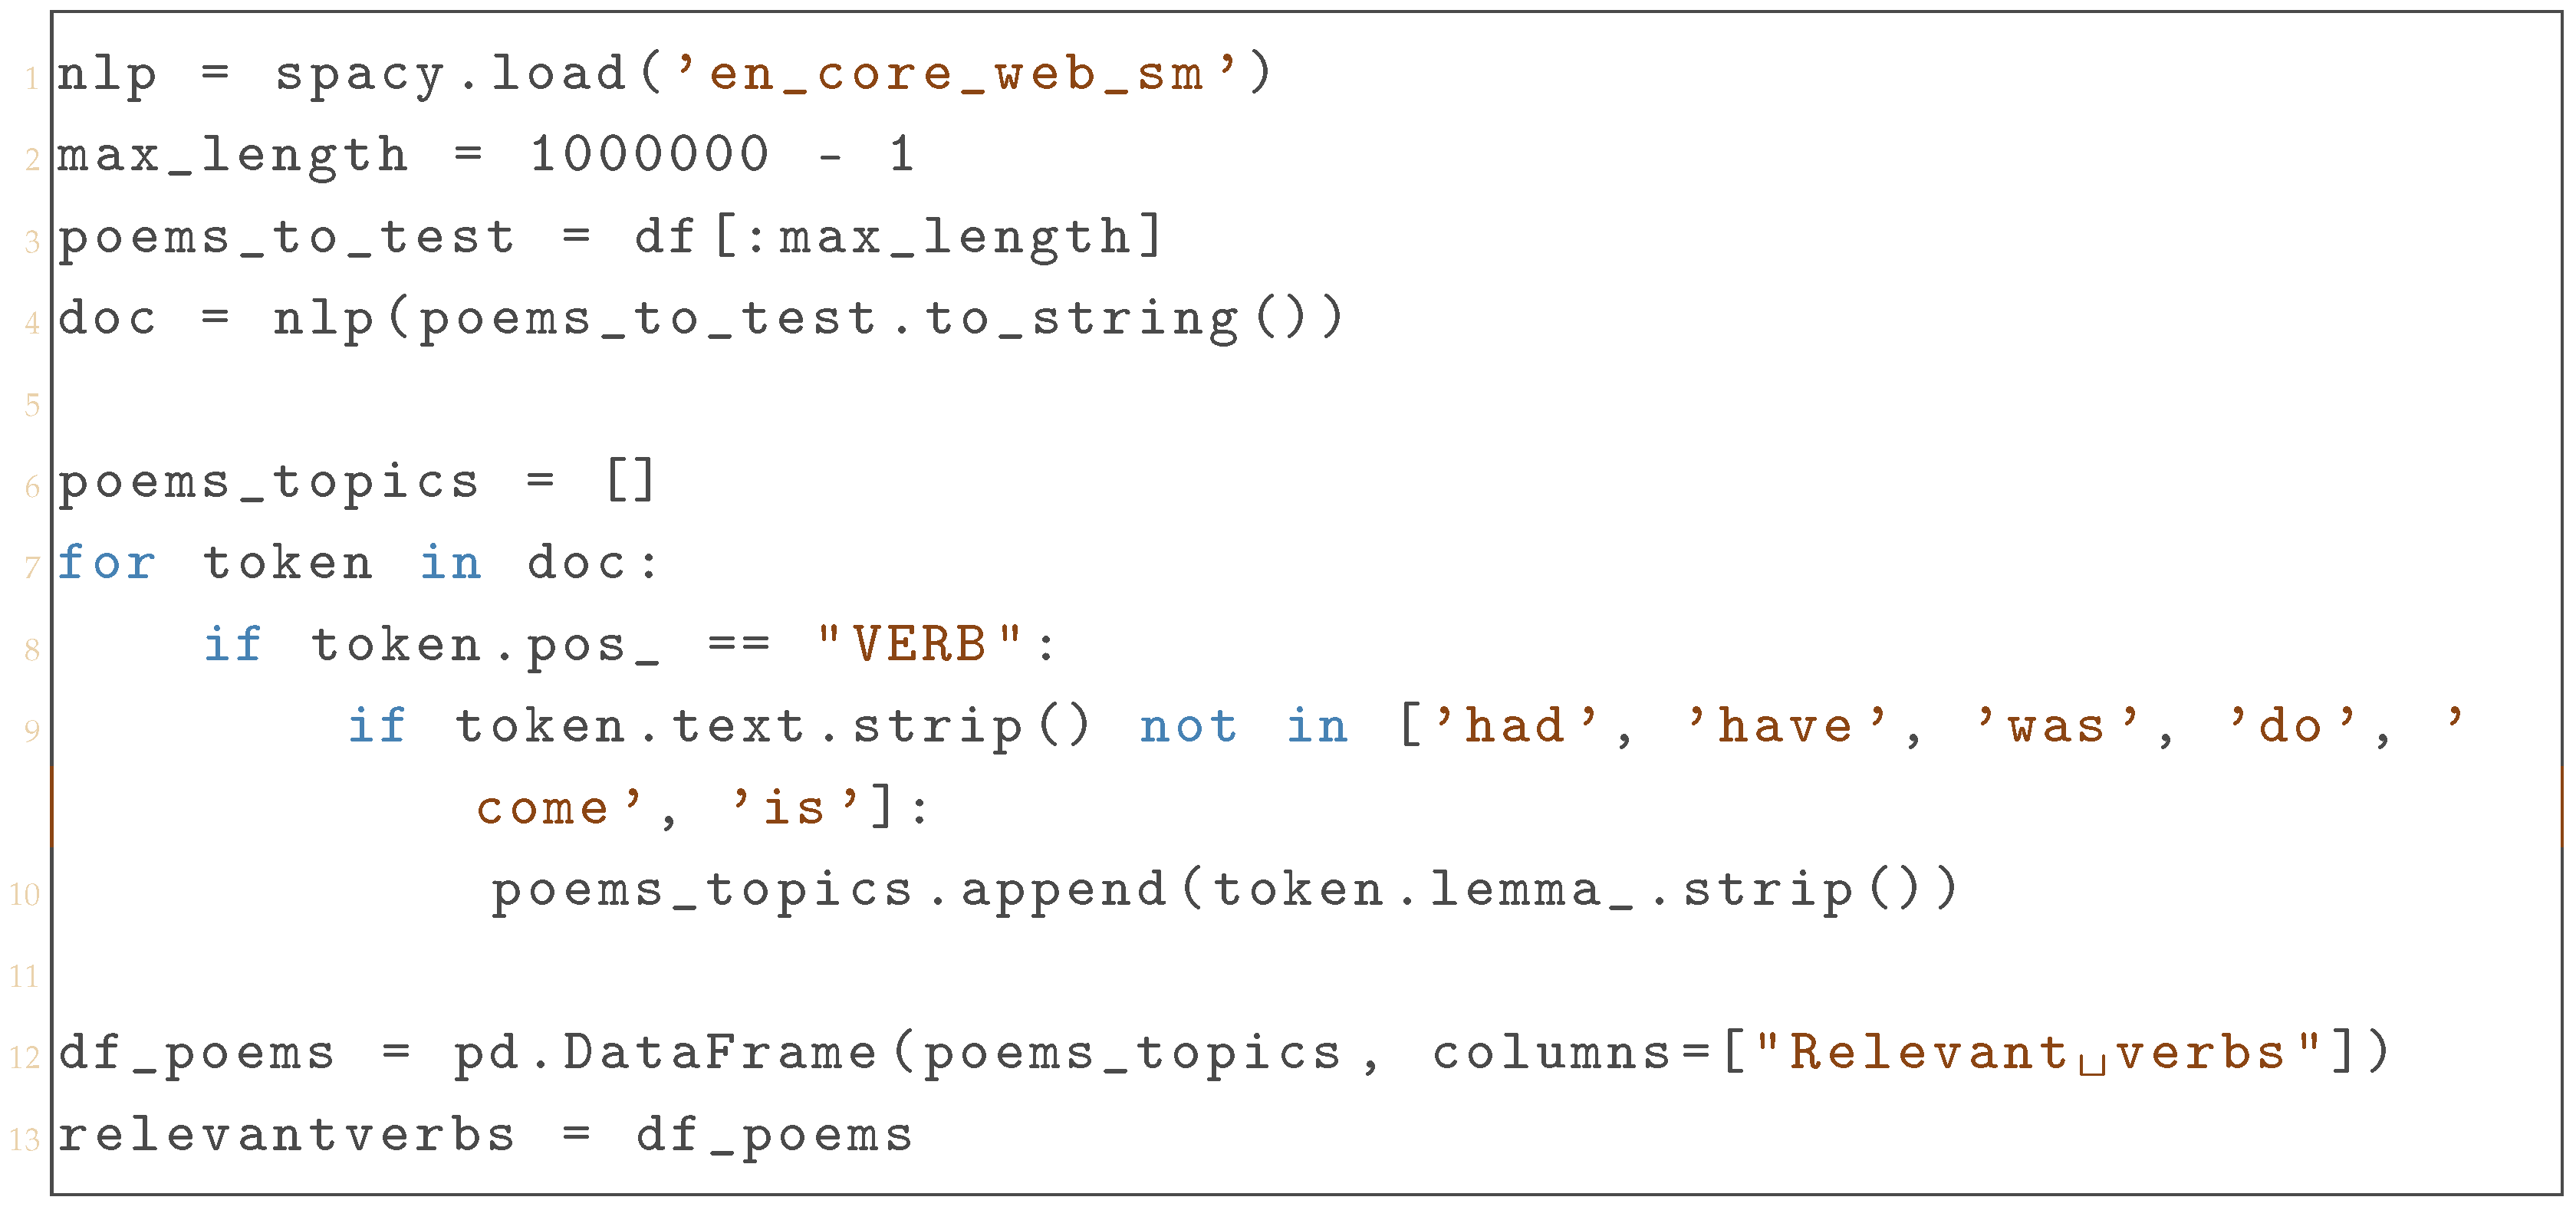
As presented in Listing 6, firstly, after loading the English language model from the spaCy library and declaring a maximum number of characters that an analyzable fragment could have, the poems_to_test dataframe was sliced at the max_lenght-th character, avoiding any possible performance-related issues. The poem_to_test’s text was then processed using the nlp model, the result being assigned to the doc object. Using a token.pos_ tag to verify if the selected word is a verb while iterating through every token present in the doc object was the method used to indicate all the verbs in the entered text. It should be noted that not all verbs conceal an important sentimental value, and therefore verbs such as ‘to have’ or ‘to be’ were excluded from the study a priori.
Extracting the original form of every verb was also important from a statistical point of view, with each possible verb form being reconnected meaning-wise to its base form (so declinations such as ‘loved’ and ‘love’ were not considered as two different verbs, instead each of them being classified as an entrance for the ‘love’ verb). It is noticeable that constructions such as ‘being loved’ were not considered forms of the verb ‘love’, with ‘loved’ being in these specific occasions an adjective and not a verb.
Finally, a new dataframe df_poems was created, containing all the relevant verbs in an appropriately named column, with the dataframe being then passed to relevant verbs to allow it to be displayed later on.
| Listing 6. Extracting Relevant Verbs from Text Using spaCy NLP Model. |
 |
The methodology is also presented as a flow chart in Figure 7.

Figure 7.
Flowchart for finding the most relevant verbs in the text.
3.5. Real-Time Recording and Emotion Monitoring
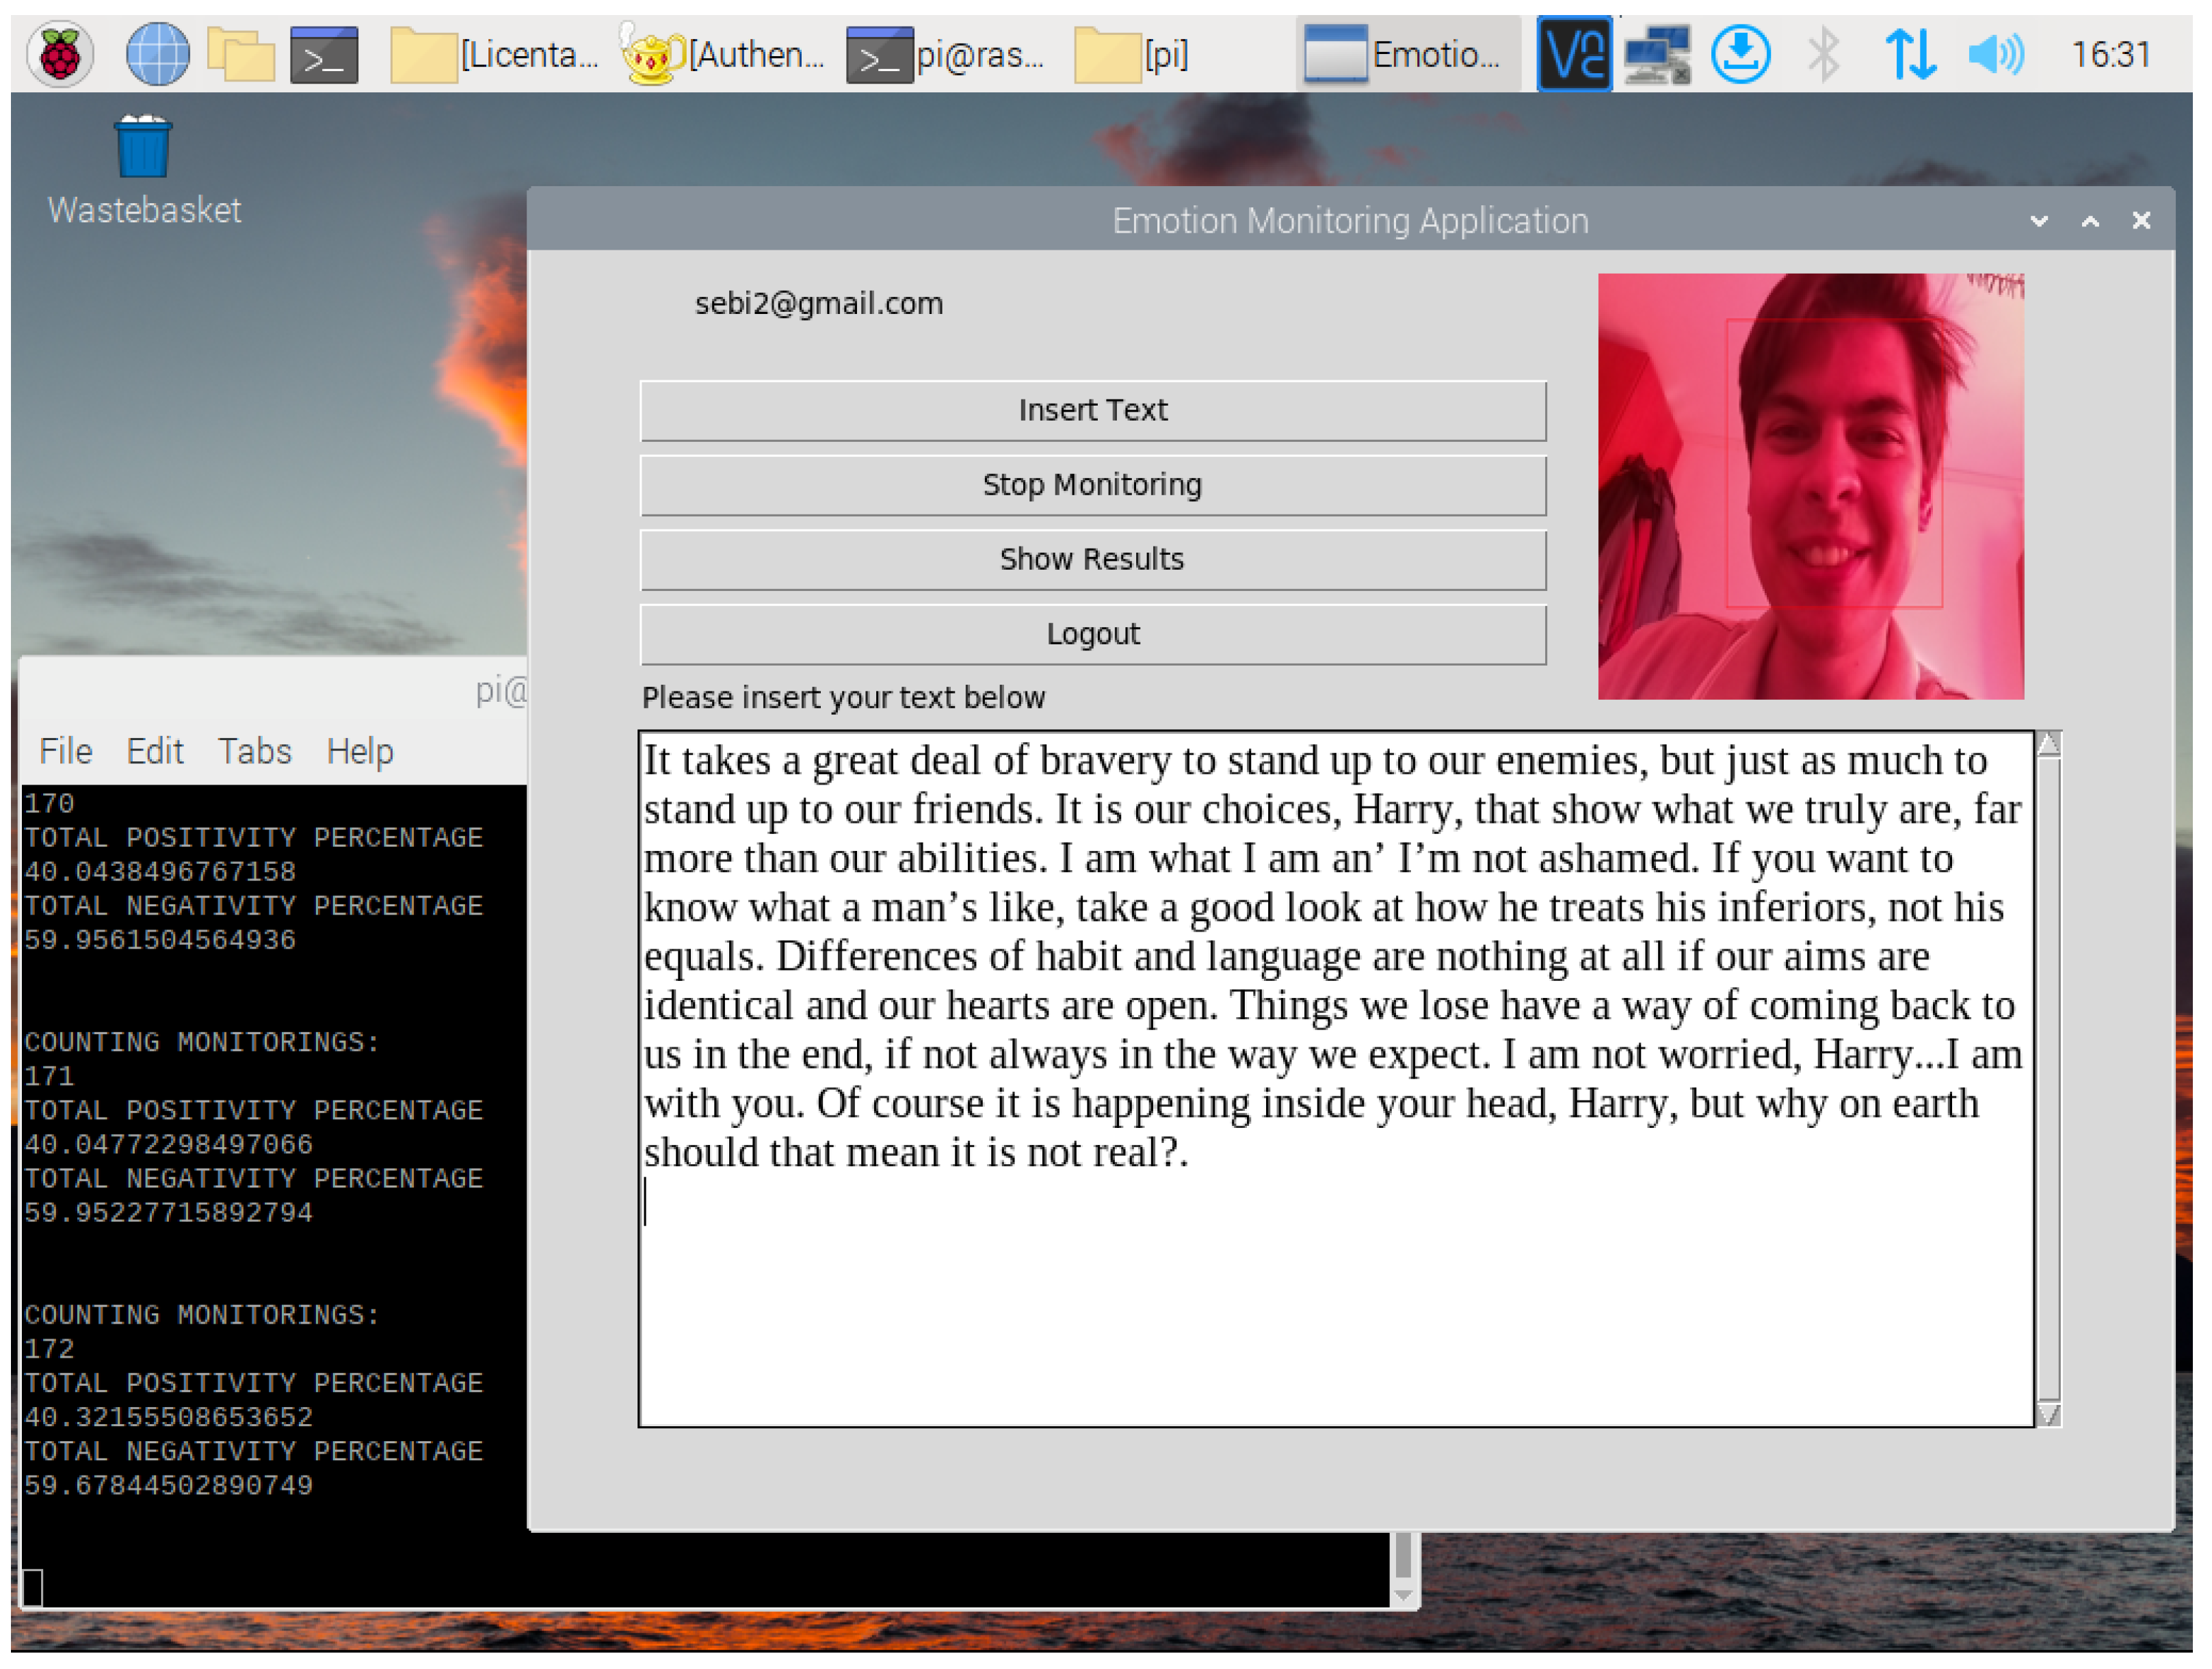
The presented system implies the use of a Pi Camera module connected to a Raspberry Pi 4 board for real-time emotion monitoring, with the said camera recording the test taker while reading the sentiment-analyzed text (Figure 8). The entire process of facial microexpression analysis can be subdivided into three fundamental steps: real-time video recording to collect the immediate emotional response to the text, emotional analysis in frame to obtain emotional interpretations of the facial expressions of the detected face in each analyzed frame, and ’displaying the video in real time in Tkinter’ to let the test taker know that they are being recorded and make the application even more interactive.
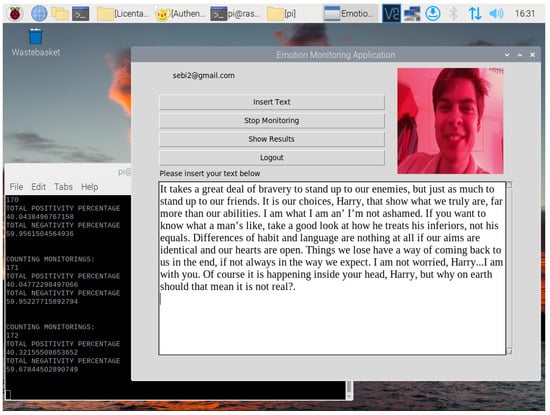
Figure 8.
Emotion monitoring application real-time monitoring process.
3.5.1. Real-Time Video Recording
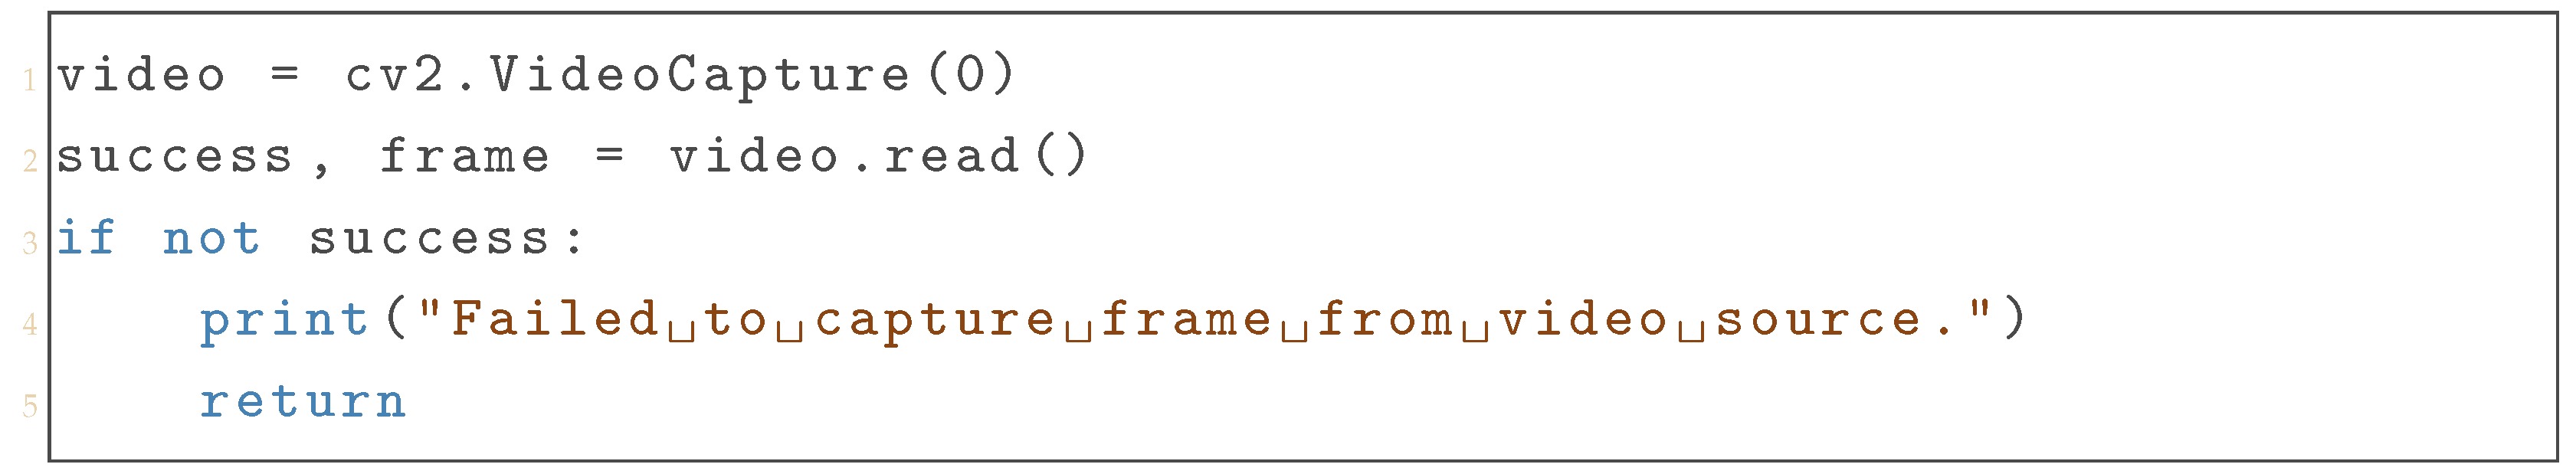
To record the face of the test taker, a video capture object had to first be created using the VideoCapture() function of the OpenCV library, as seen in Listing 7. This function assured the possibility of video streaming from a device, in this case due to the 0 parameter being the default recording device connected to the computer (in the case of multiple cameras, the parameter may be different from 0).
Once the video capture object had been created, it was possible to use the read() method to retrieve a frame from the video stream. The function returns a tuple containing a Boolean success flag and the requested frame, with the success being true when the frame was retrieved. In case of impossibility to retrieve the frame, success will be false and the message ‘Failed to capture frame from video source’ will be displayed in Terminal.
| Listing 7. Capturing a Video Frame Using OpenCV. |
 |
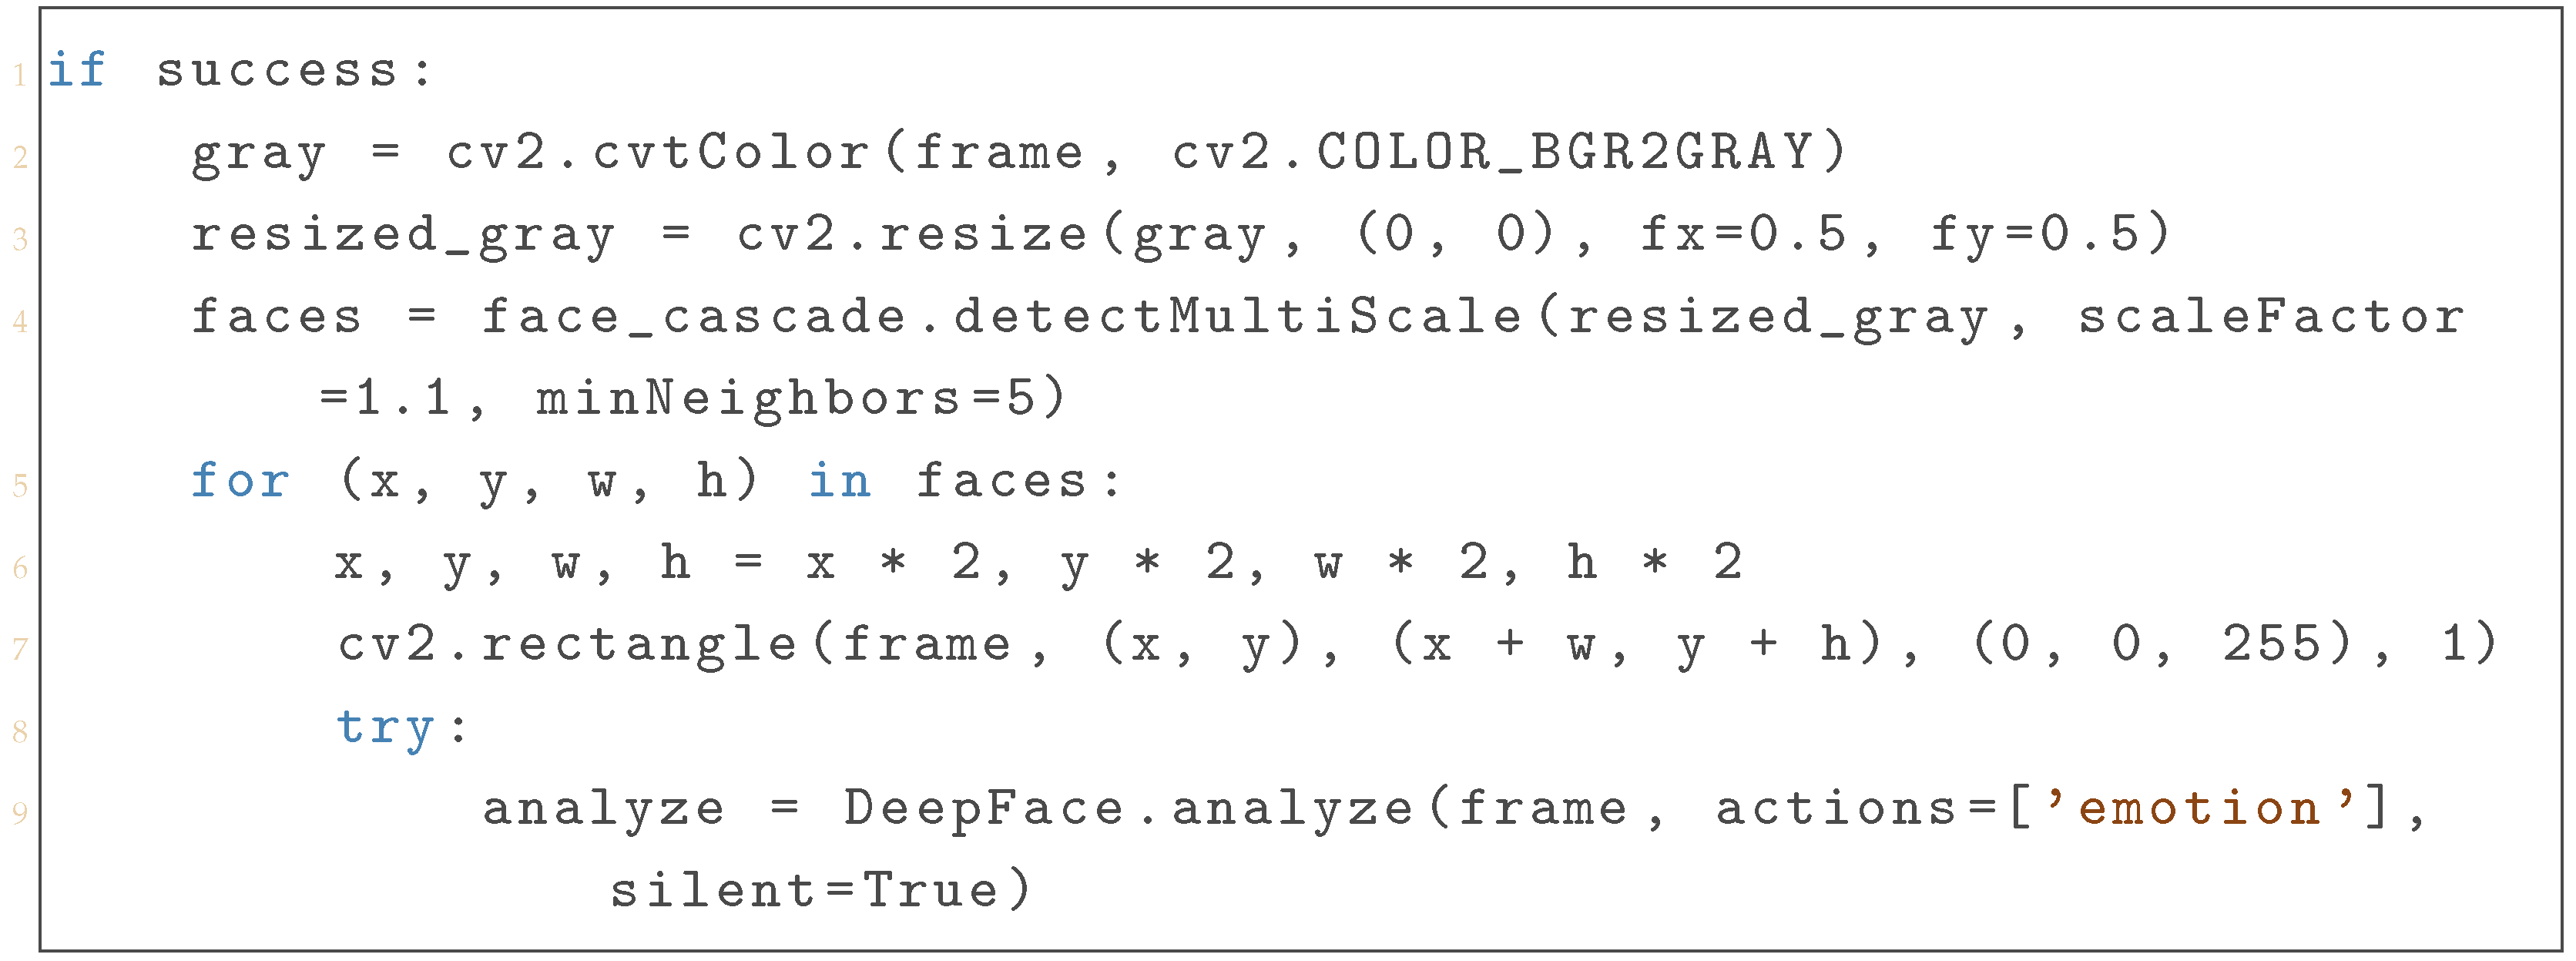
3.5.2. Emotional Analysis of Each Frame
Once successfully retrieved, the frame was also ready to be processed. Firstly, the function cvtColor() was used in order to change the color space of the parameter frame in the specified way: BGR2GRAY, which means blue–green–red color space to grayscale (Listing 8).
Using the grayscale of a frame in image processing greatly simplifies the algorithms necessary to analyze that frame. Grayscale is obtained by combining the average pixel values of each of the primary colors (red, green, and blue). Lowering the luminous intensity of each color band from 24 bits to 8 bits and making pixels in grayscale images retain only the information of luminous intensity render grayscale an efficiency-increasing process.
The frame resolution was also reduced for efficiency purposes, as well as to reduce computational complexity, with the coordinates being scaled back to the original frame size after face detection. In order to detect faces in the frame, the method face.cascade.detectMultiScale was used with a cascade classifier, a machine learning model trained to recognize certain objects or patterns. The scaleFactor parameter determines the scale factor by which, at each image scale during the face detection process, the image will be resized, and 1.1 indicates that the frame will indeed be scaled down by 10% each time. minNeighbors parameter sets the minimum number of rectangles neighboring a detected region in order for the region to be considered a face, filtering falsely detected faces. The result of the detectMultiScale() function will be a list of rectangles defined by their (x, y, w, h) coordinates representing regions where a face has been detected. x and y are the coordinates of the upper left corner of the rectangle and w and h are the width and height, respectively. The list will be stored in faces.
Subsequently, a loop over faces object was initialized. A red rectangle was also drawn on the detected faces in order to signal the user of the application regarding the success of face detection by using the rectangle() function of the openCV library, with the parameters of the function representing, in order, the coordinates of the top left corner, the coordinates of the bottom right corner, the color of the rectangle, and finally the thickness of the rectangle. Being in the loop, the function will draw the rectangle for each face detection, meaning that they will appear continuous to the users of the application, as if the rectangles were drawn directly on the video, or they were moving.
The analyze() function of the DeepFace library was utilized to perform the analysis on the provided frame. The parameter actions are a list with possible facial analysis that could be performed. The list could be provided with different elements such as ‘emotion’, ‘age’, or ‘gender’, but for the functionality of this system, only emotions were required. The ‘silent’ parameter ensures that calling the function will not clutter the terminal with undesired output.
| Listing 8. Real-Time Emotion Detection Using OpenCV and DeepFace. |
 |
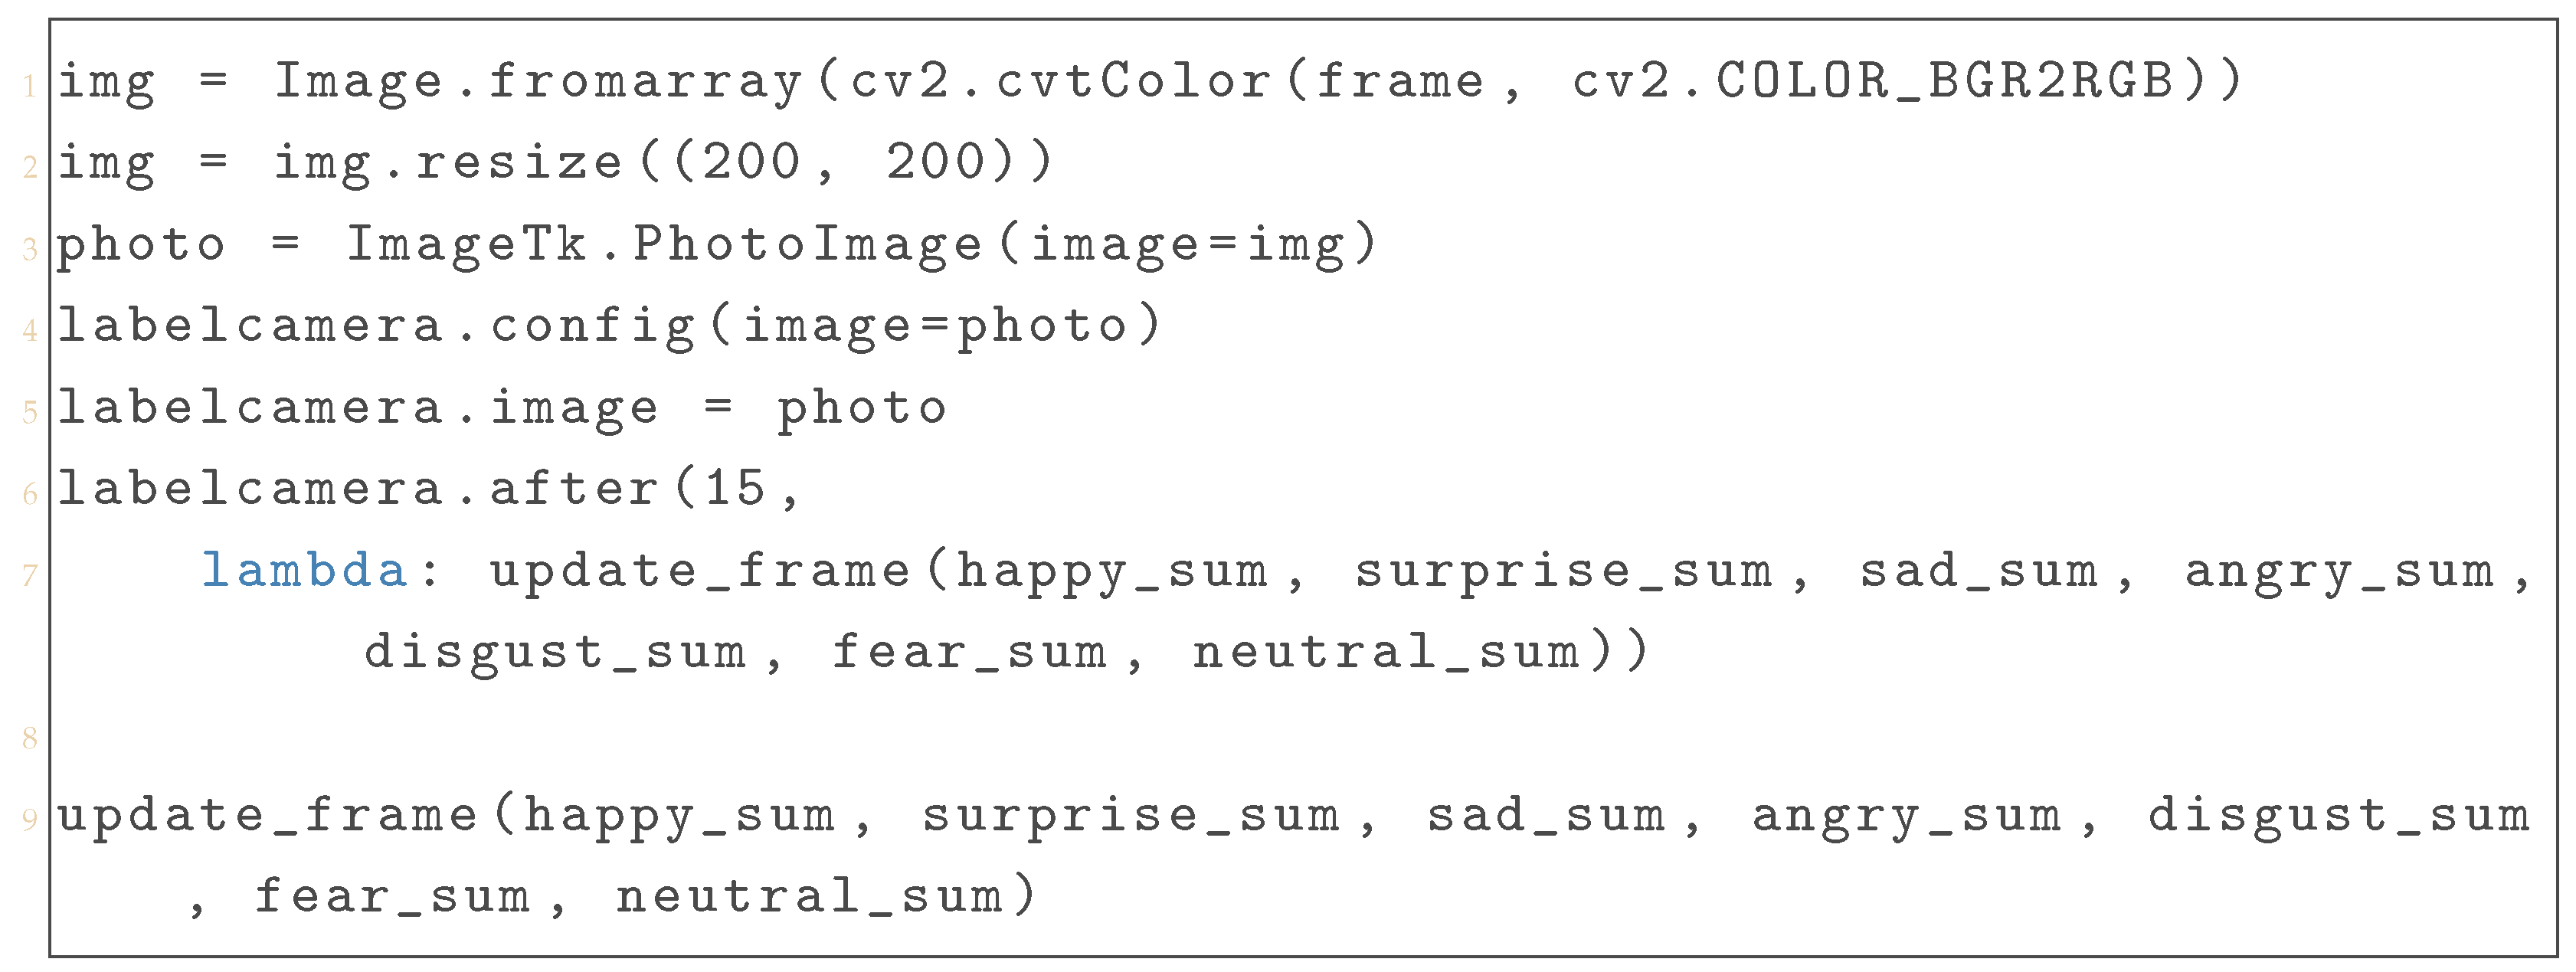
3.5.3. Displaying the Video in Real-Time in Tkinter
In Listing 9, we can observe that for displaying the frames in Tkinter, it was necessary to convert the image color space to RGB. After resizing the image and creating a PhotoImage object named photo, the content could finally be displayed in the labelcamera widget, updating itself once every 15 ms with a new frame and making the full real-time video showing possible.
| Listing 9. Updating Real-Time Video Frames for Emotion Analysis in a Tkinter GUI. |
 |
3.6. Firebase Cloud Services Integration
The system integrates cloud technologies to store test results and ensure secure data accessibility. As seen in Listing 10, the save_info() function is called only at the end of the test, giving the necessary space for the test taker to willingly decide whether to register their results or not. The function is called by pressing the “Save Info” button in the Results window.
| Listing 10. Saving User Information to Firebase Realtime Database After Test Completion. |
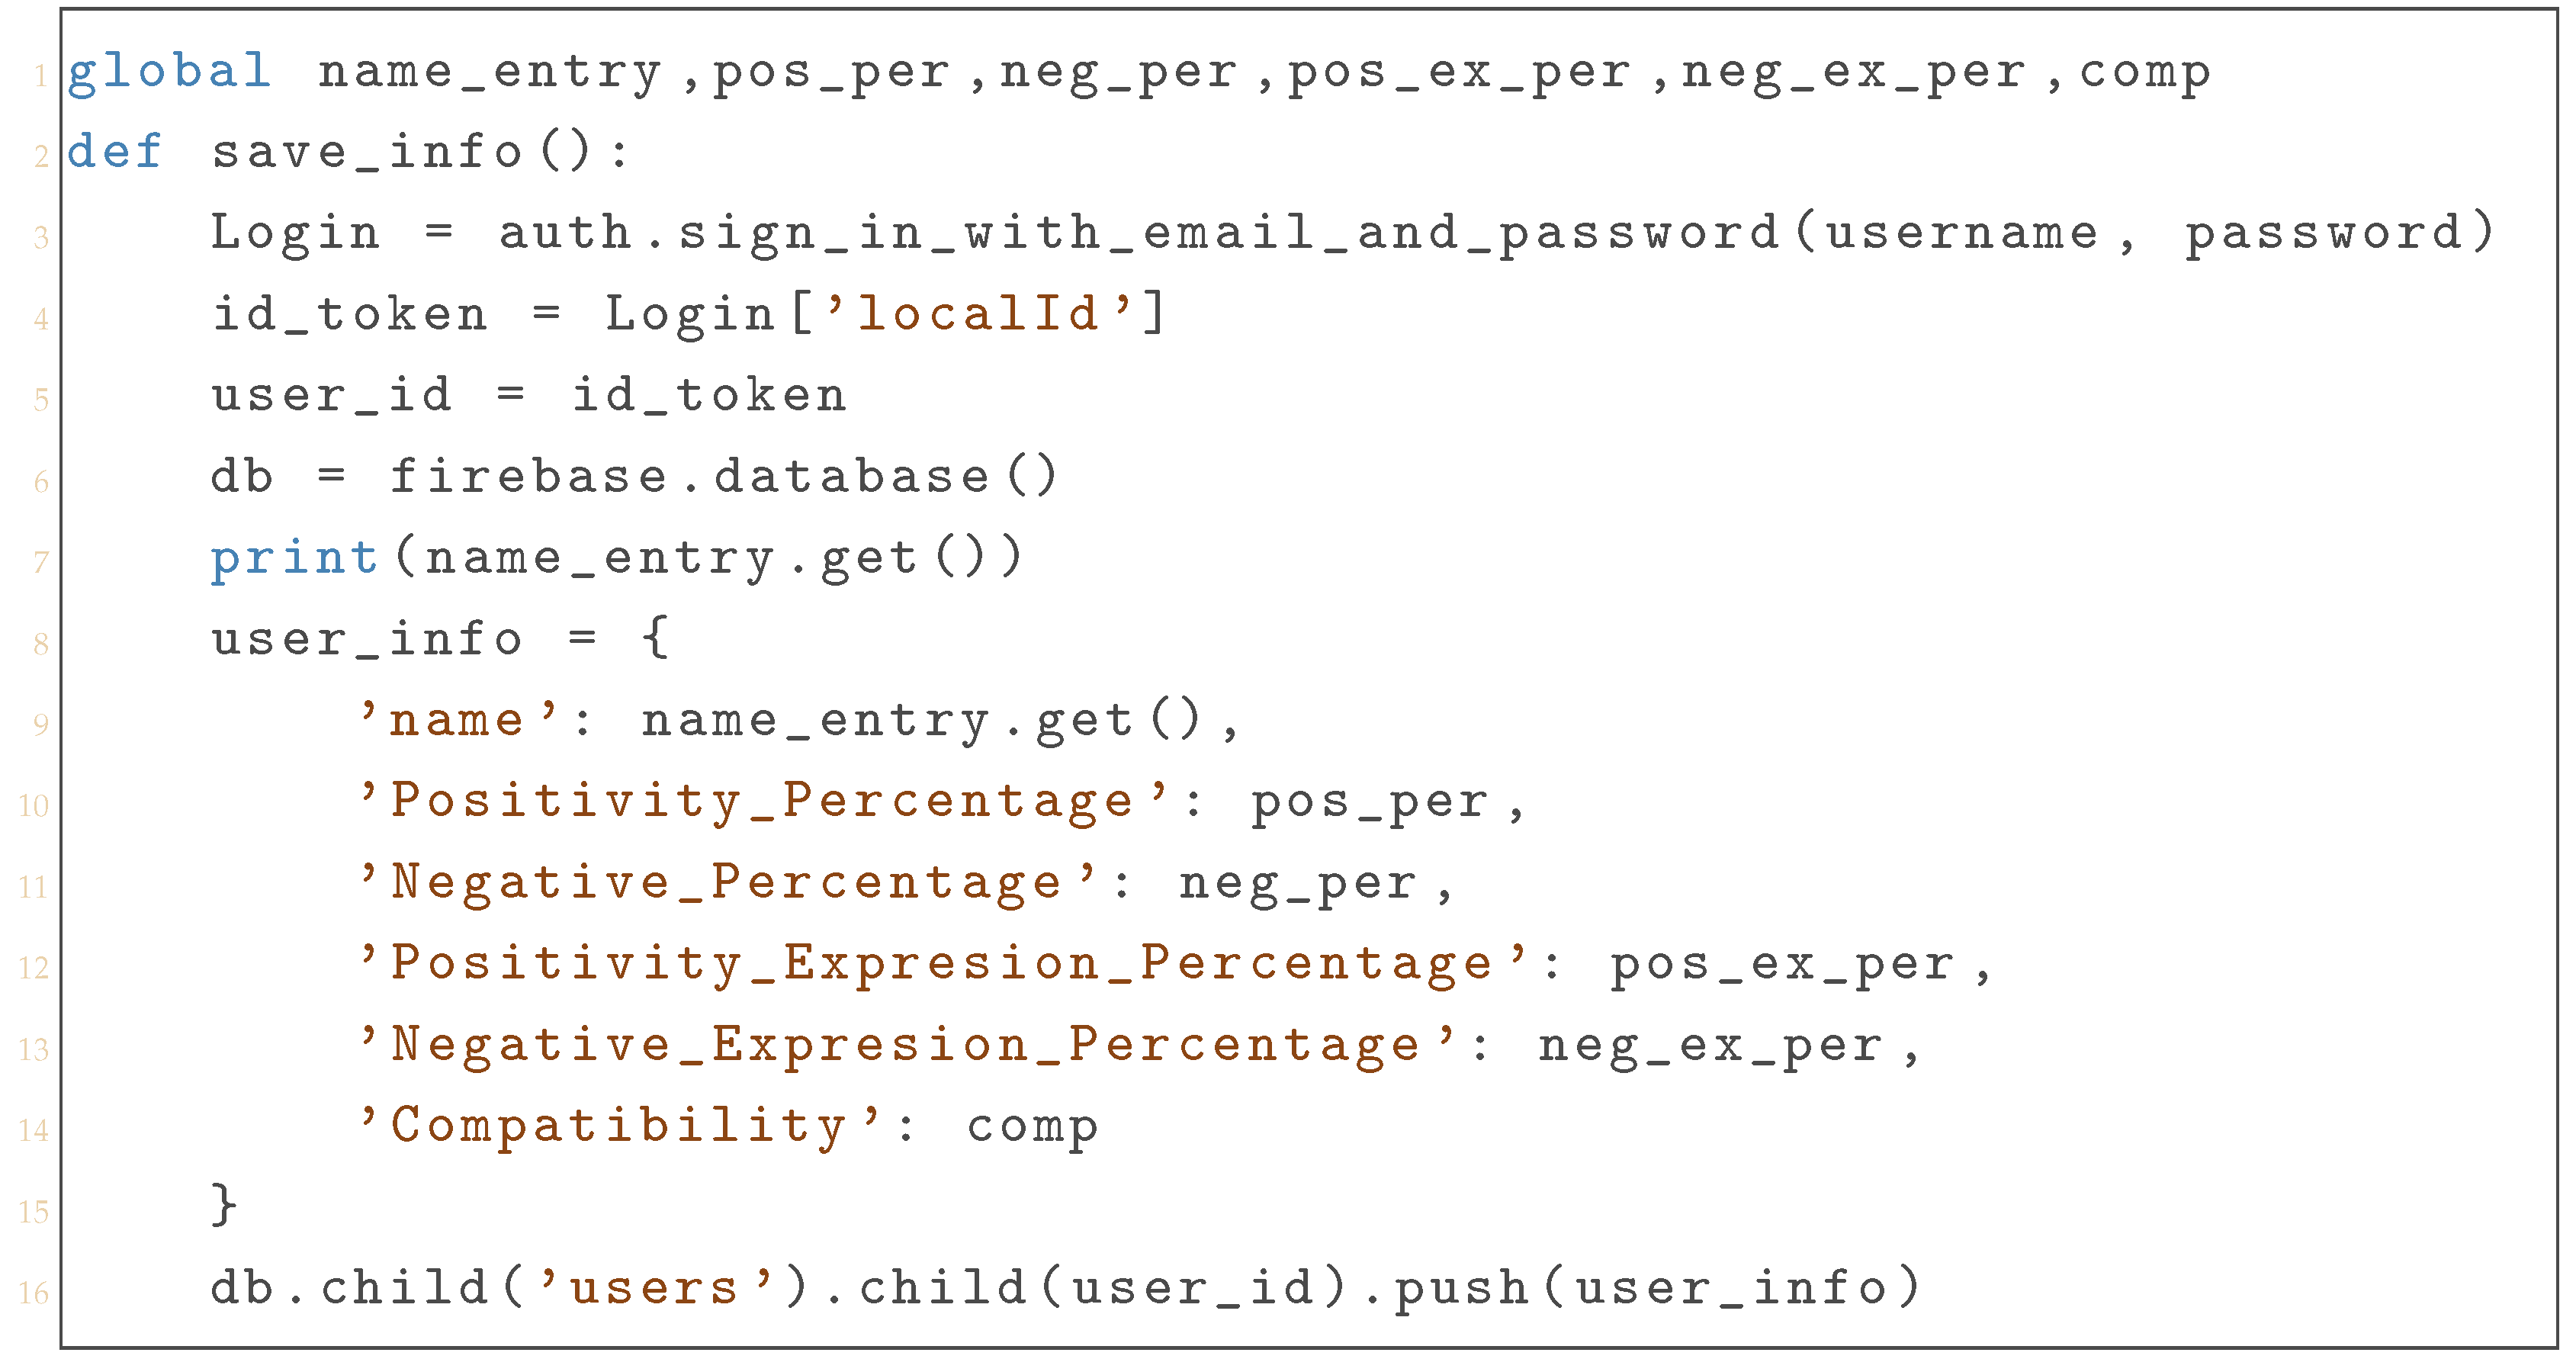 |
The reason why the system was implemented with the possibility of saving the results without entering the test taker’s name was due to the multiplicity of use case scenarios the application has, being adequate not only for private psycho-emotional studies of an individual test taker during a psychoanalysis session but also for social research in large groups of people where individual names would not be of any importance.
The Login object, which contains the authentication information, will be used to extract the localId and then assigned to the user_id variable. The connection to the Firebase Realtime Database was performed with the database() function, assigning the reference to it to the db variable. In order to organize the information to be sent as a child node under the user node in the Realtime Database, a dictionary was created containing the results to be stored, such as the name of the test taker, the positive and negative total percentages revealed in the entered text by the previously performed sentiment analysis, and the total percentages of positive and negative expressions monitored while the reader was participating in the test.
The information sending was handled by the use of the push() function, receiving as a parameter the previously created dictionary. In the event of the absence of a name, the results will still be sent to the Firebase Realtime Database, as previously mentioned.
3.7. Computing Compatibility
This system aims not only to gather data from the sentiment analyzed text and facial microexpression monitoring but also to calculate such data to perform a broader analysis and refine more conclusive results as seen in Figure 9. Particularly, the application will compute a large variety of cumulative means of revealed monitored emotions, as much as the total positivity and negativity percentages for the text’s sentiment analysis and for the microexpression study.
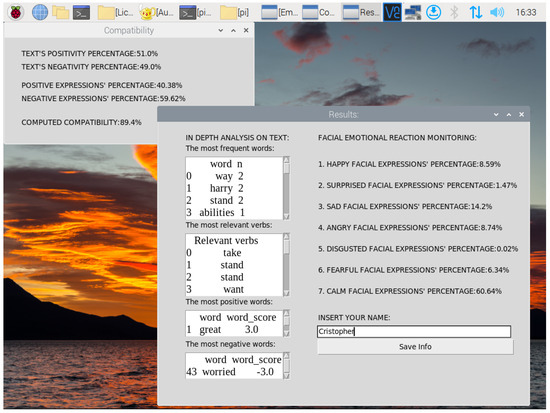
Figure 9.
Results and compatibility windows.
The system will finally measure the compatibility between the sentiments revealed by the mean of Afinn scores of the analyzed text and the emotions showcased by the test taker while reading it.
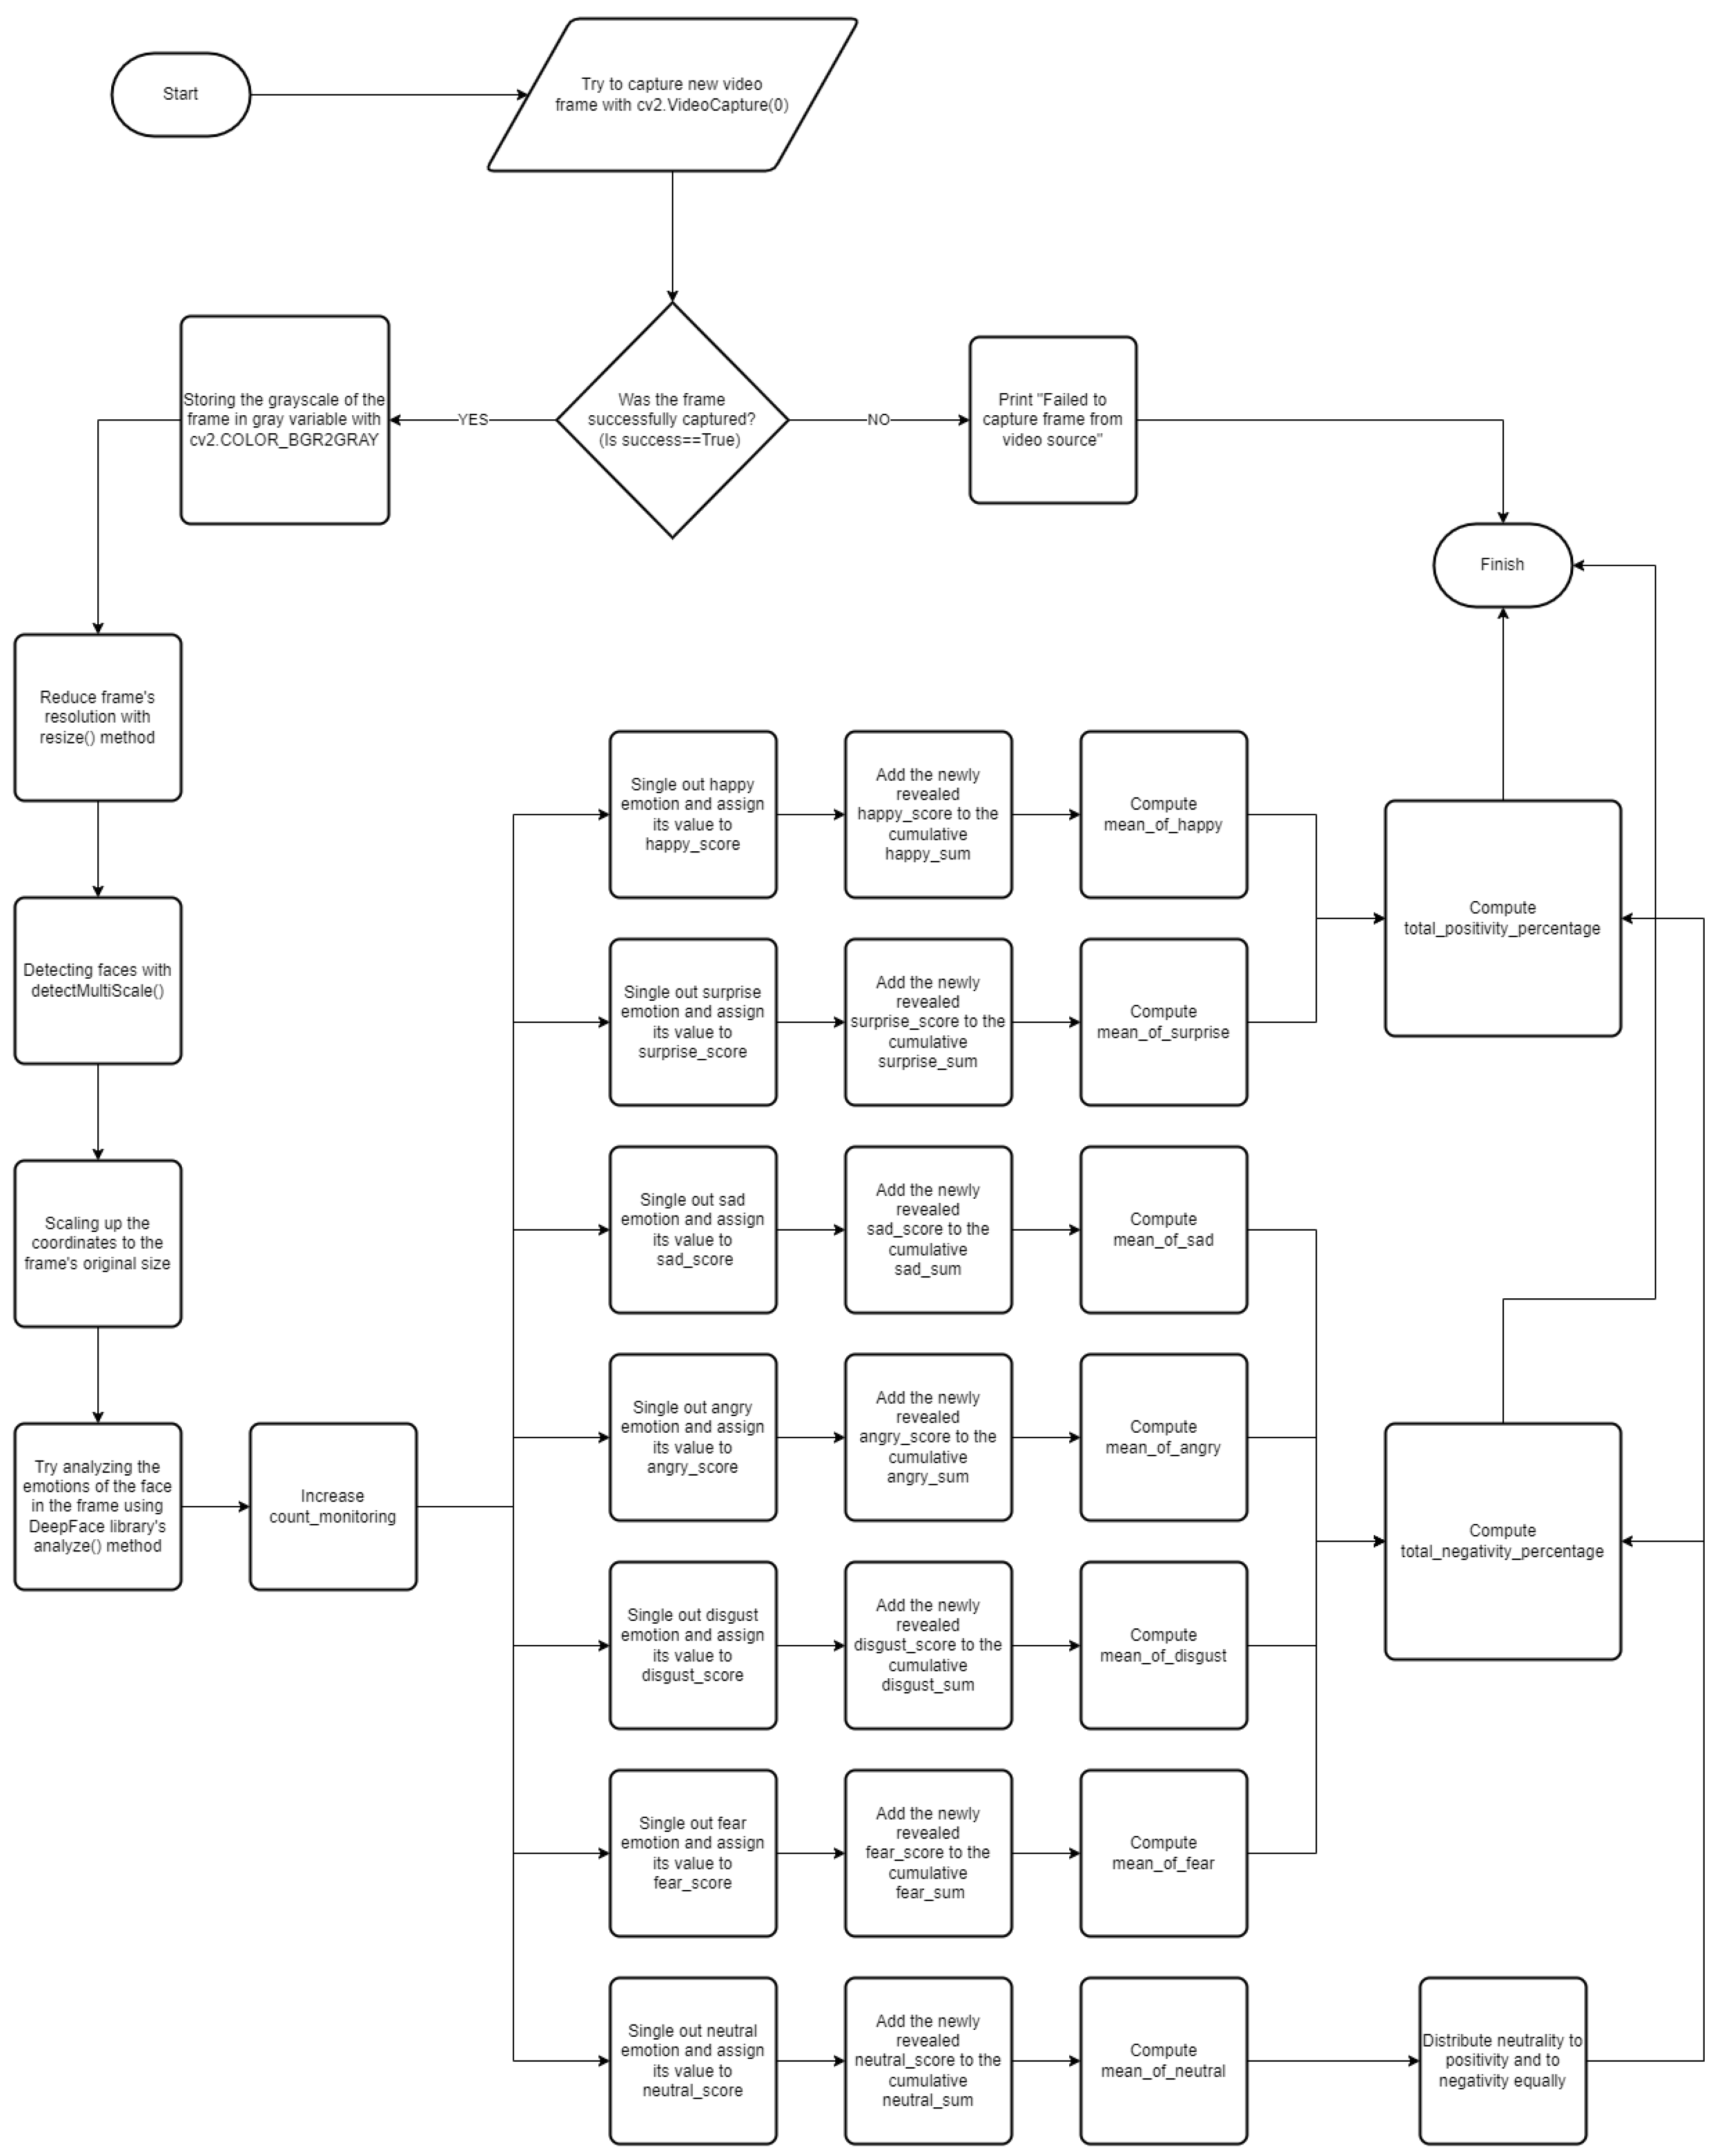
3.7.1. Computing the Cumulative Means of the Seven Emotions
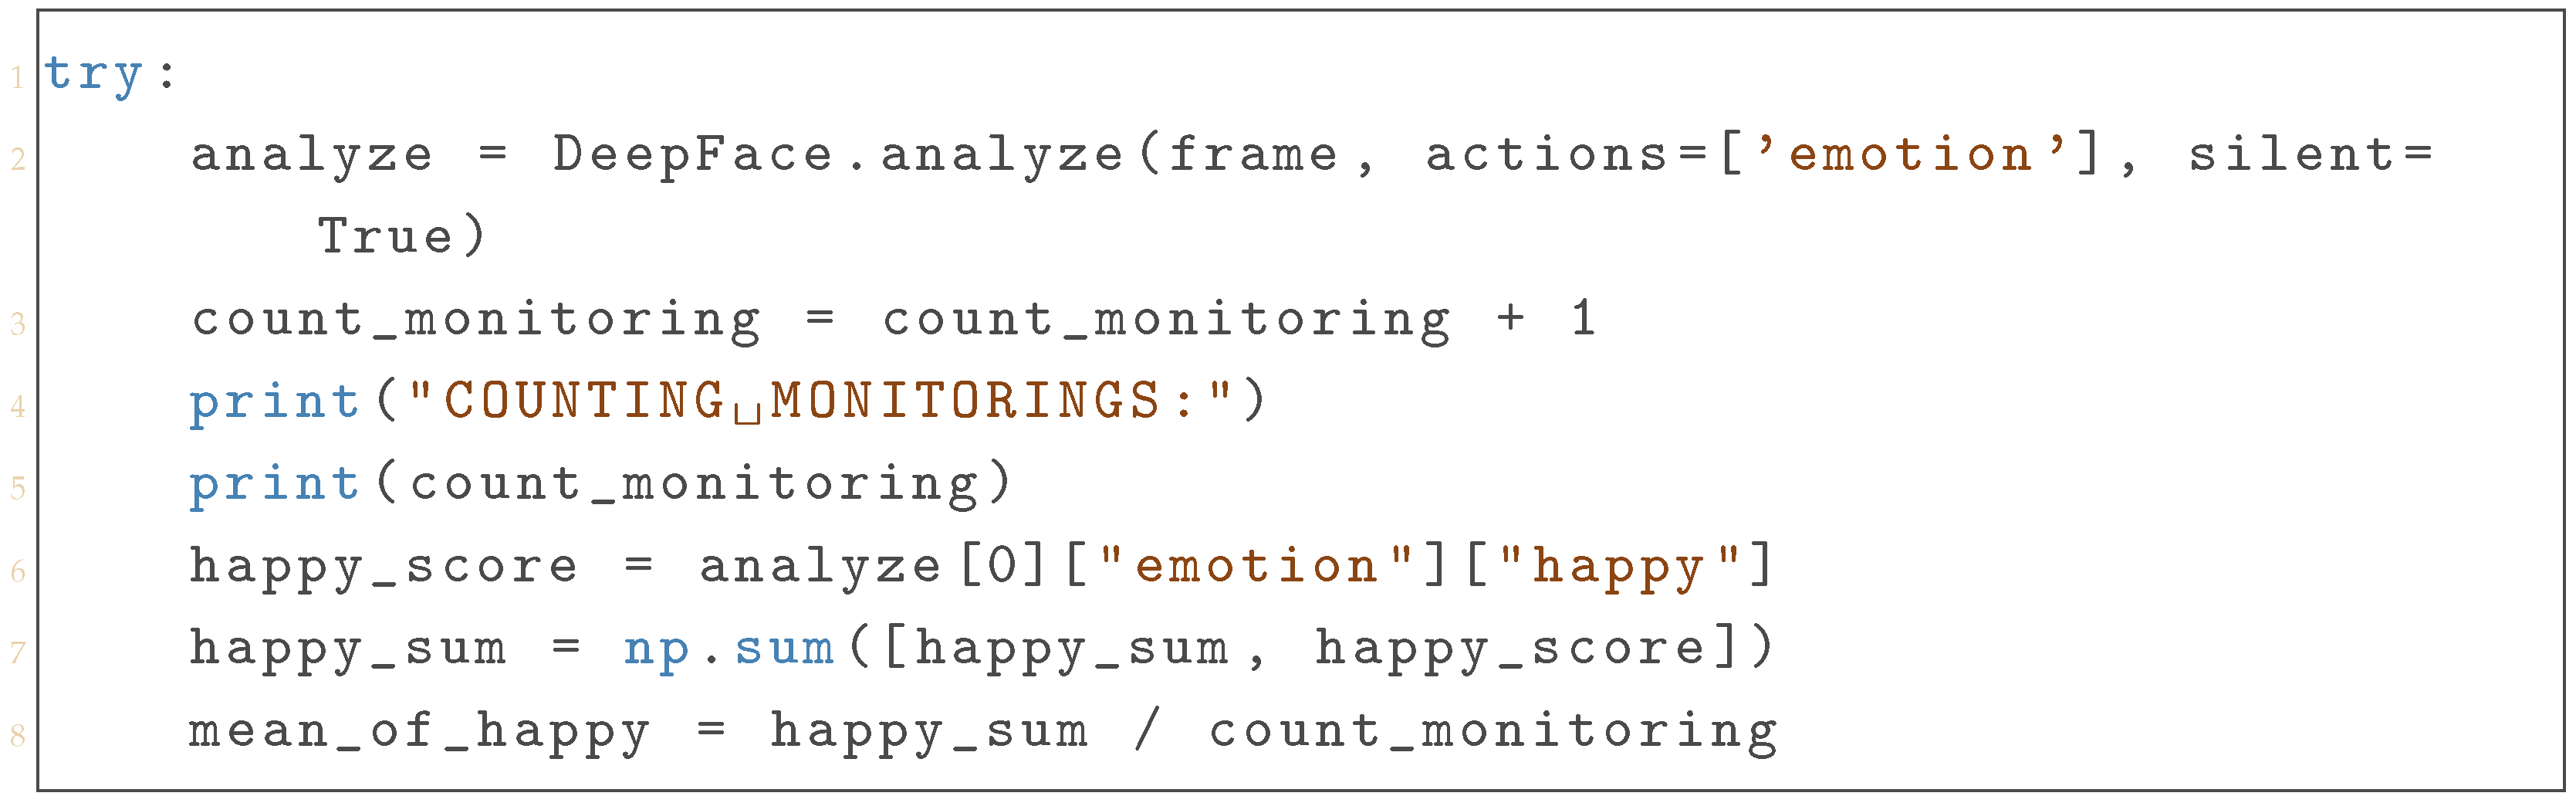
Due to the nature of the test, there was a great deal of interest in the emotions that were displayed on average throughout the reading process of the user. To obtain this result, it was necessary to retain all analysis results for each frame studied with the analyze() function as seen in Listing 11.
A count_monitoring variable was used to record the number of frames that the system has analyzed up to that point in time while also displaying this information in the terminal for the user to see in real time. The variable analyzed is the result of the calling of the DeepFace.analyze() function, the [0] index referring to the fact that only the first revealed face will be accessed in the case when multiple faces were detected in the same frame. The [emotion] key is used to specifically access the emotions section within the result. The [happy] key represents the emotion category to be retrieved from the analysis result.
Once extracted, the happy_score will be added to happy_sum, retaining the total sum of all happy_scores revealed until that iteration. Having the total sums and the count_monitoring variable containing the number of performed iterations, it will be possible to compute the mean_of_happy until that specific point in time of the realized recording process. The same procedure was implemented for all of the seven different revealed emotions in order to compute their respective means.
| Listing 11. Facial Emotion Analysis with DeepFace and Tracking Happiness Scores. |
 |
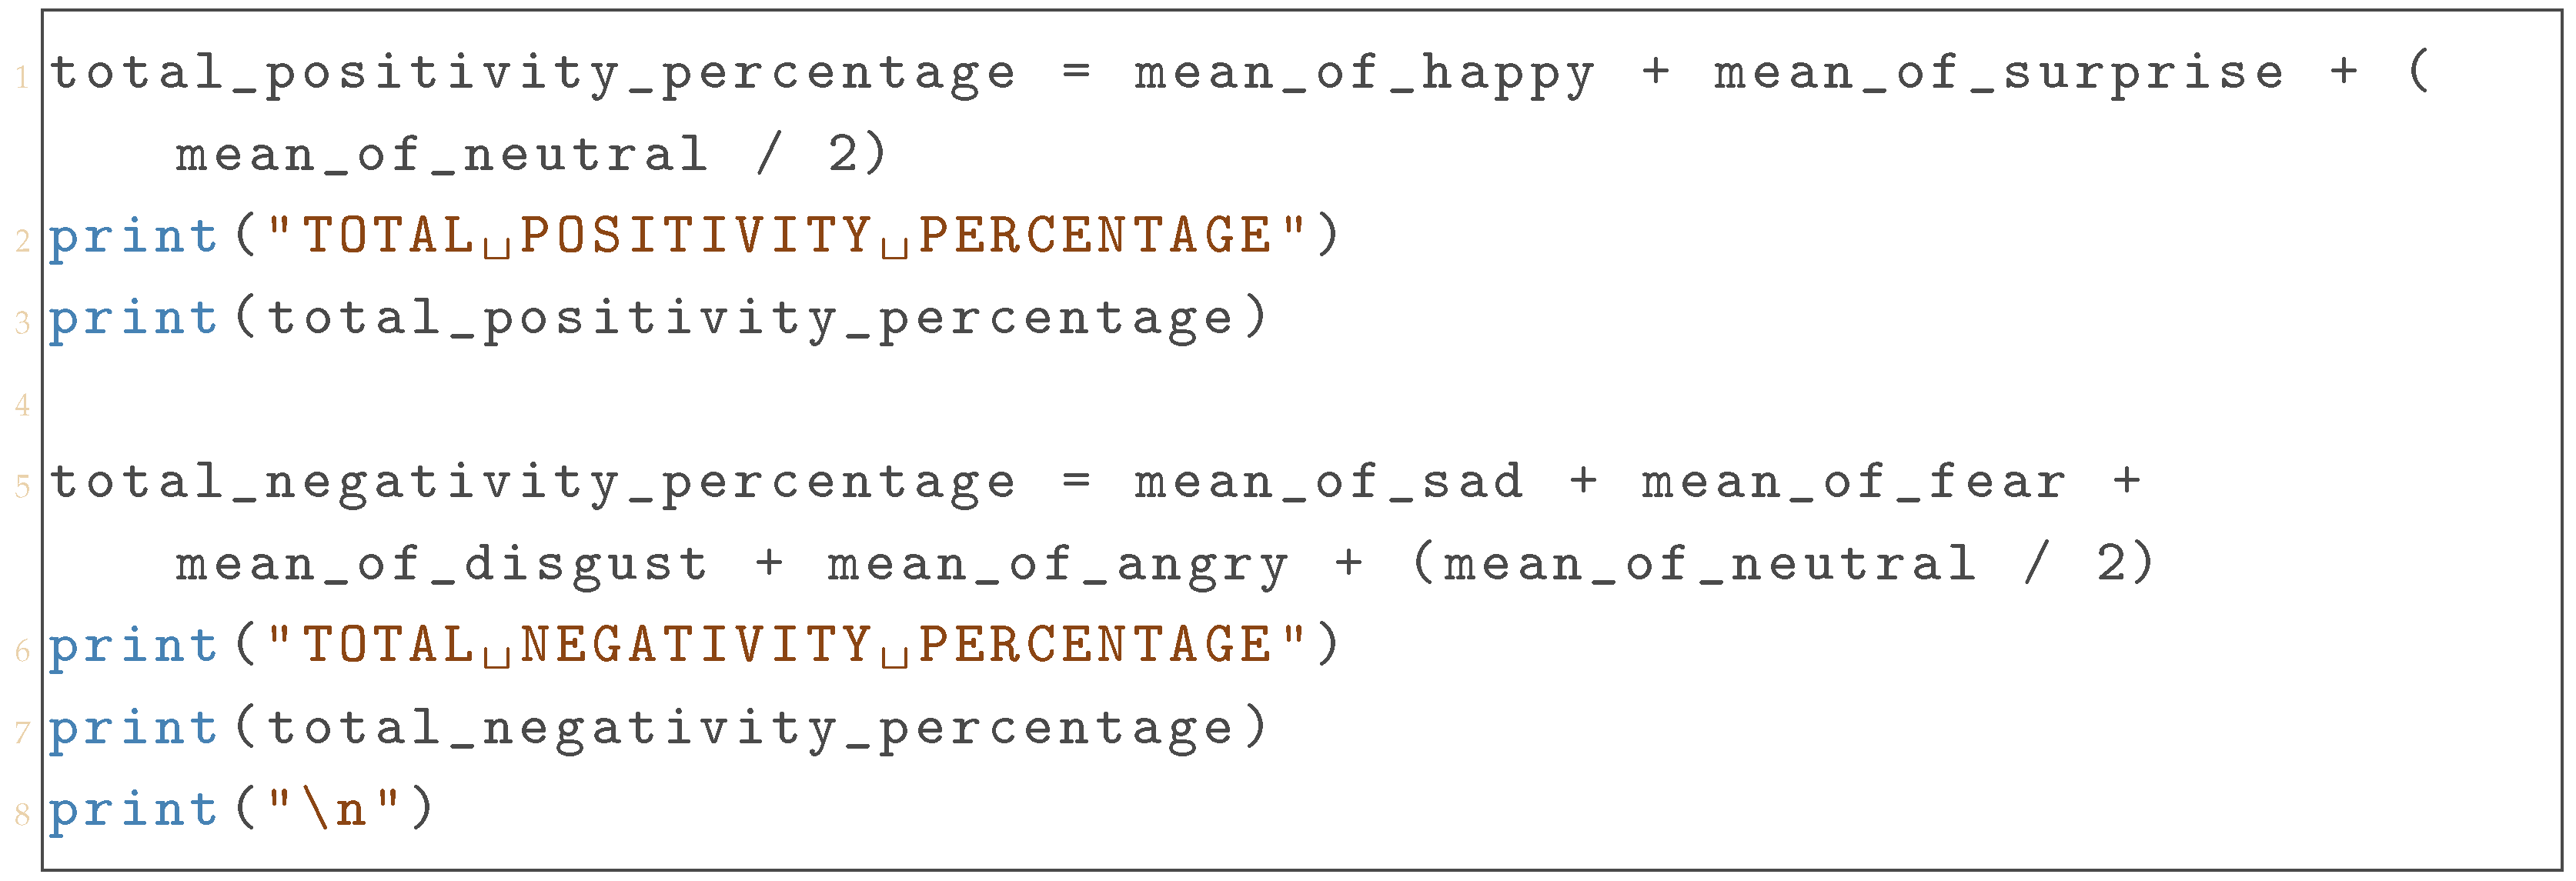
3.7.2. Computing Total Positive and Total Negative Percentages
As presented in Listing 12, having computed the means of each revealed emotion, the system will provide a total positivity percentage, which is the sum of mean_of_happy, mean_of_surprise, and half of mean_of_neutral and a total negativity percentage, which is the sum of mean_of_sad, mean_of_fear, mean_of_disgust, mean_of_angry, and half of mean_of_neutral. All these calculations were performed based on the fact that each provided emotion score that was added to the <emotion>_sum variables during the recording was in the form of a percentage of the total emotional palette subdivided into seven emotional percentages, with the sum of the seven always equal to 100%.
| Listing 12. Calculating and Printing Total Positivity and Negativity Percentages from Facial Microexpressions. |
 |
The figure shows a flowchart that represents all these computations and includes facial emotion monitoring in Figure 10.
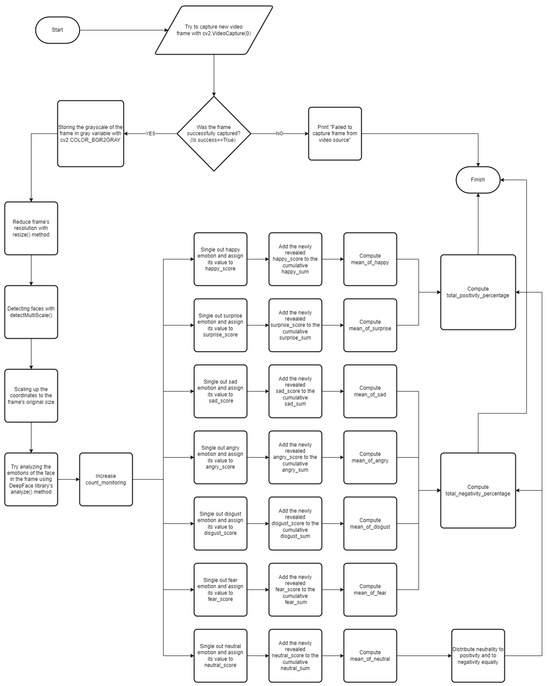
Figure 10.
Flowchart of emotion monitoring and final computations of total positivity and total negativity.
3.7.3. Converting Afinn Total Scores into Percentages
Due to the positivity score of text being the average Afinn score computed by summing all the scores of each individual word after the text tidying and dividing the result into the number of words, its value will always be between −5 and 5. In order to convert the result into percentages, the computePositivity() function was used. The function was ideated following the next thought process:
- The two numerical domains to take into consideration were from −5 to 5 and from 0 to 100, with them being connected as follows: whenever the score hit −5, the percentile would hit 0%; at −4, the percentile would be 10%; at 0 it would be 50%, and so on until the score 5, which is 100%;
- This relation could be exemplified with the equation of a straight line having the domain of x ranging from −5 to 5 and the codomain of y ranging from 0 to 100;
- With the equation beingand having the two particular cases of one of the two variables x and y being 0, it could be noted that m was 50 from
- Now, from the case of y being 0, x being −5, and m being 50, it is demonstrated that a must be 10;
- The resulting function is
Thus, the displayed positive value will be the result returned from the computePositivity() function, taking as parameter positivityofscore, while the displayed negativeity will be the difference between 100 symbolizing the totality of the emotional palette and all positive emotions, computePositivity(positivityofscore).
3.7.4. Compatibility Between Sentiment Analysis and Facial Emotion Monitoring Models
Once we have the total positivity scores of the sentiment analysis of the text and the facial emotional monitoring as percentages, the compatibility of the two results can be calculated subtracting from the total 100 the magnitude of the difference between the two as presented in Listing 13.
| Listing 13. Computing and Displaying Compatibility Based on Positivity Score Differences. |
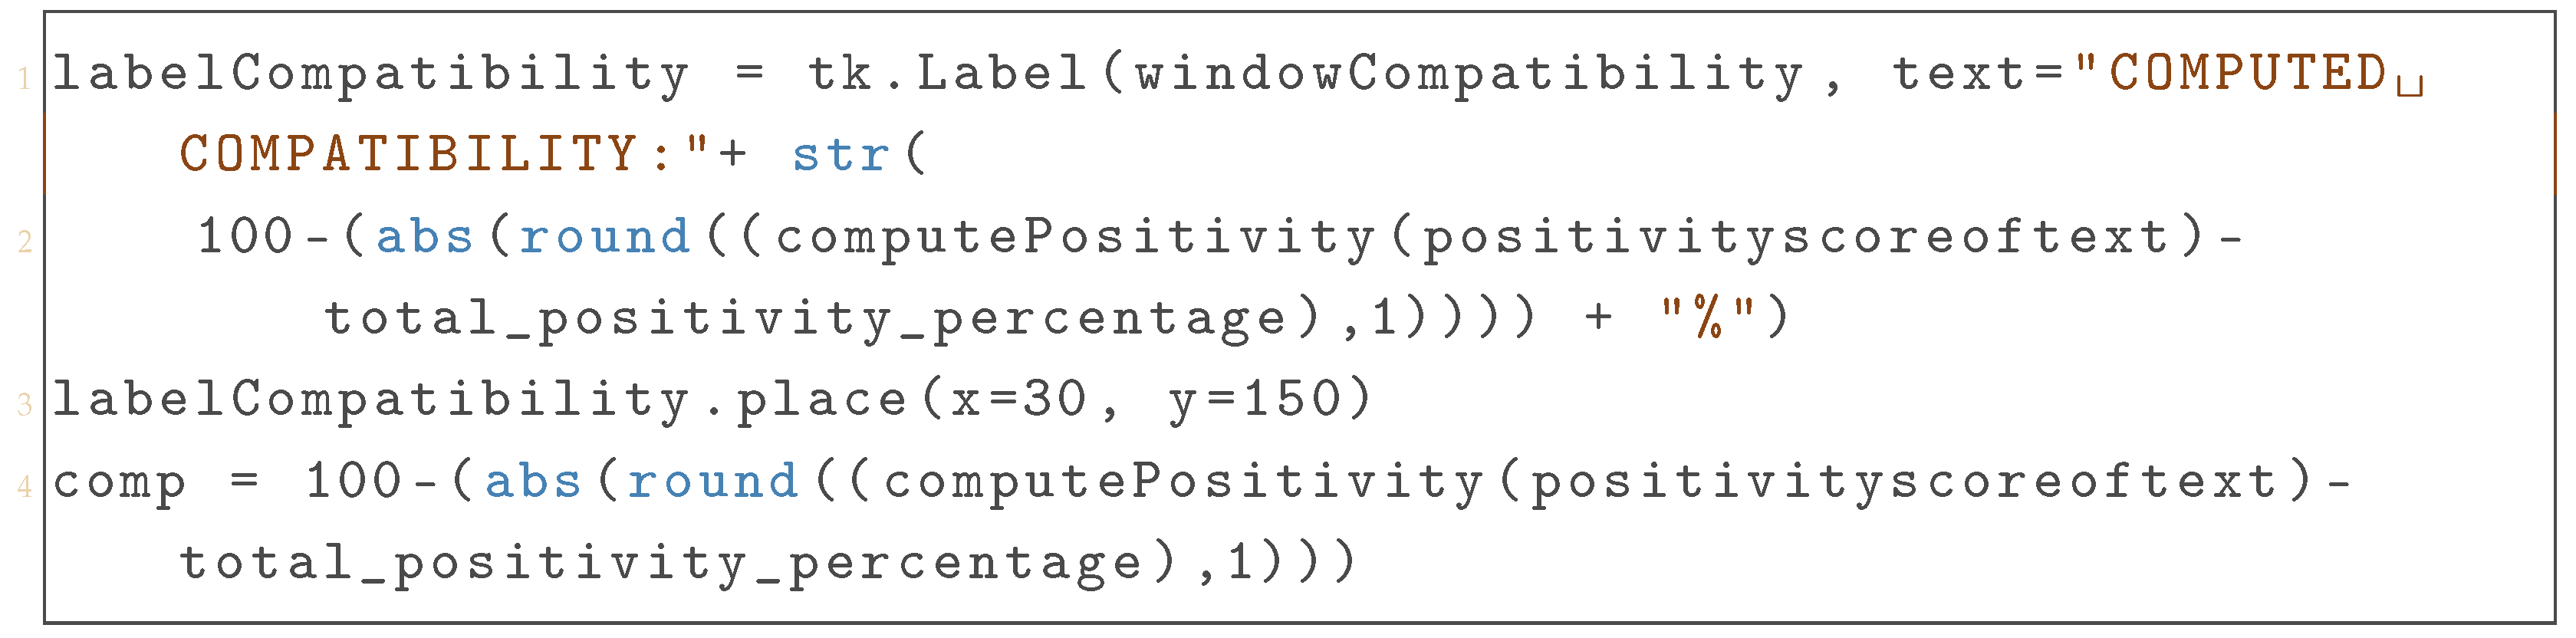 |
The compatibility between the two cross-field machine learning models was computed utilizing the following formula:
the final compatibility is the result obtained by subtracting from the full percentage of 100 the absolute value of the difference between the previously computed positivity percentage of the monitored facial emotion reactions and the revealed percentage of positivity after the sentiment analysis of the text.
Finally, the framework of this system can be adjusted in order to compare different text sentiment analysis and facial emotion recognition models to compute their respective compatibilities.
4. Research Results
Various statistical studies were conducted using the proposed system in order to validate the compatibility of the two machine learning models that detect emotional reactions. The experiment involved the participation of five subjects, each reading four different proposed texts while being monitored.
The main results of the readings are shown in Table 2. Each row represents a different test taker, while the columns represent the sentiment-analyzed texts. The table presents the final computed compatibility between the sentiment analysis of each text and the facial emotion recognition model’s reading for each subject.
Table 2.
The compatibilities between the sentiment analysis and the facial emotion recognition models.
As shown in Table 3, the average compatibilities for each of the chosen texts are relatively high, ranging from a minimum of 74.60% to a maximum of 81.35%, suggesting a good level of correlation between the sentiment analysis model and the general consensus of the subject pool.
Table 3.
Average measured compatibility for each text.
A study specifically targeting the average compatibilities revealed for each subject (Table 2) demonstrates the differentiation of the average facial emotional response to written text, suggesting a degree of subjectivity in the study specifically due to the increased expressiveness of subject number 4 scoring an average of 97.15%. It is also notable that the mean of all average compatibilities per subject was computed resulting in a 78.62% degree of overall compatibility between the sentiment analysis and the facial emotion recognition models.
Table 4 further articulates the complexity of studies regarding emotional responses over written text by individuating potential influencing parameters of compatibility such as gender, light-level intensity, and nationality. Male subjects have generally shown a lower degree of compatibility with the expected emotional response compared to females by a degree of 7.36%. The intensity of the light level was also measured during the experiment, which was carried out in two different laboratories lit differently. The results highlight a higher general degree of compatibility revealed in subjects taking the test in environments with a light intensity level of 280 LUX, while the general revealed compatibility was significantly smaller under a light level intensity of 160 LUX. Nationality was also a relevant parameter, with subjects of French nationality having an overall smaller compatibility with the showcased texts.
Table 4.
Means of compatibilities by category.
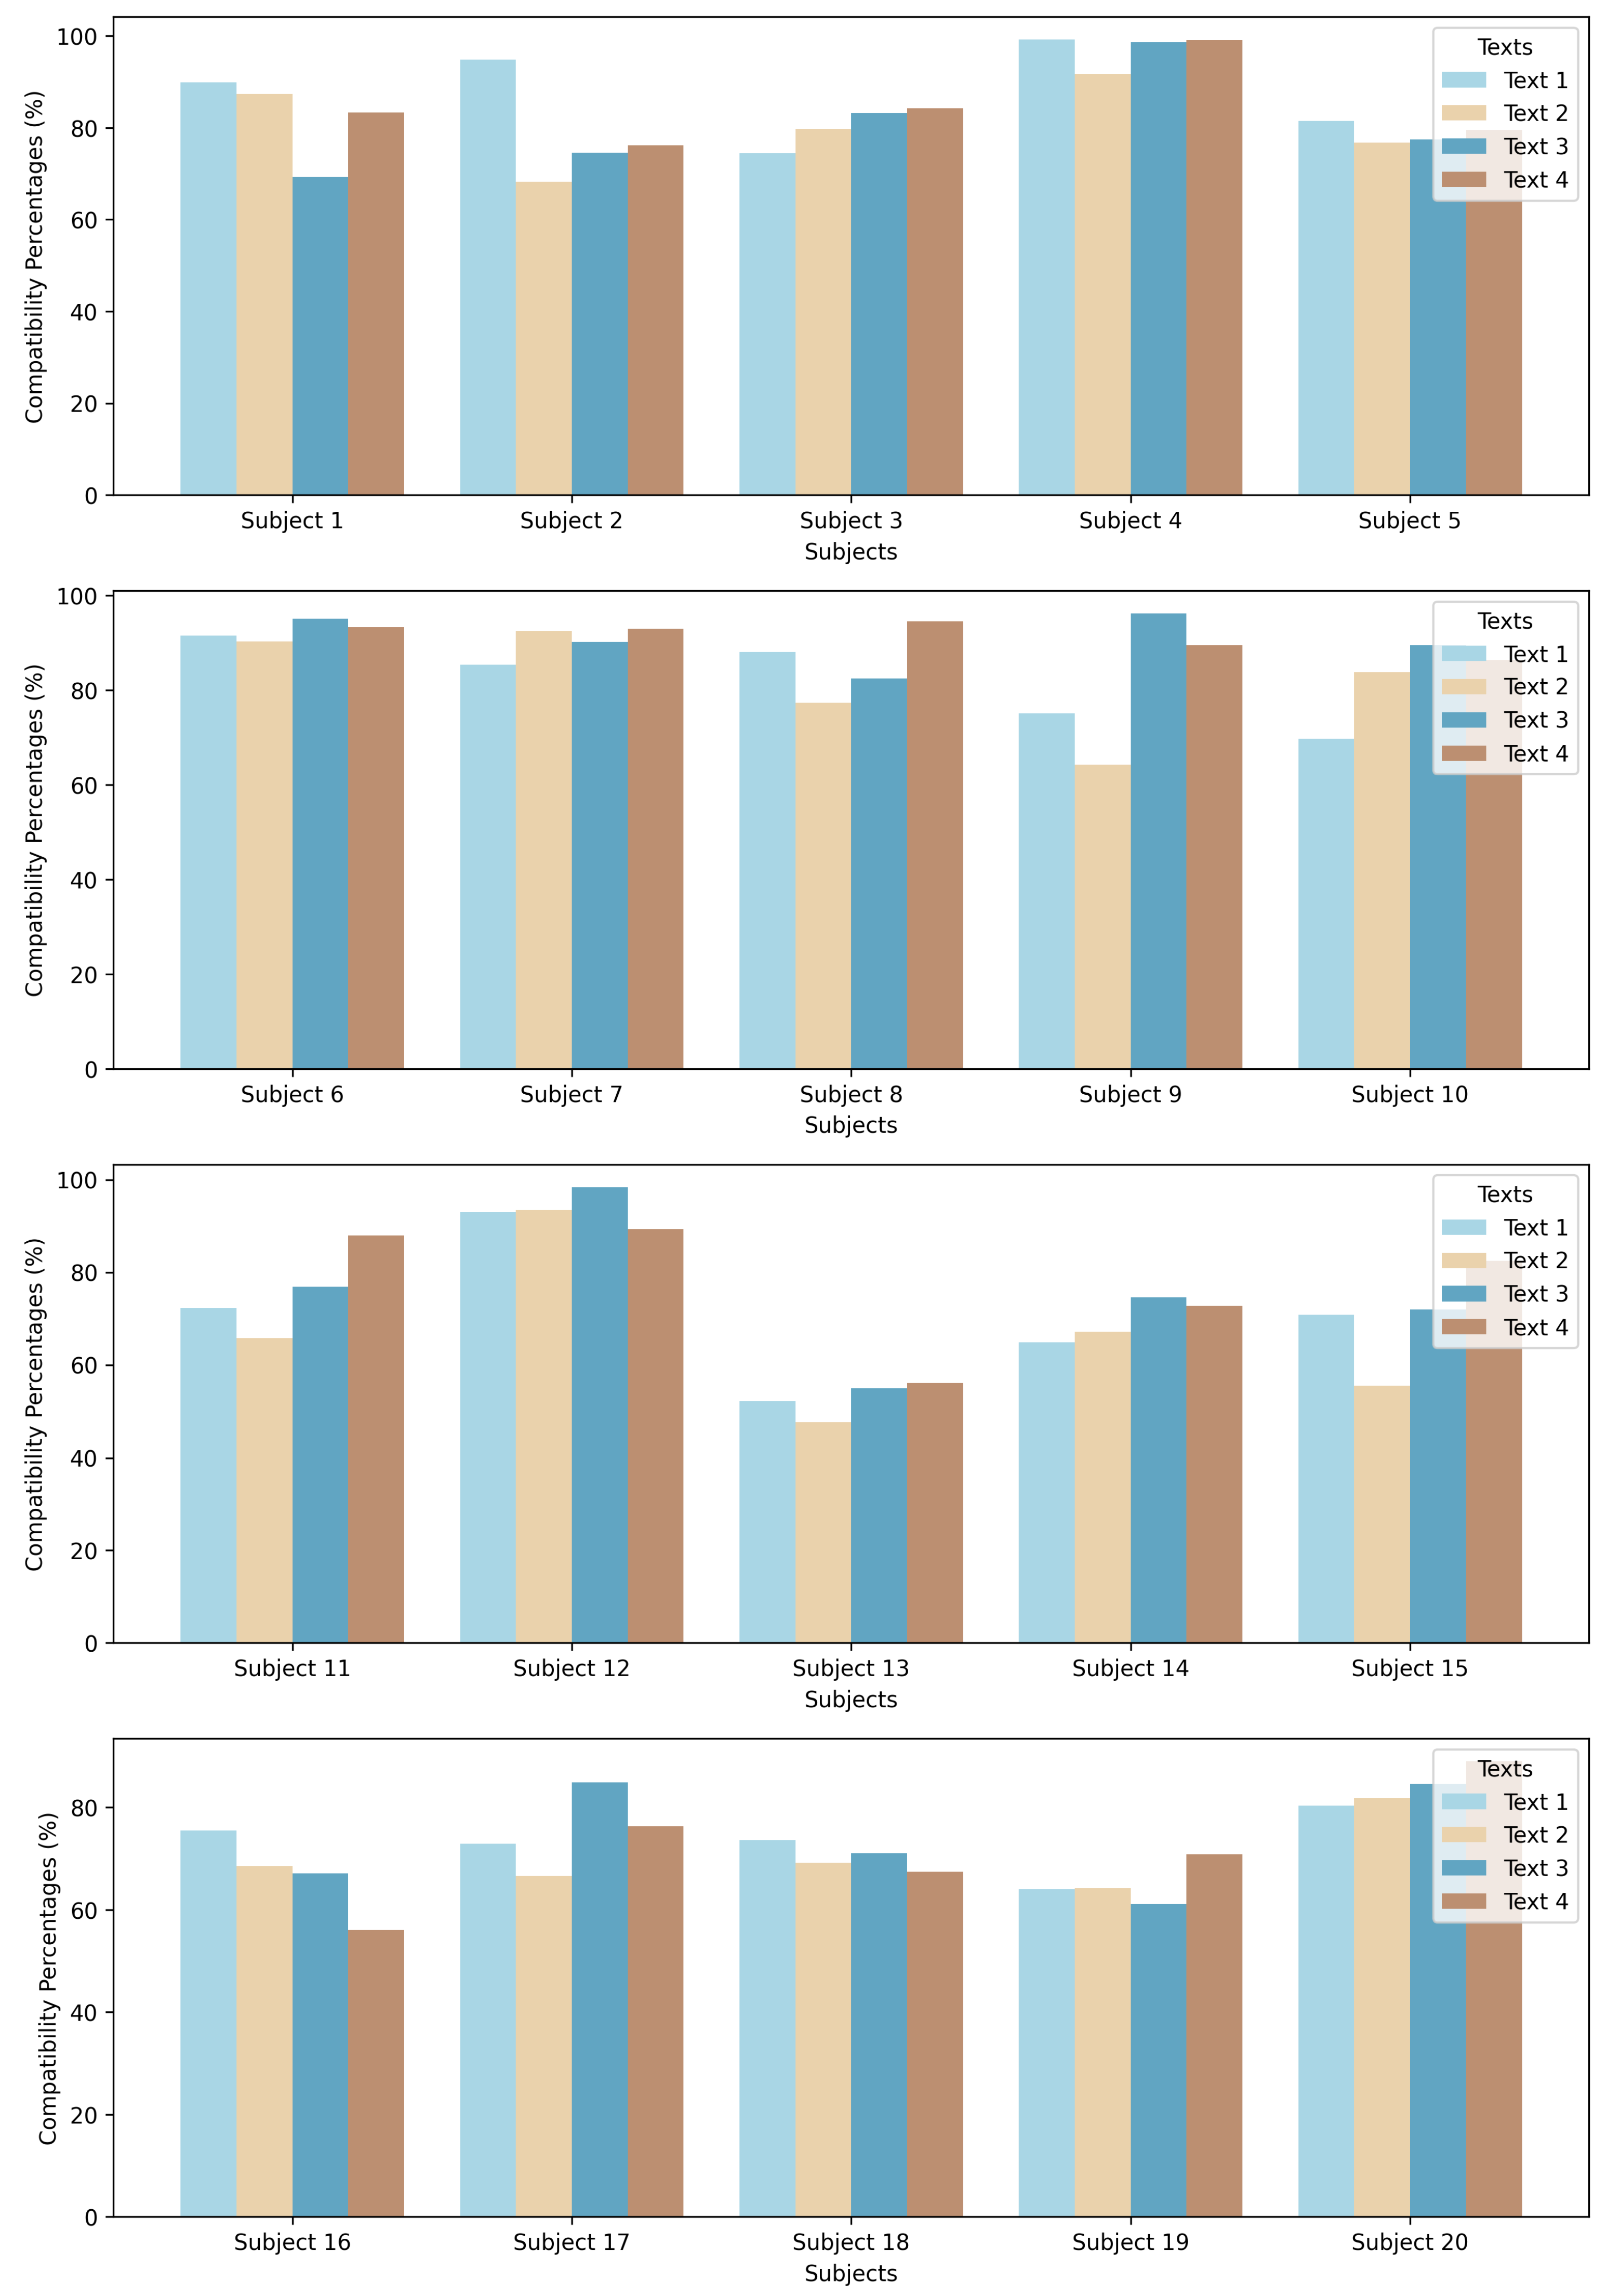
In order to further identify trends of compatibility, a chart, Figure 11, is provided plotting for each subject the computed compatibilities relative to the four studied texts.
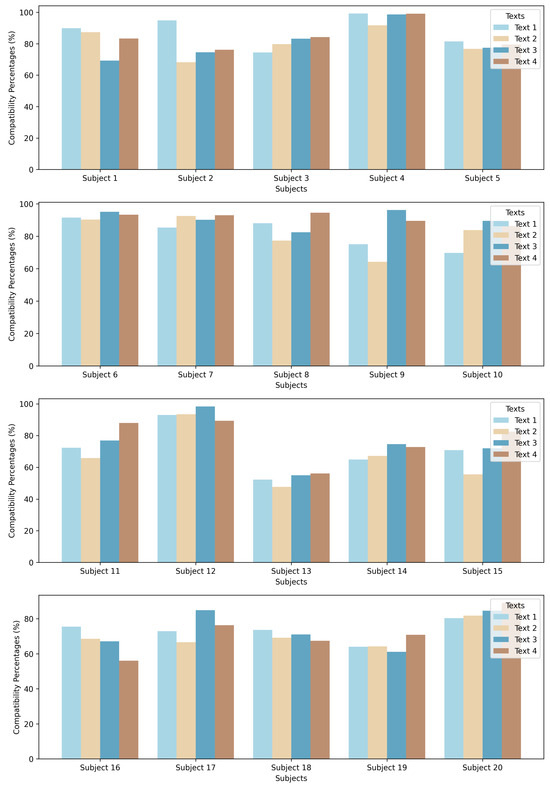
Figure 11.
Compatibility patterns for each subject.
Some revealing tendencies can be observed by the increasing scope of texts 2, 3, and 4, suggesting that the majority of subjects had a similar ratio of compatibility between the three even though they had different individual compatibility scores. The difference between the three texts is relatively small and the compatibility computed for text 2 is smaller than that of text 3, which is smaller than that of text 4. Another trend can be observed in a significantly higher compatibility score for the first text in the majority of subjects.
This particular chart reinforces the fact that compatibility is directly influenced by the specific written text proposed and that although certain subjects may showcase particularly high levels of compatibility (e.g., subject 4), the ratios between the compatibilities of different texts stays relatively constant between different subjects.
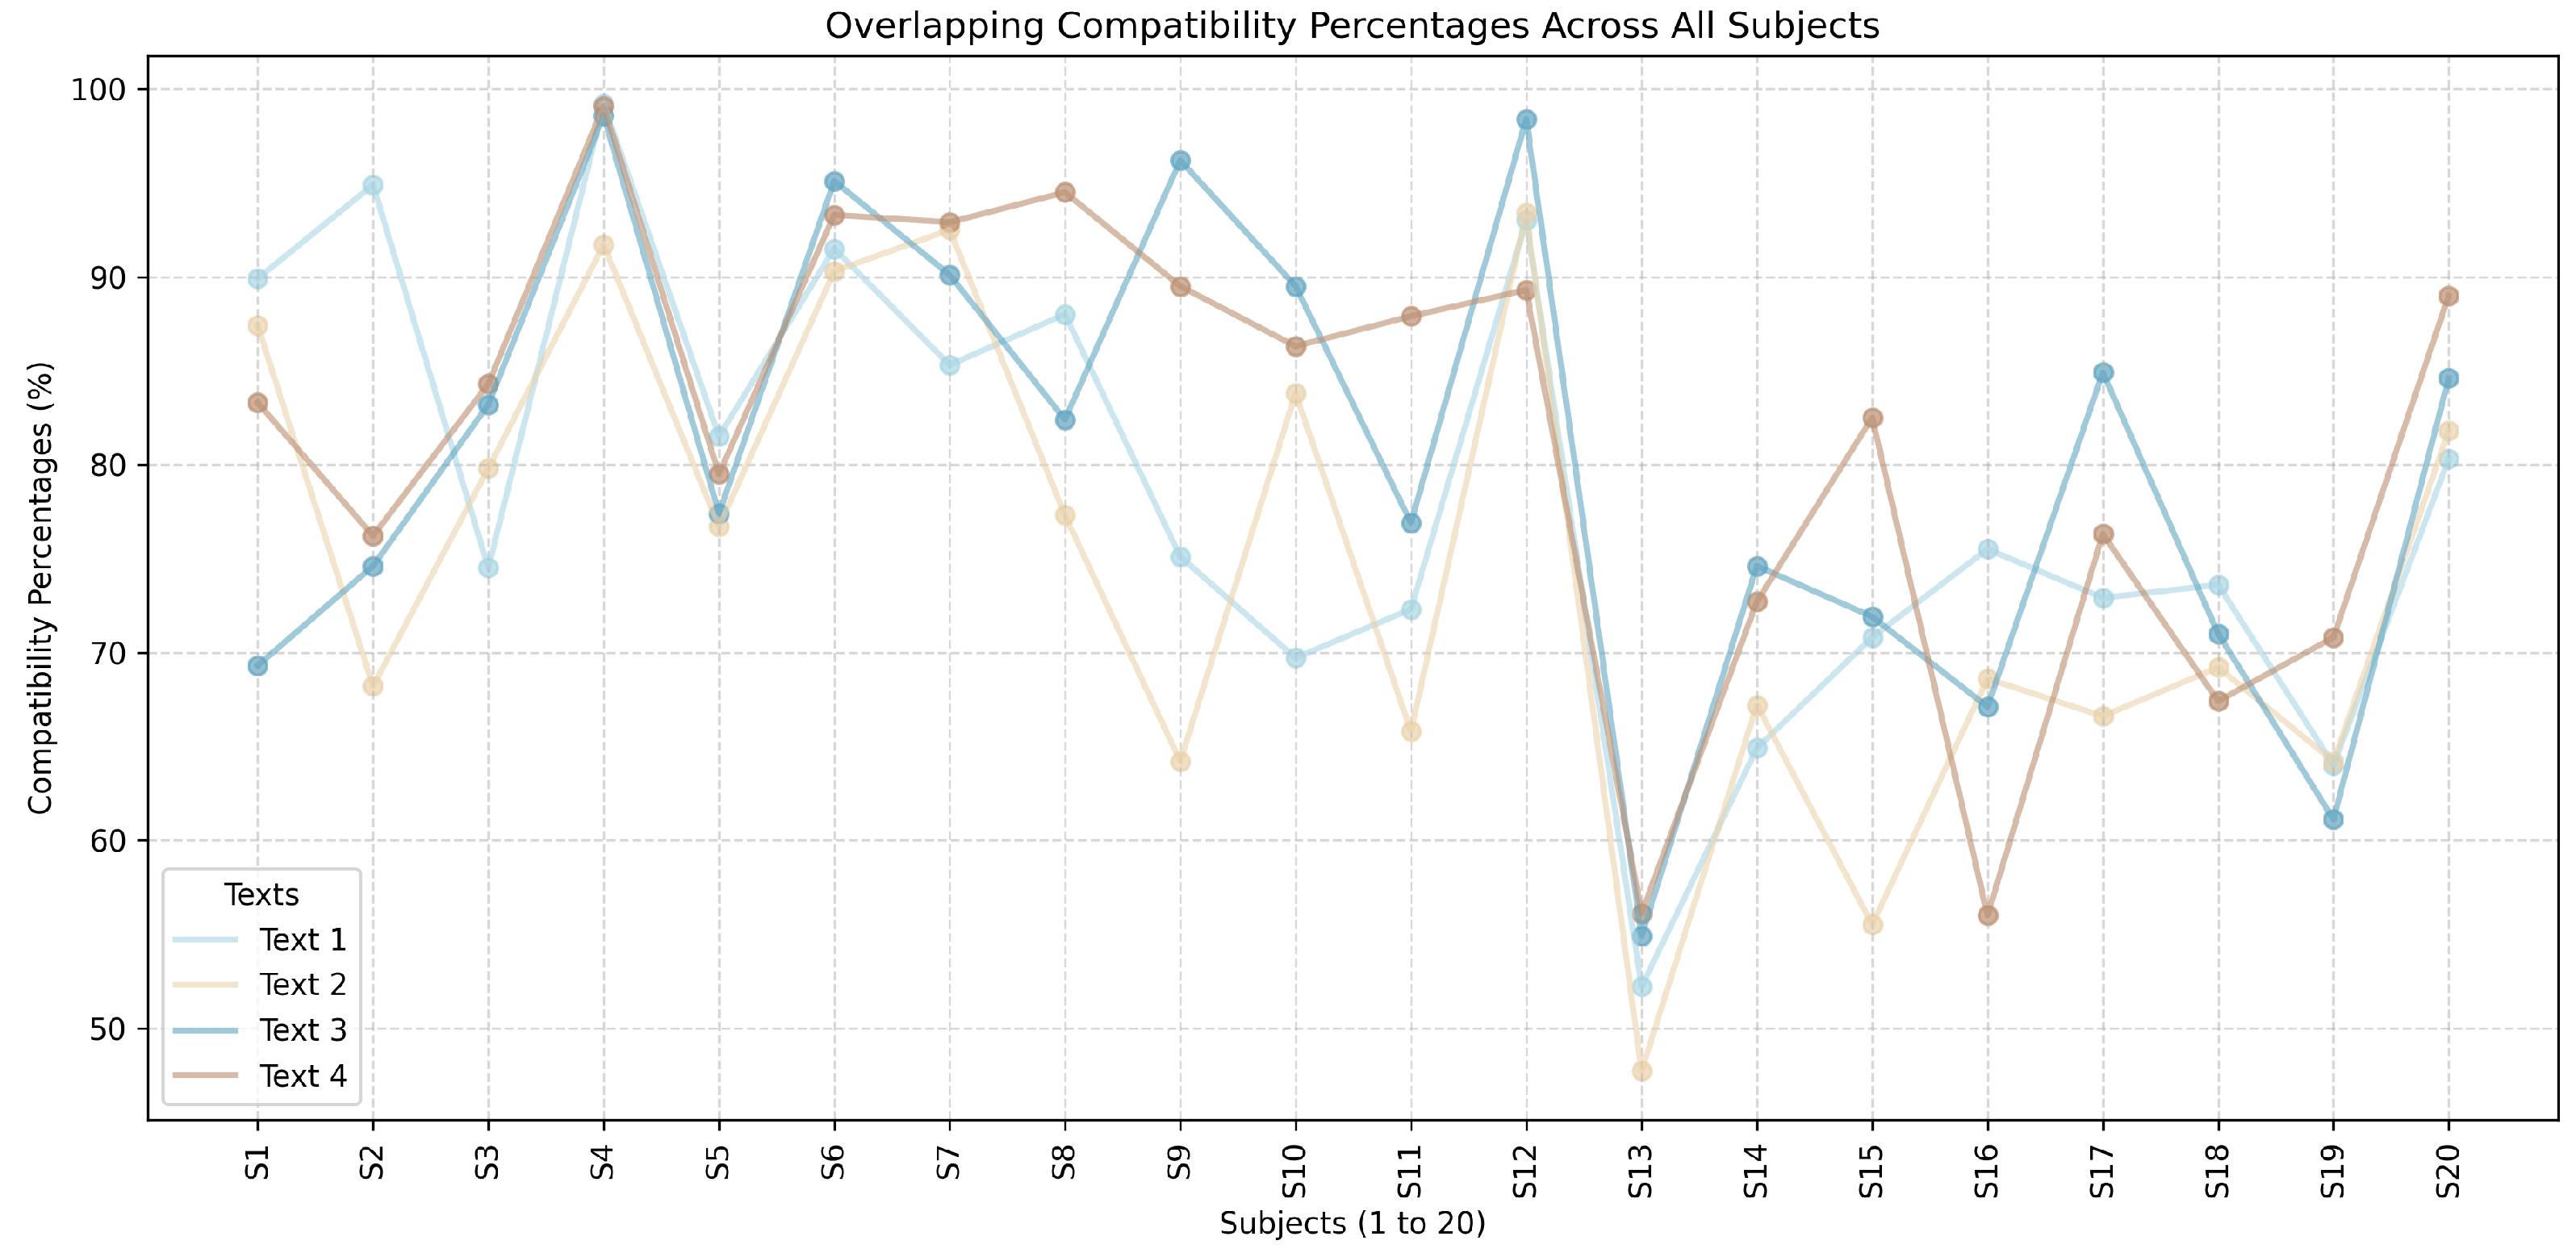
For the majority of subjects, text 4 tends to result in the highest compatibility, being closely followed by text 1. Although moderately compatible, text 3 remains consistently higher than text 2, which has the lowest scores overall. The described patterns are consistent among almost all subjects. A plot showcasing all the compatibility patterns overlapped. Figure 12 was created in order to facilitate the study of all subjects’ responses, indicating a general trend of compatibility per texts while also highlighting the influence the light intensity of the room had on the experiment, with lower degrees of compatibility being noticed in less lighted rooms.
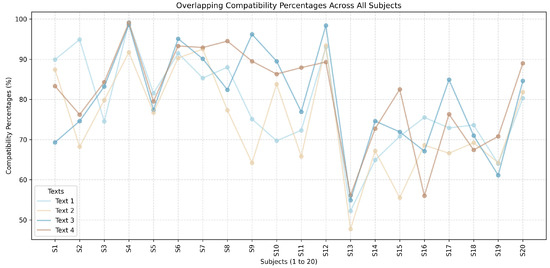
Figure 12.
Plot of compatibilities overlapping.
An important study parameter was the compatibility range for each subject, which is the difference between the lowest compatibility and the highest compatibility considering any text on a particular subject. This statistic may be used in further developments by individuating a degree of reliability per individual subject based on the subject’s predisposition of having a higher or lower range of variation.
As presented in the above Table 5, the range of compatibility variation is highly subjective. While there are subjects presenting a relatively constant compatibility level with the results of the proposed sentiment analysis model (e.g., subjects 3, 4, and 5), others showcase higher variations (e.g., subjects 1 and 2). It is also notable that the lowest compatibility of the entire set of tests was 47.7% and the highest 99.2%, while the means of all the lowest compatibilities and the highest compatibilities were 71.09% and 85.565% respectively, revealing overall high levels of compatibility. The experiment highlights a degree of stability in the measurements, with the arithmetic mean of all the compatibility fluctuation ranges being 14.475%. Finally, the mean of all average compatibilities from all subjects was 78.62%.
Table 5.
Range of compatibility variation for each subject.
5. Conclusions
Our proposed system includes all the necessary characteristics of an IoT system, such as managing data acquisition through the use of a Pi Camera module connected to a Raspberry Pi 4 board; communicating with Firebase leveraging protocols like HTTPS and WebSocket, ensuring the interaction in real time between cloud services such as Authentication or Realtime Database and various devices; implementing an edge device by using the Raspberry Pi 4 board for local data processing in order to reduce bandwidth usage and latency; and finally, integrating a cloud-based infrastructure like Firebase for authentication, data storage, or real-time updates.
By implementing both a sentiment analysis machine learning model based on the Afinn score and a facial emotion recognition model leveraging DeepFace, our system provides a framework capable of comparing cross-field models to assess their reliability, covering a research gap in emotion monitoring studies and highlighting the possibility of utilizing models from different fields in interconnection to improve their accuracy.
By analyzing the results after using the system on 20 different subjects with four texts, different trends and valuable statistics were found, such as a very high general compatibility between the two studied models (around 80%), the average compatibilities for each tester and for each subject, a compatibility pattern independent of the personal intensity of compatibility of each subject (suggesting a dependency strictly connected to the contents of the texts), and finally, the range of variation in the compatibility per subject tested.
Future work may consist of testing different machine learning model combinations in order to classify the most accurate sentiment analysis and facial emotion recognition methodologies. Different parameters such as cultural background or level of studies may also have an impact on the study, with subjects who have majored in humanistic fields possibly having a different degree of comprehension of the text and therefore of the facial response.
Author Contributions
Conceptualization, S.-I.P. and R.B.; methodology, S.-I.P. and R.B.; software, S.-I.P.; validation, S.-I.P., R.B., M.-E.I., and S.N.; formal analysis, S.-I.P.; investigation, S.-I.P.; resources, R.B. and M.M.; data curation, S.-I.P.; writing—original draft preparation, S.-I.P.; writing—review and editing, R.B., M.-E.I., S.N., and M.M.; visualization, S.-I.P.; supervision, R.B. and M.M.; system administration, S.-I.P., R.B., and M.M. All authors have read and agreed to the published version of the manuscript.
Funding
This research received no external funding.
Informed Consent Statement
Informed consent was obtained from all subjects involved in the study. Written informed consent has been obtained from the test takers to publish this paper.
Data Availability Statement
The data presented in this study are available in the article.
Conflicts of Interest
The authors declare no conflicts of interest.
References
- Hirt, F.; Werlen, E.; Moser, I.; Bergamin, P. Measuring emotions during learning: Lack of coherence between automated facial emotion recognition and emotional experience. Open Comput. Sci. 2019, 9, 308–317. [Google Scholar] [CrossRef]
- Hirt, F.S.; Moser, I.; Werlen, E.; Imhof, C.; Bergamin, P. A comparison of students’ emotional self-reports with automated facial emotion recognition in a reading situation. In Proceedings of the Sixth International Conference on Technological Ecosystems for Enhancing Multiculturality, Salamanca, Spain, 24–26 October 2018; ACM: New York, NY, USA, 2018; pp. 320–327. [Google Scholar] [CrossRef]
- Liu, T.L.; Wang, P.W.; Yang, Y.H.C.; Shyi, G.C.W.; Yen, C.F. Association between facial emotion recognition and bullying involvement among adolescents with high-functioning autism spectrum disorder. Int. J. Environ. Res. Public Health 2019, 16, 5125. [Google Scholar] [CrossRef]
- Yeung, M.K. A systematic review and meta-analysis of facial emotion recognition in autism spectrum disorder: The specificity of deficits and the role of task characteristics. Neurosci. Biobehav. Rev. 2022, 133, 104518. [Google Scholar] [CrossRef]
- Wieckowski, A.T.; Flynn, L.T.; Richey, J.A.; Gracanin, D.; White, S.W. Measuring change in facial emotion recognition in individuals with autism spectrum disorder: A systematic review. Autism 2020, 24, 1607–1628. [Google Scholar] [CrossRef] [PubMed]
- Black, M.H.; Chen, N.T.; Lipp, O.V.; Bölte, S.; Girdler, S. Complex facial emotion recognition and atypical gaze patterns in autistic adults. Autism 2020, 24, 258–262. [Google Scholar] [CrossRef] [PubMed]
- Zantalis, F.; Koulouras, G.; Karabetsos, S.; Kandris, D. A review of machine learning and IoT in smart transportation. Future Internet 2019, 11, 94. [Google Scholar] [CrossRef]
- Kowalczuk, Z.; Czubenko, M.; Merta, T. Emotion monitoring system for drivers. IFAC-PapersOnLine 2019, 52, 200–205. [Google Scholar] [CrossRef]
- Devís, B.A.; Pocoví, M. Experiential marketing: Searching for emotional connection with consumers in POS. In Applying Neuroscience to Business Practice; IGI Global: Hershey, PA, USA, 2017; pp. 63–81. [Google Scholar] [CrossRef]
- Krishnadas, A.; Nithin, S. A comparative study of machine learning and deep learning algorithms for recognizing facial emotions. In Proceedings of the 2021 Second International Conference on Electronics and Sustainable Communication Systems, Coimbatore, India, 4–6 August 2021; IEEE: New York, NY, USA, 2021; pp. 1506–1512. [Google Scholar] [CrossRef]
- Dalvi, C.; Rathod, M.; Patil, S.; Gite, S.; Kotecha, K. A survey of AI-based facial emotion recognition: Features, ML & DL techniques, age-wise datasets and future directions. IEEE Access 2021, 9, 165806–165840. [Google Scholar] [CrossRef]
- Bebawy, M.; Anwar, S.; Milanova, M. Active shape model vs. deep learning for facial emotion recognition in security. In Multimodal Pattern Recognition of Social Signals in Human-Computer-Interaction; Springer International Publishing: Cham, Switzerland, 2017; pp. 1–11. [Google Scholar] [CrossRef]
- Fong, G.Y.; Yun, G.P.; Ying, C.L.; Chiang, T.S. A Comparative Study: Facial Emotion Recognition by Using Deep Learning. In Proceedings of the 2024 12th International Conference on Information and Communication Technology (ICoICT), Bandung, Indonesia, 7–8 August 2024; pp. 144–151. [Google Scholar] [CrossRef]
- Abdulazeez, A.M.; Ageed, Z.S. Face Emotion Recognition Based on Machine Learning: A Review. Int. J. Informatics, Inf. Syst. Comput. Eng. (INJIISCOM) 2024, 5, 53–87. [Google Scholar] [CrossRef]
- Chan, W.N.; Thein, T. A comparative study of machine learning techniques for real-time multi-tier sentiment analysis. In Proceedings of the 2018 IEEE International Conference on Knowledge Innovation and Invention, Jeju Island, Repblic of Korea, 23–27 July 2018; IEEE: New York, NY, USA, 2018; pp. 90–93. [Google Scholar] [CrossRef]
- Van Atteveldt, W.; Van der Velden, M.A.; Boukes, M. The validity of sentiment analysis: Comparing manual annotation, crowd-coding, dictionary approaches, and machine learning algorithms. Commun. Methods Meas. 2021, 15, 121–140. [Google Scholar] [CrossRef]
- Faujdar, P.K.; SB, V.K.; Wadhwa, C. A Comparative Evaluation of Different Sentiment Analysis Algorithms for Social Media Text Analysis. In Proceedings of the 2024 2nd International Conference on Artificial Intelligence and Machine Learning Applications (AIMLA), Namakkal, India, 15–16 March 2024; Theme: Healthcare and Internet of Things. pp. 1–6. [Google Scholar] [CrossRef]
- Michailidis, P.D. A Comparative Study of Sentiment Classification Models for Greek Reviews. Big Data Cogn. Comput. 2024, 8, 107. [Google Scholar] [CrossRef]
- de Paula, D.; Alexandre, L.A. Facial Emotion Recognition for Sentiment Analysis of Social Media Data. In Iberian Conference on Pattern Recognition and Image Analysis; Springer International Publishing: Cham, Switzerland, 2022; pp. 207–217. [Google Scholar] [CrossRef]
- Guerrero, G.; Avila, D.; da Silva, F.J.M.; Pereira, A.; Fernández-Caballero, A. Internet-based identification of anxiety in university students using text and facial emotion analysis. Internet Interv. 2023, 34, 100679. [Google Scholar] [CrossRef] [PubMed]
- Mazhar, T.; Malik, M.A.; Nadeem, M.A.; Mohsan, S.A.H.; Haq, I.; Karim, F.K.; Mostafa, S.M. Movie Reviews Classification through Facial Image Recognition and Emotion Detection Using Machine Learning Methods. Symmetry 2022, 14, 2607. [Google Scholar] [CrossRef]
- Shirke, B.; Wong, J.; Libut, J.C.; George, K.; Oh, S.J. Brain-IoT Based Emotion Recognition System. In Proceedings of the 2020 10th Annual Computing and Communication Workshop and Conference (CCWC), Las Vegas, NV, USA, 6–8 January 2020; pp. 991–995. [Google Scholar] [CrossRef]
- Rozanska, A.; Rachwaniec-Szczecinska, Z.; Kawala-Janik, A.; Podpora, M. Internet of Things Embedded System for Emotion Recognition. In Proceedings of the 2018 IEEE 20th International Conference on e-Health Networking, Applications and Services (Healthcom), Ostrava, Czech Republic, 17–20 September 2018; pp. 1–5. [Google Scholar] [CrossRef]
- Awais, M.; Raza, M.; Singh, N.; Bashir, K.; Manzoor, U.; Islam, S.U.; Rodrigues, J.J. LSTM-Based Emotion Detection Using Physiological Signals: IoT Framework for Healthcare and Distance Learning in COVID-19. IEEE Internet Things J. 2020, 8, 16863–16871. [Google Scholar] [CrossRef] [PubMed]
- Majumder, A.J.A.; Mcwhorter, T.M.; Ni, Y.; Nie, H.; Iarve, J.; Ucci, D.R. sEmoD: A Personalized Emotion Detection Using a Smart Holistic Embedded IoT System. In Proceedings of the 2019 IEEE 43rd Annual Computer Software and Applications Conference (COMPSAC), Milwaukee, WI, USA, 15–19 July 2019; Volume 1, pp. 850–859. [Google Scholar] [CrossRef]
- Alam, H.; Burhan, M.; Gillani, A.; Haq, I.U.; Arshed, M.A.; Shafi, M.; Ahmad, S. IoT-Based Smart Baby Monitoring System with Emotion Recognition Using Machine Learning. Wirel. Commun. Mob. Comput. 2023, 2023, 1175450. [Google Scholar] [CrossRef]
- Meng, W.; Cai, Y.; Yang, L.T.; Chiu, W.Y. Hybrid Emotion-Aware Monitoring System Based on Brainwaves for Internet of Medical Things. IEEE Internet Things J. 2021, 8, 16014–16022. [Google Scholar] [CrossRef]
- Gutierrez Maestro, E.; De Almeida, T.R.; Schaffernicht, E.; Martinez Mozos, Ó. Wearable-Based Intelligent Emotion Monitoring in Older Adults during Daily Life Activities. Appl. Sci. 2023, 13, 5637. [Google Scholar] [CrossRef]
- Chen, J.; Dey, S.; Wang, L.; Bi, N.; Liu, P. Attention-Based Multi-Modal Multi-View Fusion Approach for Driver Facial Expression Recognition. IEEE Access 2024. [Google Scholar] [CrossRef]
- Nie, J.; Liu, Y.; Hu, Y.; Wang, Y.; Xia, S.; Preindl, M.; Jiang, X. SPIDERS+: A Light-Weight, Wireless, and Low-Cost Glasses-Based Wearable Platform for Emotion Sensing and Bio-Signal Acquisition. Pervasive Mob. Comput. 2021, 75, 101424. [Google Scholar] [CrossRef]

Disclaimer/Publisher’s Note: The statements, opinions and data contained in all publications are solely those of the individual author(s) and contributor(s) and not of MDPI and/or the editor(s). MDPI and/or the editor(s) disclaim responsibility for any injury to people or property resulting from any ideas, methods, instructions or products referred to in the content. |
© 2024 by the authors. Licensee MDPI, Basel, Switzerland. This article is an open access article distributed under the terms and conditions of the Creative Commons Attribution (CC BY) license (https://creativecommons.org/licenses/by/4.0/).