Enhancing Transparency and Fraud Detection in Carbon Credit Markets Through Blockchain-Based Visualization Techniques
Abstract
1. Introduction
2. Literature Review
2.1. Introduction to Carbon Credit Trading and Blockchain
2.2. Blockchain Technology in Carbon Credit Trading
2.3. Advantages of Blockchain Technology
- Security: Its decentralized nature ensures data integrity and protection against malicious tampering [4,9]. While the current framework focuses on identifying behaviors indicative of arbitrage, it does not claim to classify these behaviors as fraudulent definitively. Instead, it serves as a decision-support tool highlighting anomalies and suspicious trading patterns for further investigation. Compared to traditional fraud detection approaches, such as machine learning-based anomaly detection [16,17], this visualization-based framework prioritizes interpretability and real-time anomaly identification. The visual outputs enable decision-makers to quickly pinpoint potential irregularities without requiring specialized technical expertise. Future work could integrate machine learning techniques to automate anomaly classification and provide quantitative assessments of fraud detection accuracy, further enhancing the framework’s utility and effectiveness;
2.4. Introduction to Moss Carbon Credit (MCO2) Tokens
- Purpose: MCO2 tokens enable individuals and organizations to offset their carbon footprint while supporting environmental projects;
- Issuer: Moss, a climate-tech company, rigorously verifies and certifies these credits [13];
- Blockchain Integration: MCO2 tokens utilize the blockchain to ensure transparency, traceability, and security;
- Market Dynamics: These tokens are traded on cryptocurrency exchanges, fostering liquidity and price discovery;
- Challenges: Market volatility and regulatory inconsistencies remain barriers to widespread adoption [18].
2.5. Challenges in Reading Blockchain Transaction Records
2.6. Importance of Visualization in Blockchain Transactions
2.7. Compliance and Fraud Detection
2.8. Proposed Visualization Method for Carbon Credit Trading
2.9. Identifying and Mitigating Arbitrage Activities
3. Materials and Methods
3.1. Data Collection
- Layer: Recursive layer of transaction tracking;
- BlockNumber: The block number associated with each transaction;
- TimeStamp: Human-readable transaction time;
- Hash: Unique identifier for each transaction;
- From and To: Wallet addresses involved in the transaction;
- Value: Token amount in standardized units;
- TokenName and TokenSymbol: Information about the token involved.
3.2. Data Processing
- Recursive Data Retrieval: Transactions were tracked layer-by-layer up to a depth of three, starting with a predefined set of wallet addresses. This method ensured a comprehensive capture of transaction pathways;
- Asynchronous Processing: Python’s asyncio and aiohttp libraries optimized data retrieval, enabling concurrent processing of multiple requests to the Etherscan API;
- Data Cleaning: Irrelevant or duplicate transactions were filtered out, and data were formatted into a human-readable structure.
3.3. Visualization Framework
- Network Graph Construction: Nodes represented wallet addresses, and edges depicted transactions. Node size indicated transaction frequency, while edge thickness reflected transaction value;
- Clustering and Temporal Analysis: Clusters of wallet addresses with high transaction activity were identified, and temporal patterns were analyzed using time-sliding tools;
- Visualization Tools: We utilized Python 3.8+ libraries for data visualization, incorporating Pandas 1.5.x for static plotting and Plotly 5.x for interactive network analysis.
3.4. Arbitrage Detection
- Cyclic Transaction Analysis: Cyclic patterns among wallets were identified to trace repetitive trading behaviors;
- Node Degree Analysis: High-frequency nodes (with numerous incoming and outgoing transactions) were flagged for further investigation;
- Cross-Market Analysis: Transaction times were cross-referenced with price charts from various exchanges to identify price discrepancies;
- Machine Learning: Statistical anomaly detection models were applied to flag irregular transaction patterns.
4. Results
4.1. Transaction Network Analysis
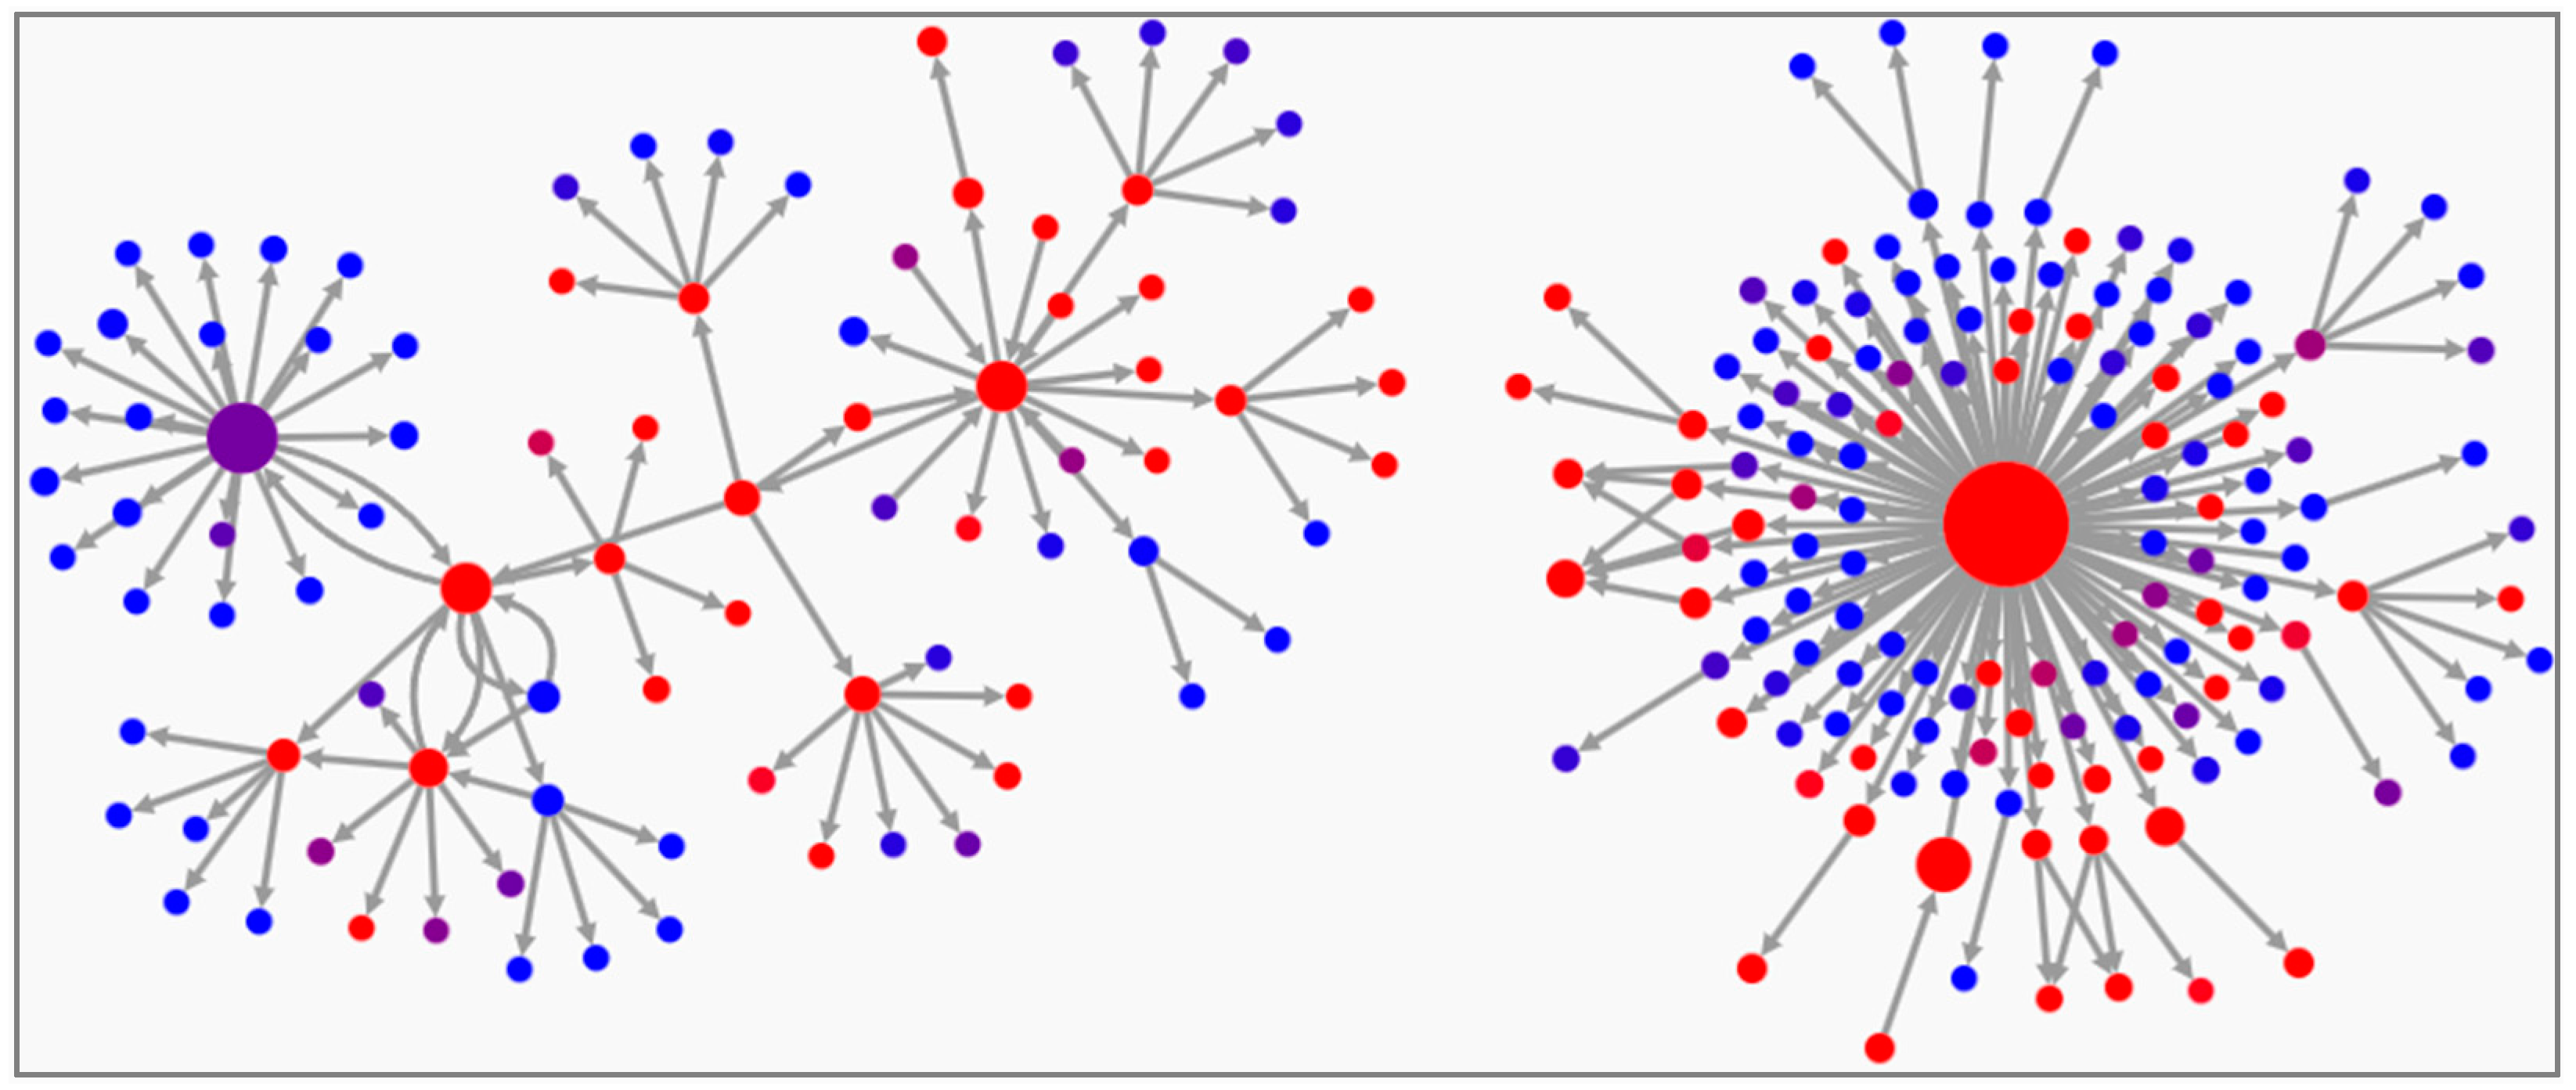
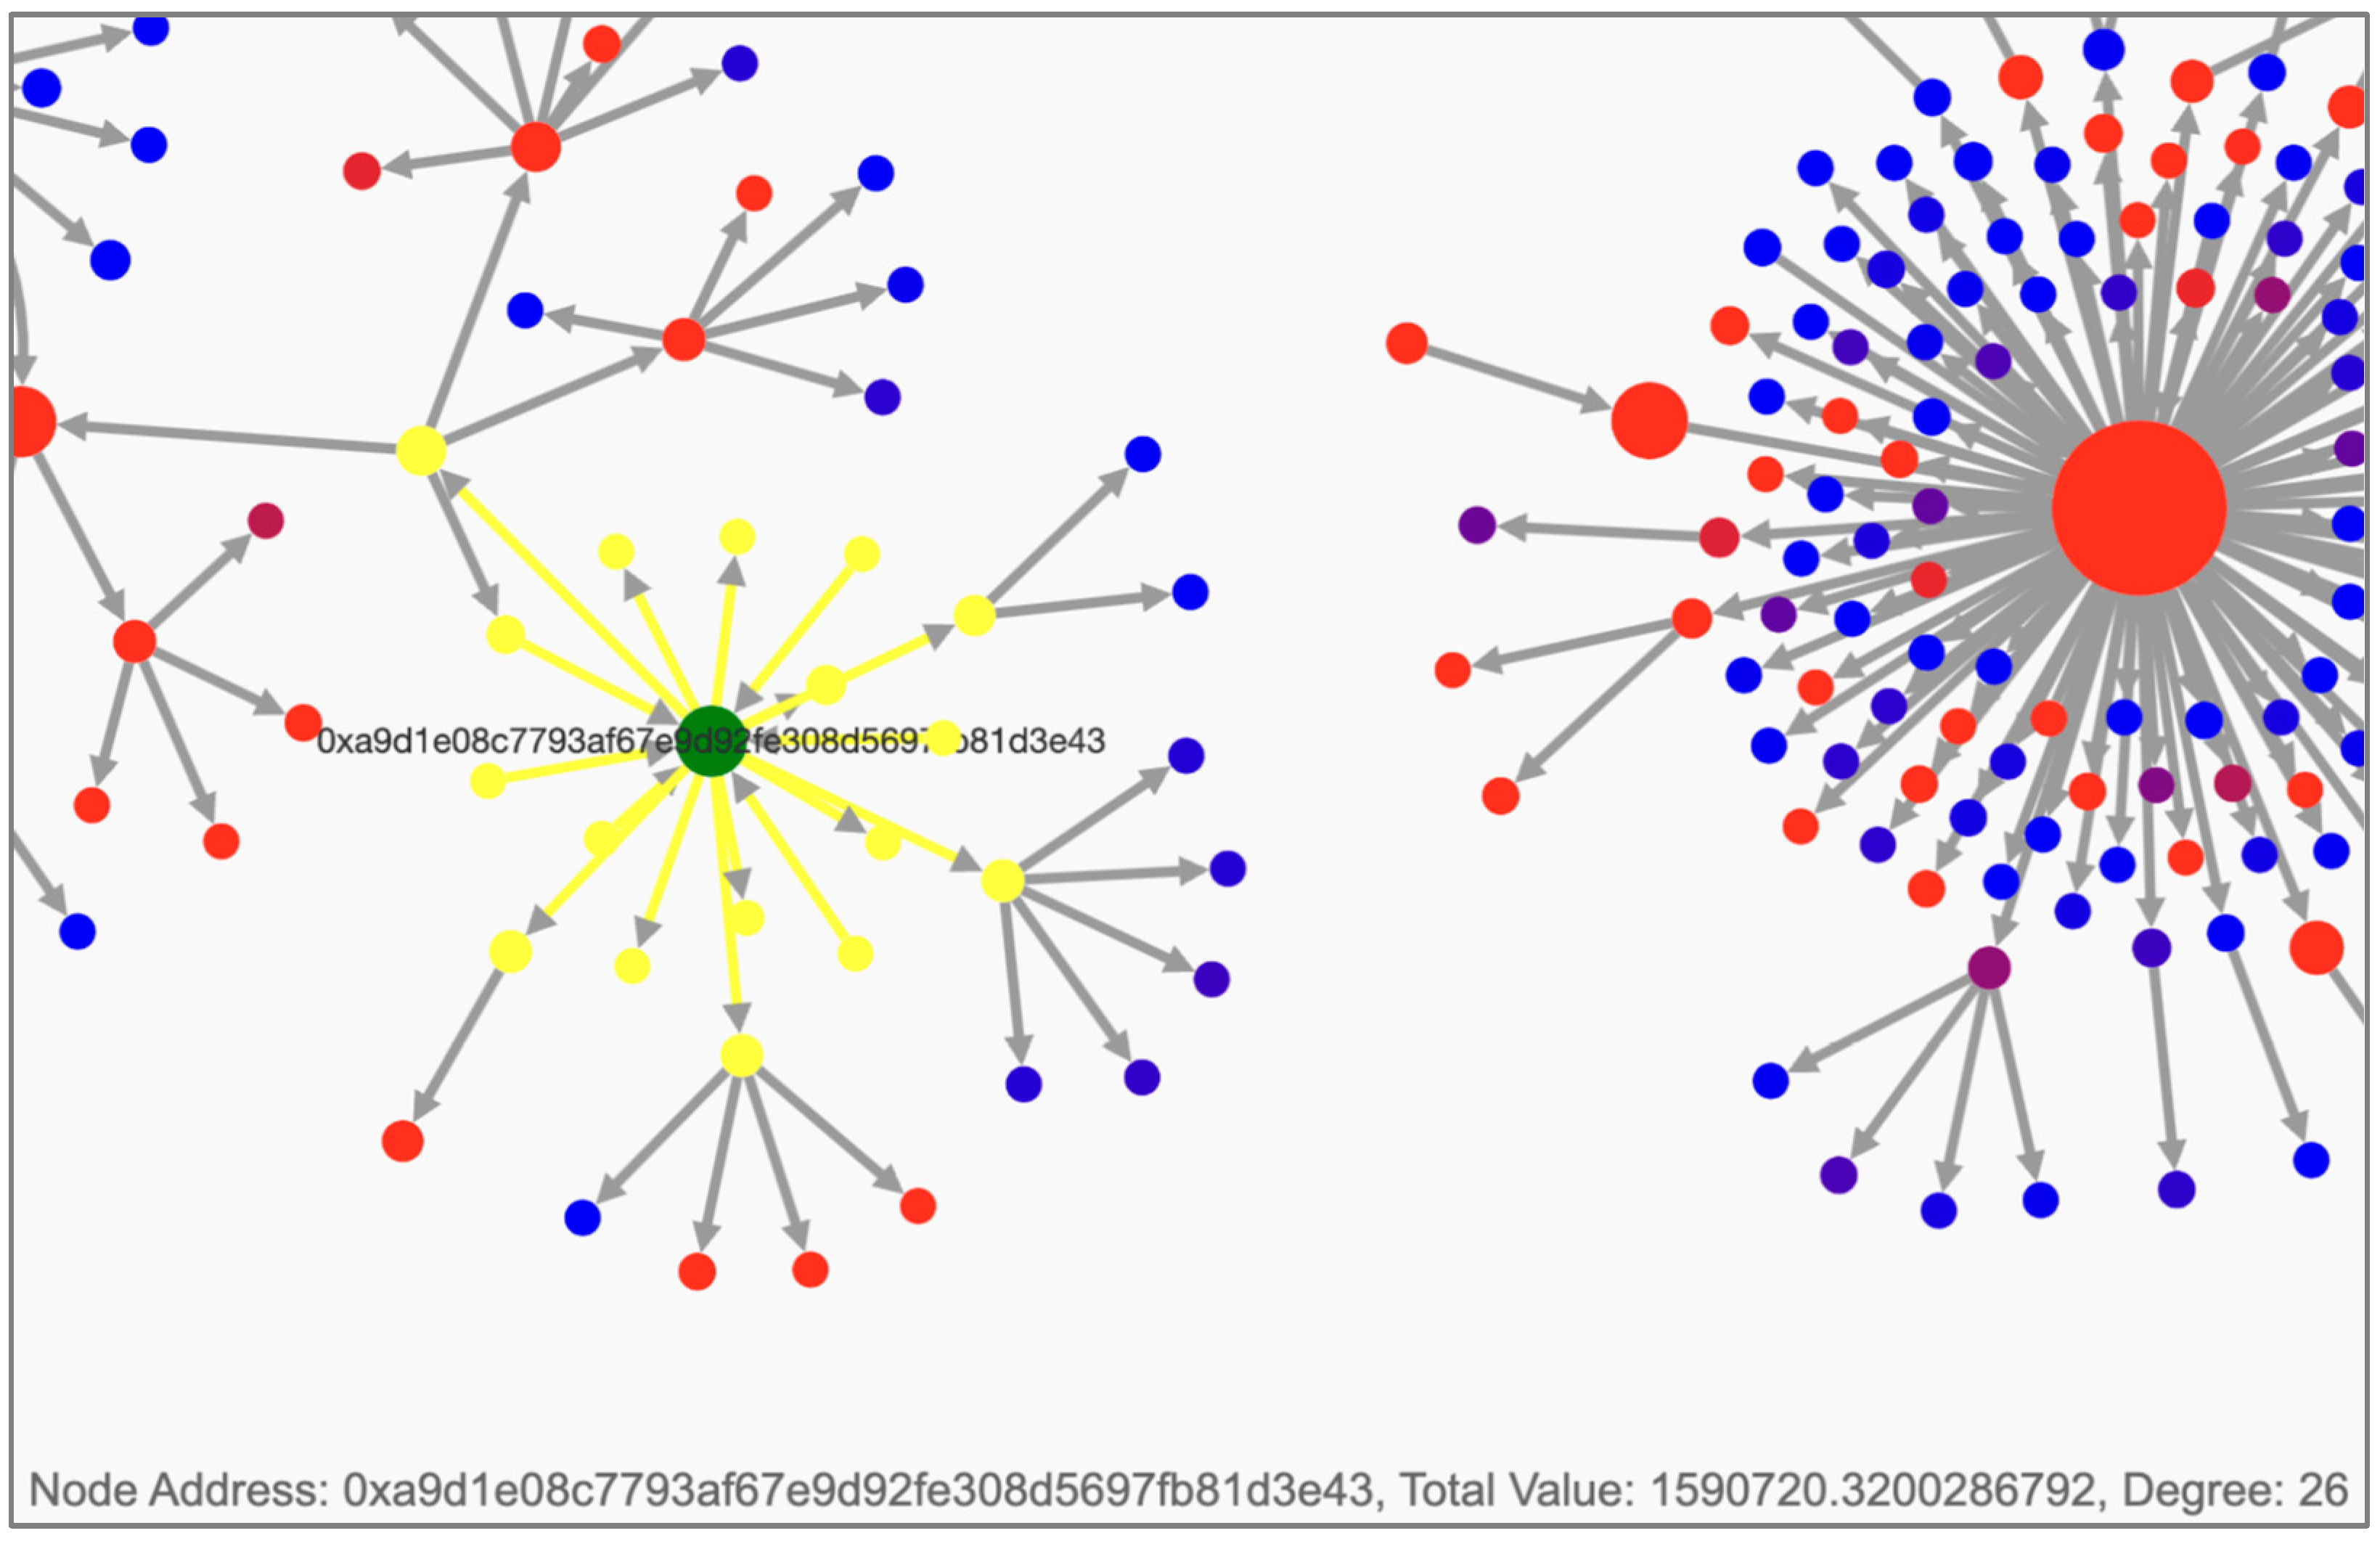
- Node and Edge Characteristics: A network graph illustrating the structure of all transactions, with node size indicating transaction frequency, node color representing total transaction value, and edge thickness reflecting transaction volume (see Figure 1.)
- ০
- A total of 1245 unique wallet addresses and 3628 transactions were identified within the three-layer network;
- ০
- High-transaction-volume nodes, such as “0xb8ba36e591facee901ffd3d5d82df491551ad7ef”, emerged as central hubs with significant activity. They conducted 1188 transactions with a cumulative value of 702,271 MCO2 tokens. These nodes often interacted with smaller nodes, creating dense clusters indicative of coordinated trading behavior.
- Cluster Analysis:
- ০
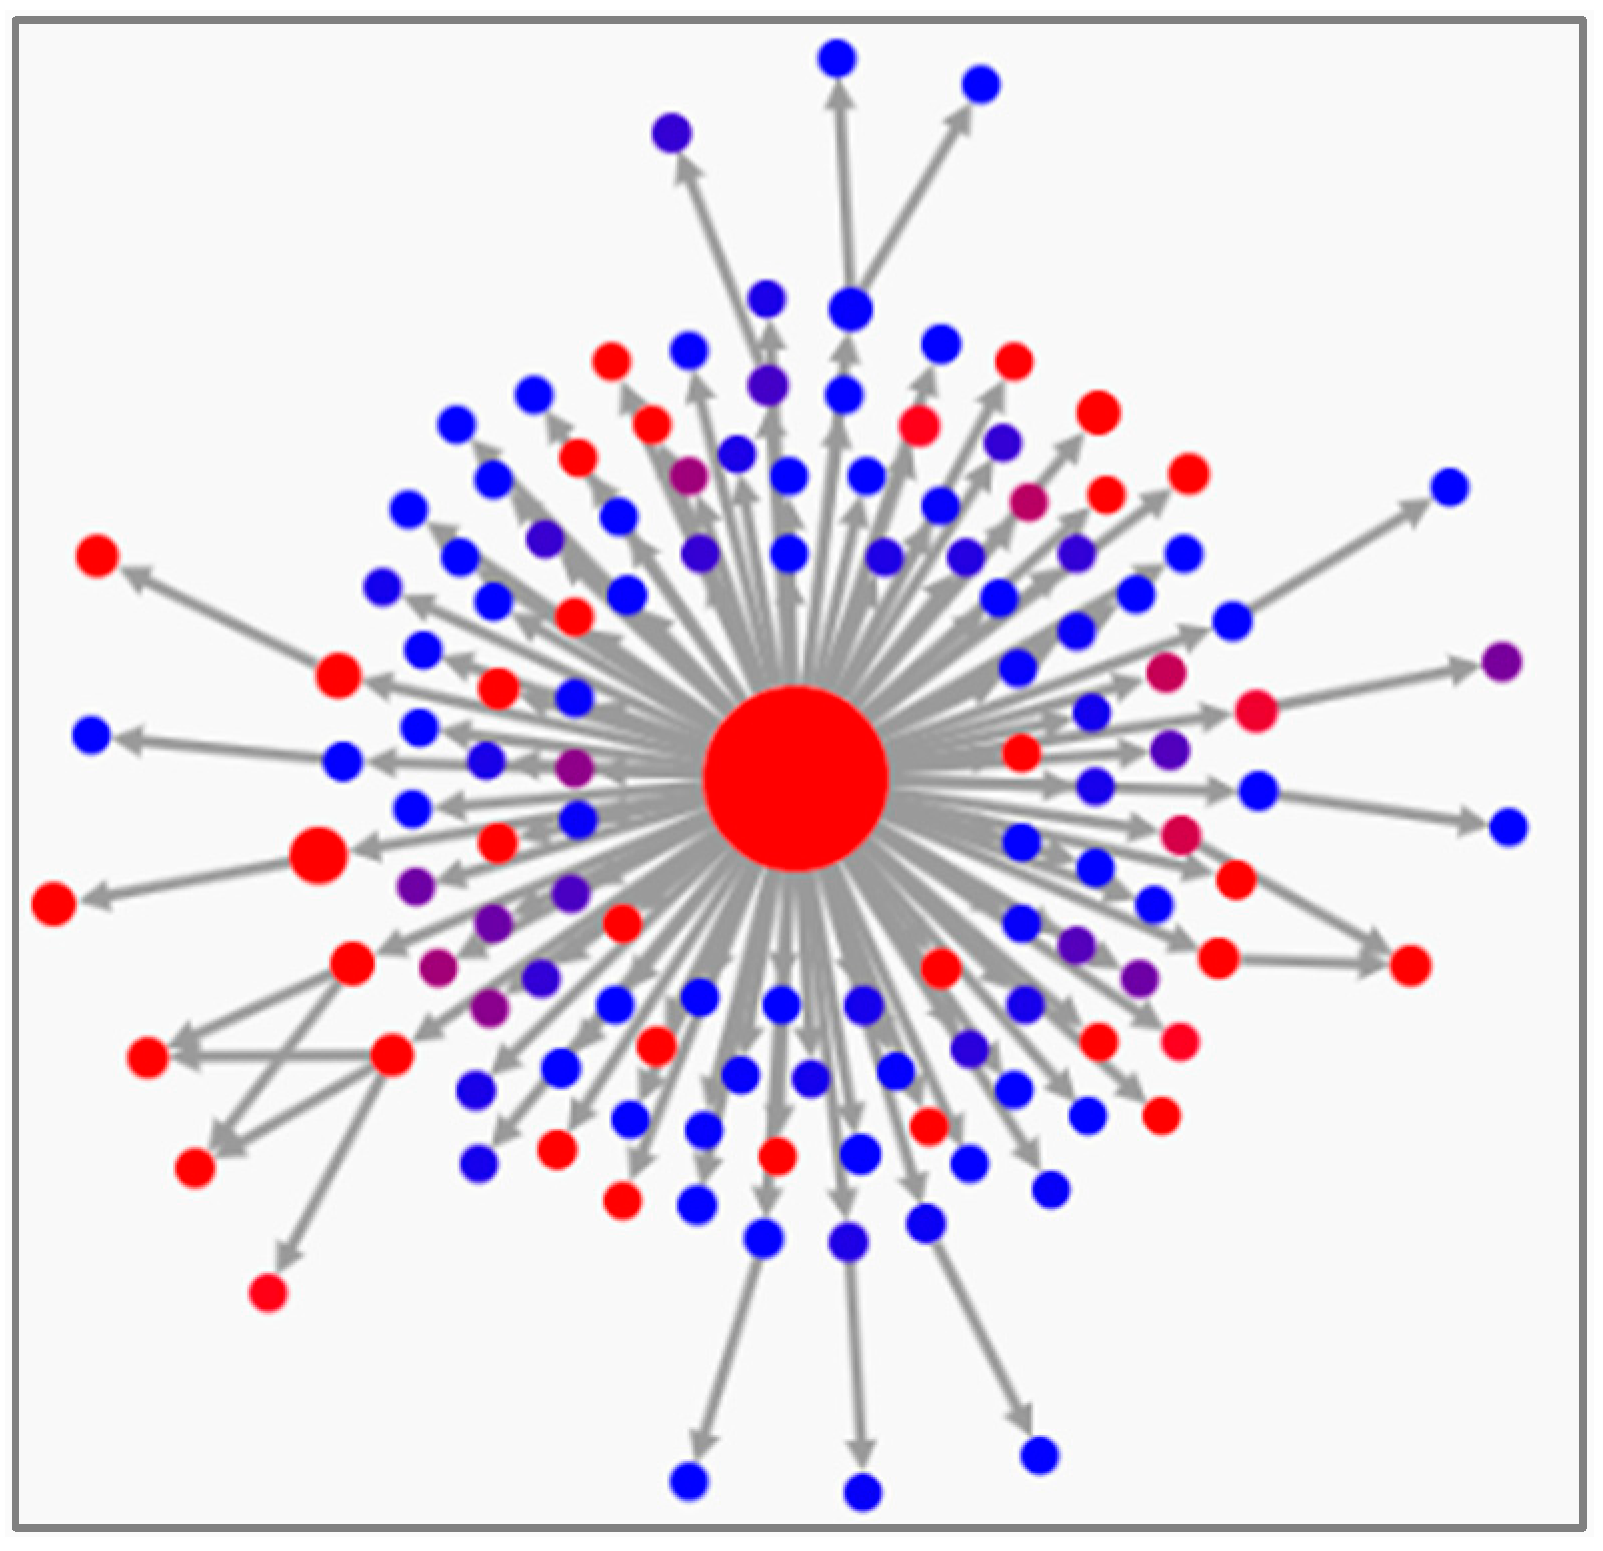
- Dense Clusters: Nodes with high transaction frequencies were observed to cluster around centralized exchanges such as “Mercado Bitcoin 1”, which facilitated 180 transactions totaling 159,204.74 MCO2 tokens. These clusters demonstrated streamlined trading routes between a small number of key participants. The dense cluster, which lasted from 29 April 2018 to 17 April 2024, features a prominent large red node with intense transaction activity, as shown in Figure 2. It involved 117 wallet addresses, 180 transactions, and a total value of 159,204.741094. Further investigation identifies this central node as “Mercado Bitcoin 1”, a centralized cryptocurrency exchange platform established in 2013 in Brazil that offers 228 currencies and 281 trading pairs;
- ০
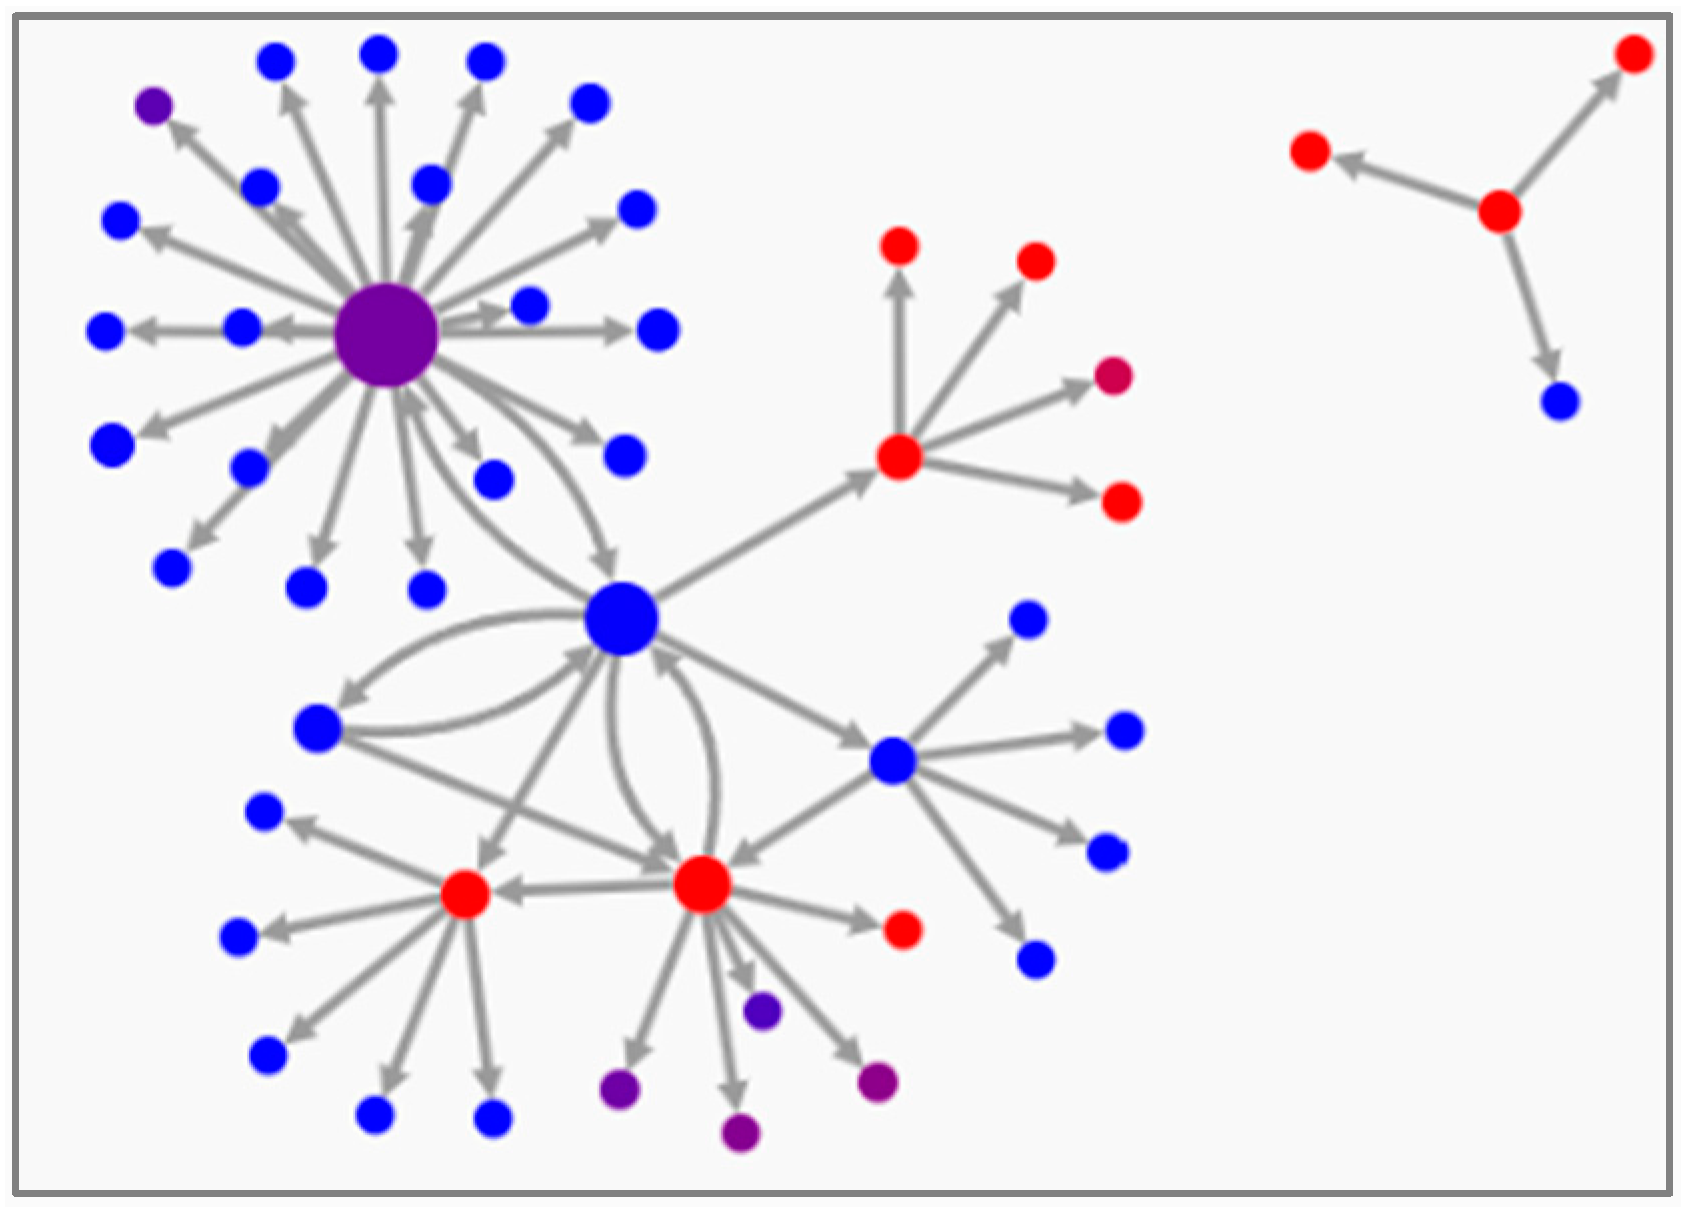
- Sparse Clusters: Transaction cycles were identified in sparse clusters, with recurring patterns emerging between April 2020 and April 2021. These cycles often involved multiple wallets with coordinated trading behaviors (see Figure 3).
4.2. Cyclic Patterns and Arbitrage Detection
- A prominent node, identified as the Router 2 contract (see Figure 5) in the Uniswap V2 protocol, facilitated 22 cyclic transactions involving MCO2 and Wrapped Ether (WETH) tokens. Each transaction cycle exhibited balanced input and output, indicating potential arbitrage activities;
- These cycles were conducted within tight timeframes, with transaction intervals as short as 30 s, optimizing opportunities to exploit price discrepancies across liquidity pools.
4.3. Using Examples from the Dataset to Detect Arbitrafige
4.3.1. Case 1—High-Frequency Trading Addresses
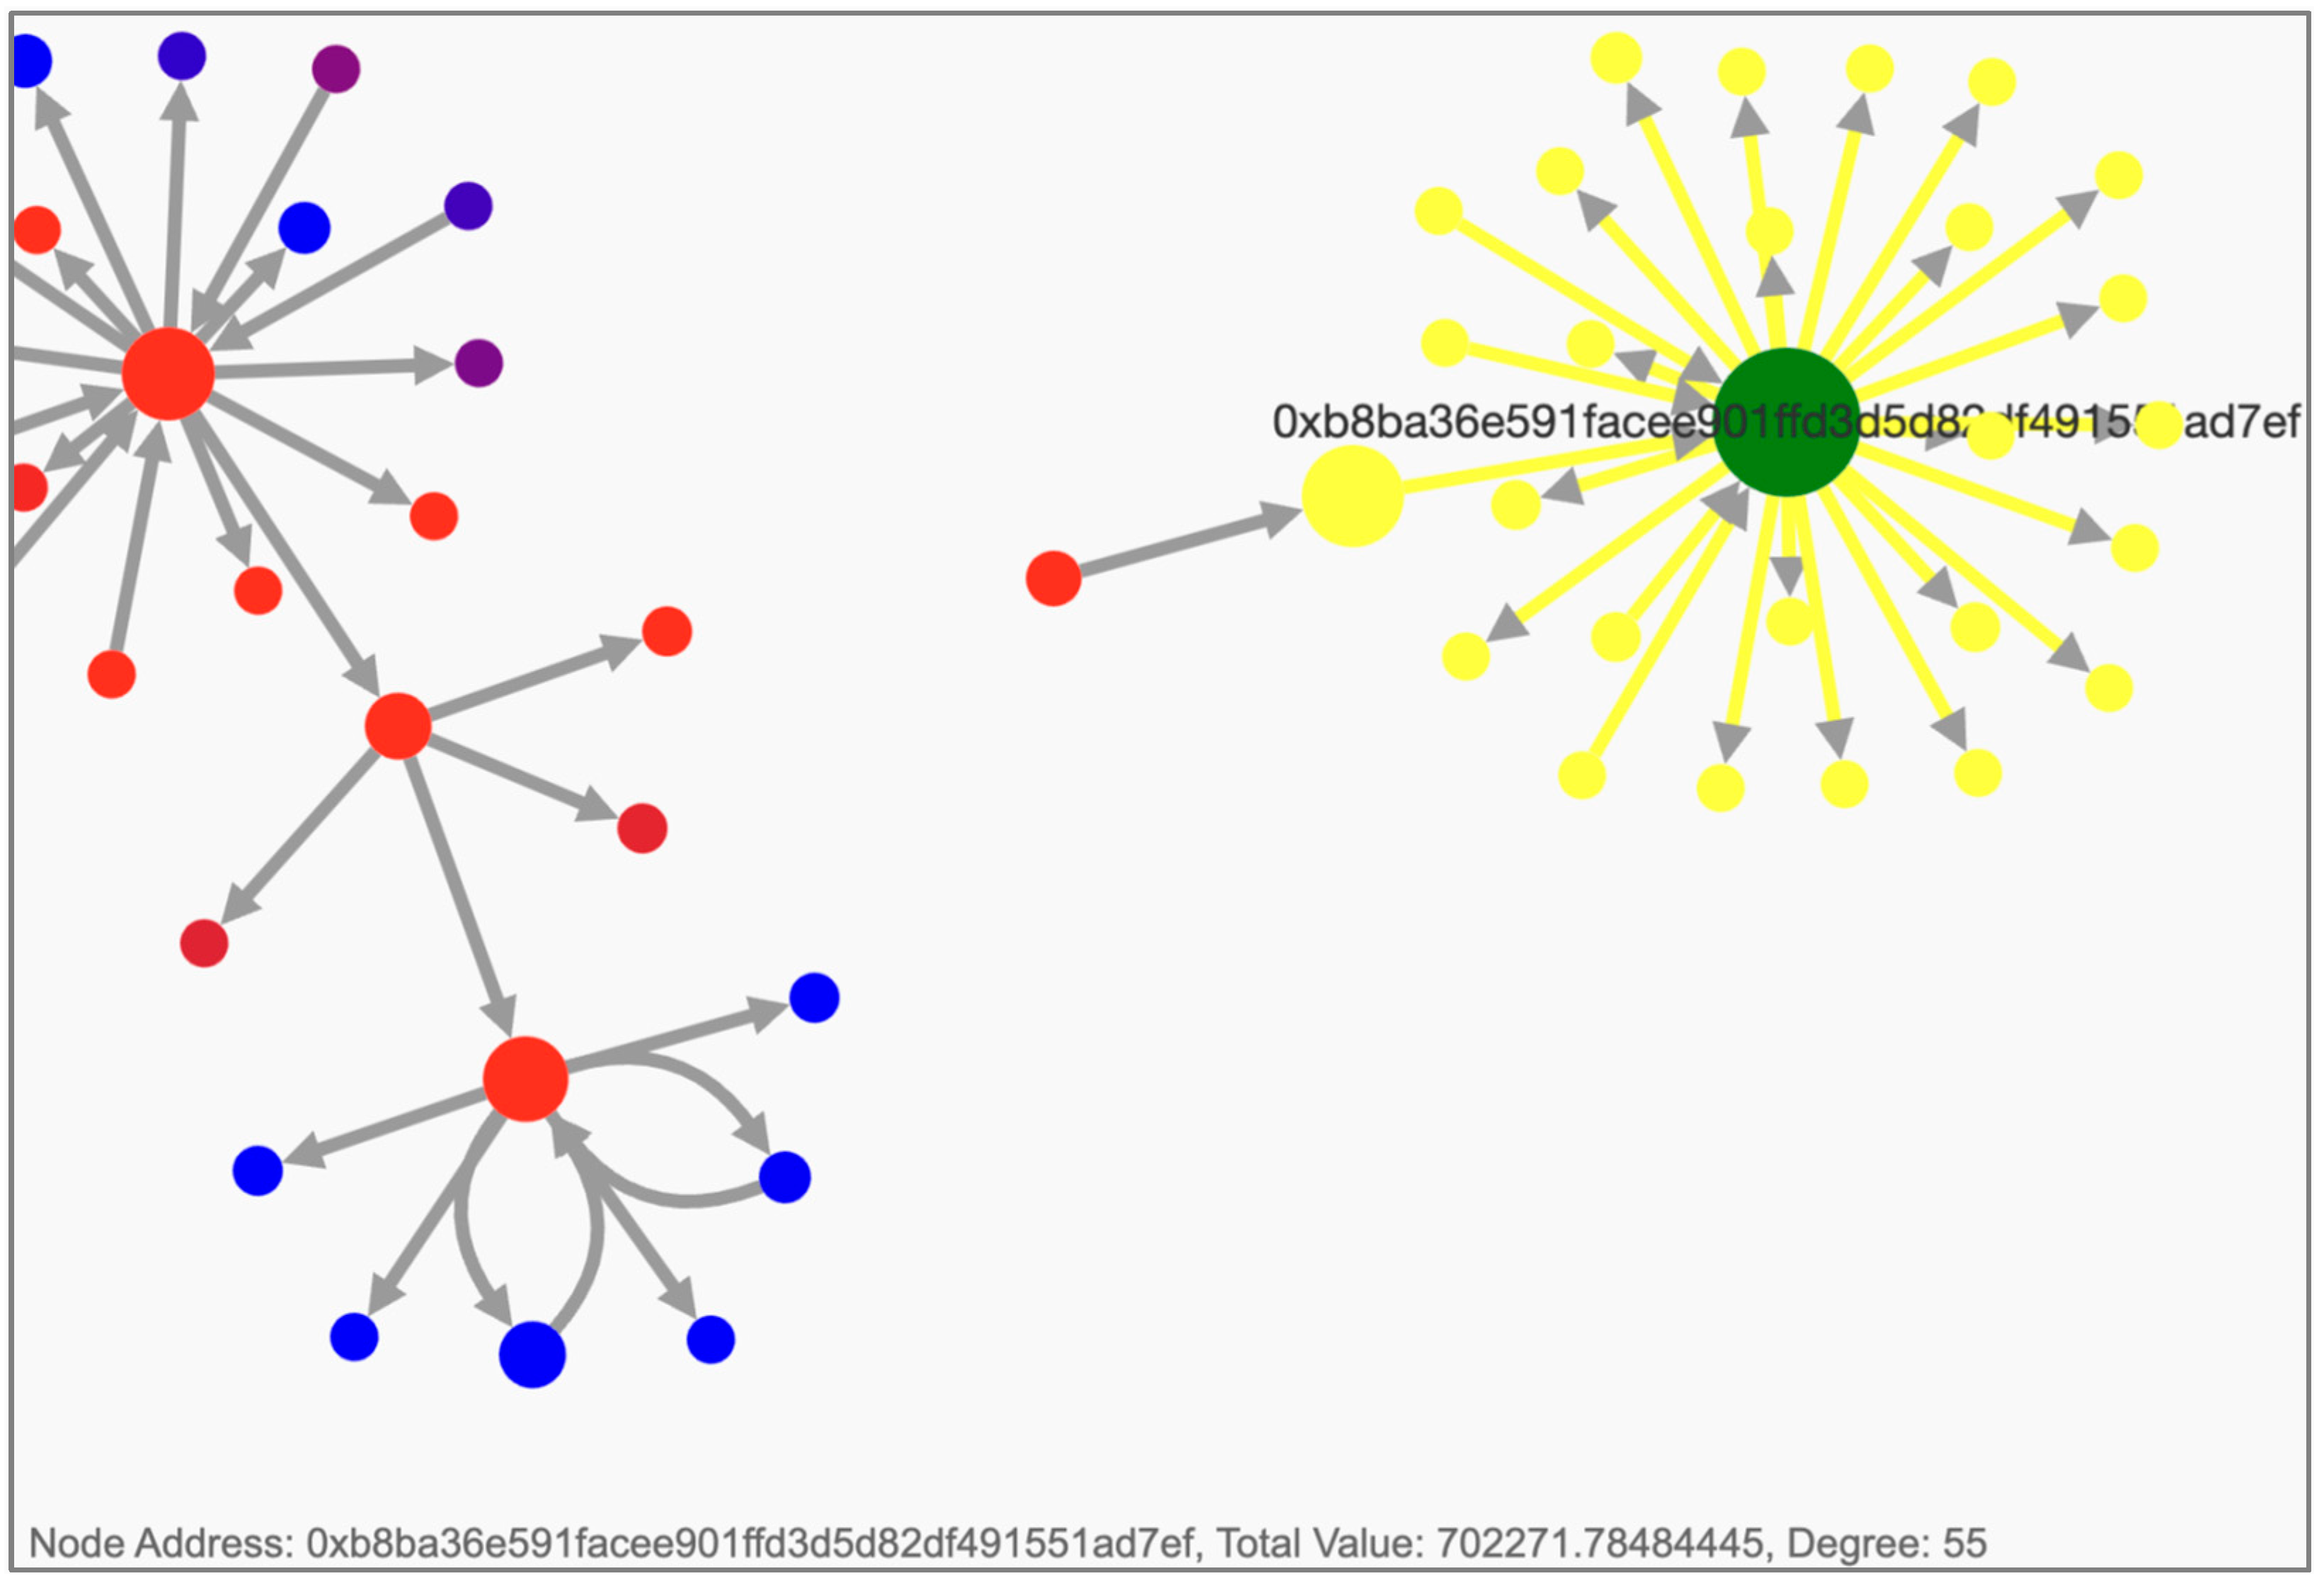
- Observation: Notably, the node 0xb8ba36e591facee901ffd3d5d82df491551ad7ef tops the list with 1188 transactions, as shown in Figure 6 and Figure 7. This node shows significant transaction activity, primarily concentrated in the first layer, with a total value of 702,271 and 55 degrees of connection. The second layer has a total value of 145,920 and 125 degrees of connection. This activity concentration suggests that the node plays a central role in potential arbitrage patterns;
- Potential Issue: The high frequency of transactions may indicate potential money laundering activities;
- Description: Focus on nodes with high transaction volumes. Use analytical tools to zoom in and examine the transaction details between these nodes. By analyzing the transaction patterns and values associated with these high-frequency addresses, we can identify whether the activities are part of regular trading or indicative of arbitrage.
4.3.2. Case 2—Anomalous Large Transactions
- List Out Top 20 Suspicious Cycles: Identify and list the top 20 suspicious cycles. Observing these cycles, you may notice many overlaps with addresses exhibiting high transaction frequencies. This correlation suggests a pattern of behavior that warrants further investigation. Both top suspicious cycles and top frequency addresses often show duplications, indicating potential coordinated activities;
- Potential Issue: These transactions’ large volume and frequency suggest possible arbitrage activities;
- Description: Analyze the values transferred in each transaction and their consistency over time. Arbitrage might manifest as repetitive high-value transactions conducted in a predictable pattern. Such analysis helps understand whether the transactions are part of regular trading activities or indicative of arbitrage;
- Check Frequency of Cycles: Recognize that the presence of a cycle does not guarantee fraudulent or laundering activities. The swap transactions might happen over a broad period. Therefore, it is crucial to check the frequency of these cycles. A higher frequency of suspicious cycles in a short period increases the likelihood of identifying fraudulent activities. Visualization tools with features like a time slider can help visualize these cycles, providing insights into their temporal patterns.
4.3.3. Case 3—Collaborative Trading Clusters
- Observation: Our analysis has uncovered interesting nodes that exhibit patterns of single-way dumping tokens to large nodes or gathering substantial funds from several leaf nodes. These patterns indicate potential arbitrage activities that need further investigation. Multiple addresses within a cluster are frequently traded with each other. This is evident in the transaction network visualization shown in Figure 10 and Figure 11. For instance, the node 0x3f5ce5fbfe3e9af3971dd833d26ba9b5c936f0be has a value of 254818.31252 and a degree of 13, interacting frequently with multiple addresses,
- Potential Issue: This frequent trading among clustered addresses may indicate collaborative arbitrage activities. Such activities could exploit price discrepancies across different platforms or chains, suggesting a coordinated effort to maximize profits through arbitrage;
- Description: If the data permits, verify whether the transactions are cross-chain or involve different platforms where price discrepancies might be more likely. This cross-platform analysis is crucial for confirming the presence of arbitrage activities. For instance, transactions involving the same addresses across multiple blockchain networks or exchanges can highlight arbitrage opportunities being exploited.
5. Discussion
- Real-time Monitoring: The framework can monitor carbon credit transactions immediately. It tracks key details such as each trade’s time, price, amount, and participants. By watching the market in real-time, regulators can quickly spot unusual activities or potential fraud. This helps keep the market fair and in line with international rules;
- Improved Traceability: Using blockchain technology, the framework ensures that every carbon credit transaction is recorded and cannot be changed. This makes it easy to trace the history of each credit, including where it came from and how it was traded. This transparency prevents problems like double counting (using the same credit twice) or fake transactions. It also meets the requirement for precise and accurate reporting set by the Paris Agreement;
- Anomaly Detection: The framework uses intelligent tools to detect unusual activities, such as sudden price changes, fake trades, or unexpectedly high trading volumes. This helps regulators identify and stop dishonest behaviors early. By finding these problems quickly, the system helps keep the carbon market reliable and trustworthy.
6. Conclusions
Funding
Data Availability Statement
Conflicts of Interest
References
- Tapscott, D.; Tapscott, A. Blockchain Revolution: How the Technology Behind Bitcoin Changes Money, Business, and the World; Penguin Random House: New York, NY, USA, 2016. [Google Scholar]
- Crosby, M.; Pattanayak, P.; Verma, S.; Kalyanaraman, V. Blockchain technology: Beyond Bitcoin. Appl. Innov. 2016, 2, 6–10. [Google Scholar]
- Nakamoto, S. Bitcoin: A peer-to-peer electronic cash system. Decentralized Bus. Rev. 2008, 21260. Available online: https://bitcoin.org/bitcoin.pdfhttps://bitcoin.org/bitcoin.pdf (accessed on 27 November 2024).
- Peters, G.W.; Panayi, E. I Understand Modern Banking Ledgers Through Blockchain Technologies; Springer: Berlin/Heidelberg, Germany, 2016. [Google Scholar]
- Catalini, C.; Gans, J.S. Some Simple Economics of the Blockchain; National Bureau of Economic Research: Cambridge, MA, USA, 2016. [Google Scholar]
- Marr, B. How Blockchain Will Transform the Supply Chain and Logistics Industry; Forbes: Jersey City, NJ, USA, 2018. [Google Scholar]
- Mukherjee, S. Analysis of blockchain solutions for the pharmaceutical supply chain industry. J. Ind. Inf. Integr. 2018, 11, 73–85. [Google Scholar]
- Yaga, D.; Mell, P.; Roby, N.; Scarfone, K. Blockchain Technology Overview; National Institute of Standards and Technology: Gaithersburg, MD, USA, 2019.
- Zhang, Y.; Wen, J. An IoT electric business model based on the Bitcoin protocol. In Proceedings of the 18th International Conference on Intelligence in Next Generation Networks, Paris, France, 17–19 February 2015. [Google Scholar]
- Geiregat, S. The pitfalls of blockchain technology for sustainability. J. Sustain. Dev. 2018, 11, 71–82. [Google Scholar]
- Rejeb, A.; Keogh, J.G.; Treiblmaier, H. Leveraging blockchain in supply chain management. Future Internet 2020, 12, 183. [Google Scholar]
- Houben, R.; Snyers, A. Cryptocurrencies and Blockchain: Legal Implications; European Parliament: Strasbourg, France, 2018.
- Moss Carbon Credit Website. MOSS—The First Global Token Backed by Carbon Credits. Online. Available online: https://app.carbonmark.com/products/mco2 (accessed on 27 November 2024).
- Peters, G.W.; Panayi, E. Understanding Modern Banking Ledgers Through Blockchain Technologies: Future of Transaction Processing and Smart Contracts on the Internet of Money; Springer International Publishing: Cham, Switzerland, 2016; pp. 239–278. [Google Scholar]
- Tovanich, N.; Heulot, N.; Fekete, J.D.; Isenberg, P. Visualization of blockchain data: A systematic review. IEEE Trans. Vis. Comput. Graph. 2019, 27, 3135–3152. [Google Scholar] [CrossRef]
- Zheng, Z.; Xie, S.; Dai, H.N.; Chen, X.; Wang, H. An overview of blockchain technology. In Proceedings of the 2017 IEEE International Congress on Big Data, Honolulu, HI, USA, 25–30 June 2017. [Google Scholar]
- Risius, M.; Spohrer, K. A blockchain research framework. Bus. Inf. Syst. Eng. 2017, 59, 385–409. [Google Scholar] [CrossRef]
- Underwood, S. Blockchain beyond Bitcoin. Commun. ACM 2016, 59, 15–17. [Google Scholar] [CrossRef]
- Wang, H.; He, J. A blockchain-based digital identity verification system. Future Gener. Comput. Syst. 2018, 90, 688–696. [Google Scholar]
- Smith, A.D. Blockchain adoption in supply chain management. Int. J. Inf. Manag. 2019, 49, 58–69. [Google Scholar]
- Swan, M. Blockchain: Blueprint for a New Economy; O’Reilly Media: Sebastopol, CA, USA, 2015. [Google Scholar]
- Xu, X.; Weber, I.; Staples, M. Architecture for Blockchain Applications; Springer: Berlin/Heidelberg, Germany, 2019. [Google Scholar]




Disclaimer/Publisher’s Note: The statements, opinions and data contained in all publications are solely those of the individual author(s) and contributor(s) and not of MDPI and/or the editor(s). MDPI and/or the editor(s) disclaim responsibility for any injury to people or property resulting from any ideas, methods, instructions or products referred to in the content. |
© 2025 by the author. Licensee MDPI, Basel, Switzerland. This article is an open access article distributed under the terms and conditions of the Creative Commons Attribution (CC BY) license (https://creativecommons.org/licenses/by/4.0/).
Share and Cite
Tsai, Y.-C. Enhancing Transparency and Fraud Detection in Carbon Credit Markets Through Blockchain-Based Visualization Techniques. Electronics 2025, 14, 157. https://doi.org/10.3390/electronics14010157
Tsai Y-C. Enhancing Transparency and Fraud Detection in Carbon Credit Markets Through Blockchain-Based Visualization Techniques. Electronics. 2025; 14(1):157. https://doi.org/10.3390/electronics14010157
Chicago/Turabian StyleTsai, Yun-Cheng. 2025. "Enhancing Transparency and Fraud Detection in Carbon Credit Markets Through Blockchain-Based Visualization Techniques" Electronics 14, no. 1: 157. https://doi.org/10.3390/electronics14010157
APA StyleTsai, Y.-C. (2025). Enhancing Transparency and Fraud Detection in Carbon Credit Markets Through Blockchain-Based Visualization Techniques. Electronics, 14(1), 157. https://doi.org/10.3390/electronics14010157


