Abstract
Visible-light spectroscopy has long been used to assess various quality indicators in coffee, from green beans to brewed beverages. High-end absorption spectroscopy systems can identify chemical compounds, monitor roasting chemistry, and support flavor profiling. Despite advances in low-cost spectroscopy, such techniques are rarely applied during coffee-drink preparation. Most coffee shops, instead, rely on simple refractometers to measure total dissolved solids (TDS) as a proxy for beverage strength. This study explores a portable, low-cost screening system that integrates visible absorption-transmittance, laser-induced scattering, and fluorescence spectroscopy to estimate brew strength and investigate potential differentiation between coffee-drink types. Experiments were conducted on four common drink preparations. A dual-region exponential decay model was applied to absorption-transmittance spectra, while laser-scattered light imaging revealed distinctive color patterns across samples. The results demonstrate the feasibility of optical fingerprinting as a non-invasive tool to support quality assessment in brewed coffee.
1. Introduction
Coffee is among the most consumed beverages worldwide, appreciated for its stimulating effects and rich sensory profile. The global coffee market exceeds USD 100 billion annually, with quality assurance playing a critical role from bean cultivation to final cup preparation [1]. Beverage quality depends on multiple factors, including coffee variety, farming and processing methods, roasting parameters, and brewing conditions [2]. Ensuring consistent quality requires practical analytical tools suitable for various stages of the production chain.
Spectroscopy has been widely used in the last few decades to determine a wide variety of quality indicators in coffee, from coffee beans to coffee drinks. A very commonly used spectral window for such analysis is the near-infrared one. Near-infrared spectroscopy (NIR) was used for the discrimination between defective and non-defective roasted coffees at a spectrum from 1200 nm to 2400 nm. The results indicated that non-defective and defective coffee samples could be separated into distinct groups, based on transmittance or reflectance spectra obtained by mixing the coffee samples with KBr [3]. A study on varietal differentiation based on NIR (1100–2500 nm) demonstrated that the combination of near-infrared spectroscopy with an orthogonal signal correction method can be used not only to discriminate between Arabica and Robusta pure coffee varieties but also for differentiating between pure varieties and blends of the two species [4]. Furthermore, NIR spectra were correlated to coffee sensory attributes to predict the acidity, mouthfeel, bitterness, and aftertaste of espresso from roasted coffee samples from 1100 nm to 2500 nm. The results confirmed that non-destructive NIR spectroscopy measurements can be successfully applied for the sensory quality estimation of espresso coffee [2]. Using NIR alongside chemometric techniques resulted in the successful detection of barley additions to coffee using the IR range between 4000 cm−1 and 10,000 cm−1 [5]. NIR combined with chemometric techniques successfully detected the addition of barley to coffee in the 4000–10,000 cm−1 range [6].
Apart from such IR spectroscopy, diffuse reflectance infrared Fourier transform spectroscopy (DRIFTS) was also used for the same reason, evaluating the ability of the method to discriminate between defective and non-defective roasted and ground coffee beans, where drifts in spectra provided satisfactory levels of discrimination in a spectrum from 4000–400 cm−1. The results confirm that drifts provide satisfactory levels of discrimination between defective and non-defective coffee beans after roasting [7]. The qualitative and quantitative discrimination process between Arabica and Robusta in instant coffee was successfully realized by Fourier transform infrared spectroscopy (FTIR) and chemometrics in the range between 800 and 4000 cm−1 or 2500 and 12,500 cm−1 [8]. A non-destructive method for the identification and classification of coffee bean varieties and quality was developed based on soft computing models using Vis/NIR spectroscopy. The results of this research demonstrated that visible–near-infrared spectroscopy, in the range of 400 to 1100 nm, can be used to detect and predict coffee bean species and varieties [9]. Laser-induced breakdown spectroscopy (LIBS) was also employed to analyze the quality of unroasted and ground coffee in the spectrum from 4244 cm−1 to 5286 cm−1, or 190 nm to 800 nm, demonstrating a high potential for discrimination between acceptable quality beans and BGS defects in unroasted ground coffee [10].
UV–Vis spectroscopy is a widely used analytical technique in food science due to its simplicity, cost-effectiveness, and ability to detect a wide range of chromophoric compounds. In the context of coffee analysis, it has proven valuable for monitoring chemical changes related to roasting and bioactive content.
High-performance liquid chromatography (HPLC) combined with UV–Vis detection has been employed for the accurate quantification of phenolic acids, flavonoids, and caffeine in coffee. One study successfully used this approach to identify and quantify eight phenolic acids, three flavonoids, and caffeine across sixteen different coffee samples, enabling differentiation based on bioactive compound profiles [11].
Furthermore, the roasting process has been shown to significantly influence the UV–Vis absorbance spectra of coffee. Studies report that increasing roast levels alters the composition of natural phenolics and melanoidins, resulting in clear variations in spectral intensity and shape [12].
Additionally, UV–Vis spectroscopy has been applied to monitor changes in chlorogenic acids between green and roasted coffee beans. These investigations highlight spectral shifts and absorbance decreases associated with roasting, offering a straightforward way to assess its impact on specific bioactive constituents [13]. UV–Vis spectrometry was used for the optical characterization in coffee beans within the spectrum of 200 nm−500 nm, developing a method for the determination of chlorogenic acids (CGAs) in coffee beans [14]. UV–Vis spectroscopy in the range between 200 nm and 400 nm, as well as chemometric methods, were also used to discriminate Indonesian palm civet coffee, demonstrating the ability to discriminate between civet and non-civet coffee with sensitivity up to 100%. This illustrates that the method can establish a rapid and acceptable method for the authentication of Indonesian civet coffee [15].
Absorption spectroscopy can identify chemical compounds present in coffee solutions, to understand the chemical reactions that occur during the roasting process, to determine the quality and flavor profile of the coffee beans, and to optimize the roasting process [16,17]. Scattering phenomena, particularly when combined with absorption or fluorescence spectroscopy, can be used to investigate the chemical composition and structural characteristics of coffee samples [18]. The fluorescence properties of coffee beans can be used to identify the origin of the beans and to determine the degree of roasting. The fluorescence properties of roasted coffee have also been used to assess freshness and aging [19].
In practical settings, beverage strength is often evaluated via refractometry, which estimates TDS based on light refraction in the liquid. While effective, such devices offer limited information and require calibration. This motivates the exploration of alternative, low-cost optical methods for more comprehensive coffee-drink characterization. This study presents a compact, portable spectrometer system capable of measuring visible absorption, scattering, and fluorescence signals in liquid coffee samples. The system integrates a white-light LED, a 405 nm laser diode, a multispectral photodetector, and a camera module. The spectrally resolved channels span from 415 to 680 nm, with the 405 nm excitation chosen for its ability to induce luminescence and scatter-specific responses in complex organic matrices such as brewed coffee. The aim is to examine whether optical features correlate with brew strength and whether drinks can be differentiated based on their spectroscopic and visual signatures. The system was tested across four drink types—ibrik, espresso (via moka pot), filter, and instant coffee—to evaluate its performance and reproducibility. Each preparation followed a standardized protocol, although variation in brew strength due to method constraints was expected and acknowledged as part of the exploratory nature of the study.
The proposed methodology provides an accessible, modifiable platform for rapid, non-destructive coffee quality screening. While not intended as a replacement for quantitative TDS instruments or standardized sensory panels, the results support its feasibility as a complementary, low-cost solution for comparative quality assessment in coffee shops, machine calibration, and field studies.
2. Materials and Methods
Four common coffee drinks were selected for testing: ibrik (L and B), espresso (prepared using a three-cup moka pot), and instant coffee. Each drink was prepared following a standardized yet practical protocol that reflects common consumer practices, while recognizing that the exact mass transfer from ground coffee to beverage varies between methods. Coffee drinks with varying coffee concentrations were prepared and tested, as summarized in Table 1.

Table 1.
Coffee weight in coffee-drink samples prepared and tested.
The coffee-drink samples were prepared using the following procedure. For all commercially available instant coffee samples, 200 mL of hot water was poured into a cup and heated at 80 °C. Then, the desired coffee quantity was added to the water and stirred for 30 s. After 20 s, the sample was transferred to the cuvette, which was consequently placed in the measurement setup.
Concerning commercially available espresso coffee samples (medium ground), a volume of 200 mL water was poured into the bottom chamber of a three-cup moka pot, with the desired coffee quantity also being added to the filter basket of the pot. Brewing occurred, over medium heat, until extraction was complete. Then, the brewed coffee drink was removed from the top chamber of the moka pot and transferred to the cuvette. The three-cup moka pot operates at a pressure of approximately 1.5 bar, producing a strong and aromatic coffee, although not an espresso in the strict sense. For the commercially available ibrik coffees, 140 mL (ibrik B) and 60 mL (ibrik L) of water and the desired coffee quantity were heated until foaming occurred. Then, the samples were removed from the kettle and transferred to the cuvette. All water used was from the pot, and glassware was cleaned between runs to avoid contamination. Brewed samples were cooled to room temperature prior to measurement and gently stirred to ensure homogeneity. Each drink type was prepared in triplicate.
3. Experiment and Discussion
A portable instrument was developed, schematically illustrated in Figure 1, comprised of a low-cost filter-on-silicon-based spectrometer (AS7341, AMS Osram, Premstaetten, Austria), which is illuminated by a light-emitting diode and a continuous-wave (cw) laser source, and images were captured using a camera equipped with a macro-objective lens. The setup was controlled by a Raspberry Pi 3 A+ single board computer, programmed in Python (version 3.10), allowing for full control over the functionality of all peripherals. The transparent sample holder (cuvette) was sandblasted at the side where laser illumination took place, could hold liquid samples, and typically had an optical path of 2.5 mm.
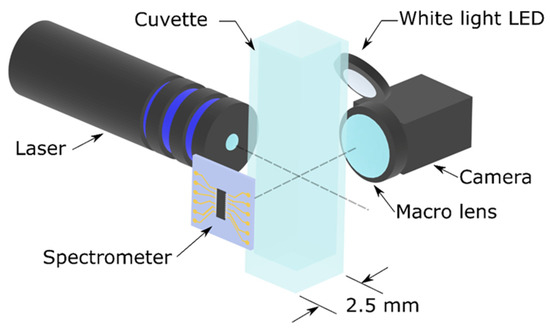
Figure 1.
The experimental setup, comprised of low-cost off-the-shelf components.
More specifically, the utilized continuous-wave laser source emitted at a wavelength of 405 nm with a maximum optical power output of 40 mW. The relatively low-cost sensor was the AMS AS7341 optical filter-based device, with a detection range from 415 nm to 940 nm. The device was based on a photodetector array, hosting a series of optical filters, lithographically developed on top of it, allowing for fluorescence and absorbance in given wavelengths. For presentation reasons, it was named a low-cost portable spectrometer. Camera images in the visible were acquired using the Raspberry pi v1.3 camera (Mouser Electronics, Assago, MI, Italy) (5 MP Omni vision 5647 Camera Module, Still Picture Resolution: 2592 × 1944).
The 405 nm laser source was selected to have a wavelength closer to the shortest detectable wavelength of the spectrometer, corresponding to higher energy photons, so that any possible luminescence (if any) could be detected.
The white-light LED (light emitting diode) source was manufactured by Cree and was selected to have a spectrum as broad and equally distributed as possible. A high color-rendering index (CRI) number was chosen for this purpose, and a white-light LED with a CRI index of 90 was used [20]. Apart from a high CRI index, the choice of a suitable color temperature of the LED is important to achieve a satisfactory spectral distribution in the visible area. In this case, we used a 4000 K color temperature in order to maximize the spectral content around 480 nm and acquire a spectrum as ‘flat’ as possible in the VIS range, as shown in Figure 2. Figure 2 also contains the spectral measurement of the 405 nm laser source used in the experimental setup (blue color).
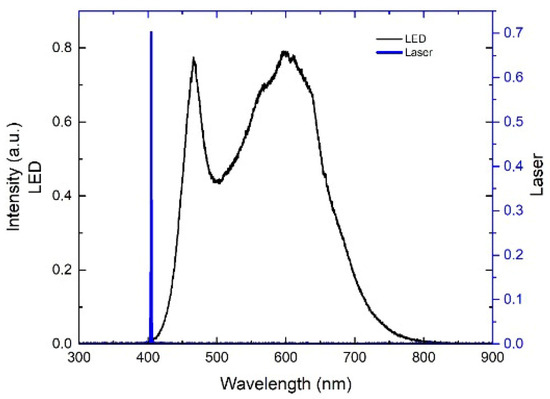
Figure 2.
Relative spectral power distribution of the white-light LED and the laser.
The LED light source (~410 nm–750 nm) was located perpendicular to the transparent side of the cuvette, and the spectrometer was located at the opposite side of the cuvette (also transparent) (see Figure 1). The light from the 405 nm laser was directed towards the sandblasted side of the cuvette in order to avoid speckle formation in the images obtained by the camera. The camera was located just below the LED light source in order to acquire the scattered laser images and reflectance images upon LED illumination. The amount and direction of scattered light depends on the coffee sample properties upon investigation, and scattered light distribution was analyzed using the color camera images. Any fluorescence coming from the coffee solution samples can be also seen in these images. In all measurements, the integration time for the spectrometer was set to 843.1 ms for both LED and laser illumination. Τhe total estimated material cost was in the vicinity of EUR 270. In case of mass production, the cost could drop below EUR 180 per unit.
The choice of the 405 nm wavelength for the laser was based on the spectrometer detection range, which starts from 415 nm, and any potential luminescence excitation can be observed. Coffee contains several compounds that are capable of exhibiting fluorescence, including caffeine, melanoidins [21,22], polyphenols (such as chlorogenic acids) [23,24], and aromatic compounds. Some of these compounds absorb light in the UV/blue region (~350–420 nm) and emit at slightly longer wavelengths in the 415–500 nm range. Fluorescence in coffee has been observed under excitation at 365 nm and 405 nm, with emission peaks starting from approximately 410–430 nm and extending up to 500 nm [25].
3.1. White-Light LED Illumination
In this section, the acquired spectra upon the white-light LED illumination of the coffee-drink samples are presented. Figure 3 illustrates the light transmittance spectrum of instant coffee, espresso, and the two different samples of ibrik coffee drinks (ibrik L and ibrik B) under white-light LED illumination. The dashed blue and red lines denote spectral areas that were examined for transmittance decay trends as a function of coffee mass.
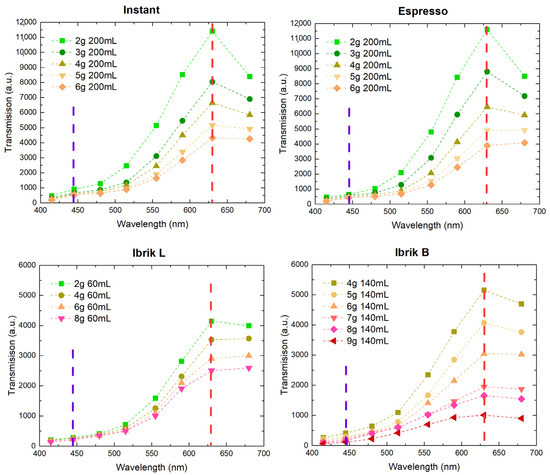
Figure 3.
Transmittance spectra of (top left) instant coffee, (top right) espresso coffee, (bottom left) ibrik coffee sample L, and (bottom right) ibrik coffee sample B. Purple and orange lines denote wavelengths that were used to conduct the exponential decay fittings.
All coffee samples exhibited increased absorption in the 400–500 nm spectral region and comparatively higher transmittance in the red region of the visible spectrum. Distinct variations were observed around 630 nm, where—under identical illumination conditions —espresso and instant coffee samples showed transmittance values ranging from approximately 4000 to 12,000 arbitrary units (a.u.), depending on the amount of coffee used.
In contrast, ibrik-style coffee presented substantially lower values in the same range (approximately 500–5000 a.u.), suggesting a denser or more-absorbing medium.
In the 400 nm region, all coffee samples demonstrated strong absorption compared to the red part of the spectrum. Moreover, the transmittance appeared inversely proportional to the coffee mass in each sample, indicating that optical attenuation is linked to the amount of extracted compounds or suspended matter. For instance, a 2 g espresso-style sample yielded a transmittance of ~12,000 a.u. at 630 nm, while a 6 g sample showed a reduced transmittance of ~4000 a.u., following an approximate exponential decay. Similar trends were observed across all types of coffee and the entire examined spectral range. Ibrik-style samples followed the same overall pattern, though they consistently showed stronger attenuation, likely due to their higher solid concentration and traditional preparation method.
The enhanced transmittance is observed at wavelengths where the LED amplitude is weaker (e.g., at 500 nm), which illustrates the validity of the method and the measuring device.
For validation reasons, the transmittance spectra of espresso coffee were also obtained using the analytical Lambda 35 UV/VIS Spectrometer (Perkin Elmer, Singapore) in the range of 400–800 nm with a scan speed of 480 nm/min [26,27]. These reference results, illustrated in Figure 4, are in agreement with the results of our portable device, with an uncertainty of ±5 nm. This validates the results of the portable device, allowing for further implementation and use.

Figure 4.
Transmittance spectra using the Perkin Elmer Lambda 35 UV/VIS Spectrometer for 2 g and 6 g espresso coffee in 200 mL water. The expected plateau in high wavelengths is observed, allowing for a clear comparison with our portable low-cost device.
Figure 4.
Transmittance spectra using the Perkin Elmer Lambda 35 UV/VIS Spectrometer for 2 g and 6 g espresso coffee in 200 mL water. The expected plateau in high wavelengths is observed, allowing for a clear comparison with our portable low-cost device.

To further explore this relationship, the transmittance values at 445 nm and 630 nm were plotted as functions of coffee mass. The effect of coffee mass on spectral behavior was further evaluated by fitting the transmittance at 445 nm and 630 nm as a function of mass and modeled using an exponential decay function with R2 > 0.99:
where is the measured transmittance at wavelength (445 nm or 630 nm), is the extrapolated transmittance at zero coffee mass, is the decay constant, is the mass of coffee used in the drink, and is a mass-dependent baseline offset. The physical reasons for this offset are under investigation and are possibly related to localized saturation effects. However, this offset value is not important in the evaluation of the transmittance results and the dependence of the coffee mass signature.
The fitted data are displayed in Figure 5, with red curves corresponding to 630 nm and blue curves corresponding to 445 nm, plotted against two vertical axes (double-Y layout) for clarity. An overview of the fitted results reveals that each coffee type exhibited a distinct transmittance decay pattern in both spectral regions. The derived decay constants varied between drink types, as summarized in Table 2. Espresso-style and instant coffee showed overall higher transmittance than ibrik coffee but also displayed a large difference in their values (instant: 0.921 vs. espresso: 0.249), despite both being diluted in the same water volume. This difference suggests potential differences in solubility or particulate composition. At 630 nm, the variation was smaller but still evident (~50% difference in α630).
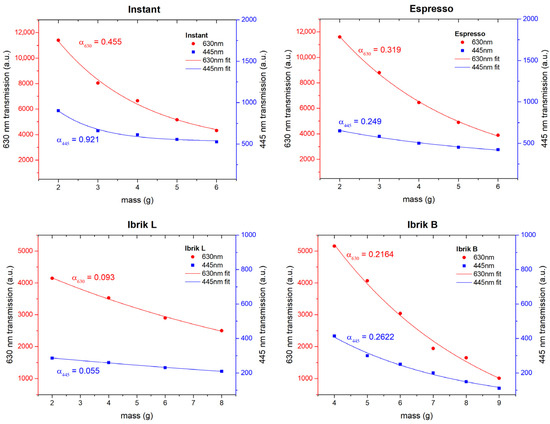
Figure 5.
White-light LED illumination transmittance as a function of coffee-drink coffee mass for (top left) instant coffee, (top right) espresso coffee, (bottom left) ibrik coffee sample L, and (bottom right) ibrik coffee sample B. Left axis: 630 nm transmission (circular points). Right axis: 445 nm transmission (square points).
Table 2.
Decay constant αλ values after fitting for the four different coffee-drink samples.
Among the ibrik samples, the drink prepared with less water (ibrik L, 60 mL) exhibited the highest optical attenuation, as indicated by the smallest decay constants, while the more diluted version (ibrik B, 140 mL) showed moderately higher transmittance and correspondingly larger α values. In all cases, the decay parameter pairs (α630, α445) were unique per sample and may serve as semi-quantitative optical markers for comparative assessment. Although no direct measurements of total dissolved solids (TDS) were conducted in this study, the observed exponential trends and distinct decay parameters support the possibility of using this method as a non-destructive fingerprinting approach.
3.2. Laser Illumination
Following the LED white-light illumination, the coffee samples under investigation were illuminated using the 405 nm laser for approximately 843.1 ms. During this period, a camera image with a similar exposure time was captured. The camera images of the coffee samples under laser illumination are illustrated in Figure 5. An overview of these images reveals both similarities and differences among the various coffee-drink samples. Differences in absorption and scattering as a function of coffee content are also manifested by the varying size (in both width and length) of the scattered light captured by the camera. At this point, it is worth noticing that the camera is placed parallel to the laser beam trajectory (see Figure 1); therefore, the information captured by the camera is the convolution between coffee-drink sample absorption and scattering. However, each coffee sample presents a unique light-scattering pattern and subtle differences in coloration around the non-saturated scattering area near the laser beam’s entrance point.
In addition to image acquisition, the spectrometer captured a spectral response during laser illumination. The primary finding was a decrease in the detected signal at the 415 nm band, the closest one to the 405 nm wavelength of the laser, as coffee concentration increased. Although the camera images visually revealed color changes, especially near the beam entrance, no significant spectral features were detected at longer wavelengths due to the limited integration time. Increasing the integration time was avoided to prevent saturation of the 415 nm channel.
The image content was analyzed by dividing it into two main regions, as shown in Figure 6: the saturated light region (A) and the observable light-scattering path (line B), along which light attenuation was investigated. Furthermore, a distinct halo-like colored region between the saturated zone A and scattering zone B was observed, which differed between coffee varieties and may be useful for qualitative identification. To quantify light attenuation, the open-source software ImageJ (version 1.54) was used to extract intensity profiles along the propagation direction (line B in Figure 6). This path included region A because it holds additional information on scattered light structure. Although a standard digital camera may saturate in this region, a high-dynamic-range sensor would resolve the intensity variation. The resulting attenuation plots for all coffee samples are presented in Figure 7, with pixel 0 at the end of the beam path and pixel ~1000 near the entry point—thus, the intensity profiles are mirrored relative to the original images (Figure 6).
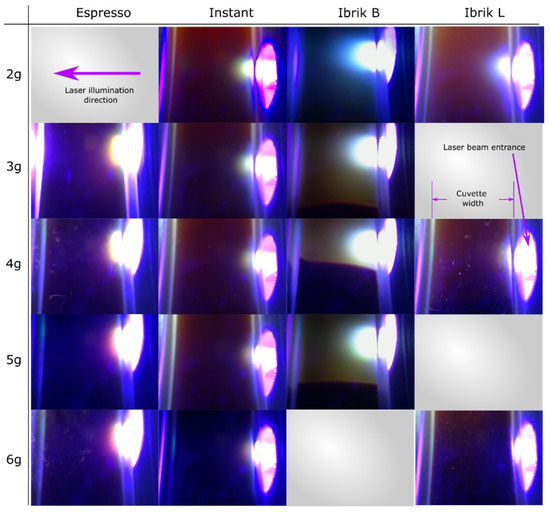
Figure 6.
Typical coffee-sample camera images upon laser illumination. Columns refer to the four different coffee-drink types tested, and rows correspond to different coffee content (in grams).
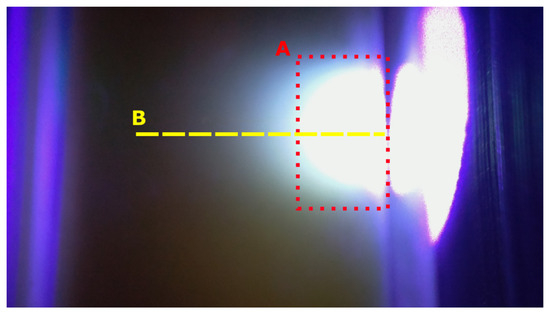
Figure 7.
A typical coffee-sample camera image upon laser illumination. The image refers to ibrik B coffee sample 5 g/140 mL, 5 min after preparation. The light-saturation zone is denoted by the dotted rectangular area A, and the light-attenuation zone is examined across the yellow line B.
The attenuation curves are illustrated in Figure 8, showing exponential decay behavior, with both saturation region length and terminal darkness level influenced by coffee concentration.
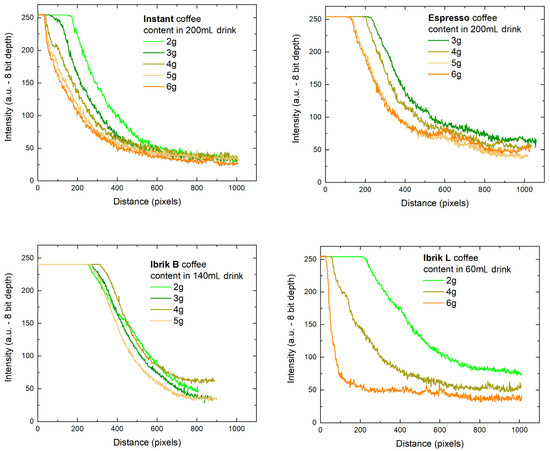
Figure 8.
Light-attenuation profile plots along laser-beam propagation path: (Top left) Instant coffee, (top right) espresso coffee, (bottom left) ibrik coffee sample B, and (bottom right) ibrik coffee sample L. Lines are color-coded as a function of coffee mass in grams.
To derive distinguishing features for each sample, an exponential decay curve was fitted to the non-saturated portion of each profile, using the following expression:
where is the measured intensity at pixel , is the peak scattered intensity, is the extinction coefficient, and is an offset related to ambient light. This curve fitting allowed for the extraction of the parameters and , which may serve as indicators of coffee content and potentially of coffee type when combined with other metrics, such as white-light absorption-transmittance or luminescence data. The fitted parameters, along with the length of the saturated region A for each sample, are shown in Table 3. These results show that instant and espresso samples have similar extinction coefficients, but their maximum scattered intensities vary with coffee content. For example, the instant coffee with 3 g of coffee in 200 mL yielded , while the espresso with the same concentration yielded . Both shared comparable extinction coefficients (0.0051–0.0053 pixels−1). In contrast, ibrik samples demonstrated more pronounced differences. The densest ibrik sample (6 g in 60 mL) had an extinction coefficient as high as 0.0264 pixels−1—nearly an order of magnitude greater than the others. The most-diluted ibrik sample (2 g in 140 mL) showed a coefficient of 0.0020 pixels−1, lower than that of the more dilute instant coffee.
Table 3.
Coffee-drink type, coffee mass, and exponential decay curve-fitting results.
Although this result may appear paradoxical, it can be attributed to the convolution of scattering and absorption in the images. Instant coffee, despite being more diluted, may contain fewer scattering centers than ibrik coffee. For espresso and instant samples, generally decreased with increasing coffee mass, in line with expected attenuation behavior. However, this trend did not hold for ibrik coffee, suggesting that additional factors such as suspended solids or brewing variations influence scattering. Notably, in the dense ibrik L sample, the saturation zone length decreased with increasing coffee content, indicating stronger beam extinction in concentrated brews. While the extracted parameters offer promising sample-specific signatures, it should be emphasized that these results reflect the combined optical effects of scattering and absorption. Therefore, further validation with independent methods, such as total dissolved solids (TDS) or refractive index measurements, is necessary to establish robust quantitative correlations between spectral features and soluble coffee content.
3.3. On the Two Experimental Modes
The experimental results, grouped into two complementary modes—white-light LED illumination and laser exposure—provide preliminary evidence that optical signatures can be used to differentiate brewed coffee drinks based on their preparation method and relative soluble content. Distinct spectral responses were observed across the examined coffee types, suggesting the presence of optical markers potentially associated with concentration and composition differences.
Under white-light illumination, specific regions of exponential spectral decay—particularly around 445 nm and 630 nm—demonstrated unique curve-fitting parameters for each coffee sample. These parameters reflect light-attenuation behavior that may relate to suspended or dissolved compounds, though no direct quantification of total dissolved solids (TDS) was performed. Consequently, we interpret these findings as semi-quantitative indicators of relative concentration, rather than absolute metrics, with potential of becoming fully quantitative following a calibration procedure for a given coffee type.
Laser-based scattering analysis provided additional fingerprinting markers among the samples. The attenuation of scattered 405 nm laser light followed an exponential trend consistent with Beer–Lambert-type behavior, under the assumption of uniform optical path and particle distribution. While absolute concentrations were not determined, the variation in peak scattered intensity () offers a reproducible metric that may support comparative evaluation among drinks of known preparation parameters. Furthermore, colorimetric data extracted from laser-illuminated images—specifically from regions just beyond the saturation threshold—revealed variations in RGB channel intensities. For instance, the ibrik L sample displayed significantly lower green (G = 102) and red (R = 129) intensity values compared to instant coffee (G = 147, R = 155), despite differences in dilution volume. These variations may stem from chromophoric or luminescent compounds linked to roast level or processing method, warranting further investigation. Figure 9 illustrates these findings, with strong agreement between experimental and fitted decay curves, and distinct RGB values supporting sample differentiation. However, notable spectral similarities between ibrik L and instant coffee suggest that reliable classification requires combined analysis from both LED and laser illumination modalities.
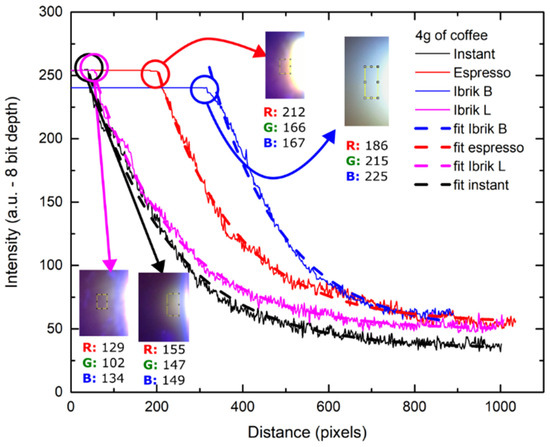
Figure 9.
Light-attenuation profile plots along laser-beam propagation path for the four different coffee drinks, all containing 4 g of coffee. Solid lines: experimental data. Dashed lines: Exponential decay curve fits. Insets: color information extracted from the ‘halo’ area just after saturation zone A.
Measurements were realized in a dark environment, and any type of possible overexposure is related to the scattering effect. Therefore, any possible overexposure is considered as an offset effect, which does not affect the value of the results.
NIR, FTIR, LIBS, and other instrumental methods are precise but expensive laboratory techniques. Our method refers to a portable and low-cost technique, which offers the ability of transmittance or absorbance measurements, while low-cost refractometers offer only a refraction index measurement. Overall, the proposed method demonstrates potential as a low-cost, non-destructive screening tool for the optical differentiation of coffee drinks with semi-quantitative capabilities, and potentially full solute concentration for a given coffee type, following a rigorous calibration.
4. Conclusions
This work presents a proof-of-concept study evaluating a low-cost, portable spectroscopic system for brewed coffee analysis. By combining visible absorption, laser-induced scattering, and fluorescence detection, the proposed method enables the comparative assessment of different coffee-drink types based on their optical signatures. Distinct spectral decay rates and scattering profiles were observed between preparations, and multivariate analysis successfully differentiated the drinks. The methodology offers a complementary, non-destructive screening tool that could be integrated into coffee equipment calibration, quality control protocols, or field-testing scenarios. For given coffee-drink types, it provides quantitative brew strength results. The system’s modular design, affordability, and ease of use make it an accessible option for practical applications and as a screening device. Future enhancements of the device include spectral expansion to the IR region and multi-wavelength excitation, with the purpose of increasing fingerprinting markers for better identifying unknown coffee-drink types and improving coffee content determination accuracy. In addition, the use of a machine learning algorithm, built into the single-board computer, is explored in order to assess accuracy in differentiating between coffee-drink types.
Author Contributions
Conceptualization, G.V. and E.H.; methodology, G.V.; software, E.M.; validation, E.M., G.V. and E.H.; formal analysis, E.M.; investigation, E.M.; resources, G.V. and E.H.; data curation, E.M. and G.V.; writing—original draft preparation, E.M.; writing—review and editing, G.V. and E.H.; visualization, E.M.; supervision, G.V. and E.H.; project administration, G.V. and E.H.; funding acquisition, E.H. All authors have read and agreed to the published version of the manuscript.
Funding
This research was funded by Action 2 of Submeasure 16.1–16.2 “Establishment and operation of Operational Groups of the European Innovation Partnership for agricultural productivity and sustainability”, the Rural Development Program 2014–2020 of the Ministry of Rural Development & Food, Greece, grant number 2014GR06RDNP001.
Data Availability Statement
Data is contained within the article.
Acknowledgments
Acknowledgements are due to TOOCOFF SMPC for their valuable information on the history and properties of coffee. Acknowledgements are also due to Eleni Alexandratou for measurements with the Perkin Elmer Lambda 35 UV/VIS Spectrometer.
Conflicts of Interest
The authors declare no conflicts of interest.
References
- Mussatto, S.I.; Machado, E.M.S.; Martins, S.; Teixeira, J.A. Production, Composition, and Application of Coffee and Its Industrial Residues. Food Bioprocess Technol. 2011, 4, 661–672. [Google Scholar] [CrossRef]
- Sunarharum, W.B.; Williams, D.; Smyth, H.E. Complexity of coffee flavor: A compositional and sensory perspective. Food Res. Int. 2014, 62, 315–325. [Google Scholar] [CrossRef]
- Craig, A.P.; Franca, A.S.; Oliveira, L.S.; Irudayaraj, J.; Klein, I. Fourier transform infrared spectroscopy and near infrared spectroscopy for the quantification of defects in roasted coffees. Talanta 2015, 134, 379–386. [Google Scholar] [CrossRef]
- Esteban-Díez, I.; González-Sáiz, J.M.; Saenz-Gonzalez, C.; Pizarro, C. Coffee varietal differentiation based on near infrared spectroscopy. Talanta 2007, 71, 221–229. [Google Scholar] [CrossRef]
- Esteban-Díez, I.; González-Sáiz, J.M.; Pizarro, C. An evaluation of orthogonal signal correction methods for the characterisation of Arabica and Robusta coffee varieties by NIRS. Anal. Chim. Acta 2004, 514, 57–67. [Google Scholar] [CrossRef]
- Ebrahimi-Najafabadi, H.; Leardi, R.; Oliveri, P.; Casolino, M.C.; Jalali-Heravi, M.; Lanteri, S. Detection of addition of barley to coffee using near infrared spectroscopy and chemometric techniques. Talanta 2012, 99, 175–179. [Google Scholar] [CrossRef]
- Craig, A.P.; Franca, A.S.; Oliveira, L.S. Discrimination between defective and non-defective roasted coffees by diffuse reflectance infrared Fourier transform spectroscopy. LWT—Food Sci. Technol. 2012, 47, 505–511. [Google Scholar] [CrossRef]
- Briandet, R.; Kemsley, E.K.; Wilson, R.H. Discrimination of Arabica and Robusta in instant coffee by Fourier transform infrared spectroscopy and chemometrics. J. Agric. Food Chem. 1996, 44, 170–174. [Google Scholar] [CrossRef]
- Aghdamifar, E.; Sharabiani, V.R.; Taghinezhad, E.; Rezvanivand Fanaei, A.; Szymanek, M. Optical discrimination of Arabica coffee fermentation conditions using spectroscopy. Eur. Food Res. Technol. 2023, 249, 1599–1612. [Google Scholar] [CrossRef]
- Silva, T.V.; Hubinger, S.Z.; Gomes Neto, J.A.; Milori, D.M.B.P.; Ferreira, E.J.; Ferreira, E.C. Potential of Laser Induced Breakdown Spectroscopy for analyzing the quality of unroasted and ground coffee. Spectrochim. Acta Part B At. Spectrosc. 2017, 135, 29–33. [Google Scholar] [CrossRef]
- Kim, H.; Moon, J.Y.; Kim, H.; Lee, D.S.; Cho, M.; Choi, H.K.; Kim, Y.S.; Lee, C.Y.; Lee, K.W. HPLC analysis and antioxidant activity of coffee prepared with different roasting levels. Food Chem. 2011, 129, 928–936. [Google Scholar] [CrossRef]
- Del Castillo, M.D.; Ames, J.M.; Gordon, M.H. Effect of roasting on the antioxidant activity of coffee brews. J. Agric. Food Chem. 2002, 50, 3698–3703. [Google Scholar] [CrossRef] [PubMed]
- Abebe, W.; Gholap, A.V. Characterization of chlorogenic acids in green and roasted coffee beans by UV-Vis spectroscopy. Afr. J. Pure Appl. Chem. 2013, 7, 219–224. [Google Scholar]
- Belay, A.; Gholap, A.V. Characterization and determination of chlorogenic acids (CGA) in coffee beans by UV-Vis spectroscopy. Afr. J. Pure Appl. Chem. 2009, 3, 234–240. [Google Scholar] [CrossRef]
- Yulia, M.; Suhandy, D. The potential application of UV-visible spectroscopy and chemometrics for discrimination of Lampung Robusta coffee with different fermentations. IOP Conf. Ser. Earth Environ. Sci. 2019, 537, 012035. [Google Scholar] [CrossRef]
- Yisak, H.; Redi-Abshiro, M.; Chandravanshi, B.S. New fluorescence spectroscopic method for the simultaneous determination of alkaloids in aqueous extract of green coffee beans. Chem. Cent. J. 2018, 12, 59. [Google Scholar] [CrossRef]
- Daglia, M.; Papetti, A.; Gregotti, C.; Berte, F.; Gazzani, G. In vitro antioxidant and ex vivo protective activities of green and roasted coffee. J. Agric. Food Chem. 2000, 48, 1449–1454. [Google Scholar] [CrossRef]
- Workman, J., Jr.; Weyer, L. Practical Guide to Interpretive Near-Infrared Spectroscopy; CRC Press: Boca Raton, FL, USA, 2012. [Google Scholar]
- Xu, Y.; He, Y.; Liu, F.; Ying, Y. Rapid detection of adulteration in extra-virgin olive oil using three-dimensional fluorescence spectra technology with selected multivariate calibrations. Int. J. Food Prop. 2015, 18, 2085–2098. [Google Scholar] [CrossRef]
- Available online: https://gr.mouser.com/datasheet/2/723/XLamp_CMB1510-3359447.pdf (accessed on 1 July 2025).
- Nunes, F.M.; Coimbra, M.A. Melanoidins from coffee infusions: Fractionation, chemical characterization, and antioxidant activity. J. Agric. Food Chem. 2007, 55, 3967–3977. [Google Scholar] [CrossRef]
- Santos, J.S.; Silva, M.S.; Iglesias, J.; Monteiro, M.; Granato, D. Fluorescence spectroscopy as a tool for determining the degree of roast in Arabica coffee. Food Chem. 2019, 298, 125023. [Google Scholar] [CrossRef]
- Pavía-Ruz, N.; González-Domínguez, R.; Hernández-Hernández, O.; Castro-Ríos, R.; Godínez-Domínguez, E.; López-Barrera, E.A. Visible fluorescence spectroscopy for quality monitoring of brewed coffee: Influence of roasting and brewing parameters. Spectrochim. Acta Part A Mol. Biomol. Spectrosc. 2023, 287, 122086. [Google Scholar] [CrossRef]
- Bekedam, E.K.; Schols, H.A.; van Boekel, M.A.J.S.; Smit, G. Coffee brew melanoidins: Interacting coffee components. J. Agric. Food Chem. 2008, 56, 7652–7657. [Google Scholar]
- Suhaj, M.; Rácová, J. Polyphenolic compounds in coffee. Czech J. Food Sci. 2011, 29, 520–525. [Google Scholar]
- Kazantzis, K.T.; Koutsonikoli, K.; Mavroidi, B.; Zachariadis, M.; Alexiou, P.; Pelecanou, M.; Politopoulos, K.; Alexandratou, E.; Sagnou, M. Curcumin derivatives as photosensitizers in photodynamic therapy: Photophysical properties and in vitro studies with prostate cancer cells. Photochem. Photobiol. Sci. 2020, 19, 193–206. [Google Scholar] [CrossRef]
- Johansson, A.; Svensson, J.; Bendsoe, N.; Svanberg, K.; Alexandratou, E.; Kyriazi, M.; Yova, D.; Gräfe, S.; Trebst, T.; Andersson-Engels, S. Fluorescence and absorption assessment of a lipid mTHPC formulation following topical application in a non-melanotic skin tumor model. J. Biomed. Opt. 2007, 12, 034026. [Google Scholar]


Disclaimer/Publisher’s Note: The statements, opinions and data contained in all publications are solely those of the individual author(s) and contributor(s) and not of MDPI and/or the editor(s). MDPI and/or the editor(s) disclaim responsibility for any injury to people or property resulting from any ideas, methods, instructions or products referred to in the content. |
© 2025 by the authors. Licensee MDPI, Basel, Switzerland. This article is an open access article distributed under the terms and conditions of the Creative Commons Attribution (CC BY) license (https://creativecommons.org/licenses/by/4.0/).