
Optimum Design of Transformers for Offshore Wind Power Generators Considering Their Behavior


Abstract
:1. Introduction
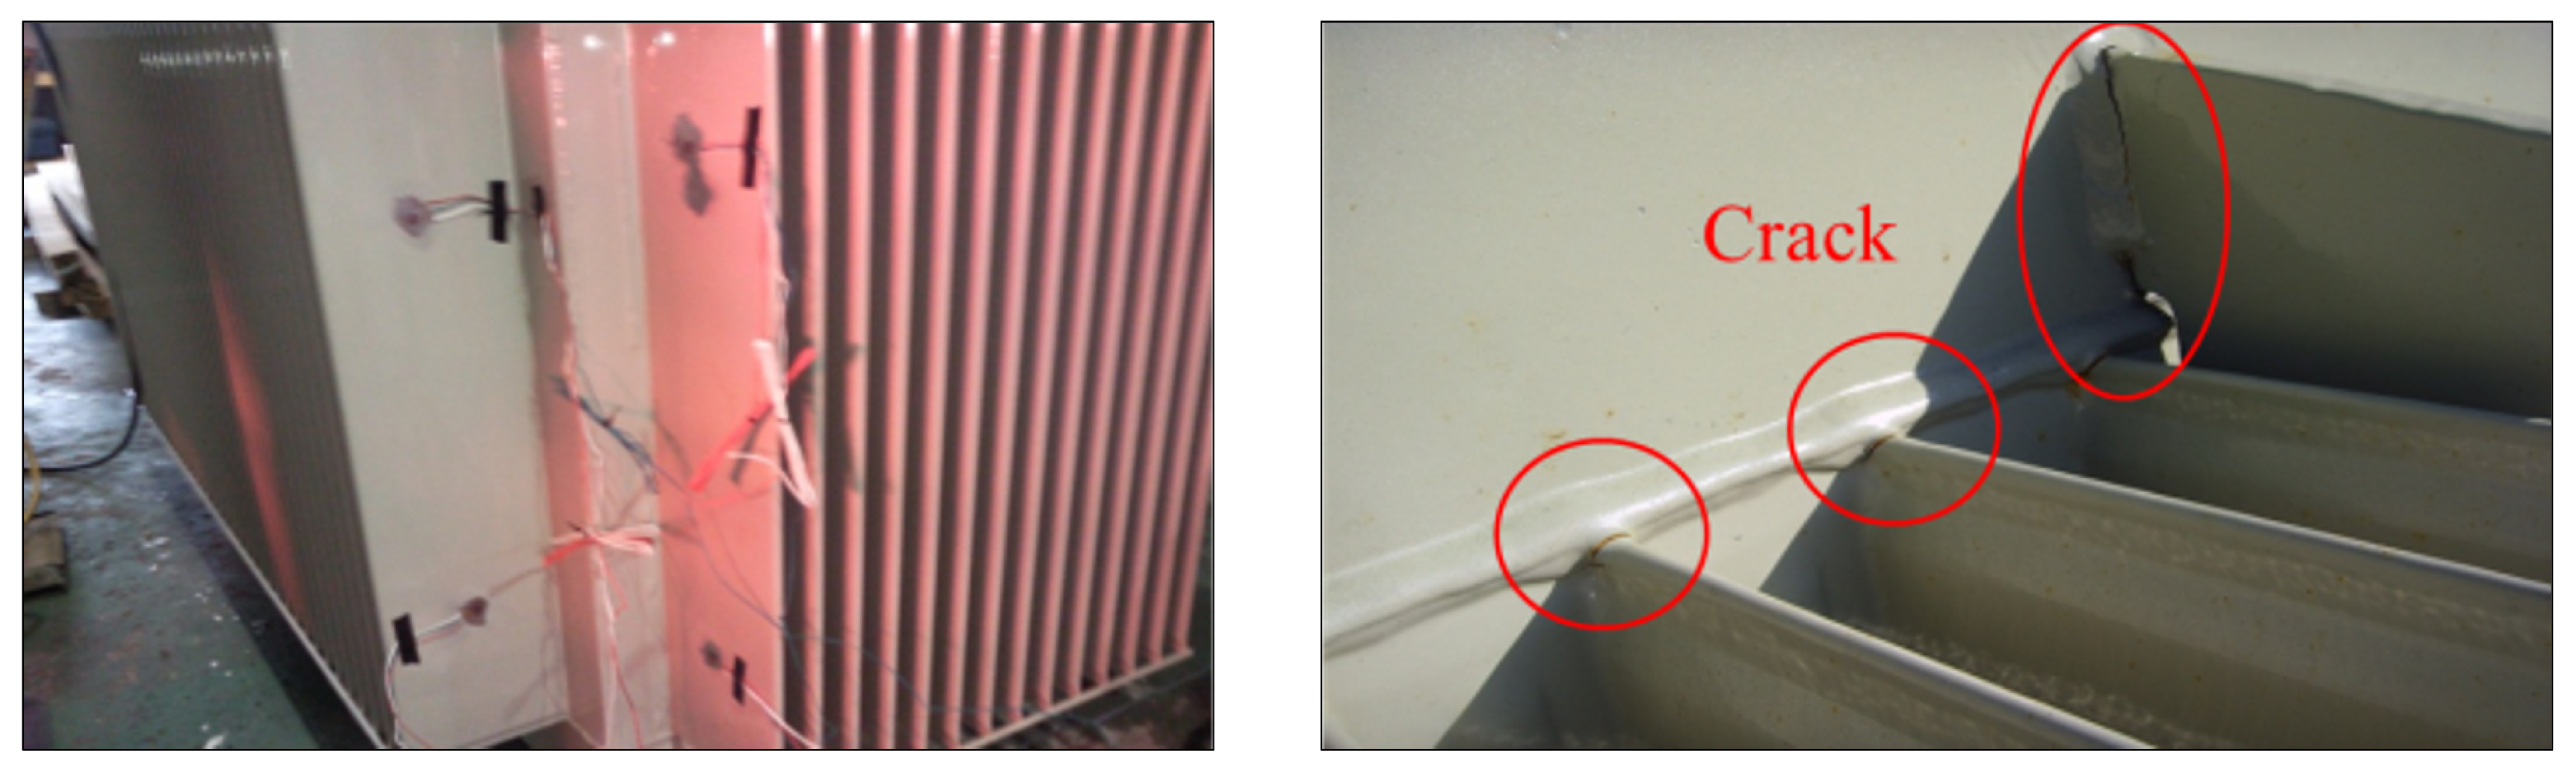
2. Temperature Behaviors
2.1. Test Transformer
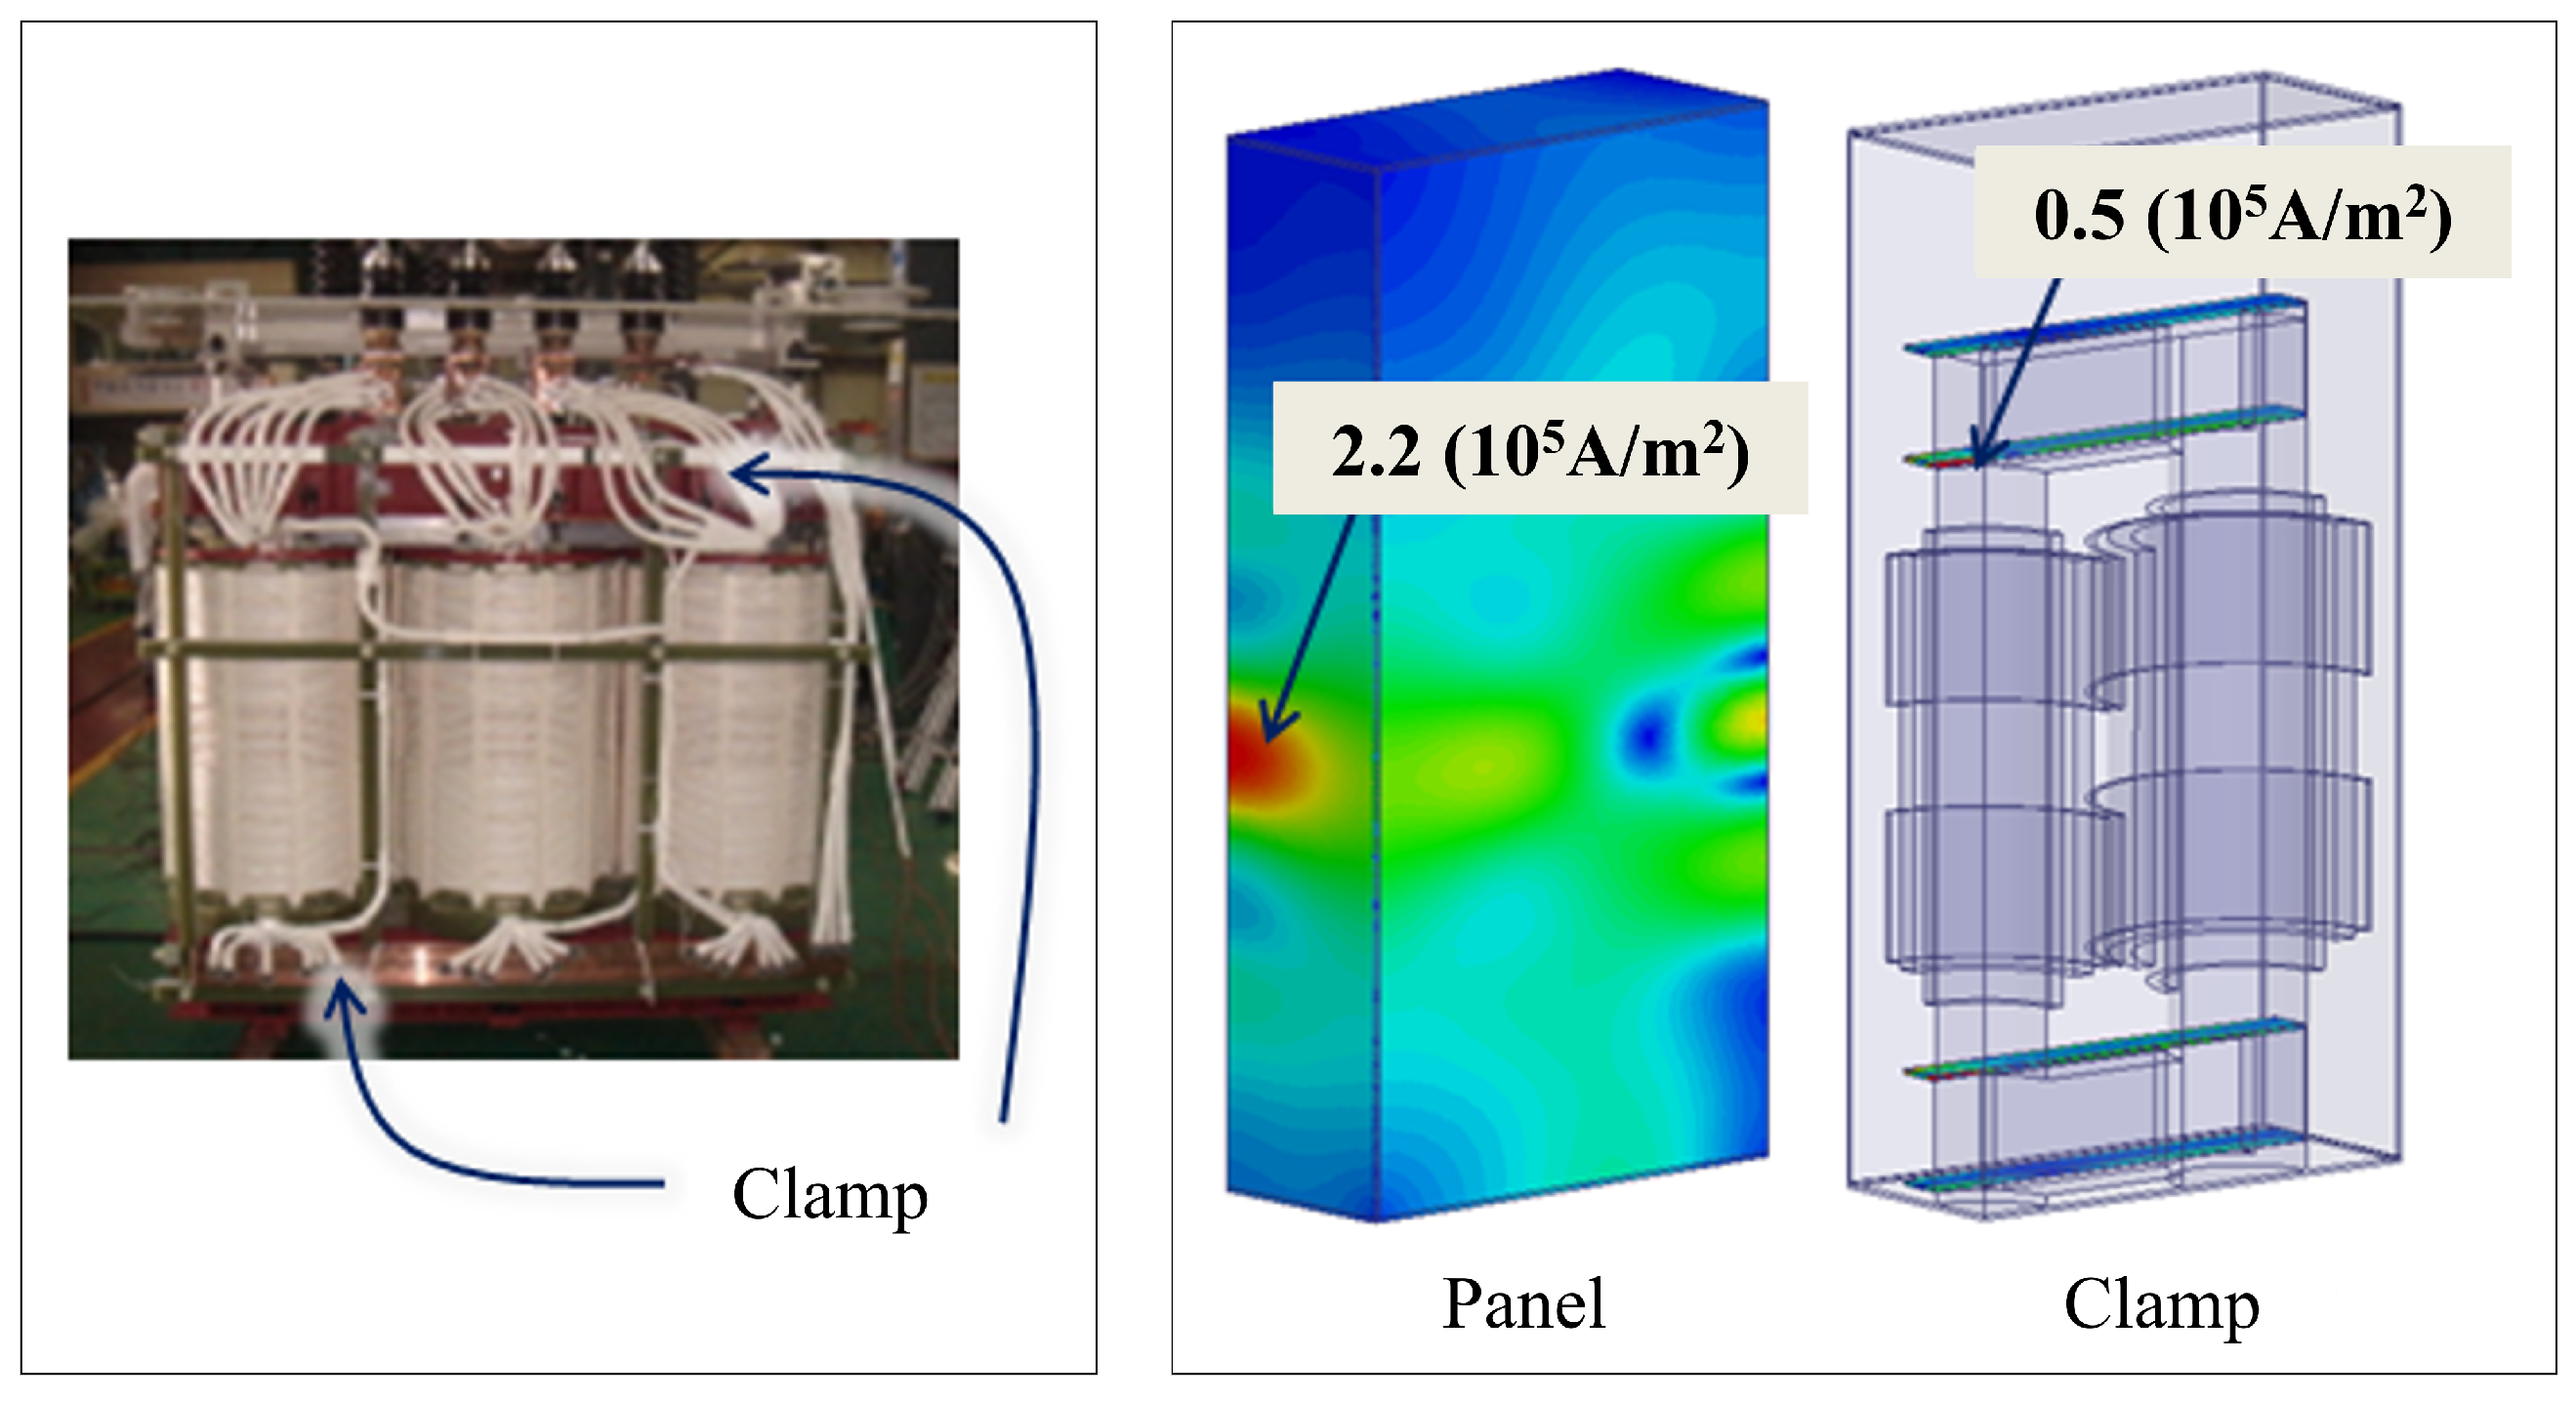
2.2. Electromagnetic Analysis
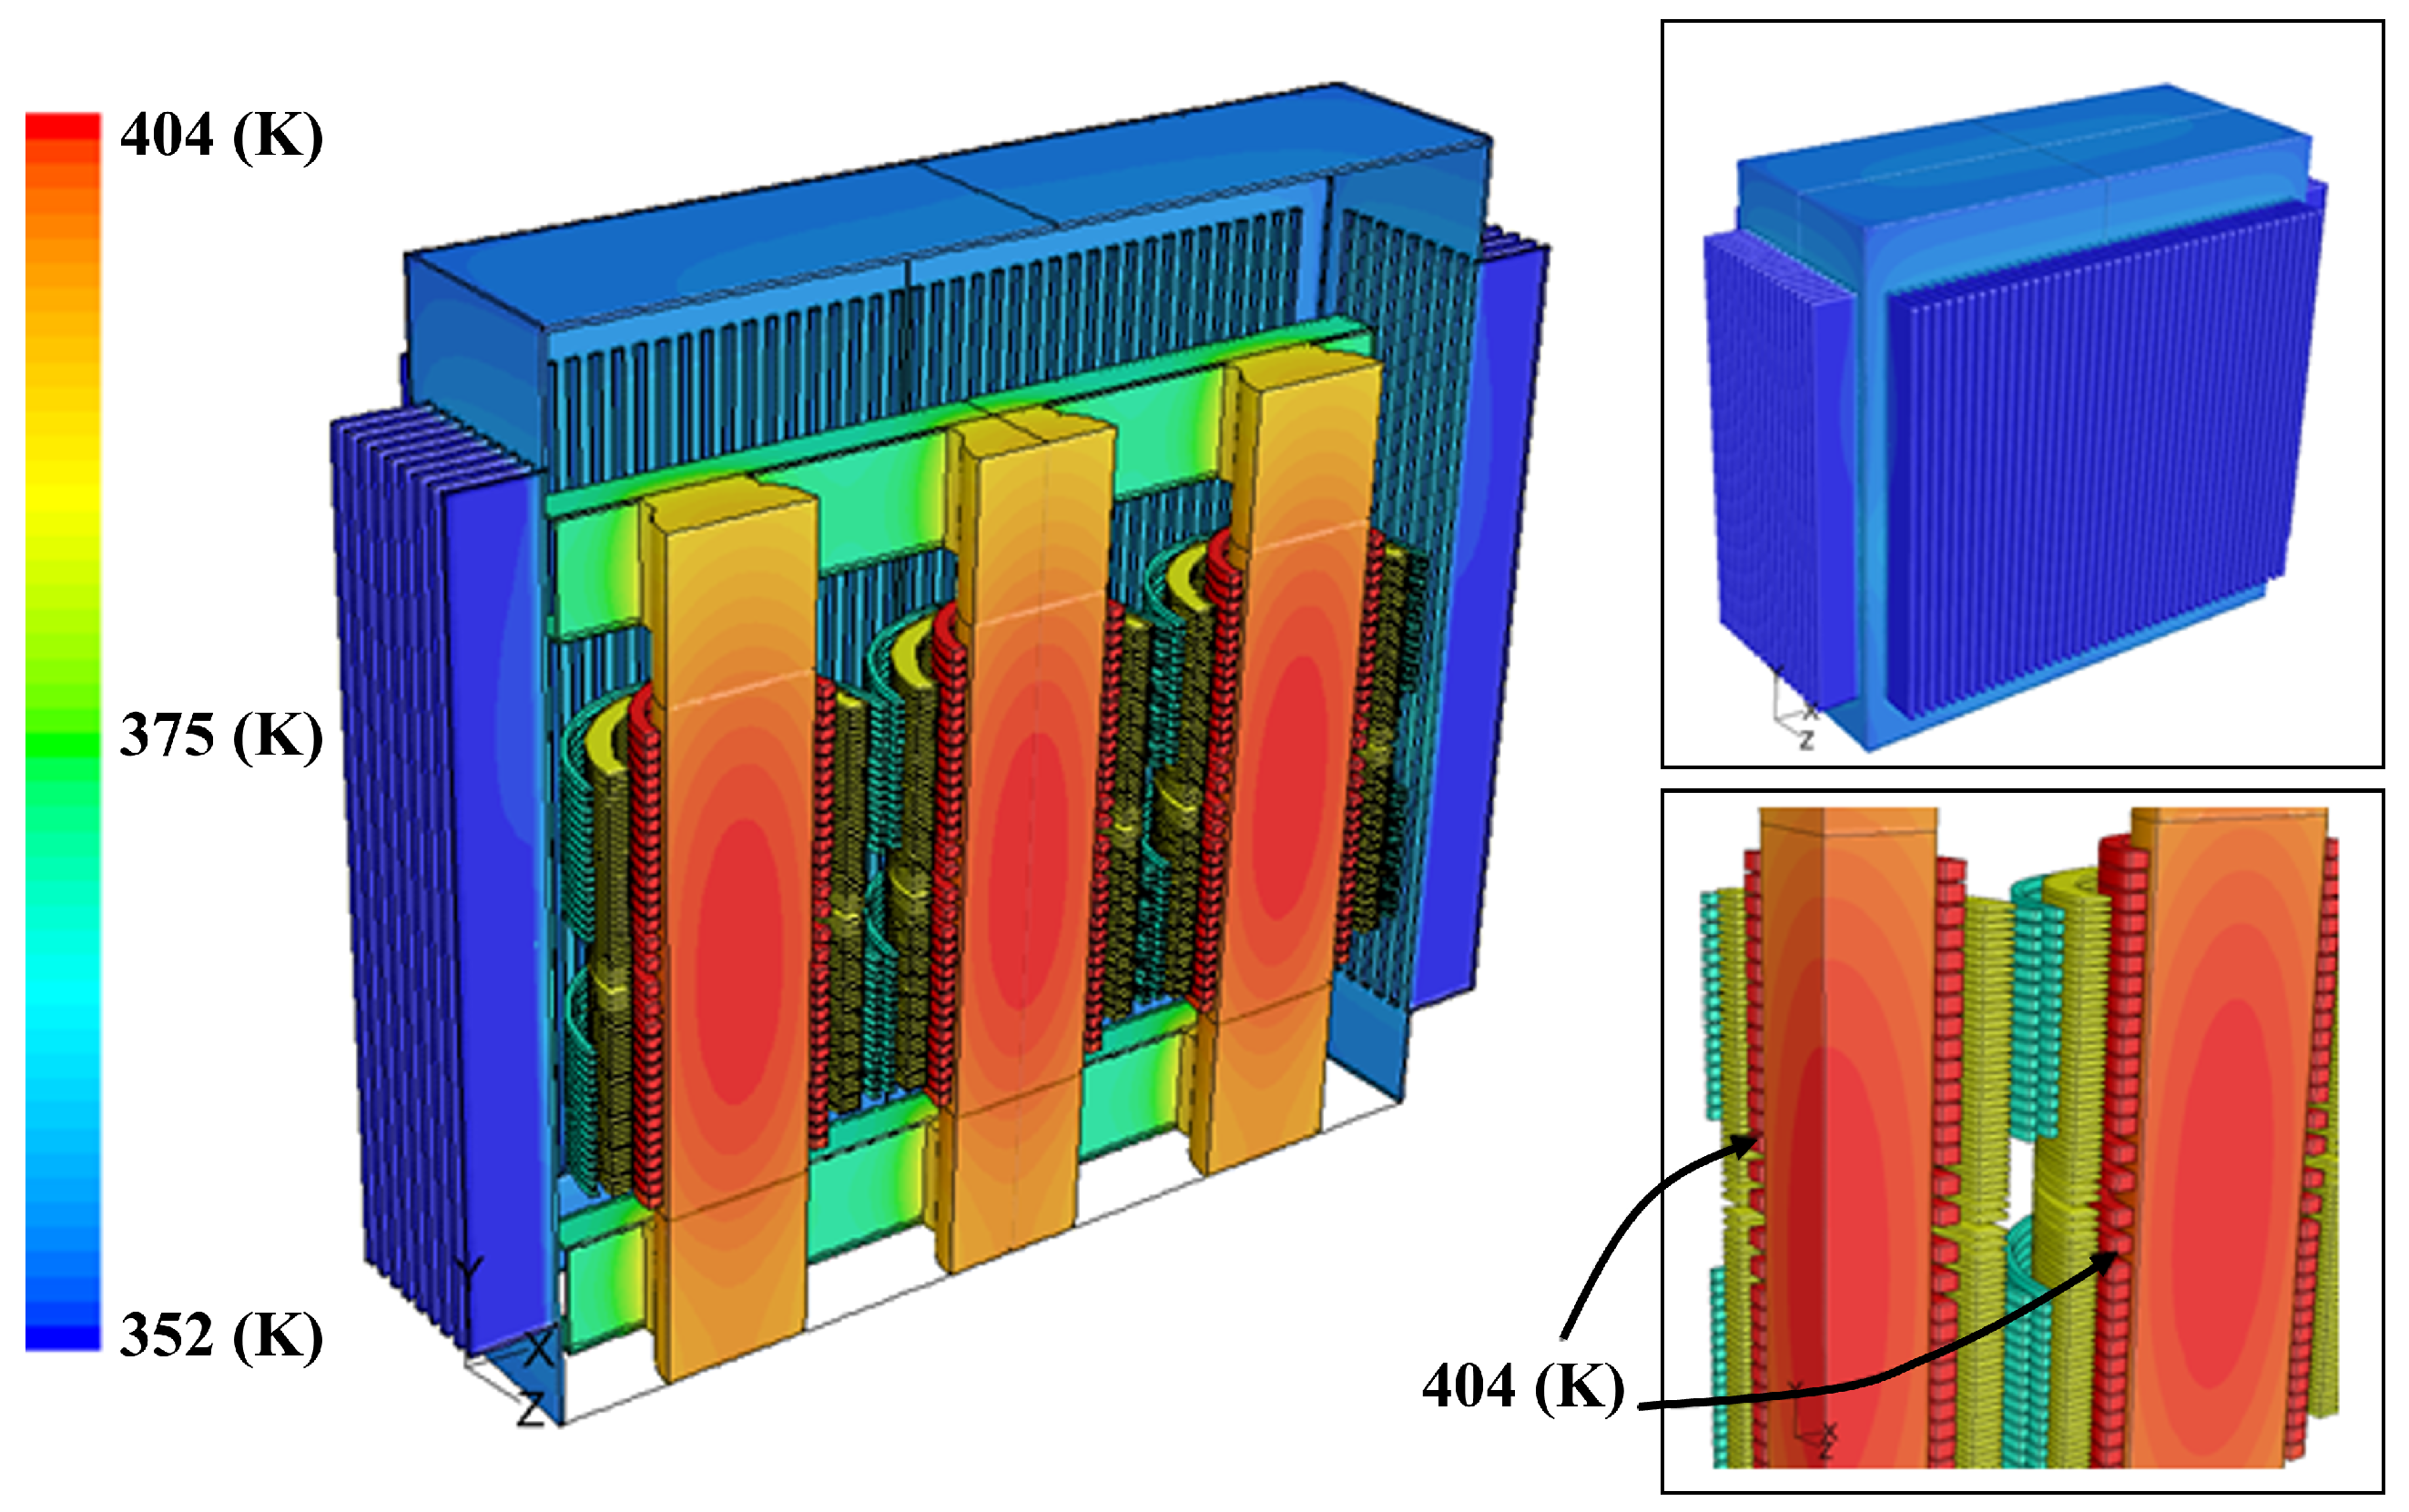
2.3. Heat Transfer Analysis
3. Optimum Design
3.1. Design Variables, Levels, and Samplings
3.2. Optimization Formulation
- CASE I: structural strength optimizationMinimize: membrane stress (, )
- CASE II: stiffness optimizationMaximize: First natural frequency (, )
- CASE III: structural strength and stiffness optimizationMinimize: membrane stress (, )Maximize: First natural frequency (, )8 ≤ ≤ 12, 1 ≤ ≤ 2
4. Results and Discussion
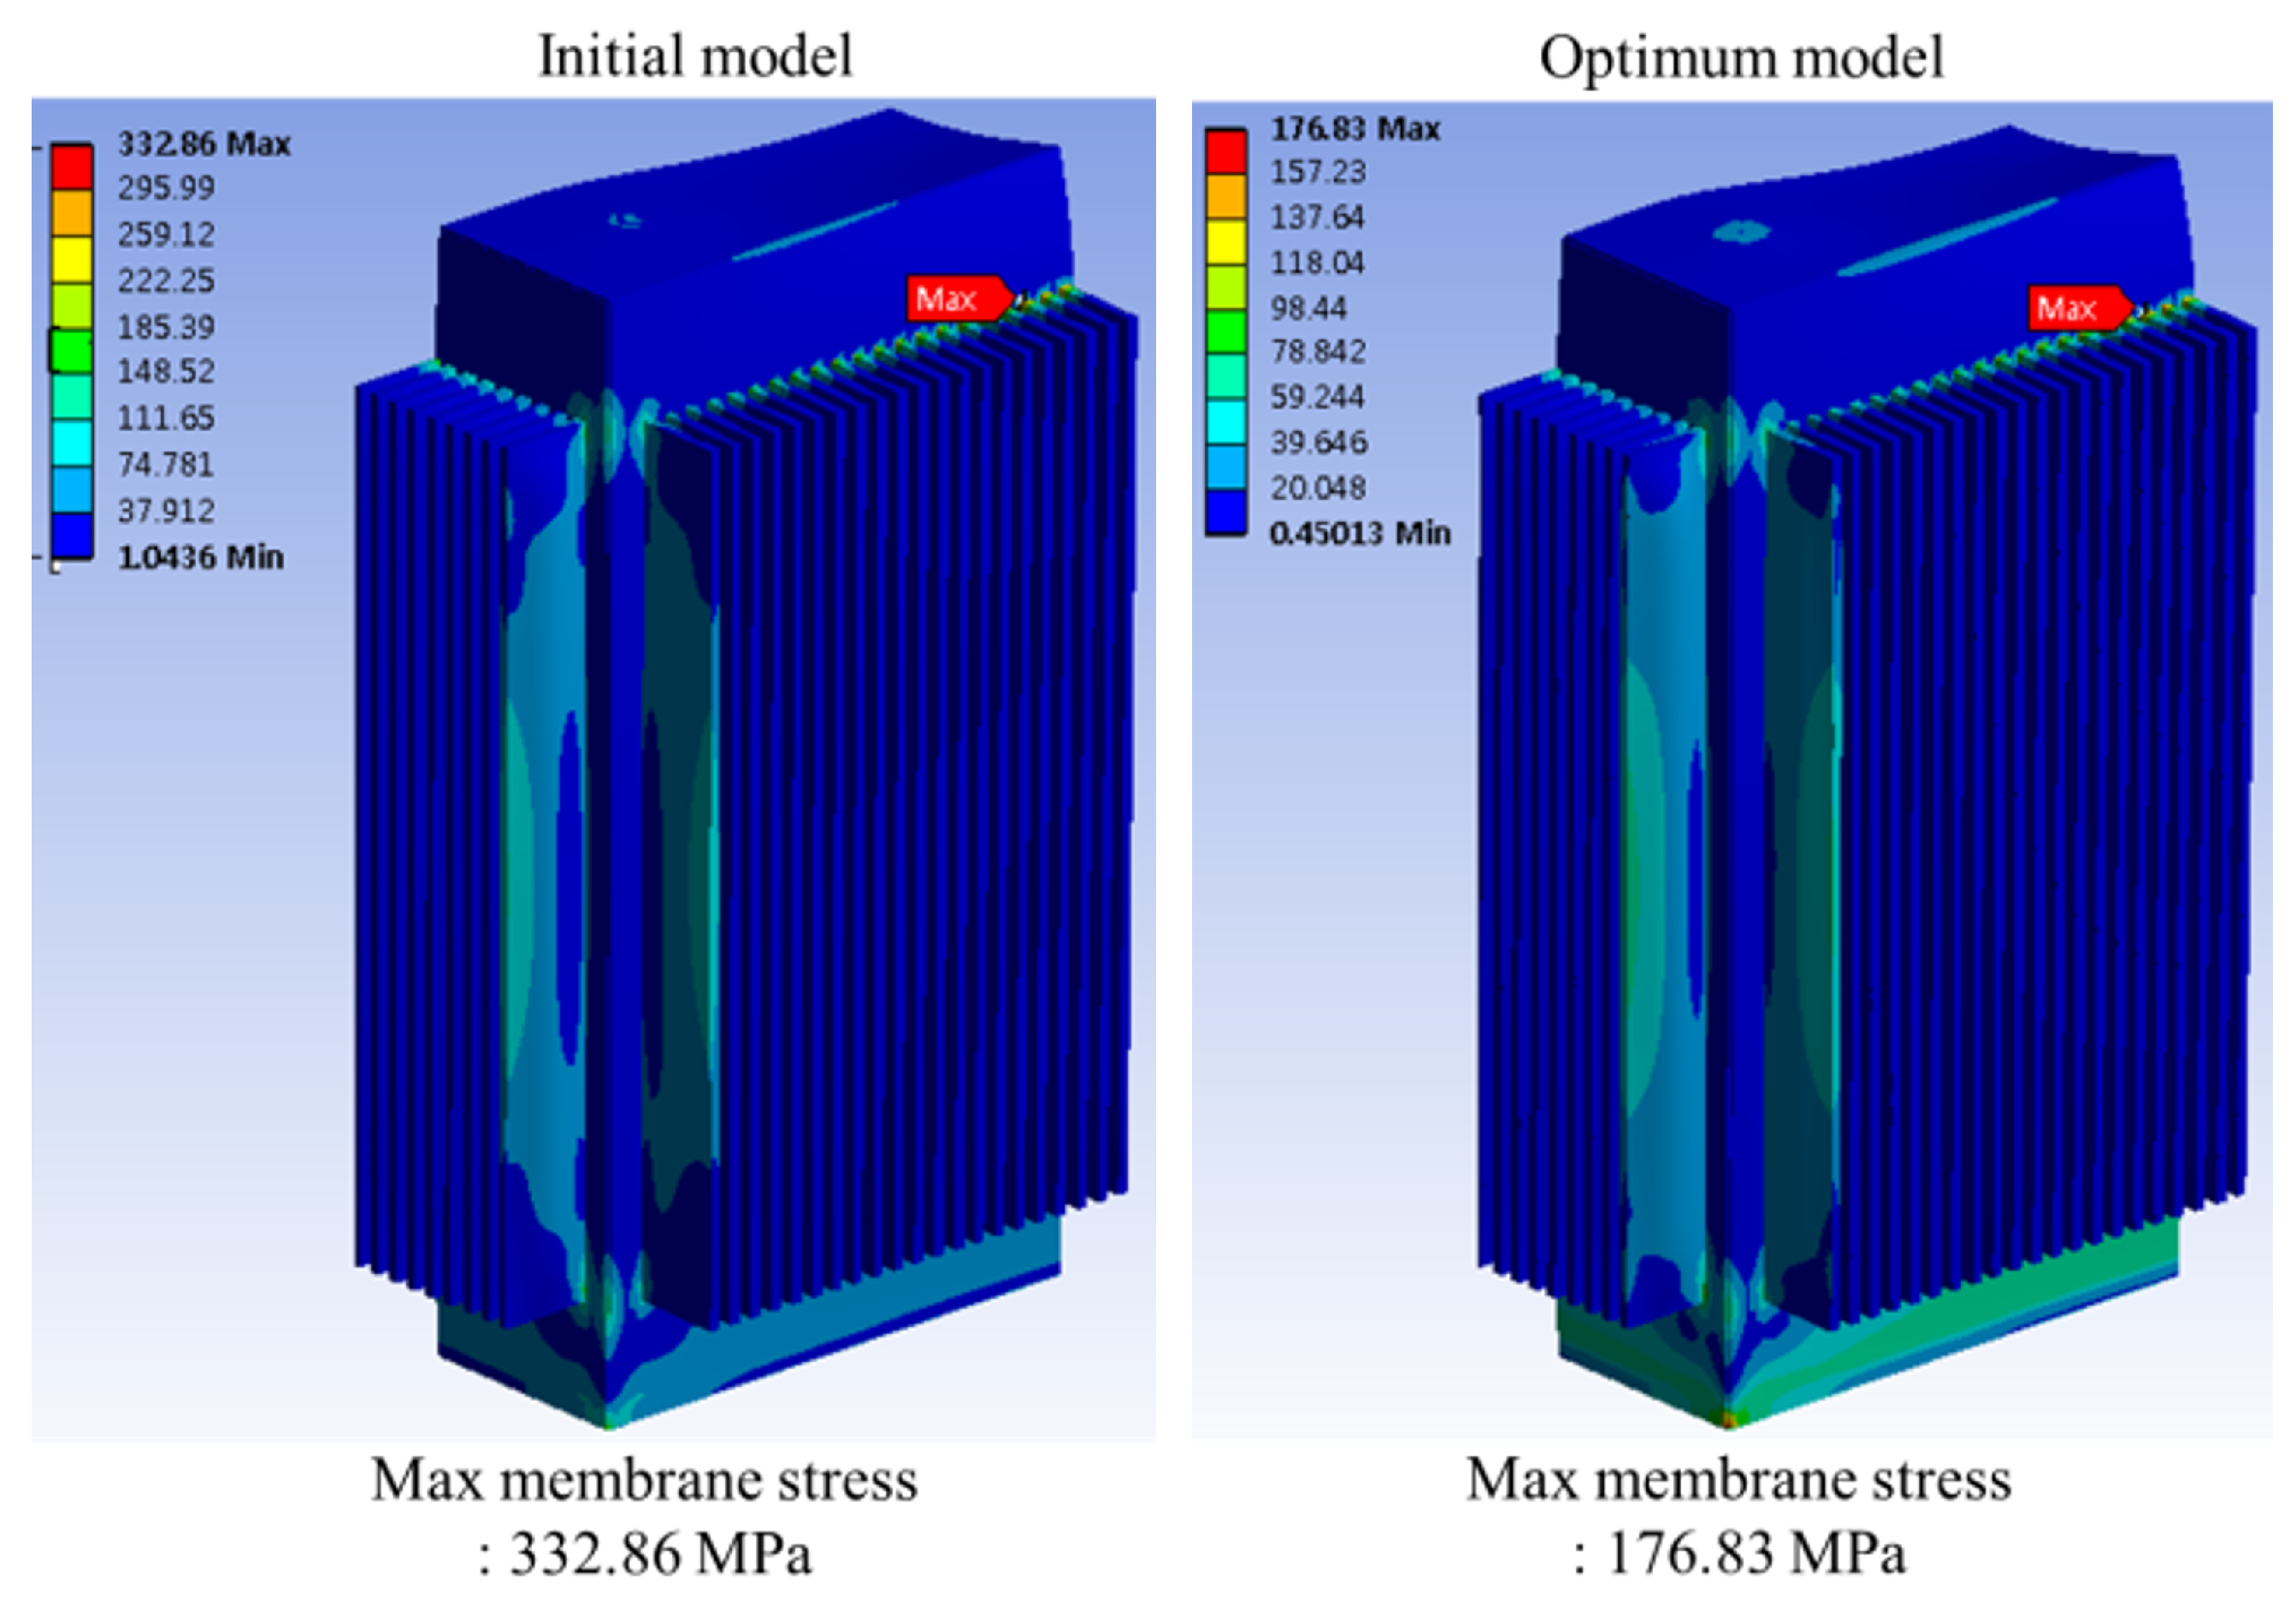
4.1. Structural Strength Results
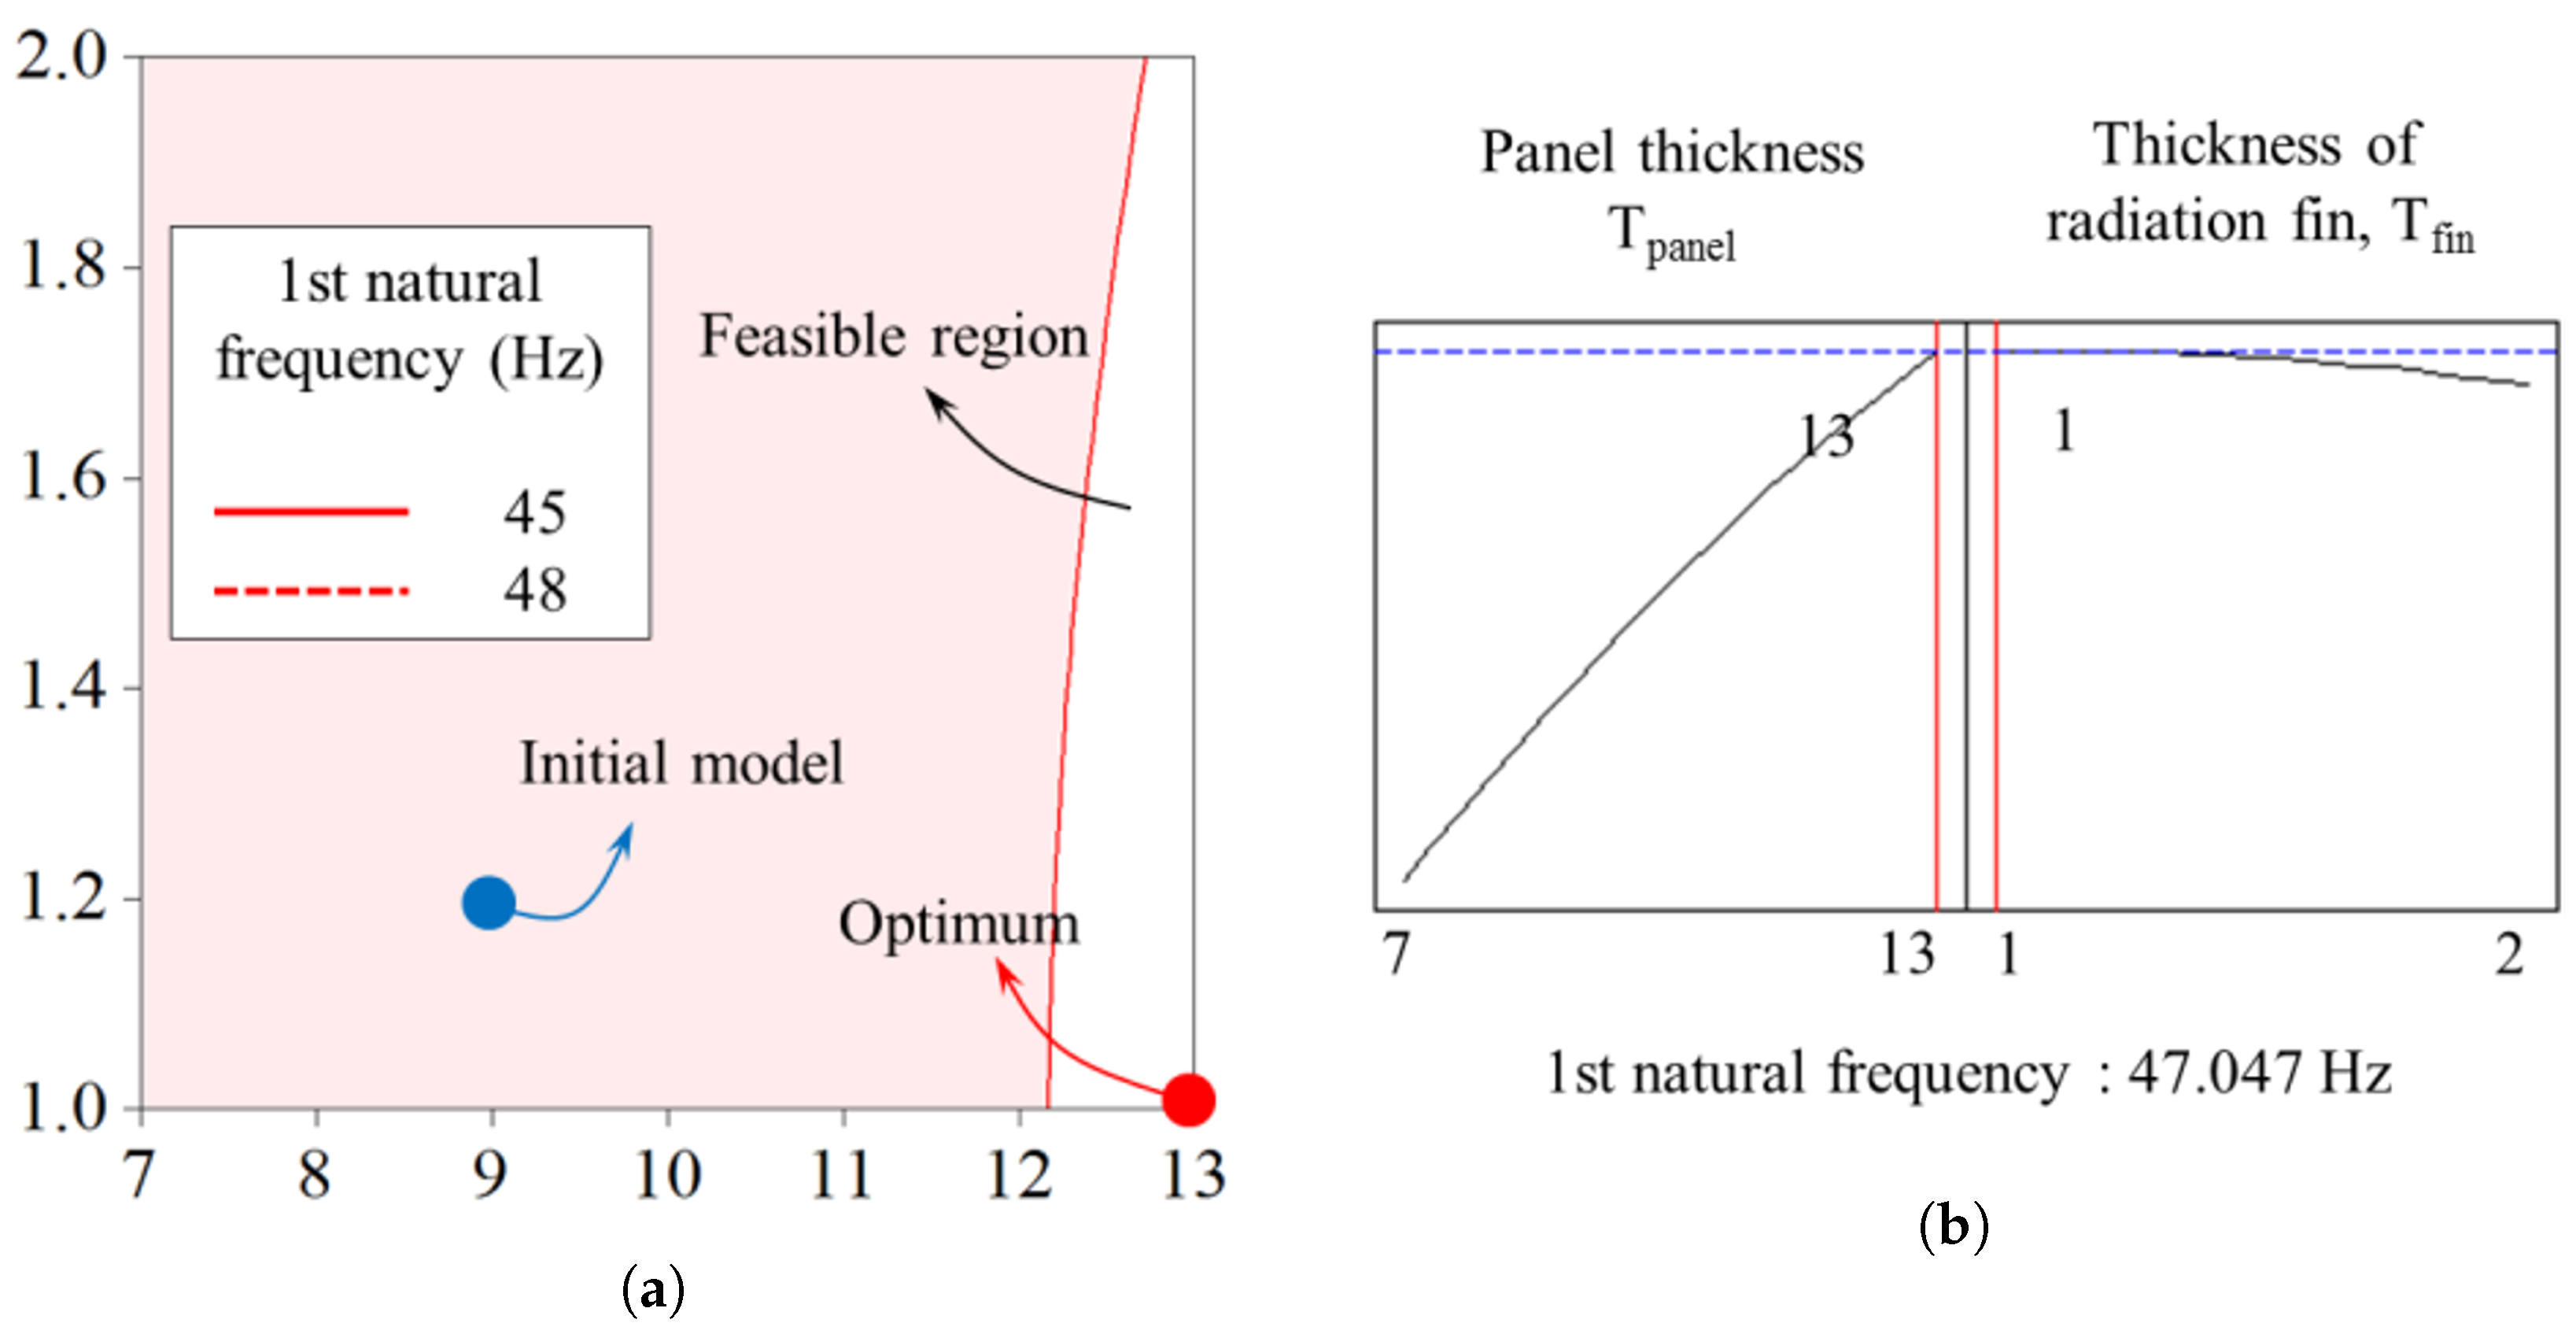
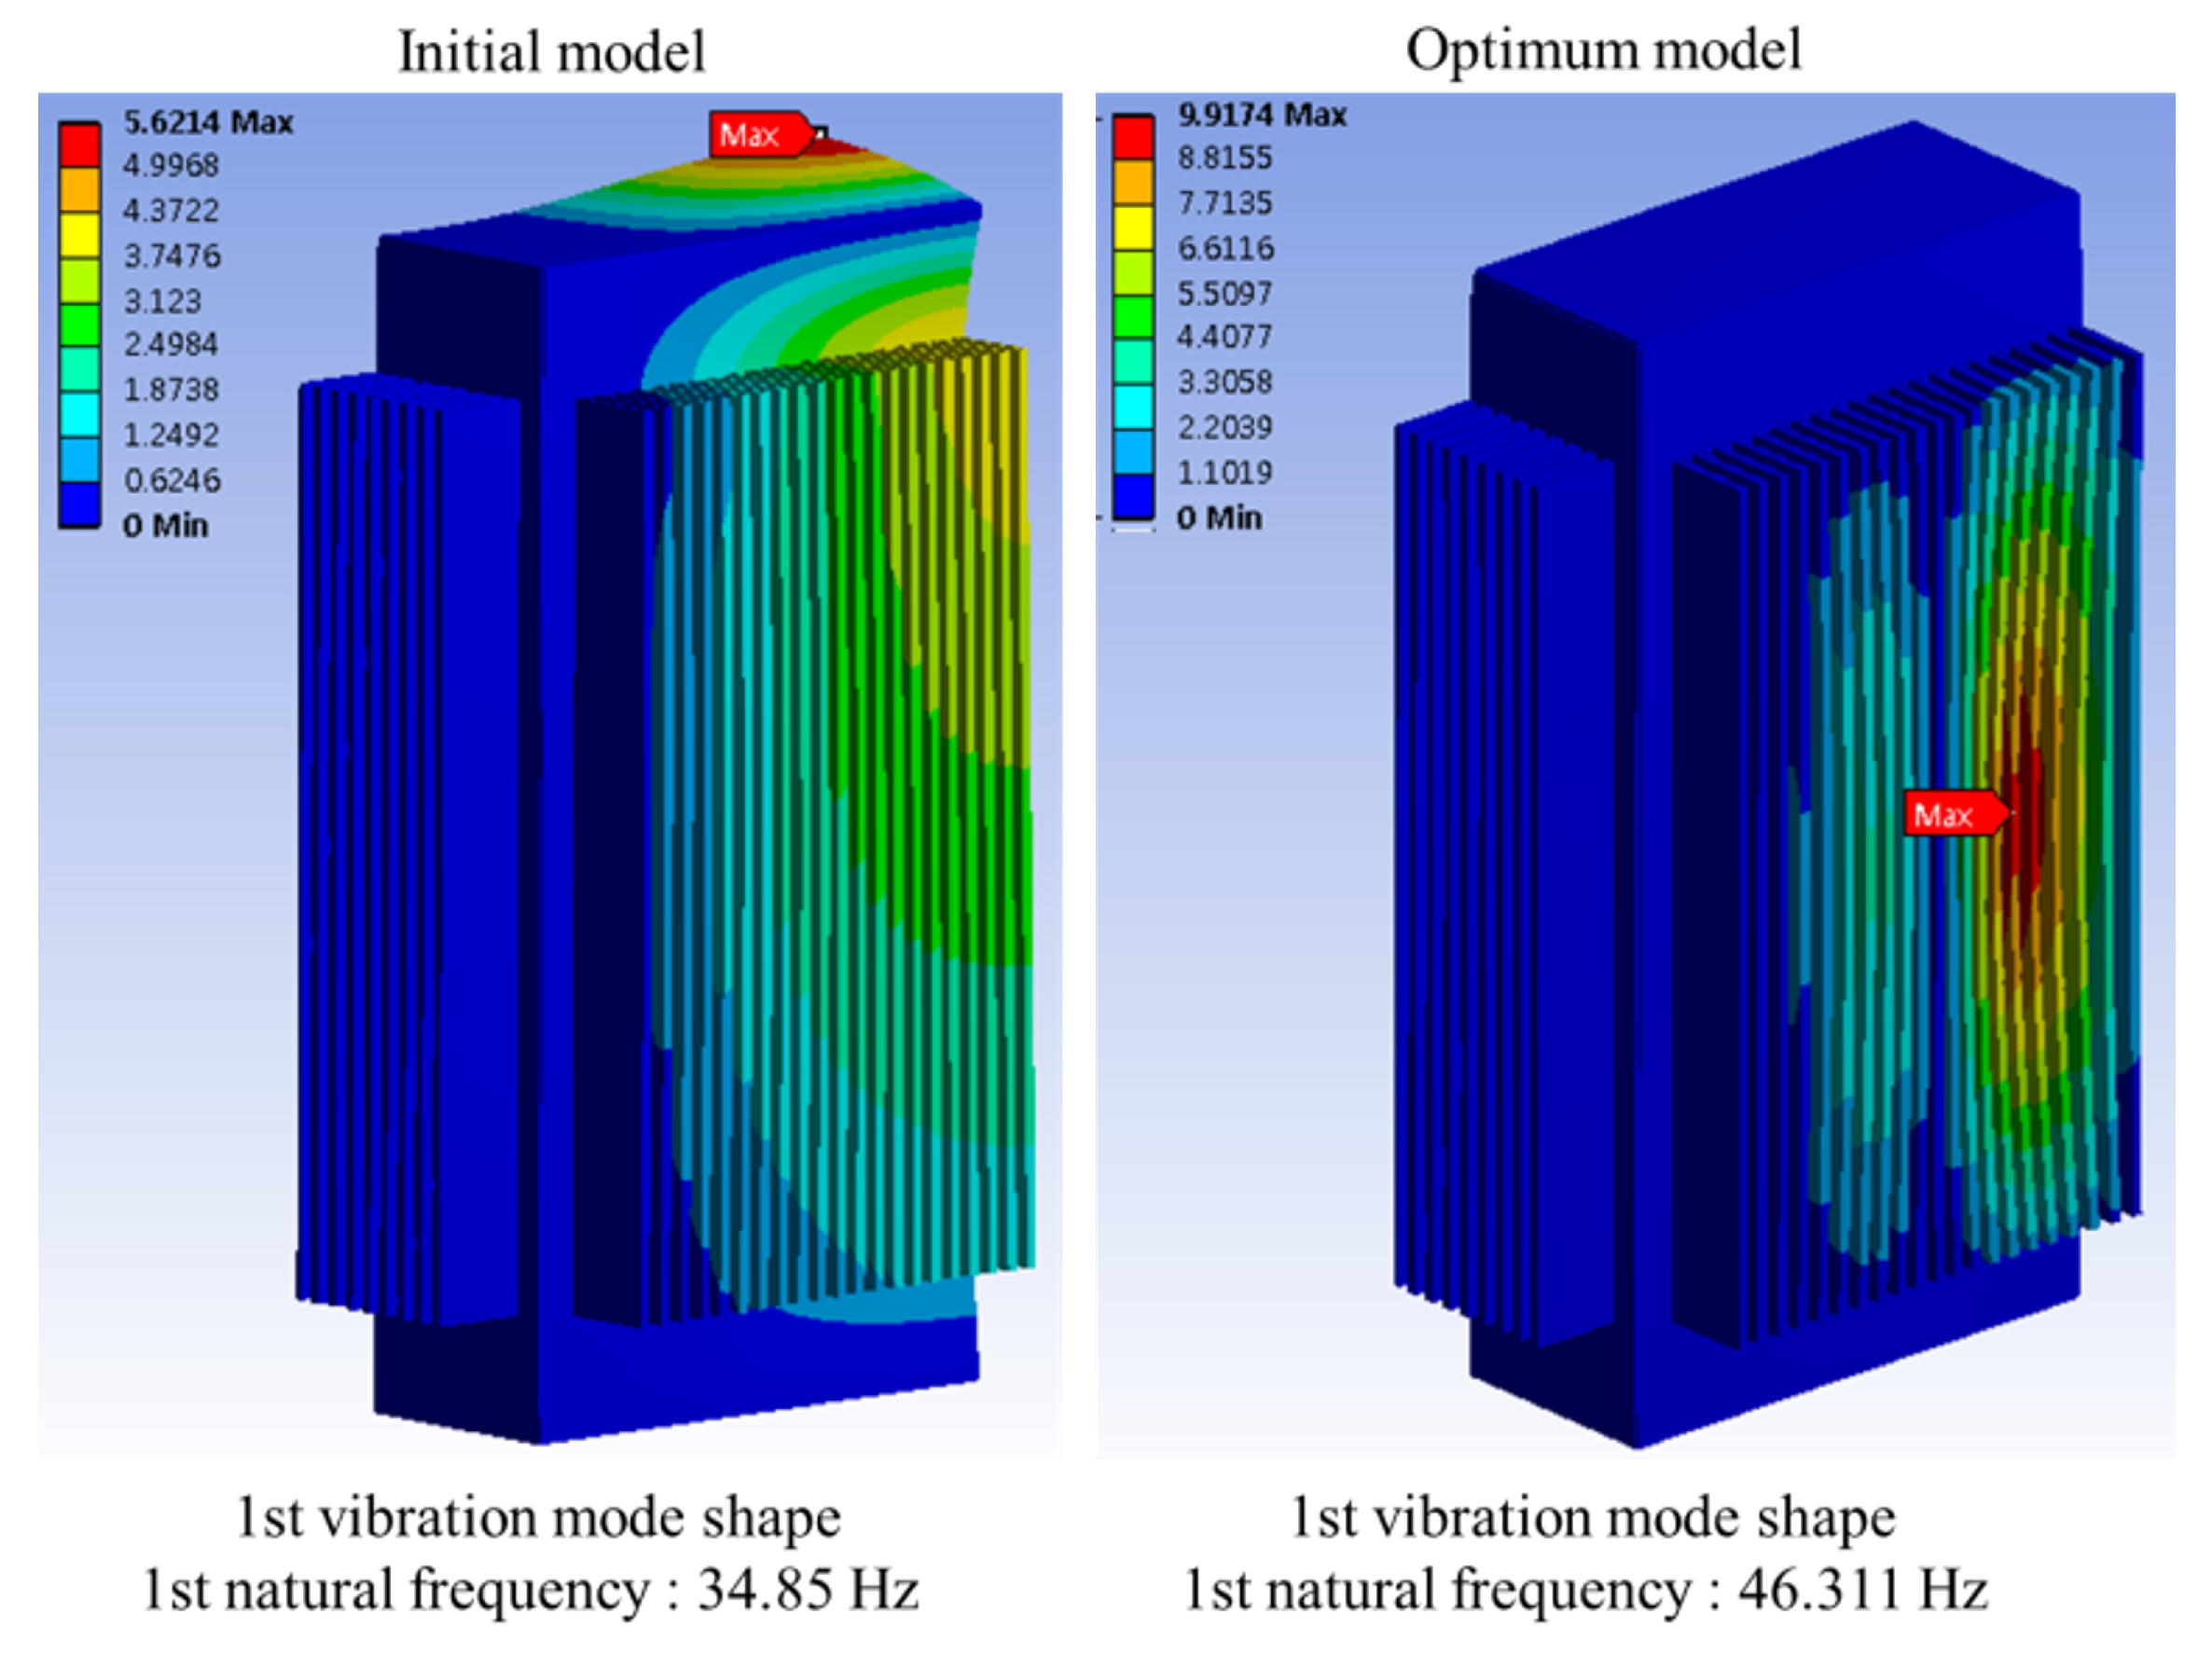
4.2. Stiffness Improvement
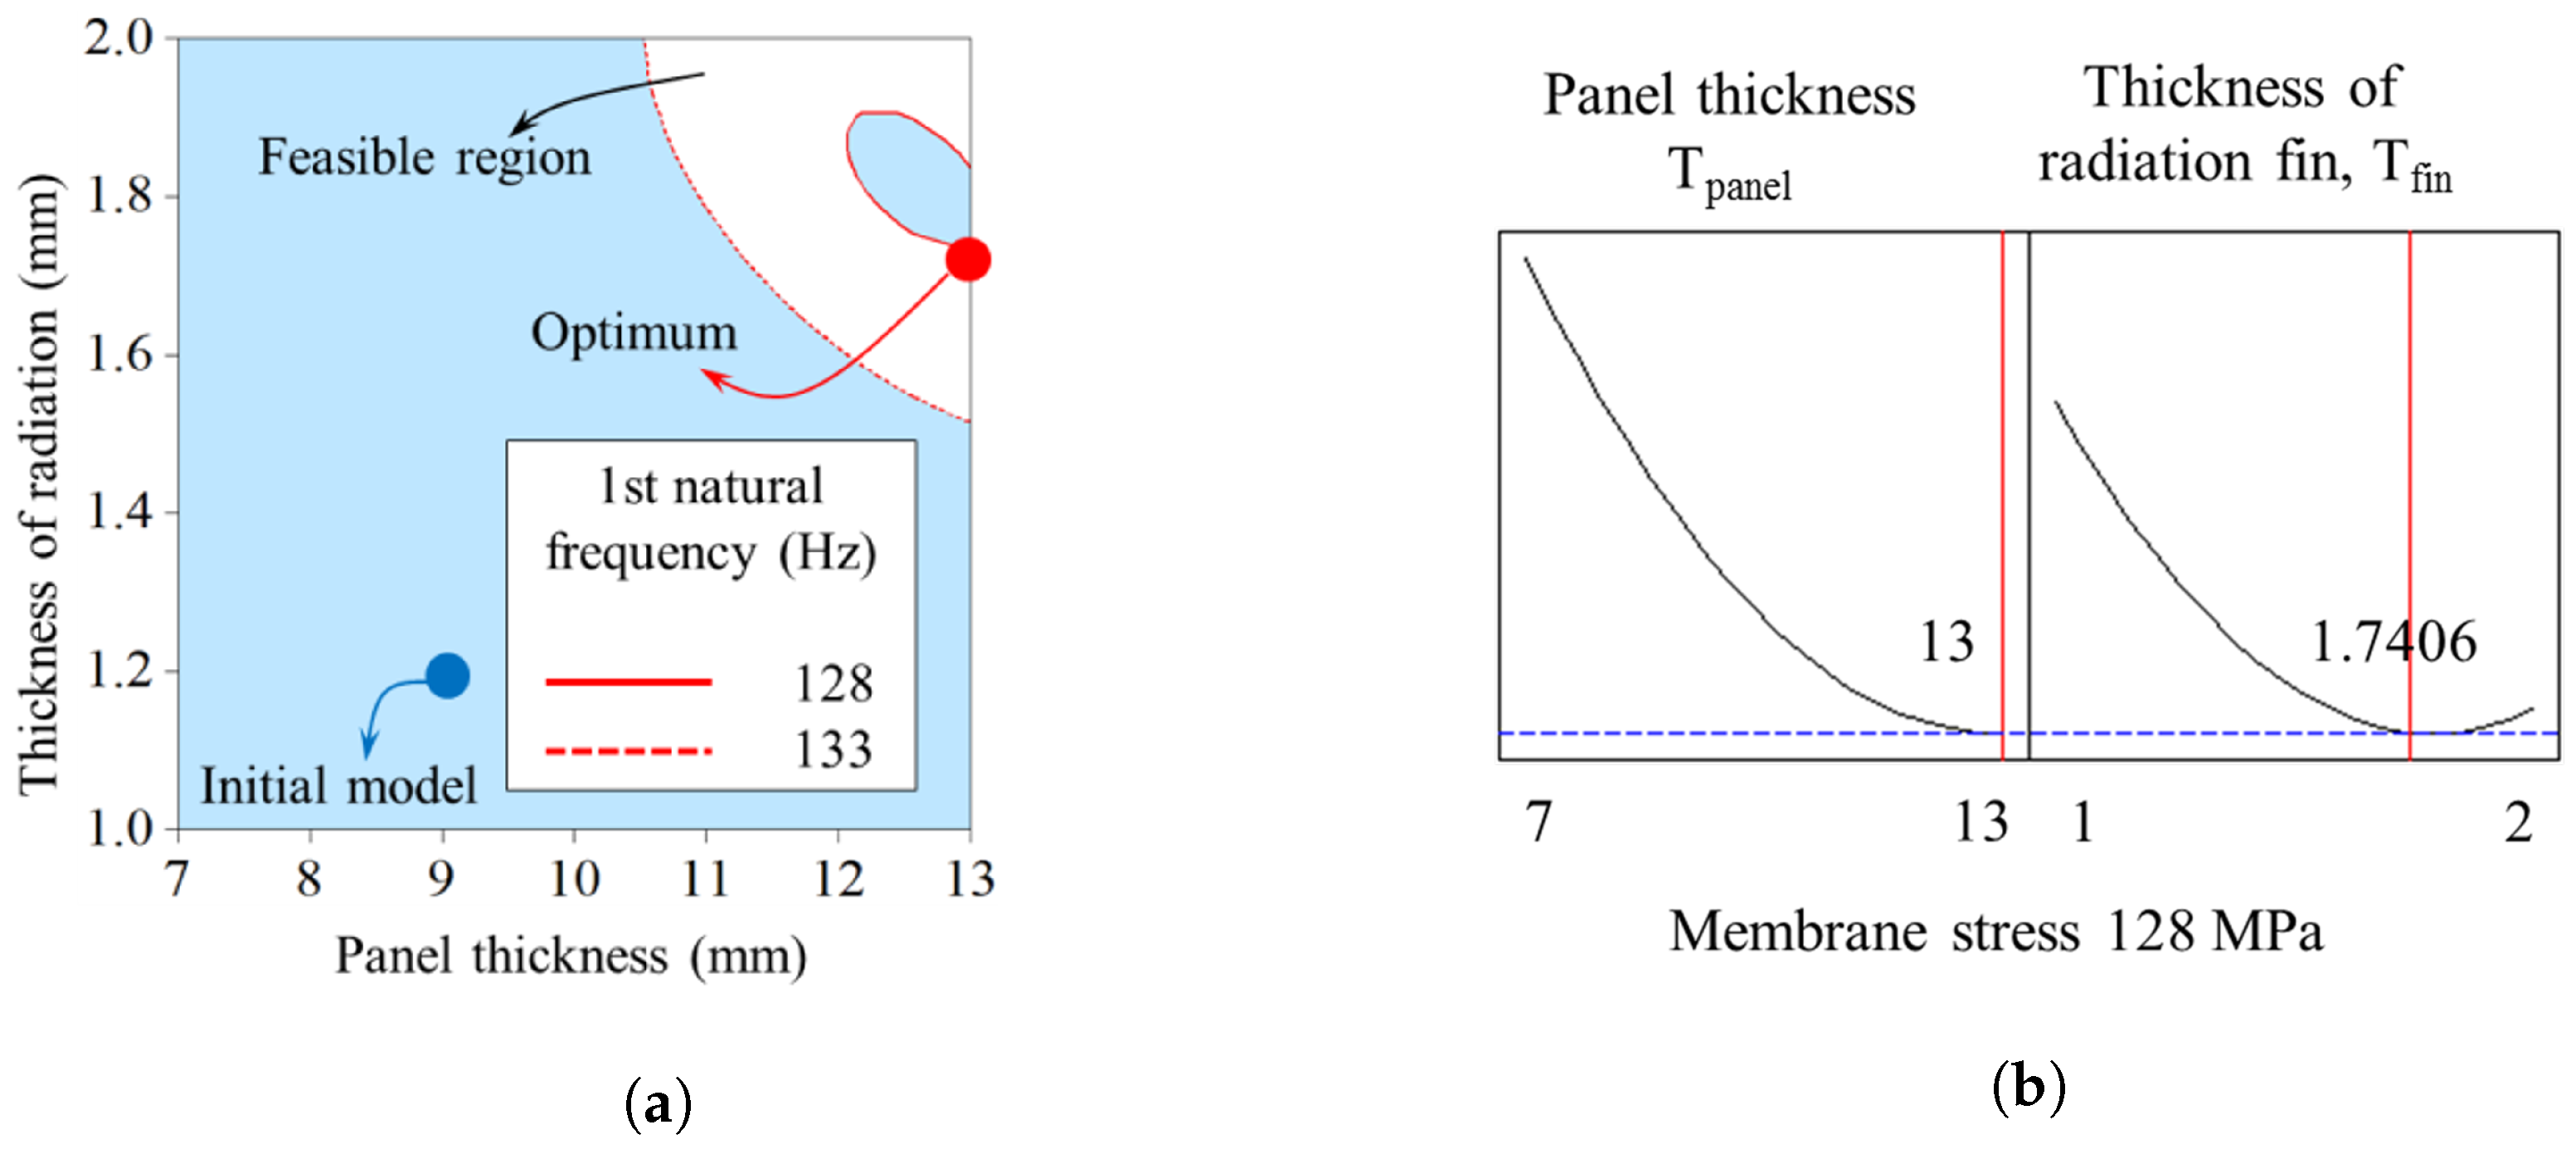
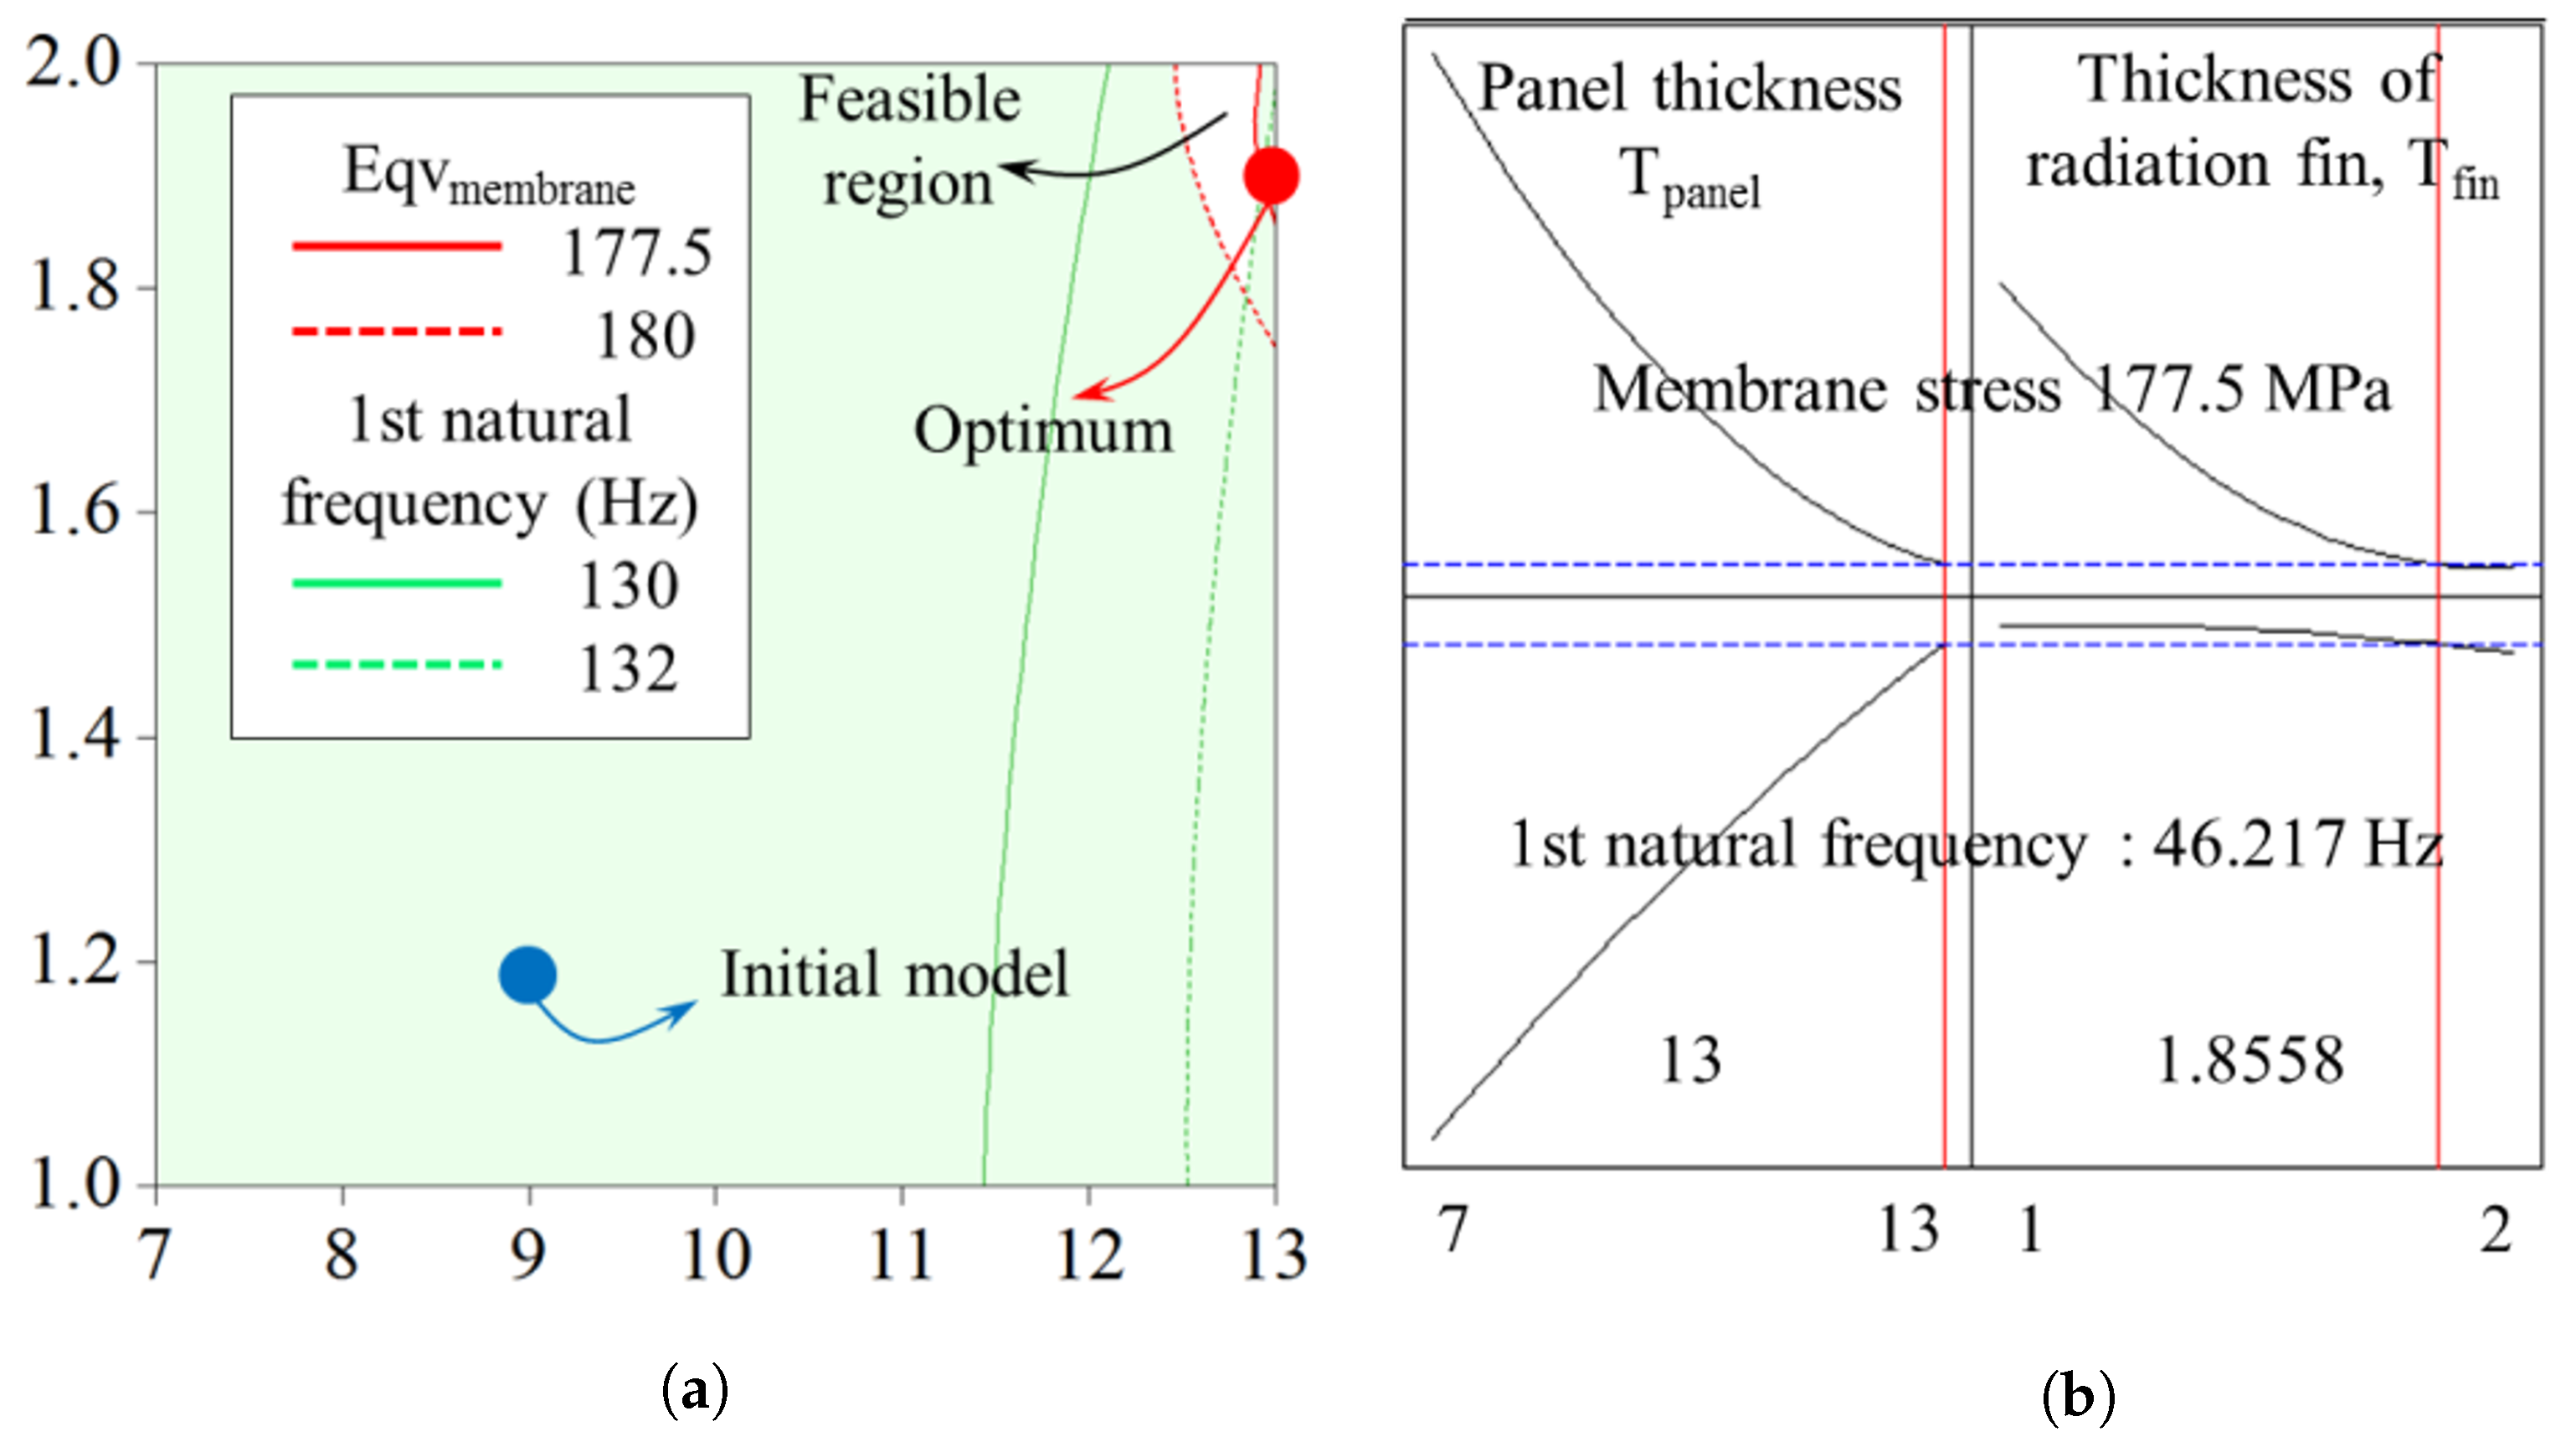
4.3. Combined Optimization Results
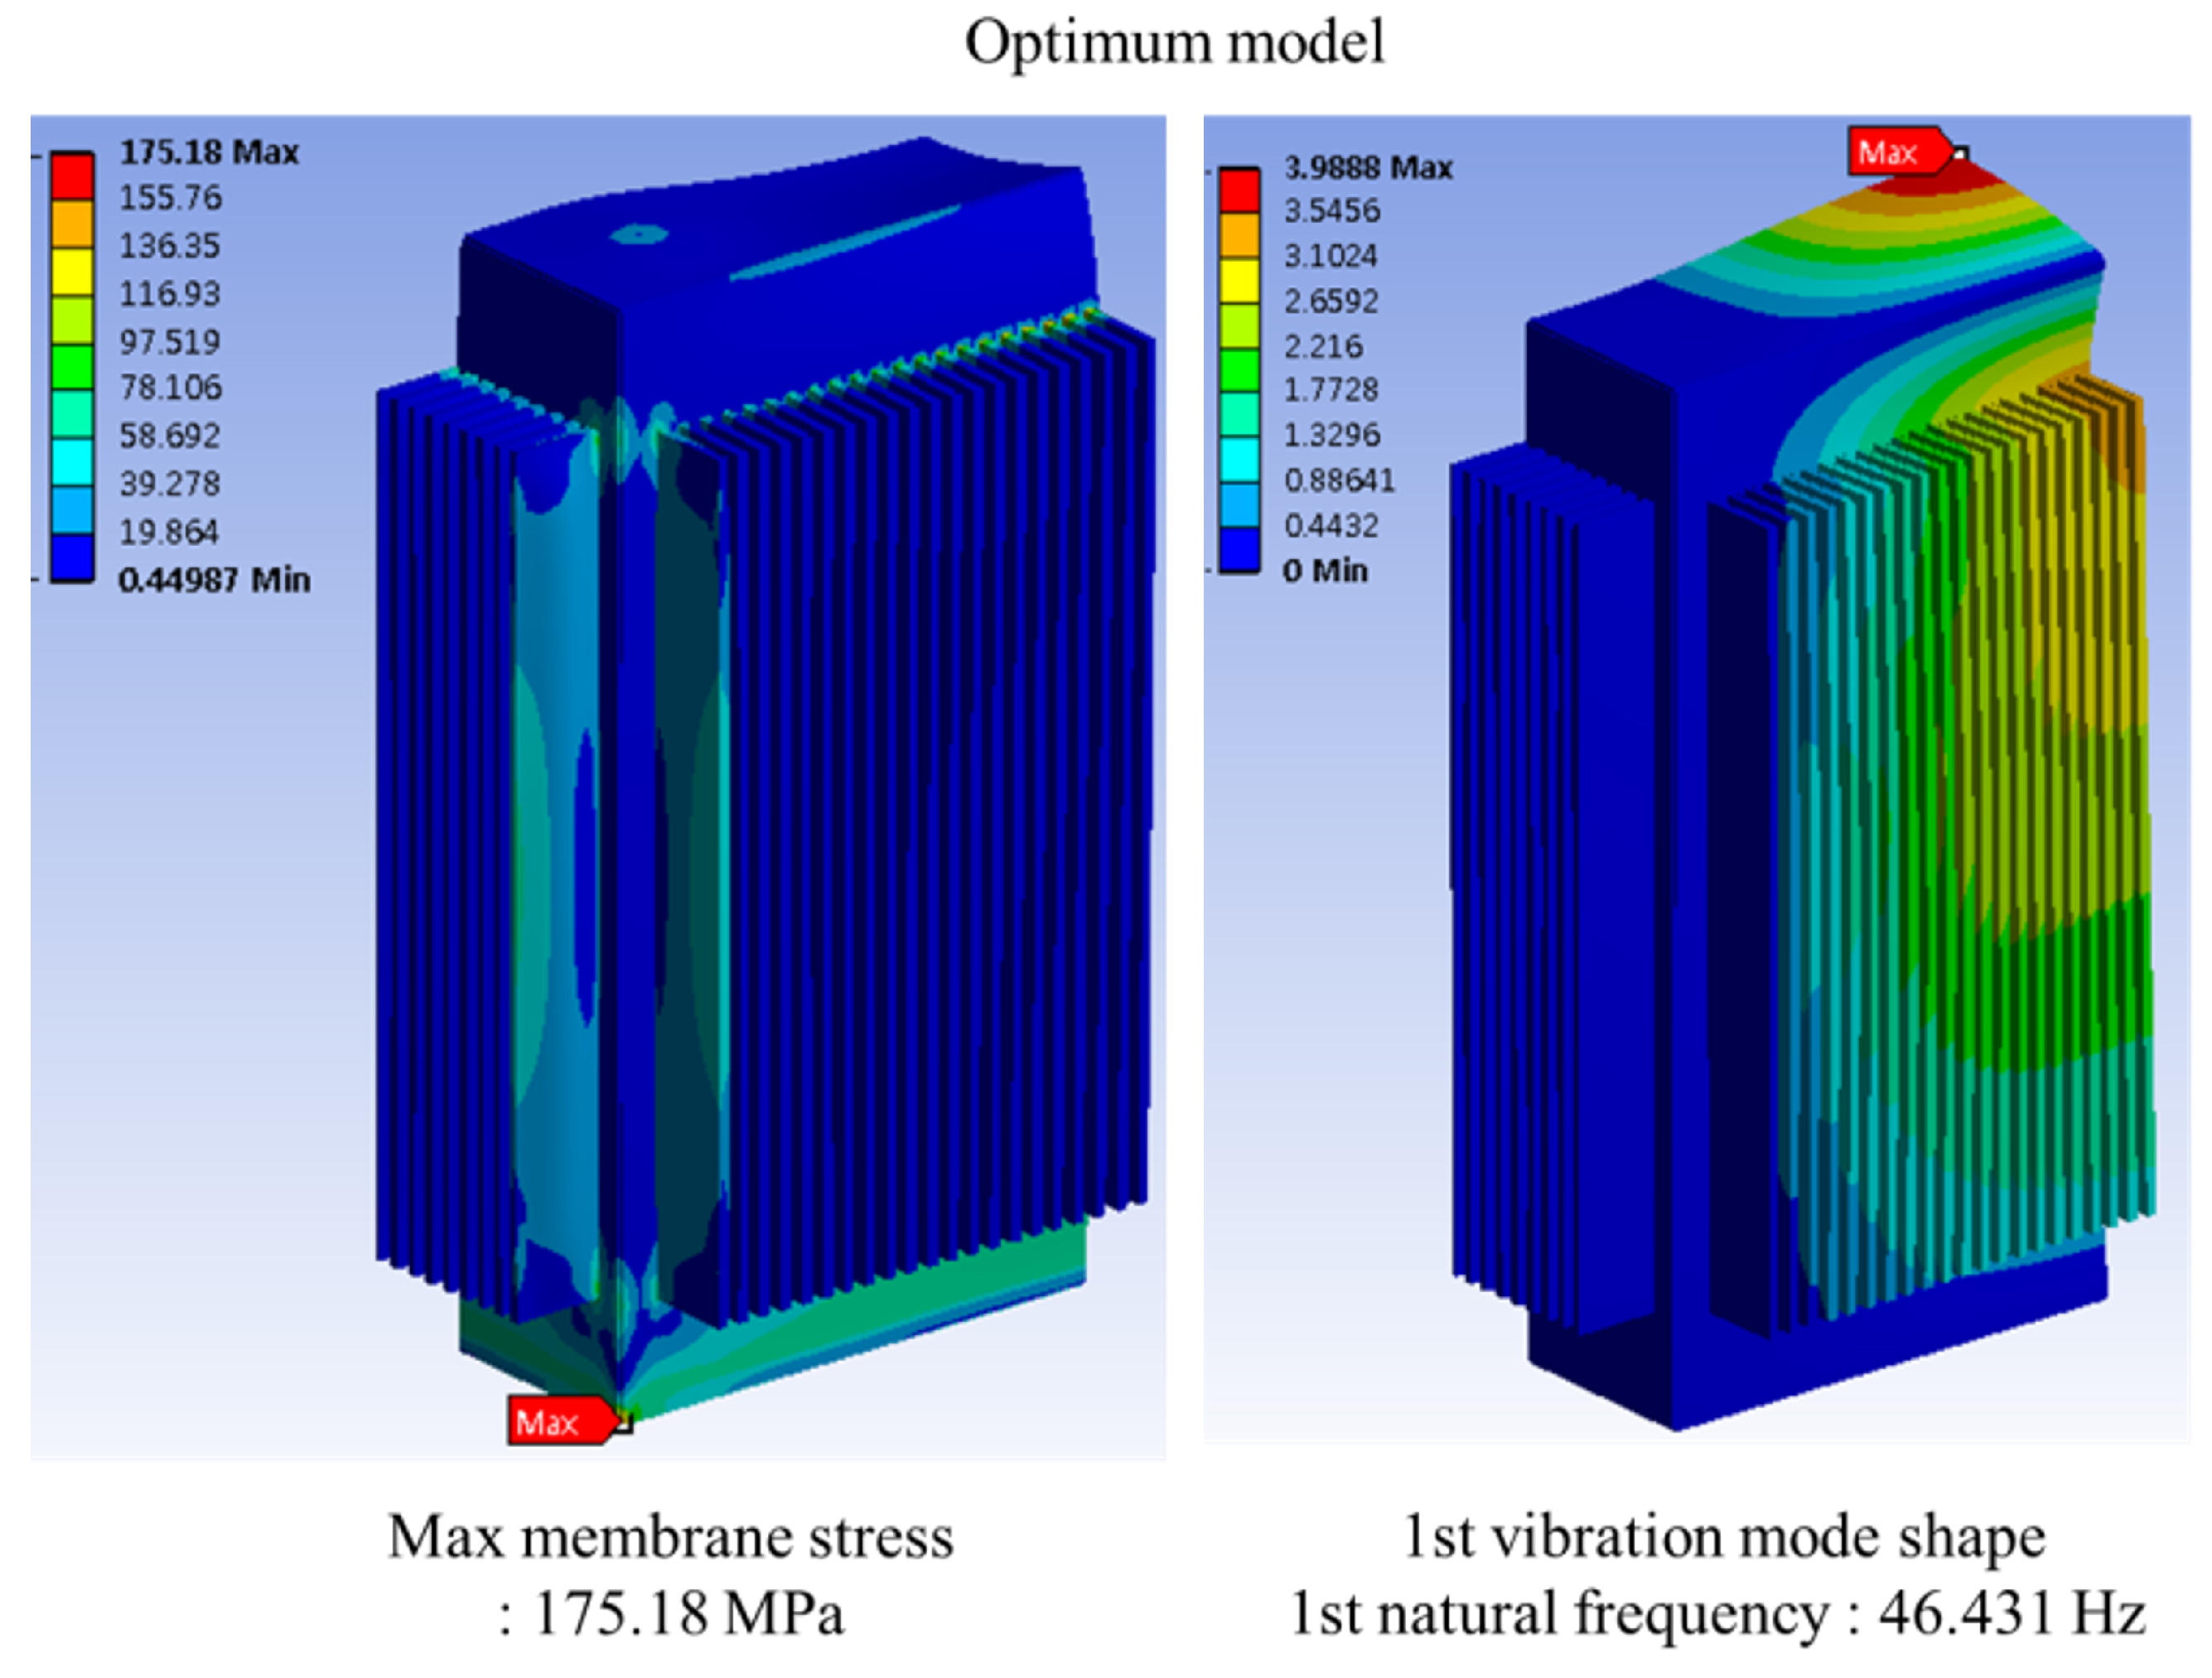
4.4. Validation of Results
5. Conclusions
Author Contributions
Funding
Data Availability Statement
Conflicts of Interest
References
- Du, Y.; Lv, S.; Zhang, Y. Application of Vegetable Oil-Based Insulating Liquids in Power Transformers: A Review. Renew. Sustain. Energy Rev. 2015, 52, 209–220. [Google Scholar]
- Amoiralis, E.I.; Tsili, M.A.; Kladas, A.G. Transformer Design and Optimization: A Literature Survey. IEEE Trans. Power Deliv. 2009, 24, 1999–2024. [Google Scholar] [CrossRef]
- Li, J.; Jia, Z.; Wang, S.; Liu, S. Pressure Characteristics in the Nitrogen-Sealed Power Transformers under Internal Faults. Processes 2024, 12, 1167. [Google Scholar] [CrossRef]
- Aslam, M.; Ul Haq, I.; Rehan, M.S.; Basit, A.; Arif, M.; Khan, M.I.; Sadiq, M.; Arbab, M.N. Dynamic Thermal Model for Power Transformers. IEEE Access 2021, 9, 71461–71469. [Google Scholar] [CrossRef]
- Ortiz, C.; Skorek, A.W. Parallel CFD Analysis of Conjugate Heat Transfer in a Dry-Type Transformer. IEEE Trans. Ind. Appl. 2009, 45, 1530–1534. [Google Scholar] [CrossRef]
- Kim, J.K.; Hahn, S.C.; Park, K.Y. Temperature Rise Prediction of EHV GIS Bus Bar by Coupled Magneto-Thermal Finite Element Method. IEEE Trans. Magn. 2005, 41, 1808–1811. [Google Scholar]
- Liu, Y.; Zhang, Y.; Zhang, W. Stress Analysis and Design Optimization of Transformer Tank Walls. IEEE Trans. Magn. 2020, 56, 1–8. [Google Scholar]
- Wang, C.; Sun, Q.; Al-Abadi, A.; Wu, W. A Combined Computational Fluid Dynamics and Thermal–Hydraulic Modeling Approach for Improving the Thermal Performance of Corrugated Tank Transformers: A Comparative Study. Energies 2024, 17, 1802. [Google Scholar] [CrossRef]
- Wang, H.; Tang, Y.; Li, B.; Li, J. Structural Optimization of Transformer Tanks Considering Vibration and Acoustic Emissions. IEEE Trans. Energy Convers. 2019, 34, 125–133. [Google Scholar]
- Nie, L.; Yang, J.; Tang, K. Thermal Network Modeling of High-Frequency Insulated Core Transformers. IEEE Trans. Appl. Supercond. 2022, 32, 1–7. [Google Scholar] [CrossRef]
- Hong, D.K.; Woo, B.C.; Lee, J.H. Multi-Objective Optimization of High-Speed Electrical Machines Using Response Surface Methods. IEEE Trans. Magn. 2012, 48, 415–418. [Google Scholar]
- Zhang, P.; Lu, X.; Yu, T. Structural Analysis of Transformer Cores Under Dynamic Loading Conditions. Energies 2020, 13, 748. [Google Scholar]
- Balagurov, B.Y. On the Theory of Ohmic Losses in LC Systems. J. Exp. Theor. Phys. 2022, 134, 249–253. [Google Scholar] [CrossRef]
- Oh, Y.H.; Song, K.D.; Sun, J.H.; Park, K.Y.; Lee, B.H. The Thermal Analysis of Natural Convection Cooling Transformer. In Proceedings of the 6th International Conference on Electrical Machines and Systems, Beijing, China, 8–11 November 2003; pp. 524–528. [Google Scholar]
- Ebrahimi, B.; Faiz, J.; Sadeghi, S.H.H. Calculation and Analysis of Hot-Spot Temperature-Rise of Transformer Structure Parts by Using FEM. IEEE Trans. Magn. 2014, 50, 7021504. [Google Scholar]
- Gao, X.; Wang, P.; Zhao, J. Structural Optimization for Improved Reliability of Transformer Tanks. Mech. Adv. Mater. Struct. 2020, 27, 512–523. [Google Scholar]
- Hong, D.K.; Woo, B.C.; Koo, D.H.; Seo, U.J. A Single-Phase Brushless DC Motor with Improved High Efficiency for Water Cooling Pump Systems. IEEE Trans. Magn. 2011, 47, 4250–4253. [Google Scholar] [CrossRef]
- Hong, D.K.; Choi, J.H.; Han, P.W.; Chun, Y.D.; Woo, B.C.; Koo, D.H. Analysis of High Speed Induction Motor for Spindle Made by Copper Die Casting Process. Int. J. Precis. Eng. Manuf. 2012, 13, 4250–4253. [Google Scholar] [CrossRef]
- Hong, D.K.; Lee, J.Y.; Woo, B.C.; Park, D.H.; Nam, B.U. Investigating a Direct-Drive PM-Type Synchronous Machine for Turret Application Using Optimization. IEEE Trans. Magn. 2012, 48, 4250–4253. [Google Scholar] [CrossRef]


| Specification | Details |
|---|---|
| Model | Rated Power: 3 MVA |
| Rated Voltage | 13.2 kV/400 V |
| Phase | 3 |
| Insulation Oil | Vegetable oil (FR3) |
| Cooling Method | Natural Convection |
| Level | Radiation Fin Thickness (mm), | Panel Thickness (mm), | Reference Image |
|---|---|---|---|
| 1 | 1 | 8 | 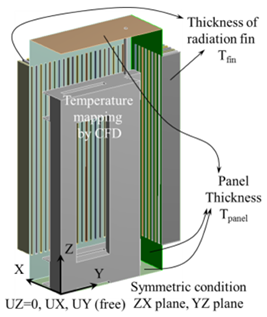 |
| 2 | 2 | 12 |
| No. | (mm) | (mm) | Maximum Membrane Stress (MPa) | First Natural Frequency (Hz) |
|---|---|---|---|---|
| 1 | 7 | 1 | 481.34 | 27.681 |
| 2 | 10 | 1.5 | 258.58 | 37.224 |
| 3 | 13 | 2 | 175.08 | 45.829 |
| 4 | 13 | 1.5 | 194.26 | 47.604 |
| 5 | 7 | 1.5 | 360.22 | 25.158 |
| 6 | 10 | 2 | 213.04 | 34.875 |
| 7 | 10 | 1 | 336.84 | 39.555 |
| 8 | 7 | 2 | 292.18 | 23.195 |
| 9 | 13 | 1 | 250.20 | 46.310 |
| Model | Max. Membrane Stress (MPa) | First Natural Frequency (Hz) |
|---|---|---|
| Initial | 332.86 | 34.852 |
| Predicted optimization of structural and stiffness | 177.5 | 46.217 |
| Verification simulation result | 175.18 | 46.431 |
| Optimization error (%) | 4.16 | 1.51 |
Disclaimer/Publisher’s Note: The statements, opinions and data contained in all publications are solely those of the individual author(s) and contributor(s) and not of MDPI and/or the editor(s). MDPI and/or the editor(s) disclaim responsibility for any injury to people or property resulting from any ideas, methods, instructions or products referred to in the content. |
© 2025 by the authors. Licensee MDPI, Basel, Switzerland. This article is an open access article distributed under the terms and conditions of the Creative Commons Attribution (CC BY) license (https://creativecommons.org/licenses/by/4.0/).
Share and Cite
Oh, Y.-H.; Hong, D.-K.; Park, J.-K.; Ahn, H.-M.; Song, K.-D. Optimum Design of Transformers for Offshore Wind Power Generators Considering Their Behavior. Electronics 2025, 14, 233. https://doi.org/10.3390/electronics14020233
Oh Y-H, Hong D-K, Park J-K, Ahn H-M, Song K-D. Optimum Design of Transformers for Offshore Wind Power Generators Considering Their Behavior. Electronics. 2025; 14(2):233. https://doi.org/10.3390/electronics14020233
Chicago/Turabian StyleOh, Yeon-Ho, Do-Kwan Hong, Jun-Kyu Park, Hyun-Mo Ahn, and Ki-Dong Song. 2025. "Optimum Design of Transformers for Offshore Wind Power Generators Considering Their Behavior" Electronics 14, no. 2: 233. https://doi.org/10.3390/electronics14020233
APA StyleOh, Y.-H., Hong, D.-K., Park, J.-K., Ahn, H.-M., & Song, K.-D. (2025). Optimum Design of Transformers for Offshore Wind Power Generators Considering Their Behavior. Electronics, 14(2), 233. https://doi.org/10.3390/electronics14020233