Abstract
This paper focuses on the crucial task of automatic recognition and understanding of table structures in engineering drawings and document processing. Given the importance of tables in information display and the urgent need for automated processing of tables in the digitalization process, an intelligent verification method is proposed. This method integrates multiple key techniques: YOLOv10 is used for table object recognition, achieving a precision of 0.891, a recall rate of 0.899, mAP50 of 0.922, and mAP50-95 of 0.677 in table recognition, demonstrating strong target detection capabilities; the improved LORE algorithm is adopted to extract table structures, breaking through the limitations of the original algorithm by segmenting large-sized images, with a table extraction accuracy rate reaching 91.61% and significantly improving the accuracy of handling complex tables; RapidOCR is utilized to achieve text recognition and cell correspondence, solving the problem of text-cell matching; for equipment name semantic matching, a method based on BERT is introduced and calculated using a comprehensive scoring method. Meanwhile, an improved cuckoo search algorithm is proposed to optimize the adjustment factors, avoiding local optima through sine optimization and the catfish effect. Experiments show the accuracy of equipment name matching in semantic similarity calculation approaches 100%. Finally, the paper provides a concrete system practice to prove the effectiveness of the algorithm. In conclusion, through experimental comparisons, this method exhibits excellent performance in table area location, structure recognition, and semantic matching and is of great significance and practical value in advancing table data processing technology in engineering drawings.
1. Introduction
In the field of engineering drawings and document processing, the automatic recognition and understanding of table structures is a crucial task. Tables serve as important carriers for summarizing and displaying information, and the extraction of their structured information is of great significance for data integration, information retrieval, and automated analysis. With the continuous acceleration of digitalization, the demand for automated processing of tables in non-structured data such as images and PDF files is becoming increasingly urgent [1]. Table structure recognition (TSR) aims to convert tables in images into formats that can be understood by machines, which requires identifying the layout structure of the tables, hierarchical relationships, accurately positioning each cell, and understanding the logical relationships between cells [2]. However, due to the diversity and complexity of tables in terms of style, layout, and content, the automatic recognition of table structures faces many challenges [3].
The motivation for this research stems from the significant impact that efficient table processing can have on various industries, including engineering, finance, and healthcare. Traditional methods of table recognition often rely on heuristic approaches that may not generalize well to diverse datasets, leading to high error rates and inefficiencies [4,5]. Recent advancements in deep learning technologies, particularly in the YOLO series for object detection and LORE [6] for structure extraction, have shown promise in addressing some of these challenges. YOLOv10 [7], as a relatively new version, has certain advantages, featuring innovative designs that enhance detection accuracy and speed, thereby providing strong support for table object recognition. However, existing methods still encounter limitations, particularly when dealing with larger images or complex table structures.
In the domain of text recognition, RapidOCR can effectively identify text areas but faces challenges in matching recognized text with corresponding table cells [8]. Furthermore, discrepancies in equipment name records between general catalogs and sub-catalogs complicate semantic similarity matching, as traditional methods such as cosine similarity often fall short of accurately capturing the nuances of equipment names [9]. These challenges highlight a critical research gap: the need for a comprehensive and intelligent verification method that not only enhances table data processing but also ensures semantic consistency in equipment name matching. Against this backdrop, this paper aims to propose an intelligent verification method that integrates advanced techniques in table detection, structure extraction, and semantic similarity matching. By addressing the limitations of existing approaches and leveraging state-of-the-art algorithms, this research seeks to contribute to the advancement of table data processing technology in engineering drawings, ultimately improving efficiency and accuracy in various applications.
In Section 2, a comprehensive review of the relevant research work in the current field is carried out, aiming to lay a theoretical foundation for the research of this paper. Section 3 elaborates in detail on the research methods adopted in this paper, specifically including table detection and recognition, table structure analysis, text recognition and alignment technology, and semantic matching methods for equipment names. Section 4 conducts experimental design and comparative analysis around the research methods to verify the effectiveness and superiority of the proposed method. Finally, Section 5 summarizes the full text, summarizes the research results, and explores future research directions.
2. Related Work
Deep learning technology has become the core driving force in the field of Document Analysis and Recognition (DAR). With its powerful feature extraction and pattern recognition capabilities, it has significantly enhanced the automation level and accuracy of document processing. Traditional document analysis methods rely on handcrafted features and rule definitions, making it difficult to handle complex and variable document structures. In contrast, deep learning models, especially convolutional neural networks (CNNs) [10], recurrent neural networks (RNNs) [11], and the widely used transformer architecture in recent years [12], can efficiently learn visual and semantic features in documents under unsupervised or with only a small amount of supervision [13].
The introduction of multimodal pre-trained models, such as LayoutLM and its subsequent models, further integrates text, layout, and visual information, improving the ability of document understanding and information extraction [14]. In addition, the construction of large-scale annotated datasets (such as DocBank) provides a solid foundation for the training and evaluation of deep learning models, promoting the rapid development of tasks such as table recognition, layout analysis, and text extraction [15]. End-to-end deep learning frameworks like DocFormer achieve precise analysis of complex document structures by combining the advantages of visual and language models [16]. Cui et al. further demonstrated the advantages of deep learning in the field of document artificial intelligence. Their research shows that deep learning models are significantly superior to traditional machine learning algorithms based on rule and statistical methods in tasks such as document layout analysis, visual information extraction, and document image classification [17]. This highlights the wide applicability and excellent performance of deep learning in handling complex document scenarios.
In summary, the widespread application of deep learning technology in the DAR field not only improves the efficiency and accuracy of document processing but also paves new paths for the understanding and utilization of unstructured data, facilitating comprehensive progress from text recognition to advanced semantic understanding. The research content of this paper focuses on table detection and table structure recognition in the DAR field. Based on this, the following section will conduct a detailed literature review of these two fields.
2.1. Table Detection
Table detection is an important sub-task in document recognition, aiming to locate the area where the table is located on a document page. Early table detection research was mainly based on heuristic rules. For example, Kieninger et al. [18] proposed the T-Rect system, which uses a bottom-up approach to perform connected component analysis on document images and then merges them according to defined rules to obtain logical text blocks. Yildiz et al. [19] proposed the pdf2table method, which was the first to perform table recognition on PDF documents, utilizing some unique information from PDF files to assist in table recognition. Koci et al. [20] presented the layout regions on the page in the form of a graph and then applied the Remove and Conquer (RAC) algorithm to identify tables as a sub-graph.
In recent years, the development of deep learning technology has brought new opportunities for table detection. Researchers have begun to explore methods based on convolutional neural networks (CNNs). Huang et al. [21] used the YOLOv3 model for table detection and adapted the anchor in the model for table optimization, achieving very good results in table target detection. Li et al. [22] proposed a GAN-based table feature generation network, which improved the table localization effect of common semantic segmentation networks and target detection networks by adding text layout features generated after training to the upsampling stage of the table detection network. Melinda et al. [23] used a mixed Gaussian method to analyze document text blocks and determined tables using the HPP method.
2.2. Table Structure Recognition
Table structure recognition is a key task following table region detection, aiming to identify the layout structure and hierarchical structure of the table and to convert the visual information of the table into a format that can describe the structure of the table. In early research on this task, researchers often designed heuristic algorithms or applied machine learning methods to achieve table structure recognition. For example, Koci et al. [24] classified and constructed graphs of individual cells in electronic tables, using genetic algorithms and other methods to search for the optimal division scheme, thus achieving structural recognition of electronic tables. Schreiber et al. [25] first introduced a division or detection framework to locate and extract the dividing lines of table rows and columns and then used empirical rules to determine the cell frame through the single cell frame. Shigarow et al. [26] used PDF documents as carriers for table recognition, extracting table visual information and proposing a configurable heuristic method framework for table structure recognition.
With the development of deep learning technology, table structure recognition methods have also begun to adopt more advanced techniques. For example, Siddiqui et al. [27] described the table structure recognition problem as a semantic segmentation issue, using FCN network framework to predict table rows and columns, based on the assumption of table consistency, using a piecewise method to reduce complexity; Tensmeyer et al. [28] proposed the SPLERGE (Split and Merge) method based on deep learning methods and heuristic methods for two-stage table structure processing; Khan et al. [29] targeted the repetitive sequence characteristics of table rows and columns, using bidirectional recurrent neural networks for row and column division; Lin et al. [30] defined the table division line prediction as a linear regression problem rather than an image segmentation problem, and proposed a new two-stage DETR-based division prediction method, called Separator REgression TRansformer (SepReTR), to directly predict the division lines in the image.
Recent table structure recognition methods mainly solve the problem by predicting the adjacency relationships of table cells [31,32] or generating marked sequences [33], but there are many limitations. Methods that rely on adjacency relationship prediction require additional heuristic rules to restore the table structure, increasing complexity and potentially introducing errors; methods based on marked sequence generation require a large amount of training data and are time-consuming. The LORE algorithm [6] models TSR as a logical position regression problem, constructing a logical position regression network (LORE), which for the first time integrates logical position and spatial position regression.
To sum up, the core tasks of table content extraction encompass table location detection and table structure recognition, as well as text recognition and alignment with table locations. Although the application of large-scale model technologies has shown remarkable performance in improving recognition accuracy, its high demands on the hardware environment and slow recognition speed have limited its wide application in practical scenarios. Currently, most of the relevant research is based on relatively small-sized table datasets, and there is a relative lack of optimization strategies for large-sized tables. In addition, existing studies often focus on a single task of either table detection or table structure recognition, neglecting the synergistic effect of the two in real application scenarios.
In view of this, this paper selects the YOLOv10 and LORE algorithms as the foundation. These two algorithms possess the advantages of simple structure and straightforward implementation, avoiding complex post-processing and lengthy decoding procedures, reducing the difficulty of understanding and implementing the model, and simultaneously enhancing the convenience of deployment and optimization, enabling them to efficiently complete table detection and recognition tasks. In terms of model training, these algorithm frameworks are concise, with clear objective functions and relatively fast convergence speeds, reducing the dependence on large-scale data and achieving good recognition results within a short period, effectively saving computational resources and time costs. By adopting the divide-and-conquer approach, the input of the LORE algorithm is improved to address the issue of insufficient accuracy in parsing large-sized tables.
This paper constructs a dataset based on actual application scenarios to achieve precise alignment between table locations and text recognition results. Through the integration of multiple optimization design strategies, the problems of extracting and processing equipment information in engineering drawings are solved, completing the full-process design from information extraction to semantic matching and visualization of results, further enhancing the practicability and reliability of the system.
3. Method
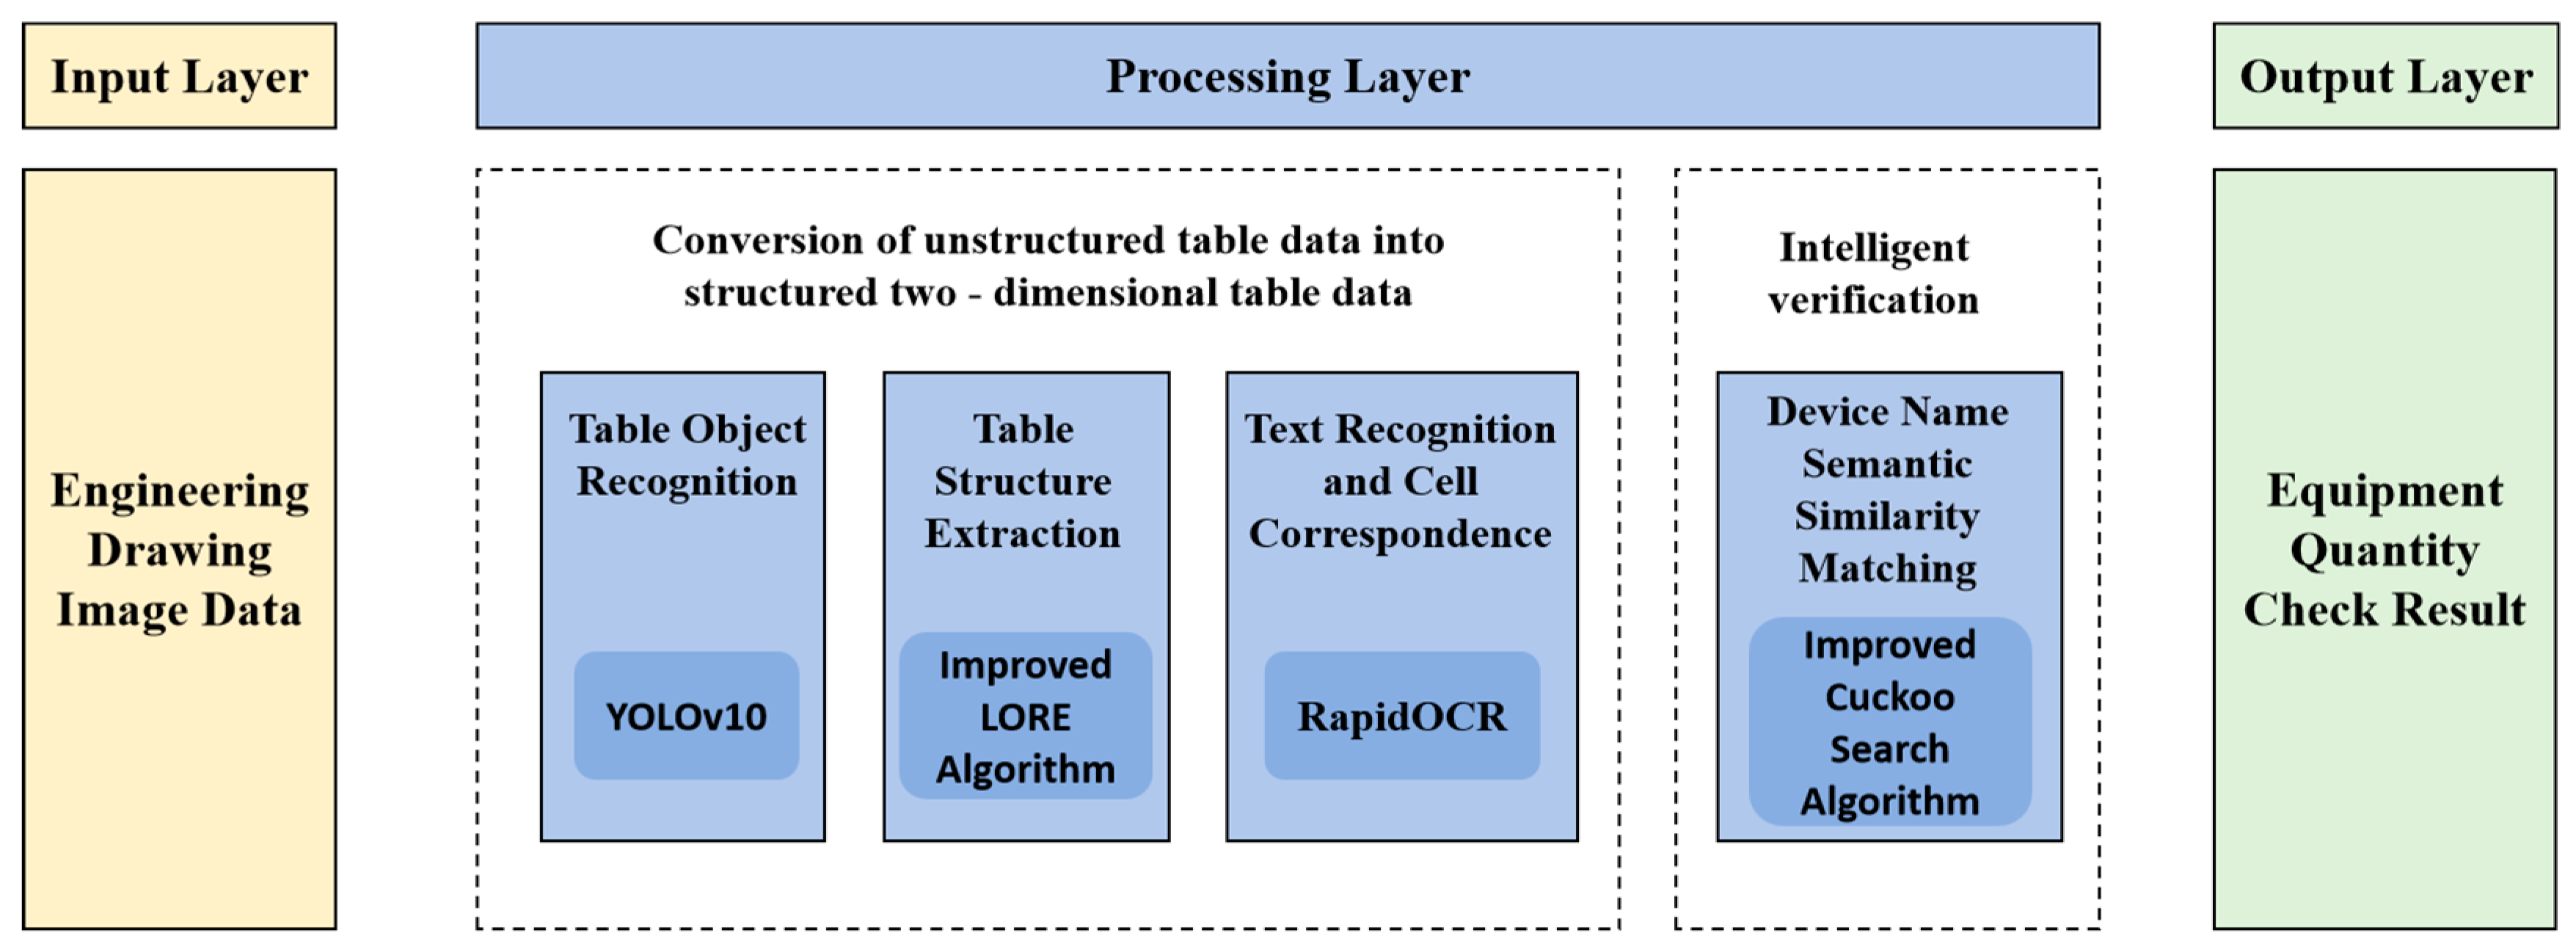
The proposed method in Figure 1 represents the overall framework of our intelligent verification approach for table structure recognition in engineering drawings. It consists of four main components: table object recognition, table structure extraction, text recognition and cell correspondence, and equipment name semantic similarity matching. Each component plays a crucial role in the process of converting unstructured table data in engineering drawings into structured and meaningful information. In the following sections, we will describe each component in detail, including the techniques and algorithms used, as well as the specific steps and operations involved.
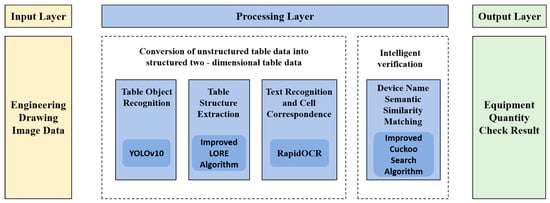
Figure 1.
The framework of intelligent verification methods.
3.1. Table Object Recognition
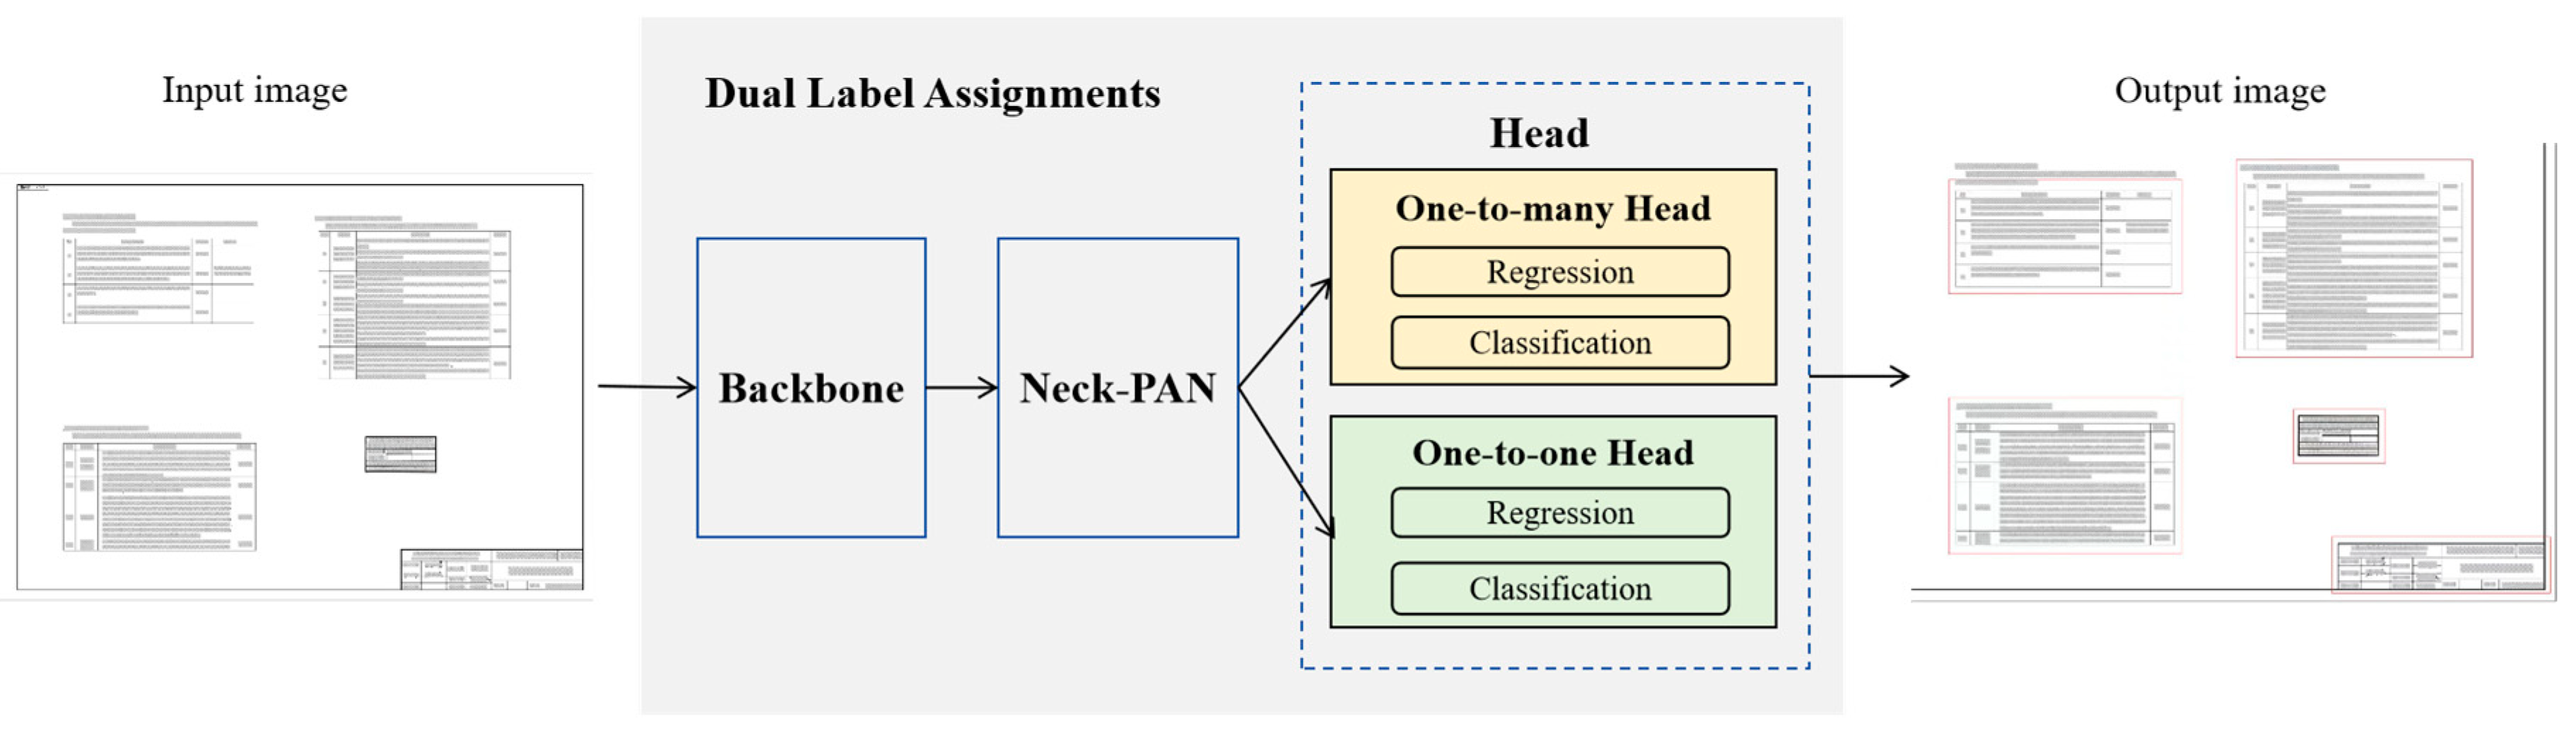
YOLOv10 [7] is a newer version of the YOLO series, featuring higher detection accuracy and speed. The backbone network of YOLOv10 adopts an enhanced Cross-Stage Partial Network (CSPNet), designed to optimize gradient flow and reduce computational redundancy, thereby improving the efficiency of feature extraction. The neck structure employs Path Aggregation Network (PAN) layers to accomplish the effective integration of multi-scale features, consequently enhancing the model’s capabilities in handling targets of diverse sizes. The model is engineered with a “one-to-many” head architecture. During the training phase, it generates multiple predictions for every object, furnishing abundant supervisory cues to augment the learning precision. In the inference process, it derives the optimal prediction for each object via a “one-to-one” head, obviating the utilization of Non-Maximum Suppression (NMS). This, in turn, curtails the inference latency and augments the overall efficiency. The framework of the model is depicted in Figure 2. The output of YOLOv10 encompasses the following parameters for each detected bounding box:
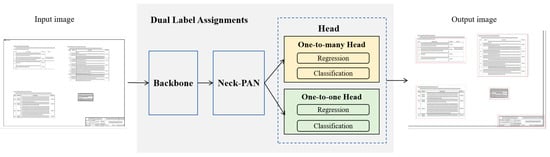
Figure 2.
The framework of YOLOv10.
: The confidence that there is an object in the bounding box.
: The probability that the object within the bounding box belongs to a certain class.
: The coordinates, width, and height of the bounding box.
3.2. Table Structure Extraction
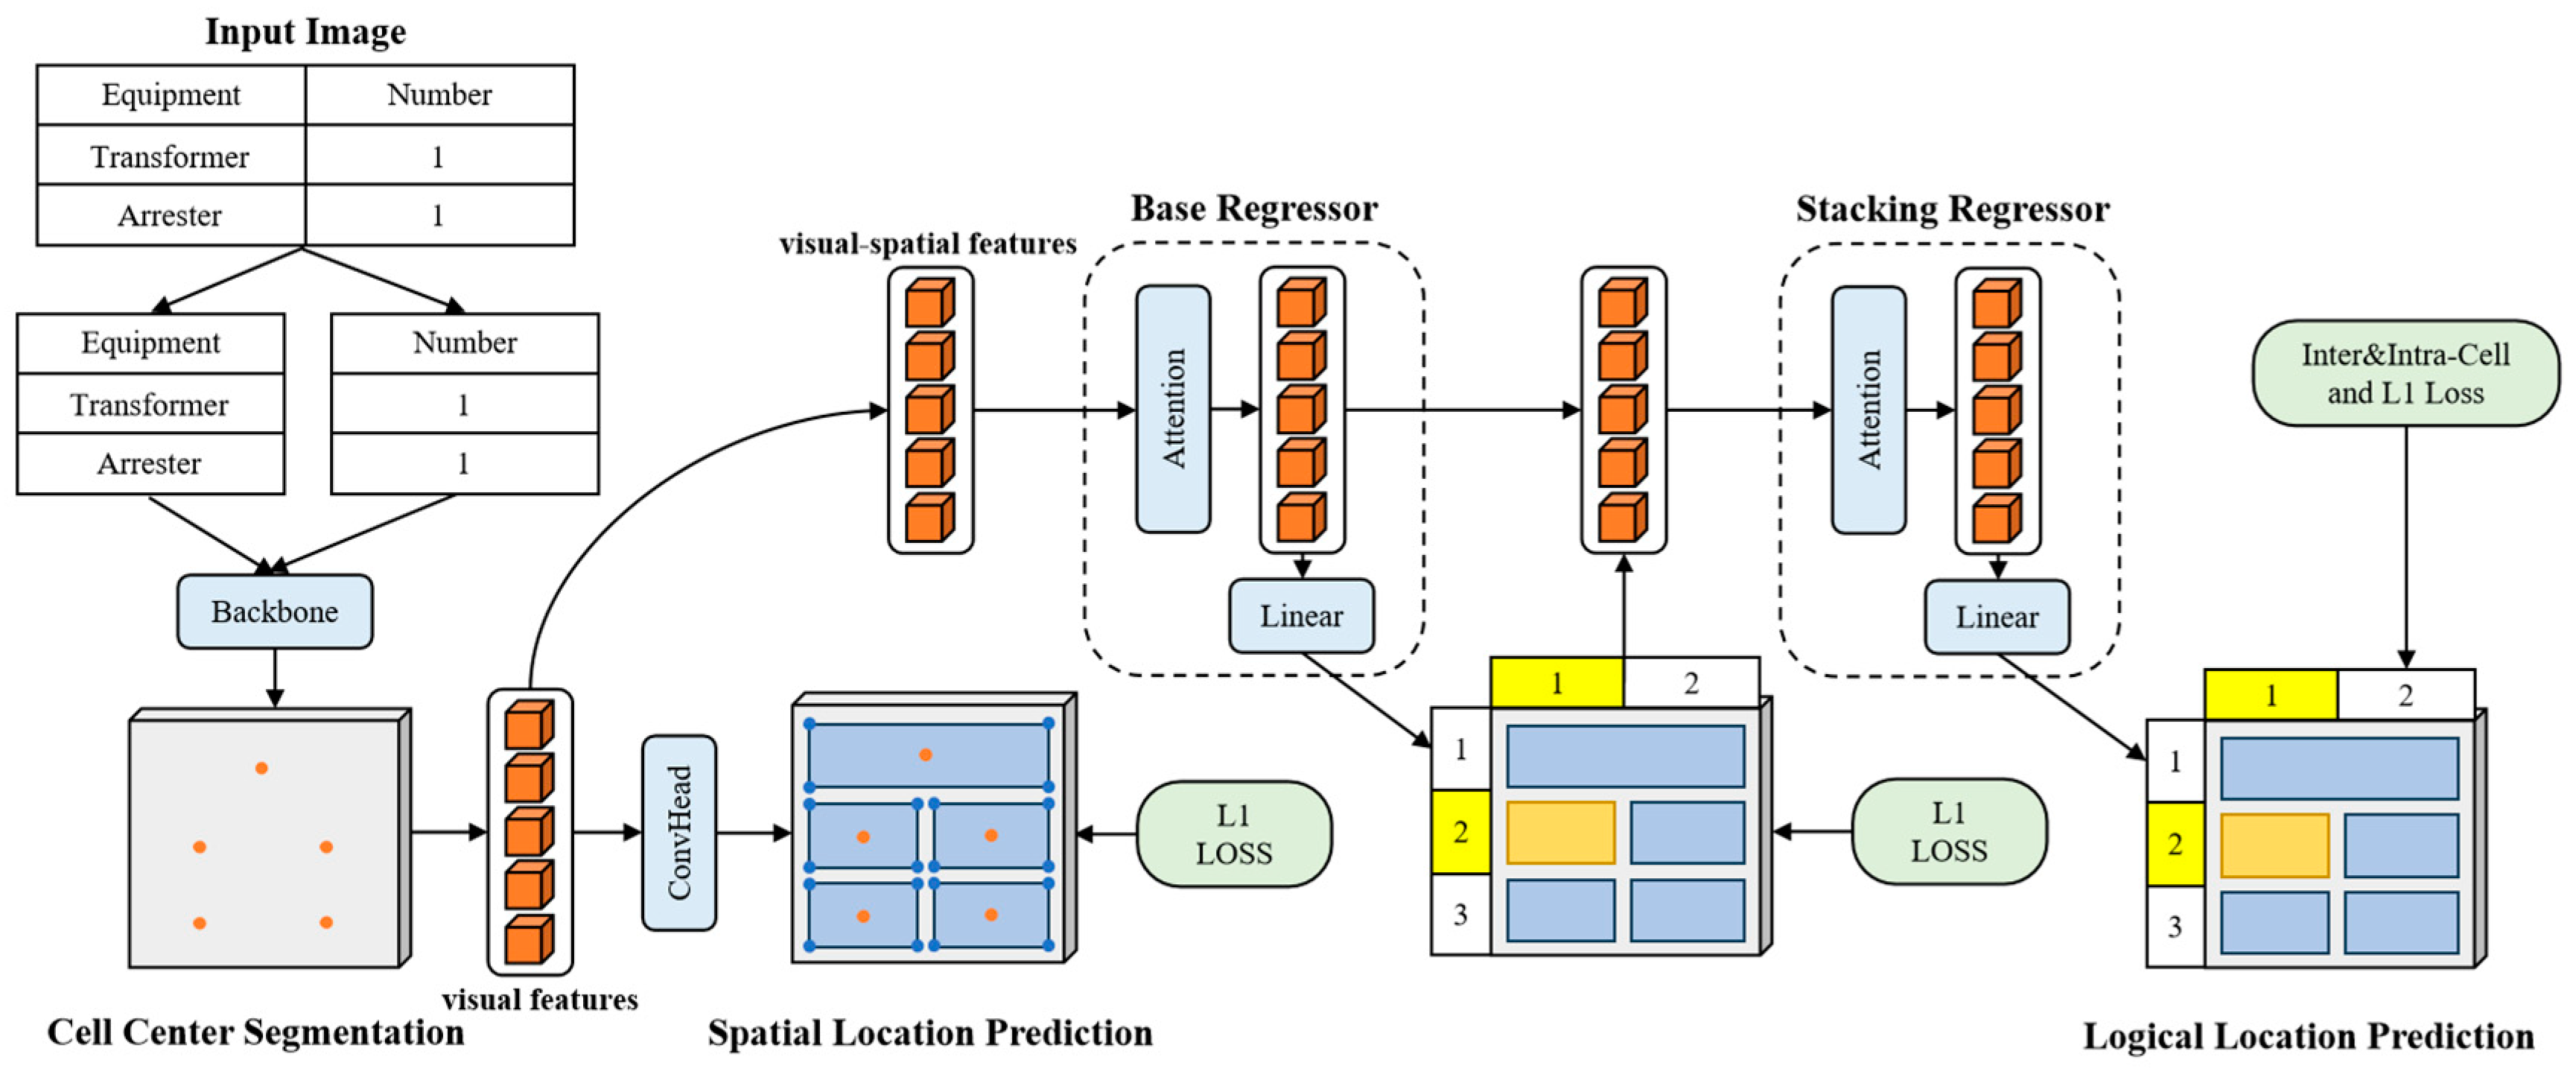
LORE uses a CNN backbone to extract visual features of table cells from input images. Then, two regression heads are used to predict the spatial and logical positions of the cells. It particularly utilizes cascaded regression quantities and employs inter-cell and intra-cell supervision to model the dependencies and constraints between logical positions. Engineering drawings typically encompass complex elements such as graphics and tables, and their sizes are generally large. Existing research mainly conducts recognition based on fixed-size training data from papers, books, etc., which to some extent limits the accuracy of the model in recognizing the table structures of large-sized engineering drawings. In view of this, for engineering drawings with a length or width exceeding 2500 pixels, we adopt a segmentation processing strategy to enhance the recognition effect. This enables the algorithm proposed in this paper to handle engineering drawings with a maximum length and width of around 4000 pixels, meeting the application requirements in the engineering field. The overall processing flow is shown in Figure 3.
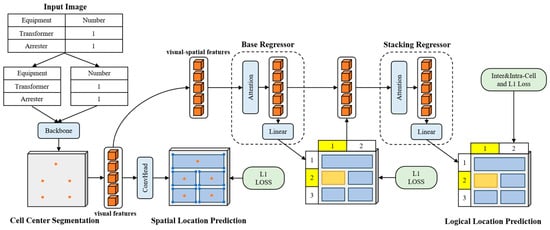
Figure 3.
Illustration of the improved LORE algorithm.
Image Preprocessing: Convert the image to grayscale. Binarize the image to black and white for easy subsequent contour detection.
Detect Table Frame Lines: Use horizontal and vertical morphological operations.
Frame Line Merging: Combine horizontal and vertical lines to form the table frame lines. Detect each frame in the table and extract their boundaries.
Segment the Table: Segment the table based on the detected frame lines.
3.3. RapidOCR Text Recognition and Cell Correspondence
Using the improved LORE to identify the four corner coordinates of each cell, when processing tables in images, it is first necessary to sort the coordinates of each cell to determine its row and column structure. Assuming the top-left and bottom-right coordinates of each cell in the table are and , respectively, the of each cell is sorted from left to right. The coordinate set of the cell is , which sorts in ascending order to determine the position of the columns, as shown in Formula (1).
Similarly, the position of each cell’s can be used to determine the position of the rows, sorting in ascending order, as shown in Formula (2).
By sorting the and coordinates of all cells, the row and column positions of each cell in the table can be determined.
When RapidOCR processes an image, it outputs the four boundary points of each text area. The coordinates of these points are , , , and , forming the boundary box of the text area. To determine whether the text belongs to a specific cell, first the center point coordinates of the text boundary box are calculated, as shown in Formula (3).
By comparing the center point of the text boundary box with the boundaries of the table cell, it can be determined whether the text is within a certain cell. Assuming that the coordinates of the top-left and bottom-right corners of a certain table cell are and , respectively, the text is considered to be within the cell if the center point meets Formula (4).
To address the issue of slight boundary overflow of text, a tolerance, , can be set for the judgment conditions. If the boundary of the text slightly crosses the cell boundary, it can also be considered to be within the cell. After setting the tolerance, the judgment conditions can be modified as shown in Formula (5).
In this paper, the tolerance is set to 2 pixels. Text that spans multiple cells needs to be handled separately. This can be identified by detecting that the boundary of the text area exceeds the range of a single cell. If any point of the text boundary box has coordinates that exceed the cell range, it is determined to span multiple cells, as shown in Formula (6).
If this condition is met, it is necessary to extract the areas of the relevant multiple cells and treat them as a whole for processing. By performing OCR recognition again on these merged cell areas, ensure that text spanning multiple cells can be correctly recognized.
3.4. Device Name Semantic Similarity Matching Based on Improved Cuckoo Search Algorithm
Using the table extraction, structure recognition, and text recognition methods from the previous section, it is possible to transform the unstructured table data in the original engineering drawings into structured two-dimensional table data. Engineering drawings are divided into material summary tables and sub-tables. Taking a substation project as an example, the summary table includes the main transformer equipment, distribution equipment, and materials required for the project. Currently, manual matching methods are used. This paper proposes an intelligent verification method whose core lies in the semantic similarity matching of device names. Since the summary and sub-books are recorded by different people, there are differences in descriptive habits, hence the need for semantic similarity methods to perform semantic matching and verify the consistency of quantities.
Cosine Similarity: Similarity measurement refers to the calculation of the degree of similarity between individuals, generally measured by distance. The smaller the similarity value, the greater the distance; the larger the similarity value, the smaller the distance. The most common method to measure text similarity is to use cosine similarity. In space, the cosine of the angle between two vectors is used to measure the difference between two individuals. A cosine value close to 1, with an angle tending towards 0, indicates that the two vectors are more similar. A cosine value close to 0, with an angle tending towards 90, indicates that the two vectors are less similar. The calculation formula for cosine similarity is shown in Formula (7).
In the formula, and are two i-dimensional vectors, and represents the cosine similarity between vector and vector .
However, cosine similarity computed solely through word segmentation presents inherent limitations in handling abbreviations. For instance, in equipment nomenclature, the abbreviation “mushe” (short for “muxian shebei”, busbar equipment) yields a similarity score of 0 against its full form under word segmentation, whereas character-level segmentation achieves 0.7. This exposes critical gaps in text-processing pipelines for technical domains requiring granular semantic alignment.
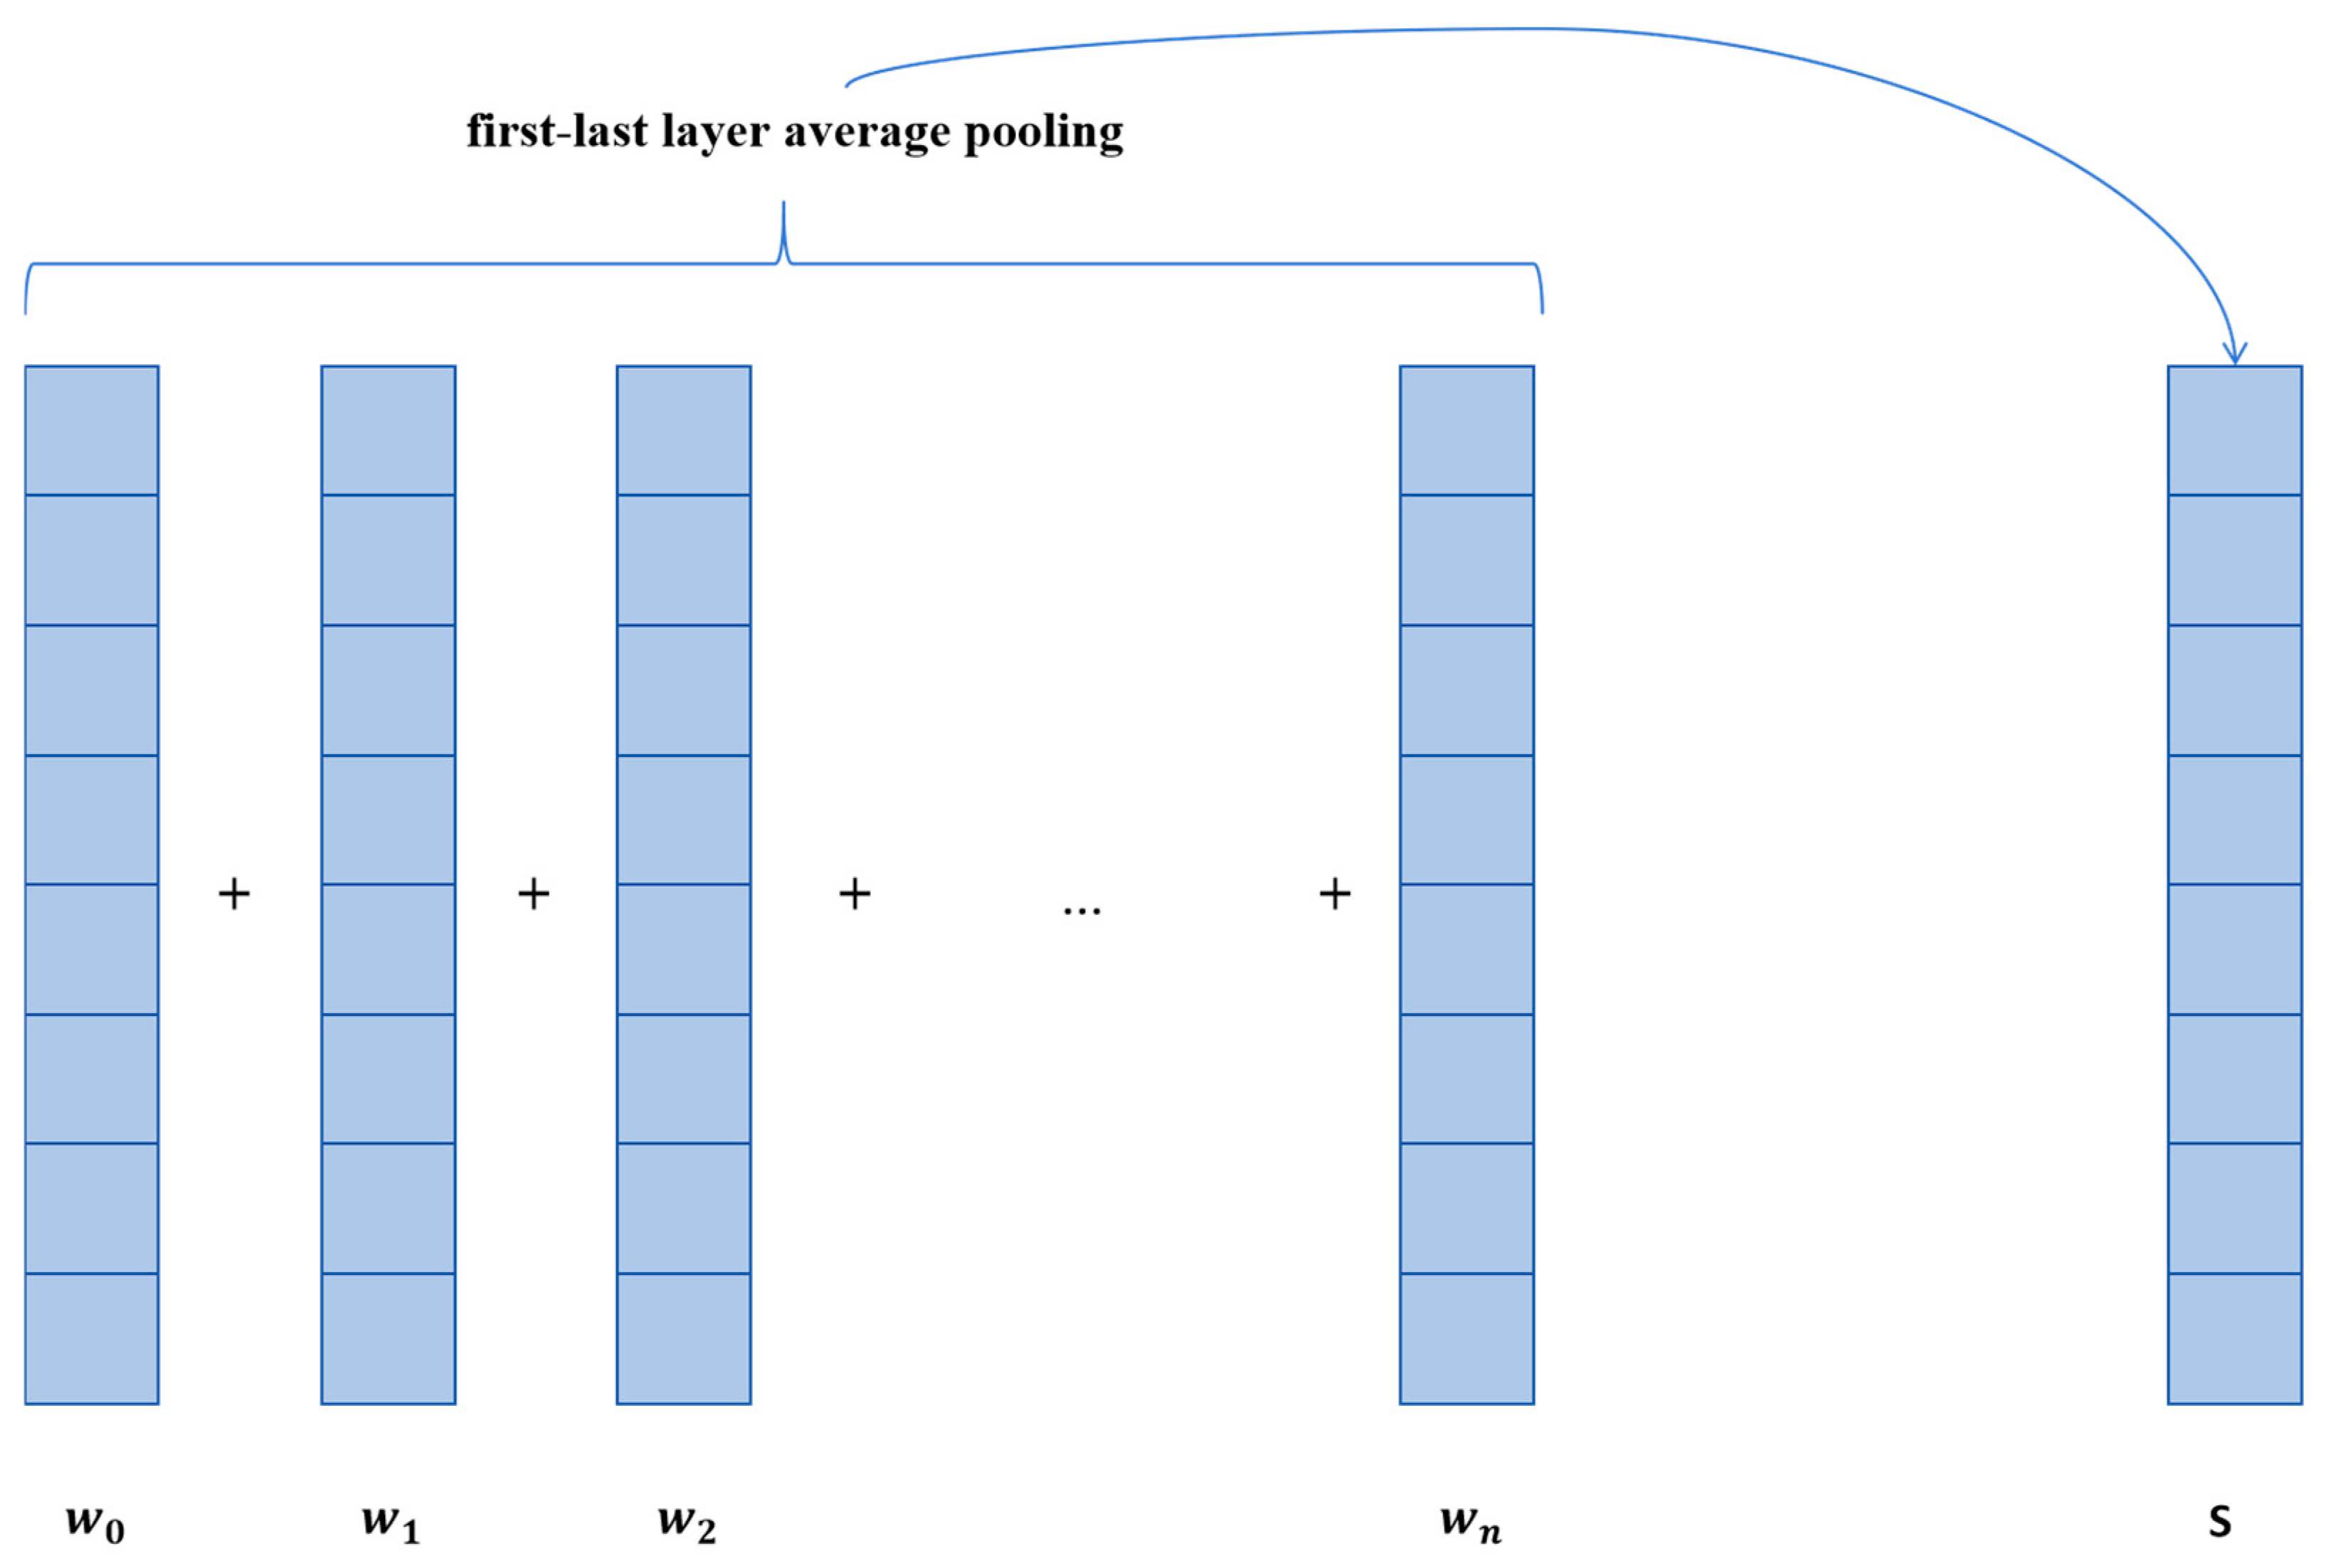
When only using cosine similarity to match device names, the semantic features between device names are often ignored. In this situation, with the powerful function of large models, this paper introduces a semantic similarity matching method based on BERT [34]. BERT is a pre-trained language model. It is based on the deep learning model Transformer with a self-attention mechanism [35]. Therefore, BERT can effectively capture long-term dependencies in sequence data. By learning the relationship between words in the text, it can obtain rich semantic information. Since language models process input text on a word basis, the output of the language model is the vector representation of each word in the text. To obtain the vector representation of a sentence, pooling is required. Common pooling operations include cls, pooler, last layer average, and first-last layer average [36]. This paper adopts first-last layer average pooling, as shown in Figure 4; it calculates the average of all word vector representations from the first and last layers. For the pooled equipment name vectors, the cosine similarity method can be used to calculate the semantic similarity between them. The similarity calculated using the above method is denoted as , which represents the semantic similarity between two i-dimensional vectors and .
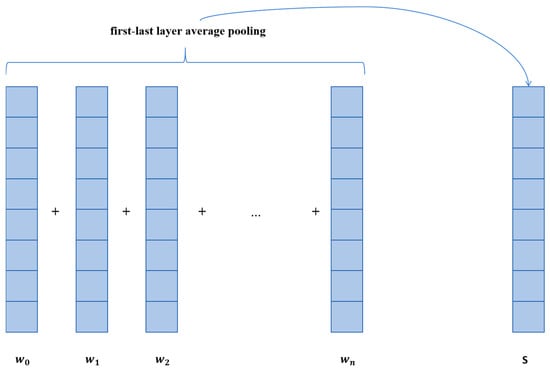
Figure 4.
First-last layer average pooling.
Using cosine similarity or semantic similarity to calculate the match degree between two equipment names both have certain limitations. Therefore, this paper adopts a comprehensive scoring method to match the similarity between phrases, as shown in Formula (8),
where α and β are adjustment factors.
Adjustment factors are crucial for the accuracy of similarity calculations, so it is necessary to construct adjustment factors based on the characteristics of the text. Accordingly, this paper proposes an improved cuckoo search algorithm to optimize the adjustment factors in semantic similarity, making it more suitable for engineering drawings.
The cuckoo search algorithm is a population-based intelligent optimization algorithm [37,38], originating from the observation of cuckoo populations. Cuckoos choose a nest during the breeding process and compete based on the quality of the nest. Higher-quality nests attract more cuckoos, thereby increasing the success rate of reproduction. The algorithm simulates this process by iteratively updating the position of the nests to gradually optimize the quality of the solutions. At the start of the algorithm, a set of initial solutions is randomly generated as the positions of the nests. Then, based on the quality of the solutions and the attractiveness of the nests, cuckoos will choose a new position. Higher-quality solutions attract more cuckoos, while poorer solutions may be eliminated. By continuously iterating and updating the positions of the nests, the cuckoo search algorithm can gradually converge to the optimal solution.
Currently, the cuckoo search algorithm has been widely applied in various fields and has achieved remarkable results. Regarding the regional energy consumption quota allocation in China, the cuckoo search algorithm has optimized the weight calculation, which has notably enhanced the rationality and effectiveness of the allocation scheme, thus effectively promoting fairness and effectiveness [39]. When it comes to the field of biomedical article retrieval for precision medicine clinical decision support, the application of the cuckoo search algorithm has successfully boosted the accuracy and efficiency of retrieval [40]. In the area of solving the traveling salesman problem (TSP) and optimizing glass-cutting paths, the cuckoo search algorithm has been used to put forward effectively improved algorithms [41].
The traditional cuckoo search algorithm uses a fixed step size to update solutions, which can lead to the algorithm easily falling into local optima when approaching local optimal solutions later on. Sine optimization is used for a broader range of global searches in the initial stage, avoiding falling into local optima by dynamically adjusting the search step size [42]. The dynamic update strategy of the sine can be represented by Formula (9).
In the formula, is the position vector of the next generation of cuckoo individuals; is the position vector of the current cuckoo individual; is the position vector of the current best solution; is a random number controlling the step size, with a value in ; is an angle factor, usually randomly generated within .
This paper adds a random strategy known as the catfish effect to enhance its ability to escape local optima. The catfish effect simulates the introduction of new, randomly generated cuckoos (“catfish”) to stimulate the vitality of the population and prevent the algorithm from converging too early. This is achieved by periodically randomly updating the positions of some individual cuckoos, as shown in Formula (10),
where is the position of a randomly updated cuckoo individual, is a randomly generated new position; is a random number between ; and is the position of the -th cuckoo individual.
The specific steps of the improved cuckoo search algorithm are as follows:
- (1)
- Define the Problem Space
Firstly, it is necessary to define the search space of the problem, that is, the upper and lower bounds of the decision variables. Assume the problem has decision variables, and each variable takes values within the interval .
- (2)
- Randomly Initialize the Population
The population of the cuckoo search algorithm consists of multiple nests, each representing a potential solution (i.e., a position). The initial population is usually generated through the following steps:
- Determine the population size N, which is the number of nests.
- For each nest (solution), randomly generate a solution vector within the problem’s defined domain.
- Assume the solution space is -dimensional, and each solution can be represented as a -dimensional vector , where each is randomly generated within its corresponding range .
The formula is represented as shown in Formula (11),
where is a uniformly distributed random number in the interval , ensuring that the initial population is uniformly distributed throughout the solution space.
- (3)
- Set Algorithm Parameters
After generating the initial population, several key parameters of the cuckoo search algorithm need to be set:
- Discovery probability : This represents the probability that a host bird discovers a cuckoo egg, typically ranging between . This parameter determines the proportion of solutions that are replaced in the algorithm.
- Maximum number of iterations: This sets the termination condition for the algorithm, usually the maximum number of iterations or the convergence precision of the objective function value.
- (4)
- Evaluate the Initial Population
After generating the population, it is necessary to evaluate the solution corresponding to each nest, using the objective function to calculate the fitness value of each solution. The fitness value is used to select the best solution or replace the poorer solutions in subsequent steps. The objective function is the accuracy rate of similarity matching, as shown in Formula (12),
where “Number of Correct Matches” is the number of correct similarity matches calculated, and “Total Number of Matches” is the total number of similarity matches calculated.
- (5)
- Generation of New Solutions
In each iteration, the cuckoo search algorithm generates new solutions through random walks, utilizing the Lévy flight strategy to generate new candidate solutions [43,44]. The Lévy flight is a random process with small steps and long jumps, as shown in Formula (13),
where represents the solution at generation . is a random number generated from the Lévy distribution, typically using to maintain global search capability. is the step size factor, which is replaced by sine optimization, thus updating Formula (13) to Formula (14).
For nests discovered by the discovery probability, two methods are used for random generation and local perturbation generation: random new solutions and the catfish effect.
After each round of iteration, the global best solution is updated based on the evaluated solutions. That is, among all nests, the solution with the best fitness value is selected as the current best solution.
- (6)
- Check Termination Conditions and Output the Optimal Solution
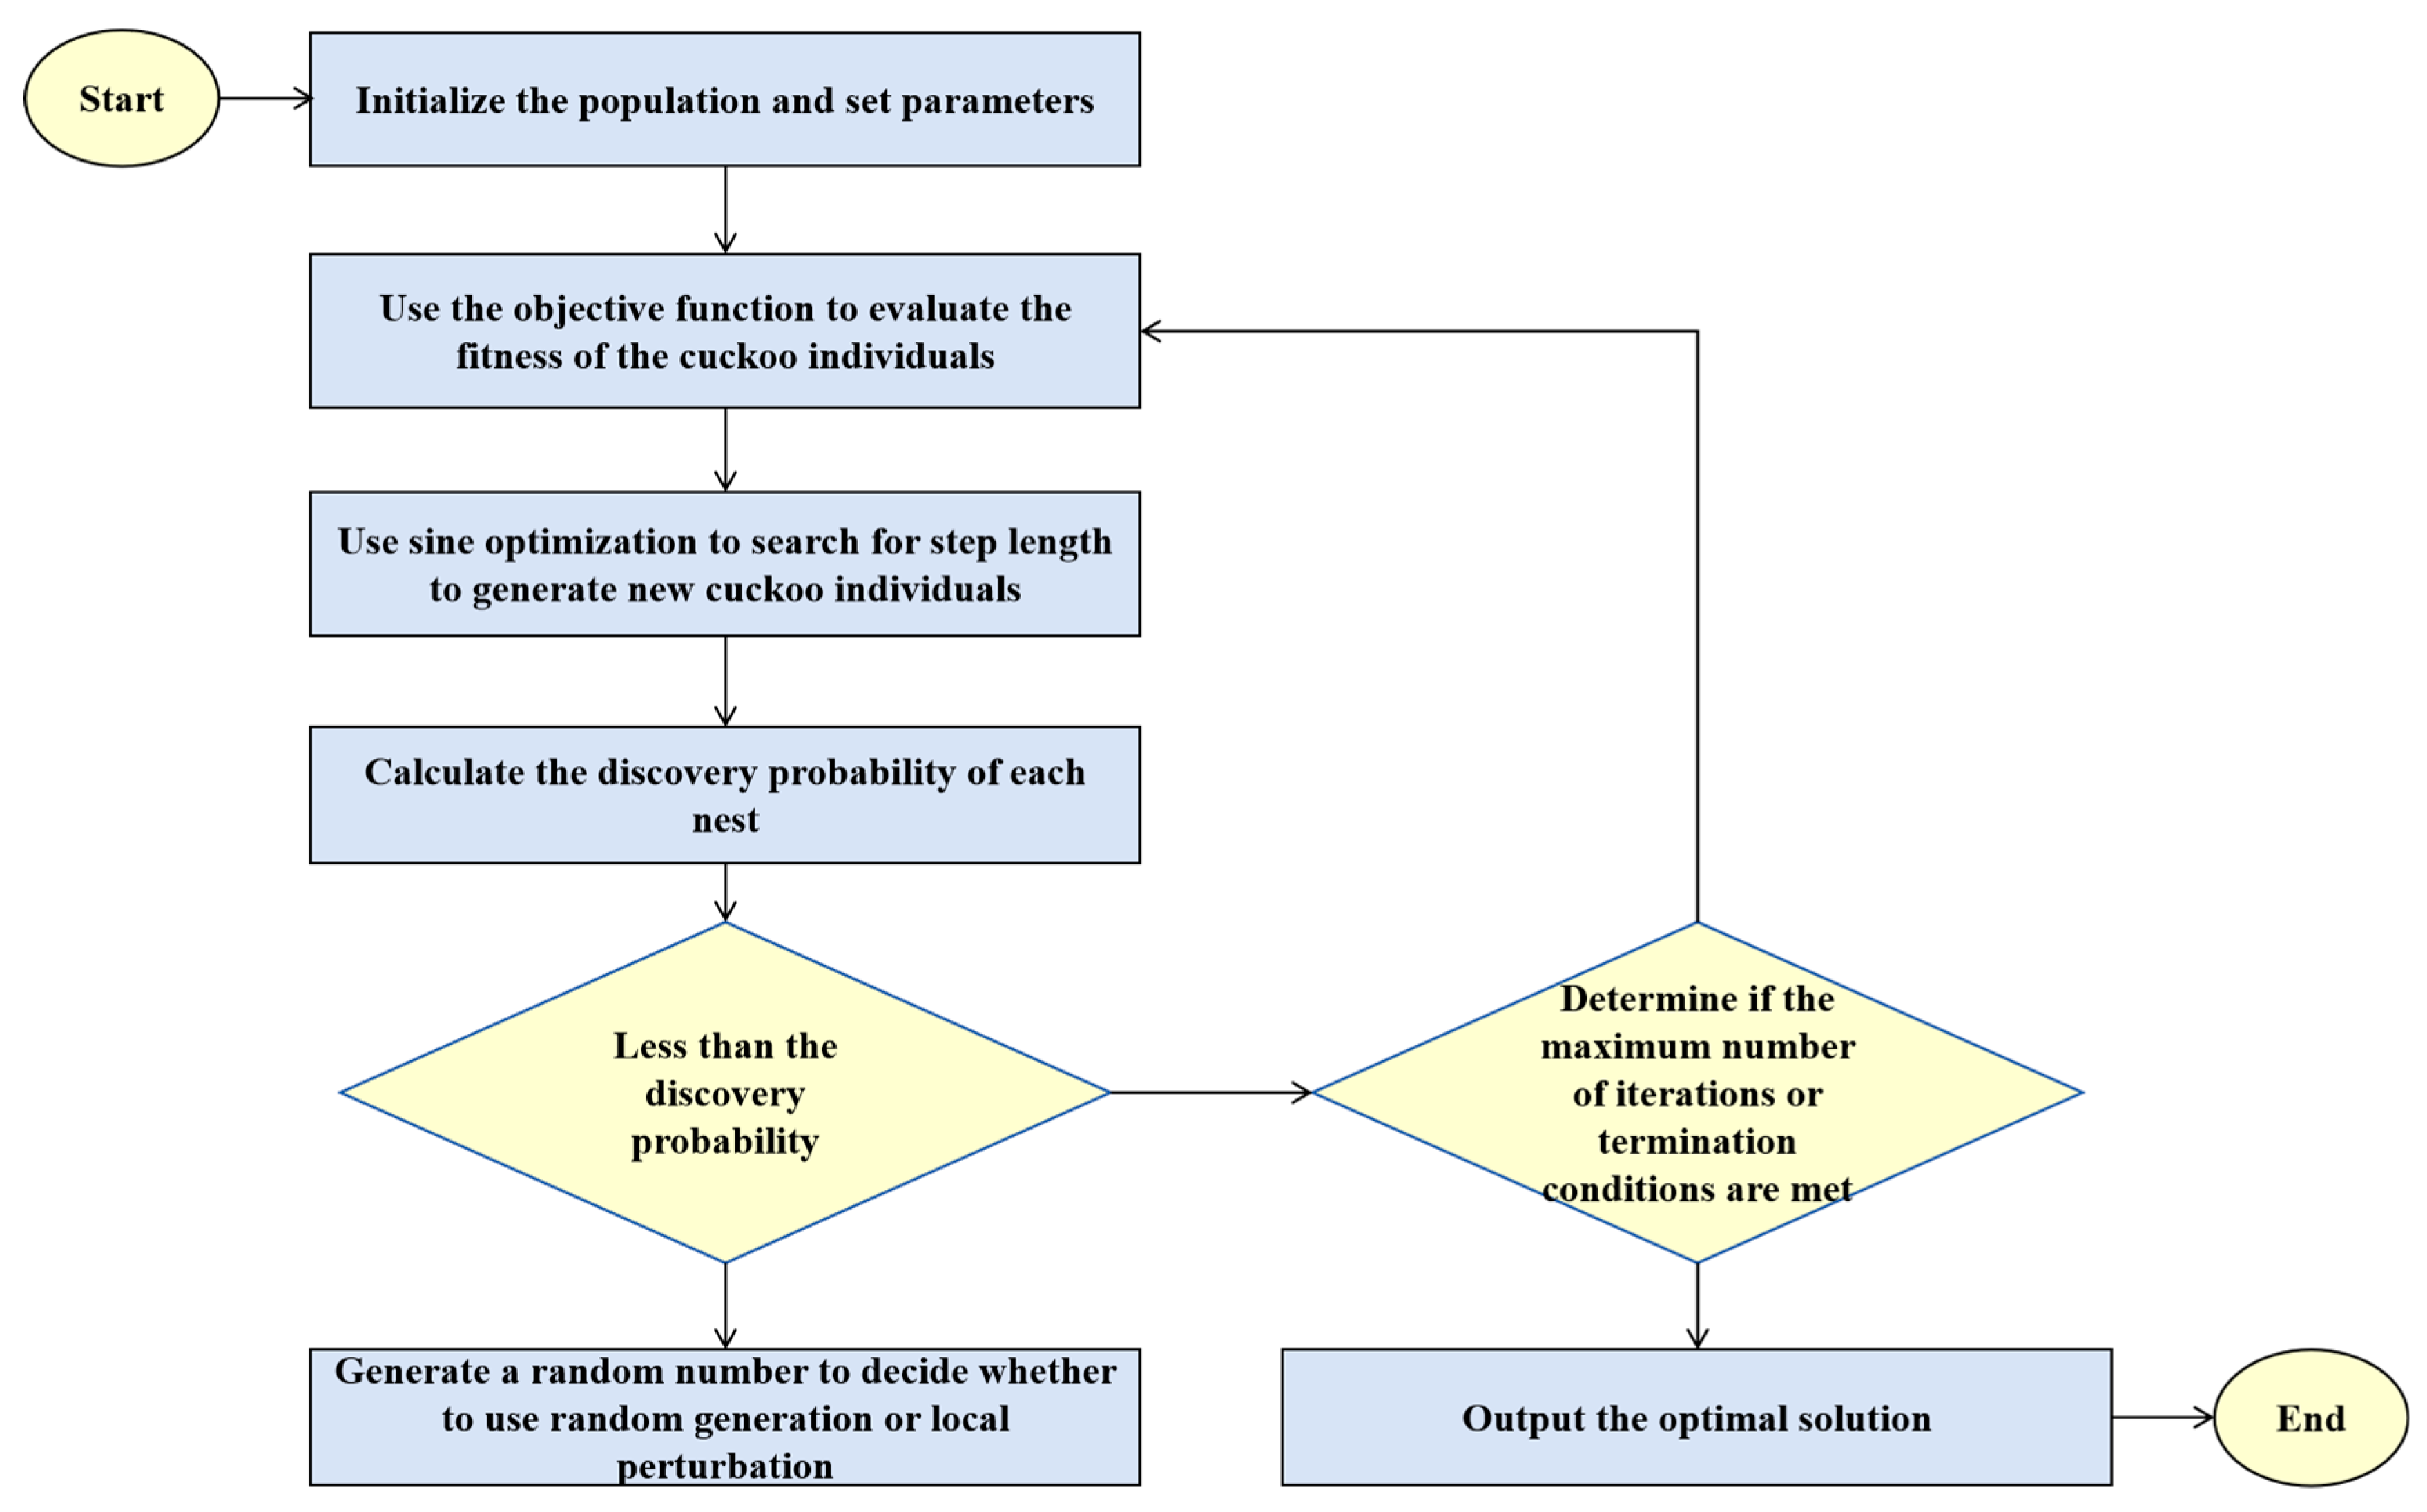
The iteration process continues until the termination conditions are met. Common termination conditions include reaching the maximum number of iterations and the change in the global best solution being less than a preset threshold, indicating that the algorithm has converged. Finally, the optimal solution is output. The overall process of the improved Cuckoo Search algorithm is shown in Figure 5.
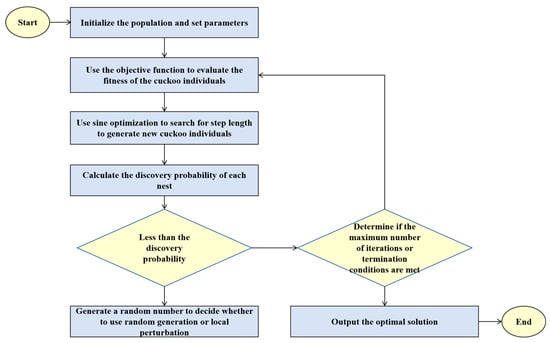
Figure 5.
Improved cuckoo search algorithm flowchart.
4. Experimental Comparison
4.1. Comparison of Table Area Location Identification Experiments
In this study, we employed the YOLOv10 model for image classification tasks. The model was trained for 100 epochs with a batch size of 16, and the input image size was set to 640 × 640 pixels. The training dataset comprised 2041 sample images, while the validation dataset contained 466 images for assessing model performance. This paper systematically summarizes the elements that appear in engineering drawings and determines that they mainly include the following six categories: engineering seals, equipment diagrams, diagram annotations, tables, text, and signatures. Based on this classification criterion, in the target recognition task of the YOLO model, six corresponding categories have been set. The specific model parameter settings and classification details are shown in Table 1.

Table 1.
Parameter settings.
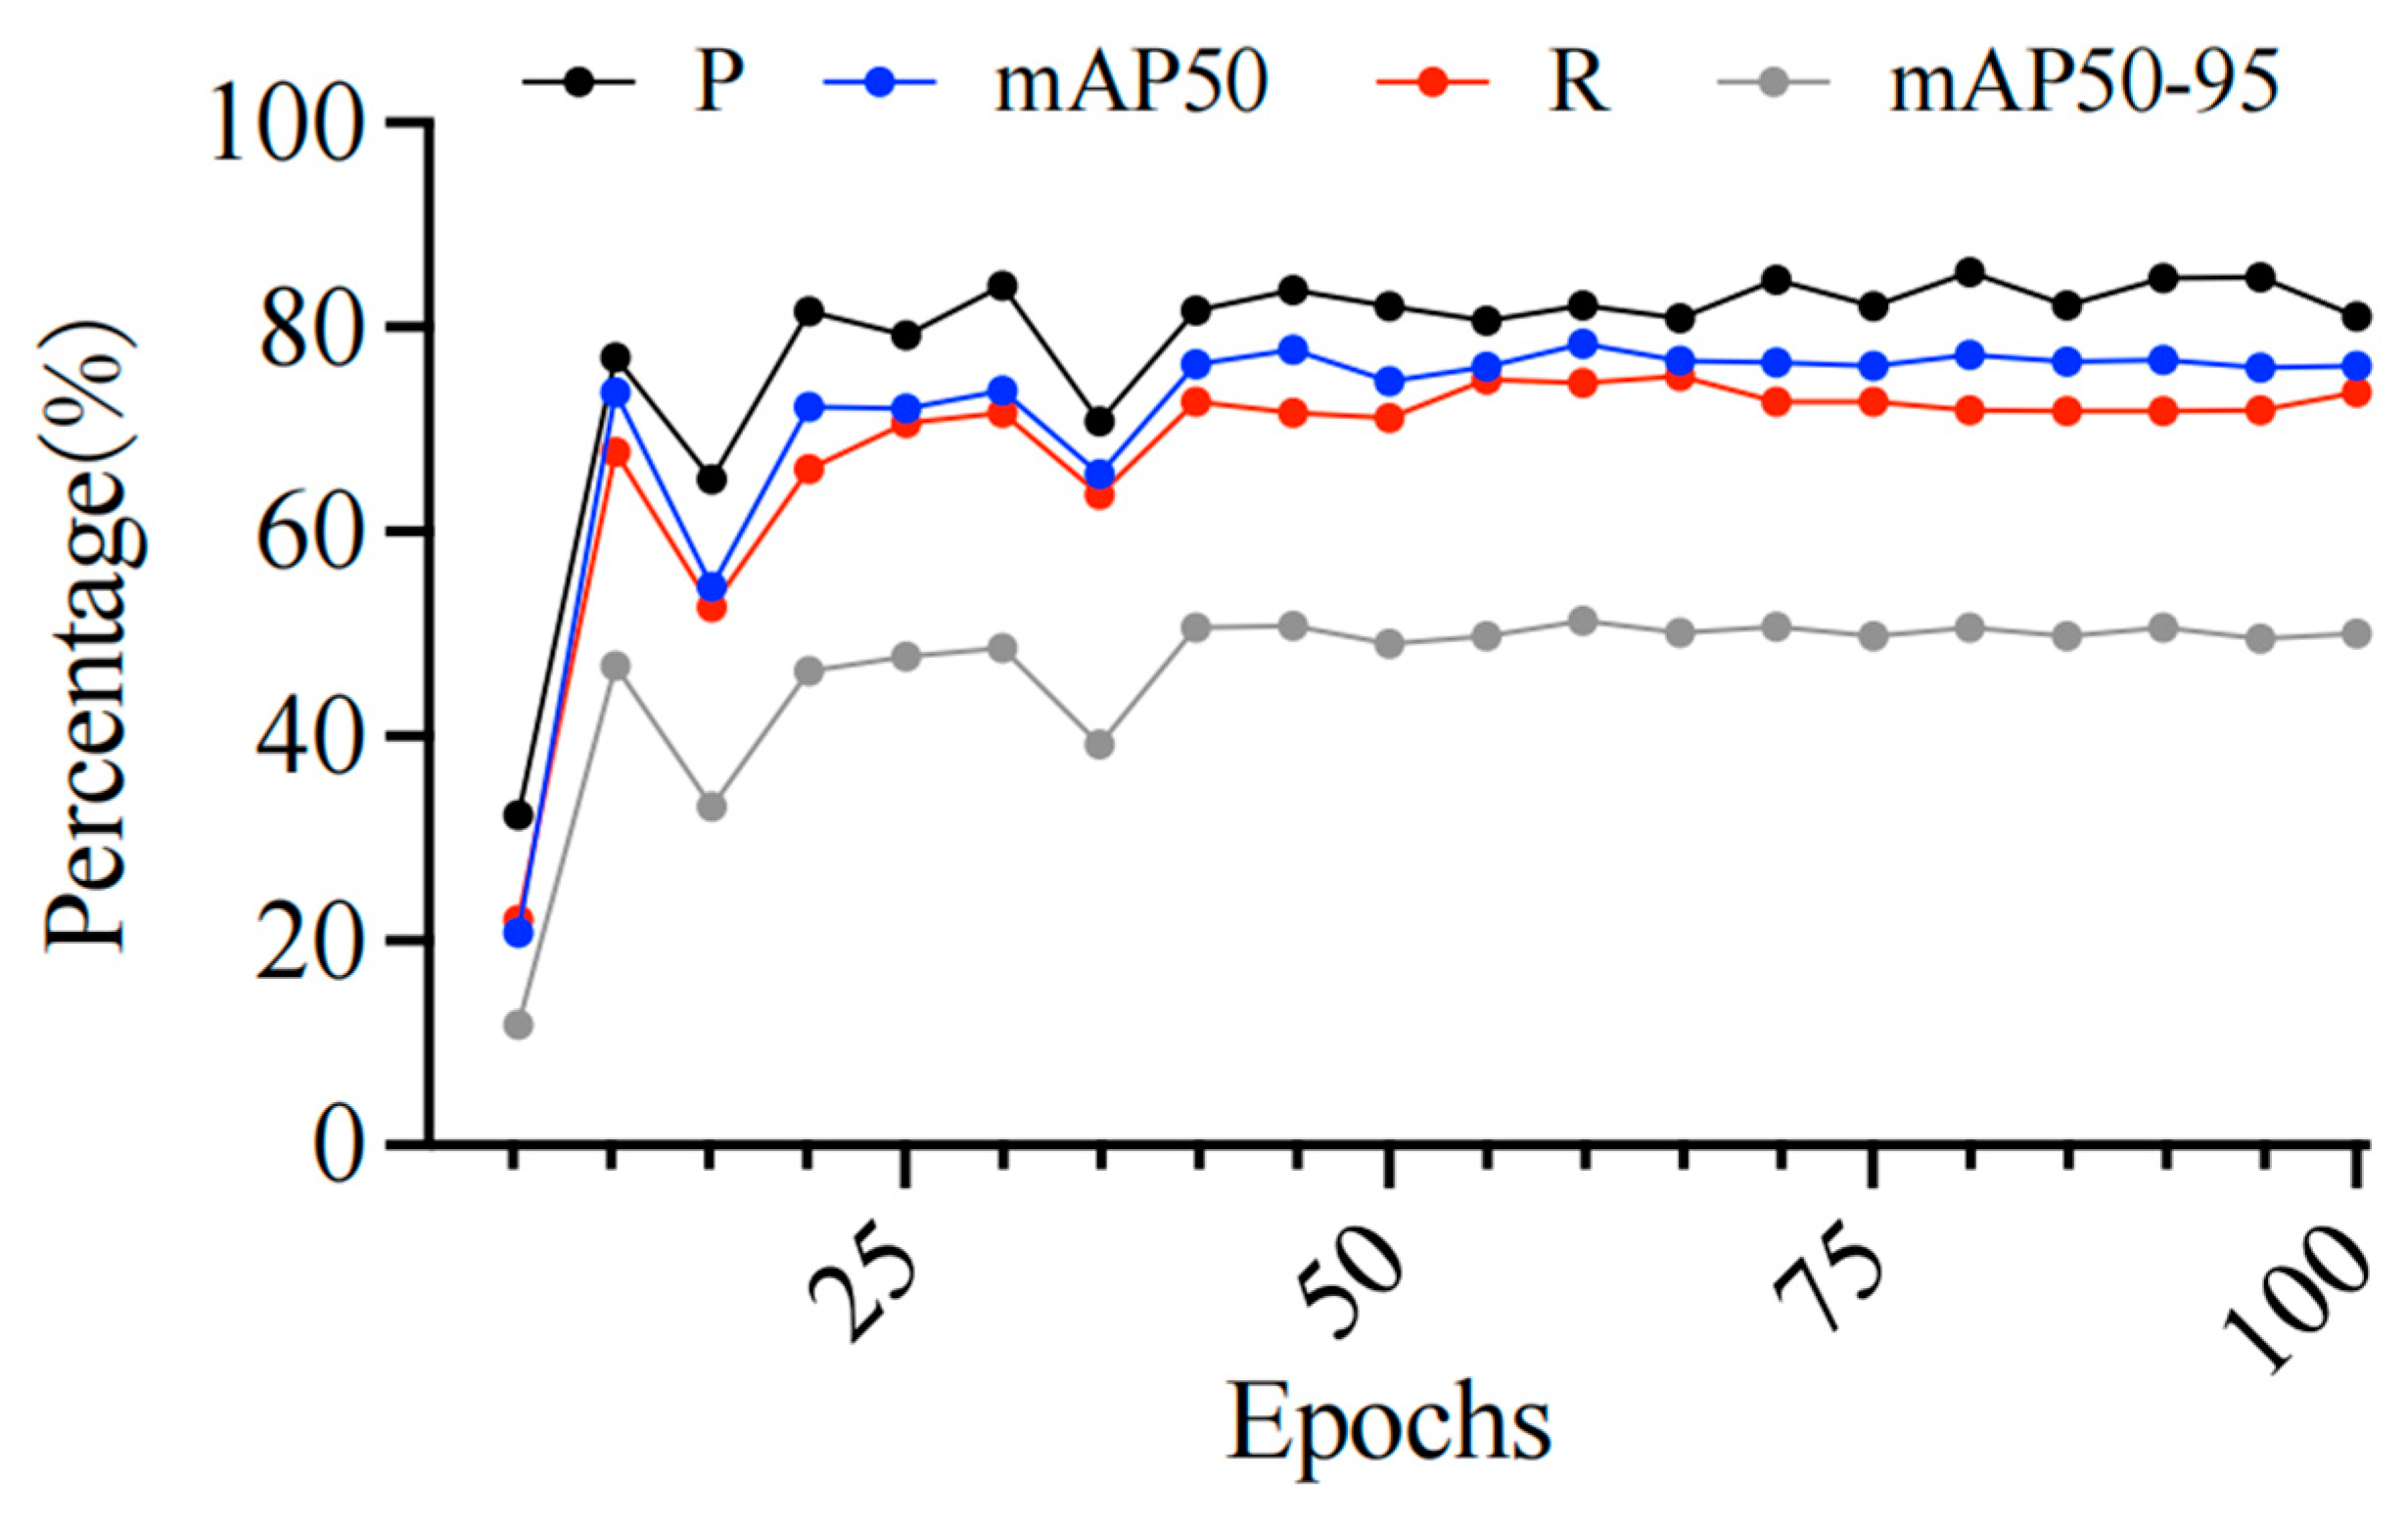
From the iteration curve of the algorithm training in Figure 6, it can be observed that various metrics (P, R, mAP50, mAP50-95) gradually stabilize as the number of training epochs increases, indicating that the algorithm is continuously optimized and gradually achieves better performance during the training process. Ultimately, the model stops after approximately 100 iterations, with the optimal precision (P) at 0.832, recall (R) at 0.752, mAP50 at 0.788, and mAP50-95 at 0.52. This suggests that the model has strong target detection capabilities, especially with higher mAP50 and stable precision, demonstrating good recognition accuracy and overall stability. Additionally, the relatively lower mAP50-95 indicates that recognition effectiveness may decline under higher IOU thresholds, but the overall performance remains satisfactory and suitable for recognition needs in most scenarios.
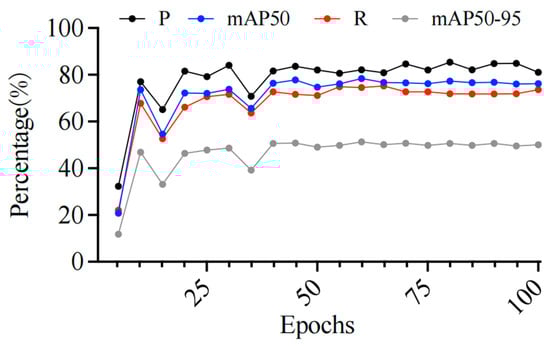
Figure 6.
Iteration curve of algorithm training effectiveness.
As shown in Table 2, firstly, the “Engineering Seal” category performs the best, with precision (P) at 0.917, recall (R) at 0.842, mAP50 reaching 0.912, and mAP50-95 at 0.593, indicating that this category is easily recognizable in the model and has high accuracy. The “Table” category also performs well, with P at 0.891, R at 0.899, mAP50 at 0.922, and mAP50-95 at 0.677, showing the model’s stable performance in this category.
Table 2.
Classification metrics statistics.
The “Equipment Diagram” category has precision and recall rates of 0.857 and 0.855, respectively, with mAP50 at 0.901 and mAP50-95 at 0.555, indicating that the model’s recognition effect for this category is good, slightly lower than the “Engineering Seal” and “Table” categories. In the “Signature” category, the model’s P value reaches 0.876, but the R value is slightly lower at 0.655, with mAP50 and mAP50-95 being 0.703 and 0.526, respectively, showing that there is a certain issue with recall insufficiency in the recognition of this category.
The recognition effects for the “Diagram Annotation” and “Text” categories are relatively lower, especially for the “Diagram Annotation” category, with a recall rate of only 0.495, resulting in mAP50 and mAP50-95 of 0.576 and 0.328, respectively. This may be due to the significant variability of this category in the sample images. In comparison, the “Text” category has a P value of 0.687, an R value of 0.766, an mAP50 of 0.716, and an mAP50-95 of 0.442, showing a relatively balanced recall rate despite the performance not being as good as other categories.
Overall, the YOLOv10 model performs excellently in recognizing the “Engineering Seal”, “Table”, and “Equipment Diagram” categories, but there is still room for improvement in the “Diagram Annotation” and “Text” categories. Future considerations could include adjustments in data augmentation or model optimization to enhance the recognition effects of categories with lower precision. In addition, the YOLO algorithm is renowned for its simplicity and efficiency, featuring a relatively fast inference speed. In this study, an NVIDIA GeForce RTX 3090 24GB graphics card was employed to conduct inference tests on 466 images. The results indicated that the average inference time was 143.6 milliseconds, fully meeting the application requirements.
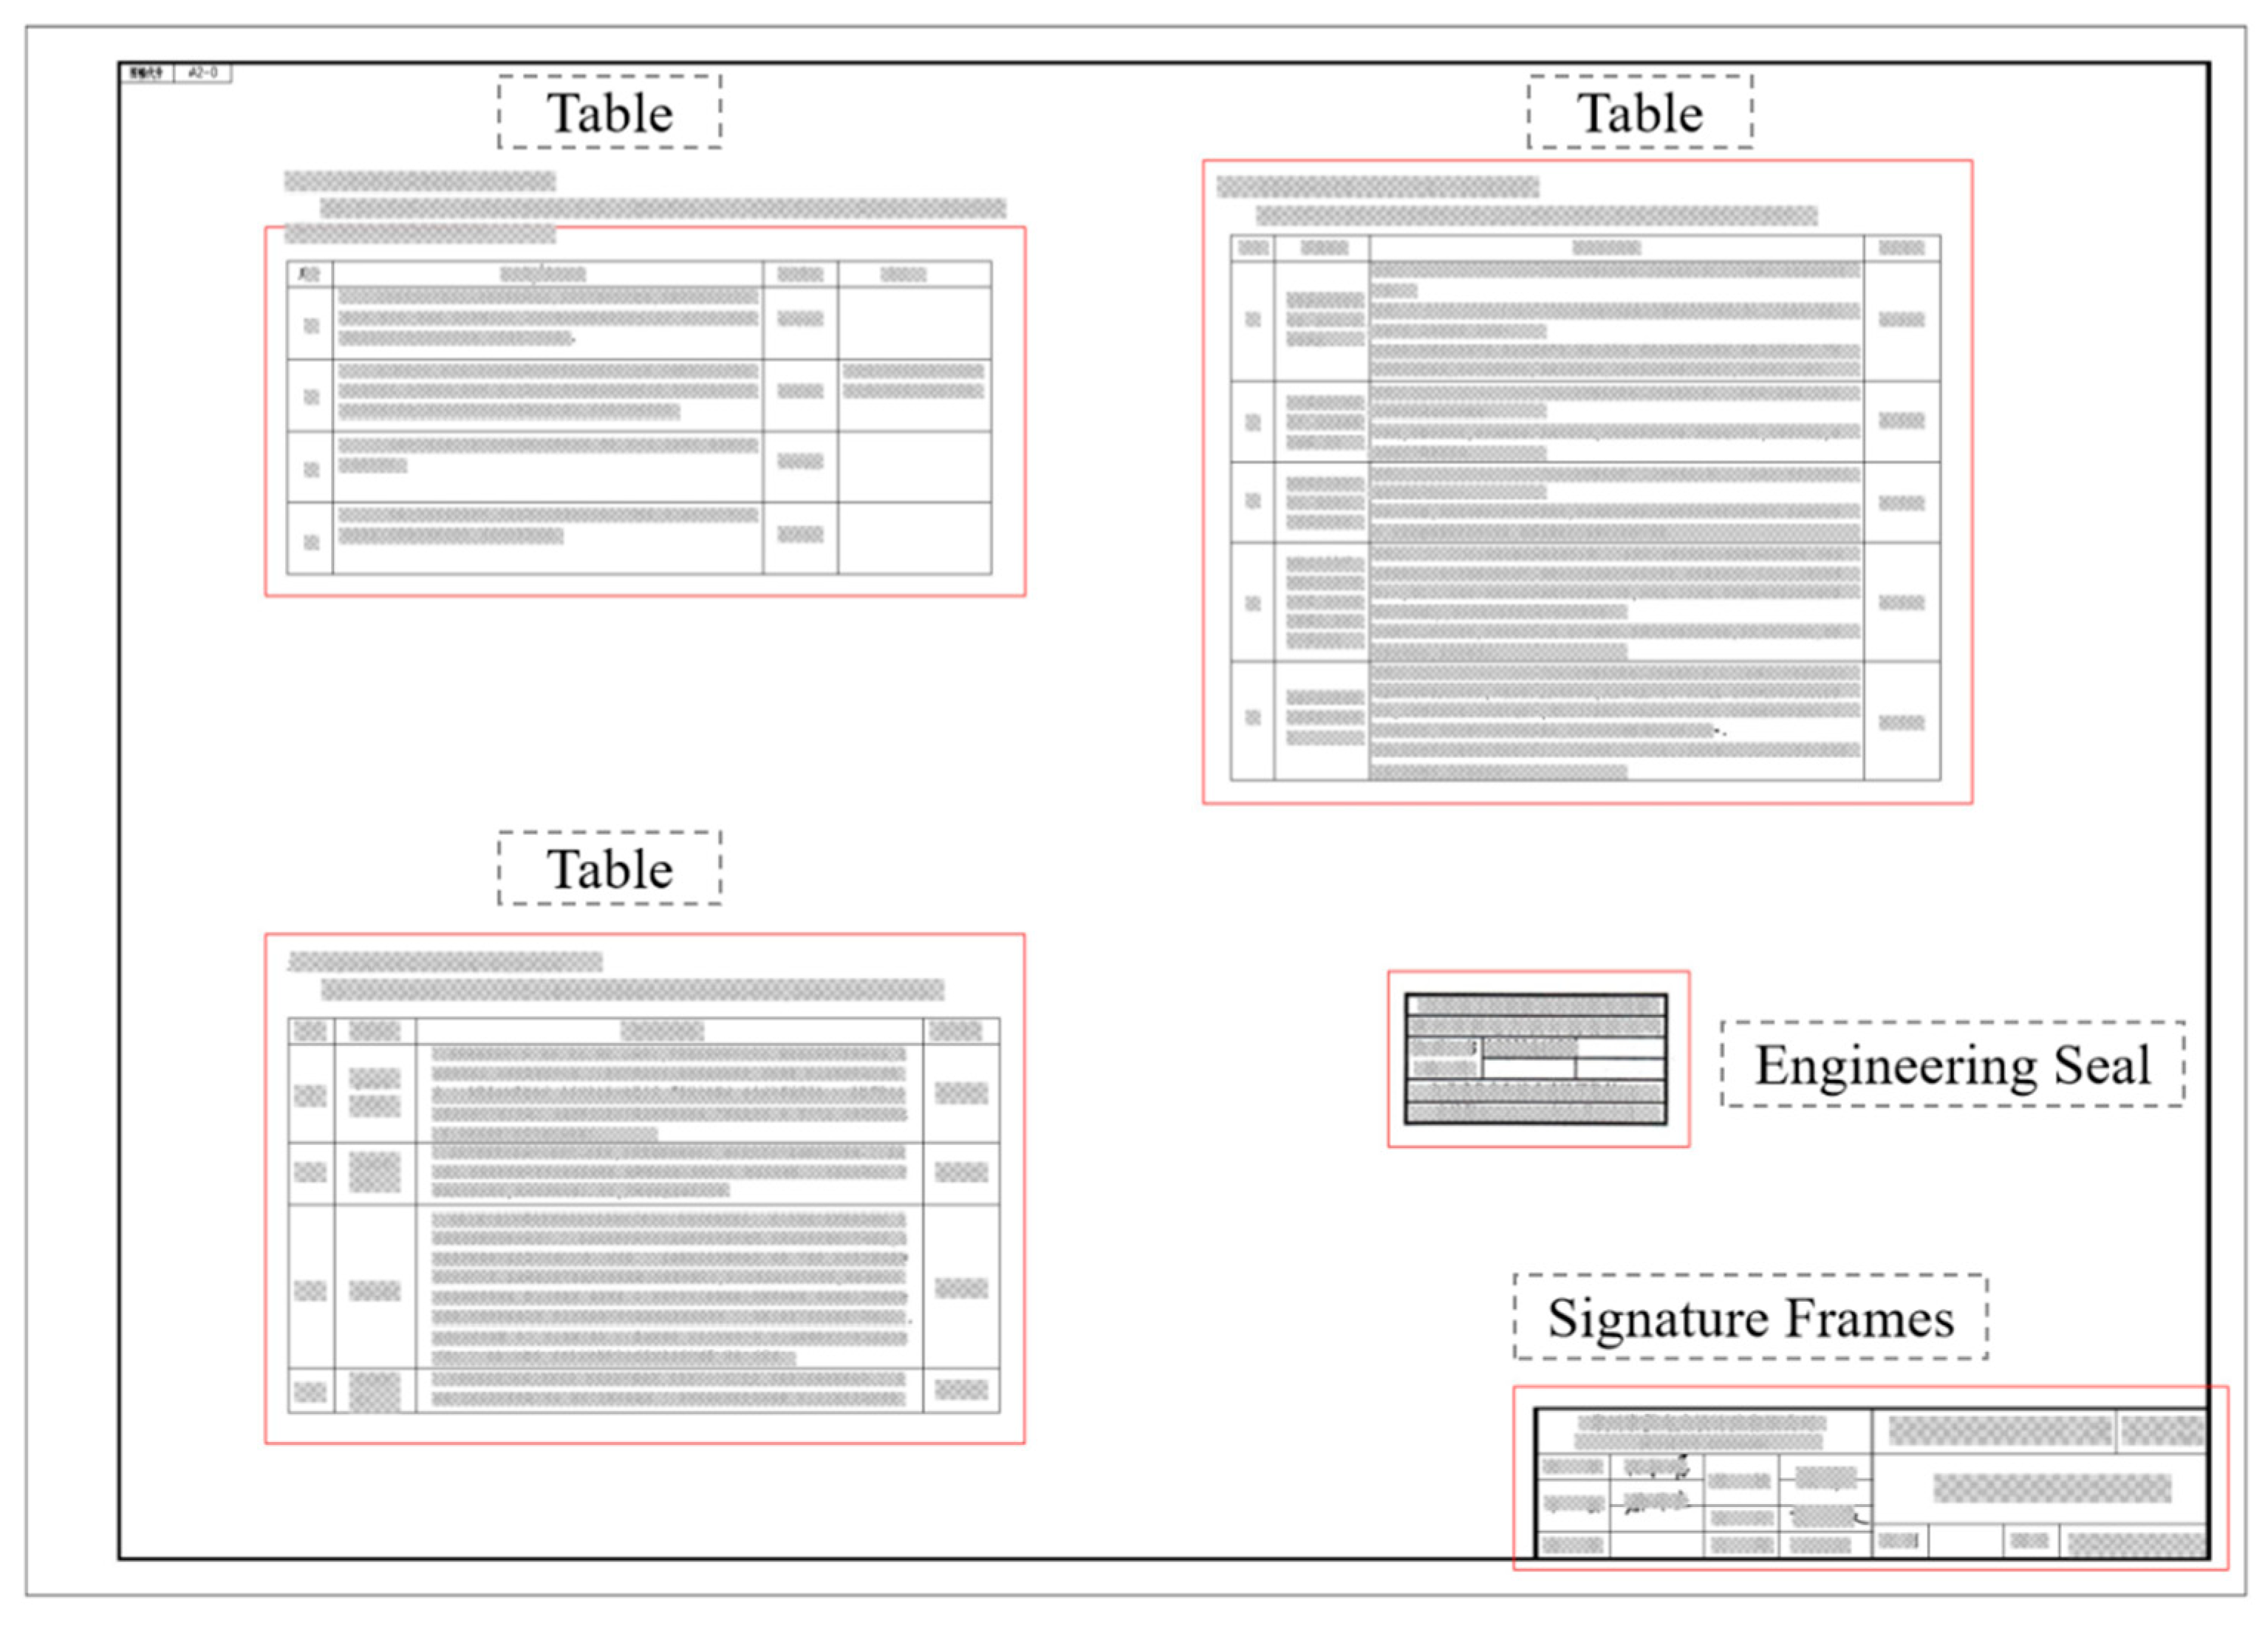
As shown in Figure 7, the YOLOv10 model has effectively recognized the tables in the image. The image displays multiple table areas accurately outlined, demonstrating the model’s excellent performance in this category. Combined with the statistical data analysis from before, the precision (P) and recall (R) for the table category are 0.891 and 0.899, respectively, with mAP50 reaching 0.922 and mAP50-95 at 0.677. These metrics confirm the high precision and stability of the YOLOv10 model in table recognition. The main reason why mAP50-95 is much lower than precision and recall and mAP50 lies in its stricter Intersection over Union (IoU) calculation criteria. mAP50 only requires that the IoU between the predicted box and the ground truth box be ≥50% to be counted as a correct detection, while mAP50-95 needs to calculate the average precision under multiple IoU thresholds ranging from 50% to 95%, so it is more stringent. Especially at high IoU thresholds (such as 90% or 95%), it is extremely sensitive to the positioning errors of bounding boxes. In addition, precision and recall mainly focus on whether the number of detections is accurate and do not strictly examine the alignment degree of bounding boxes, so they are not affected by the change in IoU as mAP50-95 is.
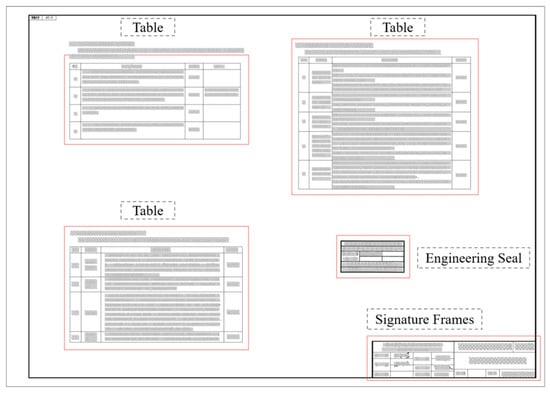
Figure 7.
Display of recognition results.
The high recognition rate for the table category may be attributed to the uniqueness of table structures, such as line segmentation and grid layouts, which can be effectively identified and distinguished during the model’s training process. Overall, the YOLOv10 model performs quite well in the detection of the table category, meeting most recognition needs.
4.2. Comparison of Table Structure Recognition Experiments
The experiment utilized Baidu’s ppstructure v2 [45], the original LORE, and the improved LORE proposed in this paper for comparative testing. The WTW-Dataset, publicly available at https://github.com/wangwen-whu/wtw-dataset, accessed on 1 October 2024, serves as the primary training dataset for both LORE and improved LORE in this study. Comprising 14,581 images, it provides rich ground truth annotations, including image names, table IDs, table cell bounding boxes (defined by four vertices), and row/column indices (start and end positions). To ensure a comprehensive evaluation, the dataset was systematically divided into training (80%), testing (10%), and validation (10%) subsets. This structured partitioning facilitates effective model training, performance evaluation, and hyperparameter optimization while mitigating overfitting and enhancing generalization across diverse table structures.
The test involved 200 engineering document PDFs, from which the table structures were recognized, and the content was extracted and stored into Excel. The comparative results of the experiment are shown in Table 3.
Table 3.
Comparative results of the three algorithms.
From the comparative data in Table 3, it can be seen that the method proposed in this paper performs the best in terms of table extraction accuracy, reaching 91.61%. Out of the 155 extracted tables, 142 tables had their structure and content correctly parsed, demonstrating a high level of accuracy. In comparison, the LORE algorithm’s accuracy rate is 89.03%, slightly lower than the method in this paper, but still better than ppstructure v2’s 72.26%. Qwen and GPT, among other multimodal large language models, were evaluated in a comparative manner for the table recognition task, achieving accuracy rates of 67.09% and 74.19%, respectively. Research shows that these large language models perform relatively well in recognizing small-sized tables, but their recognition accuracy decreases when dealing with large-sized tables. Additionally, large language models have high requirements for hardware conditions, making it difficult to achieve single-machine local deployment. Among the comparisons of various table structure recognition algorithms, PPStructure v2 demonstrated the fastest inference speed, with an average inference time of only 0.21 s per table. The LORE algorithm has an improvement in accuracy, but the inference time increased to 0.73 s. The improved LORE algorithm proposed in this paper adopted a cutting strategy for large-sized images, which not only effectively improved the recognition accuracy but also led to a slight increase in inference time, reaching 1.14 s. Since large language models cannot be locally deployed, they are not compared here. This indicates that the method in this paper has higher precision in table structure and content parsing, can more effectively extract table information, and has better potential for application.
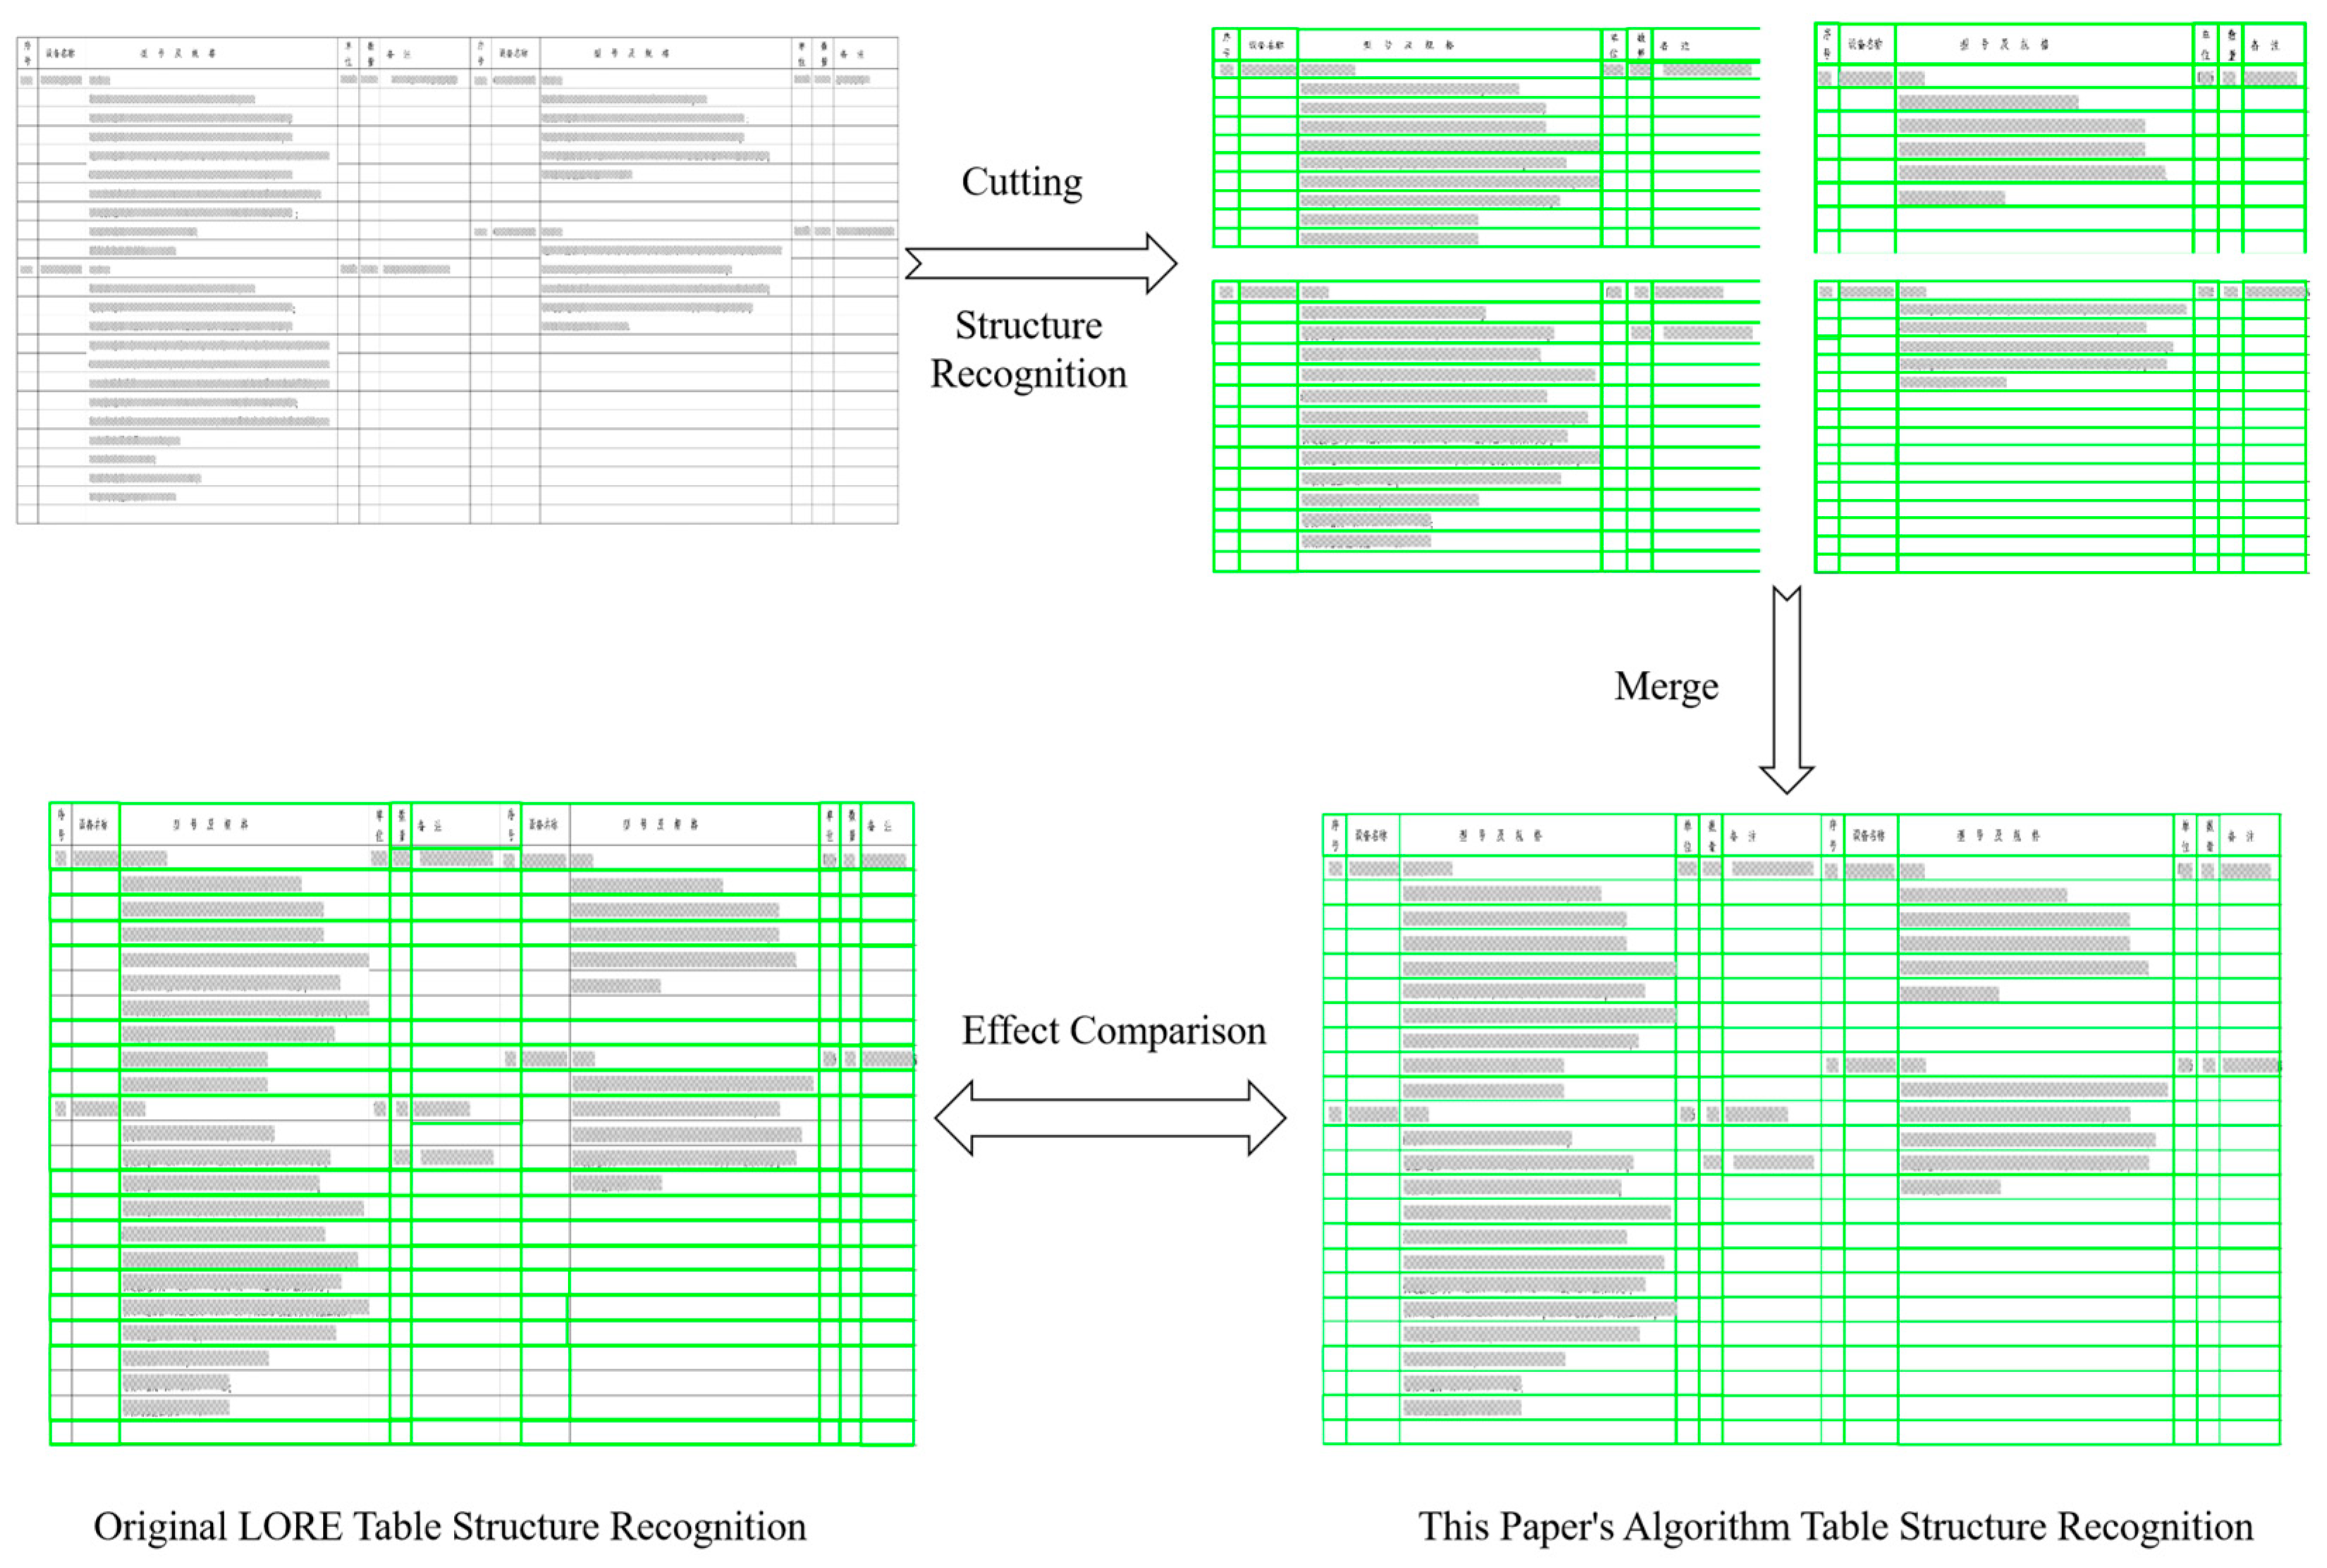
As shown in Figure 8, this paper’s algorithm significantly improves accuracy in the table processing by splitting the table for recognition and then merging the results. Compared to the traditional LORE algorithm, this method has an advantage in segmenting complex tables. Specifically, the LORE algorithm tends to lose structure or misplace content when dealing with multi-level, complex table structures, while this paper’s method, through splitting and precise recognition, can better preserve the integrity of the original table structure and content, ensuring that the merged table more closely matches the format and layout of the original data. This split-recognize-merge process effectively enhances the accuracy of table recognition, especially suitable for tables containing a large number of fields and complex structures.
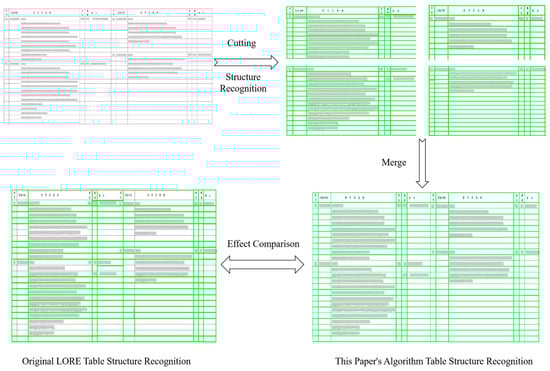
Figure 8.
Comparison of the recognition process of this paper’s algorithm with the original LORE algorithm.
4.3. Comparison of Experiments on Semantic Matching of Equipment Names Based on Improved Cuckoo Search Algorithm
The improved cuckoo search algorithm includes the following parameters (Table 4): a population size of 25, representing the number of nests or candidate solutions in each iteration; a discovery probability of 0.25, which determines the likelihood of a nest being discovered and replaced, balancing exploration and exploitation; a number of iterations set to 1000, indicating the maximum rounds of algorithm execution; and an update step size of 0.1, controlling the step size for Levy flight to adjust the solution search precision. These parameters work together to enhance optimization efficiency and adaptability.
Table 4.
Algorithm parameter settings for optimization function.
The optimization testing utilizes three benchmark functions carefully selected to align with the characteristics of the problem addressed in this paper, as shown in Table 5. Each function is defined in a 2-dimensional space and has a theoretical global optimum greater than zero. F1 features a complex inverse summation structure with a domain of [−65, 65] and a global minimum of 1. F2 combines polynomial and trigonometric components, operating within [−5, 5] and achieving a minimum value of 0.3. F3 is a highly nonlinear polynomial function with interdependent variables, defined over [−2, 2] and with a minimum value of 3.
Table 5.
Optimization function details.
Table 6 presents the results of 20 independent runs of the CS and ICS algorithms on three benchmark functions, highlighting the performance of each in terms of maximum, minimum, and mean values achieved compared to the theoretical optimal values. Across all three functions, the improved cuckoo search (ICS) algorithm demonstrates superior performance over the standard cuckoo search (CS) algorithm.
Table 6.
Comparison of Experimental Results for Different Swarm Intelligence Optimization Algorithms.
For F1, the maximum and mean values of ICS (5.03 and 2.04, respectively) are slightly better than those of CS (5.39 and 2.09). ICS consistently reaches the theoretical optimal value of 1.00, whereas CS only achieves a minimum of 1.02. For F2, ICS achieves a slightly lower minimum value (0.39) compared to CS (0.40) and exhibits a lower mean (0.41) than CS (0.43), demonstrating its ability to converge closer to the theoretical optimum of 0.3. On F3, ICS significantly outperforms CS, with a minimum value (3.00) that precisely matches the theoretical optimum, whereas CS only achieves a minimum of 3.06. Additionally, ICS produces a lower mean (3.14) compared to CS (3.78) and a much lower maximum (4.06 vs. 5.88).
Overall, ICS shows more consistent and accurate convergence across all functions, particularly in achieving values closer to the theoretical optima, highlighting its advantage over the standard CS algorithm in both accuracy and reliability.
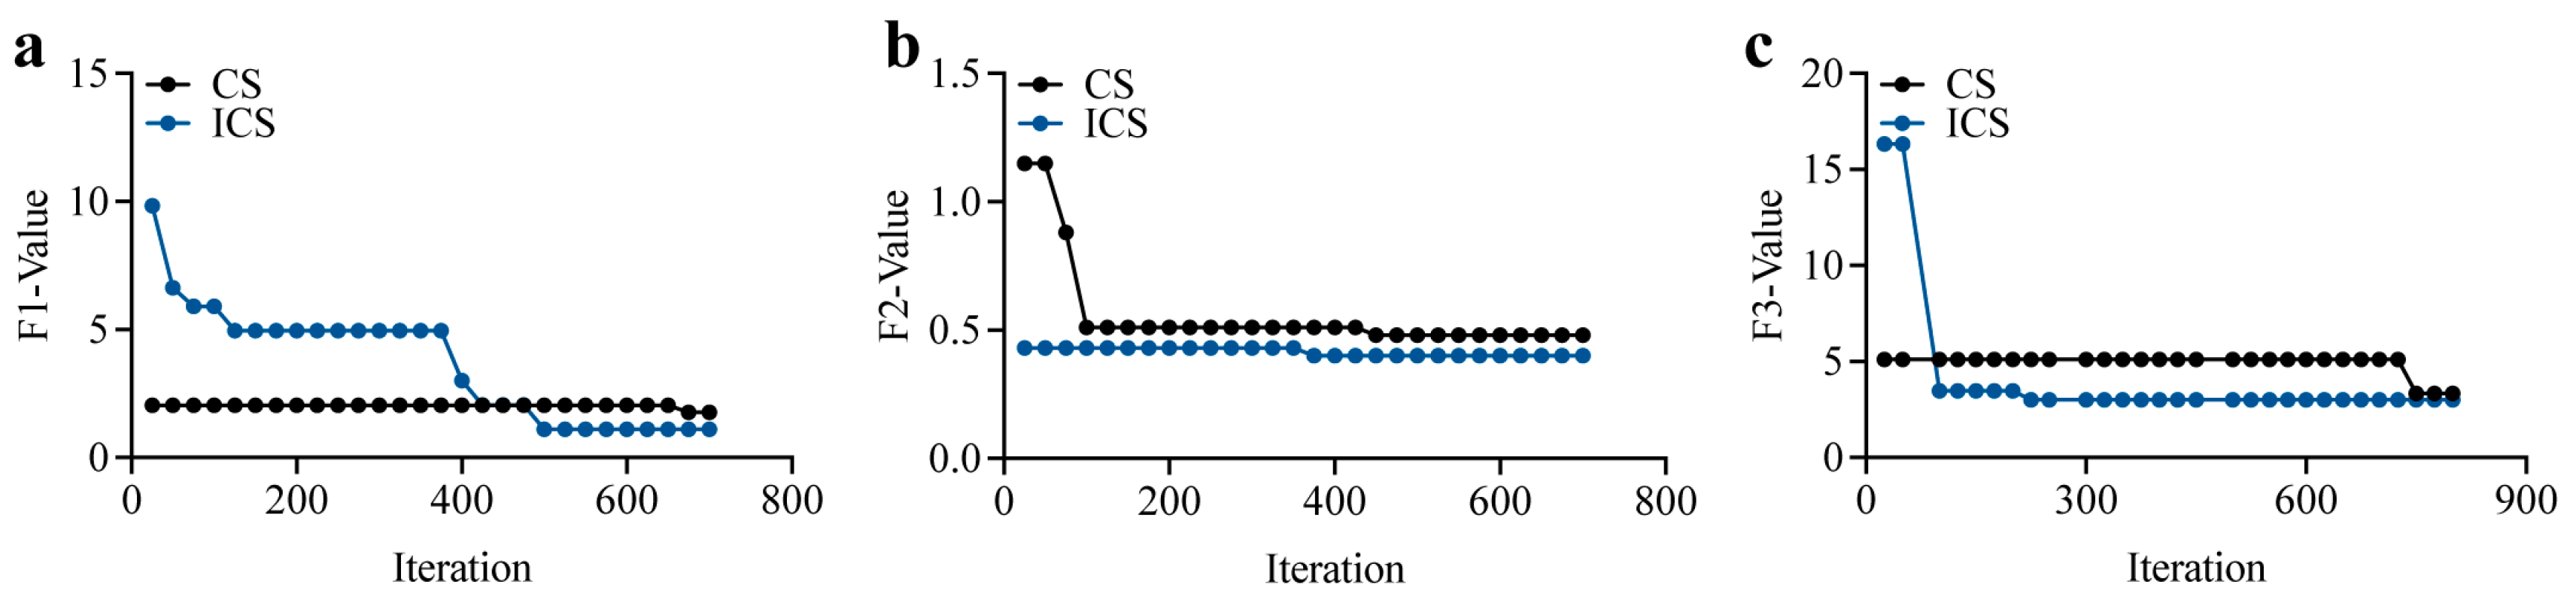
As shown in Figure 9, the convergence curves further emphasize the effectiveness of the improvements introduced in the ICS algorithm, particularly the incorporation of sine optimization and local perturbation techniques. These enhancements significantly contribute to both the convergence speed and the optimization ability of ICS.
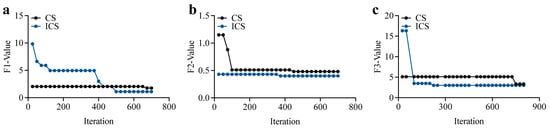
Figure 9.
Iteration curves of the three functions for CS and ICS. (a) Iteration Curves of Function F1 (b) Iteration Curves of Function F2 (c) Iteration Curves of Function F3.
The sine optimization strategy accelerates the search process by adjusting the movement of solutions based on sine functions, allowing ICS to explore the solution space more efficiently in the early iterations. This leads to faster convergence, particularly in F1 and F2, where ICS quickly approaches near-optimal solutions, unlike CS, which tends to be slower in reaching these values.
Additionally, the local perturbation mechanism improves the algorithm’s ability to fine-tune solutions by introducing small, targeted adjustments around promising candidate solutions. This allows ICS to avoid stagnation and effectively refine solutions in the later stages of optimization. As a result, ICS demonstrates better exploitation capabilities, achieving solutions that are closer to the theoretical optima with higher precision, particularly evident in F3, where ICS stabilizes at the global minimum more accurately than CS.
These two key improvements in ICS—sine optimization for faster exploration and local perturbation for more accurate exploitation—are crucial in enhancing both the convergence speed and solution accuracy, making ICS a more powerful and reliable optimization algorithm compared to CS.
Table 7 shows the key parameter settings for the improved cuckoo search algorithm and particle swarm optimization algorithm, used to optimize the sum problem. In the cuckoo search algorithm, the population size is set to 25, the individual dimension is 2, the optimization sum value range is [0, 100], the discovery probability is 0.25, the number of iterations is 30, and the update step size is 0.1. In the particle swarm optimization algorithm, the population size is also 25, the individual dimension is 2, and the optimization sum value range is also [0, 100], with a maximum velocity set to 1.5, an inertia weight of 0.8, and both the self-cognition factor and the social cognition factor are 1.5. A total of 474 self-tagged equipment name pairs were used for semantic matching parameter training. During the construction process of training data, we represent device names as semantic pairs, for example, <muxianshebei, mushe>, to represent that “mushe” is a semantically equivalent or approximate expression of “muxianshebei”. During the training process, for each device name, we select the most similar candidates based on semantic similarity measurement and use the labeled data for matching verification to evaluate its correctness. In addition, the fitness function is designed as the matching accuracy rate to measure the generalization ability and recognition accuracy of the model between different semantic variants, thereby optimizing the semantic matching effect.
Table 7.
Algorithm parameter settings for equipment names.
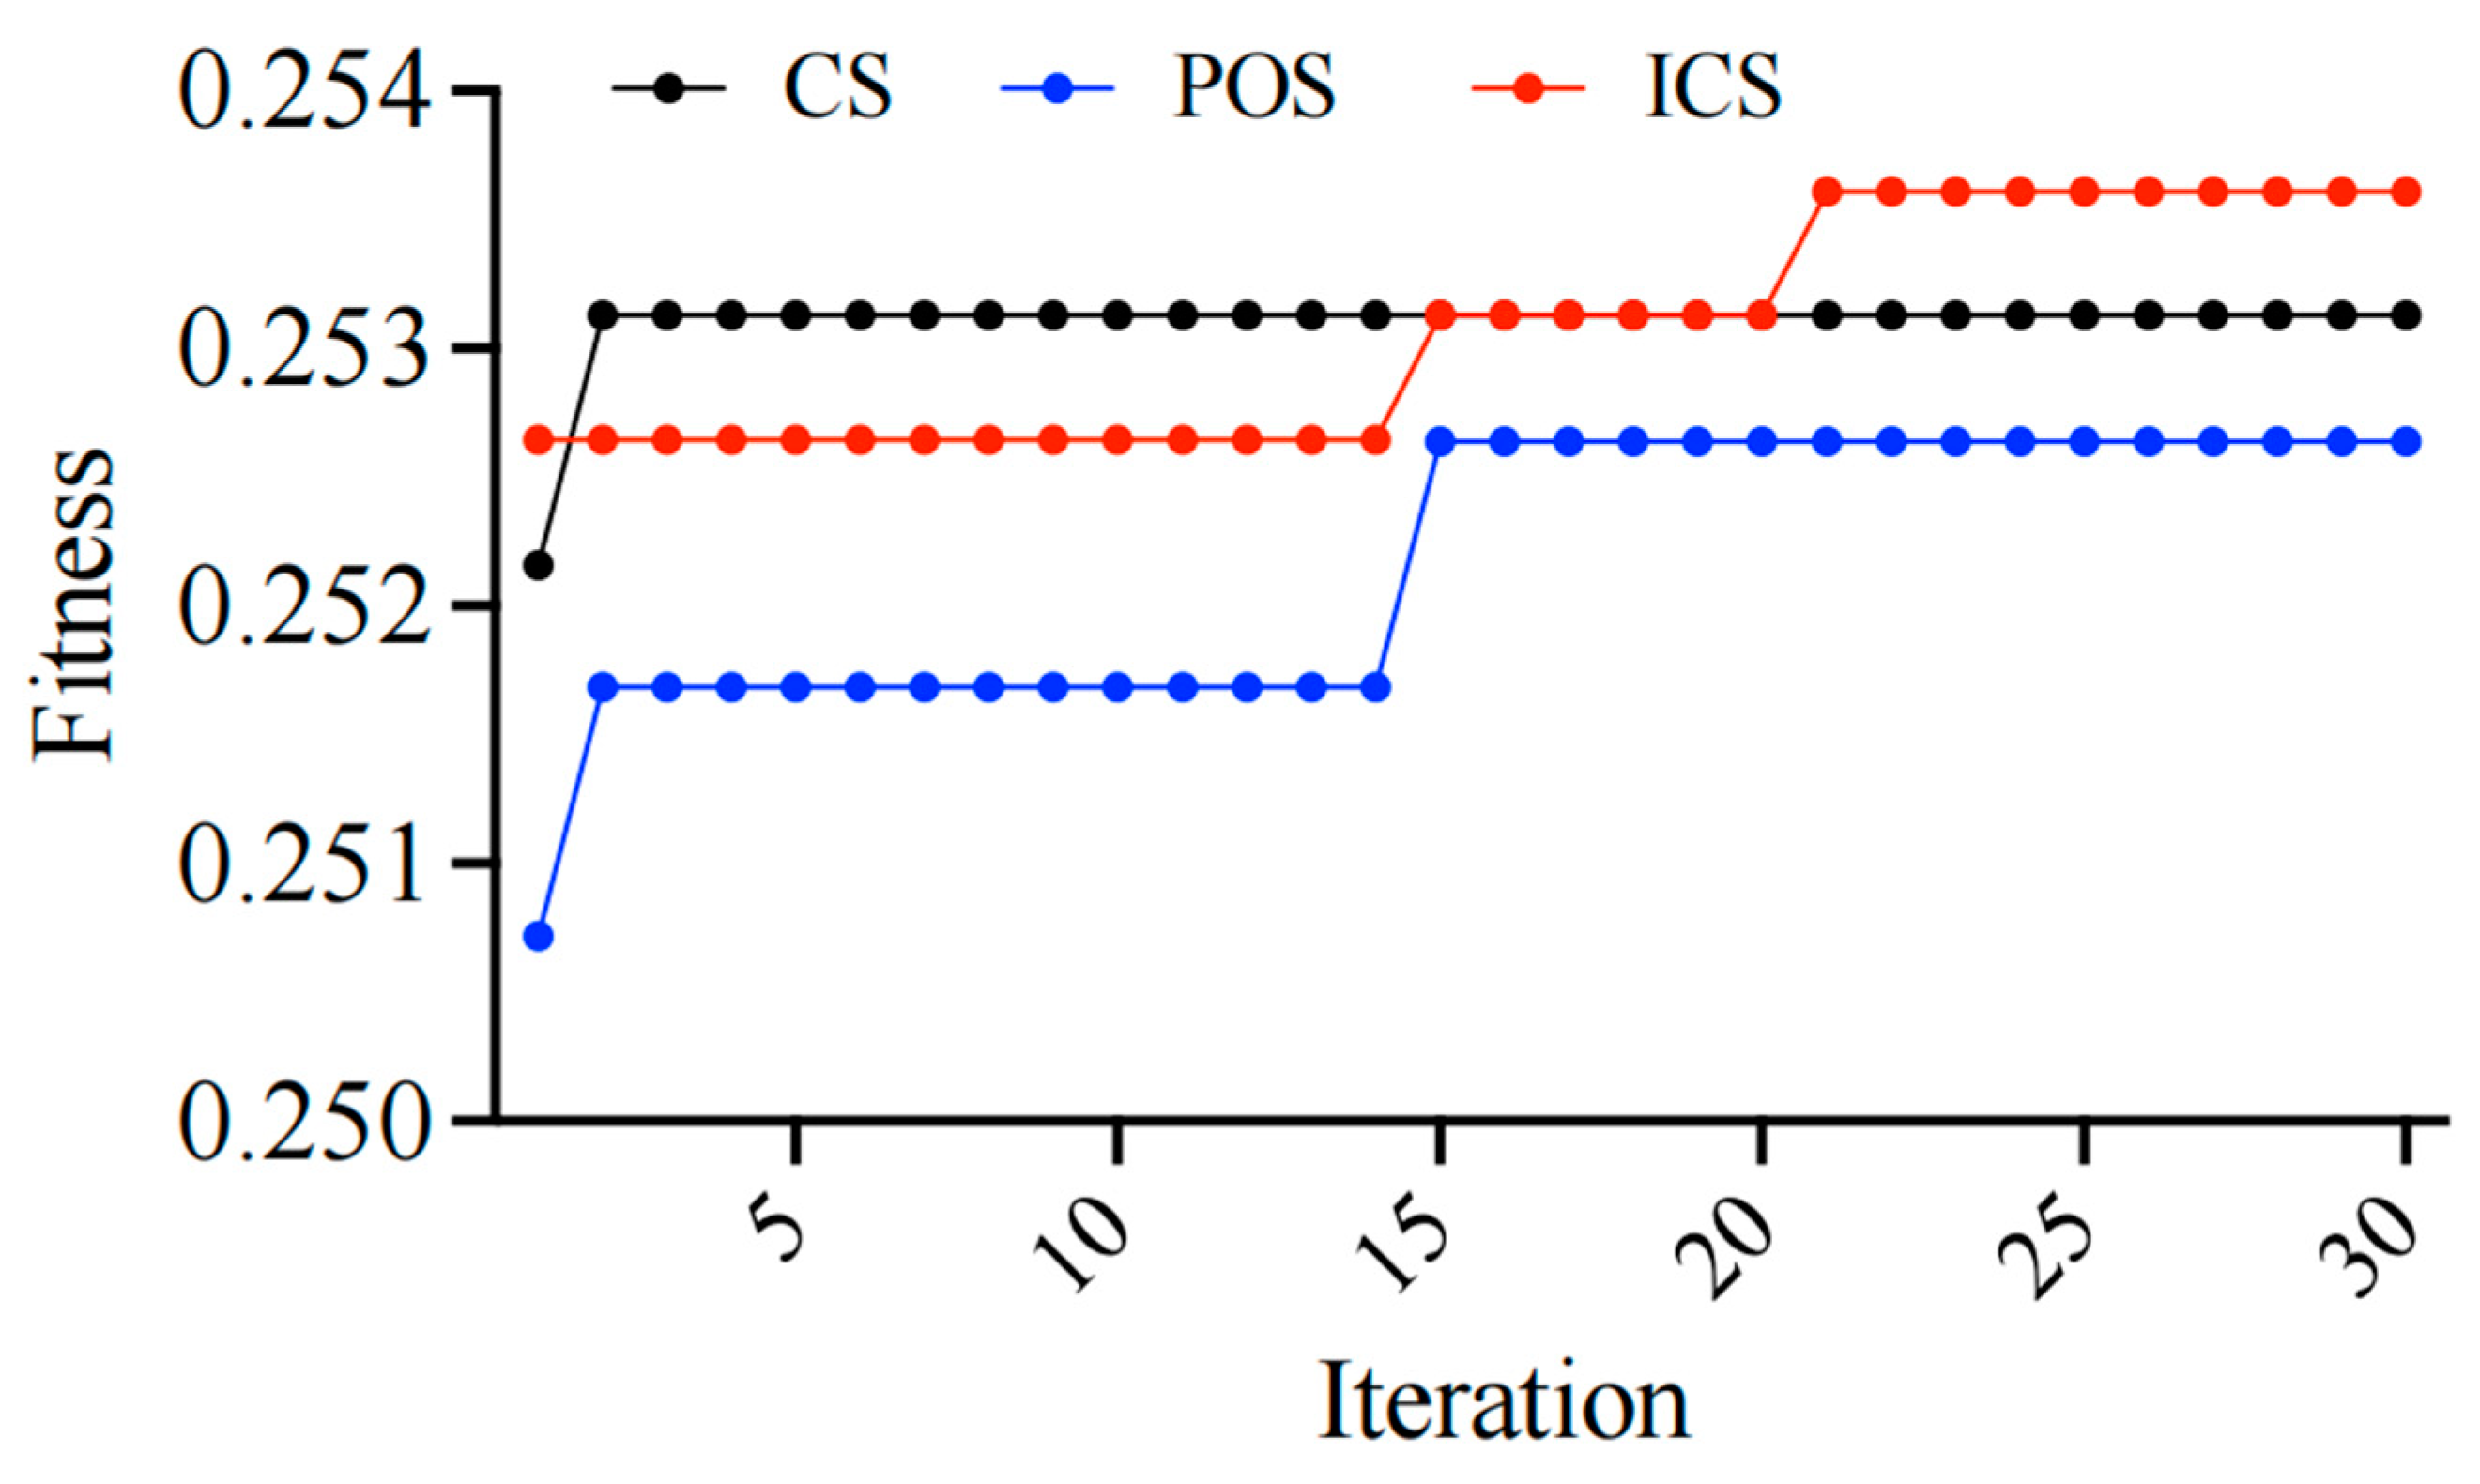
Figure 10 demonstrates that after 30 iterations, the improved cuckoo search (ICS) algorithm outperforms the traditional cuckoo search (CS) and particle swarm optimization (PSO) in terms of optimization effectiveness, showing its stronger sustained optimization capability. During the first 20 iterations, the fitness of ICS rapidly increased and surpassed both CS and PSO, eventually stabilizing at 0.253609, which is higher than CS’s 0.253128 and PSO’s 0.25264. This indicates that ICS can continue to approach the optimal solution after multiple iterations, achieving better fitness performance. The ultimately optimized values of α and β are 32.3 and 11.8, respectively, which are then substituted into the semantic similarity calculation.
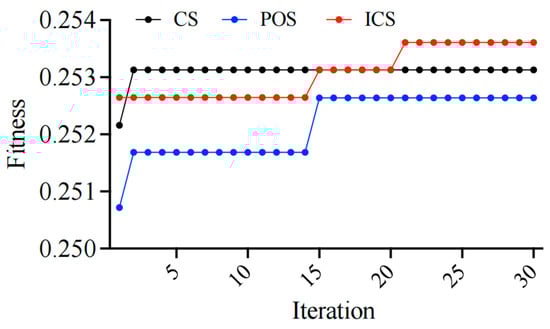
Figure 10.
Iteration curves of the three algorithms.
The reason for the overall lower fitness is that we mixed all equipment names for matching scoring without considering the characteristics of different equipment categories. In fact, the material list can be divided into different categories such as main transformer equipment, 110 kV equipment, and 10 kV equipment. Therefore, if we can conduct semantic similarity matching based on categories and remove the corresponding equipment names from the database after a successful match, it will be more conducive to improving the accuracy of matching and overall fitness. The matching cases are shown in Table 8, with a matching accuracy close to 100%.
Table 8.
Partial equipment quantity check table for a new construction project.
4.4. Systematic Practice
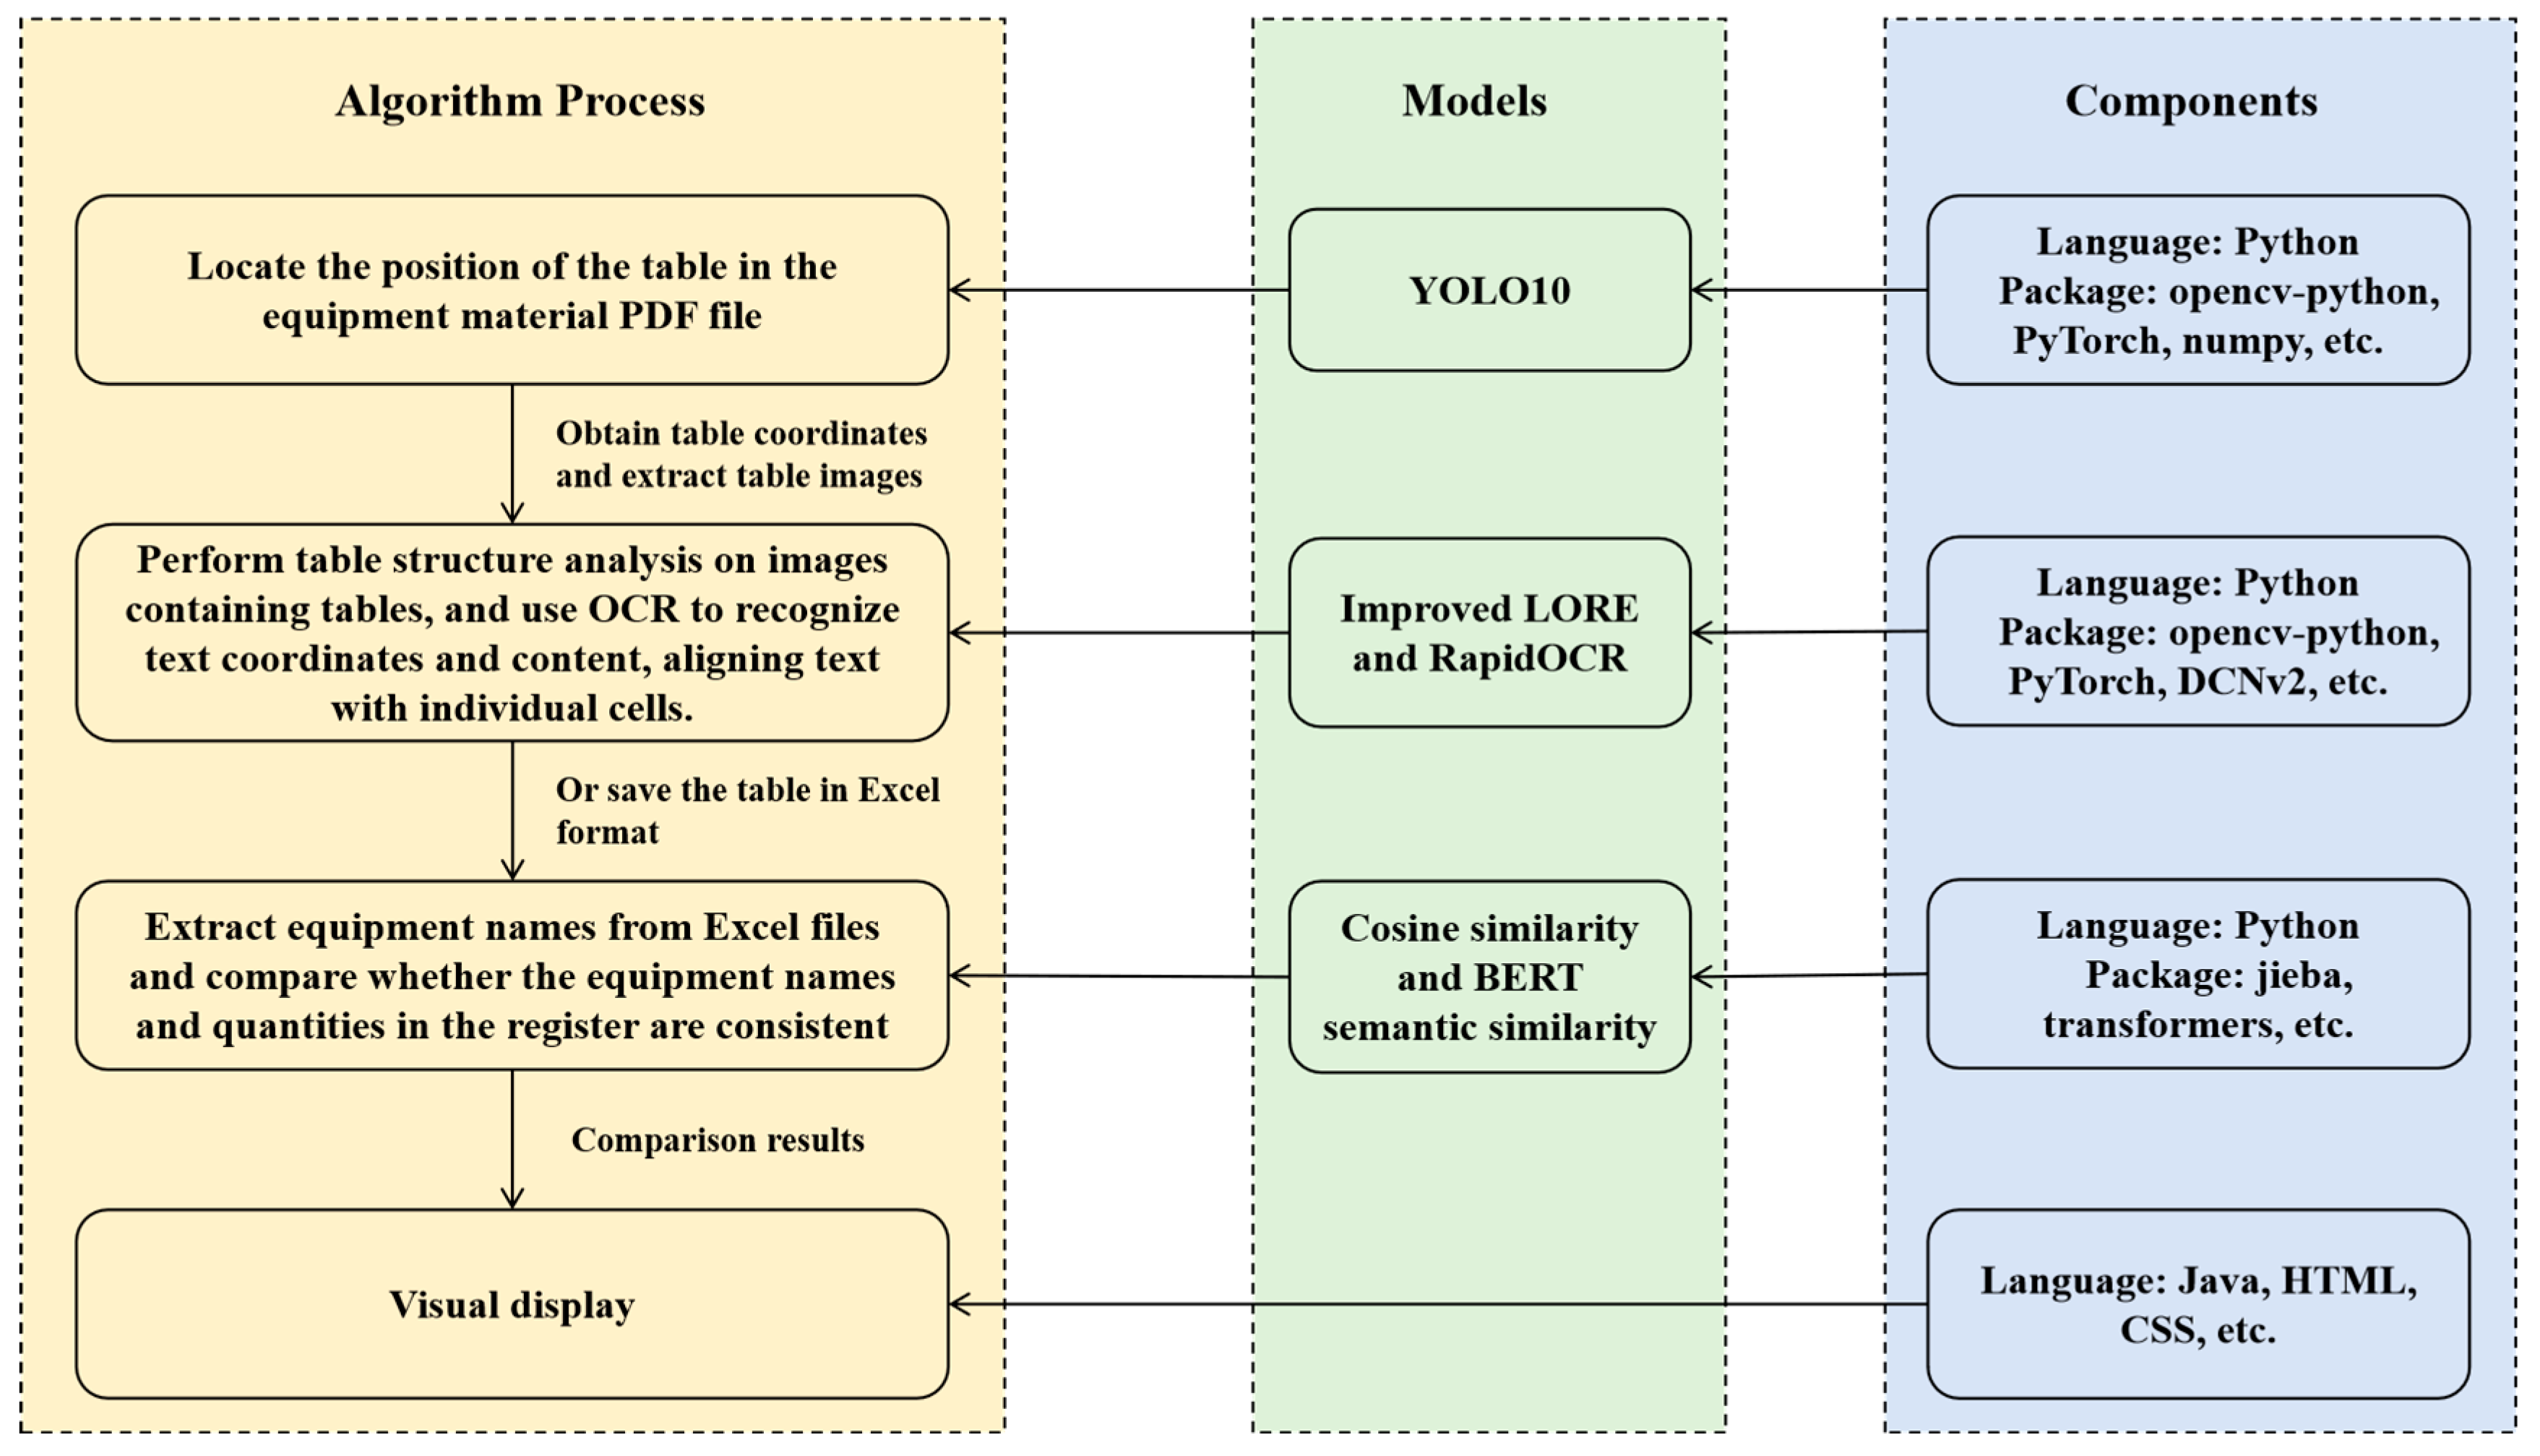
As shown in Figure 11, this system is based on deep learning and computer vision technologies to automatically detect tables (YOLOv10) from PDF documents, analyze table structures (improved LORE or RapidOCR), and extract text content recognized by OCR. Subsequently, the system uses the BIDERT semantic matching model combined with natural language processing technologies (jieba, transformers) to perform word segmentation and matching analysis on the extracted text, ensuring data consistency. Finally, the processed results are stored in an Excel structure and visualized through technologies like Java 1.8, HTML5, and CSS3. This system checked the material data of one main volume and three sub-volumes, successfully realizing the whole process from PDF input to result analysis. The total time consumption of the entire data processing process is approximately 3 s, fully meeting the real-time requirements.
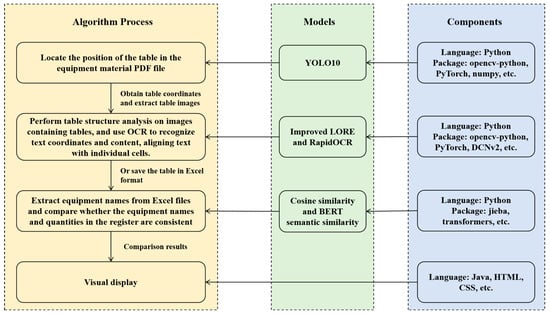
Figure 11.
Schematic diagram of system process, model and components.
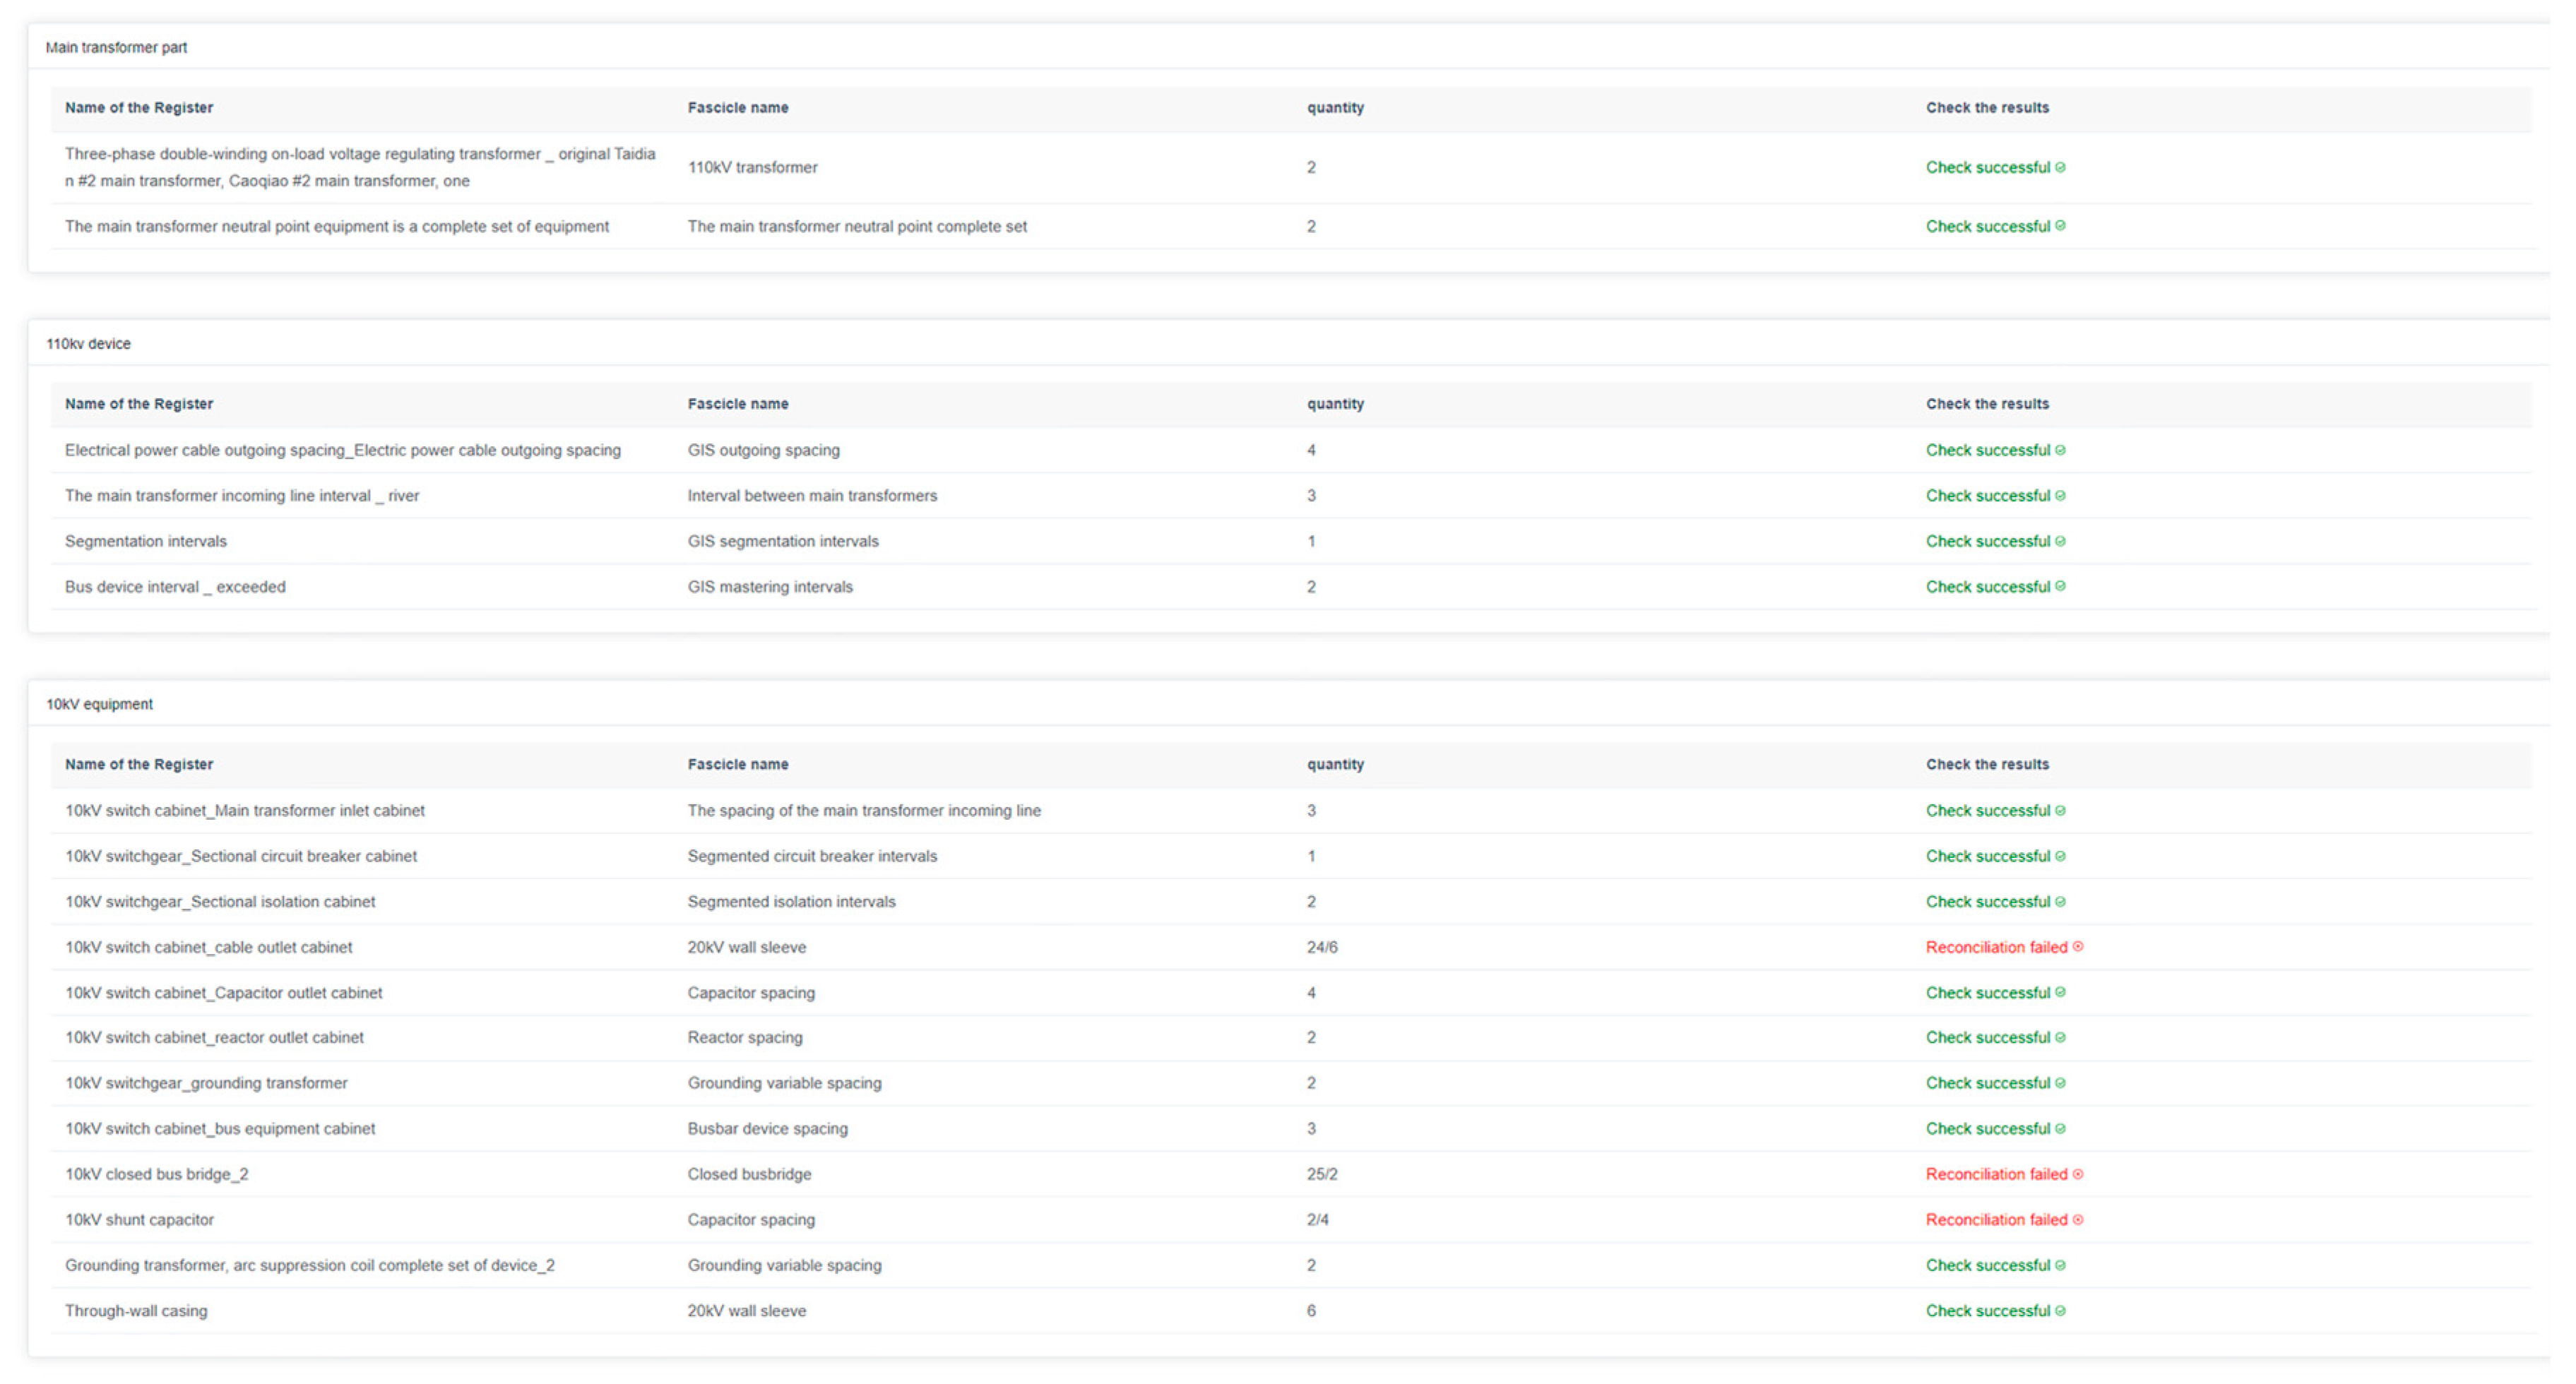
As shown in Figure 12, we integrated the proposed algorithm into the system of an engineering design organization and developed a visualization module to enhance its practical application. In this module, green highlights indicate matching entries, while red signifies mismatches. During the verification process, personnel reviewed sub-volume material lists and successfully identified errors caused by improper documentation and missing materials. This AI-driven approach streamlines the review process by providing clear visual feedback, reducing manual inspection time, and minimizing human errors. By embedding AI into business operations, our method significantly improves efficiency, accuracy, and reliability in engineering design, demonstrating its tangible impact on the industry.
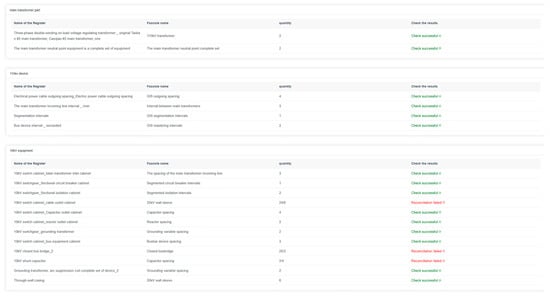
Figure 12.
Matching result system screenshot.
5. Discussion
The intelligent verification method proposed in this study has demonstrated remarkable effectiveness in the automatic recognition and understanding of table structures within engineering drawings and document processing. By integrating YOLOv10, the improved LORE algorithm, RapidOCR, and a semantic similarity matching method based on BERT and the improved cuckoo search algorithm, several key challenges in table processing have been effectively addressed as follows:
- (1)
- Table Object Recognition
The application of YOLOv10 has significantly improved table object detection [7]. With a precision of 0.891, recall of 0.899, mAP50 of 0.922, and mAP50-95 of 0.677, the model exhibits strong target detection capabilities. The recognition performance for the “engineering seal”, “table”, and “equipment diagram” categories is particularly effective. However, “diagram annotation” and “text” categories still have room for improvement, indicating the need for further refinement in detecting smaller objects. In addition, compared with the table structure recognition models based on row-column detection [46], the method proposed in this study exhibits higher robustness and versatility. It can effectively handle various types of tables, including irregular tables, multi-row and multi-column tables, and nested tables.
- (2)
- Table Structure Extraction
The improved LORE algorithm achieved a table extraction accuracy of 91.61%, surpassing the original LORE algorithm’s 89.03% [6] and Baidu’s PPStructure v2’s 72.26% [45]. This improvement is attributed to our segmentation strategy for large-sized images, successfully addressing the limitations of previous research that primarily focused on fixed-scale training with small-sized datasets. Compared to multimodal large language models (such as GPT-4o, 74.19%), our method avoids reliance on high computational resources while maintaining local deployability, which is a key advantage for engineering applications.
- (3)
- Innovations in Semantic Matching
Our BERT-based semantic matching framework [34], by integrating contextual embeddings, surpasses traditional cosine similarity methods and successfully addresses challenges such as acronym variability (e.g., the differences between “mushe” and “muxian shebei”). This achievement aligns with recent advancements in context understanding emphasized in domain-specific natural language processing models. Notably, our improved cuckoo search algorithm optimized the adjustment factors (α = 32.3, β = 11.8), achieving nearly 100% matching accuracy in practical tests.
- (4)
- Industrial Relevance
These innovations collectively bridge the gap between theoretical research and industrial applications. Combining lightweight deep learning models with domain-specific optimizations is crucial for scalable document processing systems. The real-time performance of our method (approximately 3 s per document) and its compatibility with standard hardware (such as the RTX 3090) effectively demonstrate its practical feasibility, addressing the critical limitations faced by resource-intensive large language models and heuristic-based methods.
6. Conclusions
The intelligent verification method proposed in this study has demonstrated high accuracy and robustness in aspects such as table area localization, structure recognition, text extraction, and semantic matching. The integration of deep learning-based object detection, optimized table extraction, and enhanced semantic similarity matching provides a comprehensive and automated solution for processing table data in engineering drawings. This method can effectively improve the efficiency and accuracy of table processing in large-scale engineering projects, facilitating document digitization and structured data extraction, and shows great potential for wide applications in multiple fields.
6.1. Key Achievements
Table Object Recognition: The application of YOLOv10 has remarkably enhanced table object detection. It shows strong target detection capabilities with a precision of 0.891, a recall of 0.899, an mAP50 of 0.922, and an mAP50-95 of 0.677. It performs particularly well in recognizing “engineering seals”, “tables”, and “equipment diagrams”. However, there is still room for improvement in detecting “diagram annotations” and “text”, indicating the need to refine the detection of smaller elements.
Table Structure Extraction: The improved LORE algorithm has significantly improved table structure extraction. When processing 200 engineering document PDFs, its accuracy rate reaches 91.61%, surpassing both the original LORE algorithm and Baidu’s ppstructure v2, and effectively handling large-sized images and complex table structures.
Text Recognition and Cell Correspondence: The combination of the improved LORE algorithm and RapidOCR enables more accurate text extraction and cell correspondence, especially for text spanning multiple cells. Through coordinate sorting and boundary judgment, it reduces issues like misalignment and overlapping text regions, but there is still a need to explore better ways to handle multi-line text in complex table layouts.
Semantic Similarity Matching for Equipment Names: The advanced semantic similarity calculation method based on BERT and the improved cuckoo search algorithm proposed in this paper has improved the accuracy of equipment name semantic matching to some extent. However, in the real world, equipment names often have complex semantic variations, such as industry terms, abbreviations, spelling variations, and context-dependent semantic shifts, which increase the difficulty of matching.
6.2. Future Directions
Optimizing Object Detection Models: It is necessary to enhance object detection models to improve the recognition accuracy of smaller elements like diagram annotations and fine-grained text components. Advanced techniques can be adopted for improvement.
Refining Text Extraction Mechanisms: Optimizing the extraction algorithms for multi-line and multi-cell text is crucial to better handle complex table structures and improve extraction accuracy.
Integrating Multiple Technologies: Combining domain adaptation models, equipment entity standardization methods based on knowledge graphs, or context-based self-supervised learning mechanisms can enhance the algorithm’s adaptability and robustness in complex scenarios.
Perfecting Semantic Matching Algorithms: Continuously optimizing semantic similarity matching algorithms and exploring new methods to capture the nuances of equipment naming can improve generalization across different documents and industries.
Boosting Processing Performance: Exploring the scalability and real-time processing capabilities of the algorithm in large-scale document repository deployments is essential to meet the application requirements of various industries.
Overall, this study lays a solid foundation for the automated processing of tables in engineering document management and provides practical value for industries relying on complex structured data extraction. The intelligent verification method streamlines the processing of engineering drawings and improves the efficiency and accuracy of data management in engineering projects. With the development of technology, the integration of advanced algorithms and methods will further promote the development of automated document processing systems and create conditions for future innovative applications.
Author Contributions
Conceptualization, Z.Z.; methodology, Z.Z.; software, Z.Z.; validation, Z.Z. and Y.H.; formal analysis, Z.Z.; investigation, Z.Z. and Y.H.; resources, Z.Z.; data curation, Z.Z.; writing—original draft preparation, Z.Z. and Y.H.; writing—review and editing, Y.H.; visualization, Z.Z. and Y.H. All authors have read and agreed to the published version of the manuscript.
Funding
Natural Science Research Start-up Foundation of Recruiting Talents of Nanjing University of Posts and Telecommunications (NY223210).
Data Availability Statement
The research data can be accessed at: https://github.com/wangwen-whu/wtw-dataset (accessed on 15 September 2021).
Conflicts of Interest
The authors declare no conflict of interest.
References
- The Robert Gordon University; Oxford Brookes University. New trends on digitisation of complex engineering drawings. Neural Comput. Appl. 2019, 31, 1695–1712. [Google Scholar] [CrossRef]
- Fernandes, J.; Xiao, B.; Simsek, M.; Kantarci, B.; Khan, S.; Alkheir, A.A. TableStrRec: Framework for table structure recognition in data sheet images. Int. J. Doc. Anal. Recognit. (IJDAR) 2024, 27, 127–145. [Google Scholar] [CrossRef]
- Trivedi, A.; Mukherjee, S.; Singh, R.K.; Agarwal, V.; Ramakrishnan, S.; Bhatt, H.S. Tabsniper: Towards accurate table detection & structure recognition for bank statements. arXiv 2024, arXiv:2412.12827. [Google Scholar]
- Hashmi, K.A.; Liwicki, M.; Stricker, D.; Afzal, M.A.; Afzal, M.Z. Current status and performance analysis of table recognition in document images with deep neural networks. IEEE Access 2021, 9, 87663–87685. [Google Scholar] [CrossRef]
- Jiyuan, S.; Chunqi, S. A review on table recognition based on deep learning. arXiv 2023, arXiv:2312.04808. [Google Scholar]
- Xing, H.; Gao, F.; Long, R.; Bu, J.; Zheng, Q.; Li, L.; Yu, Z. LORE: Logical location regression network for table structure recognition. In Proceedings of the AAAI Conference on Artificial Intelligence, Washington, DC, USA, 7–14 February 2023; Volume 37, pp. 2992–3000. [Google Scholar]
- Wang, A.; Chen, H.; Liu, L.; Chen, K.; Lin, Z.; Han, J.; Ding, G. Yolov10: Real-time end-to-end object detection. arXiv 2024, arXiv:2405.14458. [Google Scholar]
- Qiao, L.; Jiang, H.; Chen, Y.; Li, C.; Li, P.; Li, Z.; Niu, Y. Davarocr: A toolbox for ocr and multi-modal document understanding. In Proceedings of the 30th ACM International Conference on Multimedia, New York, NY, USA, 10–14 October 2022; pp. 7355–7358. [Google Scholar]
- Xu, S.; Wu, Z.; Zhao, H.; Shu, P.; Liu, Z.; Liao, W.; Li, X. Reasoning before comparison: LLM-enhanced semantic similarity metrics for domain specialized text analysis. arXiv 2024, arXiv:2402.11398. [Google Scholar]
- Simard, P.Y.; Steinkraus, D.; Platt, J.C. Best practices for convolutional neural networks applied to visual document analysis. In Proceedings of the Icdar, Edinburgh, UK, 6 August 2003; Volume 3. [Google Scholar]
- Graves, A.; Liwicki, M.; Fernández, S.; Bertolami, R.; Bunke, H.; Schmidhuber, J. A novel connectionist system for unconstrained handwriting recognition. IEEE Trans. Pattern Anal. Mach. Intell. 2008, 31, 855–868. [Google Scholar] [CrossRef]
- Xu, Y.; Li, M.; Cui, L.; Huang, S.; Wei, F.; Zhou, M. Layoutlm: Pre-training of text and layout for document image understanding. In Proceedings of the 26th ACM SIGKDD International Conference on Knowledge Discovery & Data Mining, Virtual Event, CA, USA, 6–10 July 2020; pp. 1192–1200. [Google Scholar]
- Baek, J.; Kim, G.; Lee, J.; Park, S.; Han, D.; Yun, S.; Lee, H. What is wrong with scene text recognition model comparisons? dataset and model analysis. In Proceedings of the IEEE/CVF International Conference on Computer Vision, Seoul, Republic of Korea, 27 October–2 November 2019; pp. 4715–4723. [Google Scholar]
- Li, C.; Bi, B.; Yan, M.; Wang, W.; Huang, S.; Huang, F.; Si, L. StructuralLM: Structural pre-training for form understanding. arXiv 2021, arXiv:2105.11210. [Google Scholar]
- Li, M.; Xu, Y.; Cui, L.; Huang, S.; Wei, F.; Li, Z.; Zhou, M. DocBank: A benchmark dataset for document layout analysis. arXiv 2020, arXiv:2006.01038. [Google Scholar]
- Appalaraju, S.; Jasani, B.; Kota, B.U.; Xie, Y.; Manmatha, R. Docformer: End-to-end transformer for document understanding. In Proceedings of the IEEE/CVF International Conference on Computer Vision, Montreal, QC, Canada, 10–17 October 2021; pp. 993–1003. [Google Scholar]
- Cui, L.; Xu, Y.; Lv, T.; Wei, F. Document ai: Benchmarks, models and applications. arXiv 2021, arXiv:2111.08609. [Google Scholar]
- Kieninger, T.; Dengel, A. A paper-to-HTML table converting system. In Proceedings of the Document Analysis Systems (DAS), Nagano, Japan, 4–6 November 1998; Volume 98, pp. 356–365. [Google Scholar]
- Yildiz, B.; Kaiser, K.; Miksch, S. pdf2table: A method to extract table information from pdf files. In Proceedings of the IICAI, Pune, India, 20–22 December 2005; Volume 2005, pp. 1773–1785. [Google Scholar]
- Koci, E.; Thiele, M.; Lehner, W.; Romero, O. Table recognition in spreadsheets via a graph representation. In Proceedings of the 2018 13th IAPR International Workshop on Document Analysis Systems (DAS), Vienna, Austria, 24–27 April 2018; IEEE: New York, NY, USA, 2018; pp. 139–144. [Google Scholar]
- Huang, Y.; Yan, Q.; Li, Y.; Chen, Y.; Wang, X.; Gao, L.; Tang, Z. A YOLO-based table detection method. In Proceedings of the 2019 International Conference on Document Analysis and Recognition (ICDAR), Sydney, Australia, 20–25 September 2019; IEEE: New York, NY, USA, 2019; pp. 813–818. [Google Scholar]
- Li, Y.; Gao, L.; Tang, Z.; Yan, Q.; Huang, Y. A GAN-based feature generator for table detection. In Proceedings of the 2019 International Conference on Document Analysis and Recognition (ICDAR), Sydney, Australia, 20–25 September 2019; IEEE: New York, NY, USA, 2019; pp. 763–768. [Google Scholar]
- Melinda, L.; Bhagvati, C. Parameter-free table detection method. In Proceedings of the 2019 International Conference on Document Analysis and Recognition (ICDAR), Sydney, Australia, 20–25 September 2019; IEEE: New York, NY, USA, 2019; pp. 454–460. [Google Scholar]
- Koci, E.; Thiele, M.; Romero, O.; Lehner, W. A genetic-based search for adaptive table recognition in spreadsheets. In Proceedings of the 2019 International Conference on Document Analysis and Recognition (ICDAR), Sydney, Australia, 20–25 September 2019; IEEE: New York, NY, USA, 2019; pp. 1274–1279. [Google Scholar]
- Schreiber, S.; Agne, S.; Wolf, I.; Dengel, A.; Ahmed, S. Deepdesrt: Deep learning for detection and structure recognition of tables in document images. In Proceedings of the 2017 14th IAPR International Conference on Document Analysis and Recognition (ICDAR), Kyoto, Japan, 13–15 November 2017; IEEE: New York, NY, USA, 2017; Volume 1, pp. 1162–1167. [Google Scholar]
- Shigarov, A.; Mikhailov, A.; Altaev, A. Configurable table structure recognition in untagged PDF documents. In Proceedings of the 2016 ACM Symposium on Document Engineering, Vienna, Austria, 13–16 September 2016; pp. 119–122. [Google Scholar]
- Siddiqui, S.A.; Khan, P.I.; Dengel, A.; Ahmed, S. Rethinking semantic segmentation for table structure recognition in documents. In Proceedings of the 2019 International Conference on Document Analysis and Recognition (ICDAR), Sydney, Australia, 20–25 September 2019; IEEE: New York, NY, USA, 2019; pp. 1397–1402. [Google Scholar]
- Tensmeyer, C.; Morariu, V.I.; Price, B.; Cohen, S.; Martinez, T. Deep splitting and merging for table structure decomposition. In Proceedings of the 2019 International Conference on Document Analysis and Recognition (ICDAR), Sydney, Australia, 20–25 September 2019; IEEE: New York, NY, USA, 2019; pp. 114–121. [Google Scholar]
- Khan, S.A.; Khalid SM, D.; Shahzad, M.A.; Shafait, F. Table structure extraction with bi-directional gated recurrent unit networks. In Proceedings of the 2019 International Conference on Document Analysis and Recognition (ICDAR), Sydney, Australia, 20–25 September 2019; IEEE: New York, NY, USA, 2019; pp. 1366–1371. [Google Scholar]
- Lin, W.; Sun, Z.; Ma, C.; Li, M.; Wang, J.; Sun, L.; Huo, Q. Tsrformer: Table structure recognition with transformers. In Proceedings of the 30th ACM International Conference on Multimedia, Lisboa, Portugal, 10–14 October 2022; pp. 6473–6482. [Google Scholar]
- Chi, Z.; Huang, H.; Xu, H.D.; Yu, H.; Yin, W.; Mao, X.L. Complicated table structure recognition. arXv 2019, arXiv:1908.04729. [Google Scholar]
- Gao, L.; Huang, Y.; Déjean, H.; Meunier, J.L.; Yan, Q.; Fang, Y.; Lang, E. ICDAR 2019 competition on table detection and recognition (cTDaR). In Proceedings of the 2019 International Conference on Document Analysis and Recognition (ICDAR), Sydney, Australia, 20–25 September 2019; IEEE: New York, NY, USA, 2019; pp. 1510–1515. [Google Scholar]
- Desai, H.; Kayal, P.; Singh, M. TabLeX: A benchmark dataset for structure and content information extraction from scientific tables. In Proceedings of the Document Analysis and Recognition–ICDAR 2021: 16th International Conference, Lausanne, Switzerland, 5–10 September 2021; Proceedings, Part II 16. Springer International Publishing: Cham, Switzerland, 2021; pp. 554–569. [Google Scholar]
- Devlin, J. Bert: Pre-training of deep bidirectional transformers for language understanding. arXiv 2018, arXiv:1810.04805. [Google Scholar]
- Vaswani, A. Attention is all you need. In Advances in Neural Information Processing Systems; The MIT Press: Cambridge, MA, USA, 2017. [Google Scholar]
- Yu, E.; Wang, J.; Qiao, X.; Qi, J.; Li, Z.; Lin, H.; Xu, B. DUTIR938 at SemEval-2024 Task 4: Semi-Supervised Learning and Model Ensemble for Persuasion Techniques Detection in Memes. In Proceedings of the 18th International Workshop on Semantic Evaluation (SemEval-2024), Mexico City, Mexico, 16–21 June 2024; pp. 642–648. [Google Scholar]
- Yang, X.S.; Deb, S. Cuckoo search via Lévy flights. In Proceedings of the 2009 World Congress on Nature & Biologically Inspired Computing (NaBIC), Coimbatore, India, 9–11 December 2009; IEEE: New York, NY, USA, 2009; pp. 210–214. [Google Scholar]
- Yang, X.S.; Deb, S. Cuckoo search: Recent advances and applications. Neural Comput. Appl. 2014, 24, 169–174. [Google Scholar] [CrossRef]
- Zhang, Z.; Xu, X. A study of the allocation of energy consumption permits among the regions of China based on clustering analysis and cuckoo search. Environ. Sci. Pollut. Res. 2021, 28, 37244–37261. [Google Scholar] [CrossRef] [PubMed]
- Zhang, Z. An improved BM25 algorithm for clinical decision support in Precision Medicine based on co-word analysis and Cuckoo Search. BMC Med. Inform. Decis. Mak. 2021, 21, 81. [Google Scholar] [CrossRef] [PubMed]
- Zhang, Z.; Yang, J. A discrete cuckoo search algorithm for traveling salesman problem and its application in cutting path optimization. Comput. Ind. Eng. 2022, 169, 108157. [Google Scholar] [CrossRef]
- Li, Y.; Zhao, Y.; Liu, J. Dimension by dimension dynamic sine cosine algorithm for global optimization problems. Appl. Soft Comput. 2021, 98, 106933. [Google Scholar] [CrossRef]
- Pavlyukevich, I. Cooling down Lévy flights. J. Phys. A Math. Theor. 2007, 40, 12299. [Google Scholar] [CrossRef]
- Pavlyukevich, I. Lévy flights, non-local search and simulated annealing. J. Comput. Phys. 2007, 226, 1830–1844. [Google Scholar] [CrossRef]
- Li, C.; Guo, R.; Zhou, J.; An, M.; Du, Y.; Zhu, L.; Yu, D. Pp-structurev2: A stronger document analysis system. arXiv 2022, arXiv:2210.05391. [Google Scholar]
- Zhu, Z.; Li, W.; Yu, C.; Li, W.; Jiao, L. TSRDet: A Table Structure Recognition Method Based on Row-Column Detection. Electronics 2024, 13, 4263. [Google Scholar] [CrossRef]
Disclaimer/Publisher’s Note: The statements, opinions and data contained in all publications are solely those of the individual author(s) and contributor(s) and not of MDPI and/or the editor(s). MDPI and/or the editor(s) disclaim responsibility for any injury to people or property resulting from any ideas, methods, instructions or products referred to in the content. |
© 2025 by the authors. Licensee MDPI, Basel, Switzerland. This article is an open access article distributed under the terms and conditions of the Creative Commons Attribution (CC BY) license (https://creativecommons.org/licenses/by/4.0/).