Article

Electrical Response of Photovoltaic Power Cells to Cosmic Radiation in the Stratosphere

1
Space Research Centre of Polish Academy of Sciences, Division of Plasma Physics, ul. Bartycka 18A, 00-716 Warsaw, Poland
2
Warsaw University of Technology, Students’ Space Association WUT, ul. Nowowiejska 21/25 p. 0.12, 00-665 Warsaw, Poland
3
École Supérieure d’Aéronautique, 10 Av. Edouard Belin BP 54032, 31055 Toulouse, France
*
Author to whom correspondence should be addressed.
Electronics 2025, 14(5), 991; https://doi.org/10.3390/electronics14050991
Submission received: 6 February 2025 / Revised: 24 February 2025 / Accepted: 26 February 2025 / Published: 28 February 2025
(This article belongs to the Special Issue Compatibility, Power Electronics and Power Engineering)

Abstract

:
This article describes the CURiE (Composites and photovoltaics Undergoing Radiation Exposure) stratospheric experiment, which was designed and built in 2024 for the BEXUS 35 stratospheric flight campaign in Sweden. One of the main objectives of the experiment was to investigate the electric currents generated in polycrystalline photovoltaic panels, shielded from visible light, and exposed in stratospheric conditions to cosmic radiation. The experiment’s registered data correlate with the X-ray fluxes registered by the GOES satellites, which are presented with the inclusion of the atmosphere’s attenuation. A single voltage-generating event may have been linked to the impact of a high-energy proton. The article forms a basis for the next research with the exposed photovoltaics and the next generation of experiments involving novel radiation-proof panels.

1. Introduction

The stratosphere—the layer of the Earth’s atmosphere situated between 12 and 60 km of altitude—has been a subject of intense exploration using balloons and rockets for nearly 100 years. While rockets enable lifting off to the higher parts of this layer, in proximity to the ionosphere, balloons (or aerostats in general) provide low-acceleration float at altitudes of usually 20–30 km. The relatively high accessibility and ability of balloons to reach atmospheric altitudes with already significantly lower air pressure and temperature (compared to the troposphere) has allowed numerous near-space research to be carried out on board stratospheric balloon gondolas [1,2]. This research includes investigating cosmic radiation, in which high-tropospheric and stratospheric altitudes already become detectable and significant. The increase in altitude allows the registration of more compounds in the radiation background, including gamma radiation, X-rays, protons, electrons, neutrons, and ultraviolet [3,4], with heavier particles reported to be largely present above the altitudes of 36–37 km and the near-space ultraviolet reaching a maximum at 42–43 km [5]. Lower stratospheric altitudes, although still situated below a significant amount of air attenuating the radiation [1], remain an attractive environment for the detection of Sun-activity-correlated cosmic radiation [3], both for the investigation of the radiation itself and for the potential investigation of the influence of the different compounds of this radiation on various types of electronic devices.
The influence of cosmic radiation on photovoltaic panels—semiconductor junctions—has been a subject of intense orbital research since the time of the Telstar satellite operations [6], with numerous studies being conducted following experimental campaigns delivering further data on the occurrence and severity of radiation-induced damage on photovoltaics of evolving designs [7,8,9,10]. Radiation models used in estimating the outcomes of these experiments can be employed up to the altitudes of 350 km [11], with only a part of the radiation present at stratospheric altitudes. For deep-space applications, the terrestrial space environment as a verification and testing environment is only partially suitable, as other larger planets, e.g., Jupiter, are significantly more harmful in terms of energies, activities, and doses imposed by the radiation around them [12,13], which demands methods of simulation and extrapolation of experimental terrestrial data to be developed and employed.
As the stratospheric polar environment, close to the auroral zone, can be considered as potentially more attractive in terms of dose and activity of the intercepted cosmic radiation [3,10], stratospheric balloon missions—composed similarly to dedicated test spacecraft in Low Earth Orbit [9]—testing different configurations of photovoltaic panels present a viable way of delivering experimental data on the interactions of the cosmic radiation with the semiconductor structures. Despite the overall lower levels of radiation at the targeted altitudes between 27 and 33 km [4] (taking into consideration the atmospheric model between 27 and 300 km [14], the thickness of the air layer, expressed in material’s surface density, shall reach 163 kg/m2), the access to cosmic radiation allows the basic characteristics of the panel response to irradiation and its degeneration to be detected and measured. The response and degeneration, however, differ with the different compounds of cosmic radiation, e.g., electrons, protons, and X-rays [15].
The electrons are able to interact with solid matter by colliding with its atoms or by non-collisional electrostatic (or coulombic) interaction [16,17], with the probability of the actual electron–atom collision estimated at the level of 1 collision every 100,000 incoming electrons [18]. Lower-energy electrons are more efficient in the creation of local ionization regions within the material [18]; however, the NIEL (Non-Ionizing Energy Loss) increases in proportion to the electron energy [19]. Still, it is considered that only the particles of lower energies are able to transfer the majority of their energy in an effective way to the intercepting matter [10]. The attenuation of the electron flux by thin aluminium layers—foils (e.g., 0.042 g/cm2)—remains significant (up to half of the flux for thin foils [20]), which is of high importance for the shielding of the experiment components; however, with the linear increase in the shield’s thickness, the increase in attenuation is non-linear [19]. For space applications, shielding with aluminium layers of thickness in the order of 10−3 m is considered sufficient to protect the payloads from damage from high-energy electrons [10]. As in a semiconductor detector, the electrons interacting with the semiconductor junction create electron–hole pairs, which generate a measurable DC current. High electron fluxes may damage the junction; for space applications and photovoltaic panels, a recurring number of 1013 ecm2 of 1 MeV of energy is reported to cause significant damage [7,8,21,22,23,24,25], leading to the decrease in performance notices in the changes in, e.g., the current–voltage characteristics [21,23], anomalous increase in the short-circuit current [26], or a slight drop in responsiveness in the visible light spectrum [27]. In the near-Earth space environment, the electrons trapped in the radiation belts are responsible for the cumulative radiation damage of the spacecraft photovoltaic panels, with the full duration of the extreme space weather electron episode estimated as 1 day [28]. Deeper in the Solar System, the Jovian environment is considered the harshest in radiation doses, with most of the dose generated by the trapped electrons [13].
The protons are less dynamic than electrons [11]; in Low Earth Orbit, they significantly contribute to the radiation damage and absorbed doses [29], as well as during the spacecraft’s passage through the proton belt [30] (for the proton energies between 1 and 20 MeV). Similarly to electrons, protons of lower energies and lower fluxes tend to dissipate more energy in interaction with the shielding material than the protons of higher energies [30,31,32]. For lower energies, the occurrence rate of damage in semiconductor junctions is practically inversely proportional to the proton energy [6]. About 50% of the damage and degradation is estimated to be caused by the protons of energy range between 1 and 10 MeV, with 15% coming from the energies below 100 keV [32]; for the glass-covered photovoltaic cells, the protons of energies above 6 MeV do not experience a full/total attenuation but are still able to deposit a substantial amount of their energy to cause measurable damage [33]. For some specific energy cases, the increase in the thickness of the shielding may slightly increase the radiation dose; as reported by Rosenzweig (1974), for the proton energy range from 12 to 40 MeV, the increase in the shielding thickness to 0.05 g/cm2 may have an opposite effect on the dose reduction [6]. For the proton energies lying in the keV range—specifically between 50 and 300 keV—the damage to the photovoltaic panel’s transparent multilayer coating is reported as negligible [34]. In the structure of the panel, three different regions of the interaction of the protons with the semiconductors can be distinguished: minor damage along the path of the proton, heavy damage by the end of the proton’s path, and a region of high concentration of defects (<1 μm of thickness) at the very end of the proton penetration [27]. For non-shielded semiconductor junctions, the experimentally measured proton penetration depths were 0.41 μm for 40 keV and 1.51 μm for 180 keV [35]; the thicker the photovoltaic panel and the lower the proton energy, the more energy is deposited in it from the proton flux; the dissipation is practically uniform over the panel’s surface [36,37,38]. The radiation damage to photovoltaic panels is reported as non-constant in time, i.e., after the irradiation. The panel is subjected to a minor radiation degradation recovery, which was also reported for panel samples at room temperatures (amorphous silicon cells) [39]. The reported >1-MeV proton fluxes causing significant/measurable damage to the photovoltaic cells are, contrary to the electron case, different for different types of cells, e.g., 109 p+/cm2 for gallium-indium-arsenide triple-junction cells [24], 1012 p+/cm2 for early silicon photovoltaic panels [8], 1013 p+/cm2 for perovskite [23] and nc-Si:H [36] (however the latter is described as more susceptible to higher fluxes), or 1014 p+/cm2 for bulk silicon [40].
The non-corpuscular compound of cosmic radiation—the X-rays, i.e., electromagnetic waves of wavelengths between 2 × 10⁻⁹ and 0.7 × 10⁻¹¹ m [41]—are heavily attenuated by air layers, with the possibility to significantly vary the attenuation with only slight increase in the air pressure [42]. The Sun-originating X-rays can be registered even on the surface of the Earth [15]. The rays’ attenuation is essentially similar to the attenuation typical for beta radiation, with the possibility to measure, e.g., the thicknesses of thin screens (<1 g/cm2) with the employment of this property [43]. Longer electromagnetic wavelengths, belonging to the terahertz spectrum, below the X-rays, ultraviolet and infrared, are reported to not be significantly attenuated by the photovoltaic cell’s thin glass covers [44]; on the contrary, the X-rays from the energy range between 5 and 25 keV are attenuated effectively by such covers [45], with higher energies expected to be more penetrating. The photovoltaic panels’ sensitivity to X-rays has been reported, e.g., by Li et al. (2021) for perovskite cells (organic–inorganic hybrid ferroelectric semiconductors) [23] and radio-photovoltaic batteries [46].
The electron and proton fluxes, as well as the X-ray power, are constantly monitored in the Earth’s geostationary orbit by, e.g., the GEOS satellites, which produce publicly available data sets [28,46].
The stratospheric conditions, with their low temperatures (reaching around −60 °C), are, however, favourable for the photovoltaic cells in terms of reducing the forward voltage of the semiconductor junction (dropping linearly at the approximate rate of 2 mV per 1 °C [47]) and increasing the voltage at the maximum power point, resulting in augmented power outputs of the cells [48].
Given the complexity of the radiation types and the effects they cause upon their interaction with photovoltaic/semiconductor structures, laboratory tests are only partially able to simulate the electrical response and accumulated damage that directly affects the cells’ operation. As the cosmic radiation in the lower stratospheric altitudes is already significant, especially in the polar region, in order to investigate the electrical output and the radiation damage of the polycrystalline silicon photovoltaic panels shielded from visible light (in dark conditions, to filter out its influence, yielding the cosmic radiation effects only), a composite photovoltaic experiment, CURiE (Composites and photovoltaics Undergoing Radiation Exposure), was designed, built, and flown in the BEXUS 35 (BX35) stratospheric balloon mission from the Esrange Space Center near Kiruna, Sweden, on 2 October 2024.

2. Experiment Description

BEXUS (Balloon Experiments for University Students) missions, belonging to the REXUS/BEXUS programme (Rocket/Balloon Experiments for University Students) under the bilateral agreement between DLR (Deutsches Zentrum für Luft- und Raumfahrt) and SNSA (Swedish National Space Agency), in cooperation with ESA (European Space Agency), SSC (Swedish Space Corporation), and ZARM (Zentrum für angewandte Raumfahrt-technologie und Mikro-gravitation) [49], typically consist of separate scientific modules (experiments) designed and built by different research groups. The modules are affixed to standard large payload gondolas (supplied by SSC: M-Egon—‘medium-E-type gondola’, from 2007 to 2023, ESCARGO—‘ESrange CARGO gondola’, since 2024) lifted up to lower stratospheric altitudes by foil/superpressure balloons manufactured by the Zodiac company. The payloads are supplied with electricity from the payload gondola’s batteries and remain in constant contact (except during the re-entry phase) with the ground station, set up in Esrange, via the wideband radio E-Link system. The navigation of the entire mission is carried out by a smaller gondola affixed in the flight train high above the payload, below the parachute [50].
The CURiE experiment, pictured in Figure 1, belonging to the long lineage of large stratospheric experiments designed and built by the Students’ Space Association WUT’s Balloon Division, was elected for the BEXUS 35 balloon mission in December 2023 and successfully flown ten months later, delivering data on the after-irradiation behaviour of both of its basic parts: the shielded photovoltaic panels and the various types of composite samples [51]. The BX35 flight also marked the very first flight of the SSC’s new ESCARGO payload gondola.

2.1. Mechanical Design

As the experiment comprised two distinct parts, its design had to be more complex to address the specific requirements of each subsystem to ensure seamless integration. Both parts utilized a shared data acquisition system that measured ionizing radiation, UV radiation, and atmospheric parameters such as temperature and humidity throughout the flight. The experiment consisted of multiple subsystems, each fulfilling a critical role [52].
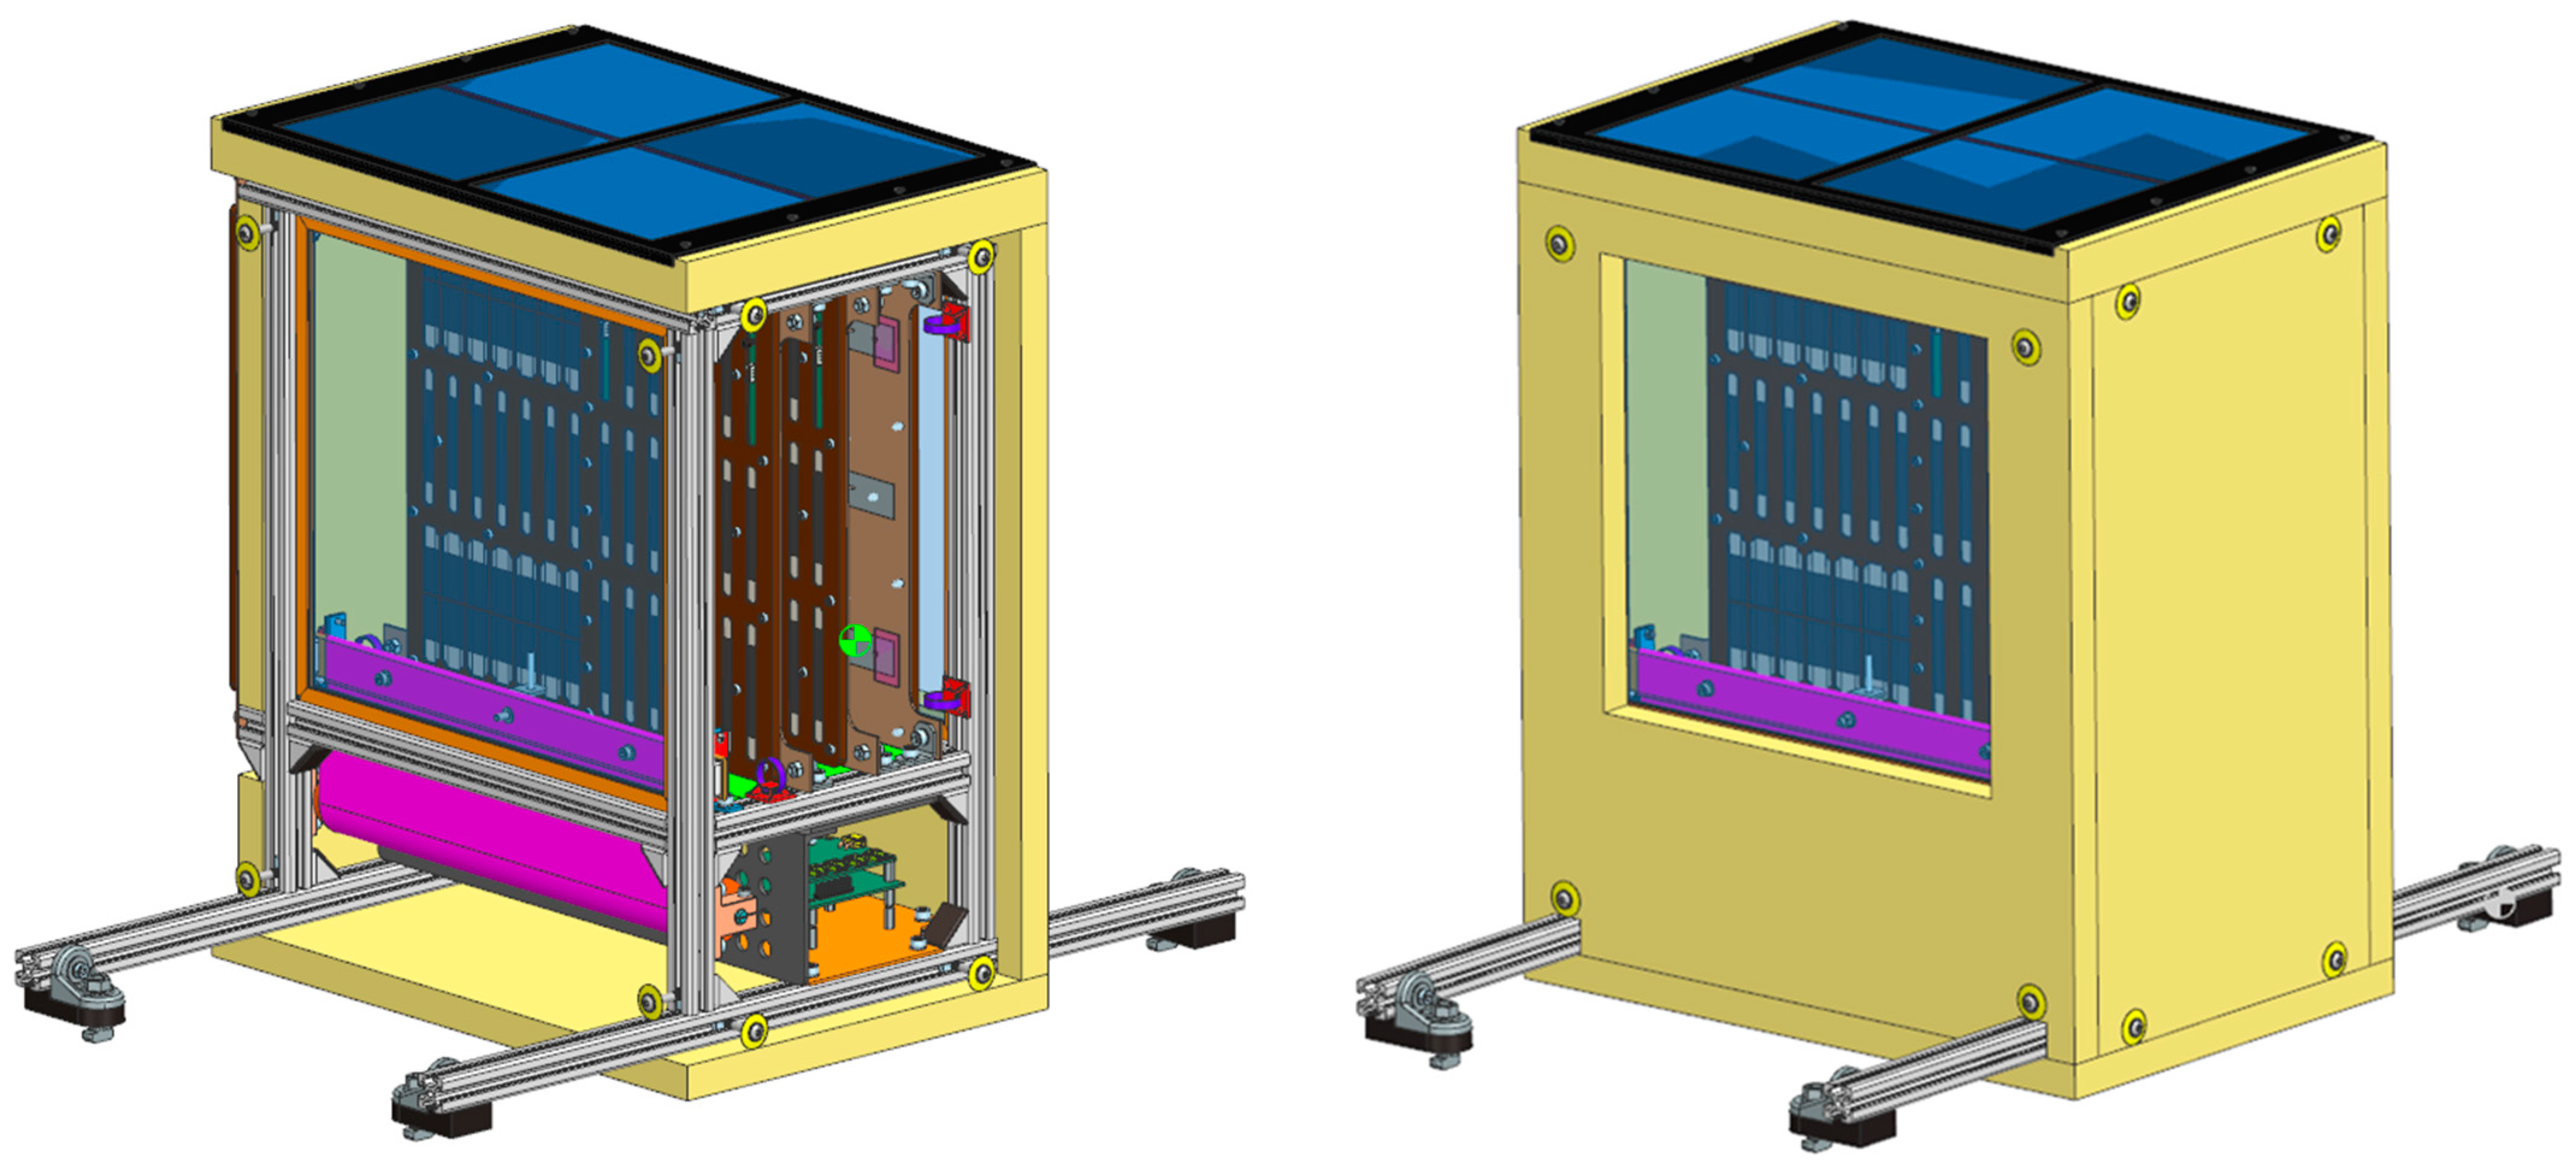
The device frame was designed using aluminium construction profiles to ensure a lightweight yet robust design. The entire structure was mounted onto the BEXUS gondola using L-shape connectors attached to the T-rails, providing stability and compatibility with the platform. The final design, presented in Figure 2, resulted in a total mass of 10.5 kg and dimensions of 0.49 × 0.4 × 0.27 m.
Composite samples were mounted on specially designed shelves, each consisting of 3D-printed plates and a glass–epoxy laminate plate secured together. A shutter mechanism was required to uncover some of the samples during flight, which was based on a window-blind system due to its simplicity, reliability, and ease of implementation.
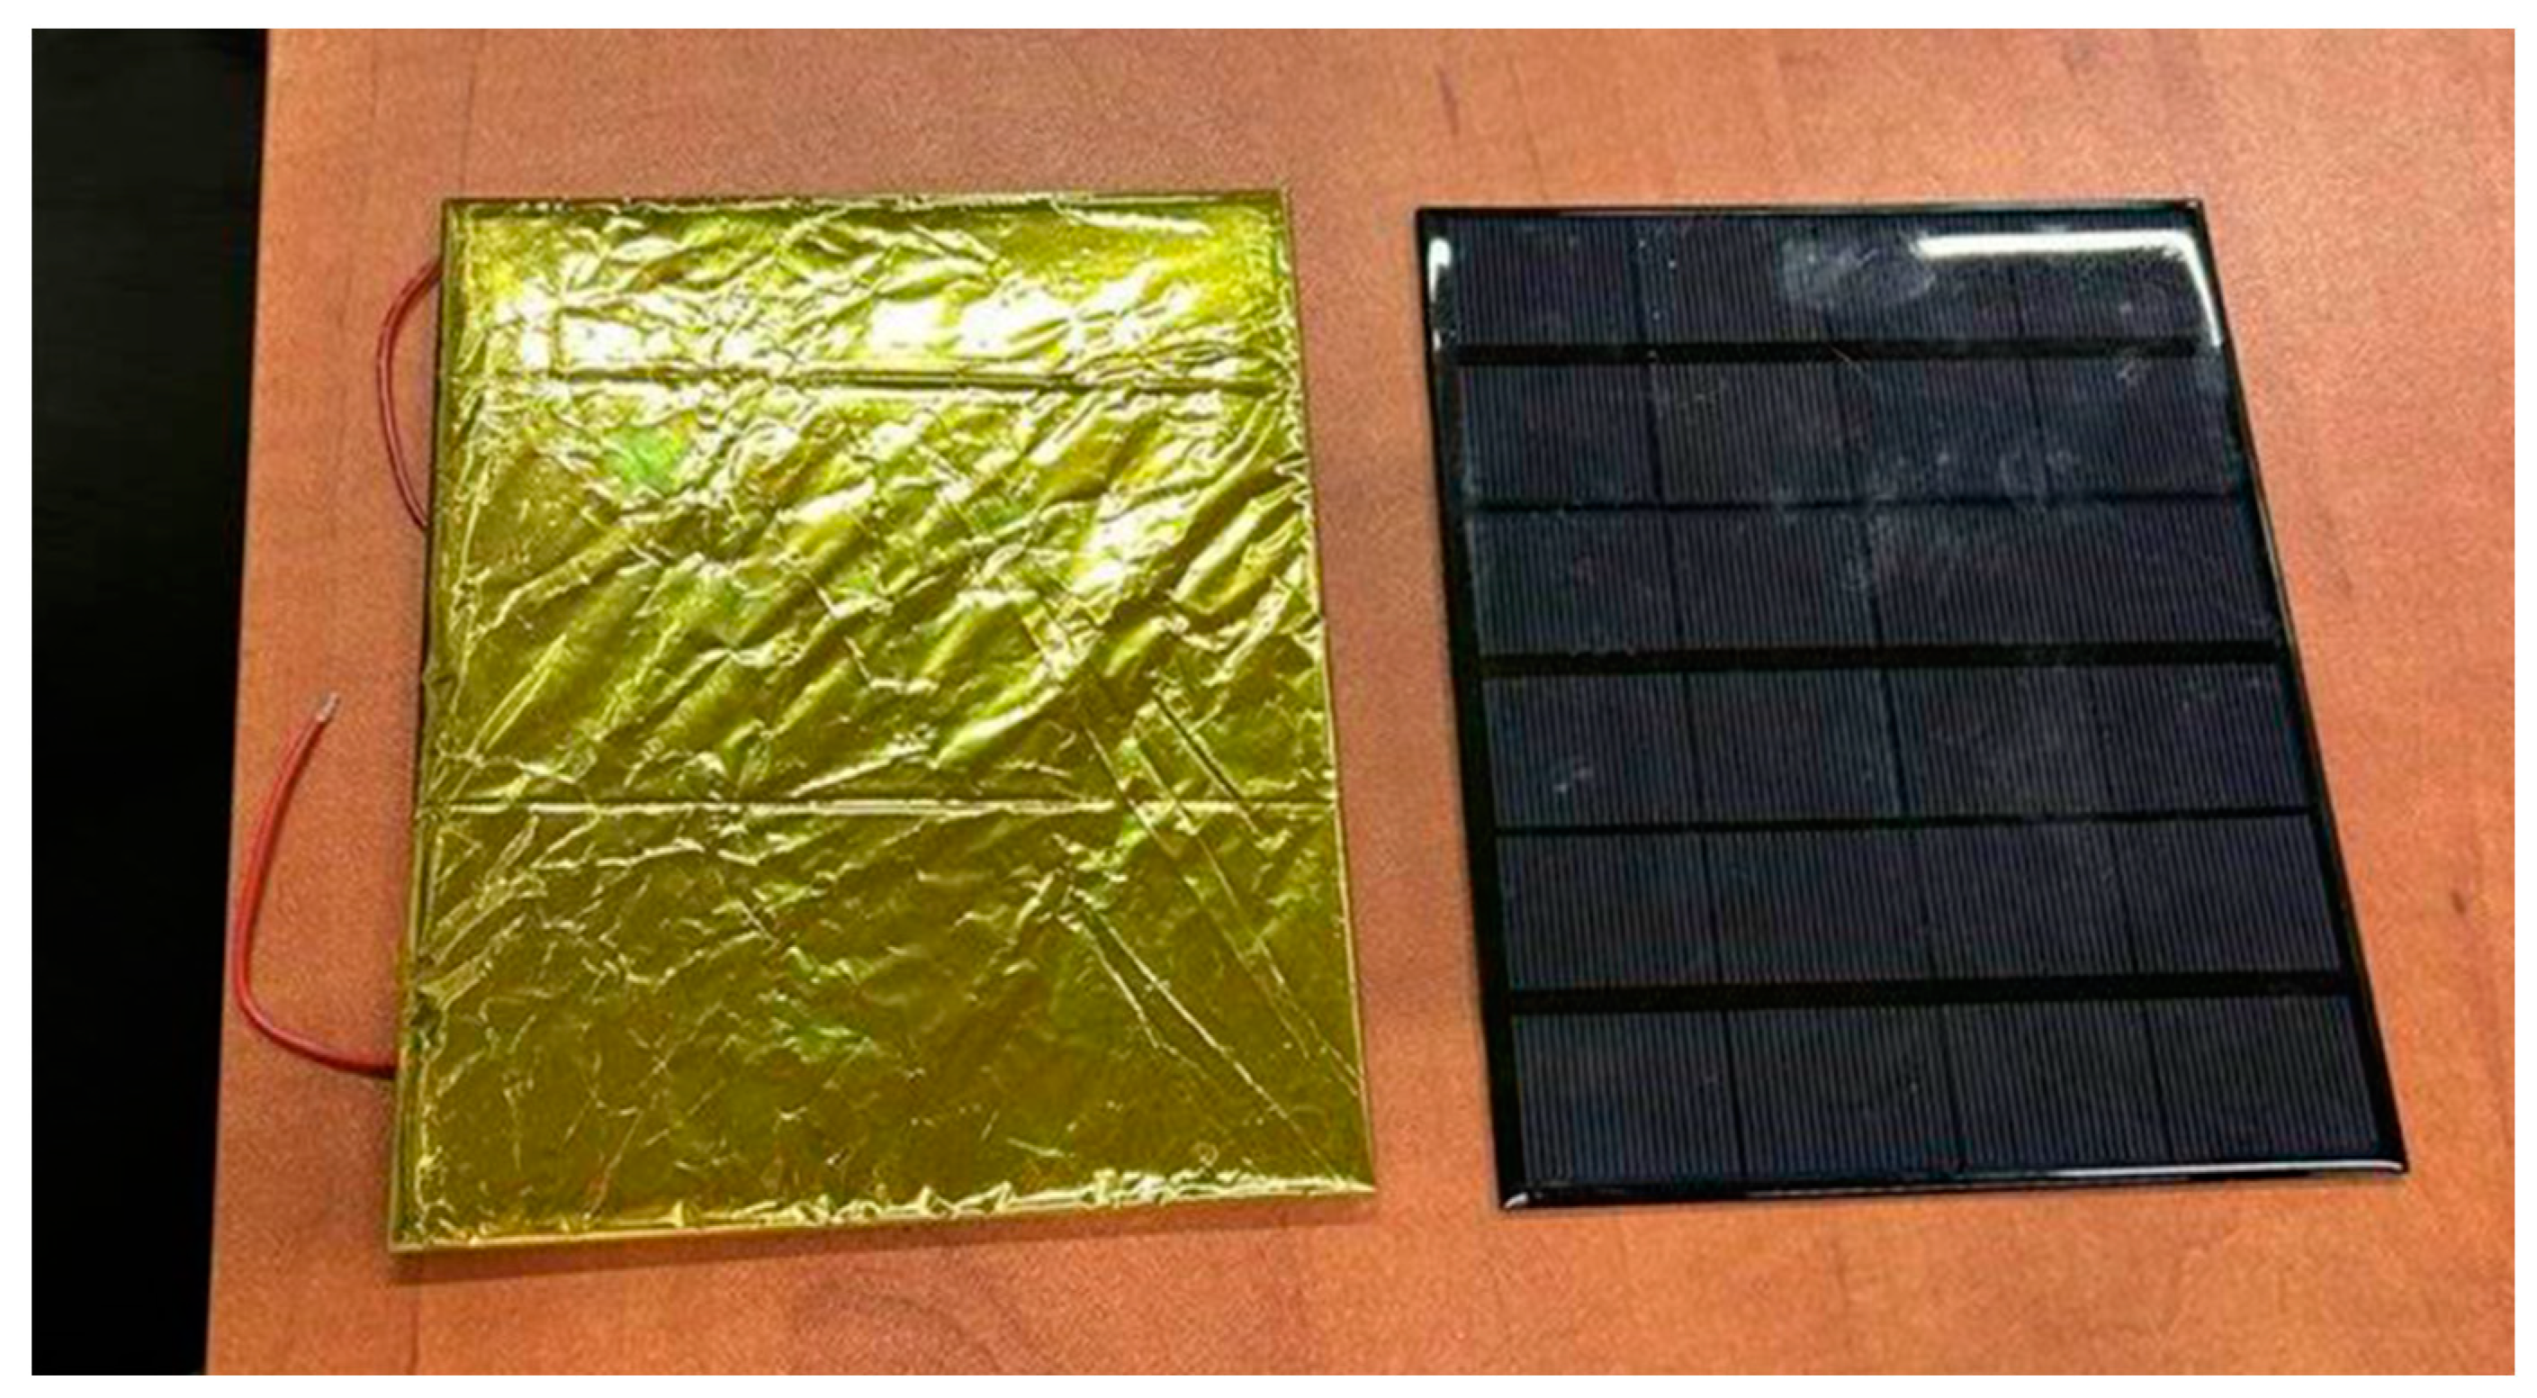
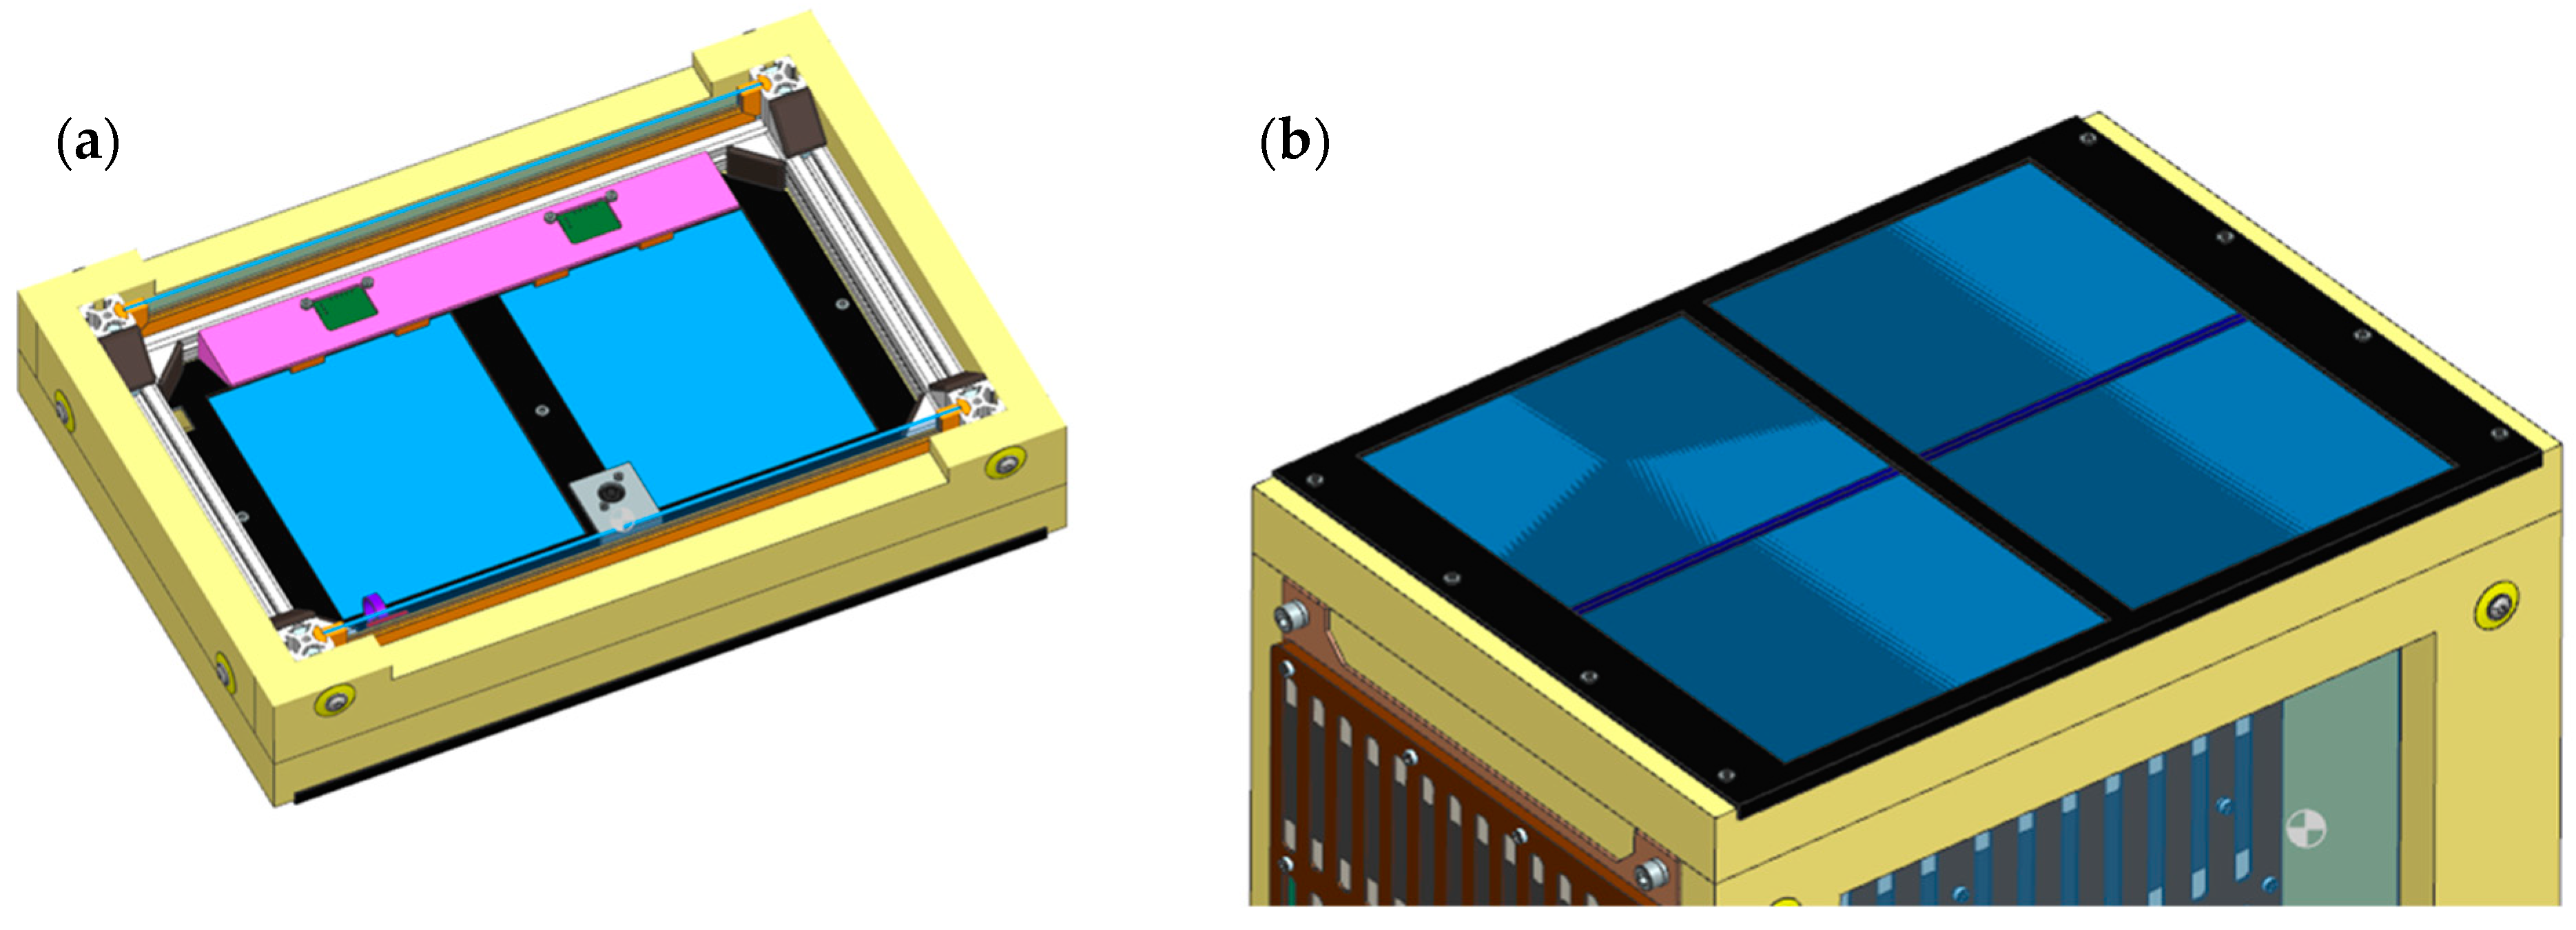
The photovoltaic panel subsystem included six iSNK polycrystalline panels (max. power output: 3.5 W per panel; max. voltage: 6 V per panel): four positioned on top of the structure and two inside (all in parallel groups), ensuring comparative measurements under different thermal and shielding conditions. The panels were embedded in Styrofoam insulation grooves and secured using 3D-printed nylon frames fastened with Styrofoam screws and adhesive. Each panel was coated with a 0.015 mm aluminium layer to block visible sunlight while allowing exposure to ionizing radiation (as seen in Figure 3). The aluminium-coated PV cells were further protected by a thin transparent cover to prevent mechanical damage. To ensure structural integrity and stable mounting, the electrical connections of the panels were routed through dedicated channels within the insulation, minimizing thermal and mechanical stress on the wiring. The mounting of the panels in the final model of the experiment is shown in Figure 4.
All subsystems were connected through an electronics module responsible for data acquisition and processing. The electronics were mounted on an aluminium plate at the bottom of the experiment, with custom adapters allowing for quick and secure installation. Geiger–Müller (GM) counters were also attached to this plate to ensure accurate ionizing radiation measurements. Dark current measurement boards were placed near the photovoltaic panels using polyethylene terephthalate (PET) mounts to maintain precise readings.

2.2. Thermal Design

Thermal insulation played a crucial role in the experiment’s thermal design. Styrofoam insulation panels covered the structure, minimizing temperature fluctuations and the impact of external temperature during flight. Additionally, careful component placement and shielding ensured that sensitive electronics—including the photovoltaic panels—remained within optimal operating conditions (extended industrial range).
The main objective of the thermal design for the CURIE experiment was to ensure the desired temperatures of the experiment components, especially electronic equipment, as they are very temperature-sensitive. According to the User Manual data [50], altitude during the float phase may vary between 25 and 30 km, and the external air temperature during this phase can drop even to −60 °C.
The final thermal design of the experiment included the following:
  • Thermal insulation made from 2 cm-thick layers of Styrofoam on each wall (except the glass wall) and one 3 cm-thick layer on the top of the experiment;
  • Heaters applied to composite samples and composite boards—3 heaters per board (0.56 W each, total 5 W power), shown in Figure 5;
  • A high-emissivity black coating was applied to composite boards’ surfaces, which are shielded from the Sun, to maximise heat flux and equalise temperatures between all composites and composite boards;
  • High-reflectance white paint coating was applied to the two surfaces of the composite boards, which are illuminated by the Sun, to reflect most of the incident solar radiation and lower the composites’ temperature;
  • Two thermal blankets covering the experiment: one permanently attached to the experiment (on the external side of insulation panels) and the second one covering the experiment on the launch pad and removed as late as possible, so around 30–45 min before launch. For this purpose, isothermal emergency blankets, popularly known as NRC foil or space blankets, were used.
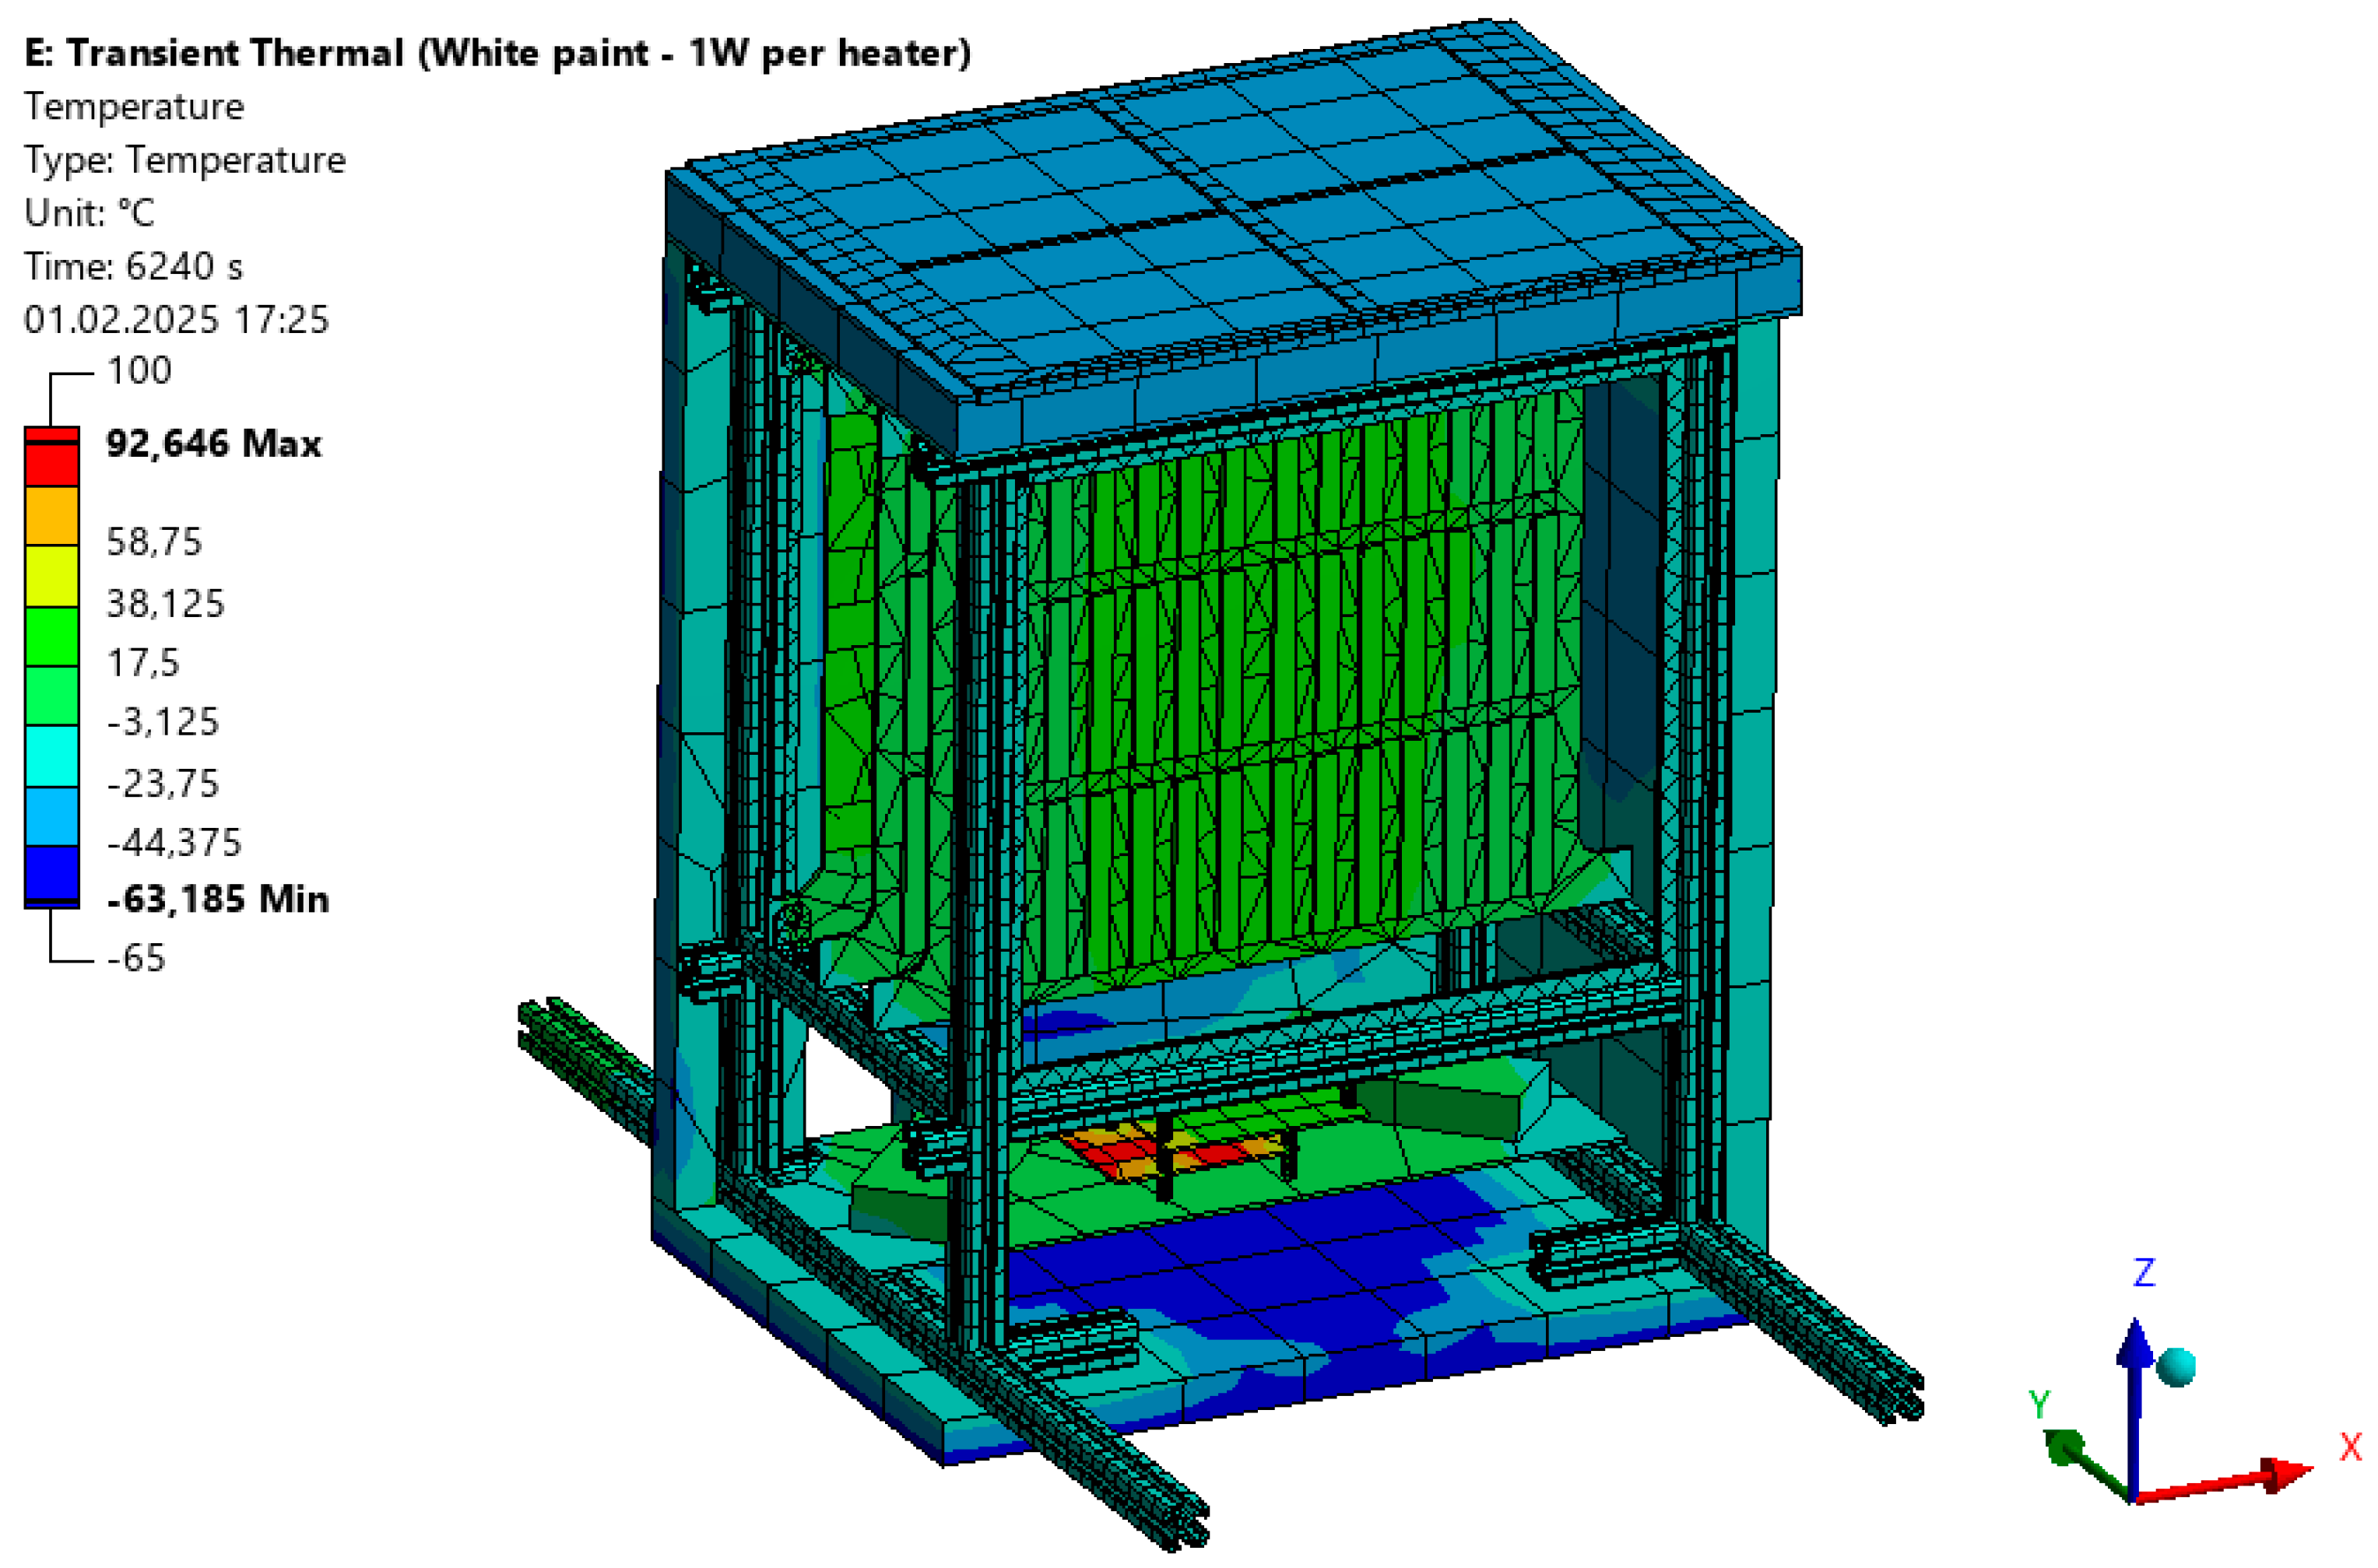
The thermal design of the CURIE experiment was verified through simulations in Ansys Workbench software (version 2024r2) and then tested in a thermal vacuum chamber in thermal conditions expected during the float phase. Thermal data from the flight could not be obtained, as the temperature and humidity sensors failed during the launch.
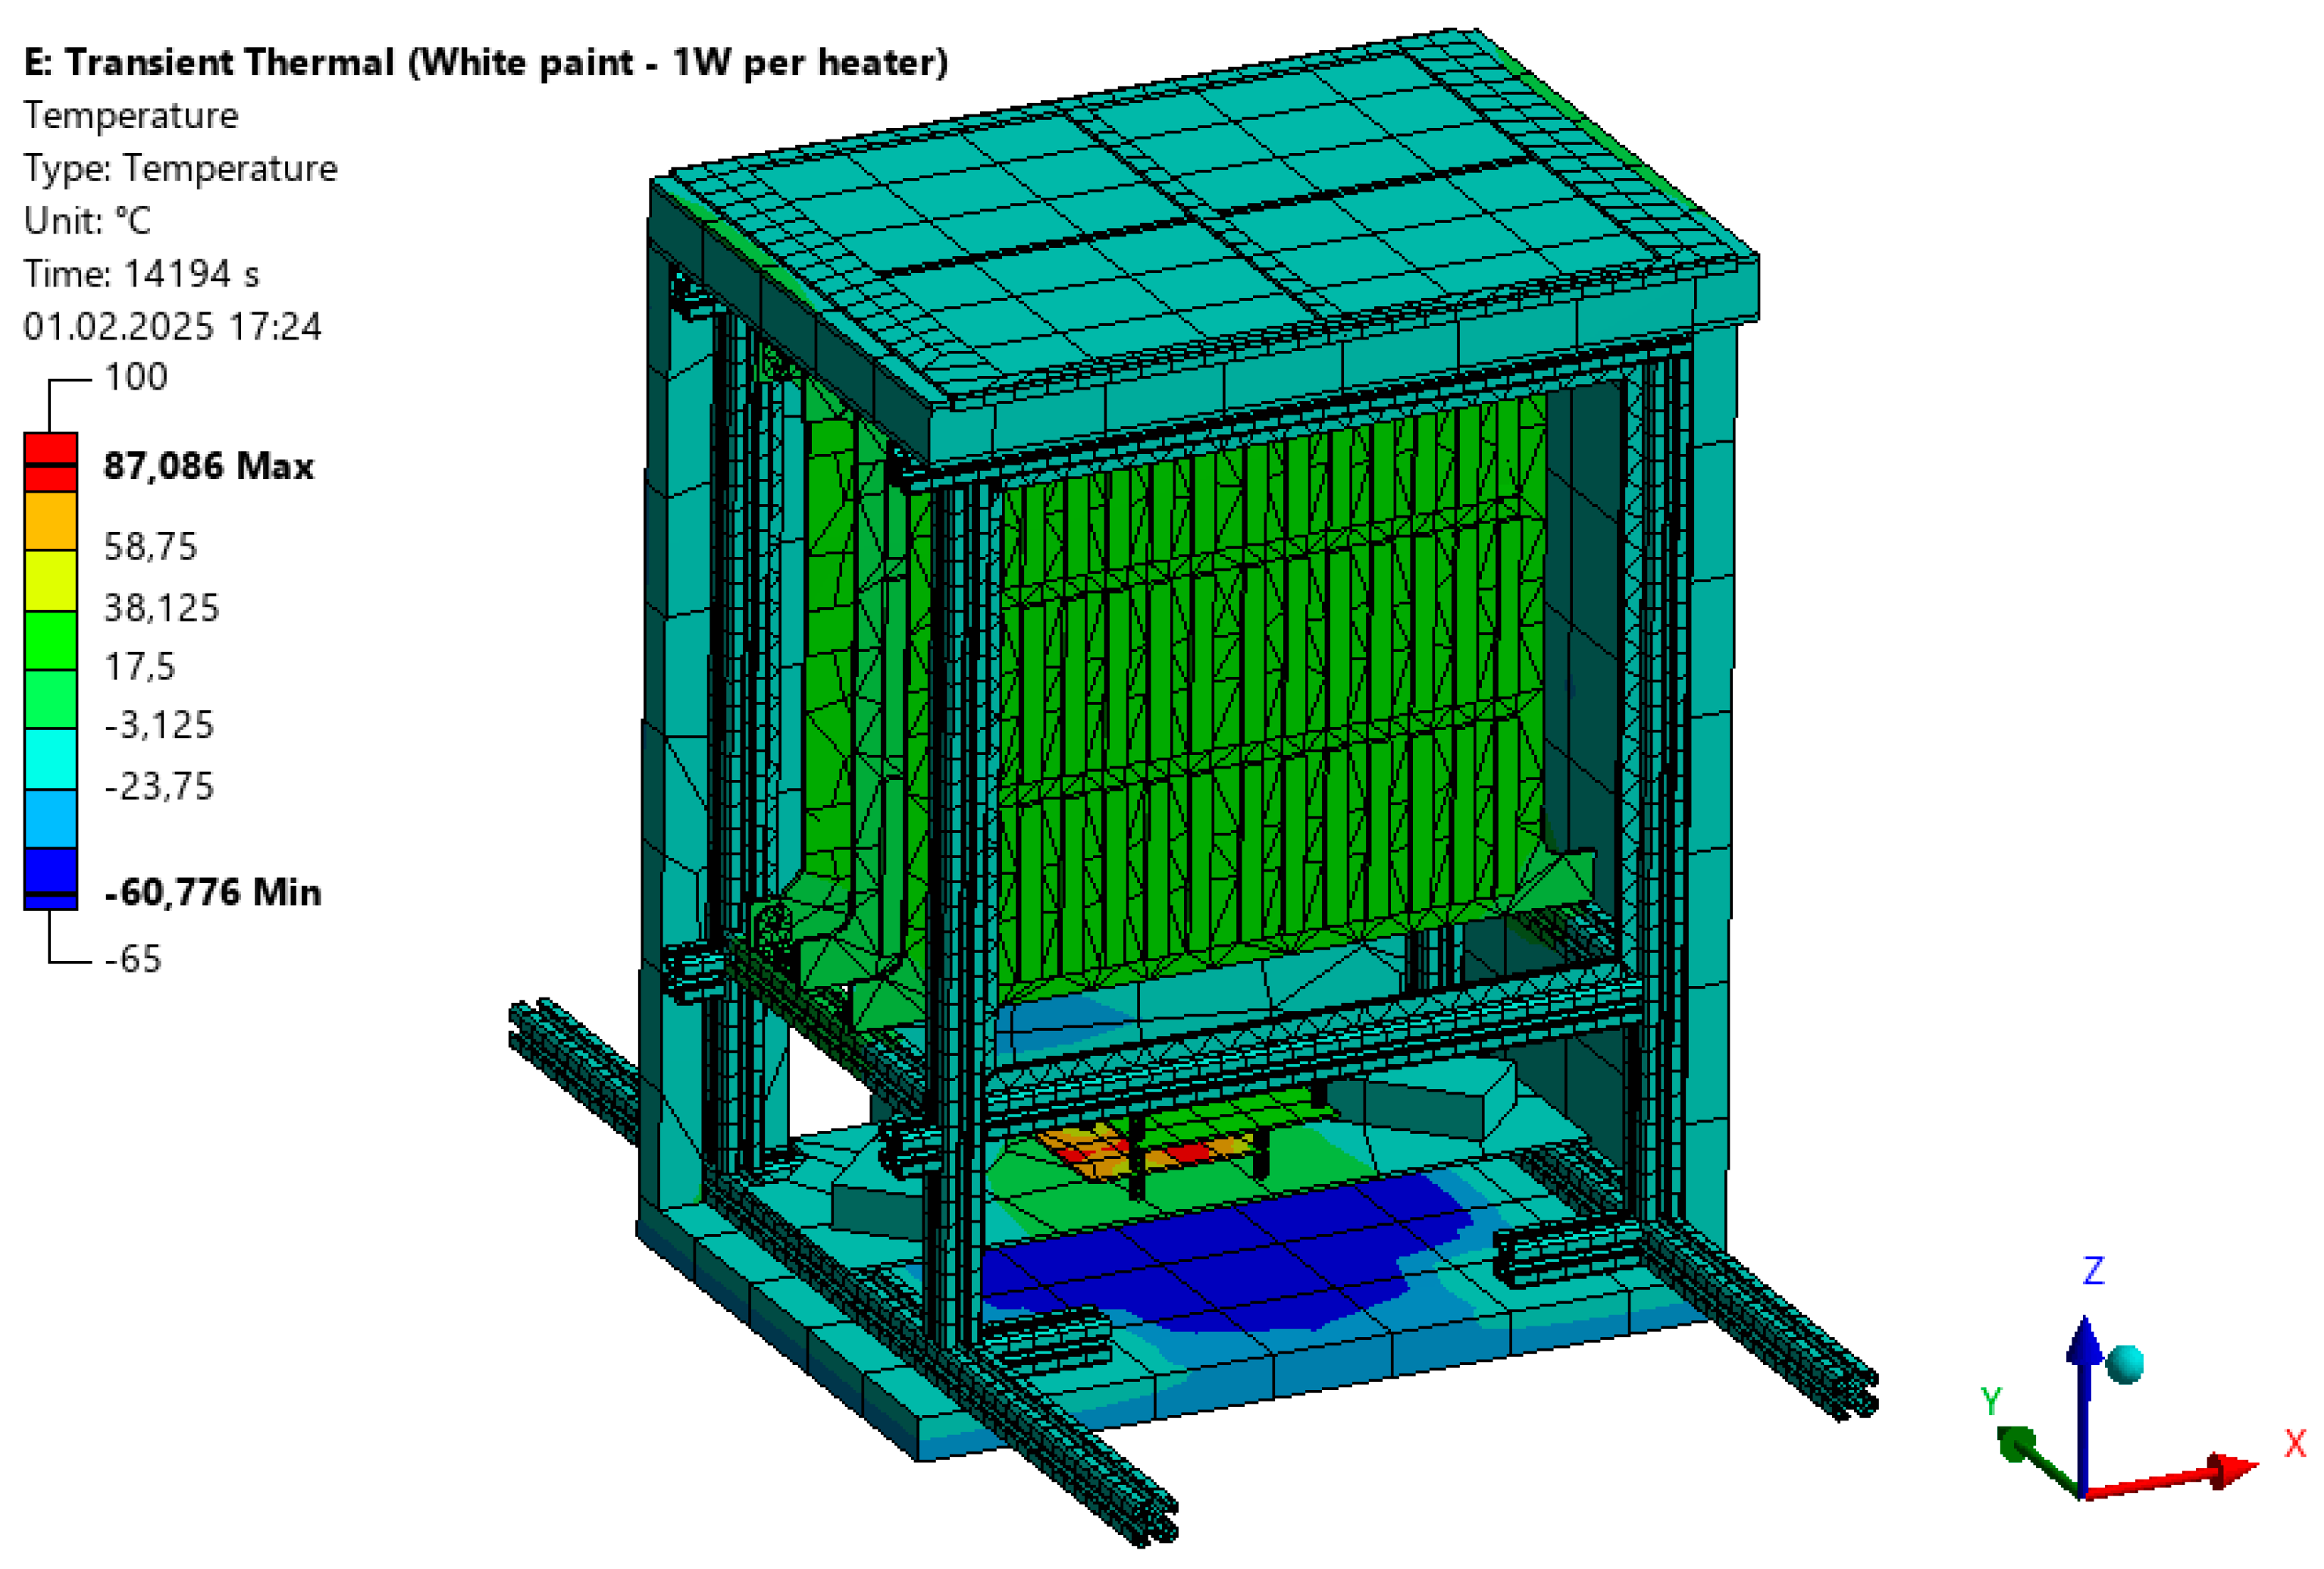
The results of the Ansys thermal simulation of the final thermal design are presented in Figure 6 and Figure 7.
The thermal results of the TVAC (Temperature-VAcuum Chamber) test are presented in Figure 8. The initial low temperature inside the chamber was generated by the cold plate, which then systematically heated up. The experiment began cooling down, with the heating system triggered after 2 min 6 s. It can be seen that the system prevents the temperatures inside the experiment from further decreasing. The test verified that the temperatures inside the experiment lay within acceptable ranges (extended industrial temperature ranges) and the experiment components were able to function properly within the stratospheric range of temperatures.

2.3. Electronics and Software Design

The electronic system of the experiment was designed to measure the following critical variables related to the photovoltaic panel research [51]:
  • Levels of the ionizing radiation, mainly in beta and gamma spectra from cosmic sources: these readings were used in composite sample analysis and correlation with dark voltages induced on photovoltaic panels;
  • Dark voltages induced on solar panels: a voltage generated on a photovoltaic panel terminal while not illuminated by visible light (in a dark state);
  • Temperature: this was measured inside the experiment.
The measurement of the photovoltaic cells’ dark current at different timestamps during the flight was carried out by a dedicated dark current measurement board. Its circuit consisted of a current sense resistor, a power monitoring integrated circuit (IC), and passive components. Each photovoltaic panel had the dimensions of 165 × 135 × 3 mm, with the total silicon area on the top of the experiment reaching 0.075 m2. The current produced by photovoltaic panels was measured by obtaining the voltage drop value across the current sense resistor and converting it, knowing the resistance of this resistor. Due to the possibility of reverse current, the circuit allows for bidirectional voltage drop readout in the range of −80 mA to 80 mA.
To eliminate the influence of external noise on measured data, the power monitor traces on the printed circuit boards (PCBs) are kept as short as possible, and the data are sent through a digital interface. The circuit was connected to the experiment’s main board through an I2C (Inter-Integrated Circuit) interface. The power was provided through a 5-pin connector, which included the I2C signals as well.
For the monitoring of the ionizing radiation, the experiment used two commercial-off-the-shelf SEN0463 modules produced by SparkFun housing ‘M4011 Geiger Tube’ (Sparkfun, Boulder, CO, USA), which were affixed to the lower part of the experiment’s box. Both modules generated high voltage for tube operation; the output current did not exceed 0.02 mA, which was insufficient to cause serious damage or injury. The modules were connected using 3-pin connectors with one signal line each; the Raspberry Pi controller in the experiment’s main board checked this signal for falling edges, which indicated that a high-energy particle reached the tube. Both GM modules could have been manually turned on/off for safety through their individual transistors—this was important as high voltages could have posed a danger to the gondola’s recovery team. By default, both GM modules were off and were intentionally turned off again after the flight and before the recovery activities. As a safety precaution, both GM modules were set to automatically turn off after no response was received from the ground station for a prolonged period.
The Raspberry Pi controller acted as the mission’s onboard main computer, controlling the data flow, and enabling communications with the ground station via E-Link (BEXUS gondola main wideband radio communication link). The Raspberry Pi did not use any RTOS (Real-Type Operating System) for this mission; multitasking was achieved using a POSIX (Portable Operating System Interface for UNIX) threads API (Application Programming Interface) that was compatible with Raspberry Pi OS (Operating System). As usual, it was included with each Linux distribution. The main computer was running a multithreading framework with three subsystems running in parallel in separate threads: Communication Subsystem (responsible for UDP, User Datagram Protocol, and communication with the ground station), Sensor Subsystem (responsible for obtaining measurements), and Logger (responsible for registering data and events on the on-board SD card). All subsystems used a thread-safe common interface for data exchange between them.
The experiment’s ground station, located at the Esrange Space Center, was hosted on a PC computer connected to the E-Link network. The received network packages were saved to a time-based database (InfluxDB) running in a Docker container. The incoming data were inspected in real time using the Grafana plotting interface that ran in another container.

3. Experiment Performance

Table 1 presents the timeline of the BEXUS 35 balloon mission, which outlines the basic flight events and events associated with the CURiE experiment. The total flight time of the mission approached 5 h, which was significantly longer in comparison with other past/typical BEXUS programme balloon flights. The indicated signal loss closer to the mission’s landing phase was due to the loss of E-Link antenna visibility by the ground station at Esrange.
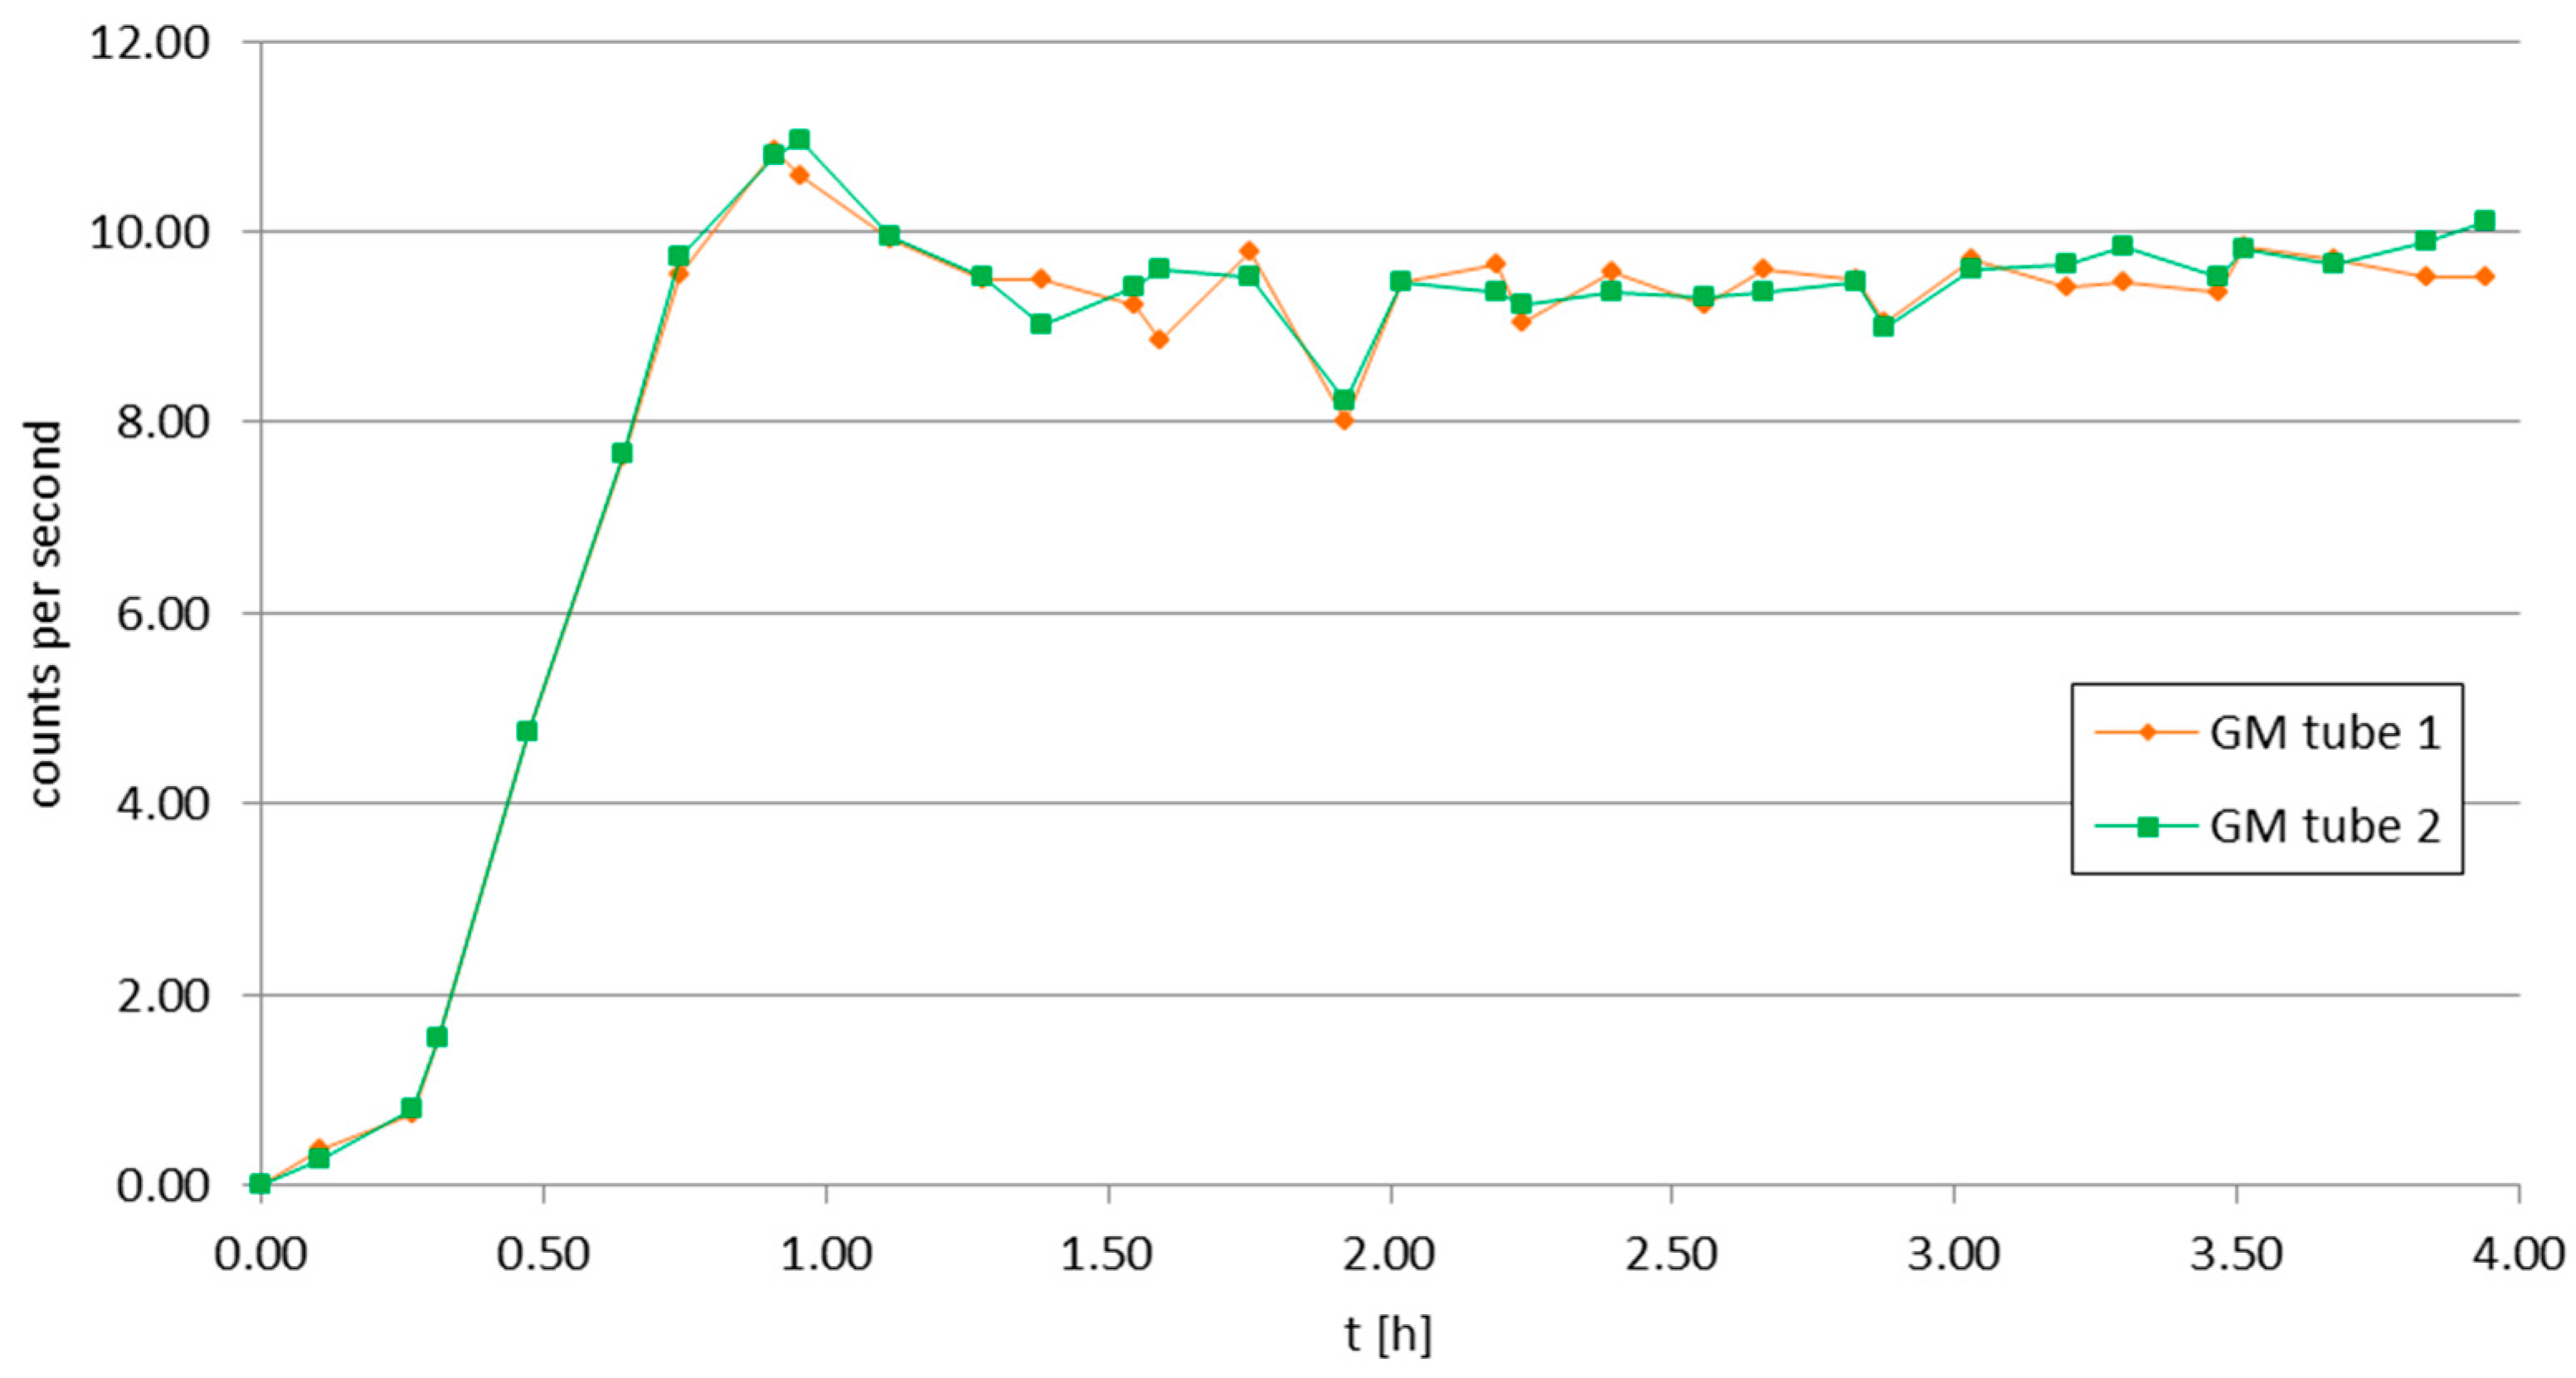
Figure 9 and Figure 10 present the basic electrical data recorded by the experiment—the dark condition voltage signals from the photovoltaic panels and the number of impulses from the GM tubes—for the undisturbed phases of the BEXUS 35 (BX35) flight, i.e., the ascend and float phases. The recording electronic measurement board truncated the panel voltage signals to values above 1.25 mV, hence the discrete character of these indications. The truncation involved the registration of the voltage above a certain threshold and averaging of every voltage peak in time (time of its duration: 500 ms); therefore, the peaks appear as uniform in value, but in real conditions, their structure below the threshold voltage could have been more complex. The single peak of 2.5 mV most likely corresponds to a hit by a single high-energy particle, e.g., a proton. The actual value of some of the voltages may have been higher, as the voltage peaks could have been registered by the I2C in the moments of their rise or decay. Also, the limited reading velocity of the I2C bus could have omitted some of the peaks. The GM tube indications show levels typical for gamma radiation encountered in stratospheric conditions; their values were averaged over the subsequent periods of file durations recorded by the experiment’s motherboard. These indications can be further re-calculated into radiation activity [Bq]; the estimation of the radiation dose can be estimated in future works if more data on the background radiation are found or delivered from external sources.

3.1. Correlation with Space Weather Data

Crucial information regarding the state of the space weather during the BEXUS 35 launch was provided by the NOAA (National Oceanic and Atmospheric Administration) Space Weather Prediction Center [46]. It included the geomagnetic activity index Kp, X-ray power density, and proton and electron fluxes recorded for different energies by the satellites GOES 16 and GOES 18 (Geostationary Operational Environmental Satellites).
Figure 11 presents the Kp indexes provided by the NOAA for the launch and mission of BEXUS 35. The figure clearly shows that there were no intense geomagnetic events; the conditions can be described as calm space weather.
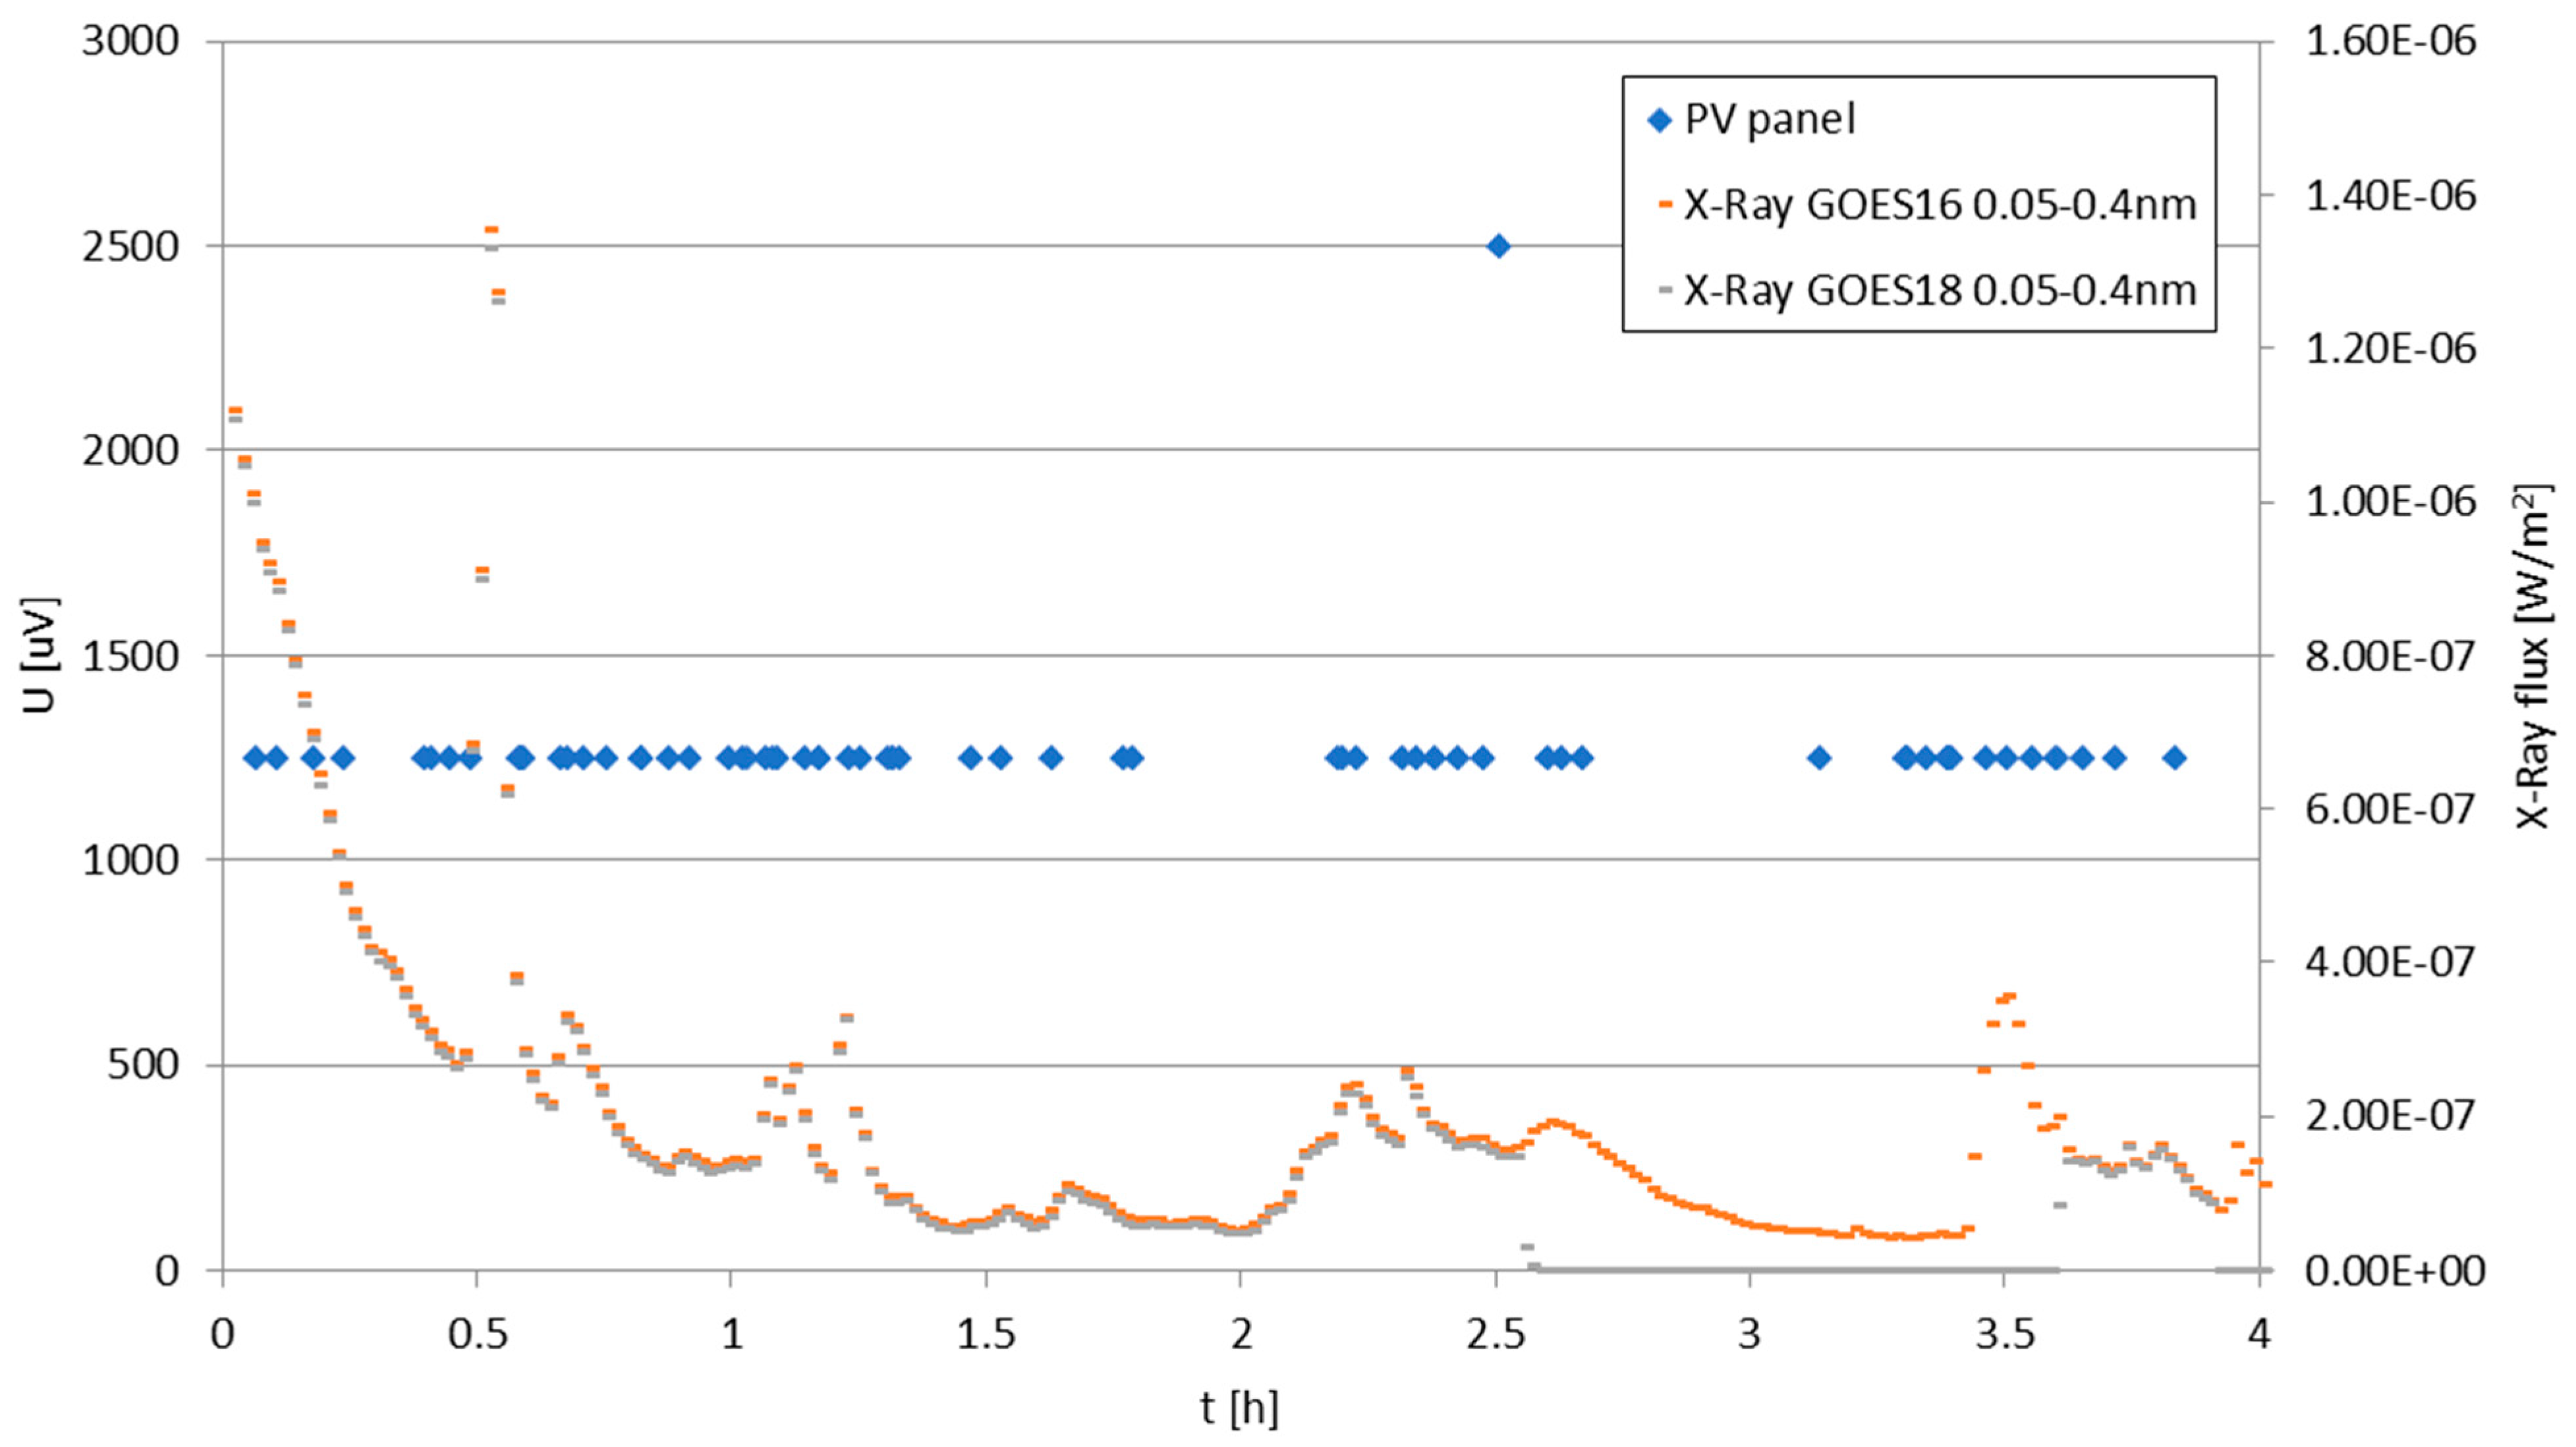
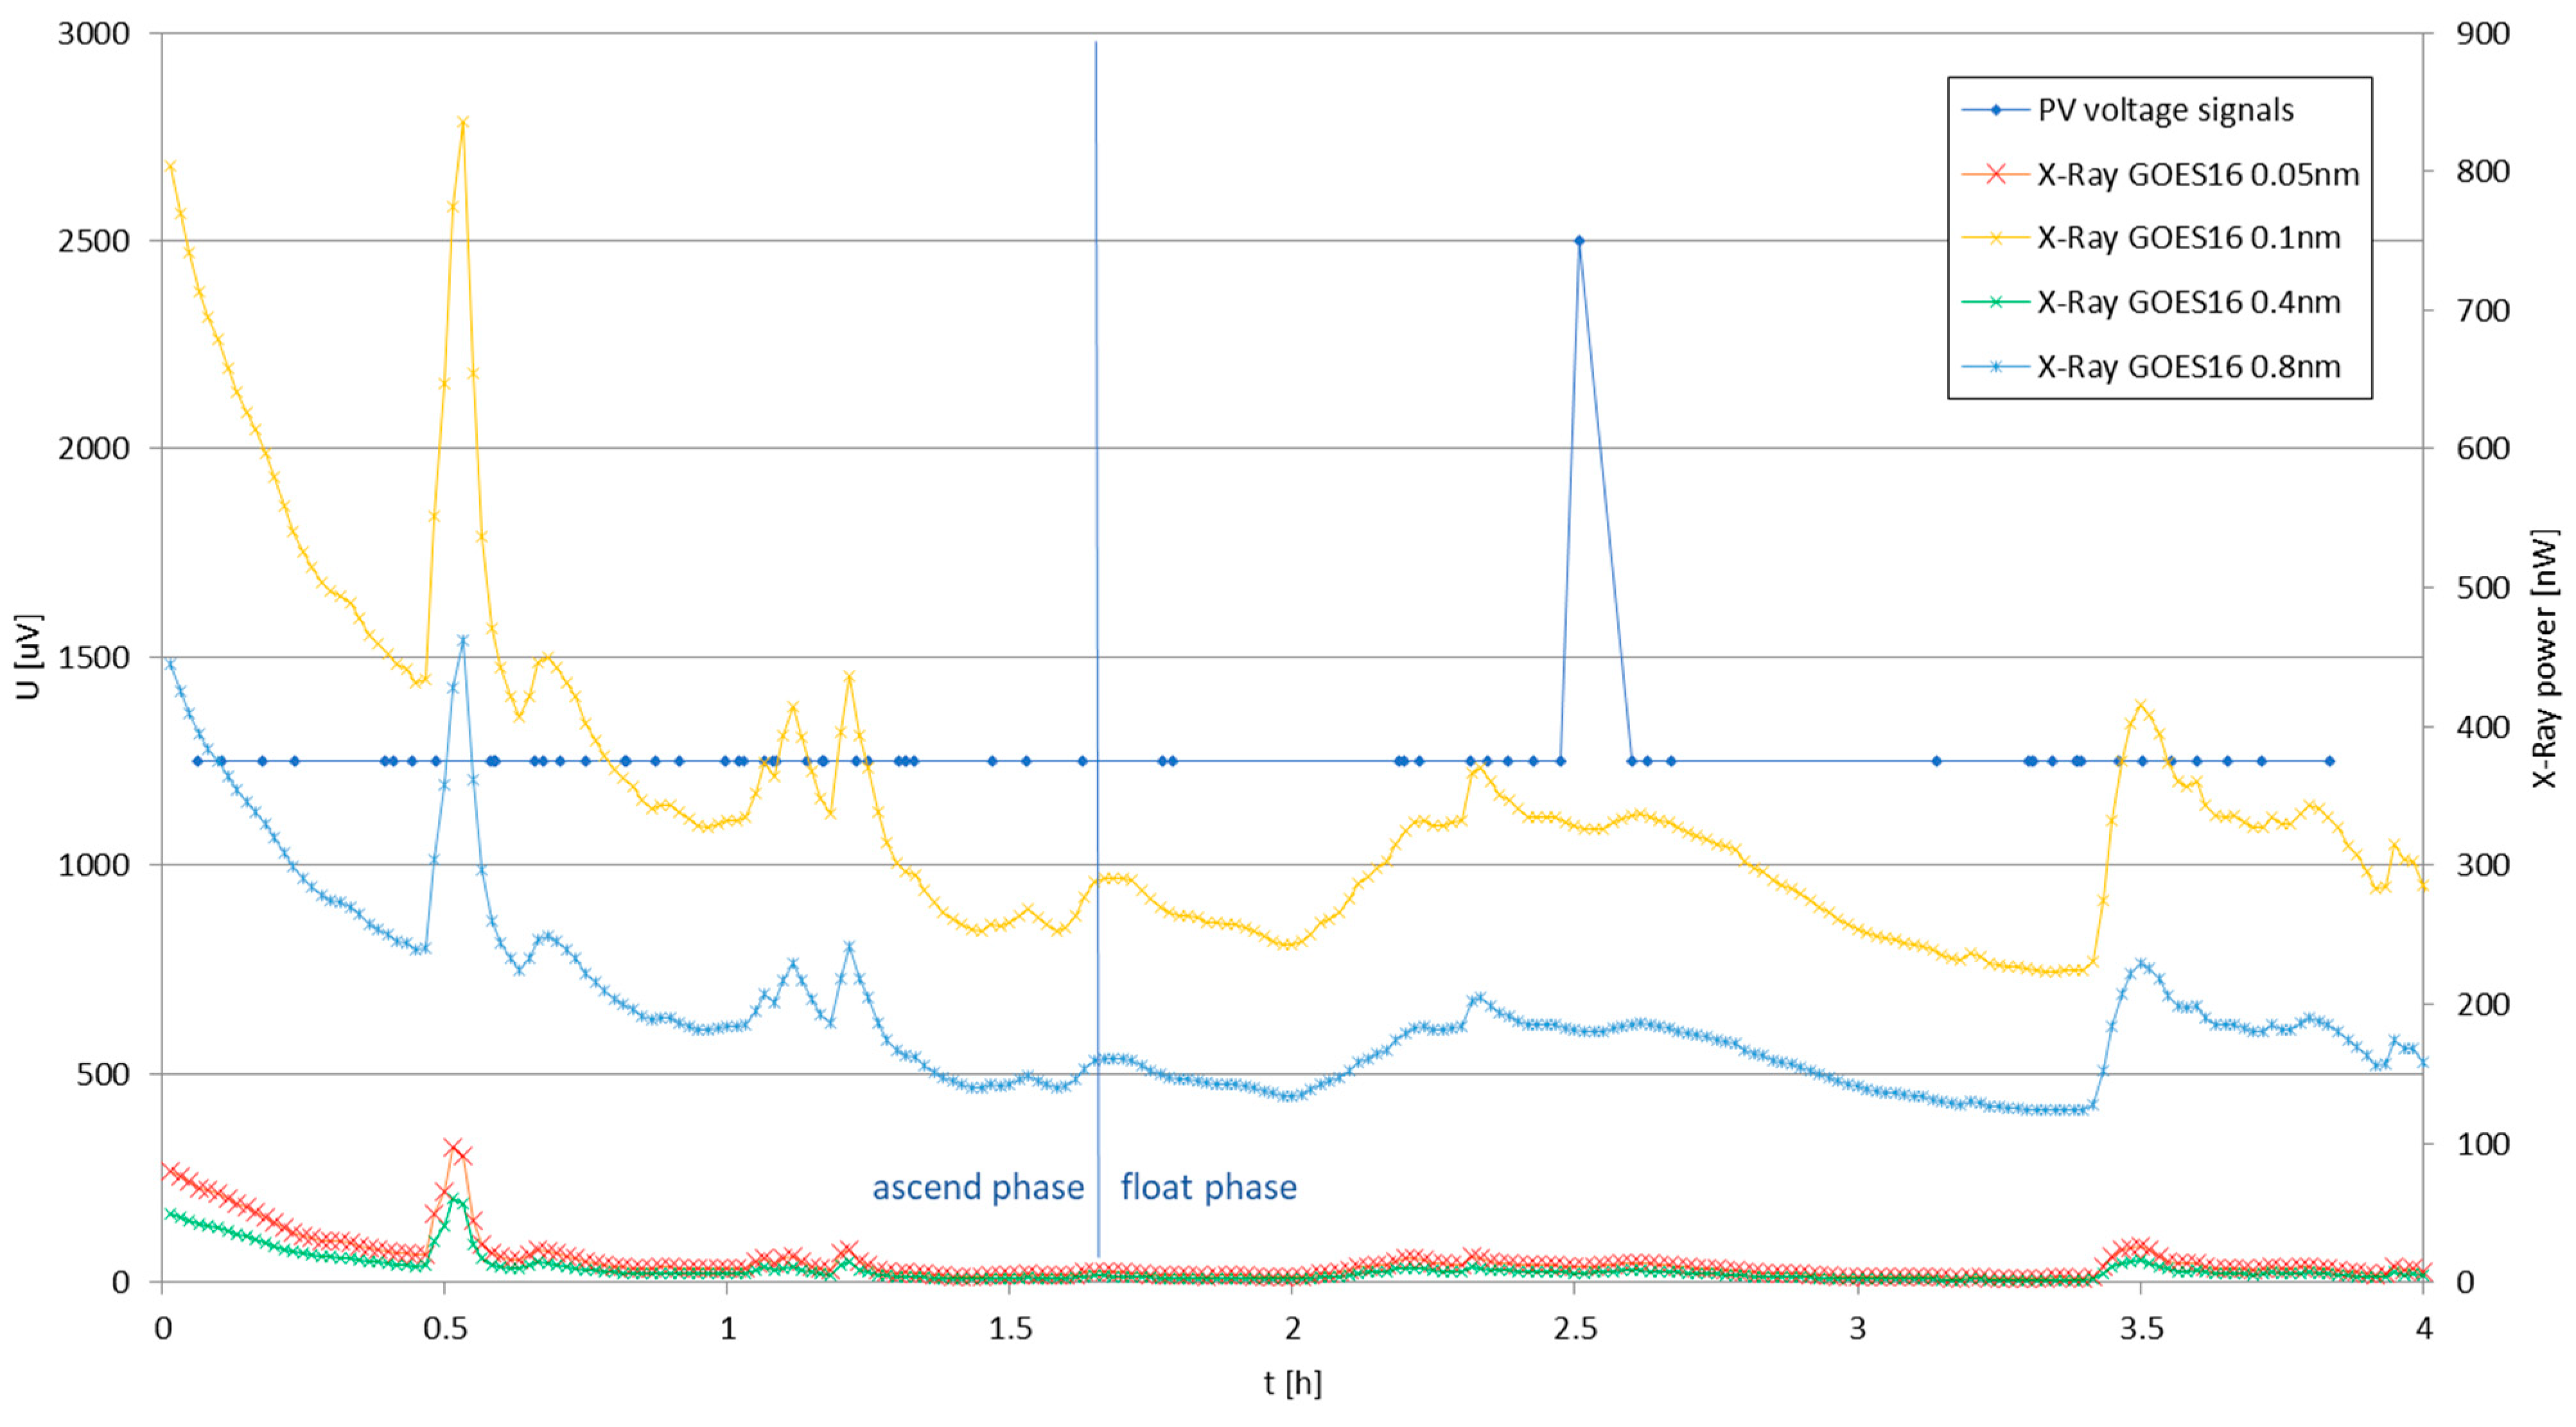
Figure 12 and Figure 13 compare the CURiE experiment’s photovoltaic panel peaks from Figure 9 with X-ray fluxes for different wavelength ranges registered by the GOES 16 and 18 satellites during the BEXUS 35 flight [46]. Considering that the float phase conditions (with approximately constant altitude) began at slightly above 1.5 h after the launch, the thinnest layer of the atmosphere—resulting in the lowest attenuation of the radiation—is experienced by the experiment since this exact time stamp. The resulting high atmospheric attenuation of the cosmic radiation between the launch and the arrival at the target altitude is the main cause of the lack of influence of the higher X-ray flux, which appeared during the ascending phase, on the CURiE experiment’s photovoltaic (PV) voltage peaks.
It is also worth noting that the slight decrease in the GM tube indications shortly before the 2nd hour of flight correlates with the significant reduction in the X-ray flux for both satellites.
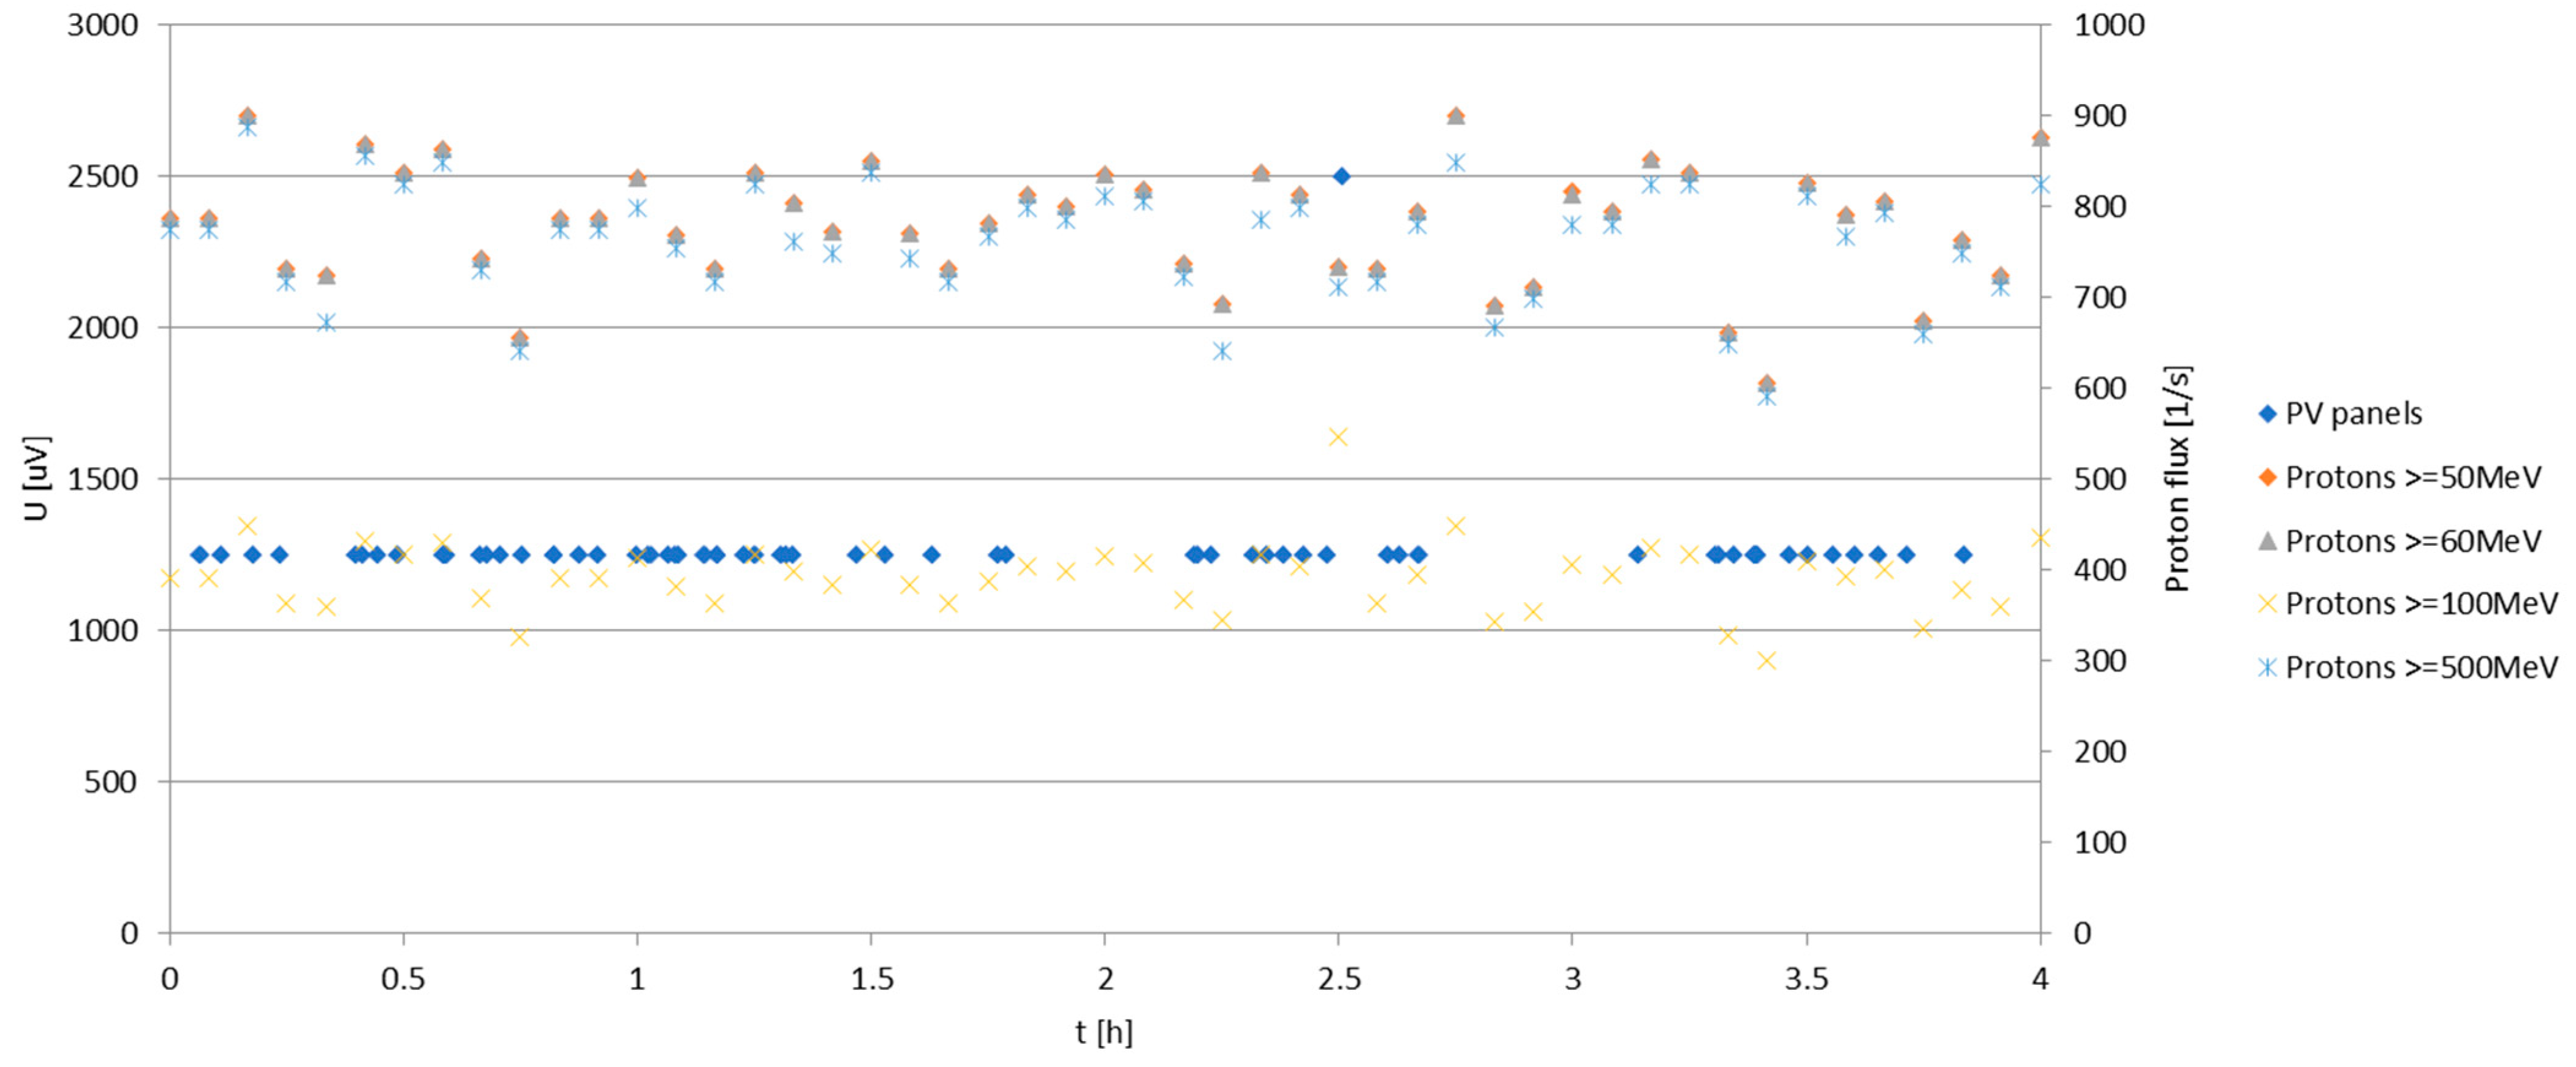
Figure 14 compares the proton fluxes registered by the GOES 18 satellite with the CURiE experiment’s PV voltage data. As the high attenuation of the atmosphere, even on the target altitude, would fully attenuate the protons and electrons (which were also registered by both GOES satellites) of lower energies (in the order of 101 MeV), only the proton energies above 50 MeV are shown. The electron flux data did not have such energy division. Therefore, it would be practically impossible to distinguish between subsequent energy ranges that differ in attenuation; additionally, as the electron fluxes presented no clear correlation with the PV panel’s voltage indications, they had to be excluded from further analysis in this article.
It is seen that there is no apparent correlation between the PV’s indications and the values of the proton fluxes. Therefore, the 2.5 mV voltage peak, if hypothesized as resulting from an impact of a single high-energy proton or pack of high-energy protons (as a local event, neither registered by the GOES satellites nor correlated with the X-ray data), was an ephemeral, single event rather than a long-lasting, consistent factor causing the voltage peaks to appear. Also, any possible mechanical or electrical failures were excluded as potential causes for this event—there was no sign of any electronic subsystem’s failure, including the data cable buses, which were investigated after the flight. The experiment also completed the FRR, Flight Readiness Review, which included a bench test with other experiments, which were found not to interfere with the experiment’s data acquisition system. On the contrary, the PV voltage peaks correlate well with the X-ray flux peaks from both GOES satellites when the CURiE experiment remained at an approximately constant altitude in the stratosphere. Therefore, the main hypothesis adopted should state that the registered voltage peaks are caused directly by the X-rays impacting the photovoltaic panels.

3.2. Analysis of X-Ray Influence

The X-ray flux, Nγ, experiencing dissipation in different media can be described by the following simple exponential equation [52]:
N γ = N γ 0 e μ σ
where Nγ0 [W/m2] is the initial value of the flux (e.g., in orbital conditions, before entering the dense atmosphere), µ [m2/kg] is the X-ray mass attenuation coefficient [53], and σ [kg/m2] is the attenuation thickness of the given material. In the case of the CURiE experiment, the model combined two sets of mi factors: dry air and aluminium foil (15 μm in thickness), with which the photovoltaic panels were covered to cut off the visible light. Table 2 and Table 3 present the values of those factors for different X-ray energies (the same as shown in Figure 12 and Figure 13).
By applying the calculated exponentials (multiplied by each other in the final solution) to the subsequent X-ray fluxes delivered by the GOES 16 satellite, the expected X-ray fluxes at different wavelengths/energies at the stratospheric altitude for the CURiE experiment can be derived. The GOES 16 satellite data were chosen exclusively due to their maintained continuity (the GOES 18 satellite experienced a discontinuity in delivering the X-ray flux information, as visible in Figure 12 and Figure 13) and higher flux levels. As each curve represents a range of wavelengths/energies, two data sets were produced using a single curve to define the limit of each wavelength/energy value. Figure 15 compares the CURiE experiment’s PV voltage peaks with the X-ray fluxes after the attenuation by the atmosphere and the panel’s aluminium foil cover. It can be noticed that the highest contribution to the overall X-ray flux during that stratospheric mission came from the X-ray flux compounds with wavelength limits of 0.1 and 0.8 nm.

3.3. Analysis of Proton Flux Influence

The overall proton flux, Np+, experiencing the atmospheric (substantial) attenuation, can be described as a linear function [54]:
N p + = N p + 0 P σ
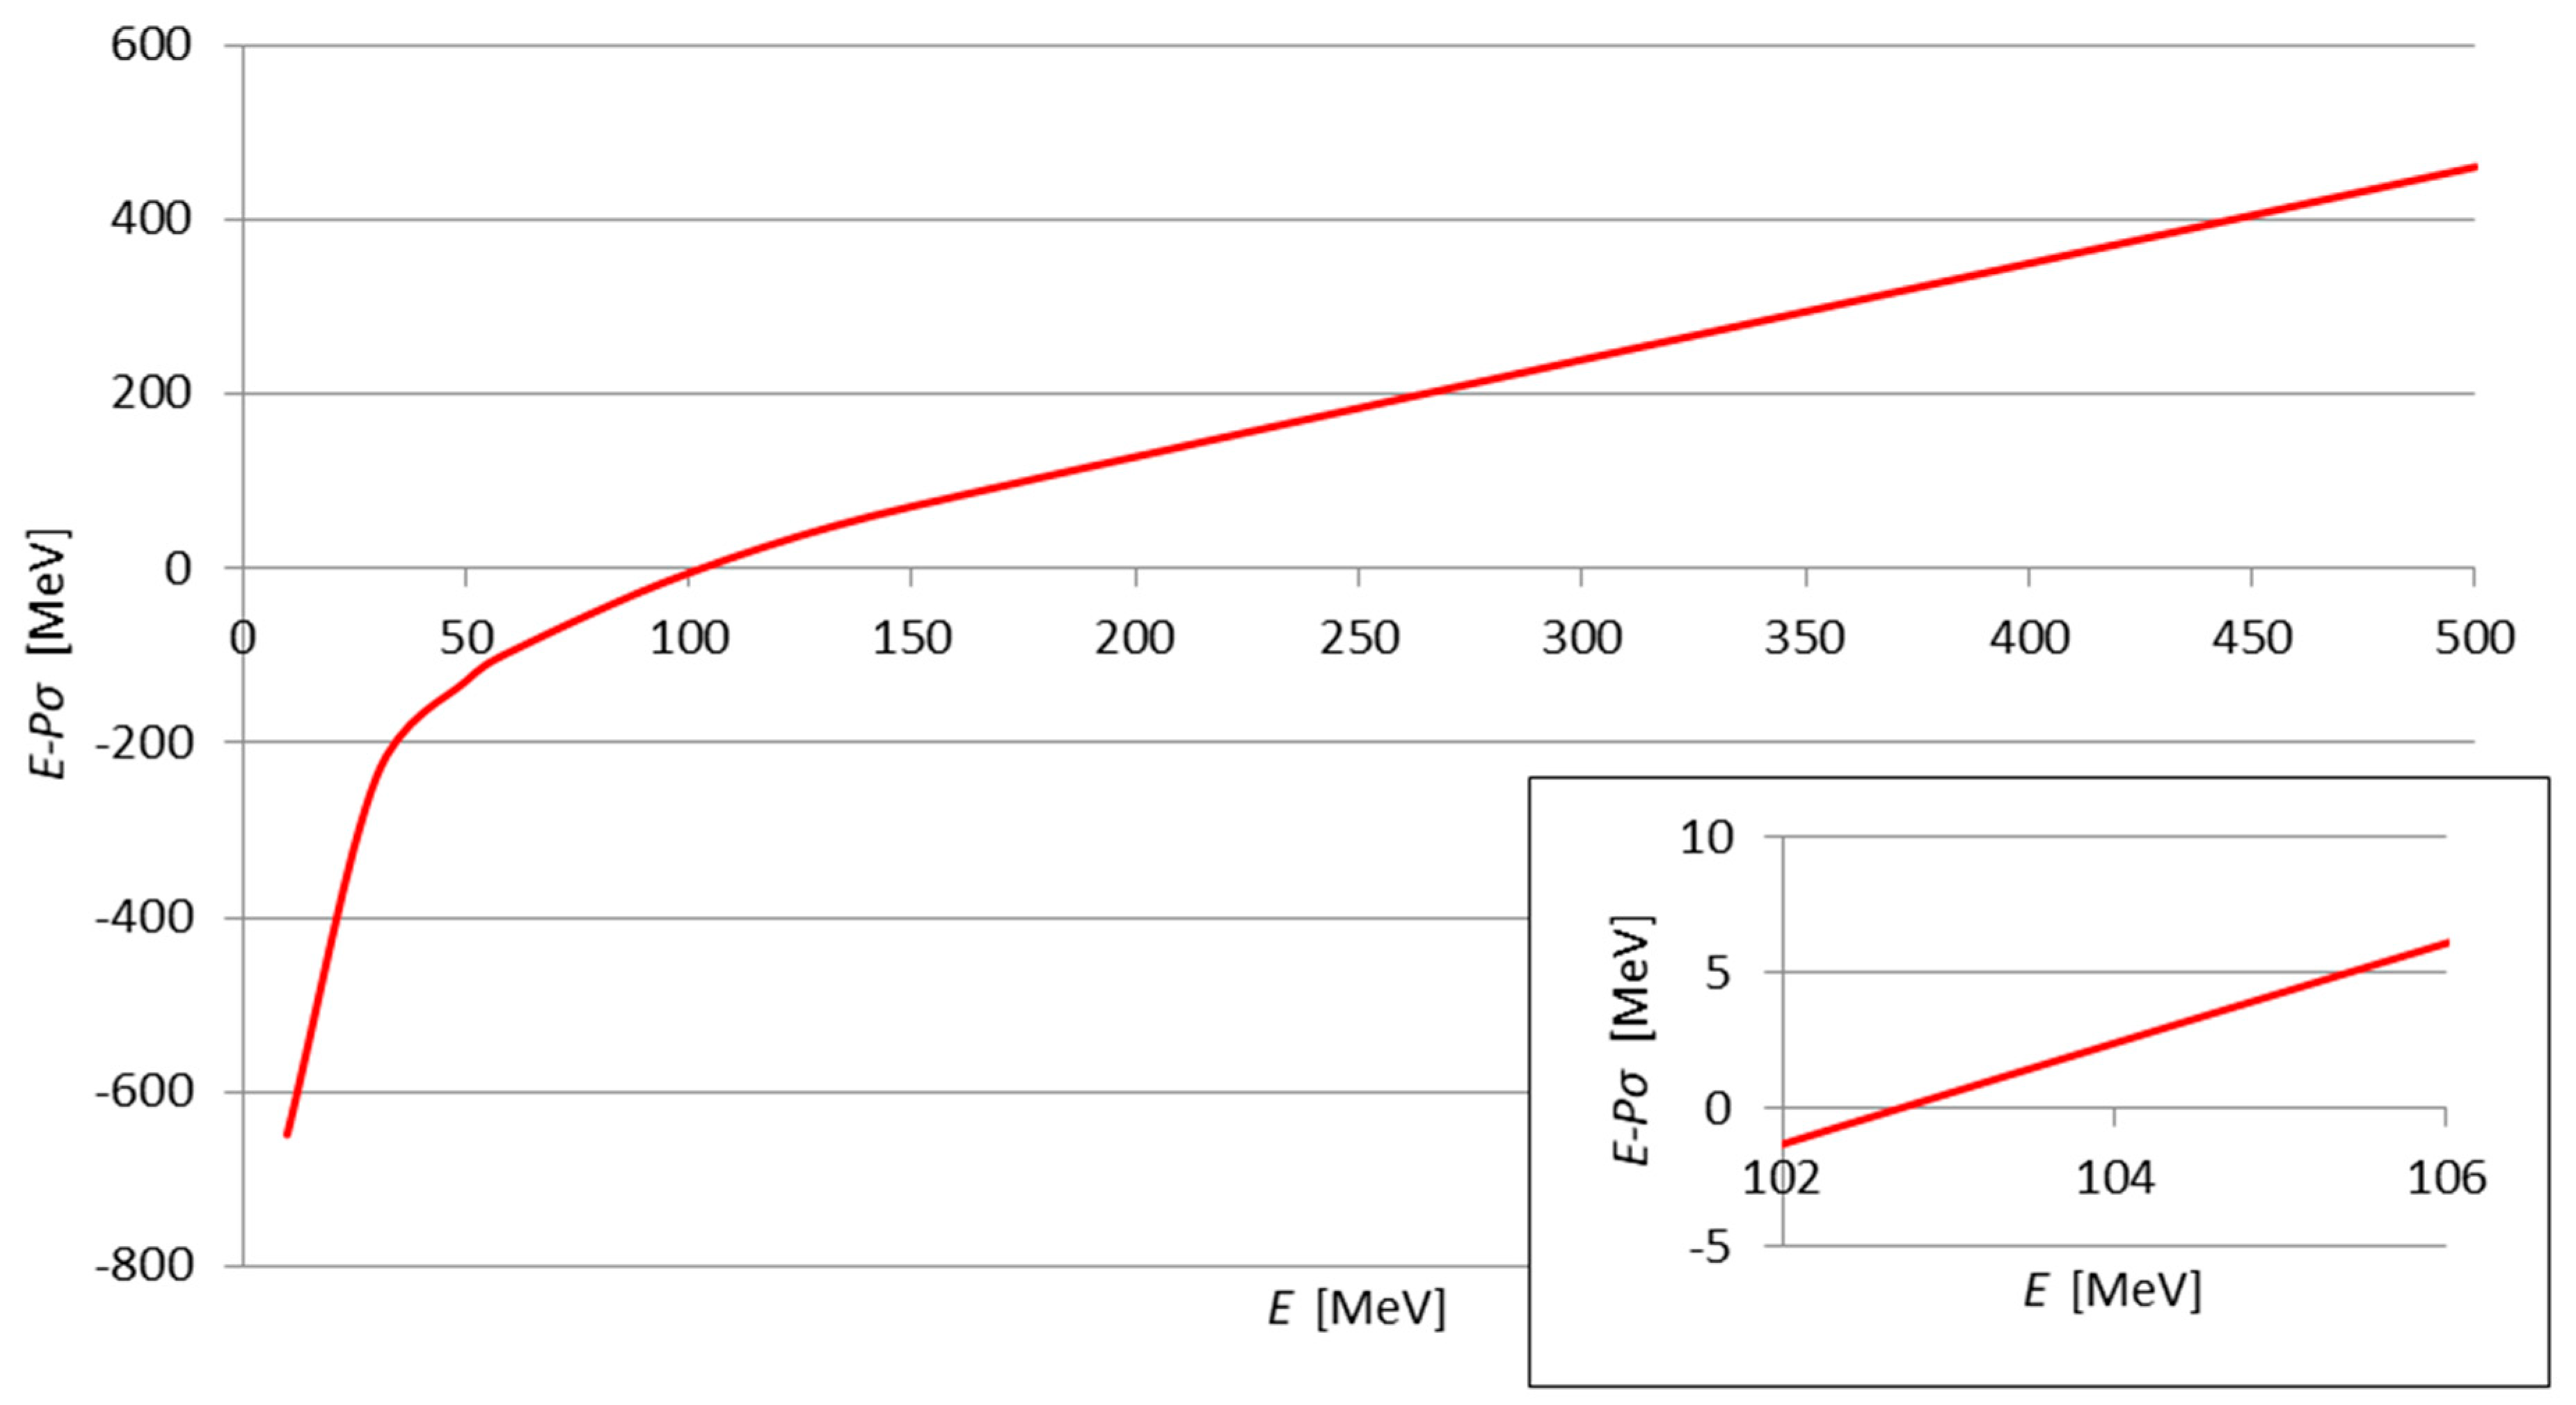
where Np+0 is the initial proton flux [MeV] and P [MeV×m2/kg] is the proton stopping power [54], with σ defined as previously described for the X-ray case. Table 4 presents the calculation of the subsequent parameters. The table includes an additional parameter R [kg/m2], which is the range of the protons of given energies in the given material (here: the air layer of 163 kg/m2). By comparing the calculated R [54] with the attenuation thickness of the air and verifying the value of the relation of R larger than air thickness (Table 4’s last column), it is possible to define the energy range of the protons that are able to pass through this layer, having the residual energy in the range of a single MeV, mentioned previously as the range which, if intercepted by a photovoltaic panel, may cause damage to the semiconductor structure. This energy range (difference) is shown in Figure 16.

4. Discussion

As shown in Figure 15, the rise of the X-ray flux for the wavelength limits of 0.1 and 0.8 nm correlates with the appearance of the voltage peaks from the PVs in the CURiE experiment. The X-ray flux can be treated as continuous (and expressed as the radiated power density function in time), i.e., not divided into separate particles, as for the proton flux. The actual X-ray and proton fluxes that reached the CURiE experiment, however, cannot be fully derived from the GOES 16 and 18 satellite data, as the satellites were not physically aligned with the BEXUS 35 mission; the GOES 16 and 18 satellite data may have been subjected to additional changes in spatial distribution, which distorted the radiation flux over the distance from the orbit to the stratosphere. Therefore, the calculations present the overall trend in X-ray attenuation in stratospheric conditions over a large/averaged spatial range, which still shows a clear correlation with the electrical data from the PV panels. The main contributors—0.1 and 0.8 nm wavelengths—would be expected to cause an even stronger influence on the semiconductor junctions at higher altitudes, leading both to the increase in recorder PV voltages and the damage to the PV’s microstructure.
As the proton flux is composed of single particles with specific energy, an attempt could be made to estimate the energy transferred to the semiconductor structure of the PV panel, which is treated similarly to a semiconductor-based radiation detector. For such a detector, the deposited energy T [eV] can be expressed as follows [55]:
T = V C W e
where V [V] is the generated voltage peak, C [F] is the capacitance of the semiconductor detector junction, W [eV] is the mean energy required for the creation of the electron–hole pair (here: ~3.5 eV), and e is the electron charge (~1.602 × 10⁻¹⁹ C). The capacitance C can be calculated using the following approximate formula [55]:
C = 2.2 10 5 S ϱ U 0
where S [m2] is the semiconductor junction surface (here 0.075 m2), ρ [Ωm] is the silicon resistivity (here, as the silicon was polycrystalline, assumed as 100 Ωm), and U0 [V] is the contact potential difference (here: 0.5 V).
Using the assumption of application of formula (3) to non-continuous radiation and the voltage generated by the single high peak at two-and-half hours after the launch—with the peak time lasting for 0.75 s—the energy deposited during this event onto the PV panel surface of 0.075 m2 would be equal to 12,745.12 MeV. This indicates a possible single impact of a high-energy proton or a group/pack of high-energy protons (as the exact location of the impact on the total surface S remains unknown unless/until the semiconductors are examined for damages, e.g., by measurements of the separate subcells of the surface S). The overall lack of correlation between the satellite data on the proton fluxes for different energies (as shown in Figure 7) suggests that if the registered peak of 2.5 mV and 0.75 s attributed to the protonic origin was a sporadic, narrow event, it is difficult (or even impossible) for the CURiE experiment and the GOES 18 satellite to achieve simultaneous detection.
If, however, the attempt is made to apply formula (3) to continuous radiation for the 0.5 s voltage peaks, which—as in Figure 15—correlate with the rises in the X-ray fluxes, the resulting power of the X-ray radiation that was intercepted by the PV panels (0.075 m2) equals 2.042 nW per voltage peak. This energy can be treated as the energy fully absorbed by the panels, as the inside-mounted PV panels did not register any signal peaks, which indicates complete energy loss in the outermost panel layer. The calculated power value, compared to the data in Figure 8, indicates that the in-orbit X-ray power above the BEXUS 35 mission was ~150 times lower than in the location of the GOES 16 satellite (geosynchronous orbit). If more information on the satellite’s positioning is made available in the future, a more detailed geometrical analysis of the radiation flux and the attenuation could be presented.

5. Conclusions

This article presents the design, mission, and results of the CURiE experiment from the BEXUS 35 stratospheric balloon mission, outlining the key collected data from its photovoltaic part and explaining, based on satellite space weather data on X-rays and protons, their most probable origin. The presented information forms a crucial data set pointing out the main factors contributing to the electrical behaviour of, and expected microstructural damage to, the CURiE experiment panels’ semiconductors, which are expected to be caused primarily by the analysed X-rays and the possible single high-energy proton event. It is, however, possible that the panel’s radiation damage in stratospheric conditions may ultimately be lower than the space-centred literature-referenced experiments. Moreover, the fact that the experiment went through a full temperature cycle (troposphere–stratosphere–troposphere) may have resulted in partial curing of the radiation damages. The analysed electrical response of the darkened cells forms an important baseline for further experiments involving the delivery of electric energy by photovoltaics interacting with cosmic radiation. This is to be investigated as a potentially beneficial co-existing factor in the spacecraft energy-delivering subsystems’ operation.
The presented analysis forms the basis for future research involving the examination of the photovoltaic panel’s damages by measuring their I-V characteristics, which will provide further explanation of the recorded high-energy event and the resistance of the used panels to cosmic radiation in stratospheric conditions. The findings shall be used as baseline conditions for the next experiment involving photovoltaics in stratospheric conditions cooperating with scintillators, consisting of the EVE CURiE experiment within the BEXUS 36 stratospheric balloon mission, which is planned to be launched in October 2025.

Author Contributions

Conceptualization, T.A.M., D.P., K.S. (Korneliusz Szalkowski), and H.T.; methodology, T.A.M., D.P., K.S. (Korneliusz Szalkowski), H.T., and D.L.; mechanical design (validation), J.C., K.S. (Korneliusz Szalkowski), M.S., K.S. (Karolina Styrna), S.W., and H.T.; electrical design and software (validation), B.K., M.S., M.P., M.G., P.U., and D.L.; thermal design (validation), P.K.; validation, D.P., B.K., and K.S. (Korneliusz Szalkowski); formal analysis, T.A.M., D.P., and H.T.; investigation, T.A.M., D.P., B.K., J.C., and P.K.; resources, T.A.M., D.P., K.S. (Korneliusz Szalkowski), and H.T.; data curation, T.A.M., and B.K.; writing—original draft preparation, T.A.M., J.C., and P.K.; writing—review and editing, T.A.M., D.P., J.C., P.K., and B.K.; visualization, J.C., and P.K.; supervision, T.A.M.; project administration, D.P.; funding acquisition, D.P., B.K., and M.P. All authors have read and agreed to the published version of the manuscript.

Funding

This research was co-funded by The Ministry of National Education of the Republic of Poland within the ‘Najlepsi z Najlepszych!’ grant programme (edition 2024-2025).

Data Availability Statement

Experiment data are available upon request. The NOAA Space Weather data are available via NOAA services online: https://www.swpc.noaa.gov/.

Acknowledgments

The team wishes to thank the DCubed company for sponsoring and supplying one of the crucial mechanical elements for the experiment and the team from the National Centre for Nuclear Research (NCBJ) for valuable help in sensor calibration.

Conflicts of Interest

The authors declare no conflicts of interest.

References

  1. Jankiewicz, Z. Balloons and Dirigibles; Publishing House of the Ministry of National Defense: Warsaw, Poland, 1968. [Google Scholar]
  2. Ginzburg, W.L.; Kurnosova, L.V. The Sun, the cosmic radiation and artificial satellites. In Space Stations: Collection of Articles; USSR Academy of Sciences: Moscow, Russia, 1960. [Google Scholar]
  3. Neher, H.V.; Anderson, H.R. Cosmic Rays at Balloon Altitudes and the Solar Cycle. J. Geophys. Res. 1962, 67, 1309–1315. [Google Scholar] [CrossRef]
  4. Mertens, C.J. Initial Results from the Radiation Dosimetry Experiment (RaD-X) Balloon Flight Mission. Available online: https://ntrs.nasa.gov/api/citations/20160006663/downloads/20160006663.pdf (accessed on 17 November 2024).
  5. Isakov, P. Life on an artificial satellite. In Space Stations: Collection of Articles; USSR Academy of Sciences: Moscow, Russia, 1960. [Google Scholar]
  6. Rosenzweig, W. Space radiation effects in silicon devices. IEEE Trans. Nucl. Sci. 1965, 12, 18–29. [Google Scholar] [CrossRef]
  7. Sarles, F.W., Jr.; Stanley, A.G.; Roberge, J.K.; Godfrey, B.W. Space radiation damage measurements in the Earth synchronous orbit. IEEE Trans. Aerosp. Electron. Syst. 1973, AES-9, 921–924. [Google Scholar] [CrossRef]
  8. Home, W.E.; Wilkinson, M.C. Improved model for predicting space performance of solar cells. IEEE Trans. Nucl. Sci. 1974, 21, 130–137. [Google Scholar] [CrossRef]
  9. Guidice, D.A. PASP PLUS: An experiment to measure space-environment effects on photovoltaic power subsystems. In Proceedings of the 5th Annual Workshop on Space Operations Applications and Research (SOAR 1991), Houston, TX, USA, 9–11 July 1991; N92-22362. NASA Technical Reports Server: Houston, TX, USA, 1992; pp. 662–668. [Google Scholar]
  10. Vogl, T.; Sripathy, K.; Sharma, A.; Reddy, P.; Sullivan, J.; Machacek, J.R.; Zhang, L.; Karouta, F.; Buchler, B.C.; Doherty, M.W.; et al. Radiation tolerance of two-dimensional material-based devices for space applications. Nat. Commun. 2019, 10, 1202. [Google Scholar] [CrossRef]
  11. Gussenhoven, M.S.; Mullen, E.G.; Hardy, D.A.; Madden, D.; Holeman, E.; Delorey, D.; Hanser, F. Low altitude edge of the inner radiation belt: Dose models from the APEX satellite. IEEE Trans. Nucl. Sci. 1995, 42, 2035–2042. [Google Scholar] [CrossRef]
  12. Guiot, P.; Vicendon, M.; Carter, J.; Langevin, Y.; Carapelle, A. Characterization of transient signal induced in IR detector array by Jupiter high-energy electrons and implications for JUICE/MAJIS operability. Planet. Space Sci. 2020, 181, 104782. [Google Scholar] [CrossRef]
  13. Garrett, H.; Jun, I.; Evans, R.; Kim, W.; Brinza, D. The latest Jovian-trapped proton and heavy ion models. IEEE Trans. Nucl. Sci. 2017, 64, 2802–2813. [Google Scholar] [CrossRef]
  14. Pankratov, B.M. Descent Vehicles; Mashinostroyeniye: Moscow, Russia, 1984. [Google Scholar]
  15. Oster, L. Modern Astronomy; PWN: Warsaw, Poland, 1982. [Google Scholar]
  16. Cahen, G.; Treille, P. Fundamentals of Nuclear Energy; PWN: Warsaw, Poland, 1959. [Google Scholar]
  17. Miley, G.H.; Krupakar Murali, S. Inertial Electrostatic Confinement (IEC) Fusion: Fundamentals and Applications; Springer Science+Business Media: New York, NY, USA, 2014. [Google Scholar]
  18. Głuszewski, W. From radiation sterilization to polymer modification. Prog. Nucl. Phys. 2023, 66, 21–27. [Google Scholar]
  19. Imnguimbert, C.; Messenger, S. Equivalent displacement damage dose for on-orbit space applications. IEEE Trans. Nucl. Sci. 2012, 59, 3117–3125. [Google Scholar] [CrossRef]
  20. Joliot-Curie, I. Natural Radioactive Elements; PWN: Warsaw, Poland, 1954. [Google Scholar]
  21. Hadrami, M.; Roubi, L.; Zazoui, M.; Bourgoin, J.C. Relation between solar cell parameters and space degradation. Sol. Energy Mater. Sol. Cells 2006, 90, 1486–1497. [Google Scholar] [CrossRef]
  22. Makham, S.; Sun, G.C.; Bourgoin, J.C. Modelling of solar cell degradation in space. Sol. Energy Mater. Sol. Cells 2010, 94, 971–978. [Google Scholar] [CrossRef]
  23. Li, P.; Dong, H.; Lan, J.; Bai, Y.; He, C.; Ma, L.; Li, Y.; Liu, J. Tolerance of perovskite solar cells under proton and electron irradiation. Materials 2021, 15, 1393. [Google Scholar] [CrossRef] [PubMed]
  24. Verduci, R.; Romano, V.; Brunetti, G.; Yaghoobi Nia, N.; Di Carlo, A.; D’Angelo, G.; Ciminelli, C. Solar energy in space applications: Review and technology perspectives. Adv. Energy Mater. 2022, 12, 2200125. [Google Scholar] [CrossRef]
  25. Šamić, H.; Makham, S. The influence of radiation on the solar cell efficiency. Balk. J. Electr. Comput. Eng. 2014, 2, 2–5. [Google Scholar]
  26. Karazhanov, S.Z. Mechanism for the anomalous degradation of proton- or electon-irradiated silicon solar cells. Sol. Energy Mater. Sol. Cells 2011, 69, 53–60. [Google Scholar] [CrossRef]
  27. Curtin, D.J.; Statler, R.L. Review of radiation damage to silicon solar cells. IEEE Trans. Aerosp. Electron. Syst. 1974, AES-11, 499–513. [Google Scholar] [CrossRef]
  28. Hands, A.D.P.; Ryden, K.A.; Meredith, N.P.; Glauert, S.A.; Horne, R.B. Radiation effects on satellites during extreme space weather events. Space Weather 2018, 16, 1216–1226. [Google Scholar] [CrossRef]
  29. Lozinski, A.R.; Horne, R.B.; Glauert, S.A.; Del Zanna, G.; Claudepierre, S.G. Modelling inner proton belt variability at energies 1 to 10 MeV using BAS-PRO. J. Geophys. Res. Space Phys. 2021, 126, e2021JA029777. [Google Scholar] [CrossRef]
  30. Burrell, M.O. The Calculation of Proton Penetration and Dose Rates; NASA Technical Memorandum TM X-53063, 17 August 1964; NASA: Washington, DC, USA, 1964. [Google Scholar]
  31. Srour, J.R.; Vendura, G.J., Jr.; Lo, D.H.; Toporow, C.M.C.; Dooley, M.; Nakano, R.P.; King, E.E. Damage mechanisms in radiation-tolerant amorphous silicon solar cells. IEEE Trans. Nucl. Sci. 1998, 45, 2624–2631. [Google Scholar] [CrossRef]
  32. Summers, G.P.; Messenger, S.R.; Burke, E.A.; Xapsos, M.A.; Walters, R.J. Contribution of low-energy protons to degradation of shielded GaAs solar cells in space. Prog. Photovolt. Res. Appl. 1997, 5, 407–413. [Google Scholar] [CrossRef]
  33. Toda, H.; Miyake, W.; Miyoshi, Y.; Toyota, H.; Miyazawa, Y.; Shinohara, I.; Matsuoka, A. Spatial distribution of radiation belt protons deduced from solar cell degradation of the Arase satellite. Int. J. Astron. Astrophys. 2018, 8, 306–322. [Google Scholar] [CrossRef]
  34. Pellicori, S.F.; Martinez, C.L.; Haugsen, P.; Wilt, D. Development and testing of coatings for orbital space radiation environment. Appl. Opt. 2014, 53, A339–A350. [Google Scholar] [CrossRef]
  35. Bogatov, N.M.; Grigor’yan, L.R.; Kovalenko, A.I.; Kovalenko, M.S.; Lunin, L.S. Pulse response characteristics of silicon photovoltaic converters irradiated with low-energy protons. Tech. Phys. Lett. 2021, 47, 326–328. [Google Scholar] [CrossRef]
  36. Verkerk, A.D.; Rath, J.K.; Schropp, R.E.I. Degradation of thin film nanocrystalline silicon solar cells with 1 MeV protons. Energy Procedia 2010, 2, 221–226. [Google Scholar] [CrossRef]
  37. Messenger, S.R.; Burke, E.A.; Walters, R.J.; Warner, J.H.; Summers, G.P.; Morton, T.L. Effect of omnidirectional proton irradiation on shielded solar cells. IEEE Trans. Nucl. Sci. 2006, 53, 3771–3778. [Google Scholar] [CrossRef]
  38. Imaizumi, M.; Ohshima, T.; Yuri, Y.; Suzuki, K.; Ito, Y. Effects of beam conditions in ground irradiation tests on degradation of photovoltaic characteristics of space solar cells. Quantum Beam Sci. 2021, 5, 15. [Google Scholar] [CrossRef]
  39. Sato, S.; Sai, H.; Ohshima, T.; Imaizumi, M.; Shimazaki, K.; Kondo, M. Temperature influence on performance degradation of hydrogenated amorphous silicon solar cells irradiated with protons. Prog. Photovolt. Res. Appl. 2013, 21, 1499–1506. [Google Scholar] [CrossRef]
  40. Amekura, H.; Kishimoto, N.; Kono, K. Radiation-induced two-step degradation of Si photoconductors and space solar cells. IEEE Trans. Nucl. Sci. 1998, 45, 1508–1513. [Google Scholar] [CrossRef]
  41. Dorabialska, A. Natural Radioactivity of Chemical Compounds; PZWS: Warsaw, Poland, 1952. [Google Scholar]
  42. Skłodowska-Curie, M. Radioactivity; OFPW: Warsaw, Poland, 2011; (Reprint 1939). [Google Scholar]
  43. Broda, E.; Schönfeld, T. Application of Radioactivity in Technology; PWN: Warsaw, Poland, 1959. [Google Scholar]
  44. Tamošiūnas, V.; Minkevičius, L.; Vaitkūnas, A.; Urbanowicz, A.; Maneikis, A.; Šetkus, A.; Valušis, G. Characterization of silicon solar cells and module materials using terahertz radiation. Energy Procedia 2015, 77, 202–207. [Google Scholar] [CrossRef]
  45. Tippabhotla, S.K.; Song, W.J.R.; Subramani, A.; Stan, C.V.; Tamura, N.; Tay, A.A.O.; Budiman, A.S. Stress and fracture of crystalline silicon cells in solar photovoltaic modules—A synchrotron X-ray microdiffraction based investigation. MRS Adv. 2019, 4, 2319–2335. [Google Scholar] [CrossRef]
  46. National Oceanic and Atmospheric Administration’s Space Weather Prediction Center. Available online: https://www.swpc.noaa.gov/ (accessed on 24 October 2024).
  47. Nowakowski, W. Fundamental Electronic Circuits; Impulse Circuits; WKiŁ: Warsaw, Poland, 1982. [Google Scholar]
  48. Butera, S.; Lioliou, G.; Barnett, A.M. gallium arsenide Fe-55 X-ray photovoltaic battery. J. Appl. Phys. 2016, 119, 064504. [Google Scholar] [CrossRef]
  49. The REXUS/BEXUS Programme. Rocket and Balloon Experiments for University Students. Available online: https://rexusbexus.net/ (accessed on 4 February 2025).
  50. BEXUS User Manual, Version 8.1; REXUS/BEXUS Programme; Kiruna, Sweden. 2023. Available online: https://rexusbexus.net/wp-content/uploads/2025/01/BX_REF_BEXUS_User-Manual_v8-2_26Dec24.pdf (accessed on 5 February 2025).
  51. Student Experiment Documentation: BX35 CURiE SED v4.1. 22 September 2024.
  52. Goldstein, H. Fundamental Aspects of Reactor Shielding; Gosatomizdat: Moscow, Russia, 1961. [Google Scholar]
  53. Hubbell, J.H.; Seltzer, S.M. Tables of X-ray Mass Attenuation Coefficients and Mass Energy-Absorption Coefficients from 1 keV to 20 MeV for Elements Z = 1 to 92 and 48 Additional Substances of Dosimetric Interest. In NIST Standard Reference Database 126; NIST: Gaithersburg, MD, USA, 2004. [Google Scholar] [CrossRef]
  54. NIST PSTAR: Stopping-Power and Range Tables for Protons. Available online: https://physics.nist.gov/PhysRefData/Star/Text/PSTAR.html (accessed on 5 November 2024).
  55. Araminowicz, J.; Małuszyńska, K.; Przytuła, M. Laboratory of Nuclear Physics; PWN: Warsaw, Poland, 1978. [Google Scholar]
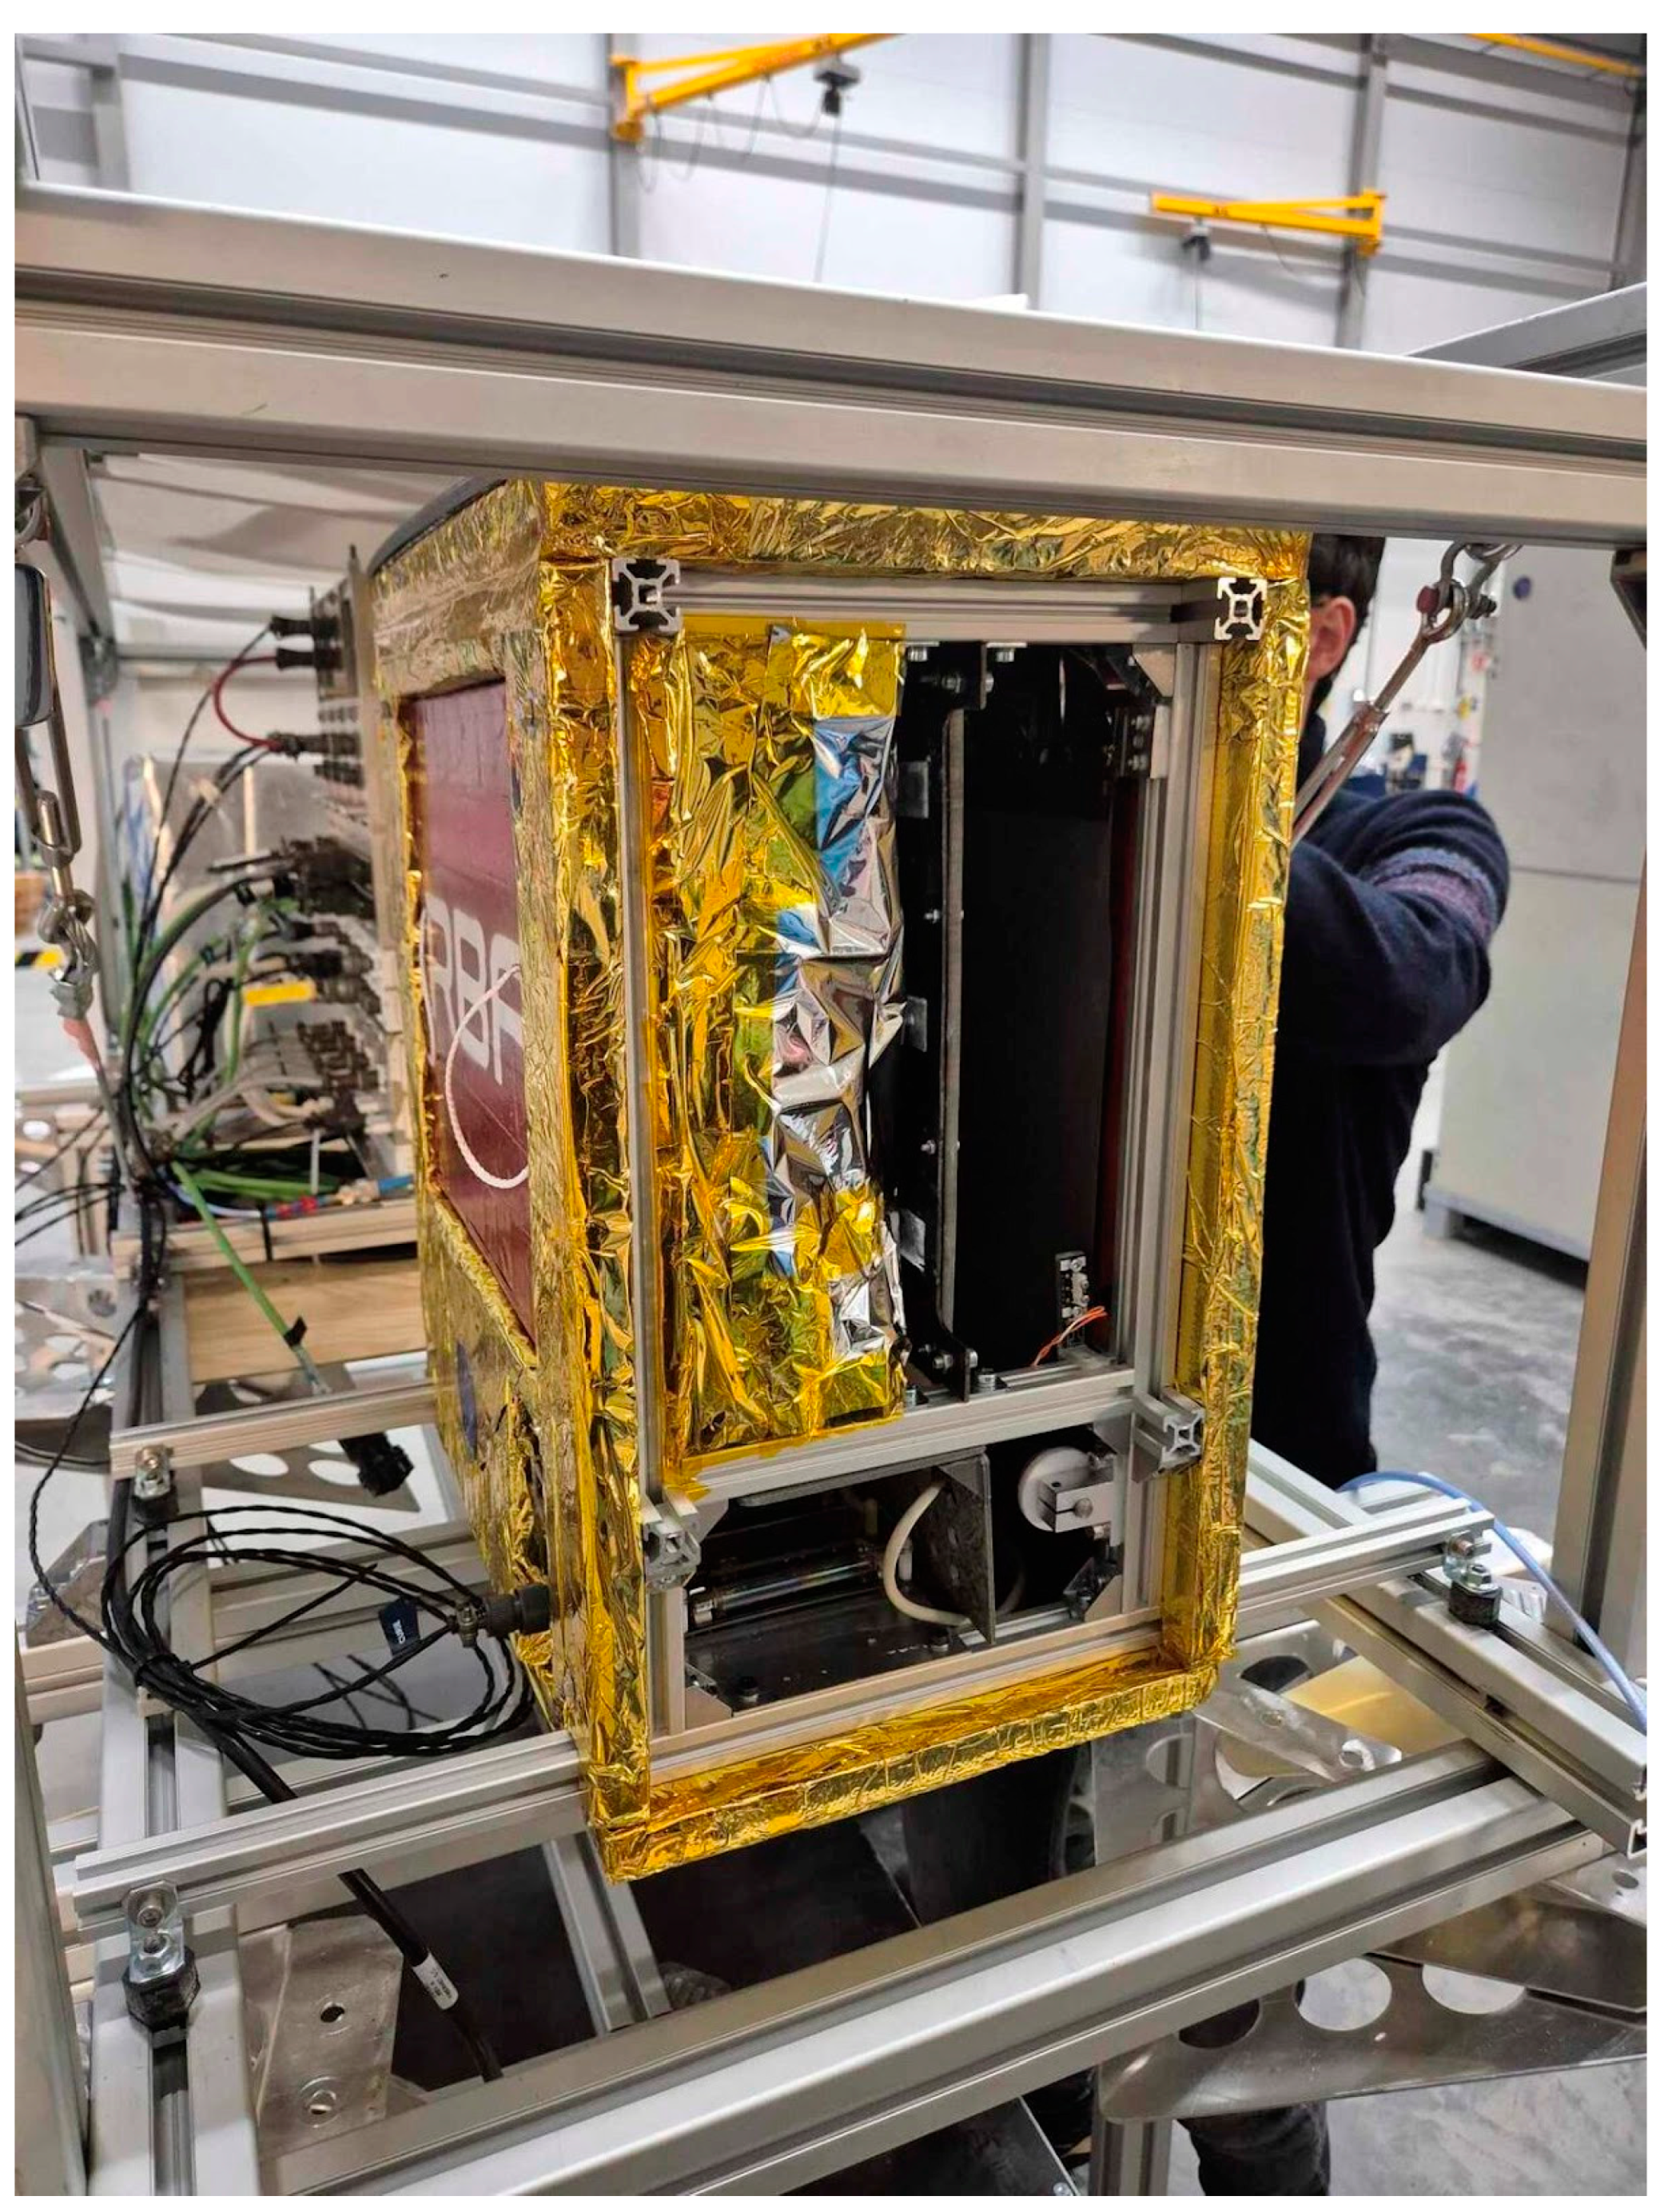
Figure 1. The CURiE experiment mounted on the ESCARGO gondola at the Esrange Space Center before launch.
Electronics 14 00991 g001
Figure 2. The final mechanical design of the CURiE experiment, without and with complete Styrofoam external insulation.
Electronics 14 00991 g002
Figure 3. The CURiE experiment’s photovoltaic panels: after and before shielding.
Electronics 14 00991 g003
Figure 4. The mounting of the photovoltaic panels on the top of the CURiE experiment: (a) two inside panels and (b) four outside panels.
Electronics 14 00991 g004
Figure 5. The design of the thermal heating plate of the CURiE experiment.
Electronics 14 00991 g005
Figure 6. Temperature of the experiment during the ascension phase (around 10 km of altitude).
Electronics 14 00991 g006
Figure 7. Temperature of the experiment during the floating phase (around 25 km of altitude).
Electronics 14 00991 g007
Figure 8. Temperature profiles of the CURIE experiment components during the TVAC test.
Electronics 14 00991 g008
Figure 9. Dark condition voltage peaks recorded from the CURiE experiment’s photovoltaic panels during the ascend and float phases of BX35.
Electronics 14 00991 g009
Figure 10. Averaged numbers of indications (impulses) from the GM tubes from the ascend and float phases of BX35.
Electronics 14 00991 g010
Figure 11. Geomagnetic activity index, Kp, for the period covering the BEXUS 35 mission [46].
Electronics 14 00991 g011
Figure 12. X-ray fluxes for the wavelength range of 0.05–0.4 nm (24.8–3.1 keV) compared to the voltage peaks recorded by the CURiE experiment’s PVs.
Electronics 14 00991 g012
Figure 13. X-ray fluxes for the wavelength range of 0.1–0.8 nm (12.4–1.55 keV) compared to the voltage peaks recorded by the CURiE experiment’s PVs.
Electronics 14 00991 g013
Figure 14. Proton fluxes above 50 MeV registered by the GOES 18 satellite compared to the voltage peaks recorded by the CURiE experiment’s PVs.
Electronics 14 00991 g014
Figure 15. X-ray fluxes from the GOES 16 satellite—after the attenuation by the atmosphere (163 kg/m2) and the aluminium cover (0.0405 kg/m2)—compared to the voltage peaks recorded by the CURiE experiment’s PVs.
Electronics 14 00991 g015
Figure 16. The difference between the proton energy and energy attenuated by the air layer of 163 kg/m2 was plotted as a continuous function of the incoming proton energy. The inserted plot shows the intersection of the function with the horizontal axis, marking the incoming proton energy limit at the considered stratospheric altitude; above this energy (approximately 102.8 MeV), the protons are able to penetrate the air, reaching the 27.7 km of altitude of the BEXUS 35 balloon mission.
Electronics 14 00991 g016
Table 1. BEXUS 35 mission timeline.
2 October 2024, Local TimeBX35 Mission Event
09.53.15BX35 launch from Esrange (Sweden)
10.04CURiE panels generate the first voltage signals
11.28Beginning of float phase, stabilizing altitude: 27.4–27.6 km
15.03Balloon cut off, beginning of re-entry
15.28Descending, altitude: 3926 m
15.32Loss of signal, altitude: 2084 m
15.41BX35 landing confirmed (Finland)
Table 2. Parameters used to calculate the X-ray attenuation in dry air (163 kg/m2).
λ [nm]E [keV]µ [m2/kg]eµσ
0.0524.80.000250.960
0.112.40.00020.968
0.43.10.0030.613
0.81.550.0030.6132
Table 3. Parameters used to calculate the X-ray attenuation in aluminium foil (15 μm thickness, resulting in 0.0405 kg/m2).
λ [nm]E [keV]µ [m2/kg]eµσ
0.0524.80.0650.997
0.112.40.120.995
0.43.110.960
0.81.553.50.868
Table 4. Calculated attenuation parameters for the proton flux of different energies for the dry air layer of 163 kg/m2.
E [MeV]P [MeV × m2/kg]P × σ [MeV]E-P × σ [MeV]R [kg/m2]R > 163 kg/m2 ?
104.006652.978−648.9721.405NO
301.653269.439−238.43910.05NO
501.099179.137−129.13725.24NO
600.9517155.1271−95.127135.04NO
1000.6443105.0209−5.020987.31NO
1500.481678.500871.4992178.3YES
5000.243139.6253460.37471320YES
Disclaimer/Publisher’s Note: The statements, opinions and data contained in all publications are solely those of the individual author(s) and contributor(s) and not of MDPI and/or the editor(s). MDPI and/or the editor(s) disclaim responsibility for any injury to people or property resulting from any ideas, methods, instructions or products referred to in the content.