Article

Exploring the Impact of Digital Transformation on Non-Financial Performance in Central and Eastern European Countries

by
Alexandru Buglea
1,
Irina Daniela Cișmașu
2,*,
Delia Anca Gabriela Gligor
1 and
Cecilia Nicoleta Jurcuț
1
1
Department of Management and Entrepreneurship, Faculty of Economics and Business Administration, West University of Timisoara, 300223 Timisoara, Romania
2
Department of Financial and Economic Analysis and Valuation, Bucharest University of Economic Studies, 010374 Bucharest, Romania
*
Author to whom correspondence should be addressed.
Electronics 2025, 14(6), 1226; https://doi.org/10.3390/electronics14061226
Submission received: 14 February 2025 / Revised: 13 March 2025 / Accepted: 18 March 2025 / Published: 20 March 2025

Abstract

:
This article explores the intricate relationship between digital transformation and non-financial performance in Central and Eastern European (CEE) countries. As these nations navigate the complexities of post-communist economic landscapes, the role of digitalization emerges as a pivotal factor influencing various dimensions of organizational performance beyond mere financial outcomes. In this framework, our research aims to analyze the ways in which digital transformation (as proxied by DESI) impacts a range of non-financial performance metrics (ESG) in order to furnish a thorough comprehension of the intricate interplay within the specific context of CEE countries. With data collected over an 11-year timeframe, we performed a panel data analysis, relying on a robust regression. The main findings indicate that digital transformation profoundly impacts the environmental (CO2 emissions, renewable energy consumption), social (ratio of female-to-male labor force participation rate, unemployment) and governance (government effectiveness) performance of CEE countries, although the effects vary significantly across different regions. The panel data highlight potential areas for policy emphasis, particularly in relation to reducing CO2 emissions, improving regulatory quality, and advancing digital integration and connectivity. The disparities identified may inform targeted strategies aimed at uplifting underperforming regions, thereby contributing to enhanced economic growth and sustainability.

1. Introduction

Our paper tackles an area that has seen an important growth in research in recent years, namely digital transformation and its effect on non-financial performance. We look at the case of CEE countries, with specific data analyzed over eleven years. As our research strives to demonstrate in the following parts, and the literature review also revealed previous studies on either digital transformation, non-financial performance, or both, for CEE countries, there is a research gap that we intend to diminish. We argue that for these countries, raising awareness on the topic of our research is crucial for future strategy development that will enable a long-term sustainable development in the current rapidly evolving and regulated context.
In recent years, digital transformation has emerged as a critical concept in the organizational discourse, reflecting the profound changes determined by integrating digital technologies into various business processes. At its core, digital transformation involves the integration of digital technologies into all aspects of an organization, fundamentally altering how businesses operate and deliver value to customers.
However, the literature on digital transformation is extensive, and multiple definitions have been proposed, each emphasizing different aspects of this multifaceted phenomenon. At first, the concept was mainly used in the information system literature [1,2], concentrating on its technological dimensions, particularly the enhancement of operational processes within organizations. In time, as digital transformation extended beyond organizational confines, it drew interest from both management scholars and researchers from various disciplines that started to focus on the strategic, managerial, and organizational ramifications [3].
In order to capture the various definitions and approaches of the digital transformation concept, we synthetized our findings from the main literature review in Table 1 below.
After reviewing the definitions, we believe that digital transformation refers to the process of executing tasks in a novel, digital manner, intricately linked to the broader, in-progress phenomenon of the digital revolution that is gaining momentum. Consequently, the assessment tools and metrics employed are constantly evolving, with the specific literature encompassing a variety of indices designed to evaluate the advancement of the digital economy, from the Information Society Index (ISI, created in 1997) to, more recently, the Digital Economy and Society Index (DESI) proposed by the European Union [16,17]. Since 2014, DESI has served as a fundamental instrument for tracking and assessing the digital advancement of the European economy and society. In 2021, the primary indicators of the DESI were synchronized with the goals outlined in the 2030 Digital Agenda, encompassing four essential dimensions: human capital, connectivity, the integration of digital technologies, and digital public services [18]. In line with the topic of our paper and the current EU trends, in our research, we will use DESI and its components as metrics for digital transformation.
Our literature search revealed that there are previous studies in various CEE countries that have used DESI as a metric for assessing a country’s digital economy development [19,20,21]. As these studies focus only on the digital development of EU countries, while relevant and important in their endeavor, they cover only a facet of a broader and complex issue, namely assessing the impact of digital transformation on performance.
As underlined previously, the literature reveals that achieving success in implementing digital transformation requires a shift in organizational culture, where innovation and agility become central points of focus [22]. Therefore, the impact of digital transformation on enterprise performance is profound. As such, another focal point of our research is related to assessing performance, most specifically non-financial performance.
Traditionally, enterprise performance was assessed solely through financial metrics, such as profitability, sales, revenue growth, and return on investment, thus measuring the overall financial health of the business. As the business environment has become increasingly dynamic, these traditional performance measures have proven inadequate in effectively underlining the true firm performance and managers turned towards non-financial metrics that capture sustainable success [23,24]. Unlike traditional financial metrics, non-financial performance encompasses qualitative aspects that reflect an organization’s operational effectiveness, stakeholder engagement, and sustainability efforts [25].
Empirical research on non-financial performance is very broad and examines several issues from defining, dimensions, metrics, reporting on impact, interplay, and limitations. To encompass the diverse definitions and approaches related to the concept of non-financial performance, we have synthesized our findings from the primary literature review in Table 2 below.
As highlighted above, non-financial performance is defined in terms of qualitative metrics that extend beyond traditional financial indicators. Previous studies reveal an abundance of metrics widely accepted and used [25,34,35], with non-financial performance often categorized into components such as innovation performance, environmental, social, and governance (ESG) performance, working capital management performance, organizational resilience, and corporate market competitiveness.
ESG encompasses a range of criteria that assess a company’s ethical impact and sustainability practices, influencing not only financial outcomes but also stakeholder perceptions and market competitiveness while shaping long-term organizational outcomes [36,37,38]. The term first emerged in finance and targeted mainly business investors, but it evolved along with the development of sustainability practices at the firm level. With the adoption of the Sustainable Development Goals (SDGs), the need for effective measurement tools to evaluate corporate contributions to sustainable development arose. Relevant studies agree that ESG can serve as a framework for assessing corporate contributions to the SDGs [39,40,41]. By incorporating non-financial ESG indicators into enterprise value evaluation systems, companies can shift their focus from short-term profits to long-term sustainability goals, thereby contributing to the SDGs, as previous studies in CEE countries have argued [42,43,44,45,46].
The intersection of digital transformation, ESG criteria, and non-financial performance is increasingly relevant for organizations in Central and Eastern Europe, as organizations seek to align with global sustainability standards as well as EU and national reporting regulations.
CEE countries, having undergone significant transitions from centrally planned to market economies, present a distinctive case for examining the impact of digitalization on economic growth and innovation, particularly in the context of their unique historical, economic, and social landscapes. The economic structures of CEE countries exhibit commonalities that influence their digital transformation trajectories. Despite the progress made since their integration into the European Union, CEE nations still face structural weaknesses that hinder their competitiveness in the digital economy. Research indicates that these countries lag behind the EU average in various performance metrics, necessitating a focused approach to their digital development [47,48].
Additionally, ten countries in the region (Bulgaria, Croatia, the Czech Republic, Hungary, Latvia, Lithuania, Poland, Romania, Slovakia, and Slovenia) are considered “digital challengers” as they demonstrate strong potential for growth in the digital economy [49], further emphasizing the validity of a collective analysis.
Digital technologies have been identified as pivotal in enhancing business performance across CEE countries. Kahrović and Avdović [50] emphasize the resource-based view (RBV) as a framework for understanding how digital technologies can lead to superior performance and competitive advantage. Their findings suggest that the acceptance and integration of digital technologies in Serbian businesses have a measurable impact on various performance metrics, including operational efficiency and customer engagement. This aligns with the broader findings of Katz et al. [51] who developed a composite digitization index that captures multiple dimensions of digital adoption, including infrastructure investment and human capital. Their work underscores the importance of not only technology penetration but also its effective utilization in driving economic and social outcomes. Furthermore, Cieślik [52] discusses how advancements in ICT services, particularly in the context of Industry 4.0, have created new opportunities for CEE economies to leverage digital technologies for improved performance metrics.
In this context, our study aims to investigate the impact of digital transformation on the non-financial performance of CEE countries. Specifically, the study seeks to examine how digital transformation (measured through DESI and its components), including factors such as digital connectivity, digital capability, digital integration, and digital services, affects various non-financial performance indicators, such as environmental, social, and governance indicators.
Thus, in our research, we conducted a panel data analysis focusing on CEE countries. Specifically, we used a robust regression with Huber and biweight estimators for data compiled over an eleven-year period (from 2013 to 2023). Thus, we analyzed how digital transformation (measured through DESI and its components) impacts a range of ESG non-financial performance metrics (CO2 emissions, renewable energy consumption, ratio of female-to-male labor force participation rate, unemployment, regulatory quality, and government effectiveness).
For environmental performance, our findings show that enhanced connectivity in Central and Eastern European (CEE) countries plays a crucial role in fostering the integration of digital technologies and smart solutions across diverse sectors. This integration leads to improved operational efficiencies, which in turn reduces resource consumption and waste, ultimately contributing to lower CO2 emissions. Furthermore, by advancing digital transformation, these countries have the potential to achieve higher GDP per capita while simultaneously decreasing CO2 emissions, increasing the adoption of renewable energy sources and improving energy efficiency.
When examining the social performance of CEE countries, the results show that improvements in digital connectivity may unintentionally result in a decline in the female-to-male labor force participation ratio. This decline can be attributed to several factors, including job displacement in sectors where women are predominantly employed, mismatches between available skills and job requirements, difficulties in achieving work–life balance, and evolving dynamics within various industries.
The analysis of governance performance reveals that, although improving connectivity and human capital typically supports economic development, in Central and Eastern European (CEE) countries, such enhancements may unintentionally result in a decline in regulatory quality. This decline can be attributed to difficulties in adapting existing regulatory frameworks, limitations in institutional capacity, and potential political and economic pressures. Therefore, it is crucial to adopt a balanced approach that integrates digital advancement with strong regulatory practices to ensure that economic growth does not compromise regulatory integrity.
Based on these empirical findings, we conclude that, in order to foster the sustainable development of CEE countries, a comprehensive strategy that considers the interconnectedness of environmental, social, and governance factors in the context of digital transformation is needed.
Our study is both relevant and important as it tackles on an area of research that has garnered less focus in comparison to the impact on financial performance [25,53]. Understanding how digital transformation affects non-financial aspects, such as ESG, is crucial for a more comprehensive assessment of the benefits of digital transformation.
Furthermore, our study is focused on CEE countries, a region that has been undergoing significant digital transformation yet has attracted less research attention when compared to more developed economies [54,55]. Exploring the connection between digital transformation and non-financial performance in this context can provide valuable insights for policymakers and business leaders in the region. Also, by understanding the non-financial benefits of digital transformation, companies can better justify and prioritize their kindred initiatives, leading to improved overall performance and competitiveness [25,53].
We structured the paper as follows: Building on the literature review presented, in the next section we present a bibliometric study aimed at underlining the opportunity, originality, and novelty of our research area. Next, we describe the research hypotheses, data, and methodology. In the subsequent section, we present the results and discuss our analysis. Finally, we conclude by highlighting the contributions, limitations, and further research paths of our study.

2. Theoretical Background

Intending to align with the Sustainable Development Goals (SDGs), as well as to gain the credibility of all stakeholders, a growing number of companies are turning to business strategies that promote sustainable solutions. Additionally, more and more companies are choosing to publish sustainability reports, providing the public with information on environmental, social, and corporate governance issues. In order to ensure sustainable development, while increasing competitiveness generated by the progress of the business environment, digital transformation is producing essential changes in both business models and management practices [56,57]. In the process of adopting environmental, social, and governance (ESG) principles, companies are required to create new frameworks for conducting internal operations, thus increasing the pressure to comply with standards in a sustainable manner [58].
In order to evaluate the scientific literature, both quantitatively and qualitatively, with reference to the topic, we conducted a bibliometric study of articles indexed in the Web of Science (22 August 2024). The logical expression used to identify relevant references in the emerging areas: ((“digital transformation” and “performance” and ((business) or (firm) or (enterprise))), was executed at the topic level (titles, keywords, and abstracts). The result was a sample of 1928 scientific papers. After applying the exclusion criteria (type scientific papers: article; published in English), 1629 articles remained. The novelty of the research area streams from the publication timeline of the studies, with the first article dated March 2017. This article highlights how firms, in the context of digital transformation, should coordinate strategies for acquiring external knowledge and directing research and development expenditures with investments in information technology, in order to enhance their innovation performance [59]. Both the originality and the opportunity of the research lie in the fact that by adding “non-financial” to the search string: ((“digital transformation” and “performance” and “non-financial” and ((business) or (firm) or (enterprise))), only 20 articles were highlighted at the time of the query.
Bibliometric analysis is used as an important tool for evaluating and understanding the evolution and current state of research in a particular field. By applying statistical techniques to the analysis and interpretation of scientific publications, the main trends are identified, as well as the research gaps, and the conceptual structure and intellectual structure are explored, establishing future study paths. The conceptual structure of the research highlights the relationships that are established between digitalization and the non-financial characteristics of performance. The intellectual structure reveals the contributions of influential authors and emerging trends.
Using the VOSviewer software 1.6.19, maps are created by processing network data. Viewing and exploring the map created for term co-occurrence analysis synthesizes the perspective on the main themes addressed and trends in research on the topic. The terms will be extracted from title and abstract fields, choosing binary counting as a counting method. Of the 28,003 terms, retaining a minimum of 10 occurrences of a term, 881 terms meet the threshold. The top 529 terms selected are based on their relevance scores. In the co-occurrence network (Figure 1), the terms were structured in three clusters, corresponding to the research themes.

2.1. Research Theme 1: Digital Transformation—A Mediating Role Between Competitive Pressure and Company Performance, an Important Element in Restructuring Activities for Value Creation, and a Solution for Sustainable Development—Particularities During the COVID-19 Pandemic

Digital transformation can be considered the continuous process of adopting and integrating digital technologies that generate consequences on business models, as well as on the internal processes and external relations of an organization [60]. Digital transformation refers to technologies such as big data and predictive analytics, artificial intelligence, Machine Learning, Internet of Things (IoT), cloud computing, and process automation. In a broader sense, concepts such as digitalization, digital innovation, and emerging technologies are also used. Chen et al. [61] study the adoption of digital organizational restructuring, as well as the impact of this strategy on value creation. Bai et al. [62] perceive digitalization as an opportunity for the economic recovery of developing countries by implementing SME digital solutions to restructure their activity and become sustainable from an ecological and social perspective.
Cluster 1 (red) groups 247 terms, comprising the main aspects addressed in correlation with the elements that generate change in organizational operational processes pursuing sustainable development. Thus, from this perspective, the following main areas of incidence can be identified: business model, creation, business value, work, new digital technology, tool, skill, solution, decision-making process, globalization, innovation process, ecosystem, pandemic, and COVID.

2.2. Research Theme 2: The Impact of Digital Transformation on Non-Financial Performance

The non-financial performance of an organization tracks those aspects of performance that cannot be quantified in financial terms but which are of particular importance to long-term success, such as corporate social responsibility (CSR), employee satisfaction, customer satisfaction, internal process efficiency, organizational innovation, and organizational sustainability.
Cluster 2 (green) brings together 170 terms, highlighting the analytical framework of digital transformation that affects the ESG performance of the enterprise, both based on the investment perspective and by considering all stakeholders. Nicolescu and Nicolescu [63] draw attention to the fact that digital transformation and the transition to a smart economy, while ensuring a healthy environment, as well as all current trends manifesting at the level of society and the economy, create new opportunities, threats, and challenges for both companies and their stakeholders, positioning the management system in unprecedented situations, with a high degree of complexity and difficulty. Wang [64] studies the direct influence and mediating role that digital transformation has on the ESG performance of companies, while also highlighting the moderating effect of external environmental regulations in the case of listed companies in China. While considering Chinese companies with shares listed on the stock exchange, Li et al. [65] also conclude that digital transformation contributes to improving the company’s ESG performance to a large extent, playing an important role in guiding the investment strategy to ensure long-term economic growth under conditions of sustainable development.
In the context of the terms highlighted within the specialized literature, non-financial performance is studied mainly in the case of enterprises in China, the country with the highest production on the studied topic (658 out of a total of 1629 articles). He and Chen [66] highlight the importance of management strategies that link technological progress with the continuous development of employees, ensuring that their skills and competencies evolve in alignment with digital transformation. This approach improves work quality, contributing to increased ESG performance at the company level. Another study [67] confirms the role of digital transformation in enhancing ESG performance which, benefiting from the moderating role of information interaction, generates an increase in the value of companies.
The generosity of this thematic approach is noteworthy, binding the impact of digitization from both the perspective of its implementation within companies and the point of view of policy implications, digital infrastructure, environmental performance, innovation performance, and research and development, following the principles of corporate social responsibility.
For example, in their study about digital transformation and non-financial performance for the semiconductor industry, Kim and Cho [68] found that effective digital transformation enhances operational efficiency and competitive advantage, which aligns with the consensus in the literature on the importance of digital transformation for superior performance outcomes across various sectors. Similarly, research focused on the effects of digital transformation on both the financial and non-financial performance of companies within the tourism sector highlights the importance of engaging policymakers in the development and enforcement of relevant regulations [69].

2.3. Research Theme 3: New Business Models and the Involvement of Information Technology (IT) Solutions to Promote Sustainable Development

Cluster 3 (blue) groups 112 terms. Terms such as organizational capability, organizational agility, organizational resilience, government support, strategic orientation, and sustainable performance, guide us towards the central idea regarding the evolution of digital business models, facilitated by the integration of IT solutions, which pursue new directions of economic growth under sustainable conditions.
Currently, traditional business models are undergoing major transformations as a result of integrating innovative IT solutions and, at the same time, the promotion of sustainable economic development. New approaches integrate environmental, social, and governance factors, alongside economic growth, resulting in business models based on the principles of circular economy, characterized by responsible consumption and sustainable production processes. These models prioritize the efficient use of resources, the optimization of supply chains, and a reduction in waste. Sustainable business models protect the environment and contribute to the long-term well-being of society in general and the economic environment in particular, allowing for business performance to be achieved simultaneously with a positive societal impact in order to achieve the Sustainable Development Goals (SDGs) and meet the expectations of all stakeholders [70].
Information technology plays a very important role, facilitating the adoption of sustainable practices at the enterprise level. Digital transformation can be considered a determinant of sustainability as it provides the tools that can be used to optimize the use of resources, increase transparency, and create more efficient production and logistics systems. IT solutions (big data analytics, cloud computing and IoT, and blockchain) are currently used to improve environmental performance and the efficient tracking of sustainability parameters. Magableh et al. highlight the potential of big data analytics and blockchain technologies to support innovative business models, based on sustainable operations, with a favorable impact on ESG performance [71]. Kohtamaki et al. [72] explore digital business models (those innovative business models that enable connectivity) revealing the ways in which companies that use digital technologies, such as artificial intelligence (AI), generate and capitalize on added value. Their research “resulting in a parsimonious solution of four clusters of digital business model studies: (1) Digital business model innovation, (2) IOT business models, (3) Digital platform business models, and (4) Digital servitization business models.” [72] (p. 8).
The keyword is usually represented by a noun or an expression and indicates the complete semantics or the basic idea of a scientific study. With the help of the co-occurrence keywords analysis, research hotspots are identified in the studied topic. Of the 5794 keywords, when keeping a minimum of 10 occurrences of a keyword, 262 reach the threshold. In the co-occurrence network (Figure 2), the keywords were grouped into five clusters. For each cluster, we selected the relevant words for this research and used them in the study of the hypotheses. Cluster 1 (red) includes the terms: digital transformation, innovation, impact, entrepreneurship, digital economy, eco-innovation, sustainability, information, and sustainable development. Cluster 2 (green) consists of management, big data, Industry 4.0, blockchain, internet, artificial intelligence, and challenges. Keywords such as business, dynamic capabilities, competitive advantage, knowledge, and firm performance are found grouped in Cluster 3 (blue). Technology, model, digital leadership, digital strategy, adoption, behavior, and intention are words included in Cluster 4 (yellow). From Cluster 5 (purple), we retained the association between the keyword strategy, satisfaction, and transformation.
Table 3 presents the top 10 keywords with the strongest links, representing fundamental concepts of the studied field (the impact of digital transformation on business performance). These links indicate the relationship of each keyword to another. The strength of each link is a positive numerical value, with higher values indicating a stronger link. The total link strength indicates the total number of studies in which two keywords appear simultaneously [73].
The central node, “digital transformation”, has the highest total link strength (5947), underlining that this concept is intricately connected to numerous other topics within the research field, including “performance”, “innovation”, “impact”, “dynamic capabilities” and “management”. The terms “performance” and “innovation” are strongly connected to most of the keywords, with a large number of links and a high total link strength, suggesting that digital transformation is a determining element for improving performance and innovation at the organizations level. Based on the selected research, “technology”, “big data”, and “strategy” are recognized as having an important role in digital transformation. Table 3 reveals a clear picture of the knowledge structure of the studied field, positioning “digital transformation” in close connection with organizational performance, innovation, and the impact of technological changes on firms. The connections between these concepts can help understand future research paths in the field [74].
The analysis of country level co-authorship highlights collaborations between researchers from different countries, as well as knowledge flows between these nations. Based on this analysis, a network is built that reflects the collaborations established between researchers from different countries, with nodes representing each country, and the links within as common publications. Figure 3 reveals the 48 selected countries, grouped into seven clusters. Through this analysis, research trends and the dynamics of international collaboration can be followed, while also establishing the scientific impact and influence of different countries on a global scale [75]. Glänzel and Schubert [76] believe that collaboration networks between countries allow the identification of centers with potential for scientific innovation. Countries that are connected to multiple other countries through scientific collaborations (Figure 3 and Figure 4—China, USA, Italy, England, Germany, France, Spain, South Korea, and Australia) can be perceived as global leaders in the field of research, generating a significant influence on global scientific progress.
Bibliographic coupling, unlike co-authorship and co-citation analysis, allows the identification of new areas of interest in research on a particular topic, quantifying the relevance between two works based on their shared references [77]. While co-citation analysis focuses on cited references to understand the thematic history and progress in research in the field, bibliographic coupling takes into account primary documents to capture the newest topics addressed, offering the possibility of identifying future directions of study not yet explored [78]. The density of the network presented in Figure 4 compared to that in Figure 3 captures the increased intensity of international collaborations compared to the previous period, which is also attributable to the novelty of the subject matter.
The data underline that the most productive country in the studied field is China, with a number of 658 published articles, followed at a considerable distance by Italy (132 articles), the USA (109 articles), and England (107 articles). As for CEE countries, the results show that 140 articles were published overall, as follows: Romania (29 articles), Poland (25 articles), Czech Republic (21 articles), Slovak Republic (13 articles), Slovenia (13 articles), Hungary (12 articles), Croatia (12 articles), Lithuania (7 articles), Estonia (4 articles), Latvia (3 articles), and Bulgaria (1 article).
New business models supported by IT solutions play a key role in the global sustainable development agenda. By adopting emerging technologies, companies can reduce their environmental impact, increase their social responsibility, and improve their governance structures. Digital business models have the potential to accelerate progress towards the UN Sustainable Development Goals, creating the conditions for business development in a market environment with strict principles regarding competitiveness and responsibility. This dynamic highlights the importance of strategic innovation in achieving long-term sustainability in current business practices.
The articles in the study sample prioritize the sustainable development directions targeted by SDG 09 Industry Innovation and Infrastructure (n = 784), SDG 12 Responsible Consumption and Production (n = 202), SDG 04 Quality Education (n = 66), SDG 08 Decent Work and Economic Growth (n = 57), and SDG 13 Climate Action (n = 45) (Table 4).
The increased interest in publishing scientific papers that reveal aspects related to SDG 09 may be due to the fact that digital transformation plays a primary role in stimulating innovation and in modernizing infrastructure. Using digital technologies (IoT, AI, and cloud computing), industries can increase production efficiency, reduce costs, and create new business models. In the context of digital transformation, non-financial performance can be associated with enhanced innovative capacity, developing sustainable and resilient infrastructure and a more competitive attitude in the market. Through public and private investments in digital technologies, the process of implementing sustainable industrial practices is accelerated, thereby enhancing support for research and development and, implicitly, fostering economic growth.
Digital technologies, through intelligent systems, data analysis, and the implementation of circular economy models, contribute to a more efficient management of all categories of resources. Production can become more sustainable through digitalization, as product life cycles can be monitored, waste can be reduced, and supply chains can be optimized. From a non-financial perspective, these solutions, which represent a more responsible and sustainable approach to consumption and production in line with the provisions of SDG 12, contribute to improved environmental conditions, better corporate governance, and increased trust among all stakeholders.
The digital transformation in the educational process has facilitated access to learning opportunities (online courses, digital platforms, and collaboration tools). Access to education is becoming more inclusive and equitable. The moderating role of human capital in achieving non-financial performance, reducing the digital divide, and promoting a culture of lifelong learning, as well as greater social mobility, allow alignment with the requirements of the digital economy, responding to SDG 04.
Overall, digital transformation contributes to achieving Sustainable Development Goals by promoting new business models and practices, ensuring social equity and improving the efficiency and transparency of organizations across all industries.

3. Research Hypotheses, Data, and Methodology

3.1. Research Hypotheses

Considering our research focus and overall objectives, derived from our previous theoretical background analysis and initial observations, we next proceeded in formulating the research hypotheses by examining the specific relevant literature and frameworks.
Recent studies have explored the targeted relationship through diverse methodologies, providing insights into how digital transformation influences areas such as innovation, organizational resilience, and market competitiveness.
One notable study by Dai and Fang [25] investigates the impact of digital transformation on non-financial performance in the manufacturing sector. The research categorizes non-financial performance into five components: innovation performance, ESG (environmental, social, and governance) performance, working capital management, organizational resilience, and market competitiveness. Other studies employ a mixed-methods approach, combining qualitative insights with quantitative data to underline how non-financial performance can be enhanced through effective digital strategies [54]. The research of Yang et al. [53] focuses on the influence of digital transformation on corporate ESG performance utilizing a quantitative methodology to analyze the relationship between digital initiatives and ESG outcomes.
A study by Esses et al. [79] highlights the relationship between digital transformation and sustainability within the Visegrad Group, which includes several CEE countries. The authors argue that digitalization can significantly impact socio-economic and environmental sustainability, although the effects vary across different regions. This aligns with findings from Hilali et al. [80] who propose that digital transformation can enhance sustainability commitments through improved operational processes and business models. These studies collectively suggest that the adoption of digital technologies can lead to more efficient resource management and reduced environmental footprints in CEE countries.
Feroz et al. [81] further elaborate on the broader implications of digital transformation for environmental sustainability, proposing a framework that encompasses pollution control, waste management, and sustainable production. This framework is particularly relevant for CEE countries, where industrial practices often lag behind Western standards. The potential for digital transformation to drive improvements in these areas is significant, as evidenced by the positive relationships identified between digital initiatives and sustainability outcomes.
H1. 
There are significant direct implications of digital transformations (mainly through the connectivity component of DESI and the integration of the digital technology component of DESI) upon the environmental performance of Central and Eastern European countries.
The interplay between digitalization and competitiveness is particularly significant, as evidenced by Hurduzeu et al. [82], who conducted a panel data analysis distinguishing between Central and Eastern European countries and their Western counterparts. Their findings indicate that digital development is closely tied to socio-economic factors, suggesting that as these countries enhance their digital capabilities, they also improve their overall competitiveness and social performance.
Zolkover et al. [83] provide additional insights into the benefits and risks associated with digital business transformation in Eastern Europe. Their quantitative evaluation reveals that effective digital transformation strategies can lead to improved business outcomes, which in turn positively affect social performance by creating jobs and enhancing service delivery. This aligns with the broader narrative of digitalization as a driver of socio-economic progress in the region.
Furthermore, the analysis by Wozniak-Jechorek [84] on the economic reforms in CEE countries post-EU accession highlights the continuous shift in resources towards higher productivity sectors, facilitated by digital advancements. This transformation not only enhances economic performance but also fosters social cohesion by addressing inequalities and improving access to services.
H2. 
There are significant direct implications of digital transformations (mainly through the human capital component of DESI, the connectivity component of DESI, and the digital public services component of DESI) upon the social performance of Central and Eastern European countries.
One of the critical aspects of digital transformation in CEE countries is its role in facilitating participatory governance. Istenič and Kozina [85] highlight that participatory governance mechanisms, which have been promoted within the EU, are essential for motivating active citizenship and improving public policy outcomes in post-socialist contexts.
This aligns with the findings of Meyer-Sahling and Van Stolk [86] who discuss the Europeanization of the central government in CEE, suggesting that the adoption of EU governance standards has led to significant changes in public administration practices. The introduction of digital tools has further supported these changes by enabling more effective communication between governments and citizens, thereby fostering a culture of accountability and responsiveness.
Moreover, the impact of digital transformation on governance quality is underscored by Wang et al. [87] who provide empirical evidence that digital transformation enhances the quality of governance, particularly in the context of environmental, social, and governance (ESG) criteria. This dynamic perspective on governance improvement through digital means is crucial for understanding how CEE countries can leverage technology to enhance their governance frameworks.
H3. 
There are significant direct implications of digital transformations (mainly through the human capital component of DESI, the connectivity component of DESI, and the digital public services component of DESI) upon the governance development of Central and Eastern European countries.
Additionally, the role of the digital government in promoting the digital transformation of enterprises is explored by Li and Xu [88] who discuss how urban big data initiatives can optimize the business environment and reduce information search costs, thereby facilitating economic growth and governance improvements.

3.2. Data and Methodology

3.2.1. Data

Relying on the main findings from the literature and the research objective of our study, the data are disposed in two groups of indicators that target digitalization and sustainable economic performance credentials. The indicators were extracted from the World Bank for environmental, social, and governance indicators and the Digital Agenda—European Commission and Digital Scoreboard for the Digital Economy and Society Index. Comprehensive coverage [89,90], policy relevance [90], reliability, and standardization [89], as well as accessibility [89,90], make the World Bank and European Commission data highly suitable for panel data analysis regarding non-financial indicators and digital transformations of CEE countries.
A substantial effort was undertaken to collect pertinent data from official sources over extended periods, which is crucial for highlighting the scale of public governance and digitalization processes. The limited availability of data for specific indicators poses a common challenge in similar empirical studies. Additionally, we placed particular emphasis on the methods of data analysis and processing; robustness checks and validation procedures were implemented to ensure that the selected variables were appropriate for the models we constructed and effectively captured the relationships and impacts between digitalization and the non-financial performance of the countries studied.
The dataset includes indicators for the CEE countries collected for the 2013–2023 timeframe, with the following groups of variables:
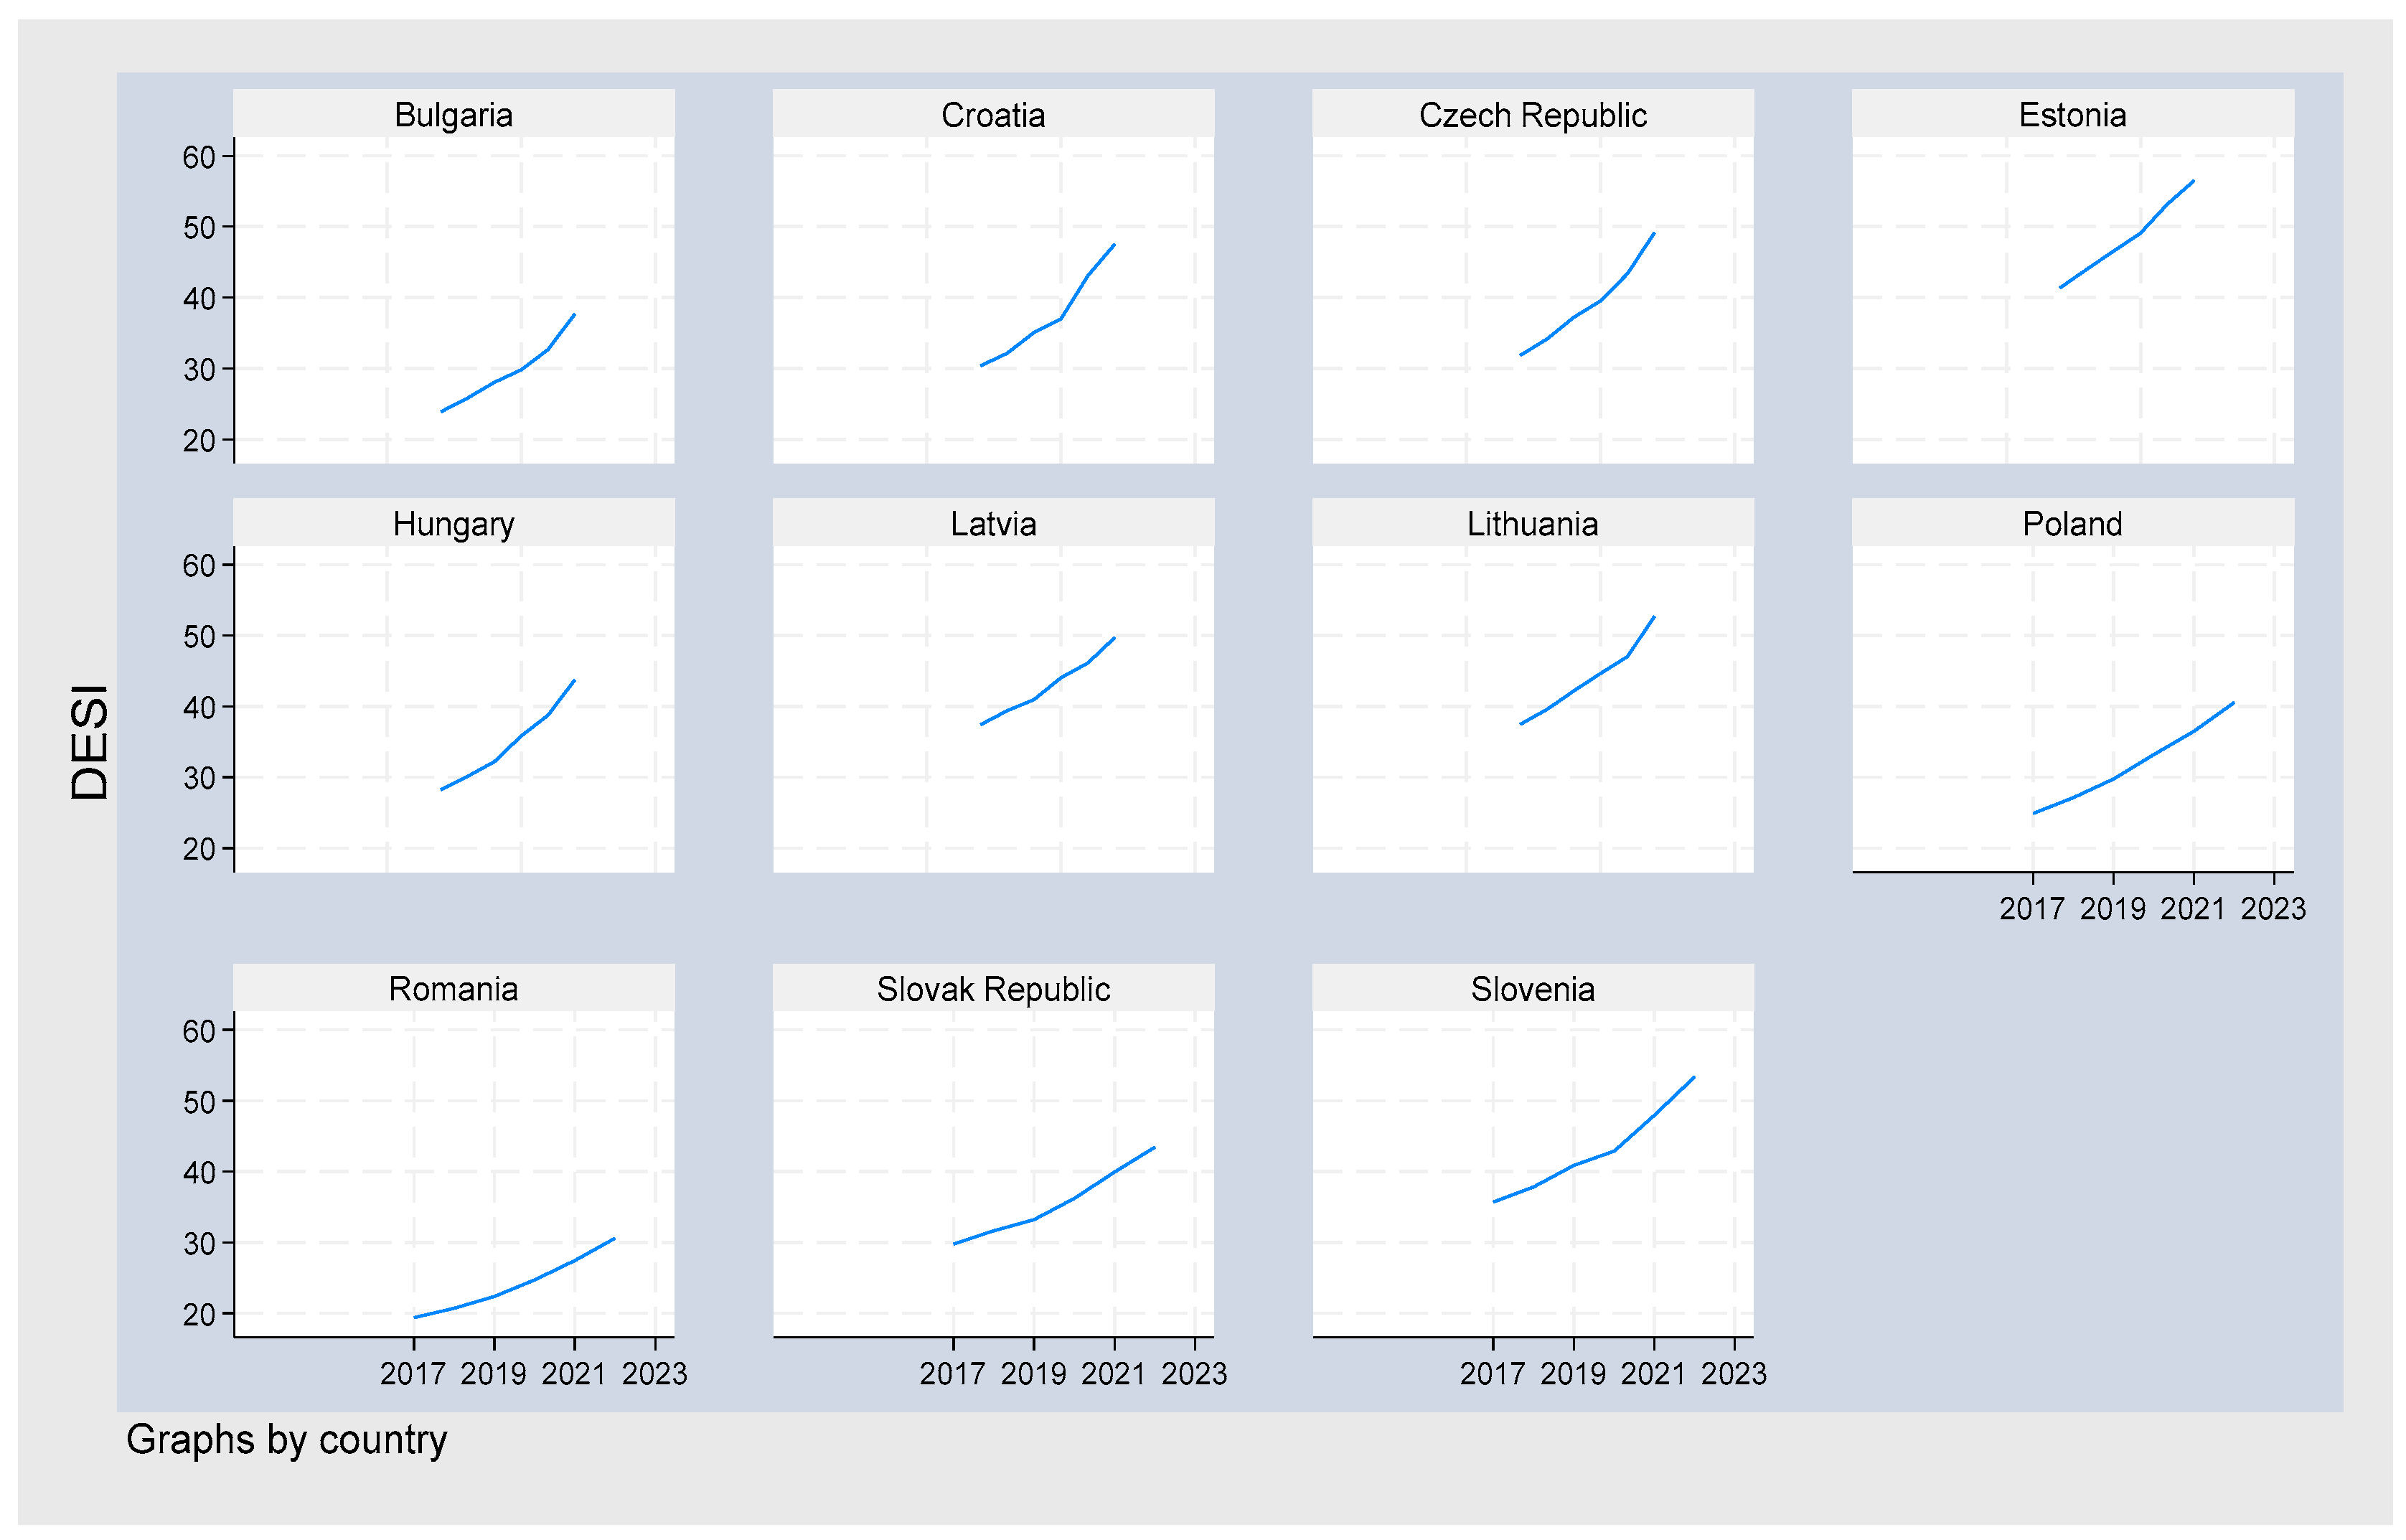
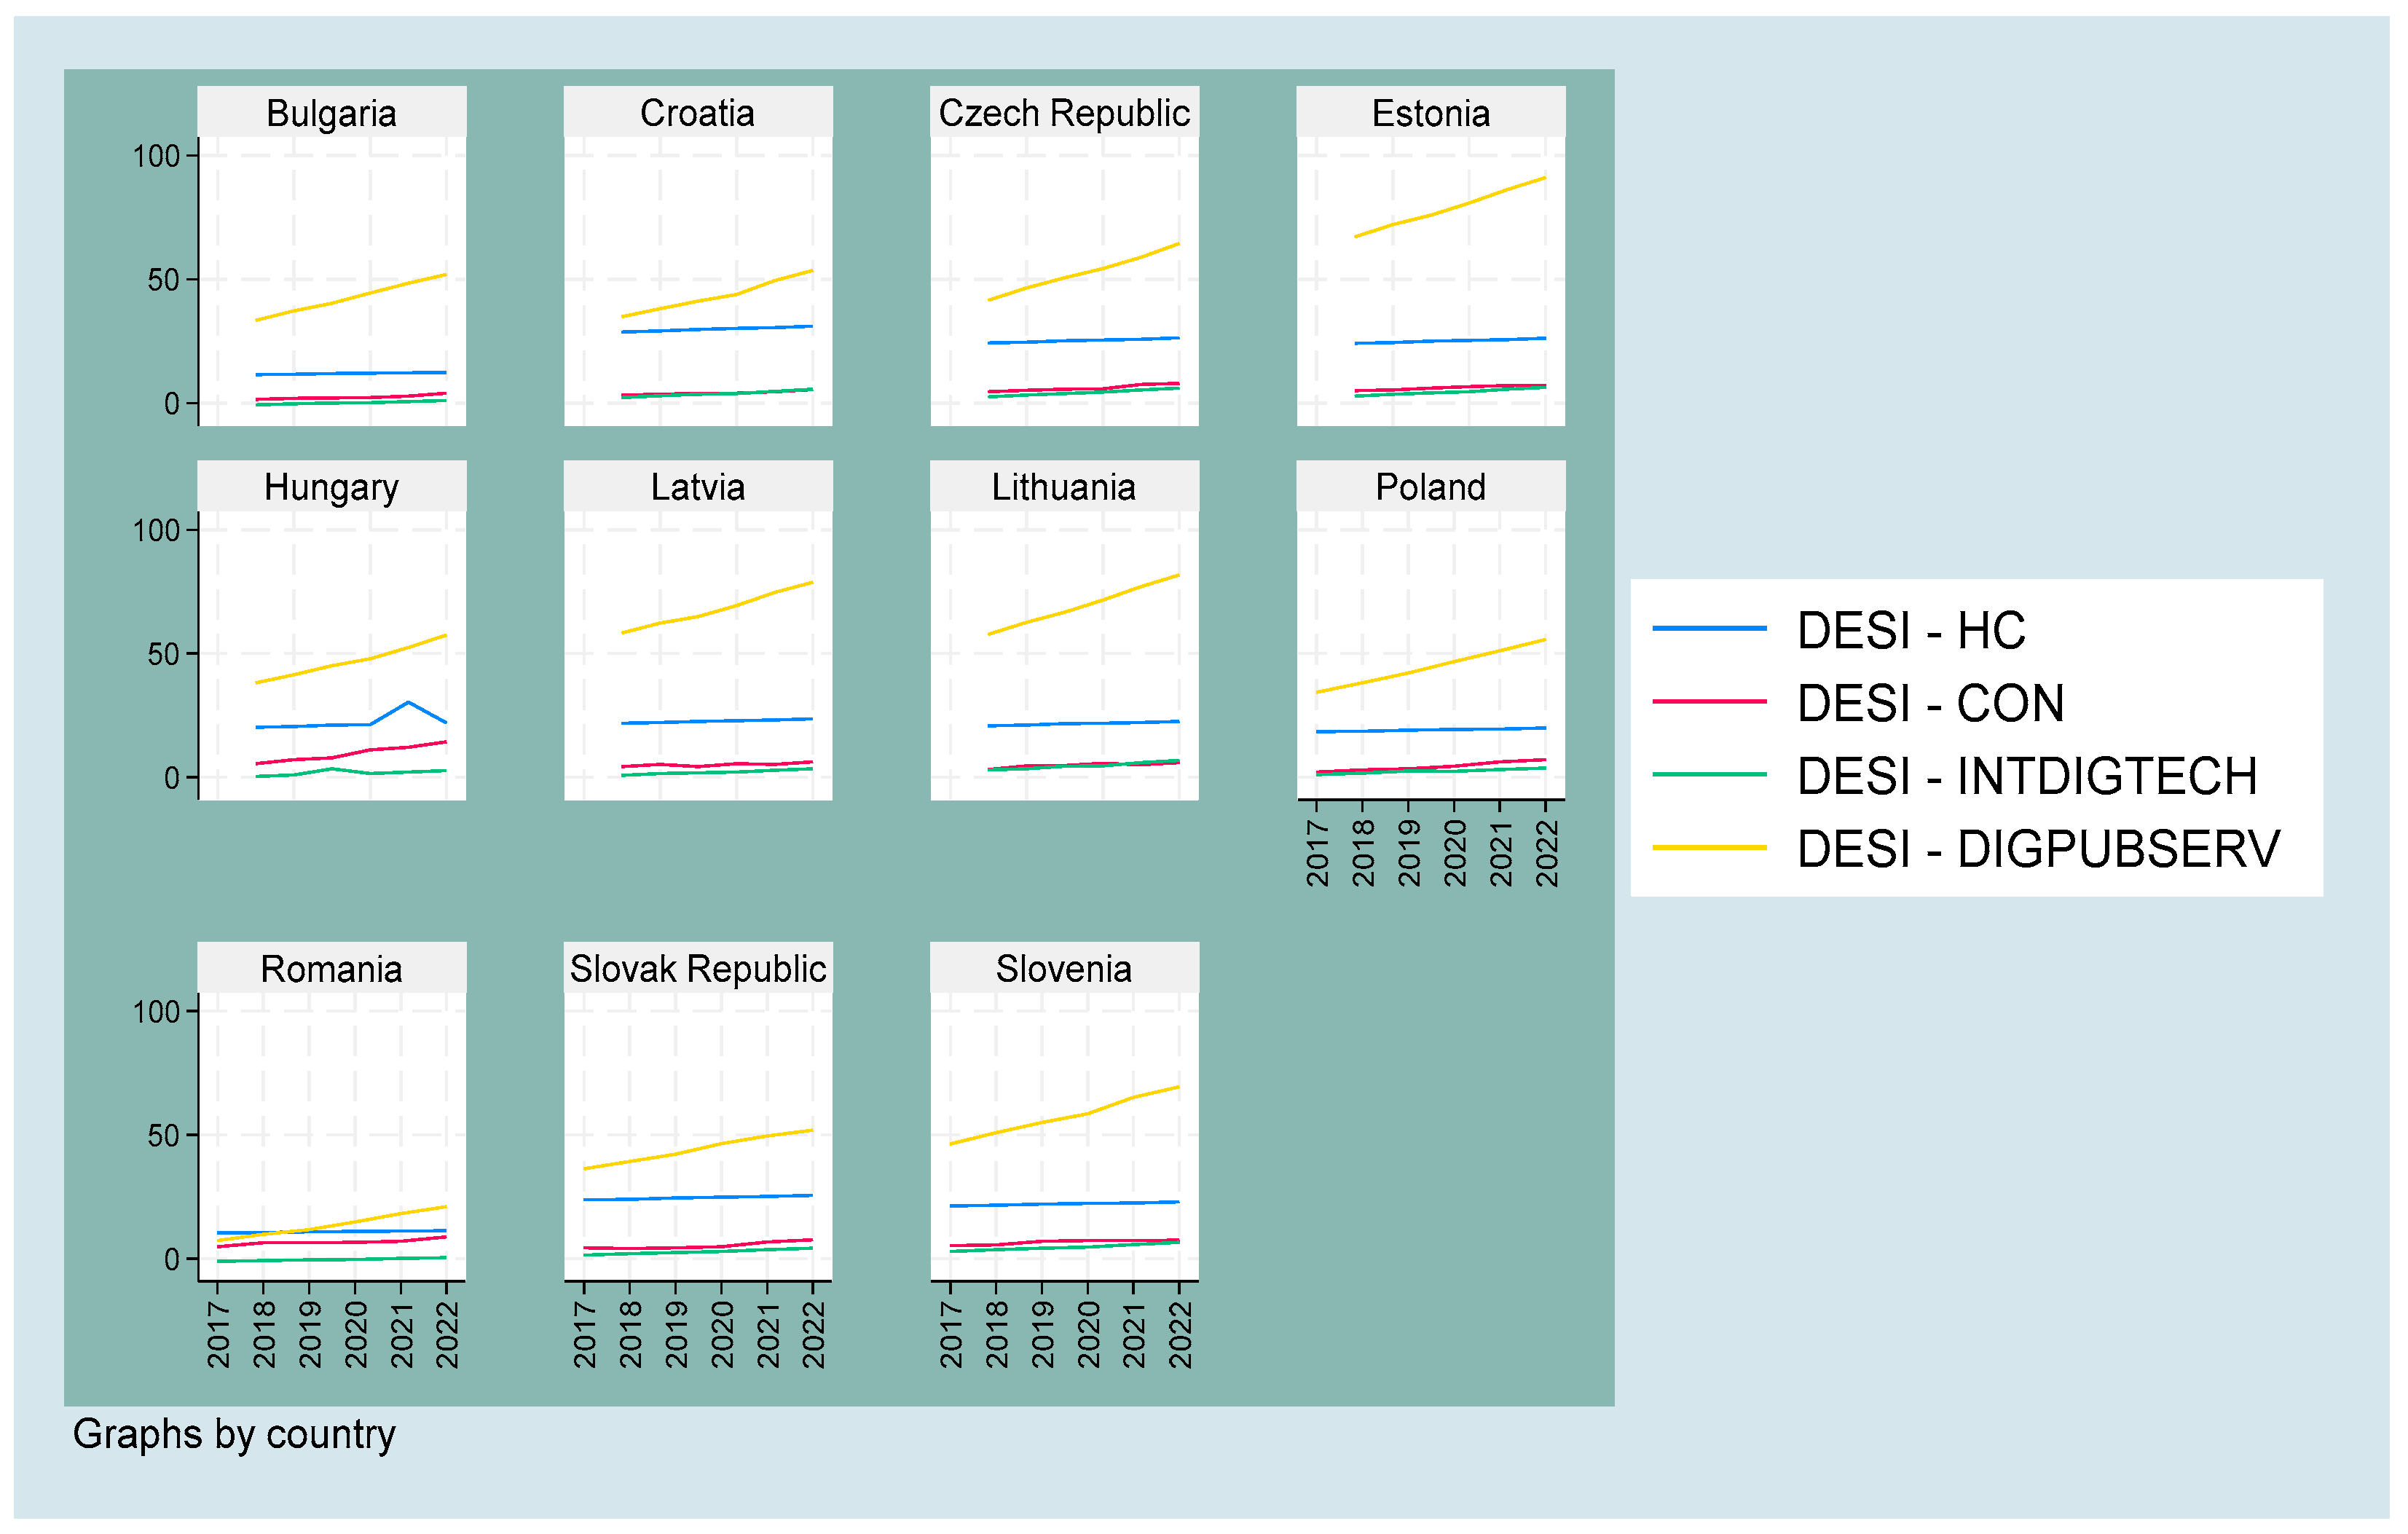
  • Digital transformations: Digital Economy and Society Index (desi); DESI—human capital (desihc); DESI—connectivity (desicon); DESI—integration of digital technology (desiintdigtech); DESI—digital public services (desidigpubserv);
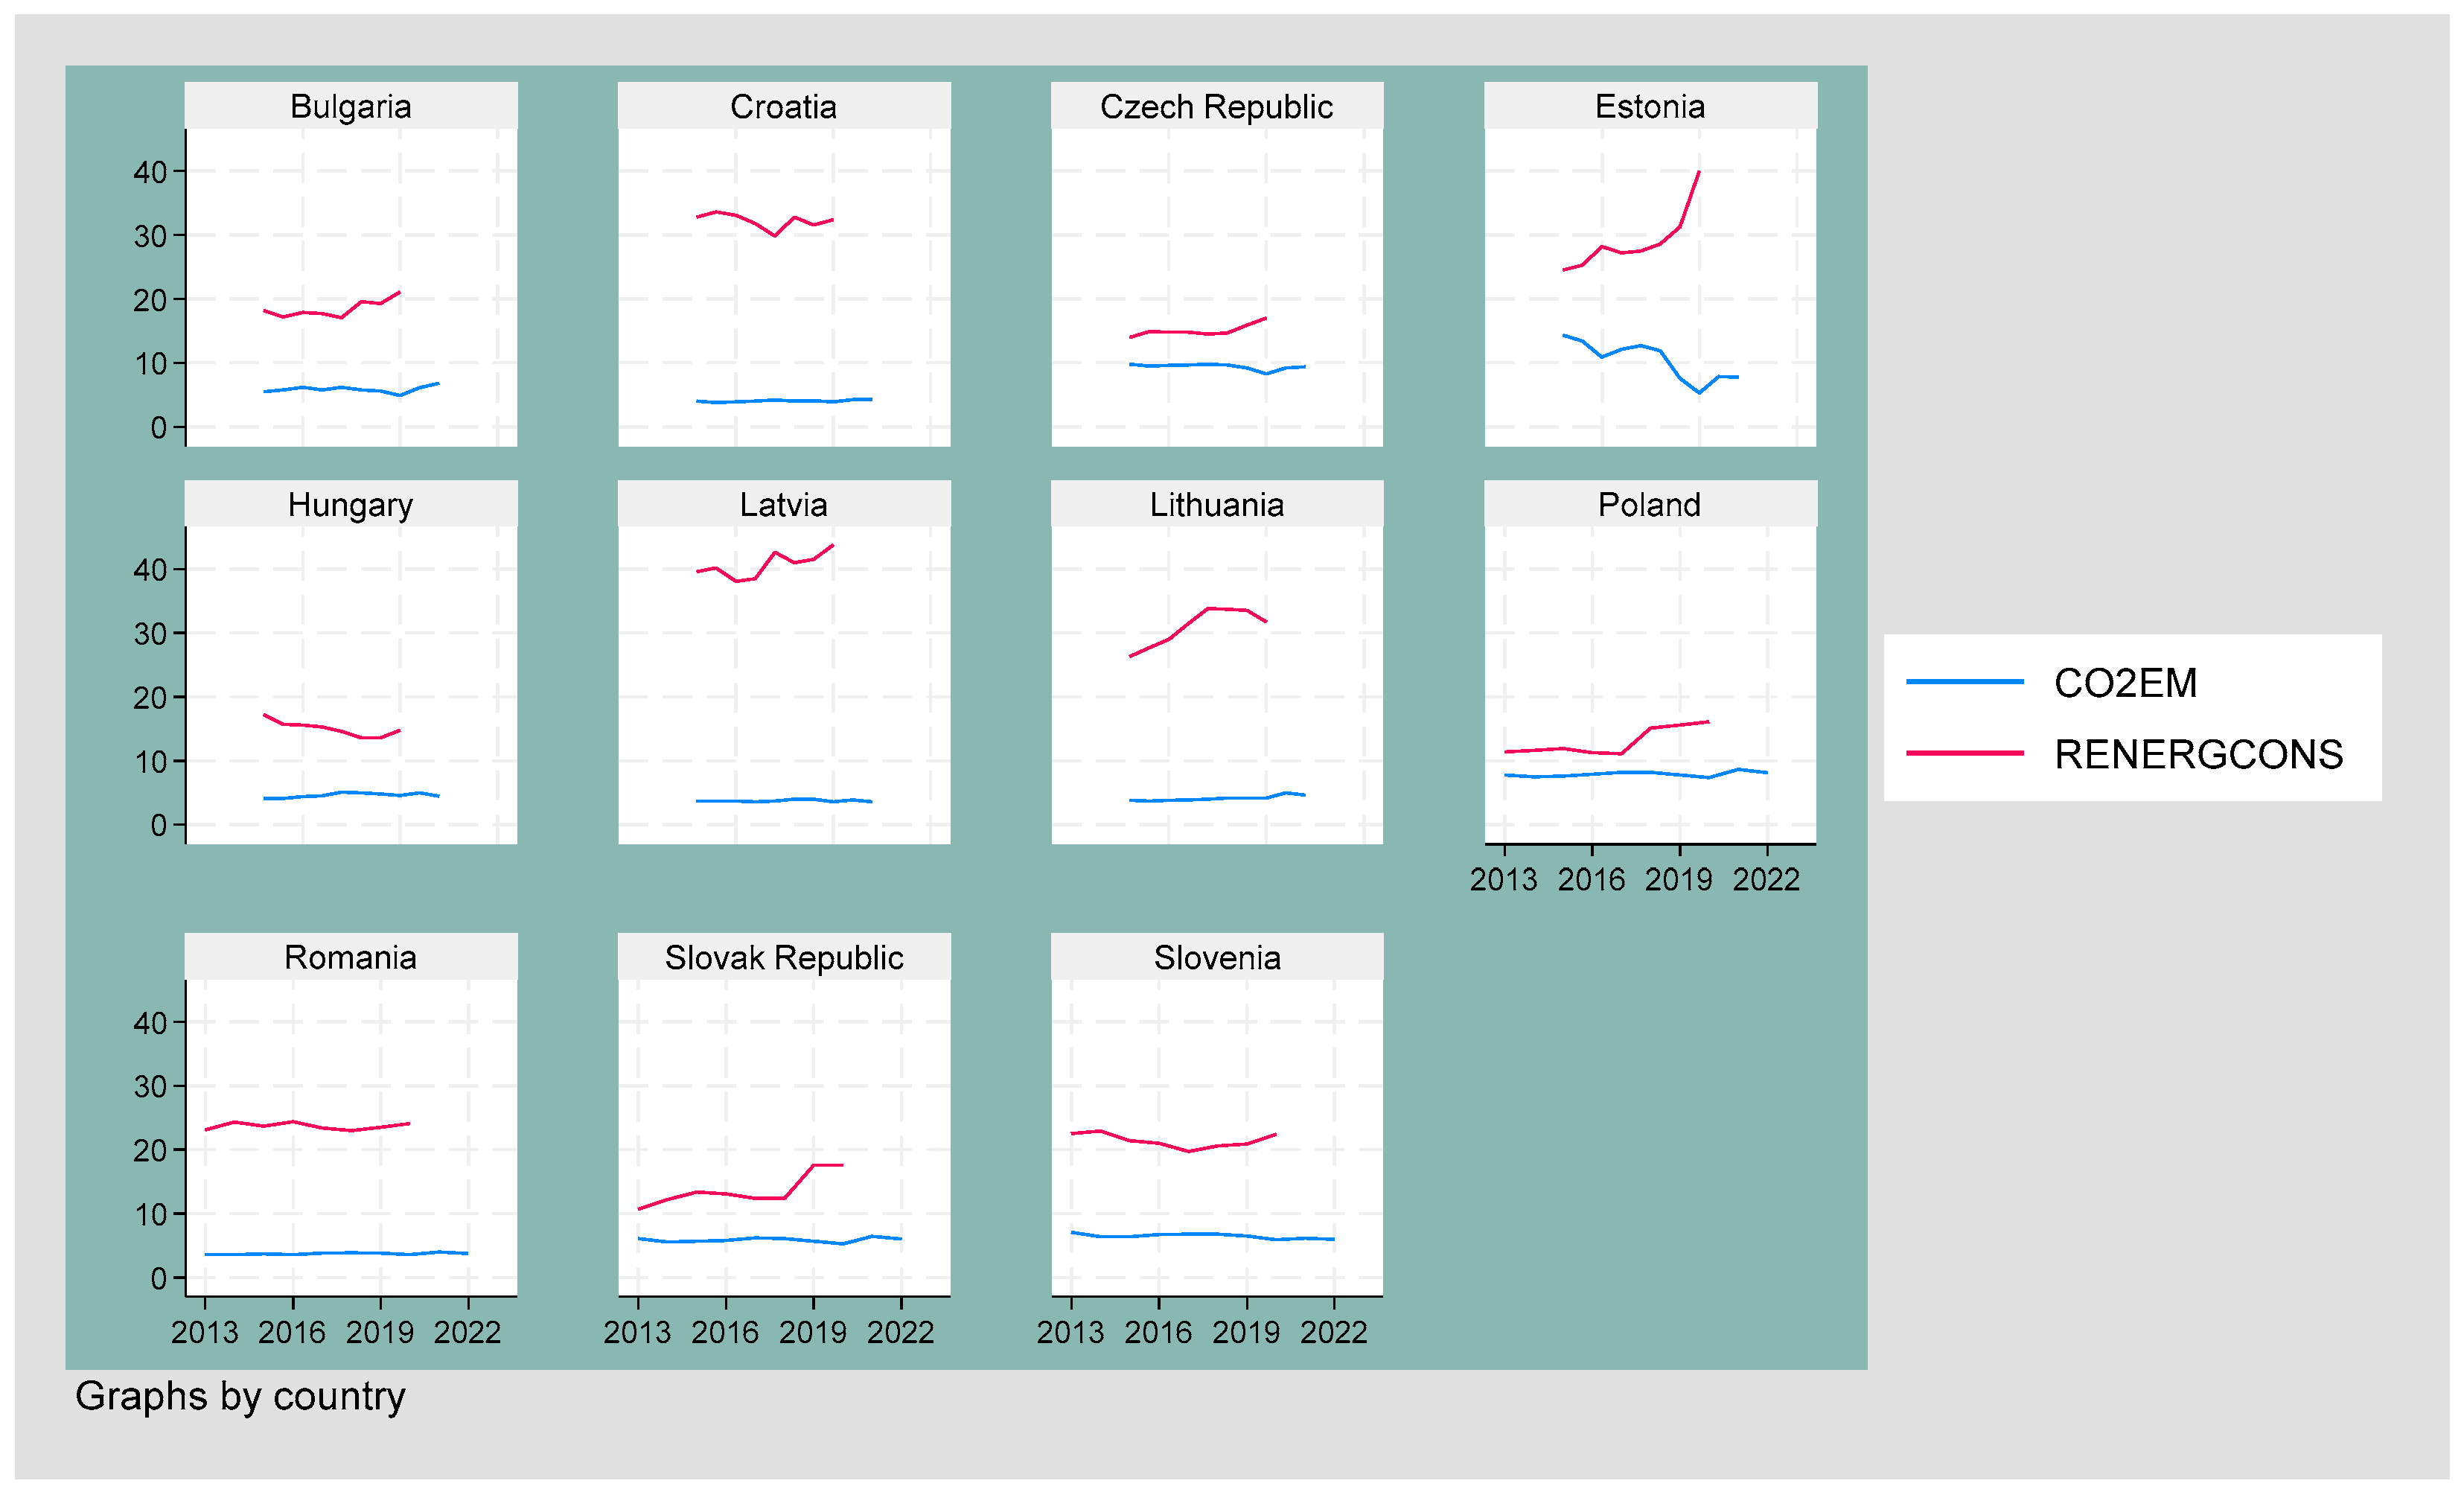
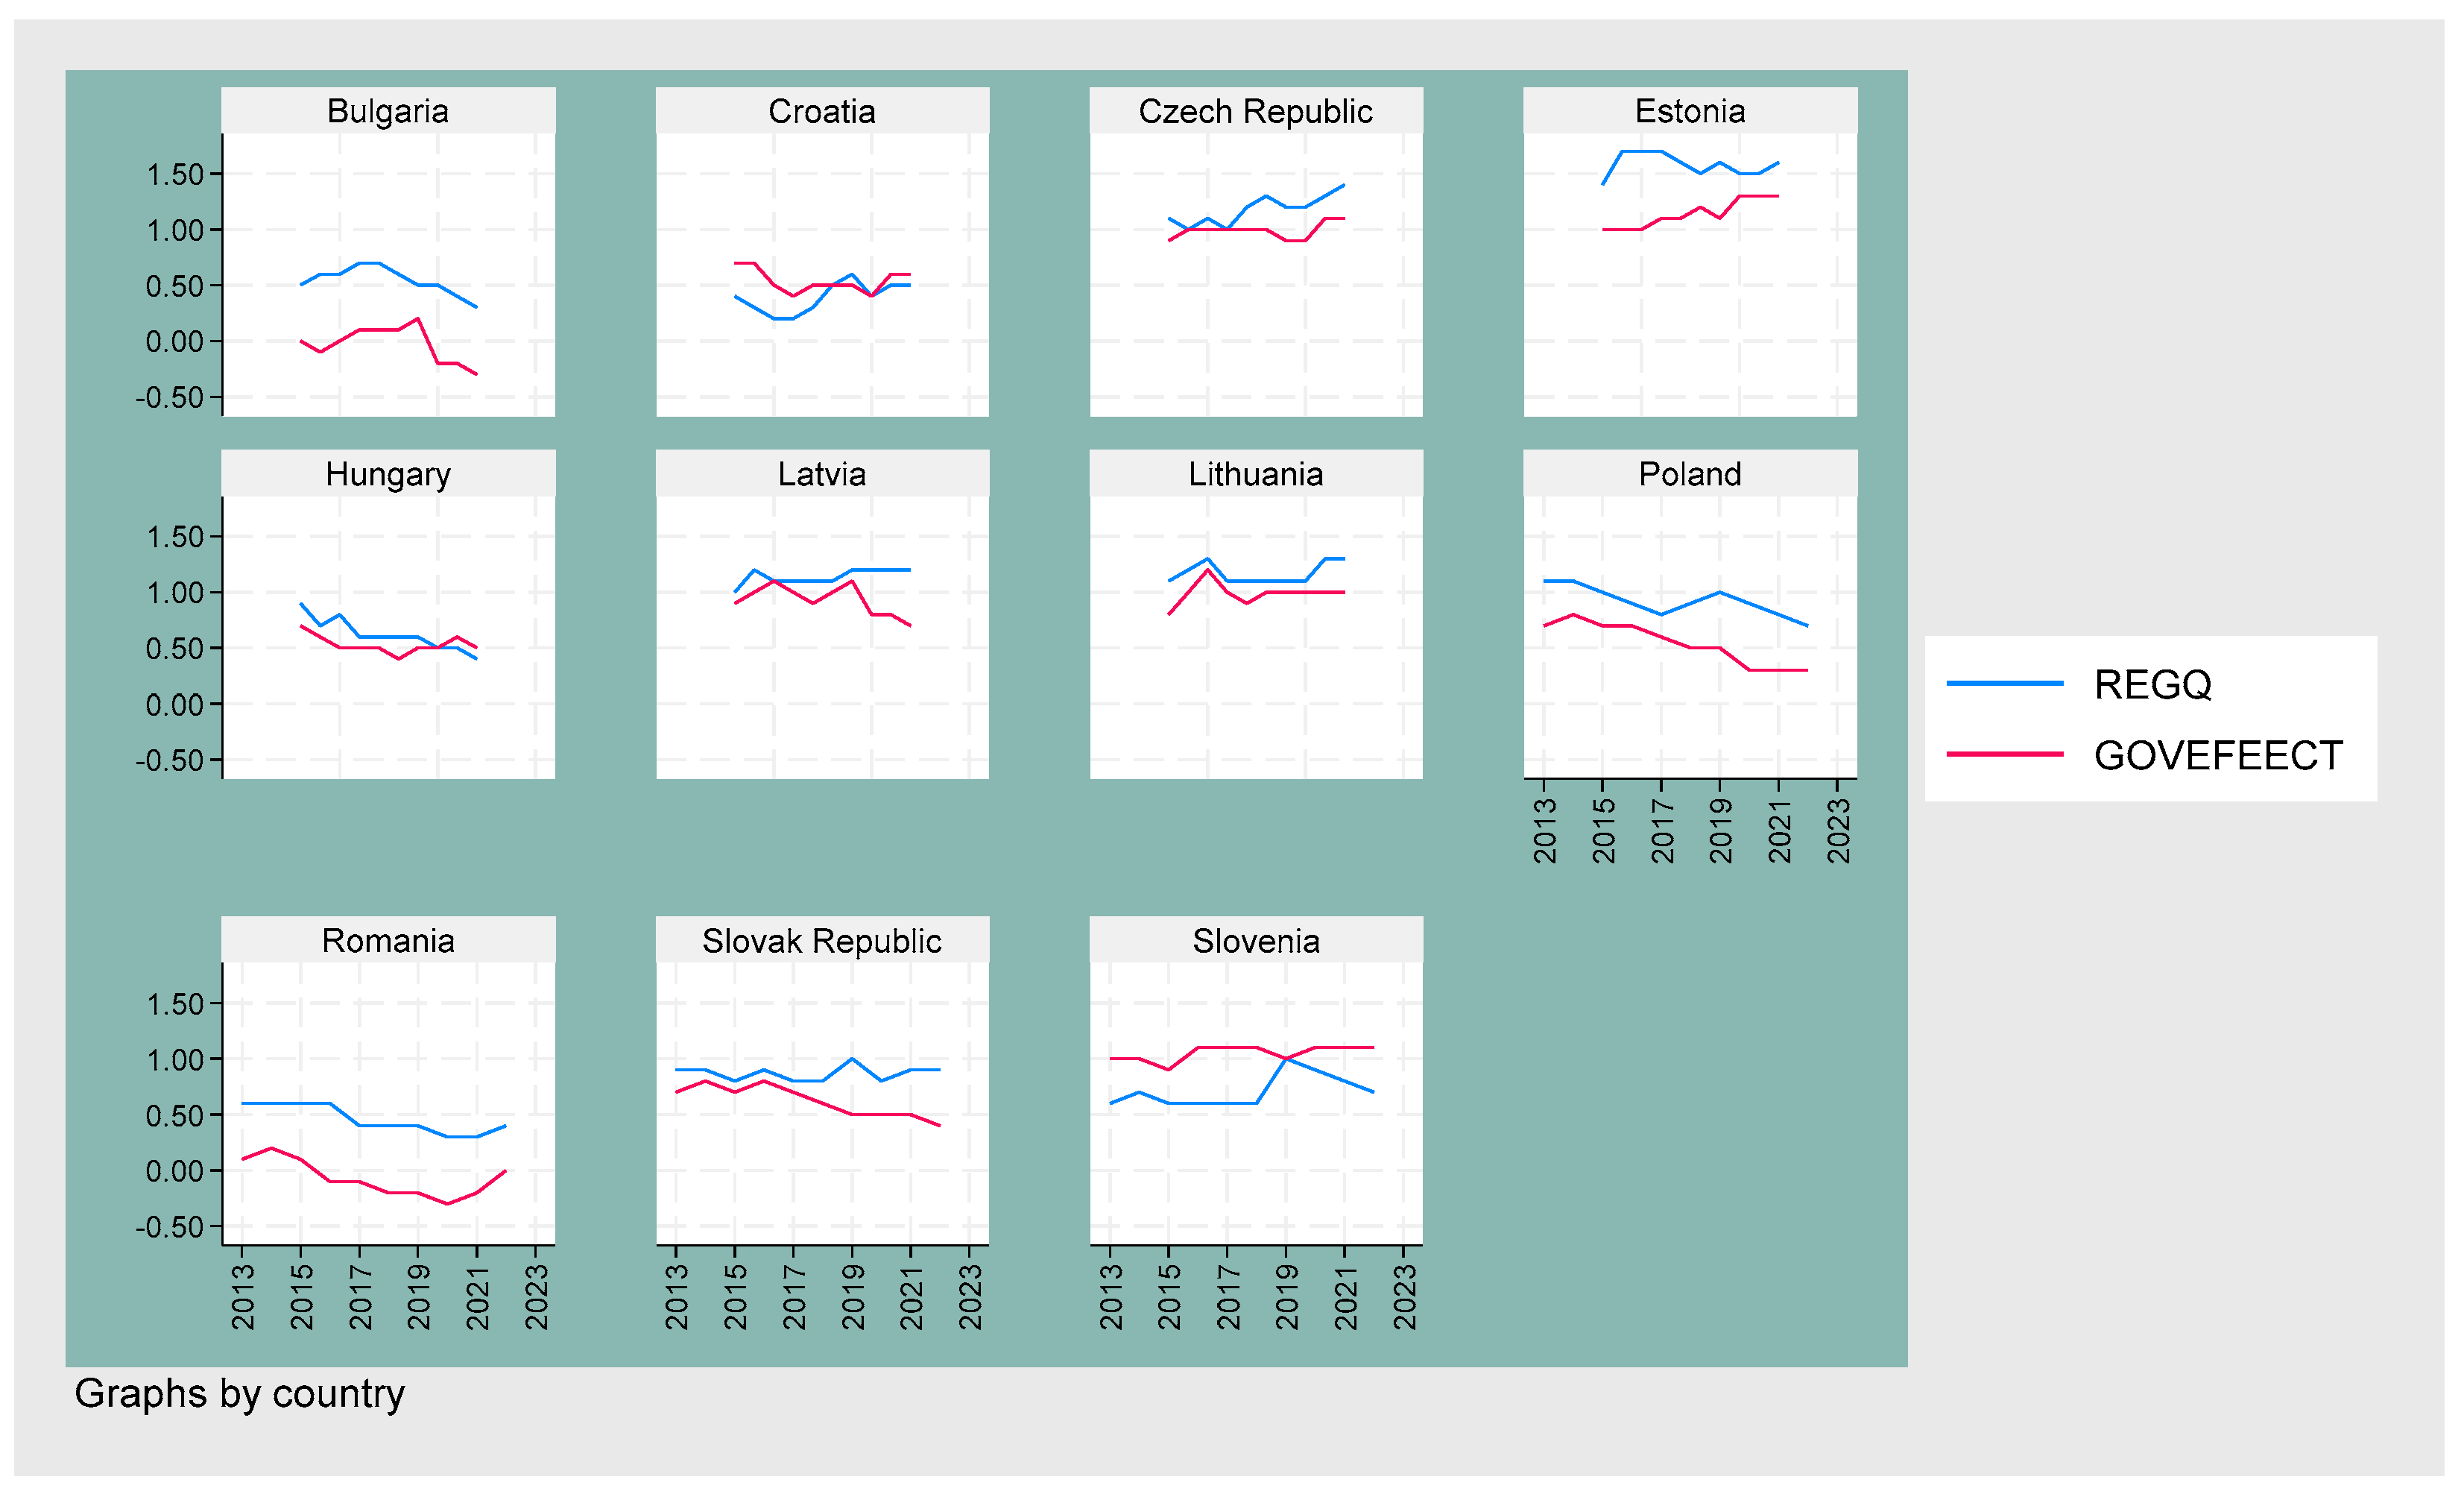
  • Sustainable economic performance indicators (environmental, social, and governance data—ESG): environmental—CO2 emissions (CO2EM) and renewable energy consumption (renergcons); social—ratio of female-to-male labor force participation rate (labforfm) and unemployment (unempl); governance—regulatory quality: estimate (RQ.EST) (regq) and government effectiveness: estimate (goveffect);
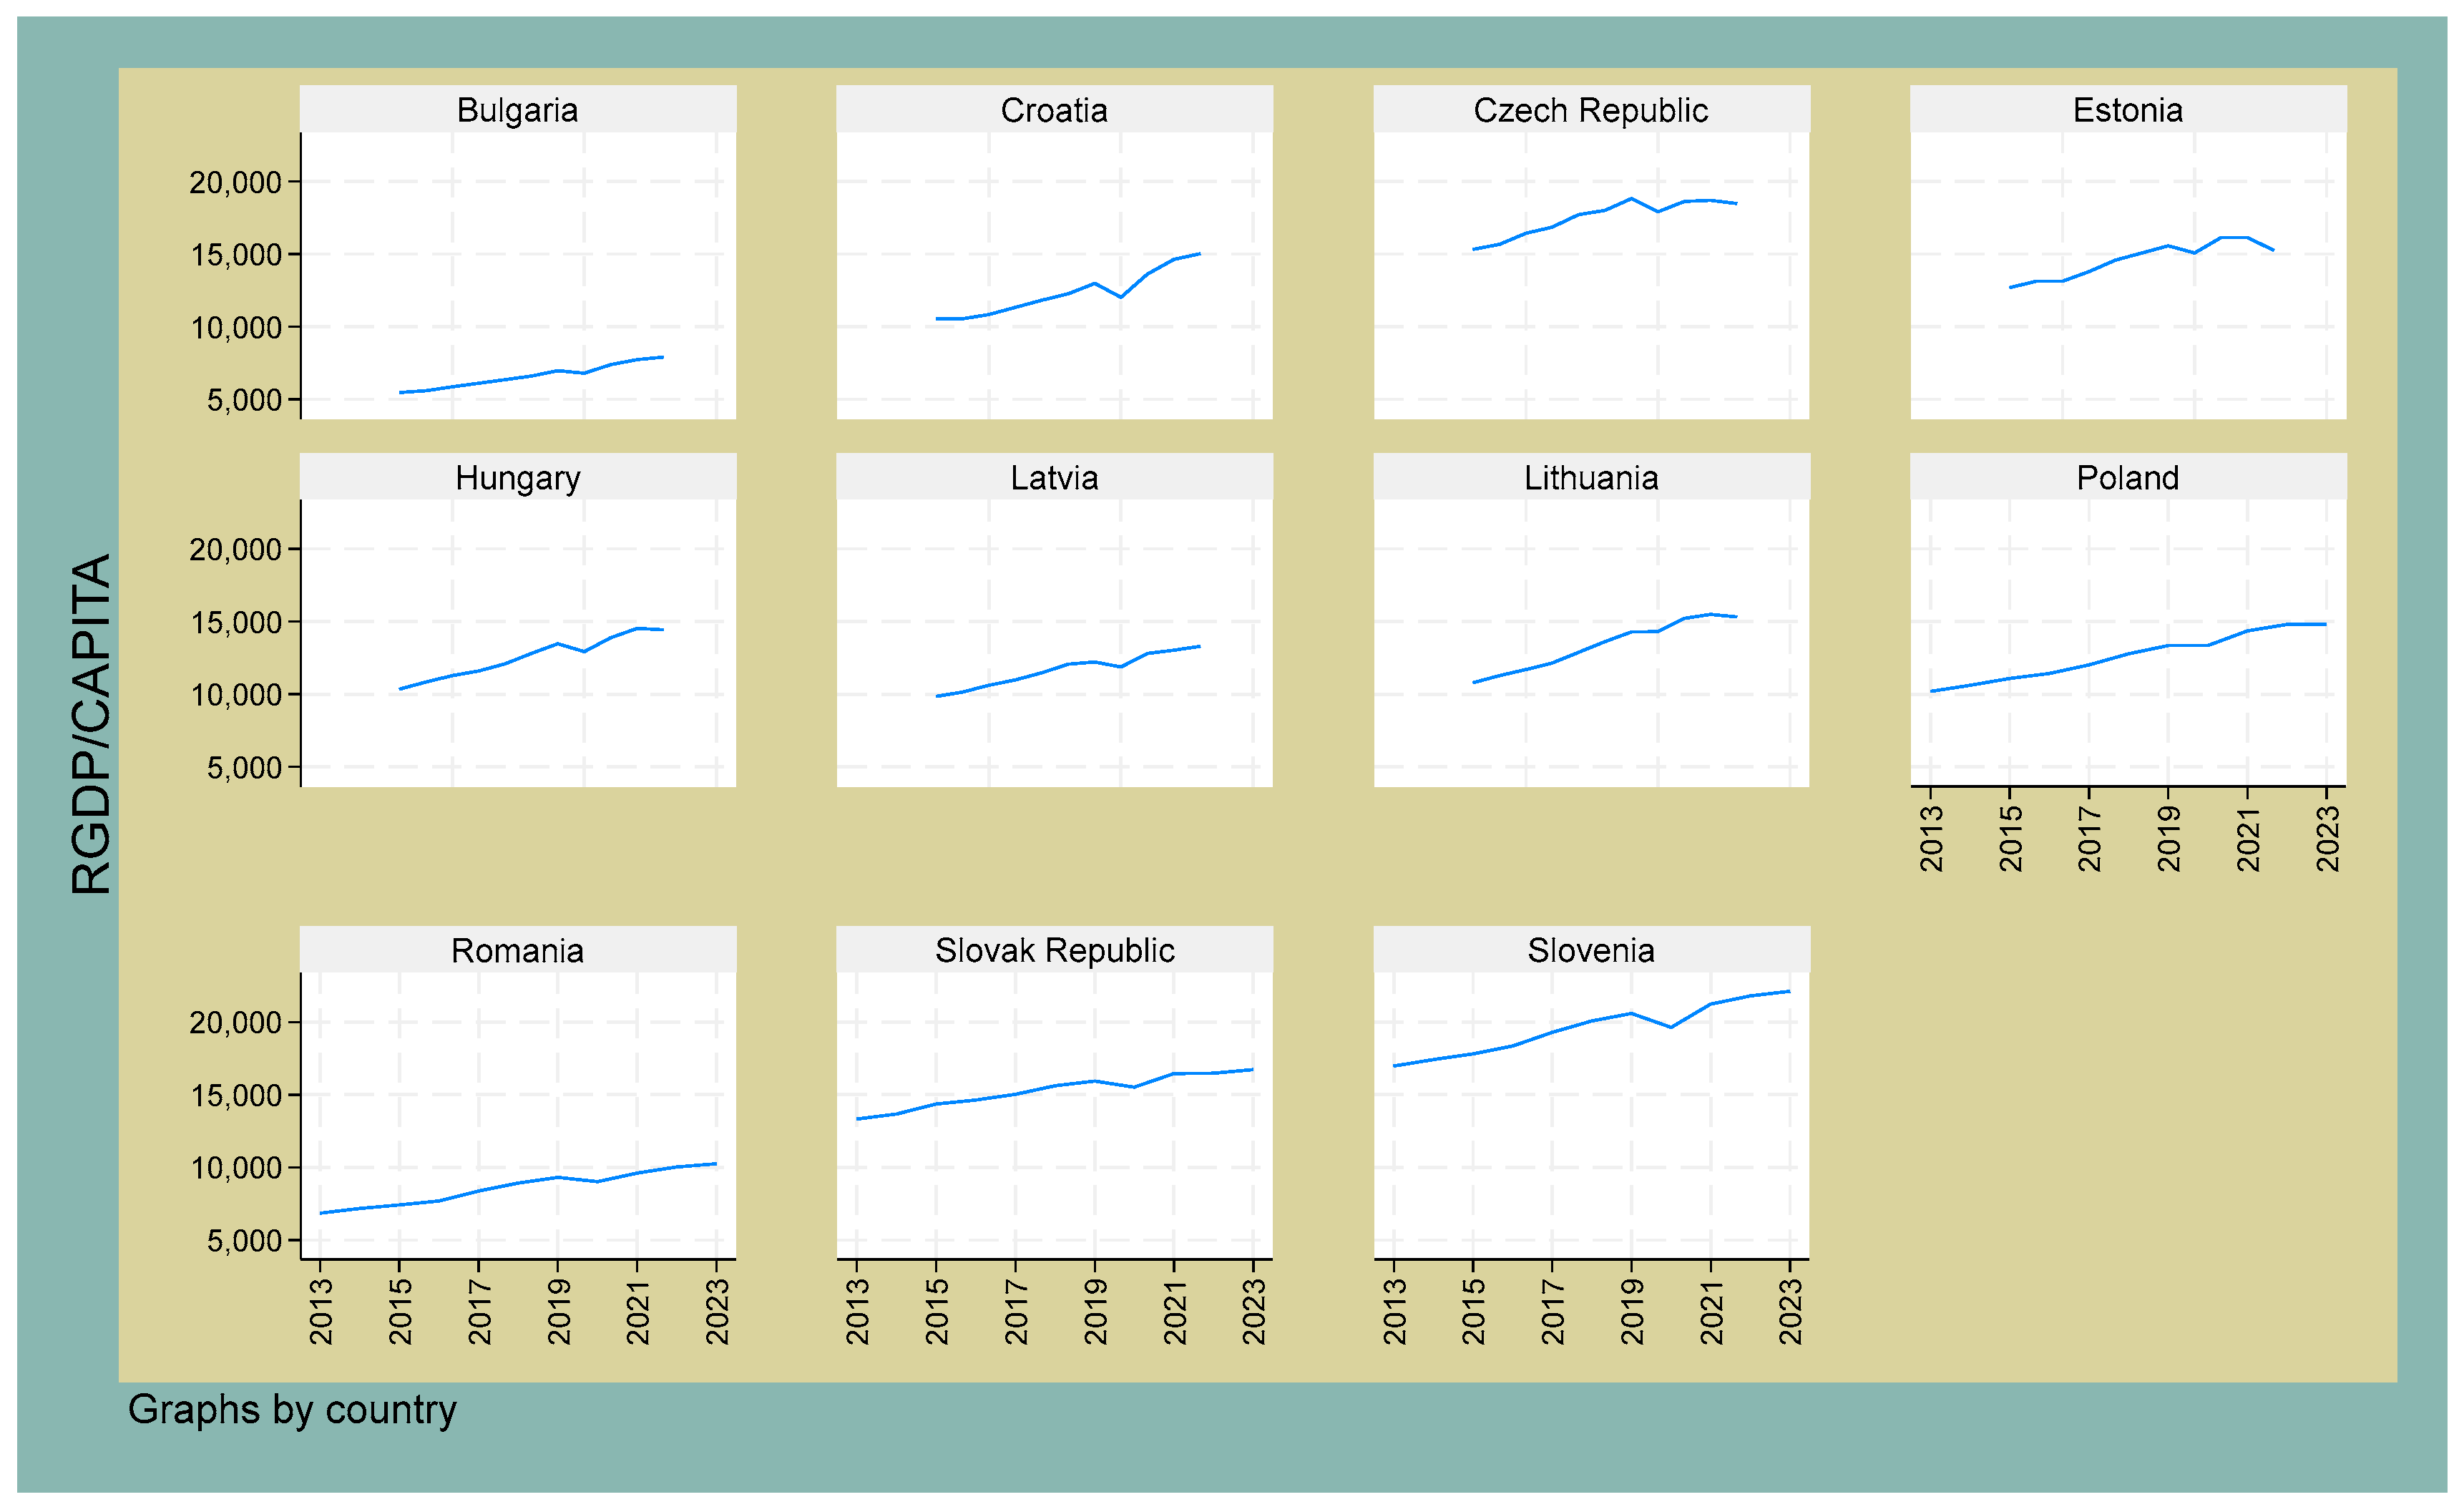
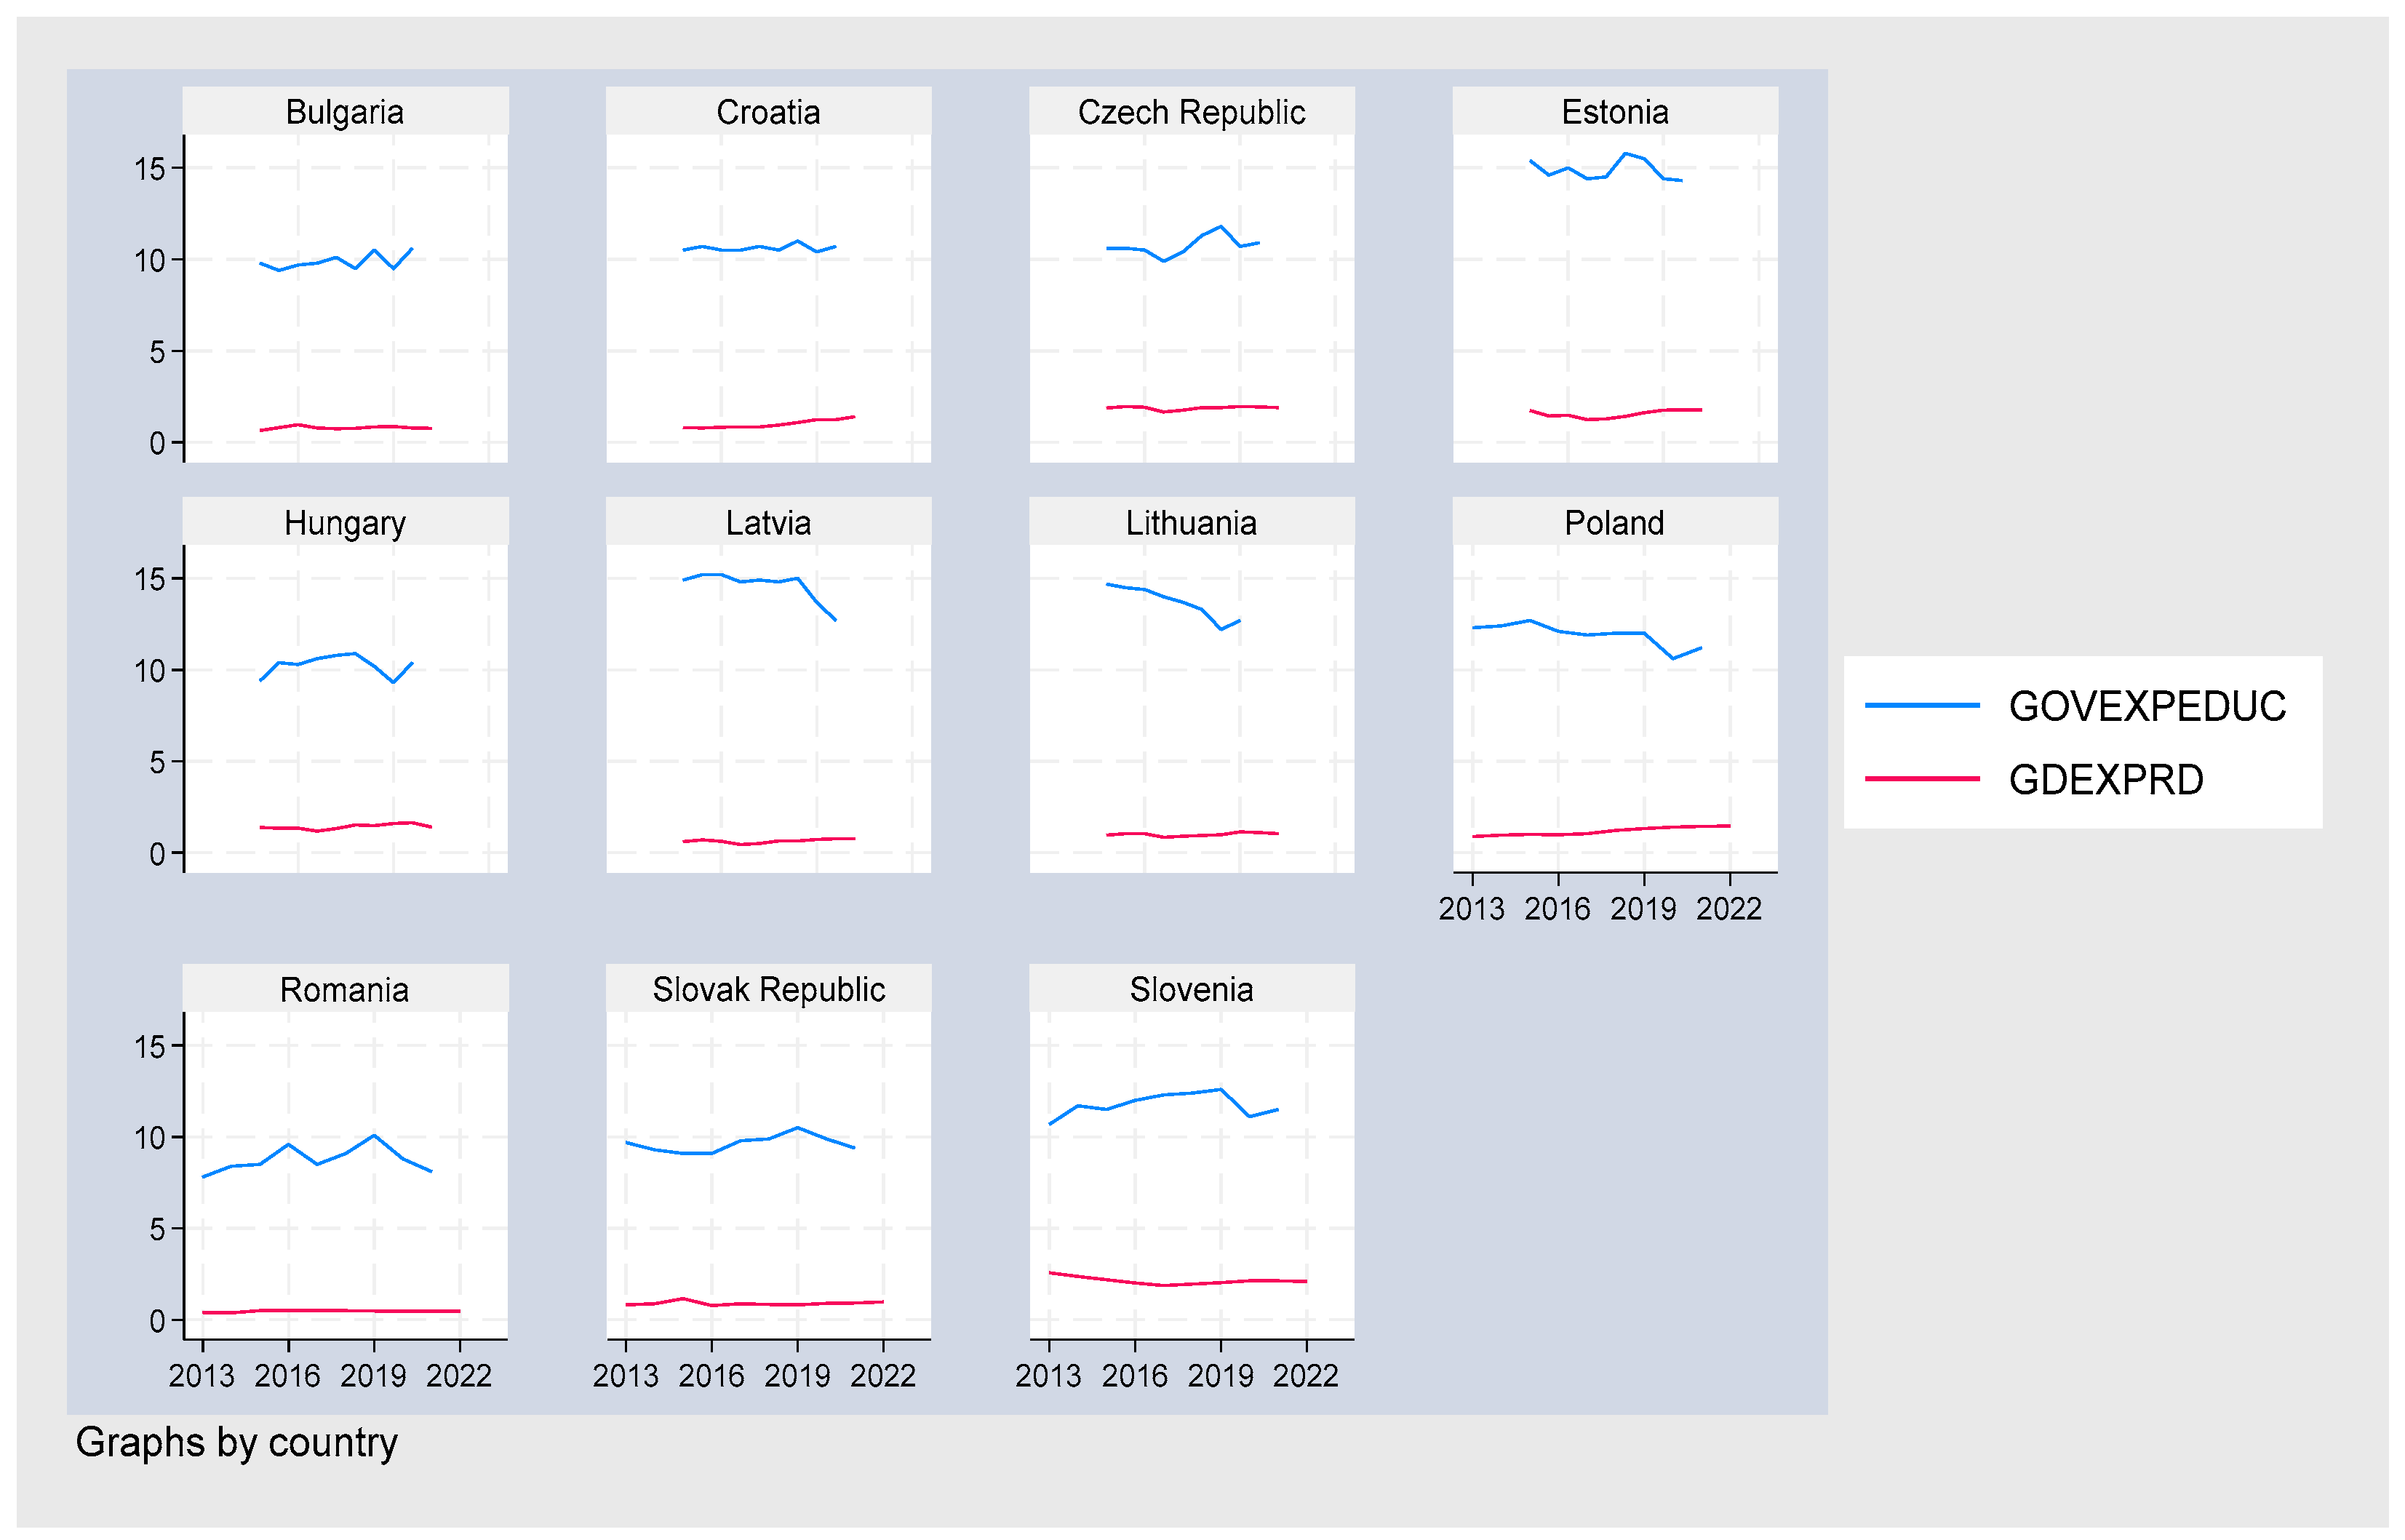
  • In order to capture a more accurate estimation of the relationship between variables [91] and to reduce omitted variable bias [92], we have included control variables in our dataset, namely: real GDP per capita (rgdpcapita), government expenditure on education (govexpeduc), and gross domestic expenditure on R&D (gdexprd). Control variables contribute to the specification of the model, allowing for a more nuanced understanding of the dynamics of the data, which is crucial in capturing both time-invariant and time-varying effects [93]. By controlling various factors, the findings are more robust and applicable to broader contexts, thus enhancing the external validity of the results [94].
The Digital Economy and Society Index (DESI) is a composite index developed by the European Commission to measure the digital performance and competitiveness of European Union member states. The index is designed to capture various aspects of the digital economy and society, allowing for comparisons among countries and tracking progress over time. DESI is structured around the following main dimensions [18]:
  • Connectivity: This dimension assesses the availability and quality of broadband services. It includes indicators such as the penetration of fixed broadband subscriptions, mobile broadband subscriptions, and the coverage and speed of network connections. Key aspects are the infrastructure quality, including the adoption of very high-capacity networks (e.g., fiber-optic connections).
  • Human Capital: This dimension evaluates the skills and education of the population concerning digital technologies. It includes indicators like the level of digital skills among the population, the percentage of individuals with basic digital skills, and the number of ICT specialists in the workforce. This dimension reflects how well people can engage with digital technologies, which is crucial for the digital economy.
  • Integration of Digital Technology: This dimension looks at how businesses integrate digital technologies into their operations. Key indicators include the adoption of technologies such as cloud services, big data, and social media, alongside the digitalization of businesses’ processes. This aspect is important for understanding how well businesses are leveraging digital tools to enhance productivity and competitiveness.
  • Digital Public Services: This dimension assesses the digitalization of public services. It includes indicators related to e-government services such as online public services, open data availability, and the use of digital tools in government interactions with citizens. It reflects how well governments are utilizing digital technologies to provide services and engage with citizens.
Although, since 2020, DESI included another dimension, namely the use of internet services, in order to maintain the same variables throughout the analyzed period, we only considered the four dimensions described previously.
The environmental, social, and governance (ESG) framework is a set of standards used to evaluate a company’s or a country’s operations and performance in these three key areas:
  • Environmental:
    CO2 Emissions (CO2EM)—This indicator measures the total amount of carbon dioxide (CO2) emissions produced by a specific country, typically expressed in metric tons per capita (as in our study) or as a total number of emissions. CO2 emissions are a crucial metric for assessing a country’s environmental impact, particularly in the context of climate change. Tracking this metric helps governments and organizations identify trends, develop policies aimed at reducing carbon footprints, and promote sustainable practices.
    Renewable Energy Consumption (renergcons)—This refers to the use of energy derived from renewable resources that are naturally replenished over time (solar, wind, hydroelectric, biomass, and geothermal energy). The World Bank tracks renewable energy consumption to evaluate the transition towards sustainable energy systems, reduce dependence on fossil fuels, and mitigate climate change impacts. It reflects a country’s commitment to increasing the share of clean energy in its total energy consumption, promoting environmental sustainability and energy security (calculated as % of total final energy consumption).
  • Social:
    Ratio of Female-to-Male Labor Force Participation Rate (labforfm)—This ratio compares the labor force participation rate of women to that of men. It is calculated by dividing the female labor force participation rate by the male labor force participation rate. Gender parity in labor force participation is a core aspect of social equity and development. A higher ratio indicates a more equitable labor market where women have opportunities comparable to those of men. This metric is crucial as it helps assess how inclusive a country’s economy is, the status of gender equality, and the role of women in the workforce which can impact economic growth, social stability, and overall well-being.
    Unemployment (unempl)—The total number of people who are actively seeking employment but are unable to find work. It includes individuals who are without jobs, available for work, and have made specific efforts to find employment within, typically, the last four weeks (calculated as % of total labor force).
  • Governance:
    Regulatory Quality: Estimate (RQ.EST) (regq)—This governance indicator reflects the ability of the government to formulate and implement sound policies and regulations that allow and promote private sector development. It is typically assessed through a combination of quantitative and qualitative measures. High regulatory quality is essential for providing a favorable business environment, ensuring fair competition, and protecting the rights of citizens and investors. It influences economic performance, investment levels, and overall governance. Strong regulatory frameworks help create stability, transparency, and rule of law, which are vital for sustainable economic growth and social development.
    Government Effectiveness: Estimate (goveffect)—This is a key governance indicator measured by the World Bank, reflecting the quality of public services, the capacity of civil service, and the degree of independence from political pressures. It also encompasses the effectiveness of policy formulation and implementation, as well as the credibility of the government’s commitment to such policies. The World Bank defines government effectiveness as “the quality of public services, the quality of the civil service and its independence from political pressures, the quality of policy formulation and implementation, and the credibility of the government’s commitment to such policies” [95]. The effectiveness of government is critical for economic development as it influences investment, economic growth, and public trust in institutions [96]. High government effectiveness is associated with better service delivery, enhanced business environments, and improved overall societal welfare.
  • Control variables:
    Real GDP per capita (rgdpcapita)—This is an economic metric, extracted from the Eurostat database, that measures the average economic output per person in a specific region, adjusted for inflation. It reflects the value of all goods and services produced in a country (gross domestic product, GDP) divided by the population, providing a clearer picture of economic performance and living standards over time. Eurostat calculates real GDP per capita using purchasing power standards (PPS), which accounts for differences in price levels between countries, allowing for more accurate cross-country comparisons [90]. This measure is crucial for assessing economic conditions and trends across European Union member states.
    Government Expenditure on Education (govexpeduc)—This refers to the financial resources allocated by governments to support educational institutions and programs. This expenditure can include funding for primary, secondary, and tertiary education, as well as vocational training and adult education. It encompasses salaries for educators, infrastructure development, educational materials, and other related costs [89]. In our analysis, we considered government expenditure on education expressed as a percentage of total government expenditure (from World Bank estimates). The proportion of government expenditure allocated to education serves as an indicator of the priority assigned by a government to the educational sector in comparison to other public investments. Variations in government structures and budget allocations can influence how education is funded. Additionally, it reflects the government’s commitment to the development of human capital (countries with younger populations may spend more on education in relation to other sectors such as health or social security and vice versa).
    Gross Domestic Expenditure on R&D (gdexprd)—This indicator measures gross domestic expenditure on research and development (GERD) as a percentage of the gross domestic product (GDP)—also called R&D intensity, extracted from the Eurostat database for our research [97]. Expressing R&D expenditure as a percentage of GDP relates it to the size of the economy. This allows for a more meaningful comparison between countries with different economic scales. A small country may have high R&D spending per capita, but if its economy is smaller, the percentage of GDP might be a better indicator of the country’s commitment to R&D. The data are collected through national statistical offices and is crucial for assessing a country’s innovation capacity and investment in knowledge creation.

3.2.2. Research Methodology

Analyzing empirical methodologies applied to capture non-financial performance and digitalization [98,99,100], we implemented a modern advanced econometric method tailored for panel data modeling, namely, robust regression (RREG) with Huber and biweight estimators. Robust regression techniques, such as Huber and biweight estimators, are valuable tools in the analysis of data that may contain outliers or non-normal errors, which can be particularly relevant in the context of panel data from Central and Eastern European countries. The method ensures the robustness and validity of the results, and also sustains the avoidance of multicollinearity issues, inherent in multiple regressions.
These robust methods offer alternatives to traditional fixed and random effects models, particularly when dealing with data that may violate standard assumptions of linear regression. The Huber estimator is designed to be less sensitive to outliers compared to ordinary least squares (OLS) regression. It combines the ideas of least squares (for small residuals) and least absolute deviations (for larger residuals) [101]. The biweight estimator extends the idea of the Huber estimator by applying a more stringent penalty for larger residuals [102]. Both Huber and biweight estimators are designed to mitigate the influence of outliers, which can skew results in conventional fixed and random effects models [103].
Based on the methodology endeavor applied, configured on the panel dataset of CEE countries compiled for the 2013–2023 period, we processed a set of robust regression models (RREG) with Huber and biweight estimators, implemented in order to analyze the ways in which digital transformation (Digital Economy and Society Index and its components: DESI—human capital; DESI—connectivity; DESI—integration of digital technology; DESI—digital public services) impacts a range of non-financial performance metrics (environmental—CO2 emissions and renewable energy consumption; social: ratio of female-to-male labor force participation rate and unemployment; governance—regulatory quality: estimate and government effectiveness: estimate), as expressed in the following Equations (1)–(12):
For the environmental dimension:
CO2EMit = β0 + β1DESIit + β2RGDPCAPITAit + β3GOVEXPEDUCit + β4GDEXPRDit + εit
CO2EMit = β0 + β1DESIHCit + β2DESICONit + β3DESIINTDIGTECHit + β4DESIDIGPUBSERVit + β5RGDPCAPITAit + β6GOVEXPEDUCit + β7GDEXPRDit + εit
RENERGCONSit = β0 + β1DESIit + β2RGDPCAPITAit + β3GOVEXPEDUCit + β4GDEXPRDit + εit
RENERGCONSit = β0 + β1DESIHCit + β2DESICONit + β3DESIINTDIGTECHit + β4DESIDIGPUBSERVit + β5RGDPCAPITAit + β6GOVEXPEDUCit + β7GDEXPRDit + εit
For the social dimension:
LABFORFMit = β0 + β1DESIit + β2RGDPCAPITAit + β3GOVEXPEDUCit + β4GDEXPRDit + εit
LABFORFMit = β0 + β1DESIHCit + β2DESICONit + β3DESIINTDIGTECHit + β4DESIDIGPUBSERVit + β5RGDPCAPITAit + β6GOVEXPEDUCit + β7GDEXPRDit + εit
UNEMPLit = β0 + β1DESIit + β2RGDPCAPITAit + β3GOVEXPEDUCit + β4GDEXPRDit + εit
UNEMPLit = β0 + β1DESIHCit + β2DESICONit + β3DESIINTDIGTECHit + β4DESIDIGPUBSERVit + β5RGDPCAPITAit + β6GOVEXPEDUCit + β7GDEXPRDit + εit
For the governance dimension:
REGQit = β0 + β1DESIit + β2RGDPCAPITAit + β3GOVEXPEDUCit + β4GDEXPRDit + εit
REGQit = β0 + β1DESIHCit + β2DESICONit + β3DESIINTDIGTECHit + β4DESIDIGPUBSERVit + β5RGDPCAPITAit + β6GOVEXPEDUCit + β7GDEXPRDit + εit
GOVEFFECTit = β0 + β1DESIit + β2RGDPCAPITAit + β3GOVEXPEDUCit + β4GDEXPRDit + εit
GOVEFFECTit = β0 + β1DESIHCit + β2DESICONit + β3DESIINTDIGTECHit + β4DESIDIGPUBSERVit + β5RGDPCAPITAit + β6GOVEXPEDUCit + β7GDEXPRDit + εit
These robust methods can provide reliable estimates in the presence of non-normal error distributions, which is often the case in socio-economic data from CEE countries.

4. Results

Table 5 below presents the summary statistics of the indicators considered in our analysis.
In terms of CO2 emissions as an indicator of sustainable economic performance, the summary statistics (Table 5) reveal a moderate level of CO2 emissions (metric tons per capita) across the dataset with significant variability among observations, with a minimum value for Latvia (3.56 metric tons per capita) and a maximum value for Estonia (14.3 metric tons per capita). The considerable standard deviation implies differing emission levels among countries or regions, which may be influenced by economic activity, regulatory frameworks, or energy sources. As for renewable energy consumption, the summary statistics highlight a significant variation in renewable energy use among countries, with the lowest value for the Slovak Republic (10.7%) and the highest value for Latvia (43.8%).
When analyzing the ratio of female-to-male labor force participation rate as indicator of sustainable economic performance, the summary statistics (Table 5) reveal a relatively high ratio of female-to-male labor force participation rate, with values between 66.4% (lowest value for Romania) and 86.1% (highest value for Estonia). The data reflects strong female engagement in the labor market, though the variability might suggest gender differences in various economic conditions or policies affecting labor participation. As for unemployment, the summary statistics show some significant differences across the dataset, with the minimum value for Czech Republic (2%) and the maximum value for Croatia (17.3%).
The summary statistics for the governance—regulatory quality metric, as an indicator of sustainable economic performance (Table 5), reveal variability in regulatory environments across observations with a minimum value for Croatia (0.2) and a maximum value for Estonia (1.7). Regulatory quality disparities may affect economic outcomes significantly, hinting at potential areas for policy improvement in lower-performing countries. For government effectiveness, the summary statistics show a moderate variation across countries, with a minimum value for Bulgaria and Romania (−0.3) and a maximum value for Estonia (1.3).
As for DESI, the summary statistics suggest moderate variability in digital readiness across different entities. Countries with higher DESI scores likely benefit from better digital infrastructure and services. The range (the minimum value—19.4 for Romania to maximum value—56.51 for Estonia) signifies a wide disparity in digital advancement among countries.
The components of DESI (human capital (desihc); connectivity (desicon); integration of digital technology (desiintdigtech); and digital public services (desidigpubserv) indicate variation likely due to geographic and economic factors. Huge discrepancies among the CEE countries were shown in the case of digital public services (desidigpubserv), with the minimum value (7.41) in Romania and the maximum (91.18) in Estonia, but also for the component of human capital (desihc) with a minimum value (10.46) in Romania and a maximum one (31.12) in Croatia. High variability in the case of digital public services suggests that while some countries excel in delivering digital services, others may need substantial enhancements to meet citizen expectations and the variability in human capital may correlate with economic growth, where countries with higher scores may attract more investment.
In regards to real GDP per capita, the summary statistics show significant economic variability among countries, with a minimum value for Bulgaria (5470 euro per capita) and a maximum value for Slovenia (22,130 euro per capita). For government expenditure on education, there is a variability in education spending with a minimum value for Romania (7.8) and a maximum value for Estonia (15.8). Finally, for gross domestic expenditure on R&D, the results suggest variability in government spending relative to GDP, with a minimum value for Romania (0.28%) and a maximum value for Slovenia (2.56%).
For complementary perspectives on the disparities in digitalization and non-financial performance among CEE countries, we performed a graphical representation of these indicators (Figure 5, Figure 6, Figure 7, Figure 8, Figure 9, Figure 10 and Figure 11).
As shown in Figure 5, for CO2 emissions, Romania and Latvia registered the lowest values due to their favorable energy mixes, heavily weighted towards renewables, less carbon-intensive economic structures, and proactive environmental policies. These factors collectively enable them to maintain lower overall emissions compared to their regional counterparts. As for renewable energy consumption, Latvia has a significant reliance on renewable energy sources, particularly hydropower, which contributes to its lower carbon emissions. According to the European Environment Agency (EEA), Latvia’s share of renewable energy in its total energy consumption was one of the highest in the EU, significantly reducing its carbon footprint [104]. Furthermore, Latvia’s commitment to increasing its renewable energy capacity aligns with EU targets, further promoting a low-emission energy sector.
Data in Figure 6 underline that Estonia has the highest values for the ratio of female-to-male labor force participation rate, values that can be attributed to several factors, such as high levels of gender equality, cultural norms, educational attainment, economic structure, government policies, and labor market demand. As for unemployment, Croatia has the highest unemployment ratio because of challenges like youth unemployment, economic structure (the country relies heavily on seasonal tourism), low investments, negative COVID-19 impact, emigration, and labor market rigidities [43].
When looking at governance indicators (Figure 7—regulatory quality and government effectiveness), the lowest values are for Croatia, Romania, and Bulgaria, a consequence of the lasting impact of communism on governance structures, high levels of corruption, political instability, public sector incapacity, and a negative public perception and engagement [21]. At the opposite end, Estonia registered the highest level for these indicators due to several country specific key—factors: digital governance, anti-corruption measures, strong institutions, high quality education, and consistent policy framework [21].
As for DESI, although the values show an ascendant trend for all countries, there are significant disparities among the CEE countries (Figure 8). This highlights the notion that, despite the ongoing development of the digital economy, there remains considerable potential for enhancement. Regarding human capital, Estonia and Latvia are shown to have the highest percentage of the population with digital skills. These countries have a well-educated population, with a strong emphasis on technology and innovation. A skilled workforce enables effective implementation of policies and regulations, contributing to better outcomes [45].
The highest level of integration of digital technology in the public and private sectors was registered in Estonia and the most digitized public services are found in Estonia, Latvia, and Lithuania (Figure 9). Estonia is a pioneer in e-governance and digital services. The country has invested heavily in digital infrastructure, allowing for efficient public services and streamlined regulatory processes. The e-Residency program, digital ID, and online voting are examples of how Estonia has embraced technology [46].
Next, we analyzed the results for the control variables included in our study (real GDP per capita, government expenditure on education and government expenditure on R&D). Hence, as data in Figure 10 and Figure 11 indicate, the countries with the lowest values are Romania and Bulgaria as they are still in a phase of economic transition, reliance on certain industries, structural issues, and demographic challenges, coupled with low investment in human capital. Conversely, the highest levels were registered in Estonia and Slovenia, due to their economic growth and structural reforms, high investment in education, focus on research, and development and international cooperation [47,49].
Overall, the panel data paints a diverse picture of economic and digital metrics across countries. It suggests areas for policy focus, especially regarding improving CO2 emissions, renewable energy consumption, enhancing regulatory quality and government effectiveness, and boosting digital integration and connectivity. The variations observed could guide targeted interventions to elevate underperforming regions, ultimately generating economic growth and sustainability.
The analysis of panel data consists of four steps: (1) tests for a panel unit root; (2) tests for multicollinearity (correlation matrix, correlation heatmap, and Variance Inflation Factor (VIF) analysis) in order to examine the correlation coefficients between independent variables that can provide insight into which variables may be highly correlated; (3) robust regression models (RREG) with Huber and biweight estimators, used to analyze the impact of digital transformation indicators on the non-financial performance metrics for CEE countries; and (4) once the panel robust regression is established, we also applied additional robustness check, namely the Wooldridge test that detects first-order autocorrelation in panel data models, a practical tool for identifying whether the residuals from a regression model are correlated across time.
The purpose of conducting a panel unit root test is to ascertain whether the panel data exhibits unit roots, which would indicate non-stationarity characterized by stochastic trends and a lack of convergence to a stable mean over time. In this analysis, we have applied two types of panel unit root tests. The first one is the panel-based unit root test of Levin et al. [105], which accommodates individual-specific intercepts—pertaining to distinct countries in this context—and permits variability in the degree of persistence of individual regression errors and trend coefficients across different entities. Ladu and Meleddu [106] underline that this test is particularly applicable to panels of moderate size; however, there are instances when contemporaneous correlations cannot be adequately addressed through the straightforward subtraction of cross-sectional averages. Additionally, the assumption that entities are homogeneous in terms of the presence or absence of a unit root imposes a restrictive condition. That is why we have cross-checked our results using the second test developed by [107]. The Harris and Tzavalis test allow for the possibility that individual units (countries in this case) in the panel may have different unit root processes. This is particularly useful in heterogeneous panels like CEE countries, where economic conditions and dynamics may vary significantly [107]. The Harris and Tzavalis test has been found to be more robust than the Levin–Lin–Chu test in small sample sizes [107]. This is crucial when working with a limited number of observations, such as for certain CEE countries.
The outcomes are presented in Table 6, revealing that, in most cases, the null hypothesis of non-stationarity for the respective variables is rejected at conventional levels of significance (for both unit root tests). The results suggest that the panel variables exhibit stationary behavior.
In the second step of our empirical analysis, we have generated the correlation matrix (Table 7), the correlation heatmap (Figure 12), and the coefficients of independent variables from Variance Inflation Factor (VIF) analysis (Appendix ATable A1 and Table A2) in order to verify the multicollinearity across exogenous variables.
The correlation matrix (Table 7), the correlation heatmap (Figure 12), and the VIF analysis (Appendix ATable A1 and Table A2) provide insights into how these various factors might interact (the blue dots from the correlation heatmap represent the strength and direction of the correlation between pairs of variables). Results suggest that there is no multicollinearity problem in the models (the VIF coefficients of all independent variables are <10). Additionally, there is a strong positive correlation between the Digital Economy and Society Index (desi) and its components: DESI—human capital (desihc), DESI—connectivity (desicon), DESI—integration of digital technology (desiintdigtech), and DESI—digital public services (desidigpubserv). Therefore, in order to avoid the multicollinearity issue, we have generated different regressions with the Digital Economy and Society Index (desi) and its components.
The next step in testing the hypotheses was to estimate multiple regression models based on the robust regression configuration. The models were estimated in an organized manner within two panels. Panel 1 tests the dependency between the Digital Economy and Society Index (desi) and the non-financial performance indicators, quantified alternatively through environmental—CO2 emissions (CO2EM—model 1) and renewable energy consumption (renergcons—model 2); social—ratio of female-to-male labor force participation rate (labforfm—model 3) and unemployment (unempl—model 4); governance—regulatory quality: estimate (RQ.EST) (regq—model 5) and government effectiveness: estimate (goveffect—model 6) (Table 8).
Panel 2 tests the dependency between the Digital Economy and Society Index (desi) components: DESI—human capital (desihc), DESI—connectivity (desicon), DESI—integration of digital technology (desiintdigtech), and DESI—digital public services (desidigpubserv) and the non-financial performance indicators, quantified alternatively through environmental—CO2 emissions (CO2EM—model 1) and renewable energy consumption (renergcons—model 2); social—ratio of female-to-male labor force participation rate (labforfm—model 3) and unemployment (unempl—model 4); governance—regulatory quality: estimate (RQ.EST) (regq—model 5) and government effectiveness: estimate (goveffect model 6) (Table 9).
To capture a more accurate estimation of the relationship between variables [107] and to reduce omitted variable bias [92], we have included the control variables in our robust regressions, namely: real GDP per capita (rgdpcapita), government expenditure on education (govexpeduc), and gross domestic expenditure on R&D(gdexprd) (Table 8 and Table 9).
Once the panel robust regressions are established, we also applied additional robustness checks, namely the Wooldridge test that detects first-order autocorrelation in panel data models (H0: no first order autocorrelation), a practical tool for identifying whether the residuals from a regression model are correlated across time. This is particularly important when analyzing data across CEE countries, as panel data often exhibit unique characteristics due to economic transitions, structural changes, and varying policies in these countries. In the context of CEE countries, applying the Wooldridge test helps ensure the validity of their econometric models. Autocorrelation can lead to inefficient estimates and biased standard errors, potentially misleading policy implications. By using this test, the appropriate estimation technique can be determined, based on the presence or absence of autocorrelation [92]. The results show, in most cases, no serial correlation and, for a small number of indicators, a limited presence of first-order autocorrelation.
After performing these robustness checks, we can assert with confidence that the estimations are both accurate and robust. These tests were used to ascertain that the analytical outcomes are not influenced by model specification errors or other potential sources of bias. The results suggest that the estimations can be further used and interpreted within an economic framework, thereby offering a dependable foundation for decision-making process and policy development. Collectively, these findings enhance the validity and credibility of the research, providing assurance that the conclusions derived are methodologically sound.
The results reveal the existence of an association among variables and a notable impact on sustainable performance (CO2 emissions, renewable energy consumption, ratio of female-to-male labor force participation rate, unemployment, regulatory quality, and government effectiveness).
As for the direct impacts of digital transformations on environmental performance—CO2 emissions (significant from a statistical point of view), the results foreground adverse effects in the case of DESI (Table 8) and the connectivity component of DESI (desicon) (Table 9), correlated with a strong positive relationship with real GDP/capita (rgdpcapita) and government expenditure on R&D (gdexprd) (Table 8 and Table 9).
For renewable energy consumption, the other environmental indicator taken into consideration (significant from a statistical point of view), the results underline a favorable influence in the case of DESI (Table 8) and the connectivity and integration of digital technology components of DESI (desicon and desiintdigtech—Table 9), correlated with a negative relationship with real GDP/capita (rgdpcapita) and government expenditure on R&D (gdexprd) (Table 8 and Table 9).
As such, Hypothesis H1 is fulfilled: there are significant direct implications of digital transformations (mainly through the connectivity component of DESI and the integration of the digital technology component of DESI) upon the environmental performance of Central and Eastern European countries.
Digital transformations have registered favorable direct impacts on the ratio of female-to-male labor force participation rates for DESI (positive and statistically significant coefficients—Table 8), while for DESI—connectivity (desicon), there appears to be a negative significant relationship, and for DESI—digital public services (desidigpubserv), there appears a strong positive relationship (Table 9—both significant statistical).
As for the impact of digital transformations upon our second social indicator, unemployment (unempl), we noticed a favorable direct impact of DESI (positive and statistically significant coefficients—Table 8), while also considering a negative correlation with the government expenditure on R&D (gdexprd).
When considering the impact of the DESI components (Table 9), a positive influence of DESI—human capital (desihc) can be observed, taking also into consideration the negative relationship with the government expenditure on R&D (gdexprd).
Consequently, Hypothesis H2 is also validated: there are significant direct implications of digital transformations (mainly through the human capital component of DESI, the connectivity component of DESI, and digital public services component of DESI) upon the social performance of Central and Eastern European countries.
In terms of the direct impacts of digital transformations on governance performance, namely regulatory quality: estimate (regq), there appears to be no statistically significant relationship with DESI, but a strong positive relationship (significant from a statistical point of view) with government expenditure on education (Table 8). Concerning the impact of the components of DESI on regulatory quality: estimate (regq), the results underline unfavorable influences in the cases of DESI—human capital (desihc) and DESI—connectivity (desicon) and favorable influences in the cases of DESI—digital public services (desidigpubserv), real GDP/capita (rgdpcapita), and government expenditure on education (govexpeduc).
For government effectiveness (goveffect), our results underline no statistically significant relationship with DESI but a strong positive relationship (significant from a statistical point of view) with real GDP/capita (rgdpcapita) and government expenditure on education (govexpeduc) (Table 8). For the components of DESI, a favorable influence of DESI—digital public services (desidigpubserv) on the government effectiveness (goveffect) can be noted, along with a positive correlation with real GDP/capita (rgdpcapita) and government expenditure on education (govexpeduc) (Table 9).
However, only the results related to the impact of the DESI components on governance performance are statistically significant (Table 9). Hence, Hypothesis H3 is partially validated: There are significant direct implications of digital transformations (mainly through the human capital component of DESI, the connectivity component of DESI, and the digital public services component of DESI) upon the governance development of Central and Eastern European countries.

5. Discussion

Our panel data analysis of CEE countries, over a period of 11 years, highlights the multifaceted impacts of digital transformation on environmental, social, and governance performance metrics, contributing to a better understanding of how digitalization influences sustainable development within the region.
When looking at the environmental performance of CEE countries, our analysis shows that improved connectivity (as a component of DESI) plays a pivotal role in enabling the adoption of digital technologies and intelligent solutions across various sectors. This enhancement not only leads to operational efficiencies but also contributes to the reduction in resource consumption and waste, ultimately resulting in lower CO2 emissions (component of ESG). Thus, we can conclude that enhanced connectivity facilitates the implementation of smart grids and energy management systems, which optimize the utilization of renewable energy sources and improve overall energy efficiency. Recent trends indicate a notable decrease in carbon dioxide (CO2) emissions, particularly in urban settings, coinciding with the rise in digitalization in public services [108,109,110].
In some cases, while government expenditures on R&D can foster innovation and potentially lead to breakthroughs in renewable energy technologies, if not managed carefully, they can inadvertently hinder immediate renewable energy consumption through a misallocation of resources, market distortions, and a lack of focus on deploying existing solutions [19]. The increase in DESI and its connectivity component, along with economic growth in CEE countries, contributes to a multifaceted approach to economic growth and sustainability. By fostering digital transformation, these countries can achieve higher GDP per capita while simultaneously reducing CO2 emissions and enhancing the use of renewable energy sources and improving energy efficiency [26,64,79].
Another dimension analyzed in our study is the social performance of CEE countries, and our results show that, while an increase in DESI signifies progress in digitalization and technological advancement, enhancing connectivity can inadvertently lead to a decrease in the female-to-male labor force participation ratio (a component of ESG). This might be due to factors such as job displacement in sectors where women are predominantly employed, skills mismatches, challenges in work–life balance, and shifting industry dynamics, especially in the case of CEE countries. The study conducted by Vuksanović Herceg et al. [111] found that, in Serbia, companies undergoing digital transformation do not perceive human resources as a driving force of change, but rather as an obstacle when they lack necessary competences and skills.
Addressing these issues requires targeted policies to support women’s participation in the digital economy, including education, skills training, and efforts to improve work–life balance. Thus, an increase in government R&D expenditure can significantly contribute to reducing unemployment in CEE countries, creating jobs directly in research sectors, fostering innovation, attracting investment, enhancing workforce skills, and promoting overall economic growth [17,22,55].
The digitalization of public services can address several barriers that women face in the labor market. By facilitating access, flexibility, resources, and support systems, the digitalization of public services can help bridge the gender gap in labor force participation rates, ultimately contributing to a more balanced and inclusive workforce. Our results align with the findings of Zolkover et al. [83] who underlined that effective digital transformation strategies can lead to improved business outcomes, which in turn positively affect social performance by creating jobs and enhancing service delivery.
In terms of the direct impacts of digital transformations on governance performance in CEE countries, there are a few potential negative influences to consider. While enhancing connectivity and human capital is generally beneficial for economic development, in CEE countries, these increases can inadvertently lead to a decrease in regulatory quality due to the challenges in adapting existing frameworks, capacity constraints, and potential political and economic pressures [53]. A balanced approach that considers both digital advancement and robust regulatory practices is essential to ensure that growth does not come at the cost of regulatory integrity, as highlighted by Kahrović and Avdović [50] in their study on Serbian business performance. The authors stress the importance of supportive governmental policies and initiatives aimed at promoting digitalization among businesses.
The increase in DESI in CEE countries through the digitalization of public services can lead to improved regulatory quality and government effectiveness by enhancing accessibility, efficiency, transparency, and accountability pressures [48]. By leveraging digital tools and data, governments can better meet the needs of their citizens and create a more responsive and effective regulatory environment. For example, the study of Moroz [21] revealed that Poland displays several weaknesses, particularly in more systemic areas like digital public services and the integration of advanced digital technologies across sectors, which limit overall competitiveness and effectiveness in comparison to more digitally advanced nations.
Beyond that, by fostering economic growth and investing in human capital, these countries can build stronger institutions, improve public trust, and create a more conducive environment for sustainable development pressures [16,66]. The interplay between education, economic growth, and governance creates a foundation for long-term stability and progress in these countries.
Although our results show that there is no statistical significance when correlating the integration of the digital technology components of DESI with regulatory quality as a component of the governance performance of CEE countries, other studies underline the transformative effect on regulatory quality by enhancing transparency through easy access to information, data-driven decision-making, stakeholder engagement, reduced bureaucracy and overall efficiency [112,113,114]. Our results might be explained by the specificity of CEE countries that face challenges in adapting existing frameworks, undergo capacity constraints, and potential political and economic pressures, in line with findings from other relevant research [115]. In Hungary, proactive government initiatives and investments in digital infrastructure have facilitated a smoother transition into the digital economy, as shown in the study of Nagy [20]. Conversely, the same study shows that Ukraine faces several challenges, including fragmented policies and insufficient governmental support, which hinder its digital transformation efforts.
Also, while CEE countries exhibit similarities in their transformation experiences, in light of their common historical and economic transitions and integration into the European Union, as underlined in our country analysis, it is important to follow up our research with deeper contextual analyses that capture the specific needs and conditions of individual nations.

6. Conclusions

The intensive use of digital technologies has revolutionized the way organizations quantify, track, and report non-financial performance. Big data, AI, blockchain, and cloud computing are important tools that enhance the accuracy, transparency, and efficiency of sustainability, social responsibility, and governance practices at the corporate level. The significant benefits obtained by implementing these technologies compete to ensure effective integration, with a series of challenges related to data privacy concerns, lack of standardization, and limited resources. As non-financial performance emerges as an important influencing factor in assessing organizational success, digital technologies are strengthening their determining role, leading to greater accountability and sustainability in the corporate world.
Thus, our study aimed to analyze the impact of digital transformation on the non-financial performance of CEE countries, concluding that digital transformation profoundly affects the environmental, social, and governance performance of CEE countries, although the effects vary significantly across different regions.
The findings of our research are meant to contribute to the existing relevant literature by providing empirical evidence specific to the CEE context. As previously shown, as most of the current research is centered on Western economies, our study fills a gap by examining how digital transformation influences non-financial performance metrics in a region characterized by unique socio-economic challenges and opportunities. Moreover, we focused our efforts on non-financial performance, a topic less approached in the specific literature, thus generating findings with diverse implications, as follows.
In the current digital era, traditional business models are undergoing major transformations that imply integrating digital tools in an effective manner throughout all business facets [116]. Therefore, from a managerial perspective, our results show that a strategic approach to digital adoption can lead to enhanced organizational resilience and adaptability, which are crucial in the rapidly evolving digital landscape.
For policymakers and regulatory bodies, as the journey towards digital transformation is fraught with challenges, especially in CEE countries, the emphasis on strategic digital initiatives will be decisive for enhancing competitiveness and achieving sustainable growth in the region. The governance structures in these countries hold a crucial role in becoming more robust and capable of addressing contemporary challenges, as the integration of digital technologies in public administration can lead to more efficient service delivery and improved regulatory frameworks.
Furthermore, the findings of this study carry important implications for policymakers in CEE countries. It is essential to recognize that digital transformations are not a panacea for sustainable performance challenges. Instead, targeted strategies that focus on enhancing specific dimensions of digital transformation—such as human capital and the integration of digital technology—are likely to generate favorable outcomes across environmental, social, and governance indicators.
Also, our study showed that while DESI serves as a useful benchmark for measuring digital progress, it is essential for policymakers to consider its potential negative implications for regulatory quality. Balancing digital initiatives with comprehensive regulatory frameworks that promote equity, transparency, and long-term sustainability is crucial for achieving effective governance in the digital age.
Other potential focal points for policy initiatives are related to the reduction of CO2 emissions, enhancement of regulatory quality, and promotion of digital integration and connectivity. The disparities observed within our study may guide the development of targeted strategies designed to elevate underperforming regions, ultimately fostering improved economic growth and sustainability. Consequently, policymakers should prioritize the enhancement of digitalization in public services, as this would likely lead to improved environmental performance, as also indicated.
As for the academic implications, overall, our study is meant to provide valuable contributions to the specific broader academic literature. By focusing on non-financial aspects, it can help expand the understanding of the multifaceted benefits of digital transformation, beyond the traditional financial metrics.
As underlined in the literature review, there is a pressing need for studies that explore the long-term impacts of digital transformation on organizational sustainability and innovation, especially when considering CEE countries. Thus, our research included a bibliometric analysis that revealed the fact that the addressed topic presents a high degree of novelty, with non-financial performance studied mainly in the case of enterprises in China. Furthermore, we explored country-level co-authorship and bibliographic coupling on the subject, thus tracking the knowledge flow as well as the knowledge gap when looking towards CEE countries, while also contributing to the mapping of knowledge, research trending, and findings in our area of study.
However, there are some potential limitations of our study that need to be acknowledged. As our study was limited to CEE countries, the results cannot be generalized. Additionally, we approached the CEE countries as a whole, but results may vary within the group due to various cultural, economic, and regulatory environments. Furthermore, digital transformation is a long-term and rarely linear process, thus its full impact on non-financial performance metrics require several years. Also, there may be differences when analyzing different sectors/industries across the CEE countries, as there are various levels of digital adoption and challenges. Another issue could be the non-financial metrics selected for the study, being that, as shown in our review, various authors consider various metrics with no general understanding on the matter. Nevertheless, all of these aspects can be further exploited in our research.
As digital transformation continues to evolve, understanding its implications for international business strategies will be testing [117]. The integration of emerging technologies, such as artificial intelligence and big data, into digital transformation frameworks will also require further exploration to maximize their potential benefits [118]. Thus, digital transformation represents a complex interplay of technology, culture, and strategy. A future research path can focus on the longitudinal effects of digital transformation and the development of frameworks that facilitate successful implementation across diverse contexts.
Moreover, the study highlights the need for further research to explore the underlying factors influencing the observed relationships. Future investigations could benefit from a granular analysis of the specific mechanisms through which digital transformations impact ESG indicators, as well as the potential moderating effects of contextual variables such as economic conditions, cultural factors, and existing regulatory frameworks.
As digital transformation is assessed through long-cycle variables, future research could analyze the lag-effects [73,119] to fully consider the potential long-term sustainability of the impact of digital transformation.
Our findings also revealed disparities in digital transformation efforts across different CEE countries, which open additional research paths to be explored. These disparities can be attributed to a range of factors, including varying levels of government support, differences in infrastructure development, and the presence of skilled labor. Such variations not only affect the overall economic growth of these nations but also influence their ability to compete in the increasingly digital global market. Future studies could investigate the specific factors contributing to the differences in digital transformation among CEE countries. Additionally, comparative analyses on various sectors within these countries could be conducted to understand how different industries adapt to digital changes, and they can identify the best practices and strategies to enhance overall performance.
Furthermore, conducting a disaggregated analysis that compares the subgroups of CEE countries could provide significant insights in the context of our research topic. Another potential future research involves extending the analysis to account for the significant global events that occurred within the considered time frame, particularly the COVID−19 pandemic as it accelerated the process of digital transformation worldwide. Such an approach would offer deeper insights into the effects of external shocks on digital transformation and its broader implications.
While digital transformations hold promise for enhancing sustainable performance in CEE countries, the complexity of these relationships necessitates a nuanced approach to policy formulation and implementation. Continued empirical research will be vital in refining our understanding of these dynamics and in fostering sustainable development in the region.

Author Contributions

Conceptualization, I.D.C., A.B., D.A.G.G. and C.N.J.; methodology, D.A.G.G. and C.N.J.; software, C.N.J.; validation, I.D.C. and A.B.; formal analysis, D.A.G.G. and C.N.J.; investigation, I.D.C., A.B., D.A.G.G. and C.N.J.; resources, I.D.C. and A.B.; data curation, D.A.G.G. and C.N.J.; writing—original draft preparation, I.D.C., A.B., D.A.G.G. and C.N.J.; writing—review and editing, I.D.C., A.B., D.A.G.G. and C.N.J. All authors have read and agreed to the published version of the manuscript.

Funding

This research was partly funded by the West University of Timisoara.

Data Availability Statement

The data that support the findings of this study are available from the corresponding author upon reasonable request.

Conflicts of Interest

The authors declare no conflicts of interest.

Appendix A

Table A1. VIF coefficients of independent variables of the models processed to assess the impact of the Digital Economy and Society Index (desi) upon non-financial performance (environmental—CO2 emissions, renewable energy consumption, social—ratio of female-to-male labor force participation rate, unemployment, governance—regulatory quality: estimate (RQ.EST), government effectiveness: estimate), Central and Eastern European countries, 2013–2023.
EnvironmentalSocialGovernance
(1)(2)(3)(4)(5)(6)
CO2EMRENERGCONSLABFORFMUNEMPLREGQGOVEFEECT
DESI2.673.292.672.672.672.67
RGDPCAPITA3.273.213.273.273.273.27
GOVEXPEDUC1.862.421.861.861.861.86
GDEXPRD2.812.782.812.812.812.81
Source: Authors’ research in STATA 18.
Table A2. VIF coefficients of independent variables of the models processed to assess the impact of the Digital Economy and Society Index components upon non-financial performance (environmental—CO2 emissions, renewable energy consumption, social—ratio of female-to-male labor force participation rate, unemployment, governance—regulatory quality: estimate (RQ.EST), government effectiveness: estimate), Central and Eastern European countries, 2013–2023.
EnvironmentalSocialGovernance
(1)(2)(3)(4)(5)(6)
CO2EMRENERGCONSLABFORFMUNEMPLREGQGOVEFEECT
DESIHC2.422.762.422.422.422.42
DESICON1.371.281.371.371.371.37
DESIINTDIGTECH7.176.917.177.177.177.17
DESIDIGPUBSERV5.966.185.965.965.965.96
RGDPCAPITA5.105.215.105.105.105.10
GOVEXPEDUC3.413.713.413.413.413.41
GDEXPRD3.163.273.163.163.163.16
Source: Authors’ research in STATA 18.

References

  1. Vial, G. Understanding Digital Transformation: A Review and a Research Agenda. J. Strateg. Inf. Syst. 2019, 28, 118–144. [Google Scholar] [CrossRef]
  2. Nadkarni, S.; Prügl, R. Digital Transformation: A Review, Synthesis and Opportunities for Future Research. Manag. Rev. Q 2021, 71, 233–341. [Google Scholar] [CrossRef]
  3. Dąbrowska, J.; Almpanopoulou, A.; Brem, A.; Chesbrough, H.; Cucino, V.; Di Minin, A.; Giones, F.; Hakala, H.; Marullo, C.; Mention, A.; et al. Digital Transformation, for Better or Worse: A Critical Multi-level Research Agenda. R D Manag. 2022, 52, 930–954. [Google Scholar] [CrossRef]
  4. Zhao, X. The Impact of Digital Transformation Strategy of Manufacturing Enterprises on Digital Innovation Performance. Int. Bus. Econ. Stud. 2024, 6, 77. [Google Scholar] [CrossRef]
  5. Papathomas, A.; Konteos, G. Financial Institutions Digital Transformation: The Stages of the Journey and Business Metrics to Follow. J. Financ. Serv. Mark. 2024, 29, 590–606. [Google Scholar] [CrossRef]
  6. Teng, X.; Wu, Z.; Yang, F. Research on the Relationship between Digital Transformation and Performance of SMEs. Sustainability 2022, 14, 6012. [Google Scholar] [CrossRef]
  7. Manny, L.; Duygan, M.; Fischer, M.; Rieckermann, J. Barriers to the Digital Transformation of Infrastructure Sectors. Policy Sci. 2021, 54, 943–983. [Google Scholar] [CrossRef]
  8. Aguilar, J.; Fuentes, J.; Montoya, E.; Hoyos, W.; Benito, D. Explainability Analysis of the Evaluation Model of the Level of Digital Transformation in MSMEs Based on Fuzzy Cognitive Maps: Explainability Analysis on Fuzzy Cognitive Maps. CLEI Electron. J. 2024, 27, 1–28. [Google Scholar] [CrossRef]
  9. Ubiparipović, B.; Matković, P.; Pavlićević, V. Key Activities of Digital Business Transformation Process. Strateg. Manag. 2023, 28, 33–40. [Google Scholar] [CrossRef]
  10. Korachi, Z.; Bounabat, B. General Approach for Formulating a Digital Transformation Strategy. J. Comput. Sci. 2020, 16, 493–507. [Google Scholar] [CrossRef]
  11. Warner, K.S.R.; Wäger, M. Building Dynamic Capabilities for Digital Transformation: An Ongoing Process of Strategic Renewal. Long Range Plan. 2019, 52, 326–349. [Google Scholar] [CrossRef]
  12. Nazari, Z.; Musilek, P. Impact of Digital Transformation on the Energy Sector: A Review. Algorithms 2023, 16, 211. [Google Scholar] [CrossRef]
  13. Czakon, W.; Mania, K.; Jedynak, M.; Kuźniarska, A.; Choiński, M.; Dabić, M. Who Are We? Analyzing the Digital Identities of Organizations through the Lens of Micro-Interactions on Social Media. Technol. Forecast. Soc. Chang. 2024, 198, 123012. [Google Scholar] [CrossRef]
  14. Jedynak, M.; Czakon, W.; Kuźniarska, A.; Mania, K. Digital Transformation of Organizations: What Do We Know and Where to Go Next? J. Organ. Chang. Manag. 2021, 34, 629–652. [Google Scholar] [CrossRef]
  15. Li, Y.; Fei, G.Z. Network Embeddedness, Digital Transformation, and Enterprise Performance—The Moderating Effect of Top Managerial Cognition. Front. Psychol. 2023, 14, 1098974. [Google Scholar] [CrossRef]
  16. Olczyk, M.; Kuc-Czarnecka, M. Digital Transformation and Economic Growth—DESI Improvement and Implementation. Technol. Econ. Dev. Econ. 2022, 28, 775–803. [Google Scholar] [CrossRef]
  17. Kovács, T.Z.; Bittner, B.; Szilárd, A.; Nábrádi, A. Digital Transformation of Human Capital in the Eu According to the DESI Index. Issues Inf. Syst. 2022, 23, 293–311. [Google Scholar] [CrossRef]
  18. European Commision. DESI Dashboard for the Digital Decade (2023 Onwards); European Commision: Brussels, Belgium, 2023. [Google Scholar]
  19. Vyshnevskyi, O.; Stashkevych, I.; Shubna, O.; Barkova, S. Economic Growth in the Conditions of Digitalization in the EU Countries. Stud. Appl. Econ. 2021, 38, 1–9. [Google Scholar] [CrossRef]
  20. Nagy, S. Digital Economy and Society. A Cross Country Comparison of Hungary and Ukraine. arXiv 2019, arXiv:1901.00283. [Google Scholar] [CrossRef]
  21. Moroz, M. The Level of Development of the Digital Economy in Poland and Selected European Countries: A Comparative Analysis. Found. Manag. 2017, 9, 175–190. [Google Scholar] [CrossRef]
  22. Baumgartner, C.; Hartl, E.; Hess, T. New Workplace, New Mindset: Empirical Case Studies on the Interplay Between Digital Workplace and Organizational Culture. In Innovation Through Information Systems; Ahlemann, F., Schütte, R., Stieglitz, S., Eds.; Lecture Notes in Information Systems and Organisation; Springer International Publishing: Cham, Switzerland, 2021; Volume 48, pp. 91–107. ISBN 978-3-030-86799-7. [Google Scholar]
  23. Neely, A. (Ed.) Business Performance Measurement: Unifying Theory and Integrating Practice, 2nd ed.; Cambridge University Press: Cambridge, UK, 2007; ISBN 978-0-521-85511-2. [Google Scholar]
  24. Najmi, M.; Rigas, J.; Fan, I. A Framework to Review Performance Measurement Systems. Bus. Process Manag. J. 2005, 11, 109–122. [Google Scholar] [CrossRef]
  25. Dai, C.; Fang, J. Digital Transformation and Non-Financial Performance in Manufacturing. Sustainability 2024, 16, 5099. [Google Scholar] [CrossRef]
  26. Hoque, Z. Linking Environmental Uncertainty to Non-Financial Performance Measures and Performance: A Research Note. Br. Account. Rev. 2005, 37, 471–481. [Google Scholar] [CrossRef]
  27. Kaplan, R.S.; Norton, D.P. Transforming the Balanced Scorecard from Performance Measurement to Strategic Management: Part I. Account. Horiz. 2001, 15, 87–104. [Google Scholar] [CrossRef]
  28. Van Veen-Dirks, P.; Wijn, M. Strategic Control: Meshing Critical Success Factors with the Balanced Scorecard. Long Range Plan. 2002, 35, 407–427. [Google Scholar] [CrossRef]
  29. Lim, S.; Matolcsy, Z.; Chow, D. The Association between Board Composition and Different Types of Voluntary Disclosure. Eur. Account. Rev. 2007, 16, 555–583. [Google Scholar] [CrossRef]
  30. Abidin, S.; Al Jaffri Saad, R.; Mohd Muhaiyuddin, N.M. Evaluating Corporate Reporting on the Internet: The Case of Zakat Institutions in Malaysia. J. Pengur. 2014, 42, 19–29. [Google Scholar] [CrossRef]
  31. Krasodomska, J.; Cho, C.H. Corporate Social Responsibility Disclosure: Perspectives from Sell-Side and Buy-Side Financial Analysts. Sustain. Account. Manag. Policy J. 2017, 8, 2–19. [Google Scholar] [CrossRef]
  32. Arvidsson, S. Disclosure of Non-financial Information in the Annual Report: A Management-team Perspective. J. Intellect. Cap. 2011, 12, 277–300. [Google Scholar] [CrossRef]
  33. Tarquinio, L.; Posadas, S.C. Exploring the Term “Non-Financial Information”: An Academics’ View. Meditari Account. Res. 2020, 28, 727–749. [Google Scholar] [CrossRef]
  34. Oladimeji, M.S.; Eze, B.U.; Akanni, K.A. Business Eco System and Micro, Small and Medium Enterprises (Msmes) Performance in Nigeria. Int. J. Entrep. Knowl. 2018, 6, 76–86. [Google Scholar] [CrossRef]
  35. Kumar, N.; Ganguly, K.K. Non-Financial e-Procurement Performance Measures: Their Interdependence and Impact on Production Cost. Int. J. Product. Perform. Manag. 2020, 70, 41–64. [Google Scholar] [CrossRef]
  36. Cho, M.; Ibrahim, S. Non-Financial Performance Measures and Pay-Performance Sensitivity. J. Financ. Report. Account. 2022, 20, 185–214. [Google Scholar] [CrossRef]
  37. Wicaksono, H.; Muchtar, S. The Effect of Dividend Policy and Environmental Social Governance on Company Performance with Moderation of Good Corporate Governance in IDX LQ45 Companies. Neraca Keuang. J. Ilm. Akunt. Keuang. 2024, 19, 182–192. [Google Scholar] [CrossRef]
  38. Karami, M.; Ghiasvand, A.; Hematfar, M. Identifying Financial and Non-Financial Metrics Affecting Companies’ Sustainability Performance: A Thematic Analysis Approach. Int. J. Innov. Manag. Organ. Behav. 2023, 3, 1–9. [Google Scholar] [CrossRef]
  39. Schönherr, N.; Findler, F.; Martinuzzi, A. Exploring the Interface of CSR and the Sustainable Development Goals. Transnatl. Corp. 2017, 24, 33–47. [Google Scholar] [CrossRef]
  40. Delgado-Ceballos, J.; Ortiz-De-Mandojana, N.; Antolín-López, R.; Montiel, I. Connecting the Sustainable Development Goals to Firm-Level Sustainability and ESG Factors: The Need for Double Materiality. BRQ Bus. Res. Q. 2023, 26, 2–10. [Google Scholar] [CrossRef]
  41. Khalid, F.; Sun, J.; Huang, G.; Su, C.-Y. Environmental, Social and Governance Performance of Chinese Multinationals: A Comparison of State- and Non-State-Owned Enterprises. Sustainability 2021, 13, 4020. [Google Scholar] [CrossRef]
  42. Albu, C.-N.; Albu, N.; Dumitru, M.; Fota, M.-S.; Guşe, R.G. Sustainability Reporting in Central and Eastern European Countries. In Research Handbook on Sustainability Reporting; Rimmel, G., Aras, G., Baboukardos, D., Krasodomska, J., Nielsen, C., Schiemann, F., Eds.; Edward Elgar Publishing: Gloucestershire, UK, 2024; pp. 400–417. ISBN 978-1-03-531626-7. [Google Scholar]
  43. David, L.K.; Wang, J.; David, V. Economic and Governance Dimensions of ESG Performance: A Comparative Study in the Developing and European Countries. J. Dev. Areas 2024, 58, 221–240. [Google Scholar] [CrossRef]
  44. Siwiec, K.; Karkowska, R. Relationship between ESG and Financial Performance of Companies in the Central and Eastern European Region. Cent. Eur. Econ. J. 2024, 11, 178–199. [Google Scholar] [CrossRef]
  45. Radu, O.-M.; Dragomir, V.D.; Ionescu-Feleagă, L. The Conceptual Link between Country Competitiveness and Corporate ESG Performance. Proc. Int. Conf. Bus. Excell. 2023, 17, 763–775. [Google Scholar] [CrossRef]
  46. Zumente, I.; Lāce, N. Are We There yet? The Evaluation of ESG Impact on Corporate Financial Performance in CEE. In Proceedings of the 12th International Scientific Conference, Vilnius, Lithuania, 12–13 May 2022; Vilnius Gediminas Technical University: Vilnius, Lithuania, 2022. [Google Scholar]
  47. Dagilienė, L.; Bruneckienė, J.; Jucevičius, R.; Lukauskas, M. Exploring Smart Economic Development and Competitiveness in Central and Eastern European Countries. Compet. Rev. 2020, 30, 485–505. [Google Scholar] [CrossRef]
  48. Brodny, J.; Tutak, M. The Level of Digitization of Small, Medium and Large Enterprises in the Central and Eastern European Countries and Its Relationship with Economic Parameters. J. Open Innov. Technol. Mark. Complex. 2022, 8, 113. [Google Scholar] [CrossRef]
  49. Novak, J.; Purta, M.; Marciniak, T.; Ignatowicz, K.; Rozenbaum, K.; Yearwood, K. The Rise of Digital Challengers How Digitization Can Become the Next Growth Engine for Central and Eastern Europe; Digital McKinsey, McKinsey & Company: New York, NY, USA, 2018. [Google Scholar]
  50. Kahrović, E.; Avdović, A. Impact of Digital Technologies on Business Performance in Serbia. Manag. J. Sustain. Bus. Manag. Solut. Emerg. Econ. 2023, 28, 37. [Google Scholar] [CrossRef]
  51. Katz, R.; Koutroumpis, P.; Martin Callorda, F. Using a Digitization Index to Measure the Economic and Social Impact of Digital Agendas. Info 2014, 16, 32–44. [Google Scholar] [CrossRef]
  52. Cieślik, E. The Cross-Sectoral Technological Interdependencies of Central and Eastern Europe in the Era of Industry 4.0 and Chinese Digital Silk Road. Acta Sci. Pol. Oeconomia 2023, 22, 19–31. [Google Scholar] [CrossRef]
  53. Yang, P.; Hao, X.; Wang, L.; Zhang, S.; Yang, L. Moving toward Sustainable Development: The Influence of Digital Transformation on Corporate ESG Performance. Kybernetes 2024, 53, 669–687. [Google Scholar] [CrossRef]
  54. Esamah, A.; Aujirapongpan, S.; Rakangthong, N.K.; Imjai, N. Agile Leadership and Digital Transformation in Savings Cooperative Limited: Impact on Sustainable Performance Amidst COVID-19. J. Hum. Earth Future 2023, 4, 36–53. [Google Scholar] [CrossRef]
  55. Liu, Q.; Wan, H.; Yu, H. Digital Transformation and Corporate Performance: The Moderating Role of Corporate Culture. Acad. J. Manag. Soc. Sci. 2023, 3, 90–93. [Google Scholar] [CrossRef]
  56. Paiola, M.; Gebauer, H. Internet of Things Technologies, Digital Servitization and Business Model Innovation in BtoB Manufacturing Firms. Ind. Mark. Manag. 2020, 89, 245–264. [Google Scholar] [CrossRef]
  57. Tronvoll, B.; Sklyar, A.; Sörhammar, D.; Kowalkowski, C. Transformational Shifts through Digital Servitization. Ind. Mark. Manag. 2020, 89, 293–305. [Google Scholar] [CrossRef]
  58. Aldowaish, A.; Kokuryo, J.; Almazyad, O.; Goi, H.C. How to Manage Conflicts in the Process of ESG Integration? A Case of a Japanese Firm. Sustainability 2024, 16, 3391. [Google Scholar] [CrossRef]
  59. Trantopoulos, K.; Von Krogh, G.; Wallin, M.W.; Woerter, M. External Knowledge and Information Technology: Implications for Process Innovation Performance. MIS Q. 2017, 41, 287–300. [Google Scholar] [CrossRef]
  60. Kraus, S.; Durst, S.; Ferreira, J.J.; Veiga, P.; Kailer, N.; Weinmann, A. Digital Transformation in Business and Management Research: An Overview of the Current Status Quo. Int. J. Inf. Manag. 2022, 63, 102466. [Google Scholar] [CrossRef]
  61. Chen, J.-S.; Khiêm, M.Đ.; Tsou, H.-T. Digital Organisational Restructuring on Business Value Creation in SMEs during the COVID-19 Pandemic. Technol. Anal. Strateg. Manag. 2024, 36, 4036–4051. [Google Scholar] [CrossRef]
  62. Bai, C.; Quayson, M.; Sarkis, J. COVID-19 Pandemic Digitization Lessons for Sustainable Development of Micro-and Small- Enterprises. Sustain. Prod. Consum. 2021, 27, 1989–2001. [Google Scholar] [CrossRef]
  63. Nicolescu, O.; Nicolescu, C. Stakeholder Management and Social Responsibility: Concepts, Approaches and Tools in the Covid Context, 1st ed.; Routledge: New York, NY, USA, 2021; ISBN 978-1-00-321770-1. [Google Scholar]
  64. Wang, J. Digital Transformation, Environmental Regulation and Enterprises’ ESG Performance: Evidence from China. Corp. Soc. Responsib. Environ. Manag. 2024, 32, 1567–1582. [Google Scholar] [CrossRef]
  65. Li, Y.; Zheng, Y.; Li, X.; Mu, Z. The Impact of Digital Transformation on ESG Performance. Int. Rev. Econ. Financ. 2024, 96, 103686. [Google Scholar] [CrossRef]
  66. He, X.; Chen, W. Digital Transformation and Environmental, Social, and Governance Performance from a Human Capital Perspective. Sustainability 2024, 16, 4737. [Google Scholar] [CrossRef]
  67. Wang, D.; Xia, X. The Impact of Digital Transformation on Firms’ Value: Examining the Role of ESG Performance and the Effect of Information Interaction. Bus. Process Manag. J. 2024, 30, 1236–1265. [Google Scholar] [CrossRef]
  68. Kim, D.; Cho, K. Digital Transformation Characteristics of the Semiconductor Industry Ecosystem. Sustainability 2022, 15, 483. [Google Scholar] [CrossRef]
  69. Liu, N.; Xu, Q.; Gao, M. Digital Transformation and Tourism Listed Firm Performance in COVID-19 Shock. Financ. Res. Lett. 2024, 63, 105398. [Google Scholar] [CrossRef]
  70. Bocken, N.M.P.; Short, S.W.; Rana, P.; Evans, S. A Literature and Practice Review to Develop Sustainable Business Model Archetypes. J. Clean. Prod. 2014, 65, 42–56. [Google Scholar] [CrossRef]
  71. Magableh, K.N.Y.; Kannan, S.; Hmoud, A.Y.R. Innovation Business Model: Adoption of Blockchain Technology and Big Data Analytics. Sustainability 2024, 16, 5921. [Google Scholar] [CrossRef]
  72. Kohtamäki, M.; Leminen, S.; Parida, V. Conceptualizing Digital Business Models (DBM): Framing the Interplay between Digitalization and Business Models. Technovation 2024, 133, 103013. [Google Scholar] [CrossRef]
  73. Guo, Y.-M.; Huang, Z.-L.; Guo, J.; Li, H.; Guo, X.-R.; Nkeli, M.J. Bibliometric Analysis on Smart Cities Research. Sustainability 2019, 11, 3606. [Google Scholar] [CrossRef]
  74. Zupic, I.; Čater, T. Bibliometric Methods in Management and Organization. Organ. Res. Methods 2015, 18, 429–472. [Google Scholar] [CrossRef]
  75. Adams, J. The Rise of Research Networks. Nature 2012, 490, 335–336. [Google Scholar] [CrossRef]
  76. Glänzel, W.; Schubert, A. Analysing Scientific Networks Through Co-Authorship. In Handbook of Quantitative Science and Technology Research; Moed, H.F., Glänzel, W., Ulrich, S., Eds.; Kluwer Academic Publishers: Dordrecht, The Netherlands, 2005; pp. 257–276. ISBN 978-1-4020-2702-4. [Google Scholar]
  77. Habib, R.; Afzal, M.T. Sections-Based Bibliographic Coupling for Research Paper Recommendation. Scientometrics 2019, 119, 643–656. [Google Scholar] [CrossRef]
  78. Vogel, B.; Reichard, R.J.; Batistič, S.; Černe, M. A Bibliometric Review of the Leadership Development Field: How We Got Here, Where We Are, and Where We Are Headed. Leadersh. Q. 2021, 32, 101381. [Google Scholar] [CrossRef]
  79. Esses, D.; Csete, M.S.; Németh, B. Sustainability and Digital Transformation in the Visegrad Group of Central European Countries. Sustainability 2021, 13, 5833. [Google Scholar] [CrossRef]
  80. El Hilali, W.; El Manouar, A.; Janati Idrissi, M.A. Reaching Sustainability during a Digital Transformation: A PLS Approach. Int. J. Innov. Sci. 2020, 12, 52–79. [Google Scholar] [CrossRef]
  81. Feroz, A.K.; Zo, H.; Chiravuri, A. Digital Transformation and Environmental Sustainability: A Review and Research Agenda. Sustainability 2021, 13, 1530. [Google Scholar] [CrossRef]
  82. Hurduzeu, G.; Lupu, I.; Lupu, R.; Filip, R.I. The Interplay between Digitalization and Competitiveness: Evidence from European Countries. Societies 2022, 12, 157. [Google Scholar] [CrossRef]
  83. Zolkover, A.; Petrunenko, I.; Iastremska, O.; Stashkevych, O.; Mehdizade, M.M. Benefits and Risks of Digital Business Transformation: The Example of Eastern Europe Countries. J. East. Eur. Cent. Asian Res. 2022, 9, 344–356. [Google Scholar] [CrossRef]
  84. Wozniak-Jechorek, B. Examining the European Transition: Central Eastern European Countries Two Decades Post-EU Accession. Rev. Econ. Políticas Públicas 2024, 12, 48–60. [Google Scholar] [CrossRef]
  85. Istenič, S.P.; Kozina, J. Participatory Planning in a Post-Socialist Urban Context: Experience from Five Cities in Central and Eastern Europe. In Participatory Research and Planning in Practice; Nared, J., Bole, D., Eds.; The Urban Book Series; Springer International Publishing: Cham, Switzerland, 2020; pp. 31–50. ISBN 978-3-030-28013-0. [Google Scholar]
  86. Meyer-Sahling, J.; Van Stolk, C. A Case of Partial Convergence: The Europeanization of Central Government in Central and Eastern Europe. Public Adm. 2015, 93, 230–247. [Google Scholar] [CrossRef]
  87. Wang, Q.; Wang, H.; Feng, G.; Chang, C. Impact of Digital Transformation on Performance of Environment, Social, and Governance: Empirical Evidence from China. Bus. Ethics Environ. Responsib. 2023, 32, 1373–1388. [Google Scholar] [CrossRef]
  88. Li, H.; Xu, J. Impact of Digital Government on Digital Transformation of Enterprises from the Perspective of Urban Economic Sustainable Development. Sustainability 2024, 16, 2667. [Google Scholar] [CrossRef]
  89. World Bank. World Development Indicators; World Bank: Washington, DC, USA, 2021. [Google Scholar]
  90. European Commission. Eurostat—Statistics Explained; European Commision: Brussels, Belgium, 2022. [Google Scholar]
  91. Baltagi, B.H. Econometric Analysis of Panel Data, 3rd ed.; J. Wiley & Sons: Chichester, UK; Hoboken, NJ, USA, 2005; ISBN 978-0-470-01456-1. [Google Scholar]
  92. Wooldridge, J.M. Econometric Analysis of Cross Section and Panel Data, 2nd ed.; MIT Press: Cambridge, MA, USA; London, UK, 2010; ISBN 978-0-262-23258-6. [Google Scholar]
  93. Hsiao, C. Panel Data Analysis—Advantages and Challenges. TEST 2007, 16, 1–22. [Google Scholar] [CrossRef]
  94. Angrist, J.D.; Pischke, J.-S. Mostly Harmless Econometrics: An Empiricist’s Companion; Princeton University Press: Princeton, NJ, USA; Oxford, UK, 2009; ISBN 978-0-691-12035-5. [Google Scholar]
  95. World Bank. Worldwide Governance Indicators; World Bank: Washington, DC, USA, 2021. [Google Scholar]
  96. Kaufmann, D.; Kraay, A.; Mastruzz, M. “Governance Matters VIII: Aggregate and Individual Governance Indicators 1996–2008” Policy Research Working Paper 4978; The World Bank: Washington, DC, USA, 2009. [Google Scholar]
  97. Eurostat. Research and Development (R&D) Statistics; Eurostat: Luxembourg, 2022. [Google Scholar]
  98. Noja, G.G.; Cristea, M.; Panait, M.; Trif, S.M.; Ponea, C. Ștefan The Impact of Energy Innovations and Environmental Performance on the Sustainable Development of the EU Countries in a Globalized Digital Economy. Front. Environ. Sci. 2022, 10, 934404. [Google Scholar] [CrossRef]
  99. Ali, S.; Dogan, E.; Chen, F.; Khan, Z. International Trade and Environmental Performance in Top ten-emitters Countries: The Role of eco-innovation and Renewable Energy Consumption. Sustain. Dev. 2021, 29, 378–387. [Google Scholar] [CrossRef]
  100. Doran, N.M.; Bădîrcea, R.M.; Manta, A.G. Digitization and Financial Performance of Banking Sectors Facing COVID-19 Challenges in Central and Eastern European Countries. Electronics 2022, 11, 3483. [Google Scholar] [CrossRef]
  101. Huber, P.J. Robust Estimation of a Location Parameter. Ann. Math. Statist. 1964, 35, 73–101. [Google Scholar] [CrossRef]
  102. Davies, L.; Gather, U. The Identification of Multiple Outliers. J. Am. Stat. Assoc. 1993, 88, 782–792. [Google Scholar] [CrossRef]
  103. Rousseeuw, P.J.; Leroy, A.M. Robust Regression and Outlier Detection; Wiley Series in Probability and Mathematical Statistics; Wiley: New York, NY, USA, 1987; ISBN 978-0-471-85233-9. [Google Scholar]
  104. European Environment Agency (EEA). Renewable Energy in Latvia; European Environment Agency (EEA): Copenhagen, Denmark, 2021. [Google Scholar]
  105. Levin, A.; Lin, C.-F.; James Chu, C.-S. Unit Root Tests in Panel Data: Asymptotic and Finite-Sample Properties. J. Econom. 2002, 108, 1–24. [Google Scholar] [CrossRef]
  106. Ladu, M.G.; Meleddu, M. Is There Any Relationship between Energy and TFP (Total Factor Productivity)? A Panel Cointegration Approach for Italian Regions. Energy 2014, 75, 560–567. [Google Scholar] [CrossRef]
  107. Harris, R.D.F.; Tzavalis, E. Inference for Unit Roots in Dynamic Panels Where the Time Dimension Is Fixed. J. Econom. 1999, 91, 201–226. [Google Scholar] [CrossRef]
  108. Jiang, H.; Chen, Z.; Liang, Y.; Zhao, W.; Liu, D.; Chen, Z. The Impact of Industrial Structure Upgrading and Digital Economy Integration on China’s Urban Carbon Emissions. Front. Ecol. Evol. 2023, 11, 1231855. [Google Scholar] [CrossRef]
  109. Yu, Z.; Liu, S.; Zhu, Z. Has the Digital Economy Reduced Carbon Emissions?: Analysis Based on Panel Data of 278 Cities in China. Int. J. Environ. Res. Public Health 2022, 19, 11814. [Google Scholar] [CrossRef]
  110. Xu, X.; Huang, N.; Wang, S. Digital Economy Enables Low-Carbon Agricultural Development in Liaoning Province under the “Double Carbon” Goal. Adv. Econ. Dev. Manag. Res. 2024, 1, 154. [Google Scholar] [CrossRef]
  111. Vuksanović Herceg, I.; Kuč, V.; Mijušković, V.M.; Herceg, T. Challenges and Driving Forces for Industry 4.0 Implementation. Sustainability 2020, 12, 4208. [Google Scholar] [CrossRef]
  112. Mokeeva, T.; Yurko, K. Using Digital Tools in Government Procurement Analysis: Detecting Suspicious Purchases with Control Indicators. Int. J. Technol. 2023, 14, 1821. [Google Scholar] [CrossRef]
  113. Van Tonder, C.; Hasanefendic, S.; Bossink, B.; Schachtebeck, C.; Nieuwenhuizen, C. Internal Organizational Factors Driving Digital Transformation for Business Model Innovation in SMEs. J. Bus. Models 2023, 11, 86–109. [Google Scholar] [CrossRef]
  114. Güler, M.; Büyüközkan, G. A Survey of Digital Government: Science Mapping Approach, Application Areas, and Future Directions. Systems 2023, 11, 563. [Google Scholar] [CrossRef]
  115. Ionescu-Feleagă, L.; Ionescu, B.-. Ștefan; Stoica, O.C. The Link between Digitization and the Sustainable Development in European Union Countries. Electronics 2023, 12, 961. [Google Scholar] [CrossRef]
  116. Stalmachova, K.; Chinoracky, R.; Strenitzerova, M. Changes in Business Models Caused by Digital Transformation and the COVID-19 Pandemic and Possibilities of Their Measurement—Case Study. Sustainability 2021, 14, 127. [Google Scholar] [CrossRef]
  117. Gao, F.; Lin, C.; Zhai, H. Digital Transformation, Corporate Innovation, and International Strategy: Empirical Evidence from Listed Companies in China. Sustainability 2022, 14, 8137. [Google Scholar] [CrossRef]
  118. Li, N.; Liu, Z.; Zhang, X. A Study on the Impact of Dynamic Visitor Demand on the Digital Transformation of Enterprises—Considerations Based on the Regional Innovation Environment and the Level of Big Data. Sustainability 2022, 15, 261. [Google Scholar] [CrossRef]
  119. Wang, D. The Long-Term Impact of Digital Transformation on Businesses: The Lagging Effect of Digitalisation. 2023. Available online: https://ssrn.com/abstract=4591187 (accessed on 10 December 2024).
Figure 1. Terms network analysis map.
Electronics 14 01226 g001
Figure 2. Keyword network analysis map.
Electronics 14 01226 g002
Figure 3. Country cooperation network in the studied field: the network of co-authorship by countries.
Electronics 14 01226 g003
Figure 4. Country cooperation network in the studied field: the network of bibliographic coupling by countries.
Electronics 14 01226 g004
Figure 5. CO2 emissions and renewable energy consumption, CEE countries, 2013–2023. Source: Authors’ research in STATA 18.
Electronics 14 01226 g005
Figure 6. Ratio of female-to-male labor force participation rate and unemployment, CEE countries, 2013–2023. Source: Authors’ research in STATA 18.
Electronics 14 01226 g006
Figure 7. Regulatory quality: estimate (RQ.EST) and government effectiveness: estimate, CEE countries, 2013–2023. Source: Authors’ research in STATA 18.
Electronics 14 01226 g007
Figure 8. The Digital Economy and Society Index, CEE countries, 2017–2023. Source: Authors’ research in STATA 18.
Electronics 14 01226 g008
Figure 9. Components of the Digital Economy and Society Index, CEE countries, 2017–2023. Source: Authors’ research in STATA 18.
Electronics 14 01226 g009
Figure 10. Real GDP/Capita, CEE countries, 2017–2023. Source: Authors’ research in STATA 18.
Electronics 14 01226 g010
Figure 11. Government expenditure on education and gross domestic expenditure on R&D, CEE countries, 2017–2023. Source: Authors’ research in STATA 18.
Electronics 14 01226 g011
Figure 12. Correlation heatmap. Source: Authors’ research in STATA 18.
Electronics 14 01226 g012
Table 1. Primary literature review on digital transformation defining.
ConceptApproach/DefinitionSources
Digital transformationThe process of leveraging (emerging) digital technologies to meet consumer needs/empower enterprises.[4,5,6,7]
A comprehensive rethinking of organizational strategies and structures.[8,9,10,11]
The process of triggering major changes in enterprise organizational characteristics and reconstructing the organizational structure, behavior, and operating system through the combined application of information technology (IT), computing, communication, and connection technologies.[6,12]
A profound socioeconomic change that spans across multiple levels, including individuals, organizations, ecosystems, and, ultimately, societies.[3,13,14,15]
Source: Authors.
Table 2. Primary literature review on non-financial performance defining.
ConceptApproach/DefinitionSources
Non-financial performanceA firm’s long-term success in customer satisfaction, internal business process efficiency, innovation, and employee satisfaction.[26,27,28]
The company’s social accountability.[29,30,31]
The companies’ intellectual capital.[32,33]
Source: Authors.
Table 3. The keywords with the greatest total link strength of the co-occurrence on studied topic.
KeywordsOccurrencesLinksTotal Link Strength
digital transformation9342615947
performance5952594052
innovation4312543009
impact3492552443
dynamic capabilities2802362268
management2852502136
firm performance2602461987
technology2022301499
big data1522181228
strategy1561991179
Source: Authors, Vosviewer data processing.
Table 4. Number of articles by SDG addressed on the topic.
SDGNumber of Articles
09 Industry Innovation and Infrastructure784
12 Responsible Consumption and Production202
04 Quality Education66
08 Decent Work and Economic Growth57
13 Climate Action45
01 No Poverty41
03 Good Health and Well-Being19
11 Sustainable Cities and Communities19
10 Reduced Inequality10
02 Zero Hunger8
07 Affordable and Clean Energy5
05 Gender Equality3
15 Life on Land2
16 Peace and Justice Strong Institutions1
14 Life Below Water1
Source: Authors, WOS data processing.
Table 5. Summary statistics of the data used in the analysis.
VariablenMeanStandard DeviationMinimumMaximum
CO2EM1106.02122.41463.5614.3
renergcons8823.02848.995410.743.8
labforfm12178.64224.418866.486.1
unempl1216.80503.0406217.3
regq1100.87090.37130.21.7
goveffect1100.65730.4167−0.31.3
desi6637.41598.562819.456.51
desihc6621.46335.574110.4631.12
desicon665.61012.25361.5114.31
desiintdigtech662.80572.0021−1.076.88
desidigpubserv6651.174718.23947.4191.18
rgdpcapita12113,155.293743.506547022,130
govexpeduc9811.49592.05487.815.8
gdexprd1101.17340.51690.302.56
Source: Authors’ contribution in Stata 18.
Table 6. Panel unit root test (Levin–Chin–Chu test and the Harris Tzavalis test).
VariableAdjusted t-Statz-Valuep-Value
Levin-Lin-ChuHarris-TzavalisLevin-Lin-ChuHarris-Tzavalis
CO2EM−2.3175−1.84320.01020.0695
renergcons−0.91931.56270.07900.0409
labforfm−0.66571.82880.05280.0964
unempl−5.99771.37360.00000.0457
regq−1.1220−2.29240.13090.0109
goveffect−3.5944−1.18760.00020.1175
desi11.34055.11650.00000.0600
desihc−1.8428−3.90200.03270.0000
desicon−9.62983.04660.00000.0988
desiintdigtech1.26482.40500.09770.0819
desidigpubserv22.84733.70160.13000.0499
rgdpcapita−2.50072.03080.00620.0789
govexpeduc−1.89−4.56800.05430.0319
gdexprd−3.5730−3.60870.00020.0514
Source: Authors’ research in STATA 18.
Table 7. Correlation matrix.
Variables(1)(2)(3)(4)(5)(6)(7)(8)(9)(10)(11)(12)(13)(14)
(1) CO2EM1.000
(2) RENERGCONS−0.366 ***1.000
(3) LABFORFM0.0490.483 ***1.000
(4) UNEMPL−0.320 ***0.308 ***0.179 **1.000
(5) REGQ0.534 ***0.176 *0.371 ***−0.155 *1.000
(6) GOVEFEECT0.346 ***0.268 **0.581 ***0.0730.722 ***1.000
(7) DESI0.1440.543 ***0.707 ***0.1340.616 ***0.724 ***1.000
(8) DESIHC0.1640.2430.432 ***0.257 **0.414 ***0.677 ***0.612 ***1.000
(9) DESICON−0.050−0.025−0.087−0.308 **−0.0170.1500.369 ***0.1981.000
(10) DESIINTDIGTECH0.259 **0.2120.616 ***0.0180.557 ***0.746 ***0.869 ***0.718 ***0.277 **1.000
(11) DESIDIGPUBSERV0.218 *0.504 ***0.769 ***0.1510.749 ***0.771 ***0.923 ***0.534 ***0.1720.754 ***1.000
(12) RGDPCAPITA0.396 ***−0.1240.393 ***−0.325 ***0.374 ***0.705 ***0.604 ***0.642 ***0.380 ***0.788 ***0.483 ***1.000
(13) GOVEXPEDUC0.252 **0.579 ***0.599 ***0.0690.729 ***0.700 ***0.662 ***0.357 ***−0.0500.428 ***0.785 ***0.227 **1.000
(14) GDEXPRD0.544 ***−0.297 ***0.296 ***−0.330 ***0.269 ***0.565 ***0.489 ***0.491 ***0.371 ***0.662 ***0.435 ***0.785 ***0.1361.000
*** p < 0.01, ** p < 0.05, * p < 0.1. Source: Authors’ research in STATA 18.
Table 8. The results of the models processed to assess the impact of the Digital Economy and Society Index (desi) upon non-financial performance (environmental—CO2 emissions, renewable energy consumption, social—ratio of female-to-male labor force participation rate, unemployment, governance—regulatory quality: estimate (RQ.EST), government effectiveness: estimate), Central and Eastern European countries, 2013–2023.
EnvironmentalSocialGovernance
(1)(2)(3)(4)(5)(6)
CO2EMRENERGCONSLABFORFMUNEMPLREGQGOVEFEECT
DESI−0.122 *
(0.0461)
0.987 ***
(0.208)
0.324 **
(0.102)
0.155 ***
(0.0362)
0.00525
(0.00667)
0.00932
(0.00466)
RGDPCAPITA0.000102
(0.000105)
−0.000516
(0.000405)
0.000290
(0.000233)
0.0000667
(0.0000826)
0.0000304
(0.000015)
0.0000554 ***
(0.0000106)
GOVEXPEDUC0.217
(0.155)
1.119
(0.663)
0.496
(0.344)
−0.0230
(0.122)
0.120 ***
(0.0224)
0.116 ***
(0.0157)
GDEXPRD2.452 **
(0.724)
−10.68 ***
(2.824)
−2.020
(1.603)
−3.172 ***
(0.568)
−0.0270
(0.105)
0.0496
(0.0731)
_cons3.271 *
(1.397)
−3.567
(5.272)
59.44 ***
(3.095)
2.937 *
(1.096)
−1.079 ***
(0.202)
−1.842 ***
(0.141)
R20.4170.7180.5060.5560.6650.881
Woolridge testF(1,10) = 4.524
Prob > F = 0.071
F(1,10) = 4.115
Prob > F = 0.08
F(1,10) = 8.395
Prob > F = 0.045
F(1,10) = 1.507
Prob > F = 0.81
F(1,10) = 5.53
Prob > F = 0.67
F(1,10) = 3.458
Prob > F = 0.087
Standard errors in parentheses. * p < 0.05, ** p < 0.01, *** p < 0.001. Source: Authors’ research in STATA 18.
Table 9. The results of the models processed to assess the impact of the Digital Economy and Society Index components upon non-financial performance (environmental—CO2 emissions, renewable energy consumption, social—ratio of female-to-male labor force participation rate, unemployment, governance—regulatory quality: estimate (RQ.EST), government effectiveness: estimate), Central and Eastern European countries, 2013–2023.
EnvironmentalSocialGovernance
(1)(2)(3)(4)(5)(6)
CO2EMRENERGCONSLABFORFMUNEMPLREGQGOVEFEECT
DESIHC−0.0386
(0.0531)
0.199
(0.266)
−0.0851
(0.117)
0.118 *
(0.0491)
−0.0273 ***
(0.00479)
0.0107
(0.00553)
DESICON−0.404 ***
(0.111)
1.238 *
(0.545)
−0.774 **
(0.245)
−0.0617
(0.103)
−0.0292 **
(0.0100)
−0.0164
(0.0116)
DESIINTDIGTECH−0.496
(0.287)
3.658 **
(1.343)
0.0126
(0.632)
0.182
(0.266)
−0.0411
(0.0259)
−0.0363
(0.0299)
DESIDIGPUBSERV0.0175
(0.0270)
−0.0673
(0.127)
0.217 ***
(0.0596)
0.0403
(0.0250)
0.00977 ***
(0.00244)
0.00837 **
(0.00281)
RGDPCAPITA0.000261 *
(0.000117)
−0.00146 *
(0.000539)
0.000475
(0.000257)
0.0000140
(0.000108)
0.0000967 ***
(0.000011)
0.0000598 ***
(0.0000121)
GOVEXPEDUC−0.177
(0.186)
3.102 ***
(0.855)
−0.254
(0.411)
−0.0955
(0.173)
0.0753 ***
(0.0168)
0.0790 ***
(0.0194)
GDEXPRD2.718 ***
(0.681)
−10.04 **
(3.196)
−1.801
(1.500)
−3.380 ***
(0.630)
0.0245
(0.0614)
0.0584
(0.0708)
_cons4.197 *
(1.765)
4.010
(8.247)
72.12 ***
(3.889)
5.709 **
(1.633)
−0.921 ***
(0.159)
−1.617 ***
(0.184)
R20.5430.7130.6210.5890.9220.906
Woolridge testF(1,10) = 4.167F(1,10) = 3.412F(1,10) = 2.949F(1,10) = 2.369F(1,10) = 1.198F(1,10) = 2.049
Prob > F = 0.06Prob > F = 0.0945Prob > F = 0.079Prob > F = 0.057Prob > F = 0.093Prob > F = 0.117
Standard errors in parentheses. * p < 0.05, ** p < 0.01, *** p < 0.001. Source: Authors’ research in STATA 18.
Disclaimer/Publisher’s Note: The statements, opinions and data contained in all publications are solely those of the individual author(s) and contributor(s) and not of MDPI and/or the editor(s). MDPI and/or the editor(s) disclaim responsibility for any injury to people or property resulting from any ideas, methods, instructions or products referred to in the content.

