Article

Integrated Waveform Design and Signal Processing Based on Composite Noise Nimble Modulated Signals

School of Electronic and Optical Engineering, Nanjing University of Science and Technology, Nanjing 210094, China
*
Author to whom correspondence should be addressed.
These authors contributed equally to this work.
Electronics 2025, 14(6), 1227; https://doi.org/10.3390/electronics14061227
Submission received: 12 February 2025 / Revised: 19 March 2025 / Accepted: 19 March 2025 / Published: 20 March 2025

Abstract

:
In modern radar operations, detection and jamming systems play a critical role. Integrated detection and jamming systems simultaneously fulfill both functions, thereby optimizing resource utilization. In this paper, we introduce a novel random noise frequency modulation nimble modulation integrated signal (RNFM-NMIS) that is designed based on reconnaissance analysis of adversary linear frequency modulated (LFM) radar signal parameters. This waveform facilitates flexible adjustment of parameters, enabling adaptive detection and jamming functions. Furthermore, to address the challenge of direct-wave interference from adversary transmissions, we propose a signal processing method based on time-domain pre-cancellation (TDPC). Simulation and experimental results show that the proposed integrated waveform exhibits excellent and adjustable detection and jamming capabilities. Under the proposed processing method, interference suppression and target detection performance are significantly enhanced, achieving substantial improvements over traditional methods.

1. Introduction

As modern warfare becomes increasingly characterized by informatization, networking, and intelligence, the electromagnetic environment in which combat platforms operate is growing more complex, and consequently, battlefield threats are on the rise [1,2]. To accomplish combat missions in an increasingly harsh battlefield environment, combat platforms have to be equipped with electronic systems such as detection and jamming [3,4]. Detection and jamming systems were initially studied in separate directions due to differences in operation and performance. However, both detection and jamming systems need to occupy a large amount of spectrum resources, and each function needs to be divided into independent spectrum space [5]. Therefore, to save costs and resources and improve countermeasure efficiency, the technology of integrated detection and jamming systems has become a hot research direction in recent years.
The integrated detection and jamming system must interfere with the adversary radar simultaneously as the detection requires the system to work in the same frequency band to form effective interference in electronic countermeasures [6,7]. If these hardware devices with similar systems and consistent operating frequency bands are integrated, the size, power consumption, and cost of the combat platform can be effectively reduced. The Advanced Multifunctional Radio Frequency (AMRFC) program was proposed to improve the electromagnetic interference problem caused by the excessive number of antennas on ships [8]. The AMRFC generates four different waveforms simultaneously in the 6–18 GHz frequency band and adjusts the allocation of resources to adapt to different operational needs by changing the radio frequency (RF) parameters. In recent years, the phase-coded modulated LFM (PC-LFM) waveform in the field of the integrated system of radar and communication has also been utilized as a joint detection and jamming signal [9,10]. A pseudo-random two-phase coding signal based on dual carrier frequency was proposed [11] that realizes the integration of detection and jamming through the allocation of frequency domain resources at two frequency points. The integrated signal was verified to have good distance and velocity resolution ability and noise characteristics, which can form suppressed jamming. Most existing integrated waveforms for detection and jamming can be broadly classified into two design approaches: multiplexing and sharing [12]. In the case of time-division multiplexing (TDM) [13], the system allocates distinct time slots for detection and jamming functions. This temporal separation often leads to inefficient use of available time resources, creating gaps in performance and reducing the system’s real-time responsiveness. Similarly, frequency-division multiplexing (FDM)-integrated waveforms [14] assign separate frequency bands for detection and jamming. However, these methods require a designated protection interval to prevent overlapping and interference between the two functions. Without this interval, the output signal can suffer from significant distortion, compromising overall system performance. However, the cognitive radar developed in recent years leverages adaptive waveform design and intelligent signal processing to optimize detection and jamming performance dynamically [15,16]. By continuously learning from the environment and adjusting its transmission strategy, cognitive radar can overcome the limitations of fixed-parameter multiplexing schemes like TDM and FDM. While cognitive radar systems employ intelligent algorithms to sense and respond to environmental changes adaptively, they often require complex signal processing and substantial computational resources. These demands can limit their real-time responsiveness and practical implementation. Additionally, cognitive radars primarily focus on optimizing detection performance, which may not fully address the simultaneous requirements of jamming capabilities. Therefore, the integrated signal presents a more streamlined and efficient solution for integrated detection and jamming applications. Many integrated waveforms based on the shared design mechanism primarily rely on random signal design while neglecting the use of prior information from other waveforms, which leads to energy dispersion and suboptimal interference performance [17]. Furthermore, most of these integrated waveforms have remained in the realm of theoretical simulation without integrated system experiments, thus failing to reflect their practical detection and jamming capabilities. In scenarios where our integrated detection and jamming radar system confronts adversary LFM radars, our system’s detection and jamming signals operate in the same frequency band as the adversary’s transmissions [18], resulting in significant direct-wave interference. Traditional methods, such as applying fractional Fourier-transform-based filtering [19] or combining sparse recovery techniques [20] to extract pure integrated echoes, are limited by high computational demands and inflexible waveform adjustment capabilities.
In this paper, the confrontation between our integrated detection and jamming equipment and the adversary’s LFM radar [21] is taken as the working scenario. The transmitted signal of the adversary radar is intercepted through the reconnaissance equipment, and its waveform parameters are analyzed. Because the amplitude modulation (AM) [22] signal does not fully utilize the power of the transmitter power amplifier, and the transmitter power amplifier is required to be linear, it is not conducive to the application in practical engineering. The random frequency modulation signal is easier to control the bandwidth, and the interpulse orthogonality is also better. Therefore, a noise frequency modulation (NFM) waveform [23] with the same time width and frequency band as the adversary radar is designed, and the intercepted radar signal is organically fused with the intercepted radar signal by nimble modulation to obtain a random noise frequency modulation nimble modulation integrated signal (RNFM-NMIS). The proposed integrated signal, RNFM-NMIS, enables simultaneous target detection and adversary radar jamming, with the detection and jamming functionalities being finely tunable through adjustments to the modulation coefficient. By unifying both functions into a single, coherent waveform, RNFM-NMIS optimizes the use of time and frequency resources to ensure continuous and effective operation, while its adjustable parameters offer enhanced flexibility to adapt to varying operational conditions. Moreover, RNFM-NMIS significantly improves interference suppression and target detection performance without the need for separate protection intervals, thereby overcoming key limitations inherent in conventional techniques. The effectiveness of this integrated approach in both detection and interference management has been validated through practical experiments. Additionally, considering the direct-wave interference caused by the transmitted signals of an adversary radar, a signal processing method based on time-domain pre-cancellation (TDPC) of the direct-wave interference is proposed. In contrast, amplitude compensation operations may introduce target detection errors due to direct-wave Doppler discrepancies. The effectiveness of the TDPC method, along with the impact of these errors, is validated and analyzed through a series of simulations.
This paper is organized as follows. Section 2 discusses the working scenario of the detection and jamming integrated system. Section 3 presents the signal design scheme of the RNFM-NMIS and analyzes the detection and interference performance by simulation results. In the scenario of strong direct-wave interference from the adversary radar, Section 4 proposes a signal processing method based on TDPC of direct-wave interference. Experimental results to verify the performance of the proposed signal are demonstrated in Section 5. Section 6 simulates the performance of the TDPC method and analyzes the effects due to the direct wave Doppler error. Finally, Section 7 summarizes this paper and discusses its limitations and prospects.

2. Scene Description

The signal design proposed in this paper is based on the typical application scenario of confrontation with the traditional LFM radar. This working scenario includes the adversary radar, the adversary’s protection target, and our integrated equipment for detecting and jamming [24]. The adversary radar transmits LFM signals in a certain direction through the antenna to warn and detect possible threats and provide information support for protecting targets. The purpose of our integrated detecting and jamming system is to detect the protection target and obtain information such as its position, size, and speed. At the same time, it interferes with the adversary radar to reduce its detection performance and achieves the purpose of concealing its integrated equipment to create favorable conditions for improving survivability. The working scene of the detection and jamming integrated system is shown in Figure 1.
In this scenario, our integrated detection and jamming equipment can receive the echo signal reflected by the target and the transmitted signal from the adversary radar. The adversary radar can receive the echo signal reflected by our equipment and the transmitted signal of our equipment. In this working scene, the integrated signal can serve as a detection signal, achieving detection functionality through the integrated echo signal reflected by the target. However, the adversary radar’s transmitted signal also generates co-frequency direct wave interference, necessitating the adjustment of the correlation between the integrated signal and the adversary signal to minimize such interference. The integrated signal can also be utilized as a jamming signal to enter the receiver of the adversary radar, thereby reducing the detection performance of the adversary radar and achieving jamming functionality.

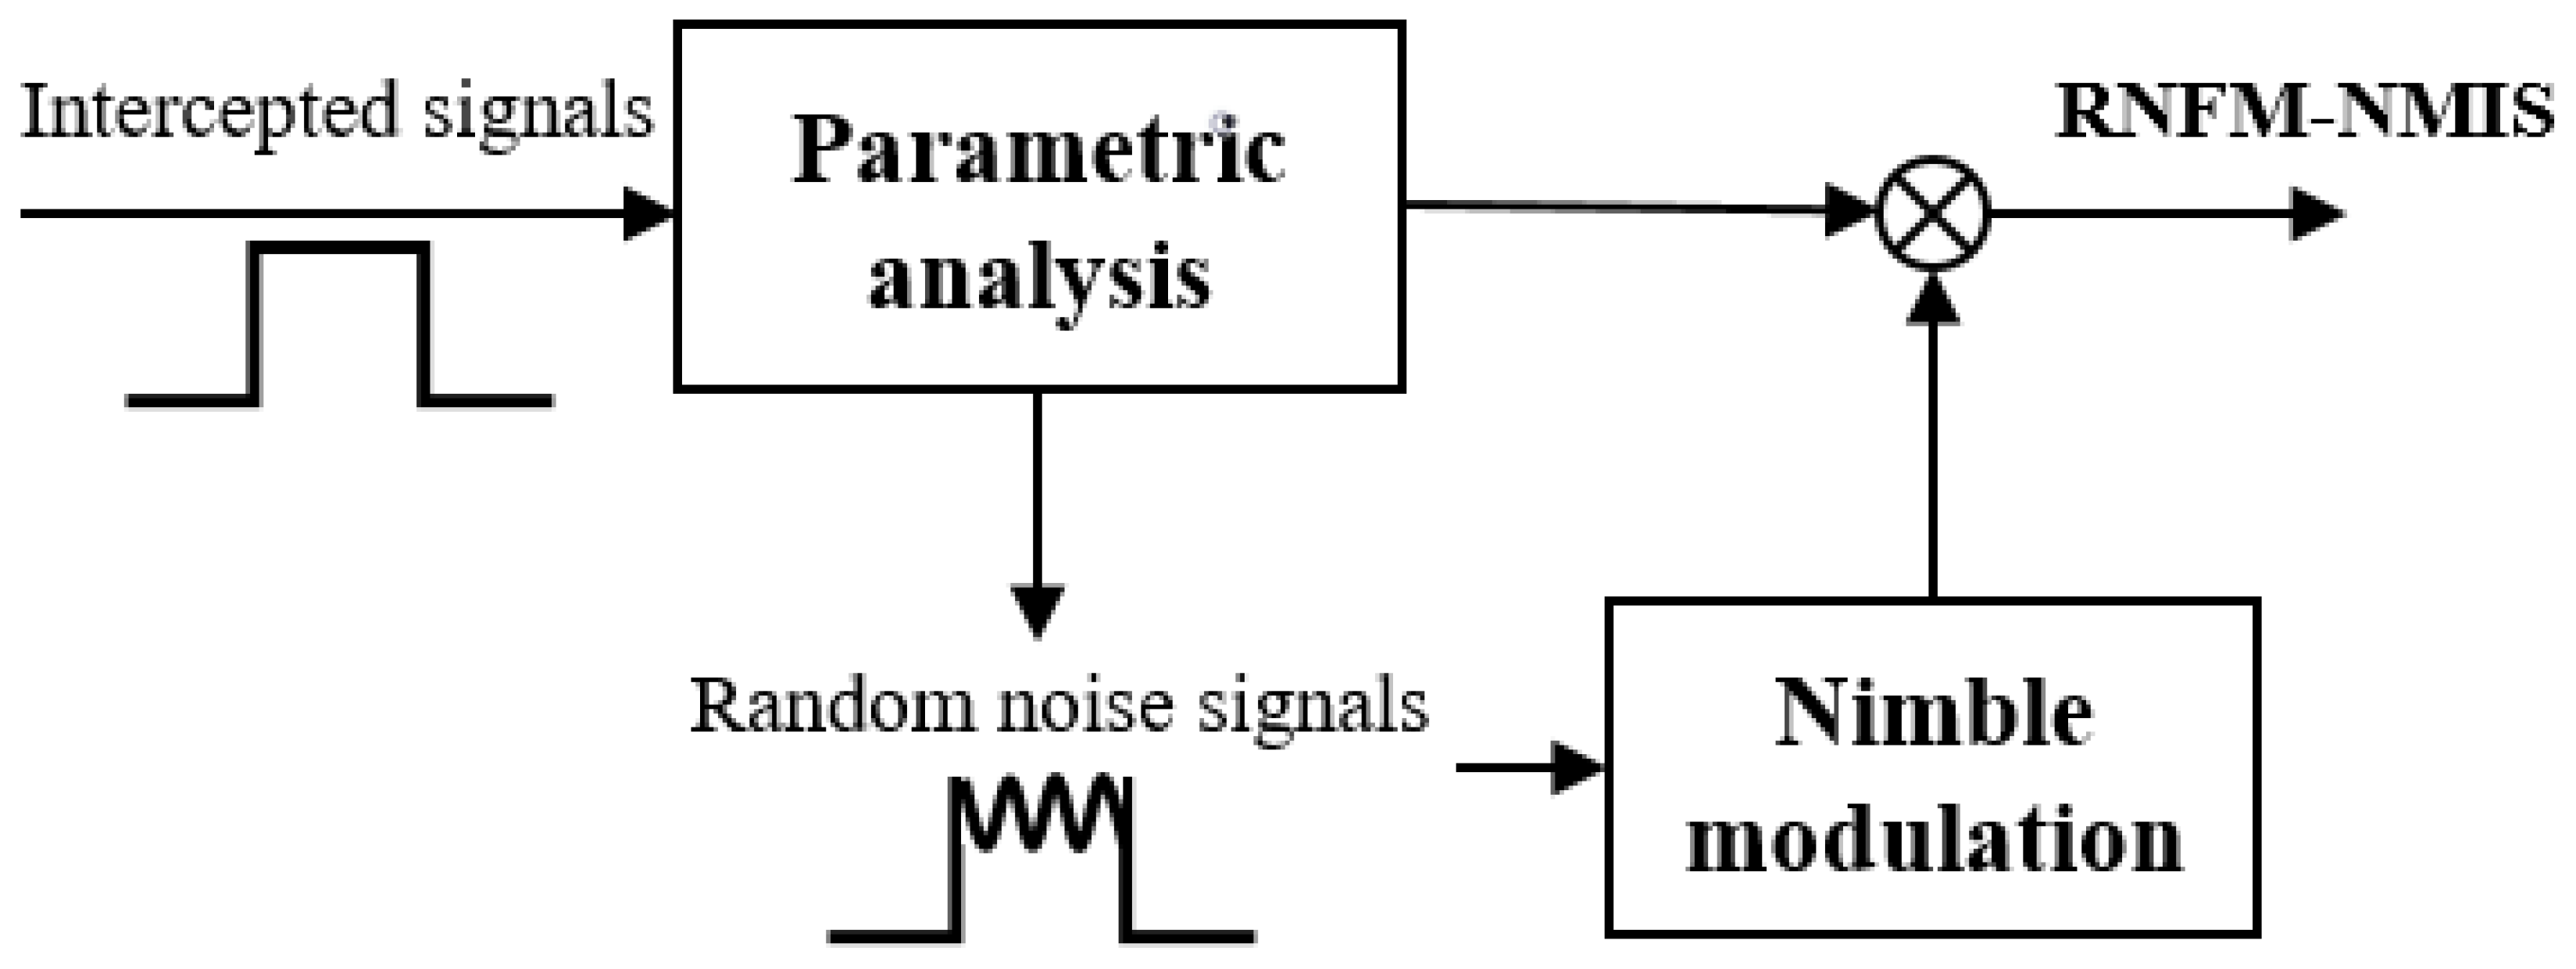
3. Design Scheme of RNFM-NMIS
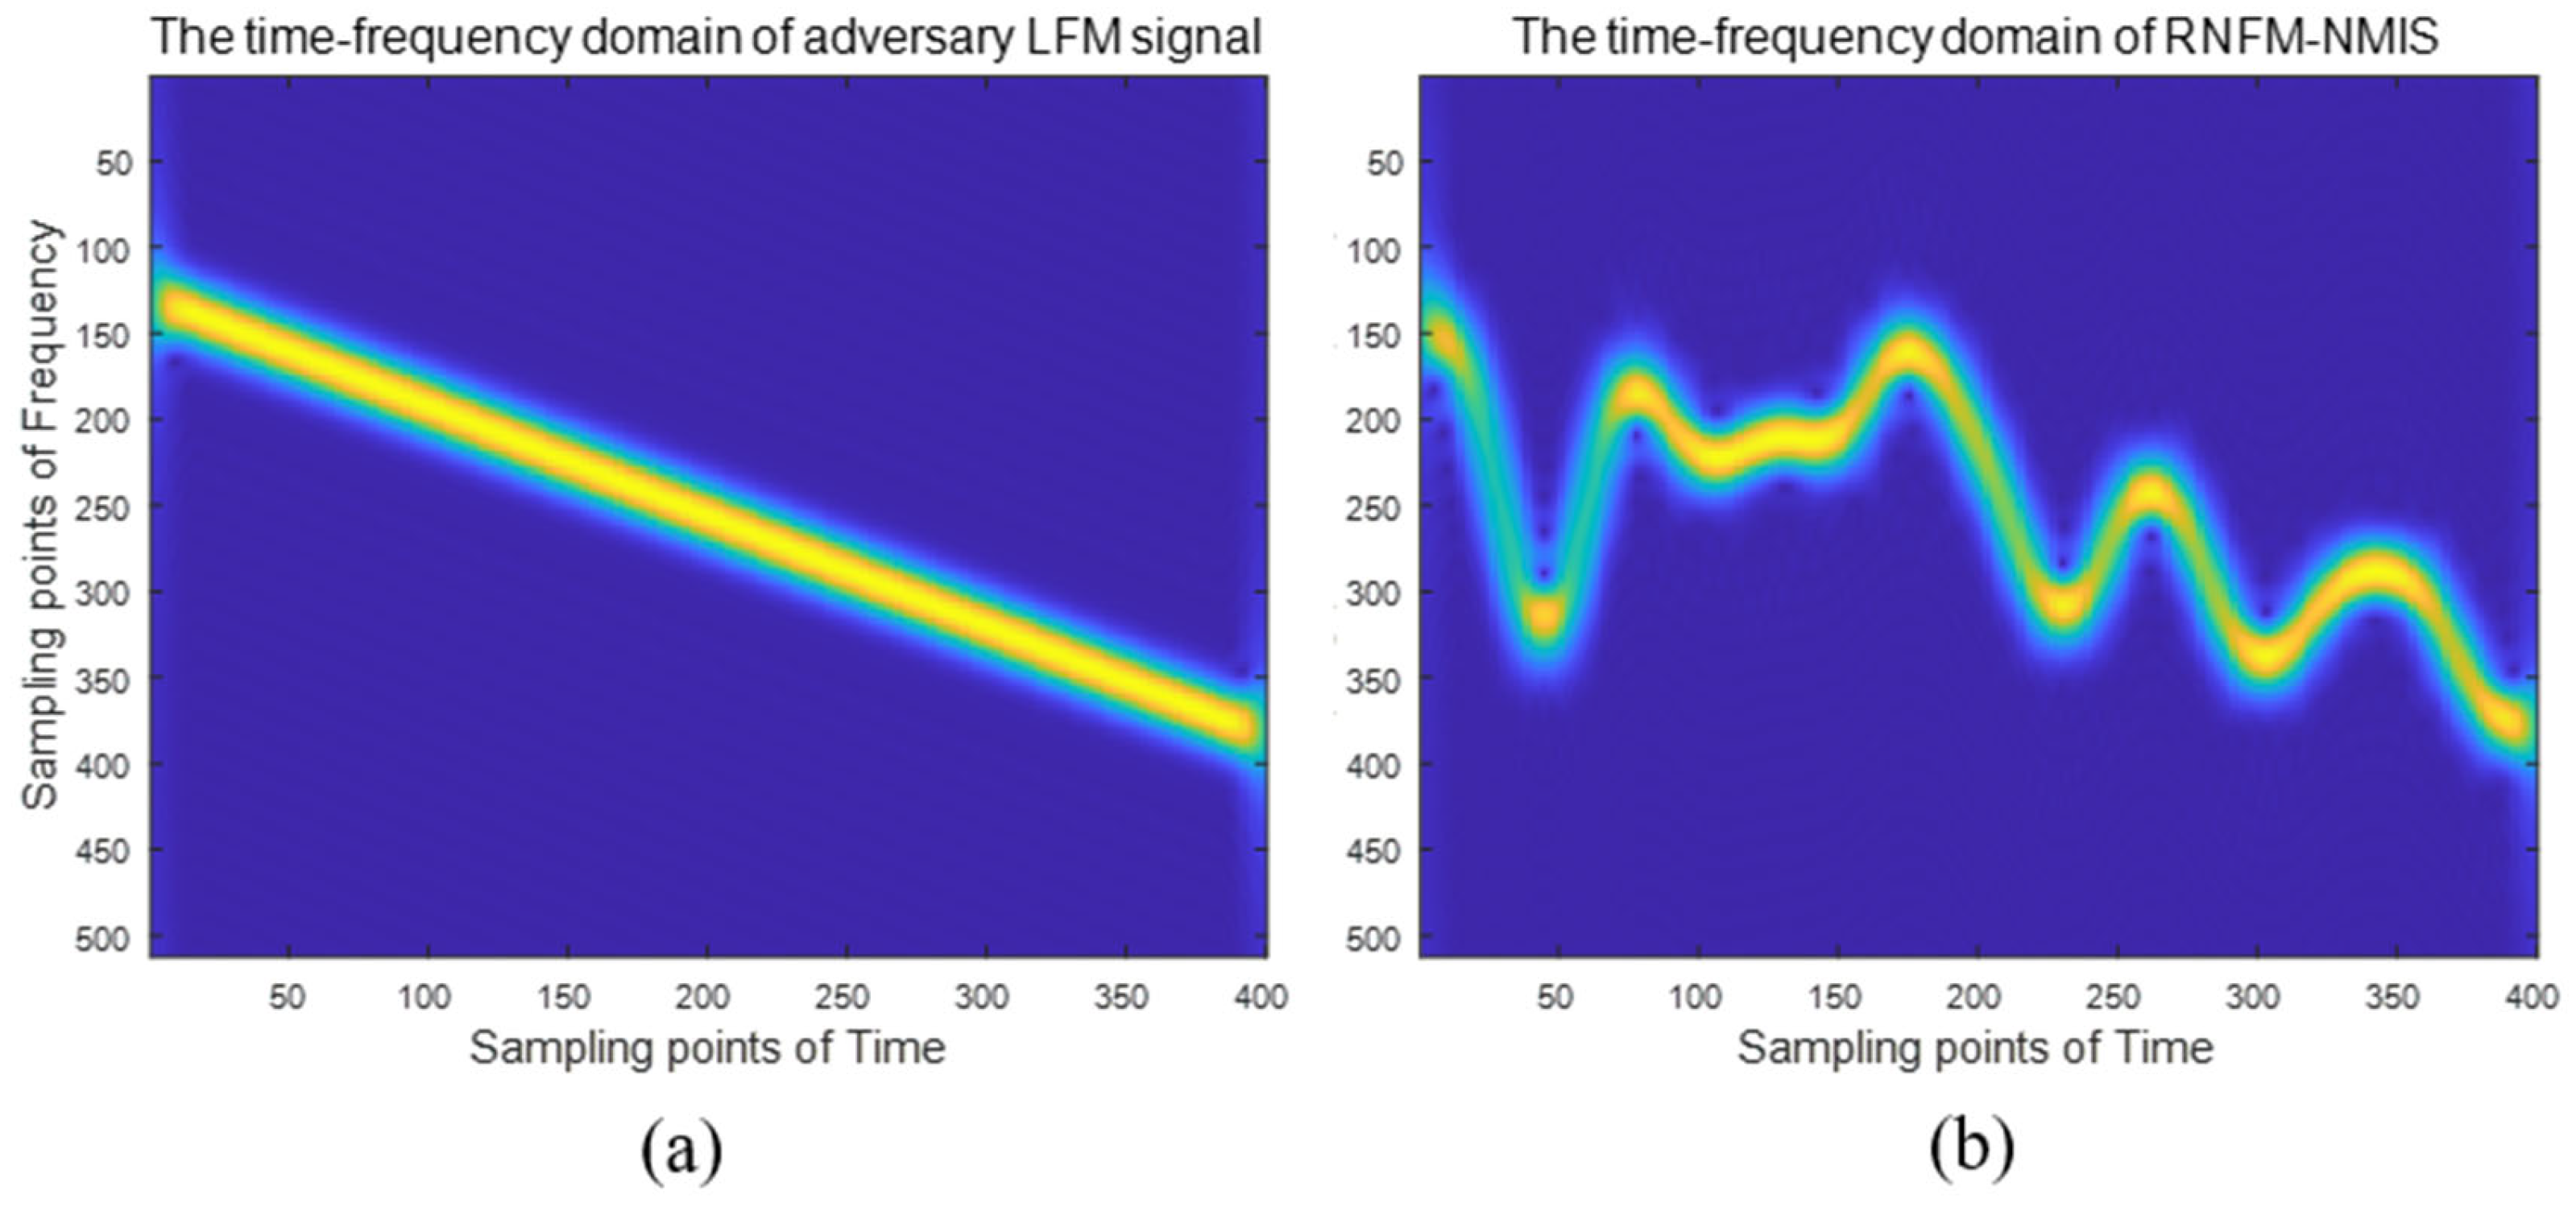
For the time-frequency shared RNFM-NMIS waveform, the structure of design and generation is shown in Figure 2.

3.1. Signal Model

First, the LFM signal emitted by the adversary radar is intercepted. The frequency modulation slope is K, the pulse time width is T r , the bandwidth is B r , and the received signal amplitude is A a . The baseband single pulse signal can be constructed as [25]
S a ( t ) = r e c t ( t T r ) A a e j π K t 2
The integrated system generates a random NFM signal of the same width, and the form of a single pulse signal is [23]
h ( t ) = r e c t ( t T r ) A o exp j 2 π f c t + j 2 π θ ( t )
where f c is the carrier frequency, and A o is the FM amplitude. The random component θ ( t ) can be expressed as
θ ( t ) = K FM 0 t u ( t ) d t
where u ( t ) is the modulated noise signal, a zero mean, generalized stationary Gaussian random process. K FM is the FM index. The selection of Gaussian-distributed noise over uniform or Laplace distributions [26] is primarily due to the inherent properties of natural noise and the mathematical characteristics of Gaussian functions. Natural noise typically arises from the aggregation of numerous independent random factors, which, according to the central limit theorem, approximates a Gaussian distribution. This makes Gaussian-distributed noise more representative of real-world scenarios. More importantly, the Gaussian distribution exhibits invariance under linear transformations, meaning that any linear combination of Gaussian variables remains Gaussian. This property is crucial in signal processing, as it allows for precise control and adjustment of signal spectral parameters. In contrast, linear combinations of uniform or Laplace distributions do not retain their original distribution characteristics, complicating the control over signal properties. Consequently, the construction of noise frequency modulation (NFM) signals predominantly employs Gaussian-distributed noise to ensure both generality and the desired mathematical tractability in signal design [23]. Set u ( t ) to Gaussian white noise, and its probability distribution is [27]
P ( u ( t ) ) = 1 2 π σ exp u 2 ( t ) 2 σ 2
The power spectrum can be expressed as
G ( f ) = σ 2 Δ F , 0 < f < Δ F 0 , o t h e r s
where σ 2 and Δ F are the variance and bandwidth of the modulation noise, respectively. Let m f e = K F M σ / Δ F be the effective frequency modulation index. When m f e > > 1 , the power spectral density G h ( f ) of the random noise FM signal is linearly related to the probability density P ( u ( t ) ) of the modulated noise. When the probability density of modulation noise is Gaussian distribution, the power spectral density of the random NFM signal is also Gaussian distribution, that is,
G h ( f ) = A 2 2 1 2 π K F M σ exp f f c 2 2 K F M σ 2
According to (6), the half-power bandwidth of the random NFM signal can be obtained as
B j = 2 2 ln 2 K F M σ
Through the local random NFM signal h ( t ) , the intercepted LFM signal is nimbly modulated to obtain the integrated waveform, which is expressed as
γ ( t ) = h ( t ) S a ( t ) = r e c t ( t T r ) A a A o exp [ j π K t 2 + j 2 π f c t + j 2 π θ ( t ) ]
We know that radar target detection resolution is determined by the spectral bandwidth of the radar signal. Let S ( f ) represent the spectral function of the LFM signal and h ( f ) that of the NFM signal. By combining Equation (8) with the property that multiplication in the time domain corresponds to convolution in the frequency domain, the spectral function γ ( f ) of signal γ ( t ) can be expressed as
γ ( f ) = S ( f ) h ( f )
where ∗ denotes the convolution operation. Let B j / B r = β denote the nimble modulation coefficient. After convolving the two signals, the main lobe is superimposed and broadened so that the spectral main lobe width of the proposed RNFM-NMIS is approximately
B r B r + B j = ( 1 + β ) B r
This parameter β allows for precise tuning of the noise signal’s frequency modulation slope by adjusting the noise bandwidth B j relative to the LFM signal bandwidth B r . In practical terms, β plays a key role in balancing target detection performance and the signal’s jamming effectiveness on the adversary radar. Specifically, a lower β results in a narrower noise modulation bandwidth, which concentrates the transmitted energy and enhances the jamming impact on the adversary radar. Conversely, a higher β broadens the effective noise bandwidth, potentially diluting the energy concentration and reducing the jamming effectiveness. Therefore, by carefully selecting β , the radar system can achieve an optimal trade-off between maintaining high target detection accuracy and maximizing the jamming performance against the adversary radar under various operational conditions.
The instantaneous frequency of our integrated signal can be obtained as
f ( t ) = f c + K t + K F M u ( t )
Since u ( t ) is a Gaussian distribution noise, its probability density function obeys a zero-mean Gaussian distribution; that is, it satisfies u ( t ) N ( 0 , σ u 2 ) . Then the probability density function of f ( t ) is a nonstationary process, i.e., it can be expressed as
f ( t ) N ( f c + K t , K F M 2 σ u 2 )
It can be observed that the frequency of integrated signals is random, making it difficult for enemy radars to analyze. The time–frequency domain results of signals can also be obtained through the short-time Fourier transform (STFT) [28] to observe this characteristic, as shown in Figure 3. Furthermore, by further adjusting the nimble modulation parameter β , it is possible to adjust the correlation between the integrated signal and the signal from the adversary radar, considering the case of direct wave interference from the adversary radar signal, and achieve different detection and jamming performance requirements.

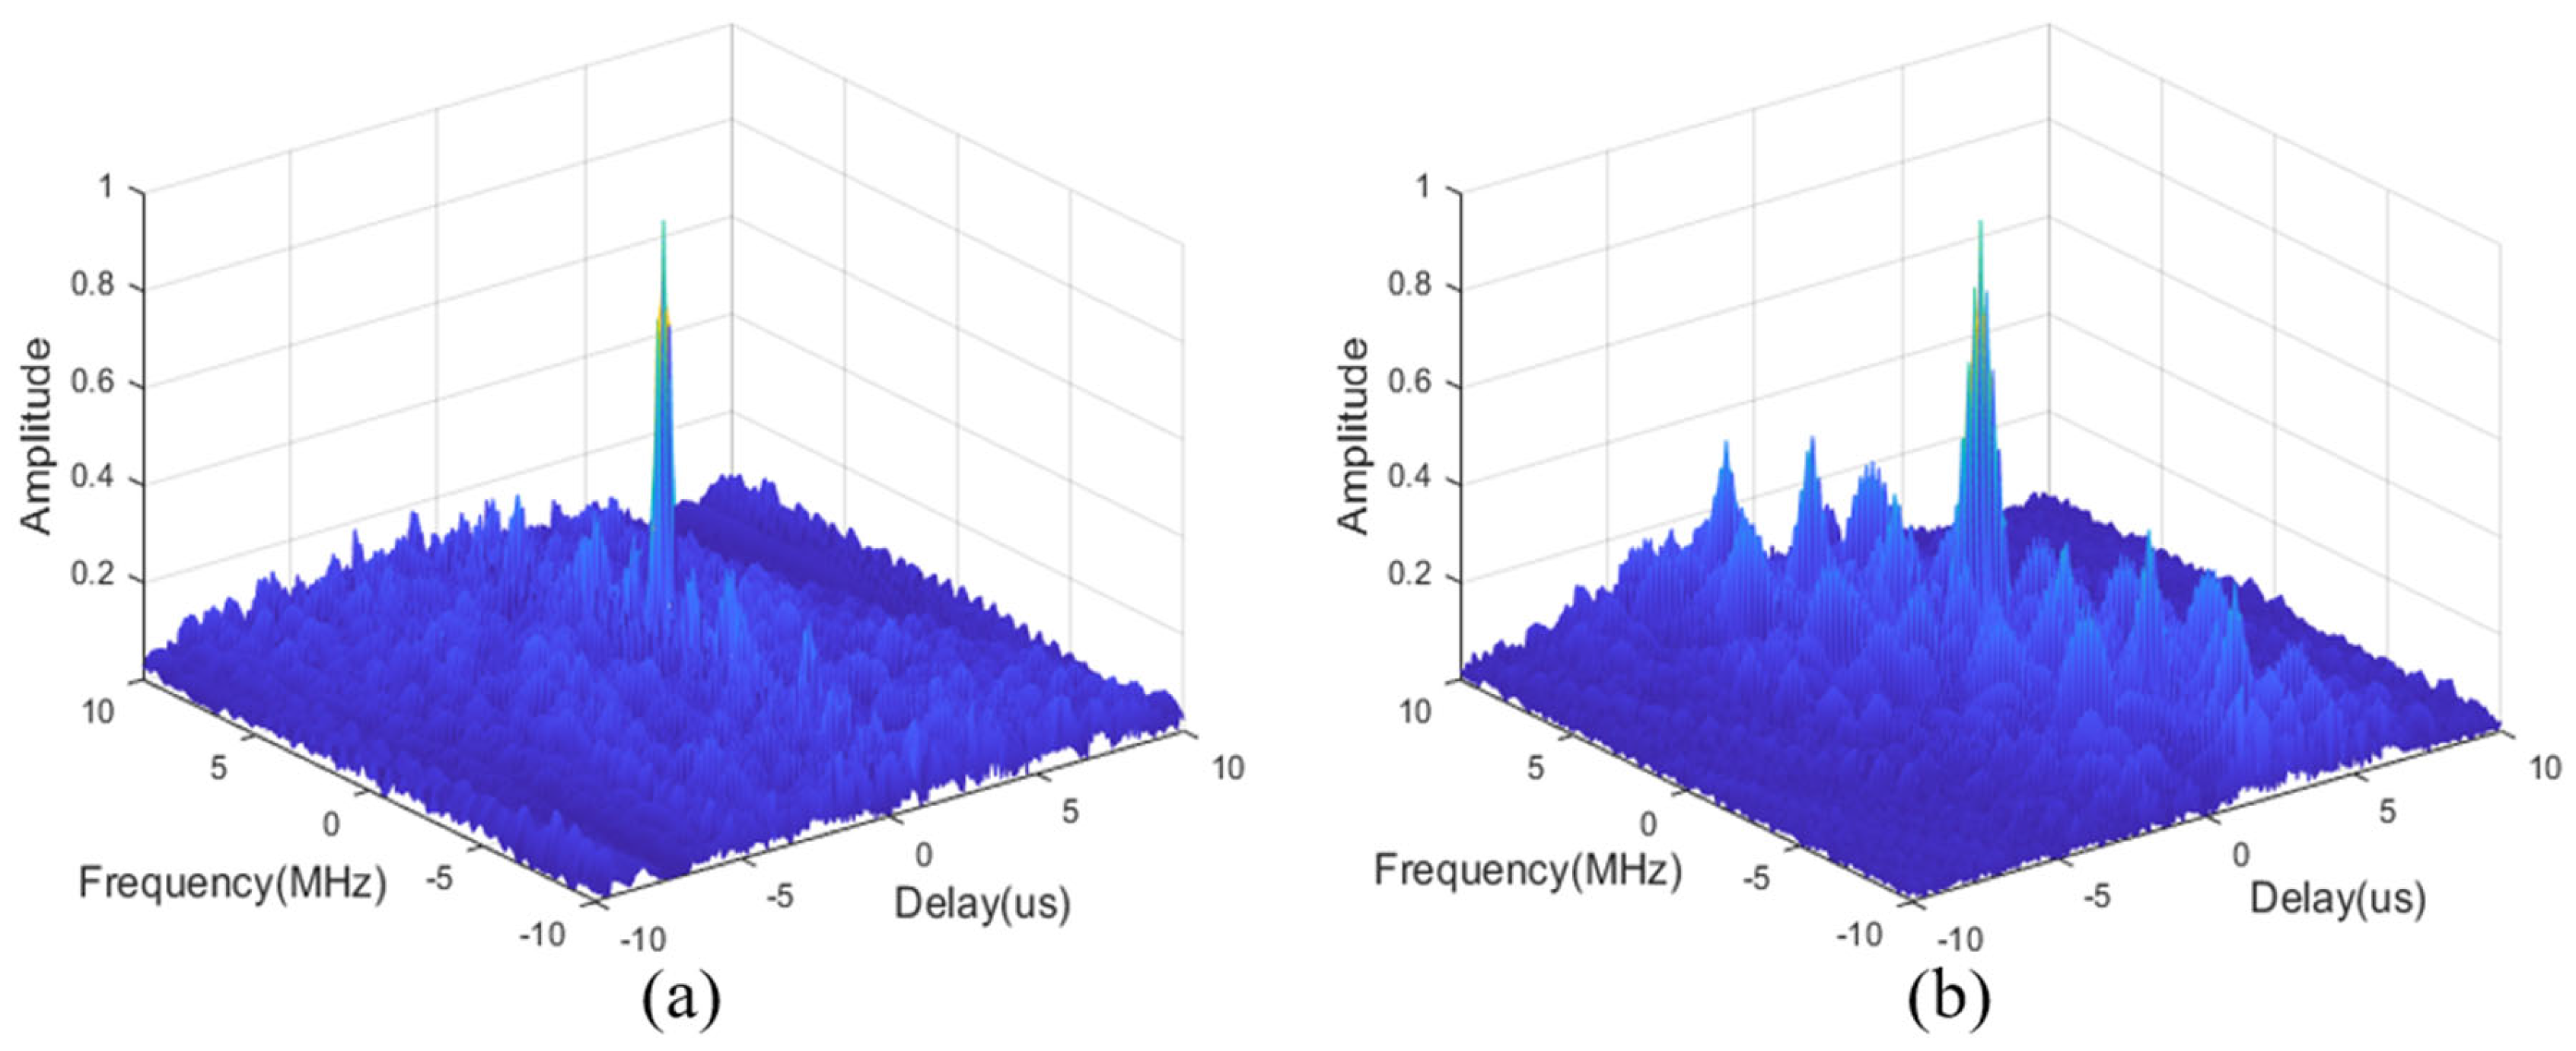
3.2. Detection Performance

The detection performance of a signal mainly comprises velocity measurement performance and range measurement performance. When evaluating these two metrics, utilizing the ambiguity function [29] is crucial for accurate assessment. The ambiguity function was initially developed to study the separation capability of detection signals for two targets, including range resolution and velocity resolution. Therefore, the ambiguity function can be used to reflect the range and velocity measurement performance of a signal. The definition of an ambiguity function for the signal s ( t ) is expressed as
χ τ , f d = + s ( t ) s ( t + τ ) exp j 2 π f d t d t
where τ represents time delay and f d represents Doppler frequency shift. Hence, the ambiguity function of the RNFM-NMIS is obtained as
χ γ τ , f d = + γ ( t ) γ ( t + τ ) exp j 2 π f d t d t
Let f d be equal to 0; we obtain the RNFM-NMIS waveform’s range ambiguity function solely related to the time:
χ γ τ , 0 = + γ ( t ) γ ( t + τ ) d t
Let τ be equal to 0; we obtain the RNFM-NMIS waveform’s velocity ambiguity function solely related to the Doppler frequency:
χ γ 0 , f d = + γ ( t ) 2 exp j 2 π f d t d t
Simulations were conducted on the ambiguity function of the typical phase-coded modulated LFM integrated signal and the proposed RNFM-NMIS, yielding the three-dimensional ambiguity maps, as depicted in Figure 4. Upon observation, we can note that the ambiguity map of the RNFM-NMIS displays an approximate nail-shaped pattern, featuring low sidelobes in both the distance and velocity dimensions. Compared to the phase-coded modulated LFM signal, the RNFM-NMIS exhibits significantly lower sidelobes and is free from false targets that could degrade detection performance. This indicates excellent performance of RNFM-NMIS in velocity and range measurement.

3.3. Interference Performance

The interference performance of RNFM-NMIS can be considered from the perspective of adversary radar, that is, by analyzing the contrast in the adversary signal detection performance before and after interference. The impact of RNFM-NMIS on the adversary signal can be measured using cross-correlation functions.
Under normal circumstances, the echo signal S a ( t τ ) received by the adversary radar during detection does not include components of our RNFM-NMIS. The cross-correlation function between the transmitted signal and the echo is given by
R s s ( τ ) = S a ( t ) S a ( t τ ) d t
When our integrated system interferes with the adversary radar, the echo signal received by the adversary radar will contain interference from our transmitted RNFM-NMIS direct wave. In this case, the cross-correlation function between the adversary transmitter signal and the received signal is given by
R s z ( τ ) = S a ( t ) z ( t τ ) d t
where z ( t ) = S a ( t ) + I S R γ ( t ) , and I S R represents the interference to signal ratio (ISR) from our integrated equipment to the adversary radar.
Due to the effect of noise modulation, the frequency of the agile NFM interference shifts, with the frequency offset being directly proportional to both the modulation coefficient and the variance of the modulation noise. Furthermore, the power spectrum of the modulated interference signal exhibits the same shape as the probability density function of the modulation noise. The modulation bandwidth of the interference can also be considered as a frequency shift component f m = 2 B r / 2 B m / 2 added to the LFM signal. Based on the characteristics of LFM signals, it is known that a frequency shift will lead to a time shift t m = f m / ( 2 K ) in the pulse compression output. Therefore, the pulse width after compression of the RNFM-NMIS is given by
Δ t j = 1 B r + B m 2 K
In the equation, 1 / B r represents the target echo pulse compression output signal width. It can be observed that the pulse compression output width of the RNFM-NMIS is greater than that of the target echo pulse compression output signal. The pulse width increases as the bandwidth of the NFM signal increases. To further analyze the suppression effectiveness of the interference signal, the interference power pulse compression gain D j and the jamming-to-signal ratio pulse compression gain D p are used as evaluation metrics. The definitions of D j and D p are given by the following equations:
D j = J o / J i D p = ( J o / S o ) / ( J i / S i )
where J i and J o represent the interference power before and after pulse compression, respectively, while S i and S o represent the signal power before and after pulse compression, respectively. According to the principle of energy conservation, the following relationship can be obtained:
J i T = J o ( 1 B r + B m 2 K )
Further calculations yield the values of D j and D p , as follows:
D j = J o / J i = T / ( 1 B r + B m 2 K ) > 1 D p = ( J o / J i ) / ( S o / S i ) = D j / D > 1 / D
where D represents the radar signal pulse compression ratio. It can be observed that the suppression pulse width of the RNFM-NMIS is inversely proportional to the suppression power of the interference signal.
Similarly, a comparison is made with the typical PC-LFM signal, and simulations were conducted to evaluate the detection performance of the adversary radar before and after our integrated system’s jamming. The resulting cross-correlation function map for the adversary signal is shown in Figure 5. The LFM signal of the adversary radar exhibits low sidelobes and an integration sidelobe level of only −44.68 dB when not affected by interference, indicating excellent detection performance. However, when subjected to jamming from our RNFM-NMIS, it experiences severe suppression interference, with the integration sidelobe level rising sharply to −14.60 dB, an increase of 30.08 dB. In contrast, the PC-LFM signal focuses on false target jamming, with an interference suppression effect of only −28.42 dB. The jamming effect on the adversary’s radar demonstrates the excellent suppression capability of the RNFM-NMIS.

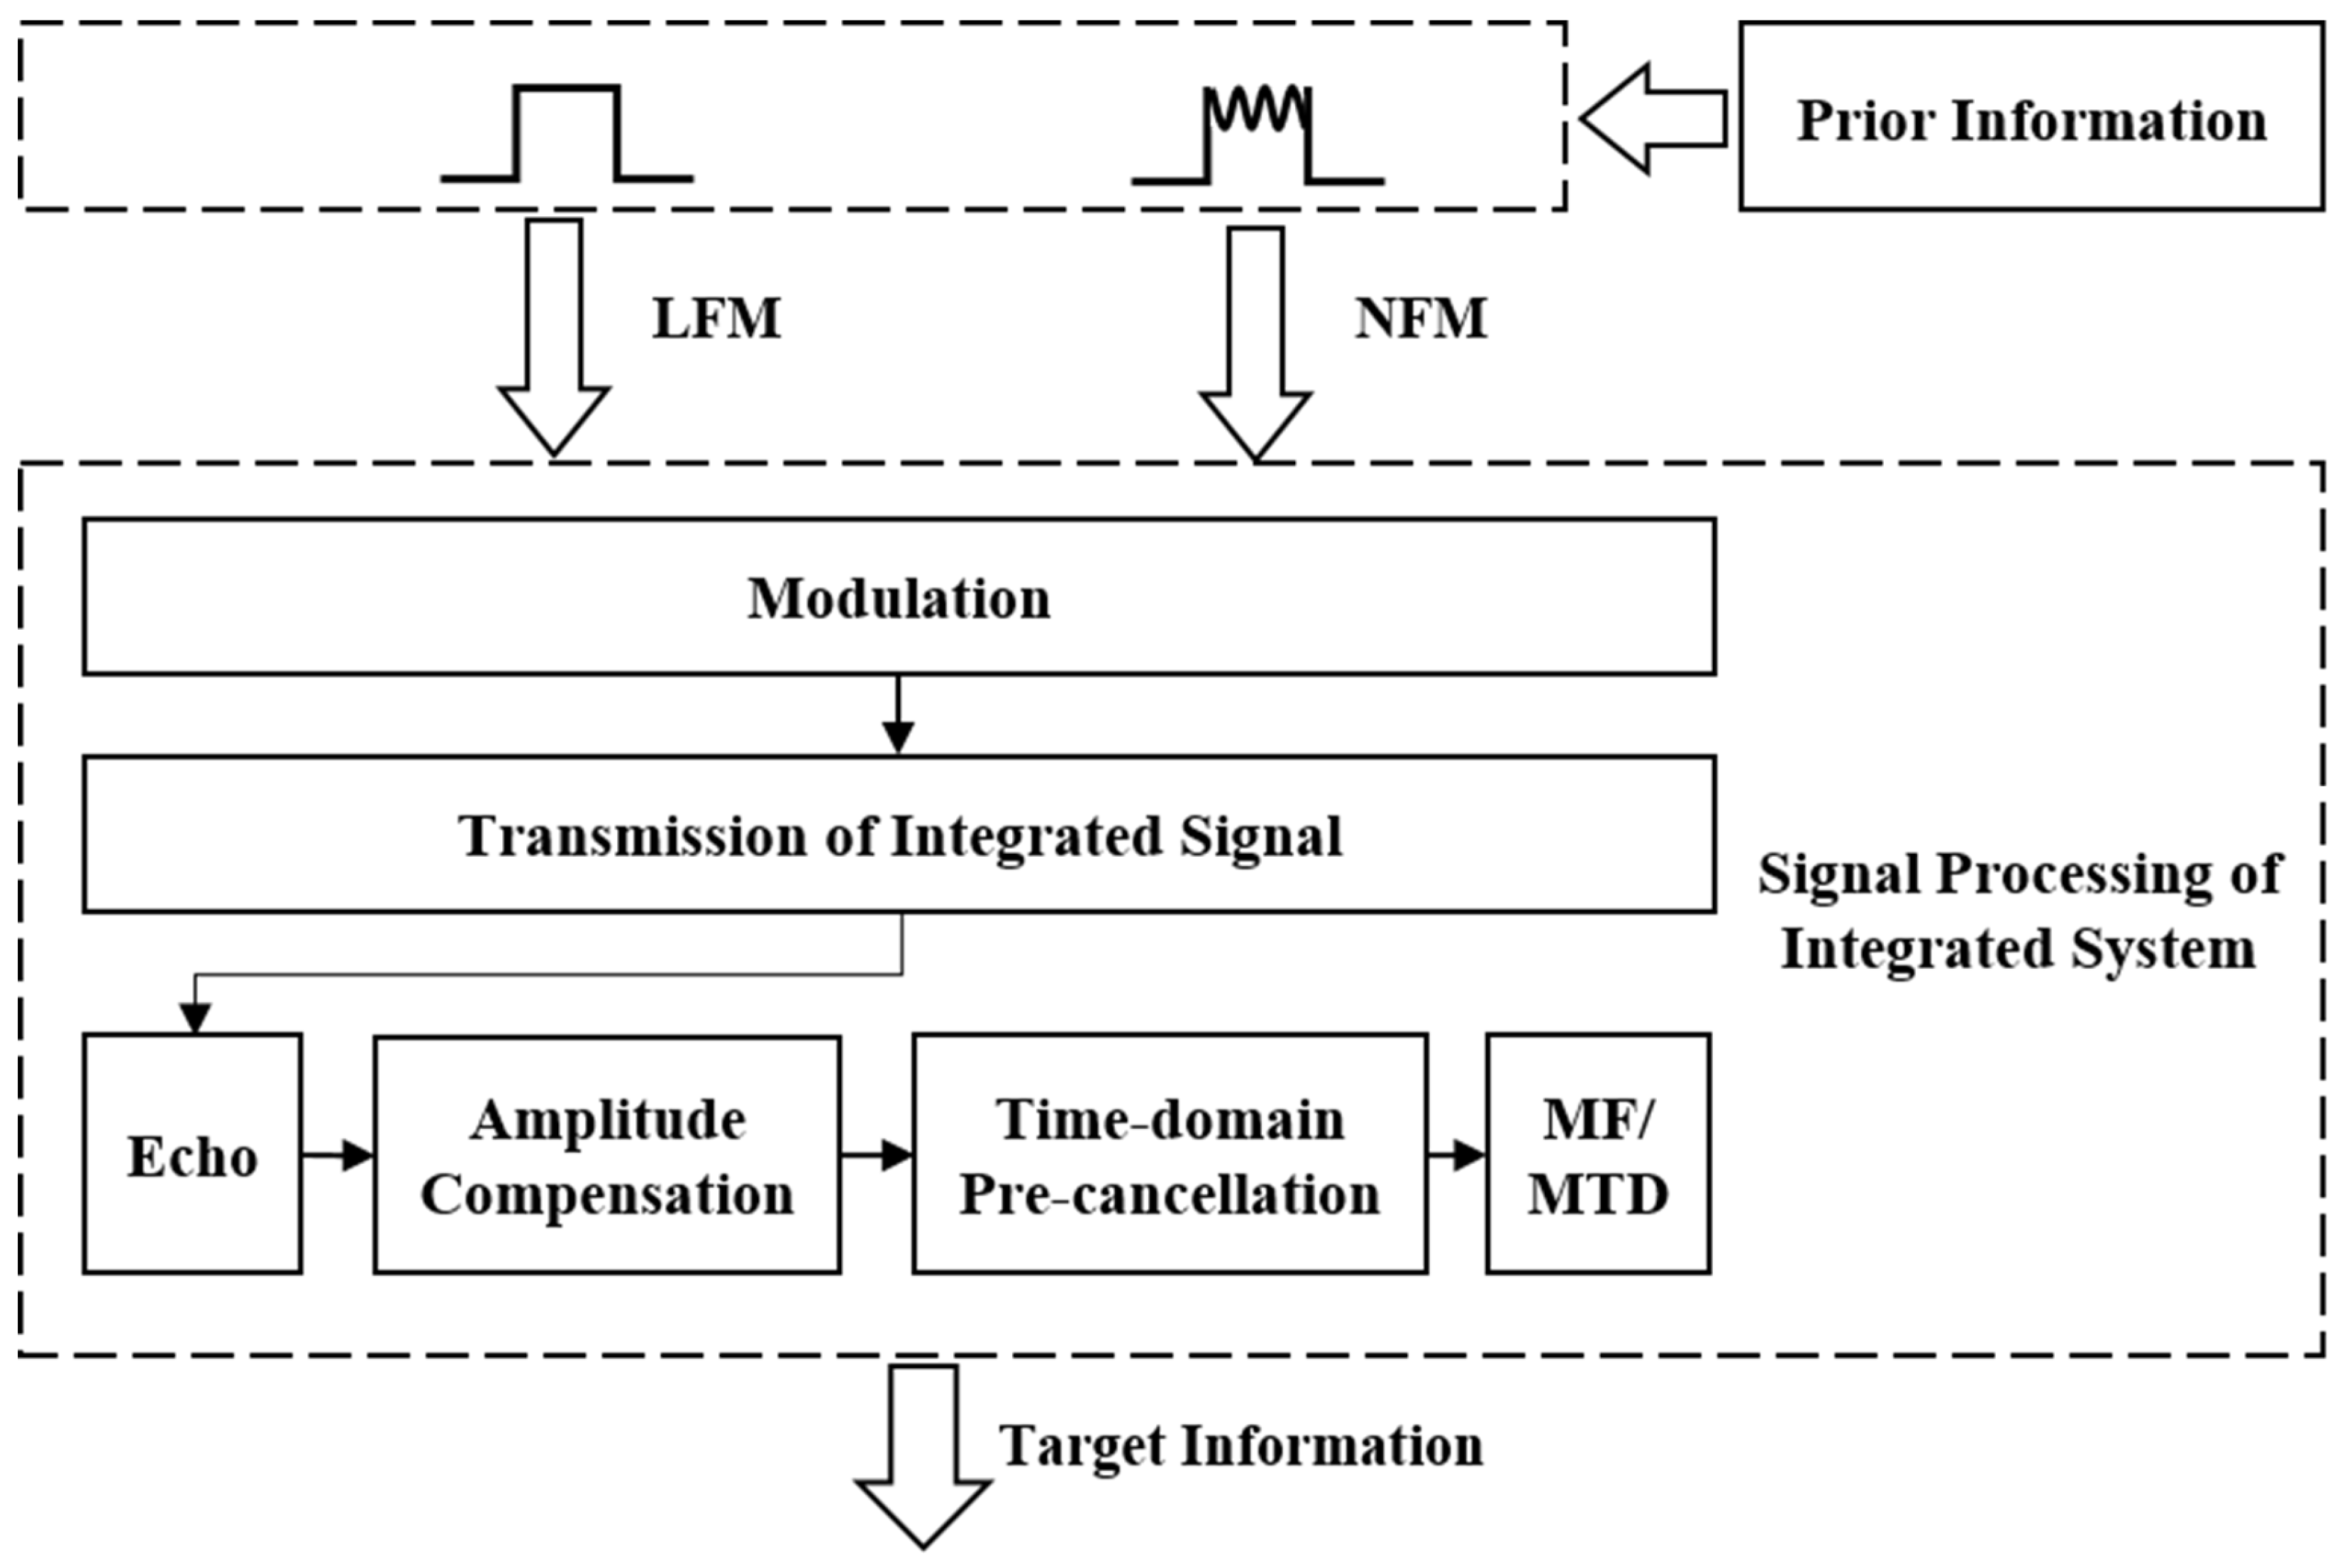
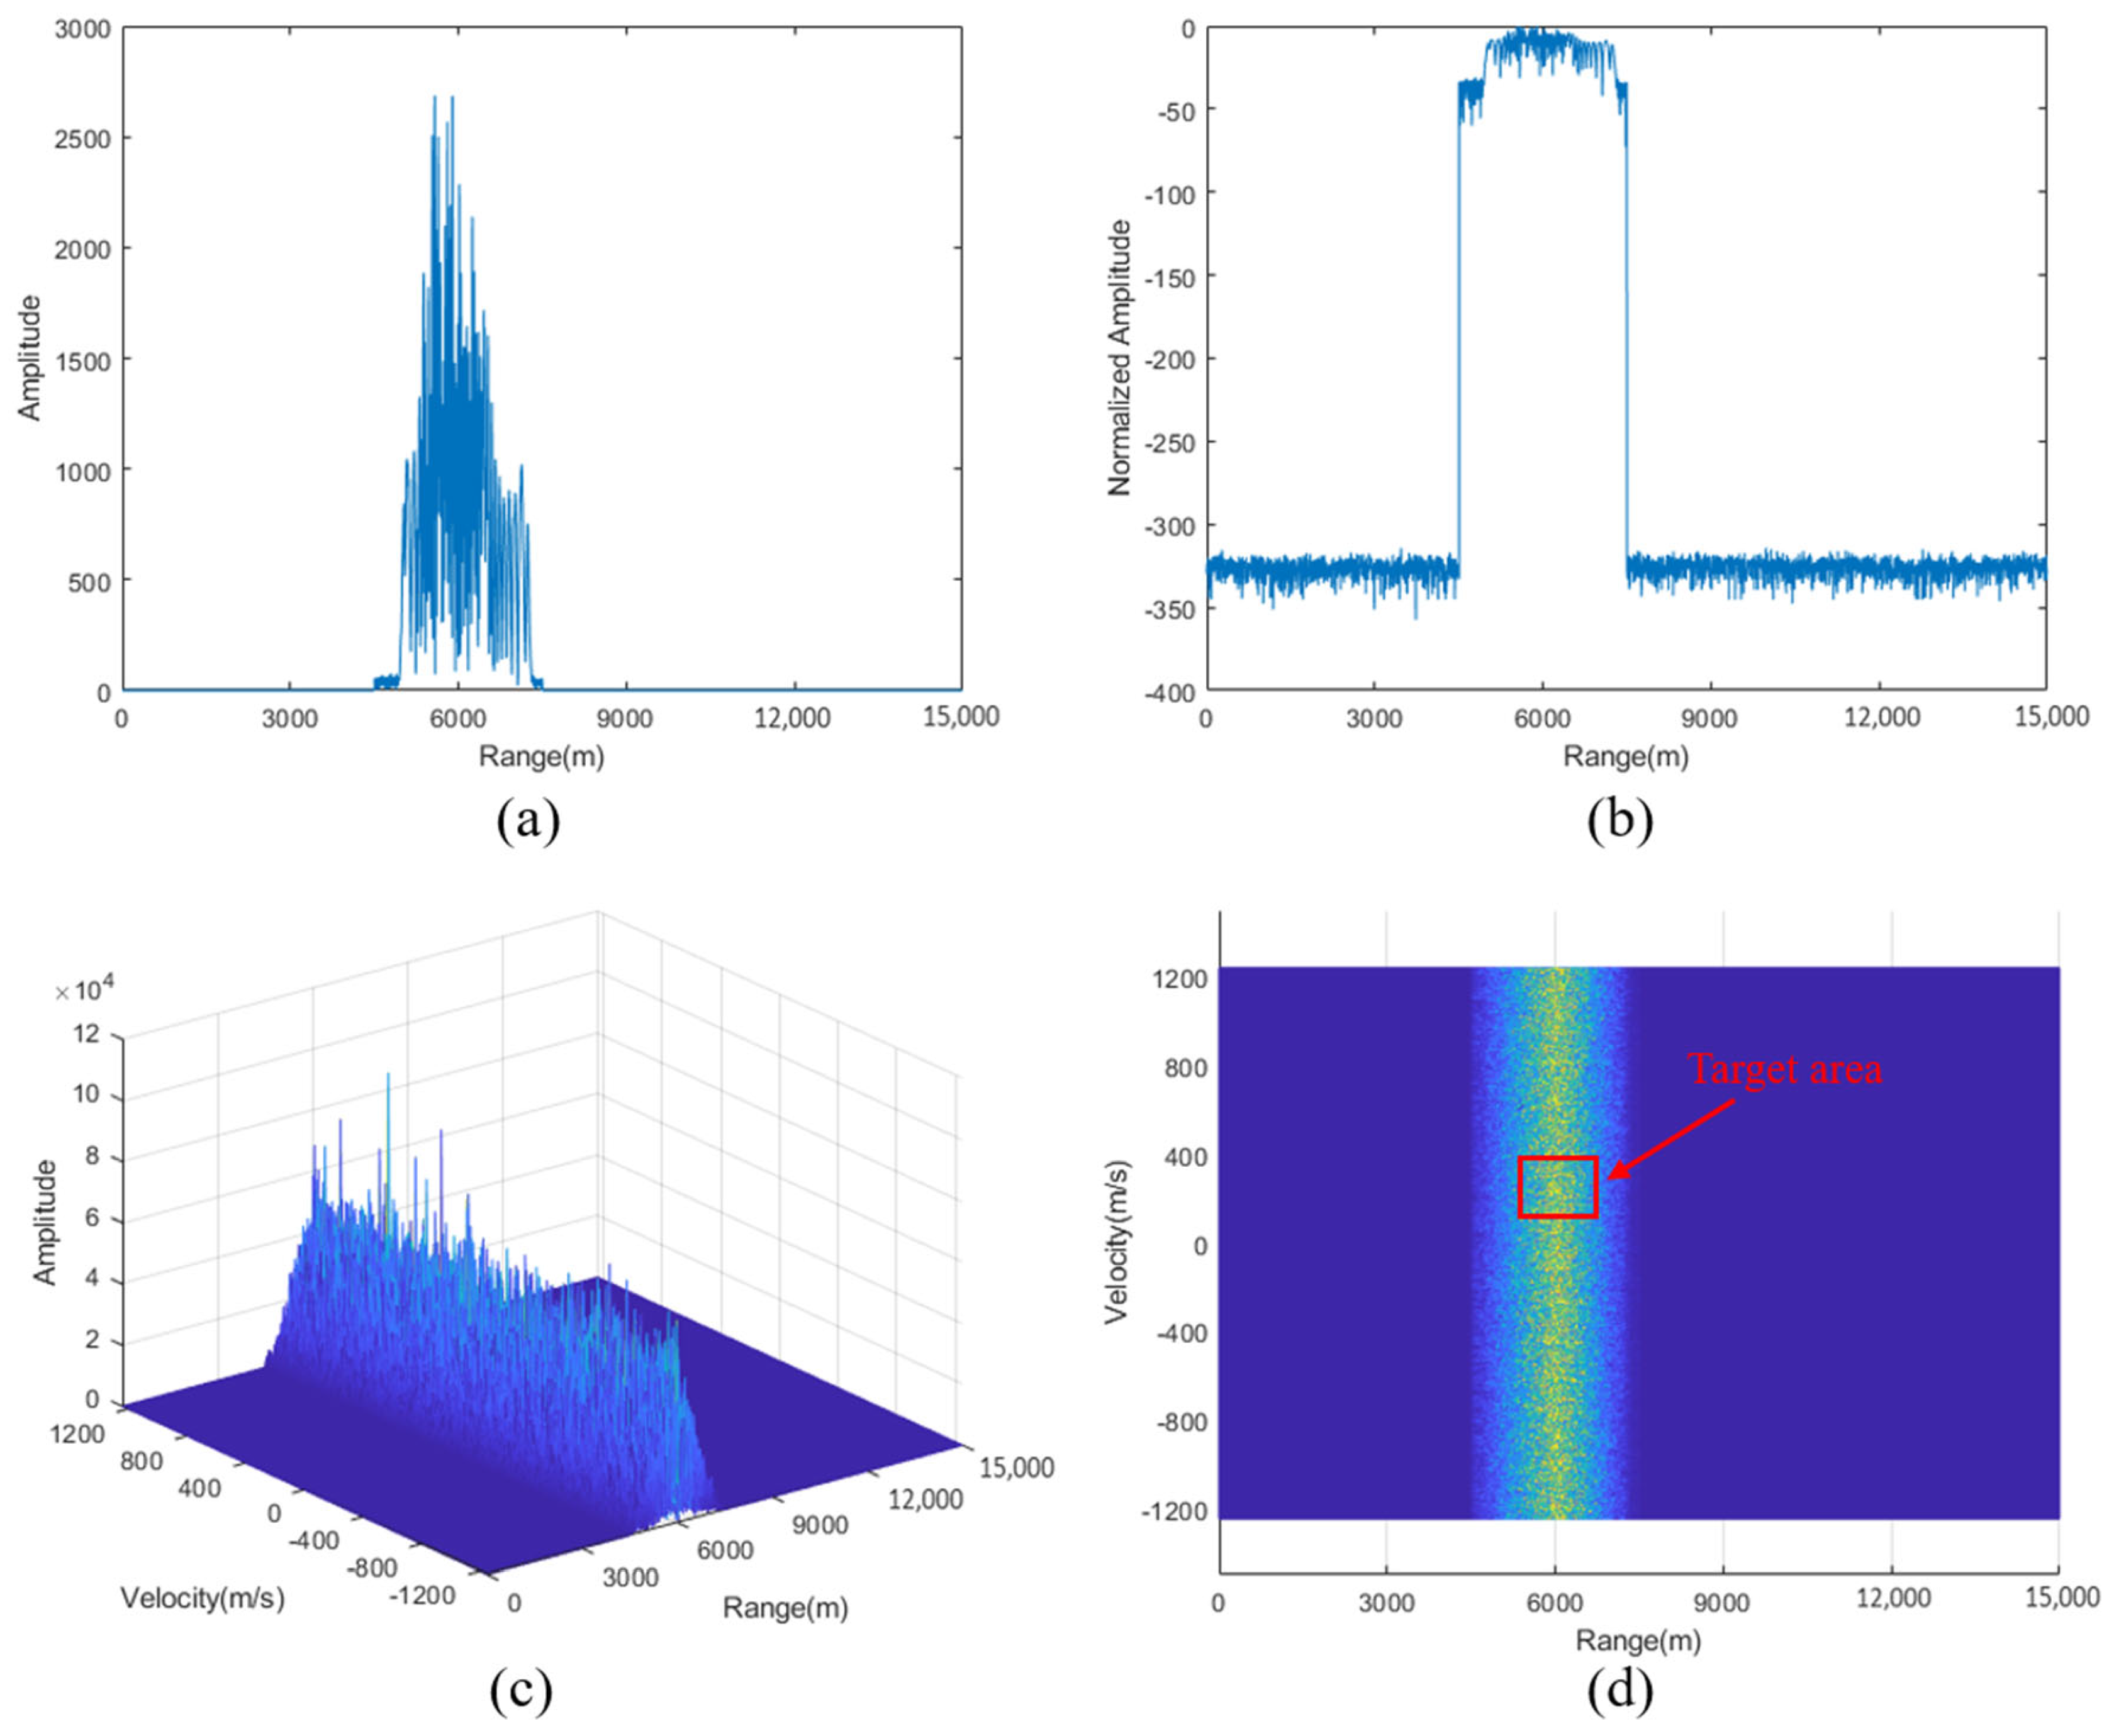
4. Direct-Wave Interference Suppression Based on Time-Domain Pre-Cancellation

4.1. Processing Algorithm Based on TDPC

For the RNFM-NMIS, our integrated detection and jamming radar system adopts a signal processing method based on time-domain pre-cancellation (TDPC) of direct-wave interference to efficiently process target echoes. The signal processing flowchart of the integrated system is shown in Figure 6. Our integrated detection and jamming radar system begins by intercepting the adversary radar’s signals. By analyzing the radar signal parameters, the system gains crucial prior information about the characteristics of the adversary signals. Using this information, the system reconstructs the adversary LFM signal and generates a flexible, adjustable NFM signal. Through amplitude modulation, the RNFM-NMIS is then constructed to perform both target detection and interference against the adversary radar. During the target detection process, amplitude compensation is applied to adjacent pulses of each signal. Subsequently, TDPC is applied between pulses to mitigate the direct-wave interference. Finally, target detection is carried out through matched filtering (MF) and moving target detection (MTD) techniques, ensuring effective performance in the complex electromagnetic environment.
Through the locally generated random NFM signal h ( t ) , the reconstructed LFM signal is flexibly modulated to obtain the integrated waveform, represented as
γ ( t ) = h ( t ) S a ( t ) = r e c t ( t T r ) A exp [ j 2 π f c t + j π K t 2 + j 2 π θ ( t ) ]
where A denotes the amplitude of the transmitted signal. When our integrated radar system emits waveforms designed for both target detection and jamming of the adversary radar, the overall complex return signal for each pulse can be expressed as the superposition of three components: the echo of the pure integrated signal γ ( t ) reflected from the target; the direct wave component from the adversary radar’s transmitted signal s a d ( t ) ; and the additive noise. To incorporate the effect of the adversary radar’s direct wave interference in our integrated system, the received signal is expressed as z ( t ) . In this study, we primarily focus on the strong direct wave interference generated by the adversary radar. For the sake of simplicity in the analysis, additive noise is omitted, i.e.,
z ( t ) = γ ( t ) + s a d ( t )
where γ ( t ) is the pure integrated signal echo reflected from the detection target:
γ ( t ) = r e c t ( t τ T r ) A exp [ j 2 π ( f c + f d ) ( t τ ) + j π K ( t τ ) 2 + j 2 π θ ( t τ ) ]
where A denotes the amplitude of the echo. Furthermore, s a d ( t ) is the direct wave interference from the other side’s radar to our integrated system:
s a d t = I S R · r e c t t τ a d T r A a exp j π K t τ a d 2 exp j 2 π ( f c + f a d ) t
where I S R is the interference-to-signal ratio, τ a d is the time delay of the adversary radar’s direct wave to our integrated system, A a is the amplitude of the direct-wave interference, and f a d is the relative Doppler frequency between our integrated system and the adversary radar. These two parameters do not represent the time delay and Doppler frequency of the echo signal when the adversary radar is considered as our detection target.
Based on the form of the integrated signal echo and transmitted signal, pre-cancellation of direct-wave interference is applied to further optimize the processing of the integrated signal echo. The TDPC processing flowchart is shown in Figure 7. Through amplitude compensation and cancellation processing between pulse signals, the reference signal and echo signal for each pulse repetition time (PRT) after direct-wave pre-cancellation are obtained. These are then further processed using MF and MTD to achieve the target detection results.
The total echo signal z ( t ) is mixed with the local oscillator signal and down-converted to the baseband. The expression is
z b t = r e c t ( t τ T r ) A exp j π K ( t τ ) 2 + j 2 π θ ( t τ ) exp j 2 π f d t + I S R · A a r e c t t τ a d T r A a exp j π K t τ a d 2 exp j 2 π f a d t
Furthermore, let
S l f m c t = r e c t ( t τ T r ) A exp j π K ( t τ ) 2 S n f m c t = exp j 2 π θ ( t τ ) S l f m a t = I S R · A a r e c t t τ a d T r exp j π K t τ a d 2 S d t = exp j 2 π f d t S a d t = exp j 2 π f a d t
Simplifying (27), the baseband total echo signal can be written as
z b t = S l f m c t · S n f m c t · S d t + S l f m a t · S a d t
Assume that the echo received by our integrated system within a single coherent processing interval (CPI) contains M PRI echo signals, where i = 1 , 2 , , M , and i represents the pulse sequence number in the echo pulse signals. The expression for the baseband signal of the i th echo pulse is
z b _ i t = S l f m c _ i t · S n f m c _ i t · S d _ i t + S l f m a _ i t · S a d _ i t
where
S l f m c _ i t = r e c t ( t ( i 1 ) · T τ T r ) A exp j π K [ t ( i 1 ) · T τ ] 2 S n f m c _ i t = exp j 2 π θ i ( t τ ) S l f m a _ i t = I S R · A a r e c t t ( i 1 ) T τ a d T r exp j π K t ( i 1 ) T τ a d 2 S d _ i t = exp j 2 π f d t ( i 1 ) T exp j 2 π · ( i 1 ) f d T S a d _ i t = exp j 2 π f a d t ( i 1 ) T exp j 2 π · ( i 1 ) f a d T
where T is PRT, T r is the pulse width, and S l f m c _ i ( t ) and S l f m a _ i ( t ) are both periodic signals. θ i ( t ) is the NFM term of the i th transmitted pulse signal of our integrated system, and it is different for each transmitted pulse signal. Additionally, it follows that
S a d _ i + 1 t = S a d _ i t · exp j 2 π f a d T
S d _ i + 1 t = S d _ i t · exp j 2 π f d T
Let
A l f m c = exp j 2 π f a d T
A d c = exp j 2 π f d T
The baseband echo signal can be further processed for direct-wave interference cancellation: subtract the amplitude-compensated i th echo pulse signal from the ( i + 1 ) th echo pulse signal to obtain a new signal z b m _ i ( t ) , which is referred to as the matched signal:
z b m _ i t = z b _ i + 1 t A l f m c z b _ i t
where A l f m c is the amplitude compensation coefficient, and further derivation of (36) can be performed: where A l f m c represents the amplitude compensation coefficient, and Equation (36) can be further derived as follows:
z b m _ i t = S l f m c _ i + 1 t · S n f m c _ i + 1 t · S d _ i + 1 t + S l f m a _ i + 1 t · S a d _ i + 1 t A l f m c · S l f m c _ i t · S n f m c _ i t · S d _ i t + S l f m a _ i t · S a d _ i t = S l f m c _ i + 1 t · S n f m c _ i + 1 t · S d _ i + 1 t A l f m c · S l f m c _ i t · S n f m c _ i t · S d _ i t = A d c S n f m c _ i + 1 t A l f m c S n f m c _ i t · S l f m c _ i t · S d _ i t
At the same time, construct the reference signal S r e f ( t ) , expressed as
S r e f t = S n f m _ i + 1 t S n f m _ i t · S l f m t
where
S l f m t = r e c t ( t T r ) A exp j π K t 2 S n f m _ i t = exp j 2 π θ i ( t )
where S l f m ( t ) is the baseband waveform of the adversary radar’s transmitted signal intercepted by our integrated detection and jamming system, and S n f m _ i ( t ) is the NFM signal modulating S l f m ( t ) in the i th pulse of our transmitted signal. Finally, apply matched filtering to the matched signal S l f m ( t ) , and the expression for the matched output is
H t = z b m _ i t S r e f t = A d c S n f m c _ i + 1 t A l f m c S n f m c _ i t · S l f m c _ i t · S d _ i t S n f m _ i + 1 t S n f m _ i t · S l f m · t
where ∗ represents the convolution operation. Further expansion yields
H t = z b m _ i t S r e f t = A d c exp j 2 π θ i + 1 ( t τ ) A l f m c exp j 2 π θ i ( t τ ) · S l f m c _ i t τ · exp j 2 π f d t exp j 2 π θ i + 1 ( t ) exp j 2 π θ i ( t ) · S l f m t
To investigate the signal’s matching outcome, we begin by setting i = 1 . At this stage, Equation (31) clearly indicates that S l f m c _ 1 ( t ) = S l f m c ( t ) , and we further define
M 1 ( t ) = exp j 2 π θ 1 ( t ) · S l f m c t M 2 ( t ) = exp j 2 π θ 2 ( t ) · S l f m c t
Thus, the matched output of the signal can be further expressed as
H ( t ) = [ A d c M 1 ( t τ ) M 1 ( t ) + A l f m c M 2 ( t τ ) M 2 ( t ) A d c M 1 ( t τ ) M 2 ( t ) A l f m c M 2 ( t τ ) M 1 ( t ) ] exp ( j 2 π f d t )
According to the matched filtering theory, it can be seen that the first two terms can match a peak at the time delay τ . On the other hand, the transmitted RNFM-NMIS exhibits randomness and is uncorrelated for each pulse. Therefore, the convolution results of the last two terms will not produce a distinct peak. As a result, in (43), at the time delay τ , the matched output will exhibit a clear peak, which corresponds to the target’s range or delay.

4.2. Analysis of Computational Complexity

Assume that our platform transmits pulses with N sampling points per pulse and a total of M pulses. After receiving the integrated signal echo, the system first performs mixing and down-conversion; this step requires O ( N ) complex multiplications and additions per pulse, resulting in an overall computational complexity of O ( M N ) . Similarly, both the direct-wave interference pre-cancellation and the construction of the reference signal each require O ( M 1 ) subtraction operations. In the subsequent matched filtering stage, convolution is performed between the pre-canceled echo and the reference signal, typically accelerated using FFT. The computational cost for a single FFT-based convolution is O ( N log N ) , so the total complexity for the matched filtering operation becomes O ( M N log N ) . Finally, moving target detection (MTD) is carried out in the slow-time domain, where an M-point FFT is applied to each range gate to extract the Doppler frequency, resulting in an overall computational cost of O ( N M log M ) . Thus, the computational complexity of the target detection process based on the TDPC algorithm is predominantly concentrated in the matched filtering and MTD stages, amounting to O ( N M ( log M + log N + 1 ) ) . In practical systems, optimizing the matched filtering and MTD stages—such as through hardware acceleration and pulse-level parallelization—is essential for achieving real-time performance. However, while reducing the sampling rate or the number of pulses can significantly lower the overall computational load, it may also compromise the system’s range or Doppler resolution. Therefore, a careful trade-off must be made between real-time efficiency and high resolution, with hardware acceleration playing a key role in ensuring effective processing.
To further assess the feasibility of real-time implementation, we estimate the processing time and resource consumption on typical hardware. Considering a modern FPGA-based signal processing platform, such as the Zynq UltraScale MPSoC from Xilinx, San Jose, CA, USA, with dedicated DSP blocks and parallel processing capabilities, the FFT-based matched filtering stage, which dominates the computational load, can be efficiently executed. For instance, assuming a pulse length of N = 1024 and M = 128 pulses, an optimized FFT implementation can achieve a processing time on the order of microseconds per pulse. Similarly, the MTD stage, leveraging efficient hardware acceleration, can be completed within a comparable time frame. Given these estimates, a real-time processing pipeline with sub-millisecond latency is achievable, ensuring that our TDPC-based system meets practical radar operational requirements while maintaining high resolution and detection performance.

5. Practical Experiments Results on Signal Performance

We conducted outdoor experiments to replicate typical operational scenarios for the integrated system. Two universal software radio peripheral (USRP) devices, model USRP B210, were employed to simulate two radar systems. The integrated radio-frequency (RF) chipset, in conjunction with the antenna, is utilized for the transmission and reception of radar signals, while a field programmable gate array (FPGA) within the device manages module control and facilitates data exchange. Additionally, a host computer dedicated to data processing communicates with the USRP via a USB 3.0 interface for data transfer. Two radar systems were utilized—one simulating our integrated system and the other representing the adversary radar. The adversary radar employs LFM signals to detect a corner reflector target. Based on the LFM signal parameters, we adjusted the nimble modulation parameter β to construct our RNFM-NMIS waveform. Our integrated system simultaneously detects the corner reflector and interferes with the adversary radar by transmitting the RNFM-NMIS waveform. In these signal processing experiments, each parameter is determined based on theoretical analysis, laboratory equipment constraints, and prior research experience. First, the LFM signal bandwidth is set to 20 MHz to enhance the target’s range resolution while ensuring that the signal energy remains concentrated within a limited frequency band; although a wider bandwidth offers better range resolution, it also imposes greater demands on hardware performance. The signal pulse width is chosen to be 10 μs, balancing sufficient energy accumulation with high temporal resolution so that the echo signal effectively reflects the target information. For the nimble modulation parameter, values of 0.2, 0.5, and 1.0 are used to compare the processing performance under different modulation depths and analyze their impact on signal processing and target detection. Gaussian noise is adopted to simulate the statistical characteristics of thermal noise and other random noises in actual radar systems. The carrier frequency is set at 5 GHz, which not only aligns with the common operating bands of laboratory radar equipment but also balances penetration capability and resolution requirements. The pulse repetition interval (PRI) is defined as 50 μs to avoid echo signal aliasing while meeting the temporal requirements for continuous target detection; the sampling rate is set at 40 MHz to fully comply with the Nyquist sampling theorem, ensuring complete signal capture. The transmit power of 10 dBm guarantees a sufficient signal-to-noise ratio while taking into account the power limitations and safety of the laboratory equipment. Finally, a corner reflector is used as the target with a distance of 20 m; the corner reflector, as a standard target, provides a high and stable radar cross-section, and the 20 m distance reflects the near-field conditions of laboratory tests, facilitating an accurate evaluation of system performance. The specific parameters in the experiment are provided in Table 1. Processing the experimental data from the two radar systems separately, we analyze the detection and interference performance of our RNFM-NMIS system.
The experimental data analysis results are presented in Figure 8. By examining the time–frequency domain waveforms, it is evident that as the nimble modulation parameter β increases, the frequency variation of RNFM-NMIS becomes more pronounced. This increased frequency agility leads to a greater deviation from the adversary’s LFM signal, thereby reducing the similarity between the two signals. Consequently, the correlation between RNFM-NMIS and the adversary’s LFM signal decreases, enhancing the system’s ability to disrupt the adversary’s radar operation while maintaining its own detection capabilities. Next, the experimental results are analyzed from the perspectives of detection and jamming. First, from the detection perspective, our integrated system utilizes RNFM-NMIS for target detection, generating three-dimensional range-Doppler maps. The results clearly show that the target peaks are well-defined with minimal sidelobe interference. When the nimble modulation parameter is set to 0.2, 0.5, and 1.0, the signal-to-noise ratios (SNRs) of the target relative to adjacent units are approximately 28.98 dB, 33.59 dB, and 42.22 dB, respectively. This indicates that as the nimble modulation parameter β increases, the correlation between RNFM-NMIS and the adversary’s waveform decreases. As a result, the interference from the adversary radar’s transmitted signal on our detection system is significantly mitigated, leading to an overall enhancement in the detection performance of RNFM-NMIS. Second, from the jamming perspective, An analysis of the adversary radar’s detection results following interference by our signal reveals the formation of a distinct interference zone. When the nimble modulation parameter is set to 0.2, 0.5, and 1.0, the corresponding SNRs in the adversary radar’s detection outputs are approximately 16.2 dB, 20.4 dB, and 24.8 dB, respectively. Furthermore, by examining the target peak values, the estimated target distances were found to be 13.6 m, 16.6 m, and 18.4 m, which deviate from the actual distances—indicating that the targets are not being correctly detected. This discrepancy confirms the effective interference achieved by our RNFM-NMIS. Additionally, as illustrated in Figure 8, a smaller nimble modulation parameter β (indicating a higher correlation between signals) results in a more concentrated distribution of interference energy on the adversary radar’s distance-Doppler detection plane; however, this also limits the range of distances over which effective interference can be applied.
While the experimental setup was meticulously designed, several potential sources of error and environmental factors may have influenced the measurements. Variations in environmental conditions, such as temperature, humidity, and electromagnetic interference, could affect electronic components and signal propagation characteristics, introducing measurement inaccuracies. Inaccurate calibration of the USRP devices or associated equipment might lead to systematic errors in signal generation and reception, affecting the reliability of the results. The outdoor environment may introduce multipath propagation, where signals reflect off surfaces before reaching the receiver, causing constructive or destructive interference that can distort measurements. Additionally, operator handling, including variations in equipment setup, antenna positioning, or procedural inconsistencies, could introduce variability in the experimental outcomes. Furthermore, inherent limitations of the USRP B210 devices, such as a typical noise figure of less than 8 dB and a maximum input power of −15 dBm, may contribute to measurement uncertainties. Despite these potential sources of error, the experimental results consistently align with theoretical expectations and simulation outcomes, demonstrating the robustness of our proposed system. The observed detection and jamming performance trends validate the effectiveness of RNFM-NMIS, indicating that the system remains highly reliable under practical operating conditions.

6. Signal Processing Simulation Results

In this section, four sets of experiments are carried out to simulate the signal processing process of the detection target of the integrated system, aiming at verifying the effectiveness of the improved TDPC signal processing method based on the pre-cancellation of direct wave interference. The specific simulation parameters are shown in Table 2.

6.1. Comparison of Matched Filtering Results Under Single Target

In traditional radar signal processing, the conventional matched filtering method is generally used directly for signal processing of target echoes. To evaluate the effectiveness of the TDPC method in mitigating direct wave interference, a comparison has been made between the simulation results of the conventional method and the proposed TDPC method in the context of the integrated system application. In order to highlight the ability of the method to deal with direct wave interference, only the direct wave interference factor is considered without adding noise. The scene parameters are shown in Table 3.
When the SIR is −35 dB, the echo processing results obtained via direct matched filtering are presented in Figure 9. The results indicate that processing the integrated system’s target echo with conventional matched filtering fails to directly reveal the simulated target, due to the overwhelming influence of surrounding sidelobes. Moreover, following MTD processing, the direct wave interference manifests as a distinct interference band. Analysis shows that this band closely corresponds to the direct wave simulation parameters—specifically, a signal time width of 10 µs and a time delay of 40 µs—centered at 6000 m in the range dimension, with a width of 3000 m, spanning the entire velocity dimension. Notably, the simulated target is located at (6000 m, 180 m/s), exactly at the center of the interference band, resulting in the most severe interference.
The results of using TDPC to process the integrated signal echo after matched filtering are shown in Figure 10, which shows that also under the −35 dB SIR, the target peaks are clearly visible in the one-dimensional distance image obtained after processing by this method, the main-para-valve ratio reaches 18.77 dB, and the target main-valve −3 dB width is about 4 m. In the three-dimensional and top view of the results of the MTD processing, the interference bands have been basically eliminated The target spectral line is sharp and obvious, and the simulation result is (distance 6000 m, speed 175.80 m/s), which is consistent with the parameter setting. It can be seen that compared with the traditional signal processing method, the proposed TDPC method of interference pre-cancellation shows a more excellent processing effect and effectively suppresses the direct wave interference in this scene.

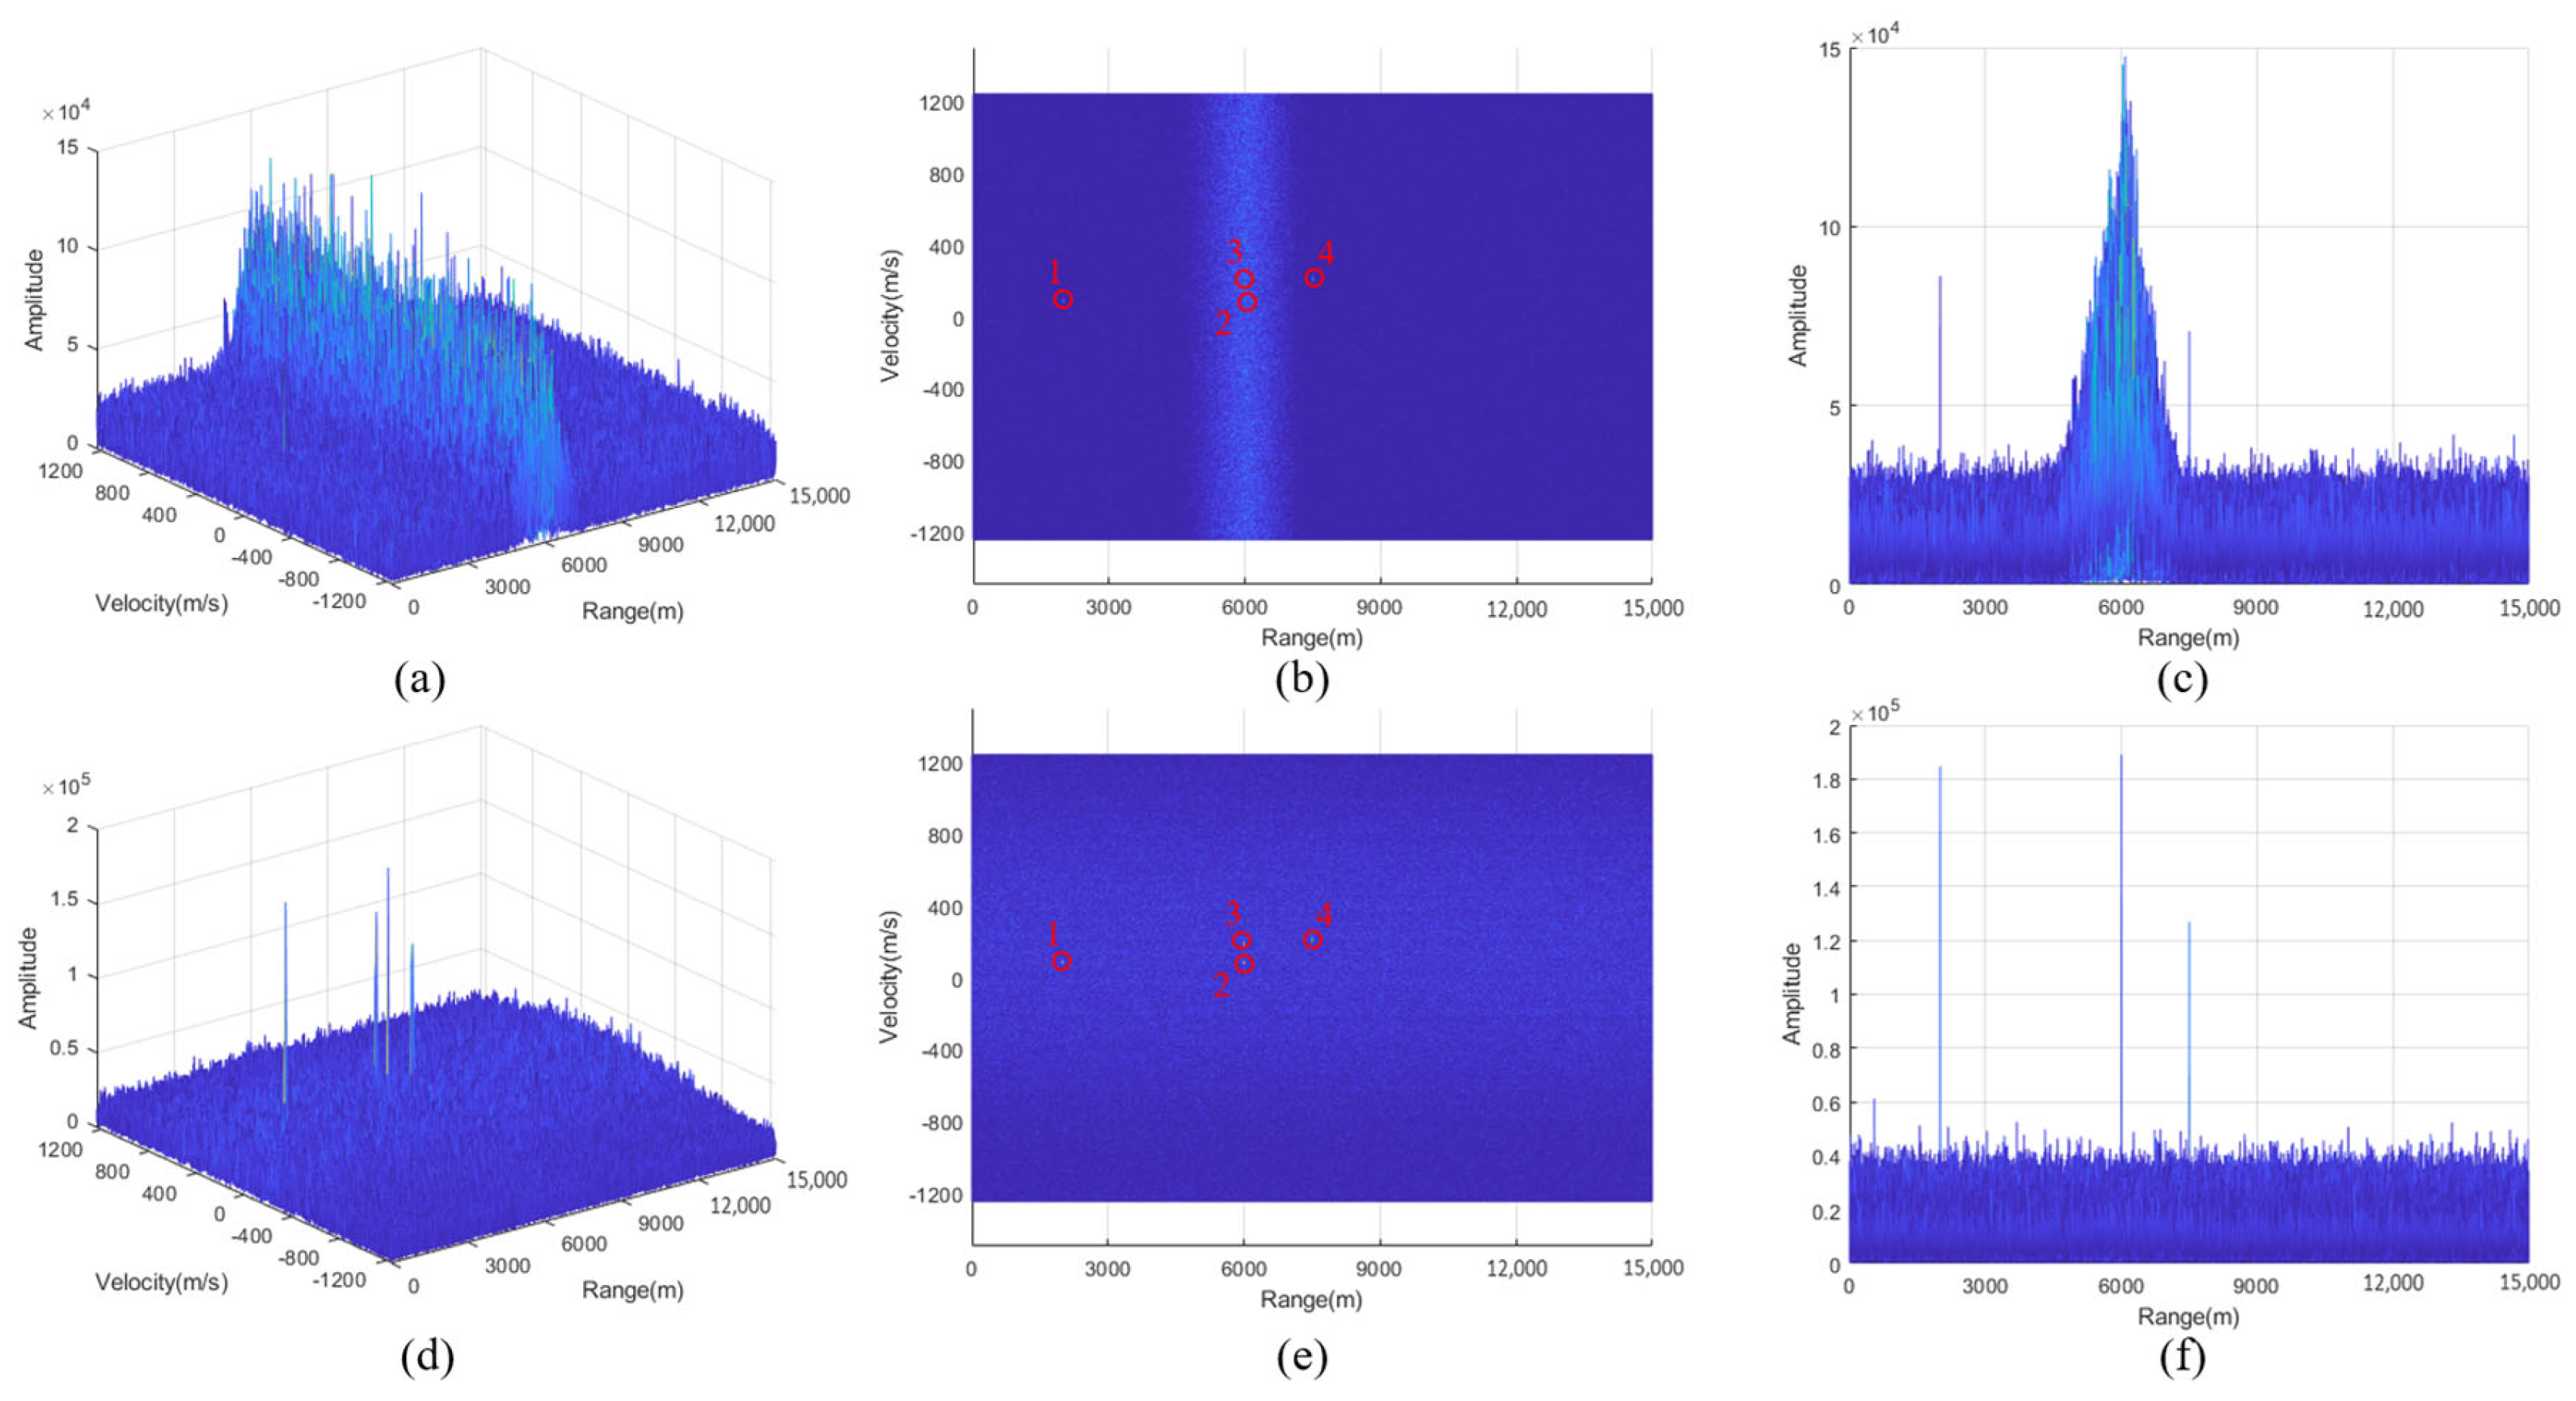
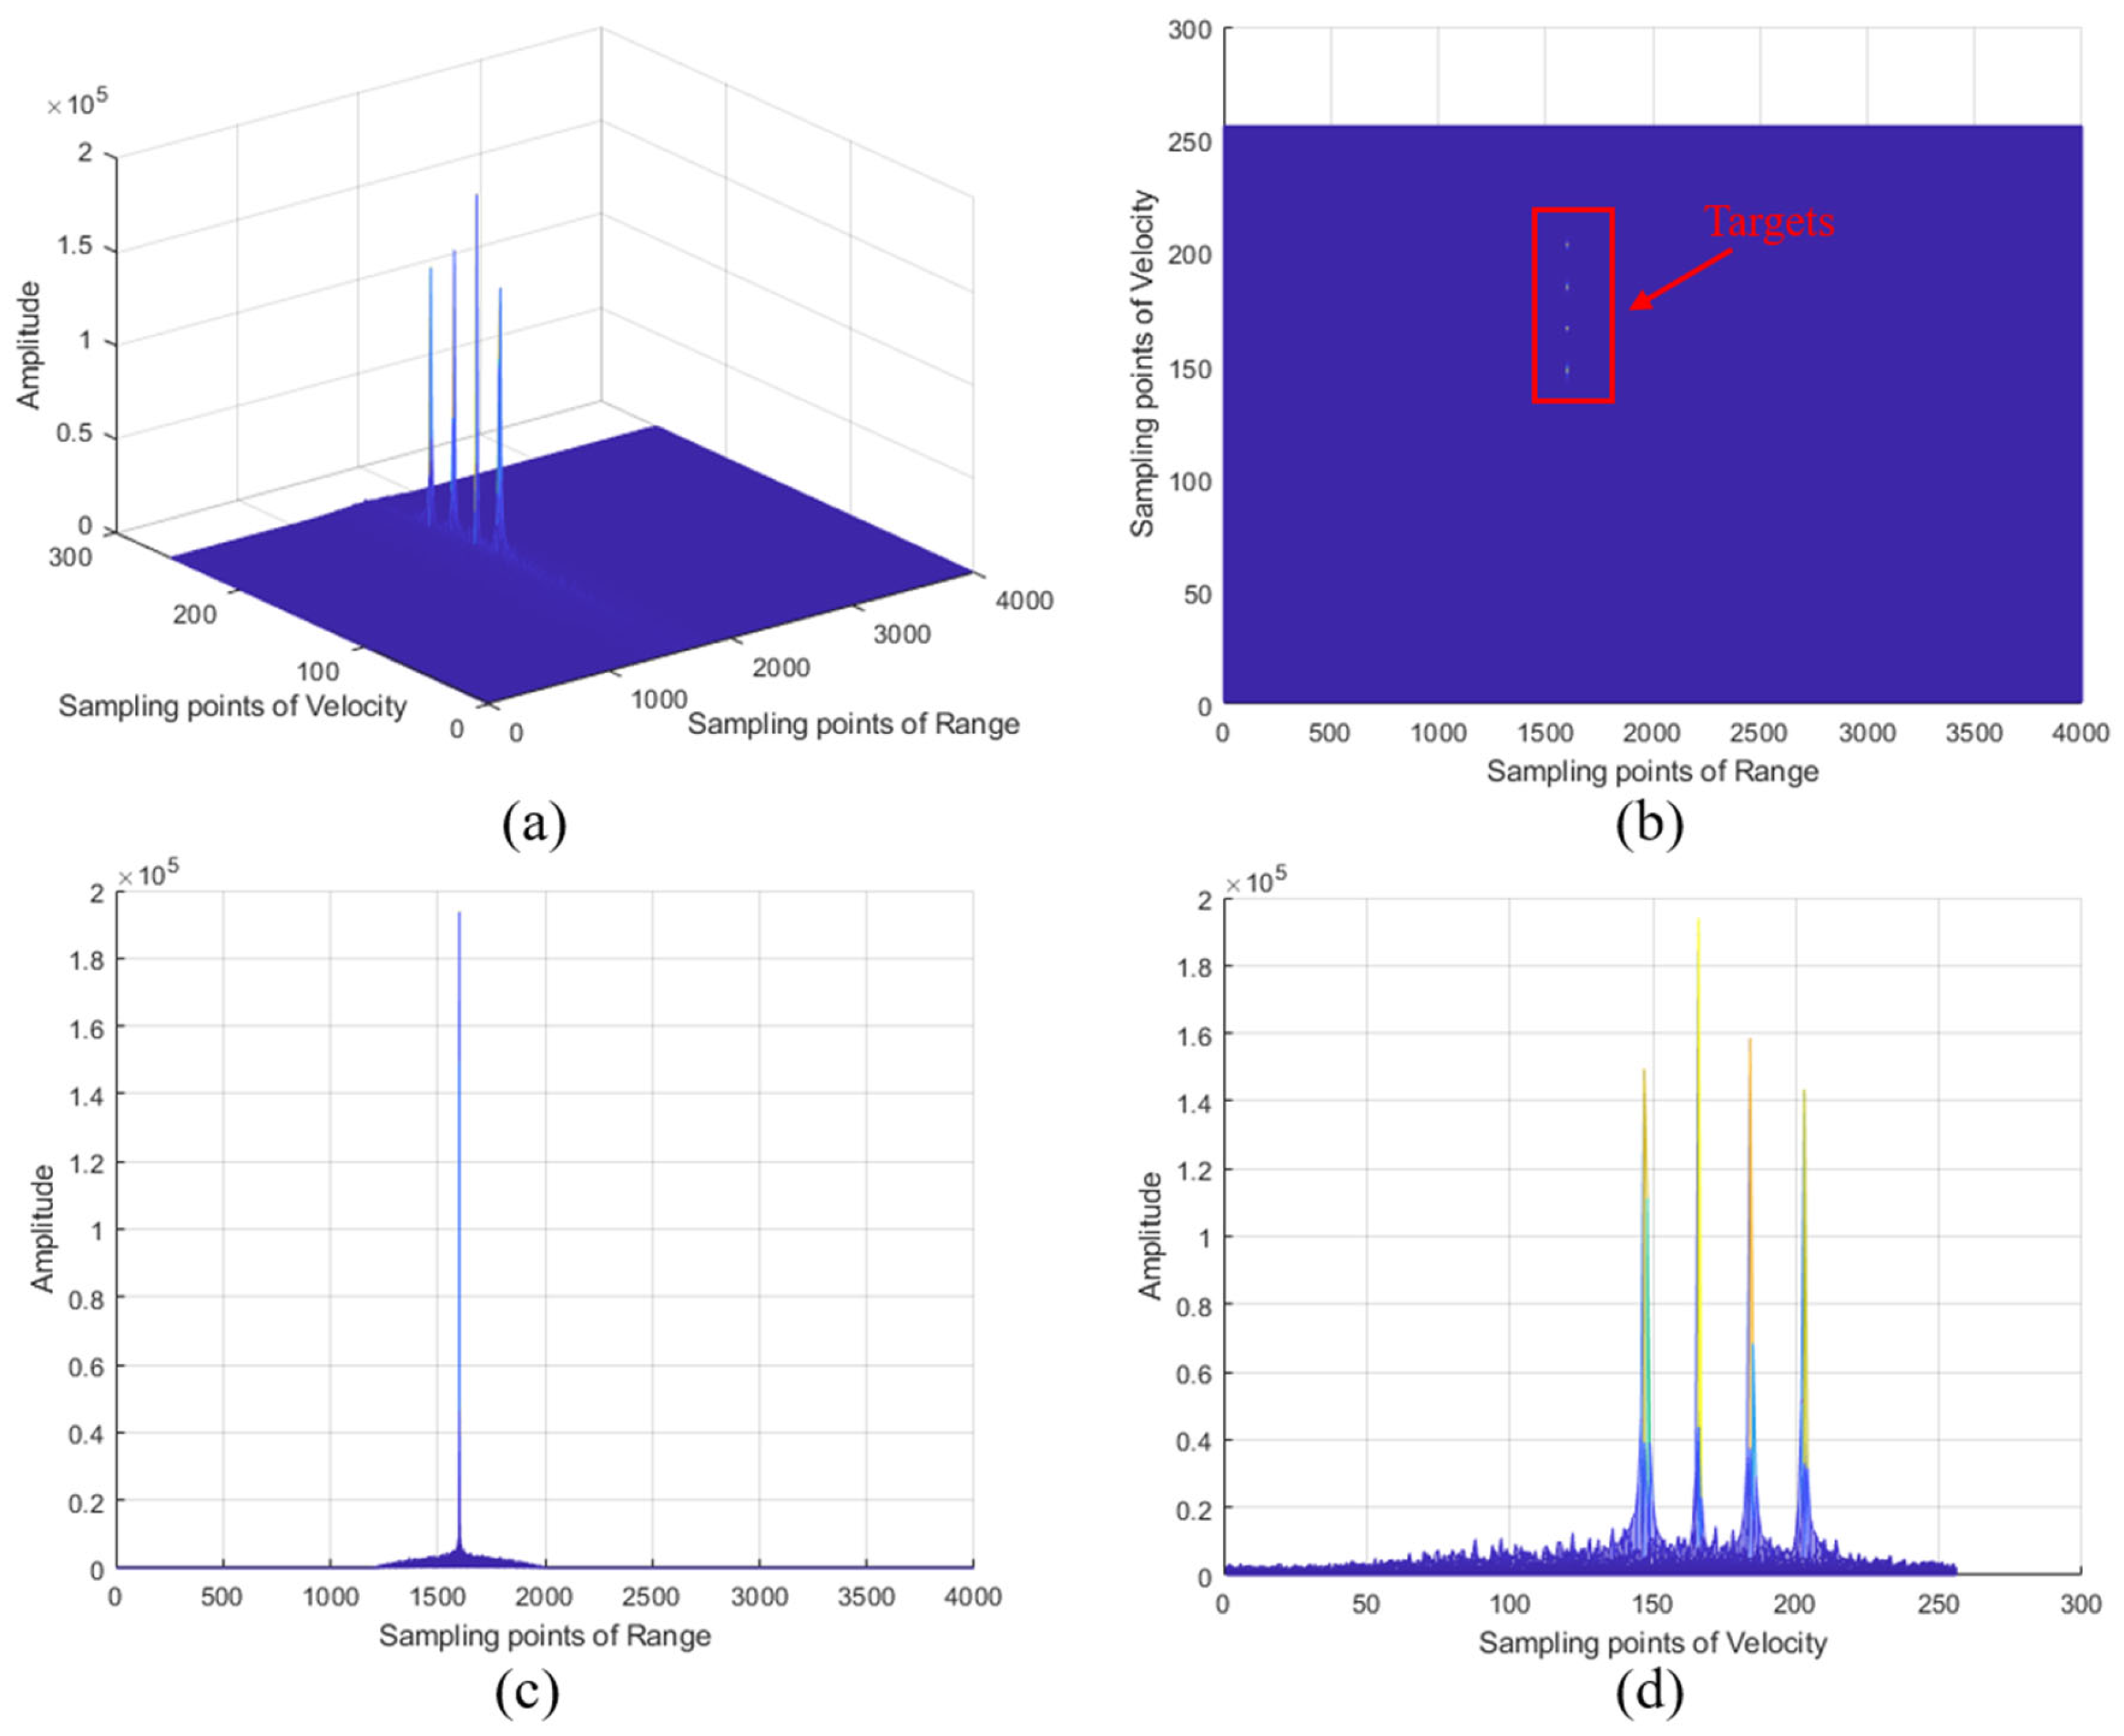
6.2. Multi-Target Detection Results in Complex Environments

In order to further explore the performance of the TDPC method for multi-target detection in complex environments, simulations are carried out using the traditional method and the TDPC method, respectively, while taking into account the influence of noise in practical applications. The details of the simulation parameters are shown in Table 4. Through the analysis of the experimental results, we try to gain a deeper understanding of the adaptability and effectiveness of the TDPC method in complex scenes where noise, interference, and multiple targets coexist and further verify its advantages over traditional methods in complex scenes.
The results of the multi-target echo signal processing of the integrated system are shown in Figure 11, and the two processing methods exhibit significant differences. When the traditional method is used, the targets located in the interference band are almost completely submerged due to the double influence of noise and direct wave interference, which makes it difficult to carry out effective identification. While the targets located outside the interference range, (2000 m, 80 m/s) and (7500 m, 200 m/s), can still be detected through signal processing. On the contrary, when the TDPC method is used for signal processing, all targets can be clearly observed due to the effective elimination of the interference band in advance. The simulation results after processing show that the target positions are (1999 m, 78.13 m/s), (6000 m, 78.13 m/s), (6000 m, 175.80 m/s), and (7500 m, 195.30 m/s), which are highly compatible with the pre-set parameters, with very little error. This comparison result intuitively shows that when processing multi-target echo signals, the TDPC method is more advantageous than the traditional method in suppressing noise and direct-wave interference, which can significantly improve the accuracy and completeness of the target detection and effectively overcome the limitations of the traditional method in complex environments.

6.3. Simulation of the Effect of Direct Wave Doppler Error on Algorithms

In practical application scenarios, due to the interference of the complex electromagnetic environment, a certain degree of error will inevitably occur between the estimated value of the direct-wave Doppler frequency f a d and the real value of f a d obtained by the probe-dryer integration system, and in order to accurately measure this error, the error coefficient α is introduced here, which is defined as
α = | ( f a d f a d ) | / f a d
Based on this, in order to deeply investigate the specific effect of the direct-wave Doppler frequency error on the interference-based pre-cancellation signal processing method, the performance of the TDPC method in the presence of direct-wave Doppler frequency error is analyzed by simulation, in which the simulation parameters are detailed in Table 5.
Figure 12 and Figure 13 show the simulation results of the TDPC method using the direct-wave Doppler frequency estimate f a d and the true value f a d , respectively. f a d = f a d 0.7 = 504 Hz, i.e., the error coefficient α = 0.3 . To simplify the analysis, no noise is added to the echo. It is worth noting that the four targets involved in the simulation are all located in the center axis of the interference band, which makes them suffer from the maximum degree of interference, and thus can highlight the actual processing effect of the improved method more significantly.
When the real value of f a d is used for compensation, the direct-wave interference band is almost completely eliminated, and the four simulated targets can be clearly observed in Figure 12, which is highly consistent with the previous description. However, when the estimated value of f a d is used, although the four simulated targets are still effectively distinguished in Figure 13, the direct-wave interference band is only partially eliminated. The simulation image reveals a distinct inverted V-shaped “canyon” pattern, with the distance-velocity coordinates at the center of the “canyon” being (6000 m, 180 m/s). These values align with the simulation parameters of the direct-wave interference, specifically the instantaneous delay of 40 µs and Doppler frequency of 720 Hz. The reason for this phenomenon is that the direct-wave interference in each pulse echo is only partially eliminated when the estimated value of f a d is used for the direct-wave pre-cancellation operation. Moreover, the degree of interference cancellation decreases as the sequence of pulse echoes advances in each coherent processing interval (CPI). This is reflected in the interference band in Figure 13, i.e., it is manifested in the fact that the further the velocity cell is from the center of the “canyon” on the same distance cell, the greater the residual interference intensity is.
In order to further explore in depth the variation of the target output signal-to-interference ratio ( S I R o u t ) under the TDPC method within a specific direct-wave Doppler frequency error range, here, S I R o u t is defined as the ratio of the signal power of the target cell to the average signal power of the surrounding extended region. Specifically, the expansion region is centered on the target cell, extending 50 distance cells in the positive and negative directions in the distance dimension, and 20 distance cells in the positive and negative directions in the velocity dimension, and Figure 14 gives a schematic diagram of this definition.
In order to obtain more reliable and statistically significant results, this study carried out 1000 Monte-Carlo experiments for the S I R o u t . The simulation parameters of the target are adjusted to (6000 m, 175.8 m/s), (6000 m, 361.3 m/s), (6000 m, 537.1 m/s), and (6000 m, 722.7 m/s). The results of the error curves are shown in Figure 15. It can be seen that with the gradual increase in the error coefficient, the target S I R o u t obtained by the proposed TDPC method shows a continuous decreasing trend; at the same time, it is also observed that when the target speed and the radial speed of our integrated system relative to the other side’s radar are closer to each other, the target S I R o u t is higher, and the de-interference effect based on the TDPC method of the direct-wave interference pre-countermeasure is better; in addition, with the increase in the target speed, the radial speed difference with our integrated system gradually increases, and the target S I R o u t also decreases. In addition, as the target speed increases, the radial speed difference with our integrated system gradually increases, and the target S I R o u t also decreases. In general, under the conditions set in this study—specifically, with direct wave interference parameters including a 40 µs delay, a Doppler frequency of 720 Hz, a target input SIR of −50 dB, a target speed of less than 720 m/s, and a Doppler frequency error of the direct wave within 30 % —the output SAR for the target remains above 15 dB. Under these circumstances, it can be concluded that the target within the interference zone can be effectively detected.

7. Conclusions

Based on the RNFM-NMIS generated from the adversary radar signal, it possesses both detection and interference capabilities. Furthermore, by adjusting the nimble modulation parameter, the correlation between signals can be modified, striking a balance between detection and interference effects while considering the direct wave interference of the adversary radar signal. However, direct wave interference from the adversary radar signal remains an unavoidable issue. The core principle of the TDPC-based signal processing method lies in the amplitude compensation mechanism and the subsequent phase subtraction operation of adjacent pulse echoes, which realizes the effective cancellation of direct wave interference. In a series of simulation experiments conducted in this paper, the proposed TDPC method demonstrates excellent performance. The experimental results show that the method is able to effectively remove the direct-wave interference from the echoes, even in the presence of certain direct-wave Doppler frequency estimation errors. This feature enables the subsequent signal processing to be carried out smoothly, and then the target can be detected accurately, which provides solid theoretical support for practical applications.
In practical application scenarios, if the initial phase subtraction operation does not adequately remove direct wave interference to meet the integrated system’s preset performance criteria, a moderate extension of the coherent accumulation time should be considered. By prolonging the accumulation period, multiple iterations of adjacent pulse-echo phase reduction can be performed, allowing the interference suppression effects from each round to be cumulatively enhanced. This strategy ultimately achieves the level of interference suppression necessary for stable and efficient operation of the integrated system in complex electromagnetic environments. However, the real-time application of this method is heavily influenced by hardware constraints. Extending the coherent accumulation time increases the computational load, which may require more advanced processing hardware and optimized algorithms to ensure timely processing. Moreover, in operational scenarios characterized by multiple interference sources or dynamic interference conditions, the effectiveness of the method may be limited. In such environments, the accumulation process might struggle to adapt quickly to rapid changes without additional adaptive processing techniques. Future research should thus focus on enhancing hardware capabilities and developing more robust, adaptive algorithms to improve real-time performance and broaden the applicability of this method in various challenging interference scenarios.

Author Contributions

X.C. and S.Z. conceived and simulated the algorithm and wrote the paper; K.T. improved the algorithm and designed experiments; J.Y. and X.L. conducted experiments and data analysis; X.L. and Z.D. provided valuable suggestions to improve this study; H.G. contributed analysis tools and laboratory equipment. All authors have read and agreed to the published version of the manuscript.

Funding

This work is supported by National Natural Science Foundation of China under Grant 62101260, Grant 62001229, and Grant 62101264.

Institutional Review Board Statement

The current research is limited to radar signal processing, which is beneficial for radar detection in complex electromagnetic environments and does not pose a threat to public health or national security. Authors acknowledge the dual-use potential of the research involving the integrated system and confirm that all necessary precautions have been taken to prevent potential misuse. As an ethical responsibility, authors strictly adhere to relevant national and international laws about DURC. Authors advocate for responsible deployment, ethical considerations, regulatory compliance, and transparent reporting to mitigate misuse risks and foster beneficial outcomes.

Data Availability Statement

Data are contained within the article.

Conflicts of Interest

The authors declare no conflicts of interest. The funders had no role in the design of the study; in the collection, analyses, or interpretation of data; in the writing of the manuscript; or in the decision to publish the results.

References

  1. Zhang, C.; Wang, L.; Jiang, R.; Hu, J.; Xu, S. Radar Jamming Decision-Making in Cognitive Electronic Warfare: A Review. IEEE Sens. J. 2023, 23, 11383–11403. [Google Scholar] [CrossRef]
  2. Moon, S.H.; Kim, K.I.; Choi, H.J.; Kim, K.T. Simulation of Ground Clutter Received Signals on Rough Surfaces in an Electronic Warfare Environment. J. Korean Inst. Electromagn. Eng. Sci. 2025, 36, 95–105. [Google Scholar] [CrossRef]
  3. Shen, Y.; Lv, Z.; Liu, M.; Liu, J. The Jamming Evaluation System of Intelligent Electromagnetic Spectrum Warfare. In Proceedings of the 2024 IEEE 12th International Conference on Information, Communication and Networks (ICICN), Guilin, China, 21–24 August 2024; IEEE: Piscataway, NJ, USA, 2024; pp. 111–114. [Google Scholar] [CrossRef]
  4. Zhang, P.; Zhang, C.; Gai, W. Research on application and development trend of multi-domain cooperative combat for unmanned combat platform. In Proceedings of the 2021 2nd International Symposium on Computer Engineering and Intelligent Communications (ISCEIC), Nanjing, China, 6–8 August 2021; IEEE: Piscataway, NJ, USA, 2021; pp. 297–301. [Google Scholar] [CrossRef]
  5. Fan, X. Intelligent Radio Spectrum Management and Dynamic Spectrum Allocation Algorithm. In Proceedings of the 2024 International Conference on Power, Electrical Engineering, Electronics and Control (PEEEC), Athens, Greece, 14–16 August 2024; IEEE: Piscataway, NJ, USA, 2024; pp. 836–841. [Google Scholar] [CrossRef]
  6. Wei, Z.; Liu, F.; Ng, D.W.K.; Schober, R. Safeguarding UAV networks through integrated sensing, jamming, and communications. In Proceedings of the ICASSP 2022-2022 IEEE International Conference on Acoustics, Speech and Signal Processing (ICASSP), Singapore, 23–27 May 2022; IEEE: Piscataway, NJ, USA, 2022; pp. 8737–8741. [Google Scholar] [CrossRef]
  7. Zhang, S.; Lu, X.; Tan, K.; Yan, H.; Yang, J.; Dai, Z.; Gu, H. Co-Frequency Interference Suppression of Integrated Detection and Jamming System Based on 2D Sparse Recovery. Remote Sens. 2024, 16, 2325. [Google Scholar] [CrossRef]
  8. Mokole, E.L.; Blunt, S.D. Some Current and Recent RF-Spectrum Research and Development, Applications, Management, and Interference Mitigation. In Proceedings of the 2023 IEEE Conference on Antenna Measurements and Applications (CAMA), Genoa, Italy, 15–17 November 2023; IEEE: Piscataway, NJ, USA, 2023; pp. 417–422. [Google Scholar] [CrossRef]
  9. Dong, Z.; Liu, Y.; Ouyang, Y. Integrated Detection of Respiration and Heartbeat with Communication Capabilities Using OFDM-LFM-MP Signals. IEEE Access 2025, 13, 4021–4033. [Google Scholar] [CrossRef]
  10. Uysal, F. Phase-coded FMCW automotive radar: System design and interference mitigation. IEEE Trans. Veh. Technol. 2019, 69, 270–281. [Google Scholar] [CrossRef]
  11. Li, Q.; Wang, Y.; Shang, K. Design and performance simulation for the detection and jamming integrated signal waveform. J. Detect. Control 2020, 42, 39–43. [Google Scholar]
  12. Lu, J.; Zhang, Q.; Shi, W.; Zhang, L. Development and Prospect of Detection and Communication Integration. J. Signal Process. 2019, 35, 1484–1495. [Google Scholar] [CrossRef]
  13. Su, W.C.; Lai, Y.C.; Horng, T.S.; El Arif, R. Time-Division Multiplexing MIMO Radar System with Self-Injection-Locking for Image Hotspot-Based Monitoring of Multiple Human Vital Signs. IEEE Trans. Microw. Theory Tech. 2023, 72, 1943–1952. [Google Scholar] [CrossRef]
  14. Dong, B.; Jia, J.; Tao, L.; Li, G.; Li, Z.; Huang, C.; Shi, J.; Wang, H.; Tang, Z.; Zhang, J.; et al. Photonic-based w-band integrated sensing and communication system with flexible time-frequency division multiplexed waveforms for fiber-wireless network. J. Light. Technol. 2024, 42, 1281–1295. [Google Scholar] [CrossRef]
  15. Wang, Y.; Yu, X.; Yang, J.; Cui, G. Cognitive Radar Subpulses Waveform Design via Online Greedy Search. IEEE Trans. Signal Process. 2025, 73, 1122–1137. [Google Scholar] [CrossRef]
  16. Song, Y.; Tian, B.; Wang, R.; Xu, S.; Chen, Z. Joint waveform design and resource allocation strategy for cognitive radar target situation awareness. IET Radar Sonar Navig. 2024, 18, 1364–1380. [Google Scholar] [CrossRef]
  17. Zhang, W.; Zhang, H. The design of integrated waveform based on MSK-LFM signal. In Proceedings of the 2020 15th IEEE International Conference on Signal Processing (ICSP), Beijing, China, 6–9 December 2020; Volume 1, pp. 565–569. [Google Scholar] [CrossRef]
  18. Li, C.; Wu, G. A shared waveform design and processing method for integrated radar detection and coherent jamming signal. In Proceedings of the 2022 IEEE 10th Joint International Information Technology and Artificial Intelligence Conference (ITAIC), Chongqing, China, 17–19 June 2022; IEEE: Piscataway, NJ, USA, 2022; Volume 10, pp. 373–380. [Google Scholar] [CrossRef]
  19. Li, Z.; Yang, Y. lfm interference suppression algorithm based on FrFT. In Proceedings of the 2020 IEEE 6th International Conference on Computer and Communications (ICCC), Chengdu, China, 11–14 December 2020; IEEE: Piscataway, NJ, USA, 2020; pp. 1161–1165. [Google Scholar] [CrossRef]
  20. Wang, Y.; Cao, Y.; Yeo, T.S.; Cheng, Y.; Zhang, Y. Sparse reconstruction-Based joint signal processing for MIMO-OFDM-IM integrated radar and communication systems. Remote Sens. 2024, 16, 1773. [Google Scholar] [CrossRef]
  21. Fang, Y.; Pan, Y.; Ma, H.; Ma, D.; Guizani, M. A novel DCSK-based linear frequency modulation waveform design for joint radar and communication systems. IEEE Trans. Green Commun. Netw. 2024, 9, 354–366. [Google Scholar] [CrossRef]
  22. Jiang, X.; Wu, X.; Gu, Q.J.; Liu, X. On Amplitude Modulation in CW Doppler Radars for Remote Displacement Sensing Using ENVSIL Radar. IEEE Trans. Microw. Theory Tech. 2024; early access. [Google Scholar] [CrossRef]
  23. Chen, T.; Zhe, Z. Research on Smart Noise Frequency Modulation Jamming Technology Based on Convolution Modulation. In Proceedings of the 2024 9th International Conference on Electronic Technology and Information Science (ICETIS), Hangzhou, China, 17–19 May 2024; IEEE: Piscataway, NJ, USA, 2024; pp. 195–199. [Google Scholar] [CrossRef]
  24. Zhang, S.; Lu, X.; Yu, W.; Wu, Y.; Yan, H.; Wu, M.; Gu, H. Direct Wave Suppression Technology Based on De-slope Filtering and Sparse Recovery of Integrated Detection and Jamming System. J. Signal Process. 2023, 39, 221–234. [Google Scholar] [CrossRef]
  25. Aldimashki, O.; Serbes, A. LFM signal parameter estimation in the fractional Fourier domains: Analytical models and a high-performance algorithm. Signal Process. 2024, 214, 109224. [Google Scholar] [CrossRef]
  26. A uniform-Laplace mixture distribution. J. Comput. Appl. Math. 2023, 429, 115236. [CrossRef]
  27. Jia, W.; Jiao, Z.; Zan, W.; Zhu, W. Probability density of the solution to nonlinear systems driven by Gaussian and Poisson white noises. Probabilistic Eng. Mech. 2024, 77, 103658. [Google Scholar] [CrossRef]
  28. Alpay, D.; De Martino, A.; Diki, K.; Struppa, D.C. Short-time Fourier transform and superoscillations. Appl. Comput. Harmon. Anal. 2024, 73, 101689. [Google Scholar] [CrossRef]
  29. Lyu, M.; Chen, H.; Yang, J.; Wu, X.; Zhou, M.; Ma, X. Sensing matrix optimization for random stepped-frequency signal based on two-dimensional ambiguity function. Chin. J. Electron. 2024, 33, 161–174. [Google Scholar] [CrossRef]
Figure 1. The working scene of the detection and jamming integrated system.
Electronics 14 01227 g001
Figure 2. The signal generation structure of the RNFM-NMIS.
Electronics 14 01227 g002
Figure 3. The time–frequency domain results of the signal. (a) Adversary LFM signal. (b) The RNFM-NMIS.
Electronics 14 01227 g003
Figure 4. The three-dimensional ambiguity maps. (a) RNFM-NMIS. (b) PC-LFM.
Electronics 14 01227 g004
Figure 5. Cross-correlation function maps of the adversary radar. (a) Interfered by RNFM-NMIS. (b) Interfered by PC-LFM.
Electronics 14 01227 g005
Figure 6. Signal processing flowchart of our integrated detection and jamming radar system.
Electronics 14 01227 g006
Figure 7. Signal processing flowchart of TDPC to the direct-wave interference.
Electronics 14 01227 g007
Figure 8. Experimental results include the time–frequency domain waveforms, detection effects, and jamming effects of RNFM-NMIS.
Electronics 14 01227 g008
Figure 9. Results of direct matched filtering of target echoes (including direct wave interference) of the integrated system. (a) Single pulse range dimension. (b) Single pulse range dimension after amplitude normalization. (c) Three-dimensional view of MTD processed results. (d) Top view of MTD processed results.
Electronics 14 01227 g009
Figure 10. Results of echo processing by TDPC (including direct wave interference). (a) Single pulse range dimension. (b) Single pulse range dimension after amplitude normalization. (c) Three-dimensional view of MTD processed results. (d) Top view of MTD processed results.
Electronics 14 01227 g010
Figure 11. Multi-target detection results for integrated systems in complex environments. (ac) Results of the traditional method. (df) Results of the TDPC method.
Electronics 14 01227 g011
Figure 12. TDPC results based on true values of direct-wave Doppler frequencies. (a) Three-dimensional view of MTD processed results. (b) Top view of MTD processed results. (c) Range dimension cut surface result. (d) Velocity dimension cut surface result.
Electronics 14 01227 g012
Figure 13. TDPC results based on estimated values of direct-wave Doppler frequencies. (a) Three-dimensional view of MTD processed results. (b) Top view of MTD processed results. (c) Range dimension cut surface result. (d) Velocity dimension cut surface result.
Electronics 14 01227 g013
Figure 14. Specific schematic of the range of S I R o u t definition.
Electronics 14 01227 g014
Figure 15. Variation curve of S I R o u t with the error coefficient at different speeds.
Electronics 14 01227 g015
Table 1. The Experimental Parameters.
ParametersValues
LFM signal bandwidth20 MHz
Signal pulse width10 μs
Nimble modulation parameter0.2, 0.5, 1.0
Type of noiseGaussian distribution
Carrier frequency5 GHz
Pulse repetition interval50 μs
Sampling rate40 MHz
Transmit power10 dBm
Target categoryCorner reflector
Target distance20 m
Table 2. The Experimental Parameters.
ParametersValues
Adversary LFM signal bandwidth20 MHz
Adversary LFM signal pulse width10 μs
Our NFM signal bandwidth20 MHz
Our NFM signal pulse width10 μs
Carrier frequency600 MHz
Pulse repetition interval100 μs
Number of repetition cycles257
Sampling rate80 MHz
Table 3. The Scene Parameters.
ParametersValues
Target distance6000 m
Target speed180 m/s
Time delay of direct wave40 μs
Doppler frequency of direct wave720 Hz
Signal-to-interference ratio (SIR)−35 dB
Table 4. The Scene Parameters.
ParametersValues
Target distance and speed(2000 m, 80 m/s), (6000 m, 80 m/s)
   (6000 m, 180 m/s), (7500 m, 200 m/s)
Time delay of direct wave40 μs
Doppler frequency of direct wave720 Hz
Signal-to-noise ratio (SNR)−35 dB
Signal-to-interference ratio (SIR)−35 dB
Table 5. The Scene Parameters.
ParametersValues
Target distance and speed(6000 m, 180 m/s), (6000 m, 360 m/s)
   (6000 m, 540 m/s), (7500 m, 720 m/s)
Time delay of direct wave40 μs
Real Doppler frequency of direct wave720 Hz
Error coefficient0.3
Signal-to-interference ratio (SIR)−50 dB
Disclaimer/Publisher’s Note: The statements, opinions and data contained in all publications are solely those of the individual author(s) and contributor(s) and not of MDPI and/or the editor(s). MDPI and/or the editor(s) disclaim responsibility for any injury to people or property resulting from any ideas, methods, instructions or products referred to in the content.

