Article

Wireless Charger for Pacemakers Controlled from Primary Current Without Communication with Secondary Side

Power Electronics Systems Group, Carlos III University of Madrid, 28911 Leganes, Spain
*
Authors to whom correspondence should be addressed.
Electronics 2025, 14(8), 1563; https://doi.org/10.3390/electronics14081563
Submission received: 6 March 2025 / Revised: 7 April 2025 / Accepted: 10 April 2025 / Published: 12 April 2025
(This article belongs to the Special Issue Wireless Power Transfer Systems: Design and Implementation)

Abstract

:
This paper discusses the implementation of a wireless inductive power transfer system for pacemaker applications. One of the inherent challenges in these systems is regulating the output voltage, as there is no direct physical connection from the primary. Additionally, there are other challenges, such as variability in magnetic coupling. First, resonant converters for inductive charging topologies are investigated for biomedical applications. Then, a control method based on the system’s modeling is proposed, eliminating the need for communication. This method is designed for systems with variable and unknown coupling and specifically for a resonant series–parallel topology. For an operation point, determined by the coupling factor, the primary current is measured to regulate the output voltage by adjusting the input voltage. The relationship between the input current and the input voltage is set by a look-up table. The effectiveness of this control strategy is validated in the PSIM simulator and with experimental results for a coupling range between 0.3 and 0.5, achieving a regulated output current error of less than 1%, and an output voltage range within the limits of the battery charger.

1. Introduction

Active implantable medical devices (AIMD) are devices implanted into a patient’s body to stimulate, treat, or regulate a malfunctioning organ. These devices include pacemakers, which, like other active devices, require an electrical power source to operate. In the specific context of pacemakers, primary batteries are the most commonly used power source [1].
Currently, when the primary battery of a pacemaker is depleted, the device must be completely removed from the patient to replace the battery [2]. The surgical procedure required to replace an AIMD can lead to complications and increase patient risk. Therefore, the current challenge is to develop alternative supply methods that avoid further surgical intervention [3,4].
The objective is to prolong the lifespan of AIMDs by replacing primary batteries with rechargeable technology. One of the methods for recharging is self-recharging through energy harvesting from the environment [5,6,7,8]. However, the solution most studied in pacemakers and AIMDs is the use of wireless power transfer (WPT).
Inductive power transfer (IPT) is the most widely used wireless power transfer (WPT) technology for wireless charging of batteries in biomedical devices due to its simplicity, high efficiency over short distances, and safety [9,10]. IPT converters typically operate in resonance [11], which aims to counteract the leakage inductance of the magnetic coupling by using compensation capacitors on both the primary and secondary sides. This significantly improves efficiency [12,13].
An IPT resonant converter consists of four basic components, as shown in Figure 1: an inverter stage that generates a periodic current, a transmitter coil that includes a resonance tank for primary compensation, a receiver coil that includes another resonance tank for secondary compensation, and a rectifier with high-frequency filtering [11]. This architecture includes a pre-regulator for control. The main parameters that define these systems are the resonance frequency, the magnetic coupling between the coils, and the battery charger.
The main challenge is regulating the converter’s output voltage without physical connections between the transmitter and receiver. The necessity for regulation arises from the variability and uncertainty frequently observed regarding the coupling of coils in many applications. This leads to alterations in the operation point and energy transfer efficiency [9].
This paper presents a method for regulating and controlling the converter from the primary side of the IPT system without communication between both sides. Unlike other strategies that estimate system parameters, such as those presented in [14], this method uses a look-up table (LUT) that contains the main converter operation points. The LUT allows for determining the magnitudes at different coupling conditions for a constant output power. The output regulation is achieved through the sensing of the primary current amplitude and the subsequent adjustment of the input voltage based on the LUT. This predictive approach eliminates the need for communication between both sides of the converter. The control is appropriate for applications with unknown coupling and space and/or weight constraints on the receiver, such as charging systems for small drones or biomedical devices.
This article describes the design and control process of the power converter. The converter and the control system were validated by simulation. Also, a functional prototype was developed, and the correct operation of the system was checked.

2. State of the Art

2.1. Cardiac Pacemaker Technology

The pacemaker is an electronic device implanted in the human body that produces electrical impulses to stimulate the heart muscle when normal stimulation fails. It comprises an electrical pulse generator (the pacemaker) and an electrode [2]. The pulse generator is a small metal casing that houses the electronics and battery. When the battery is depleted, the entire device must be replaced. The replacement procedure carries similar risks to the initial surgery, including infection, bruising in the pacemaker area, and adverse reactions to anesthetics [15].
The initial pacemaker implants in humans used rechargeable nickel–cadmium batteries recharged inductively by transmitting energy to the implanted receiver. However, these batteries had a shorter lifespan than primary or non-rechargeable ones. Additionally, the inductive technology was limited in energy transfer, which extended the charging duration by hours [16].
Primary pacemaker battery technologies began in the 1960s with mercury–zinc and plutonium (Pu-238) batteries, both metallic and ceramic plutonium oxide. In 1972, the lithium/iodine–polyvinylpyridine–iodine battery was first implemented and became the power source of choice for pacemakers due to its long lifespan and high energy density. Furthermore, the voltage gradually and predictably decreases, making it safe and easy to predict when a replacement is needed [16].
These primary batteries have voltages ranging from 2.75 V to 3.0 V and capacities of approximately 1 Ah. Despite their higher energy density, they must be replaced once depleted. The technology currently under investigation for this type of implant is based on secondary lithium-ion electrolyte batteries. Although these have a lower energy density, they can extend the life of the device [2].

2.2. Wireless Charging in Pacemakers

Using an IPT converter in AIMDs allows the batteries to be recharged from outside the patient. Invasive procedures are reduced, and the risk of infection in the pacemaker area due to surgery is limited. In order to implement this technology in pacemaker chargers, it is necessary to consider the relevant specifications of this application.
The pacemaker case is implanted under the skin at a maximum distance of 15 mm [17,18]. The distance between coils may vary due to patient respiration and tissue thickness differences, typically between 8 mm and 12 mm [19]. The coupling factor, k, is affected by both the distance and misalignment, typically ranging from 0.15 to 0.4 [2]. Equation (1) relates the mutual inductance to the coils’ inductance.
M = k L 1 L 2 k = M L 1 L 2
A lithium battery with a voltage of 3.6 V, adjusted to the pacemaker’s size, would have a capacity of approximately 100 mAh. In contrast, the stimulator consumes 10–20 μA, and the communication for 30 min every 6 months consumes 200–400 μA in new-generation pacemakers [20]. The charging process is usually set at 2 C to reduce the patients’ waiting time to 30 min [21]. The charging power for this case should not exceed 800 mW [2]. According to (2), the approximate duration without charging would be a maximum of one year.
t d i s c h a r g e = Q b a t I d i s c h a r g e
The resonant frequency is a crucial parameter in resonant IPT converters. High frequencies improve the inductive transfer efficiency but can cause excessive losses in the active components and additional radiation. Low frequencies offer better penetration of the magnetic field into the body by radiating less but present lower efficiency and transferred power [2,3,22,23]. However, low frequencies improve electromagnetic compatibility (EMC) by generating fewer eddy currents [2,17]. Operating in the 300–500 kHz range achieves high efficiency between windings without compromising the operation of the power converter.

2.3. Human Exposure Considerations

In order to ensure patient safety in the face of potential hazards associated with electromagnetic radiation, it is essential that the device’s design adhere to the relevant safety regulations. Given the potential for tissue heating damage, it is important to consider the safe levels of power absorbed by tissue. The specific absorption rate (SAR) is the factor employed to measure the maximum permissible exposure (MPE) in electromagnetic field environments [24]. The International Commission on Non-Ionizing Radiation Protection (ICNIRP) and the IEEE Standard Basis C95.1 serve as the basis for establishing SAR limitations. These standards stipulate the calculation of the average SAR by determining the mass in grams and subsequently representing the SAR as a function per unit mass. According to IEEE 1992, the maximum SAR value should be less than 2 W/kg for 10 g and less than 1.6 W/kg for 1 g [19,24,25].
The estimation of the value is derived from the Equation (3), where σ is the conductivity, ρ is the tissue sample density, and E is the electric field. It can also be estimated in terms of the temperature rise (T) over a given exposure time (t) for specific tissue points with specific heat capacity (c). The tissue quantity can be integrated into a mass or volume of tissue, as delineated in each SAR standard [25,26].
S A R = σ · E 2 ρ = c Δ T Δ t
A number of researchers specializing in pacemaker systems have conducted safety assessment-oriented SAR calculations. Typical analysis methodologies include three-dimensional finite element simulations [3,18,27]. Additionally, an analysis was conducted in [3] to examine the impact of induced currents on the titanium case, which demonstrated that the case can modify the efficiency of the IPT system.

3. Power Stage Design

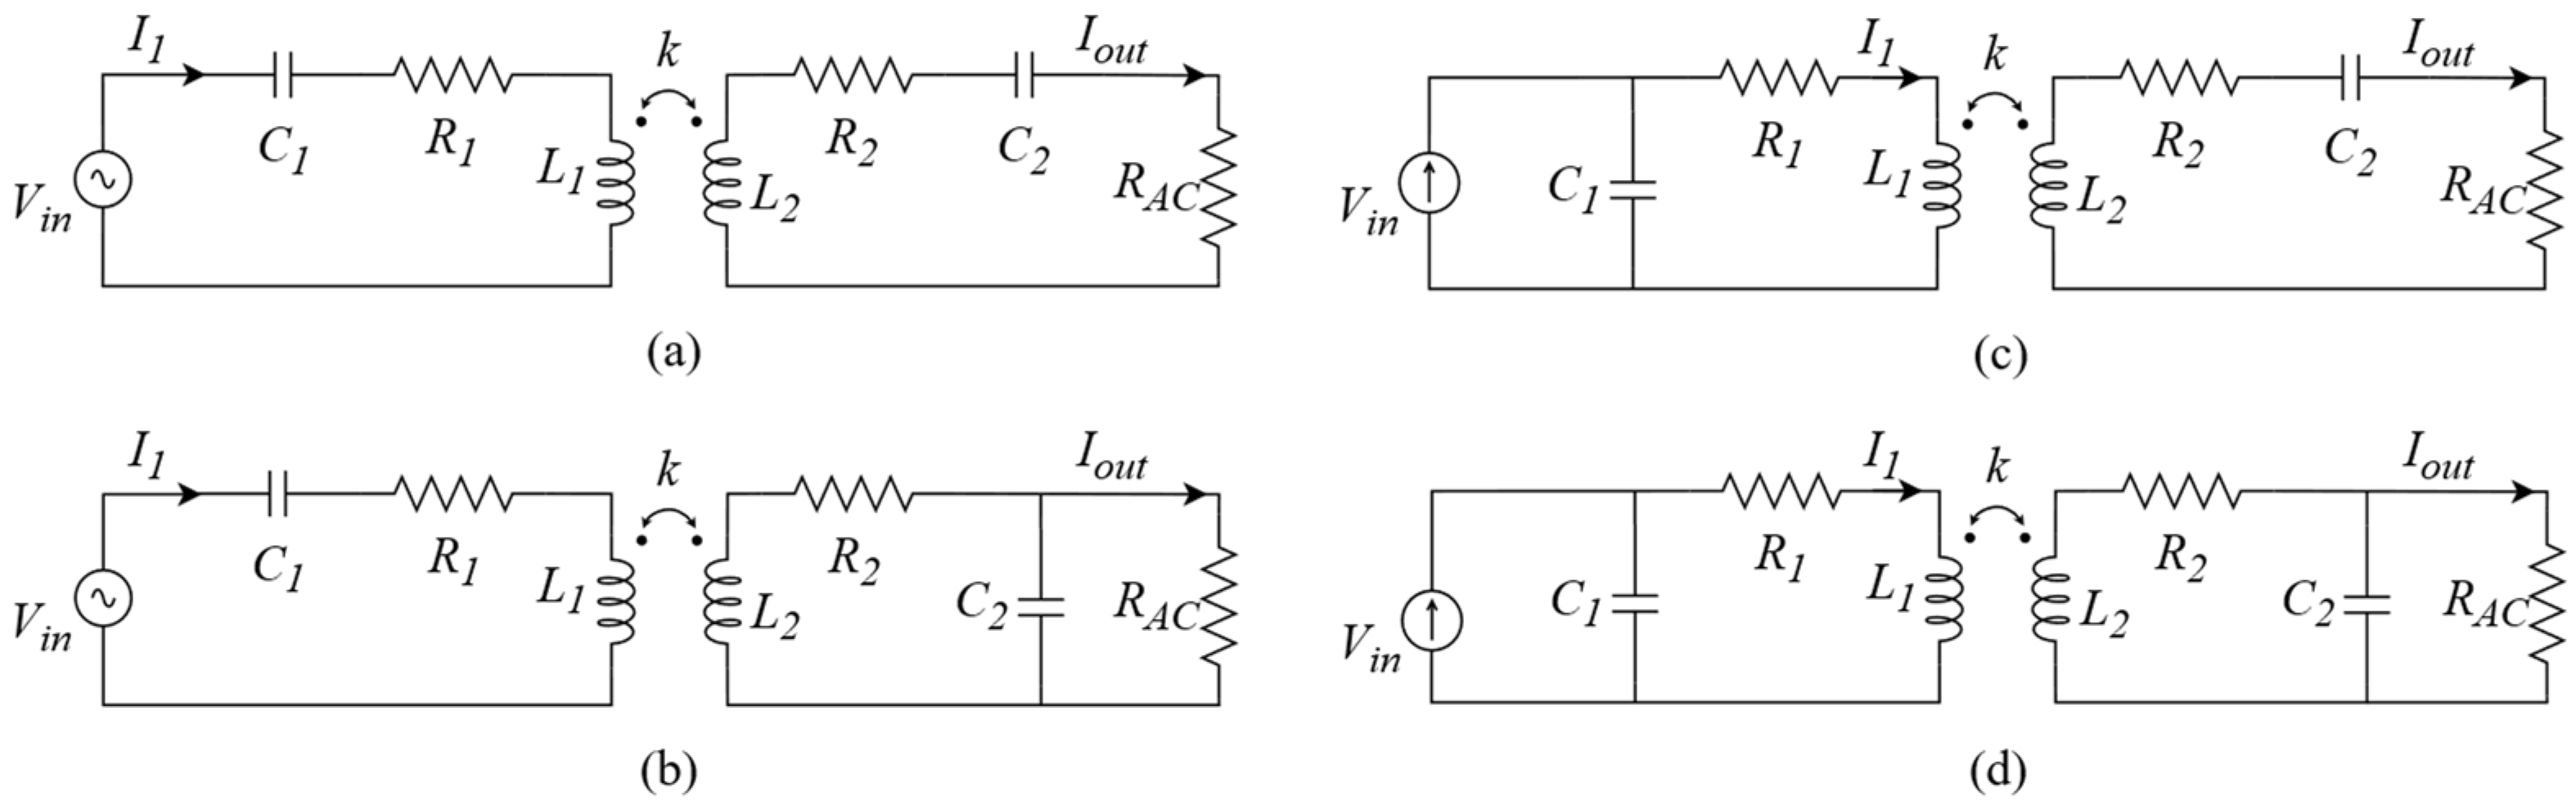
3.1. Topology Selection

Resonant tanks have different topologies depending on the type of compensation used. The most commonly studied topologies are series–series (SS), series–parallel (SP), parallel–series (PS), and parallel–parallel (PP), Figure 2. Some research has also been conducted on hybrid topologies (LCC and LCL) that improve inductive transfer efficiency but add complexity to the model.
Figure 2 shows the equivalent circuits of the SS and SP topologies, including the parasitic resistances of the coils ( R 1 and R 2 ) and the equivalent output resistance ( R A C ). From these circuits considering low coupled coils, it is possible to obtain the approximate capacitance value at which resonance occurs given an inductance (4) [9].
C 1 = 1 ω 2 L 1 C 2 = 1 ω 2 L 2
The SP topology is a suitable option for lower powers and is robust against load variations, as mentioned in references [12,28]. Compared to the SS topology, the SP topology requires less secondary inductance. This makes it particularly useful in applications where the receiver coil’s size needs to be minimized or when a constant voltage transfer ratio is desired without needing feedback control, such as in biomedical applications [18]. Furthermore, it reduces voltage stress on the secondary components and offers better compensation for variations in the coupling coefficient, making it a more reliable choice for systems with fluctuating distances between coils.
SP topology also shows better performance compared to PS and PP topologies, which are more oriented to higher-power applications [12].
As for higher-order compensation topologies such as LCC-LCC, CCL-LC, LC-LC, LCL-LCCL, LCL-LCCL, LCC-S, SP-S, P-PS, and S-SP, analyzed in detail in [12,29], the SP topology still demonstrates favorable characteristics for pacemaker charging applications, particularly given the requirement to operate at low power across wide load ranges.

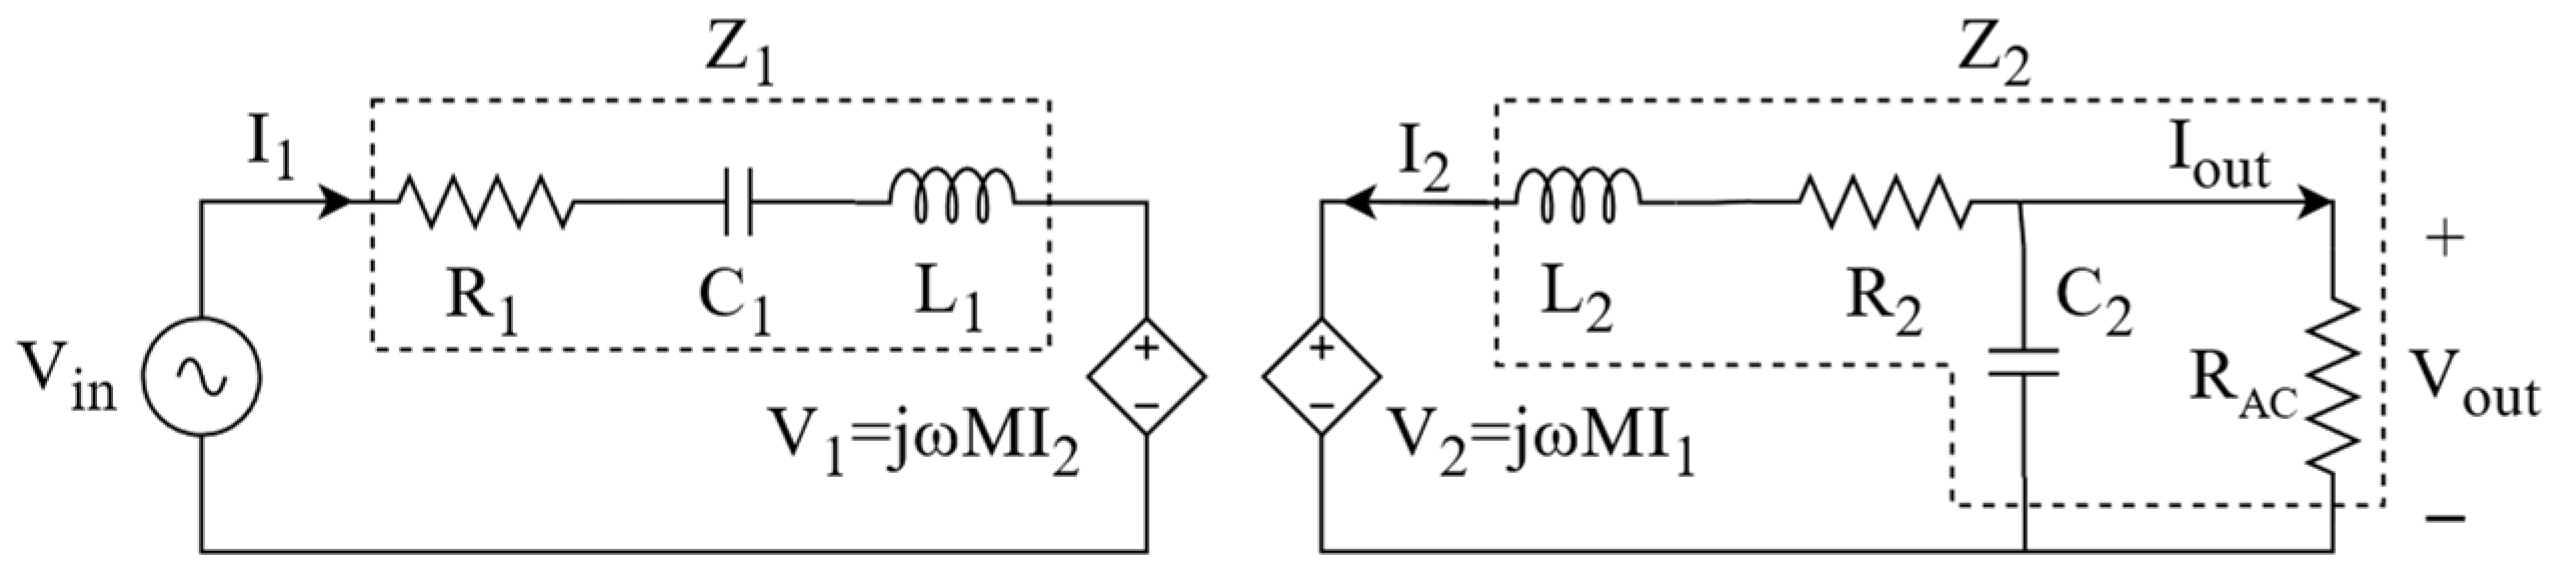
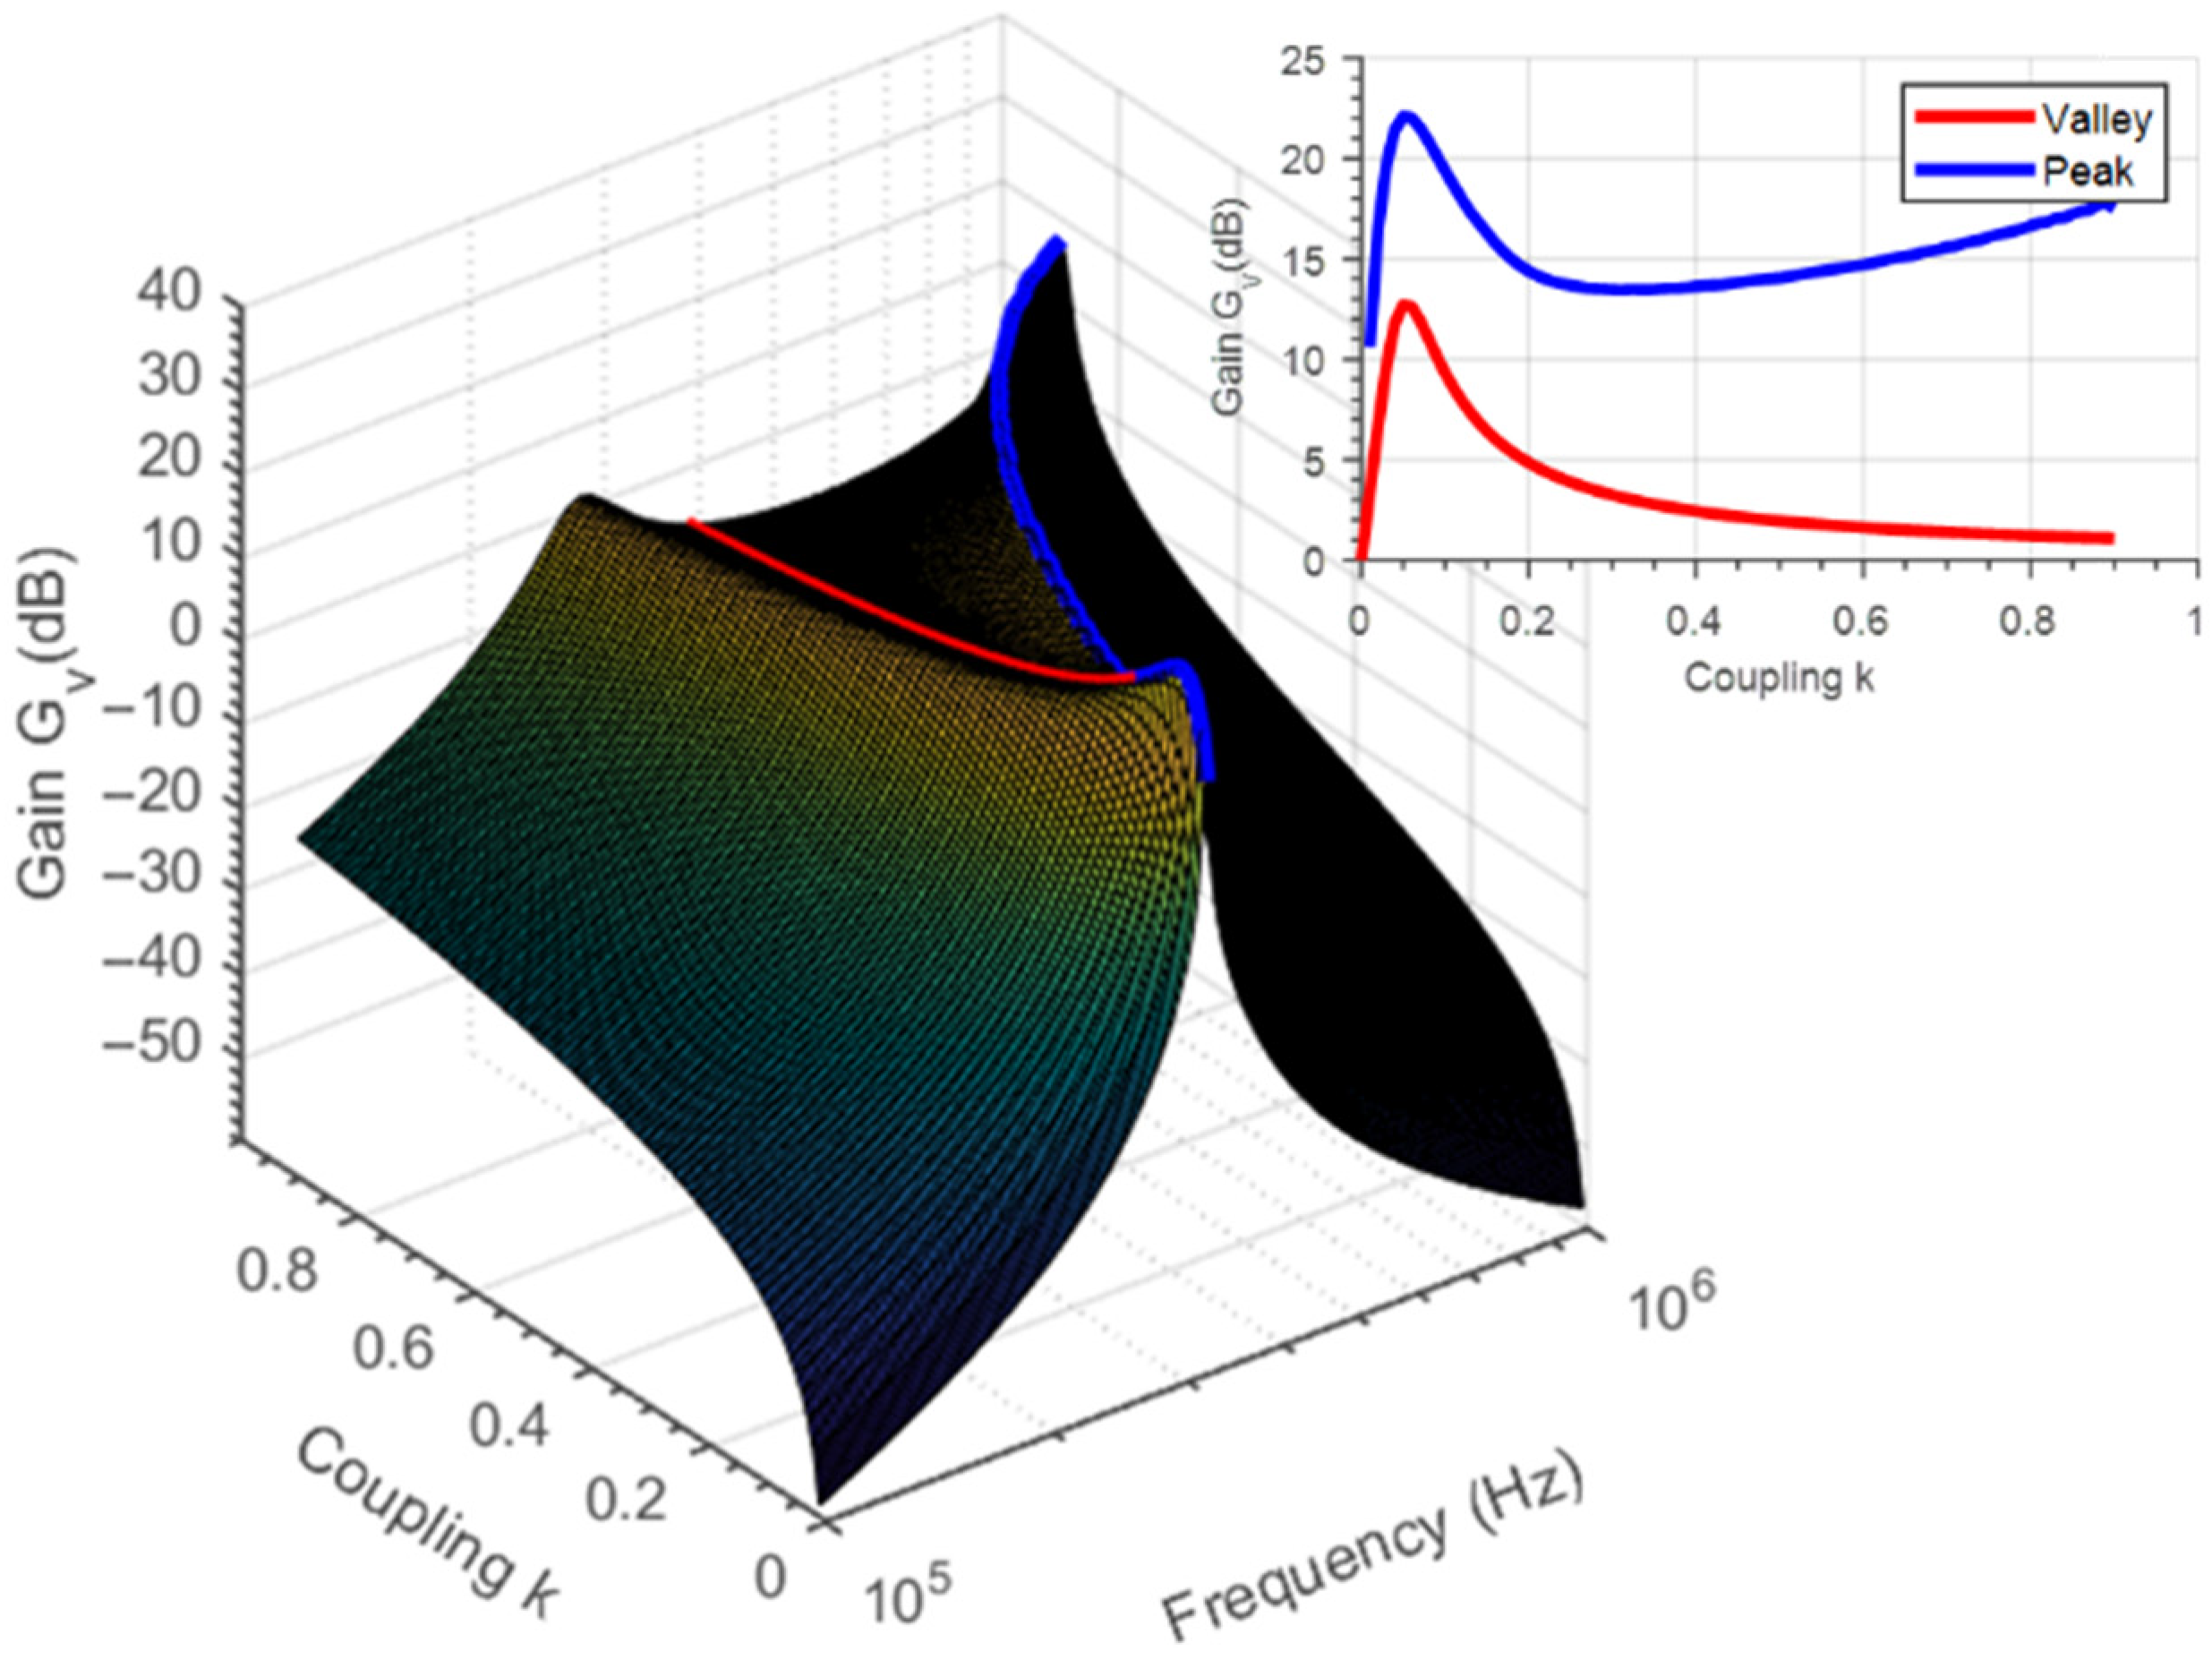
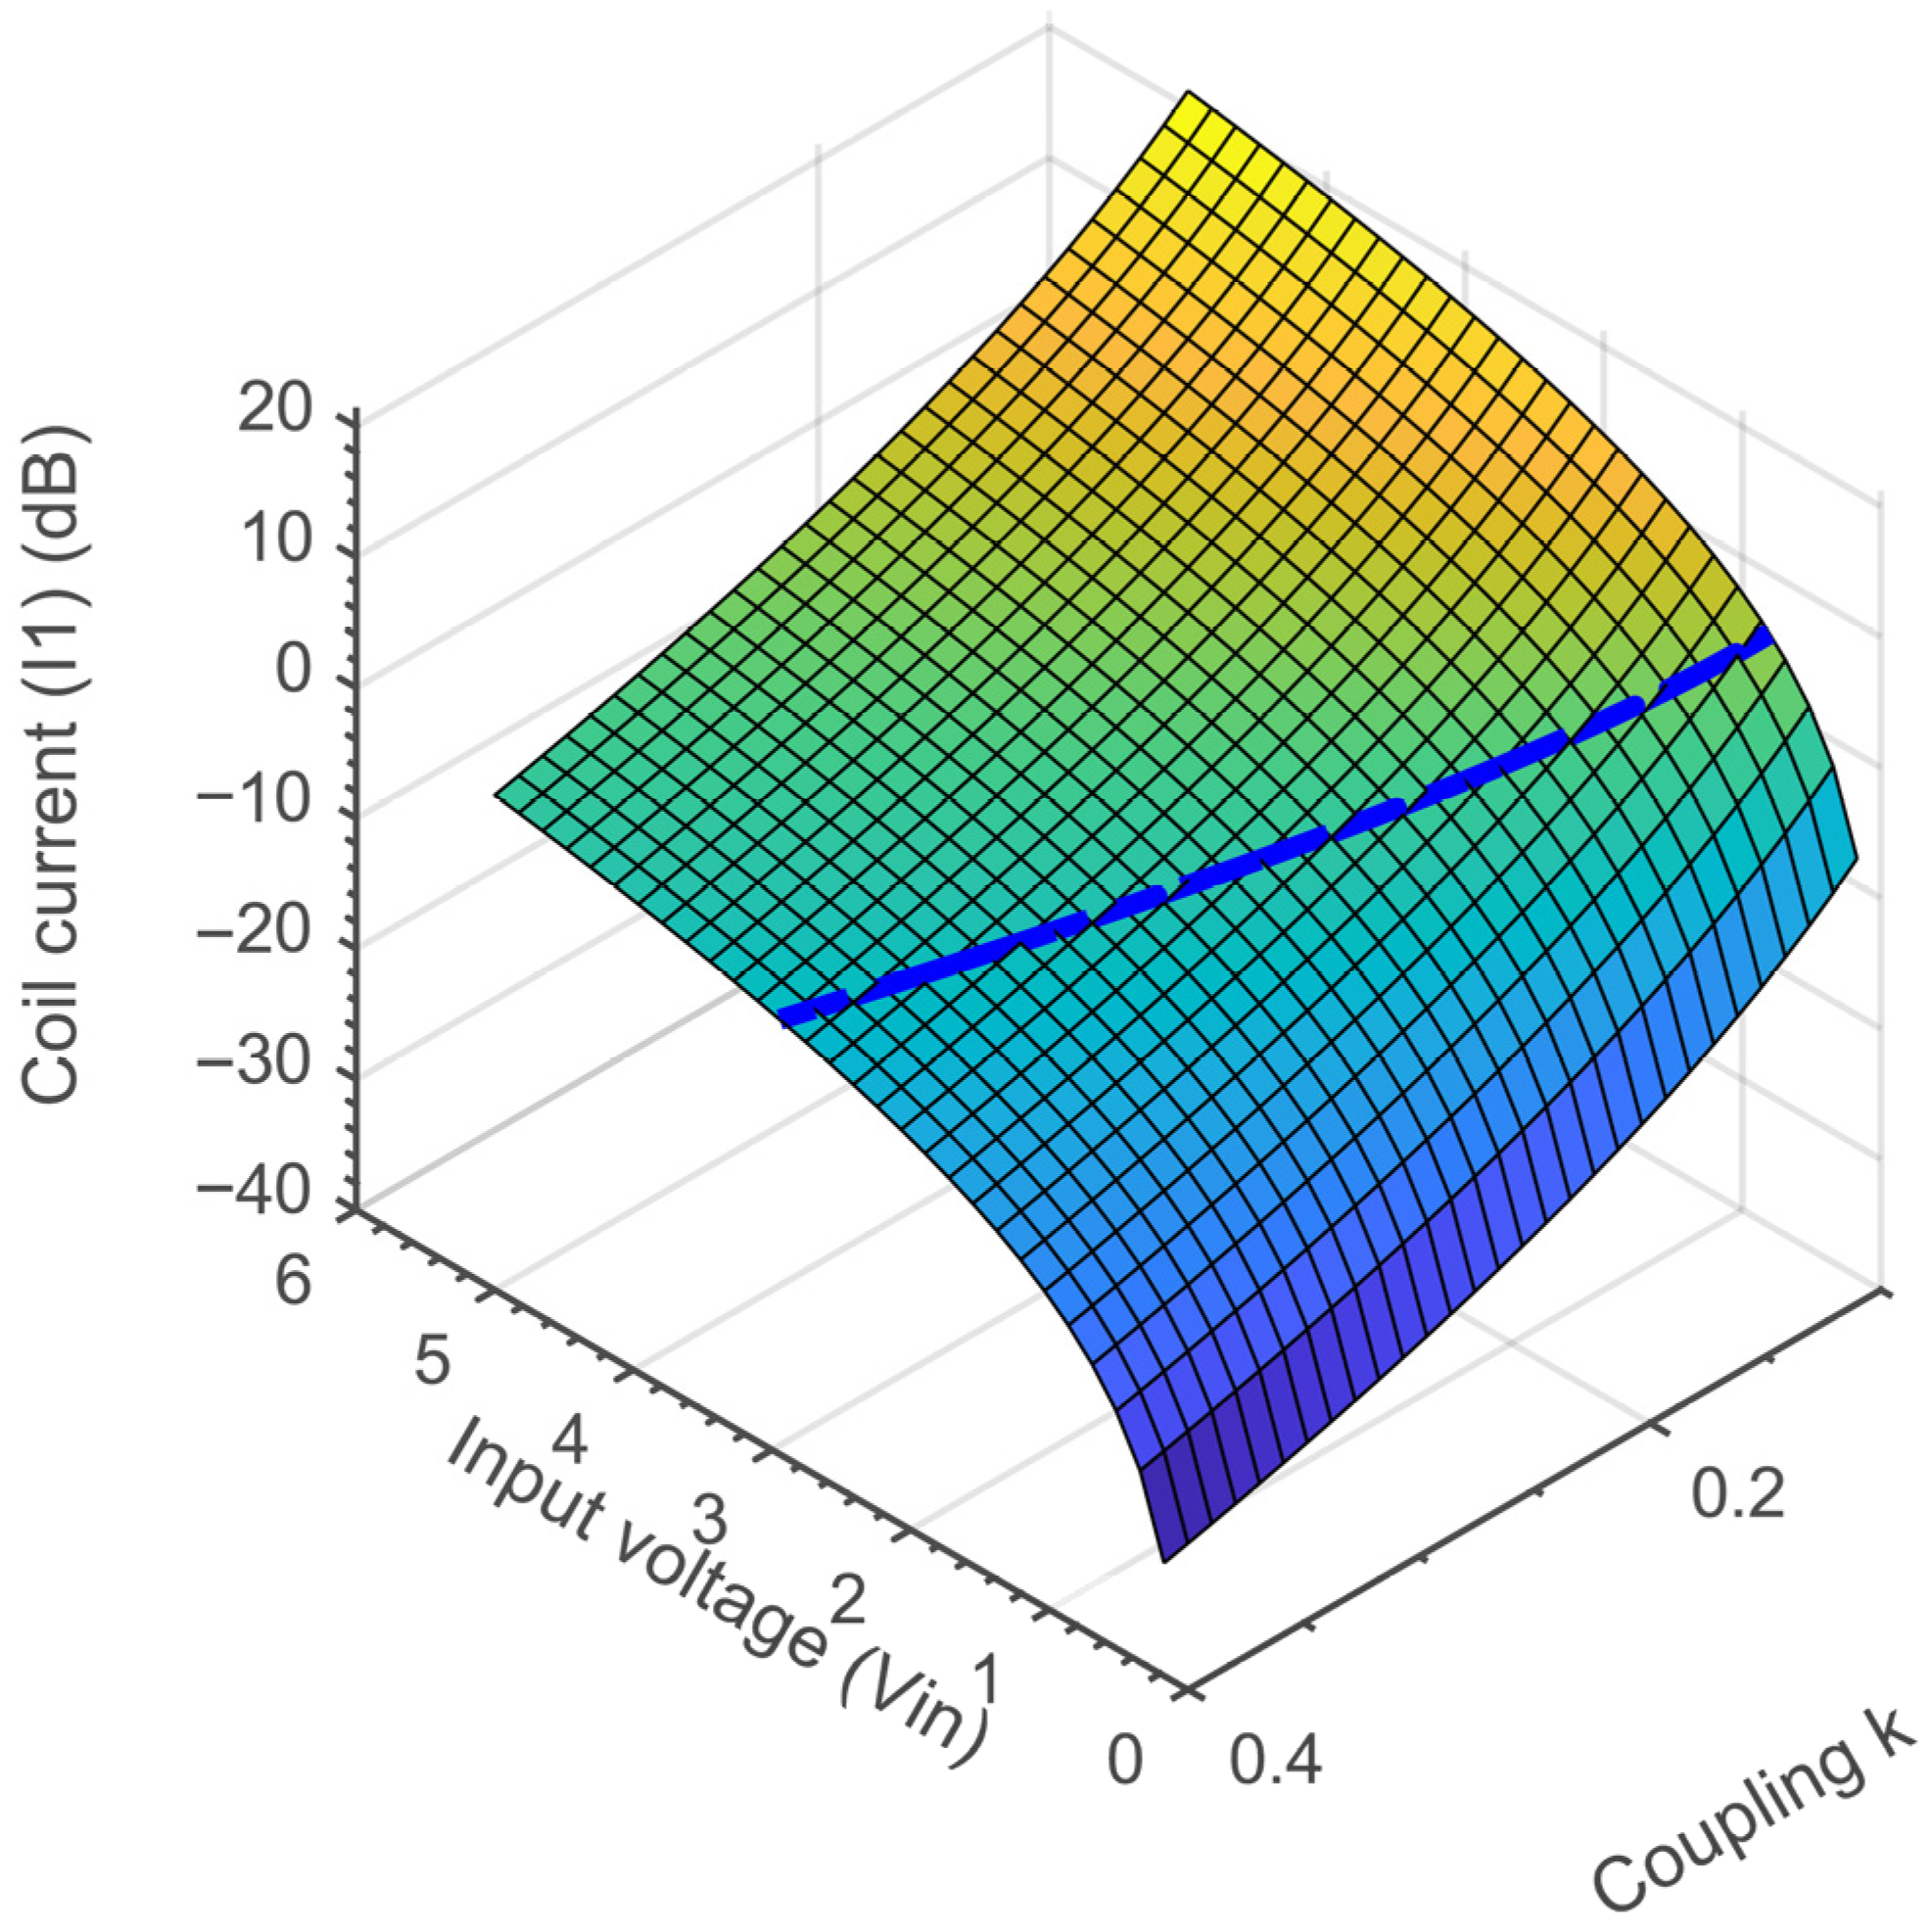
3.2. IPT System Modeling

The input of the IPT system assumes the first harmonic approximation (FHA) condition. This approximation simplifies the analytical process and remains valid at resonance due to the natural filtering of harmonics in the compensation tanks. The M-model, shown in Figure 3, represents the series–parallel circuit. This model includes dependent voltage sources representing the voltages induced in the primary and secondary windings. The input is a sinusoidal voltage, and the output is an equivalent AC resistance R A C .
The equations in Table 1 describing the system are derived from the M-model. In this way, the voltages and currents of the circuit are calculated, which allow for obtaining the transfer function G v = V o u t / V i n .
Figure 4 shows the gain G v as a function of frequency and coupling. The values used are given in Table 2. Two trajectories are identified at variable frequency, where the gains reach their maximum value. This phenomenon is known as frequency splitting or frequency bifurcation. Of the two ridges, the one highlighted in blue exhibits a higher gain, thereby making it a preferable option in terms of gain. In contrast, the region in the valley, highlighted in red, corresponds to the constant resonant frequency defined by Equation (4).
While the gain is lower than that observed in the ridge region, selecting a working point at the valley resonance frequency is more practical in terms of both implementation and control. In this situation, the load dependence decreases significantly, as the tank impedances are almost canceled at the resonant frequency. Therefore, this becomes the preferred frequency operation point.

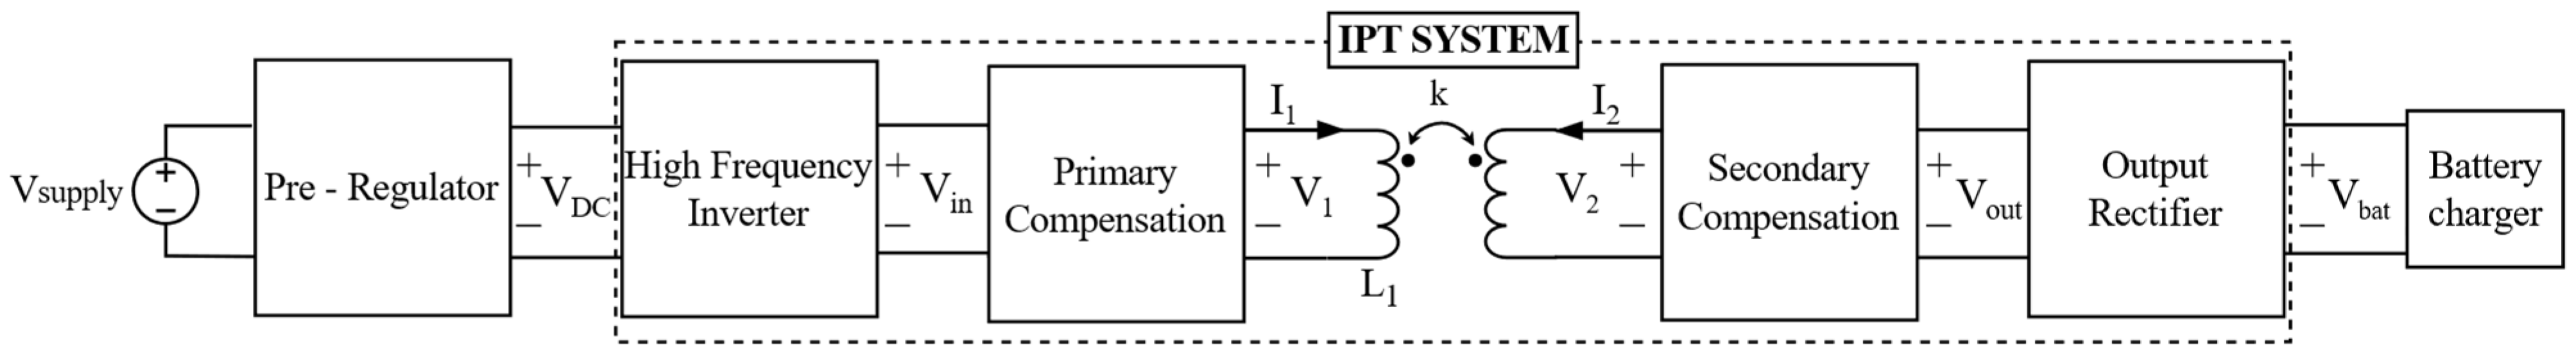
3.3. Complete Power System

The system is completed with the inclusion of conditioning blocks, Figure 5. At the input to the power supply, a step-down converter serves as a pre-regulator, modifying the input voltage ( V D C ) and controlling the output voltage ( V o ). The employed topology is regulated by a reference voltage ( V r e f ) [14].
A class-D half-bridge inverter is specially designed to operate at high frequencies, generating a periodic wave at the resonant frequency for the series–parallel compensation network. The advantage of this choice is that the resonance frequency is not affected by load and coupling variations, avoiding affecting the system’s stability. Therefore, this type of inverter is more robust than the class E inverter.
For modeling the inverter, it is assumed that the resonance tank filters the harmonic components other than the fundamental so that the equivalent sinusoidal voltage amplitude is given by (5).
V i n = 2 π V D C
A full-bridge rectifier with an output LC filter is employed for output voltage conditioning. The equivalent resistance for the M-model of the IPT system, obtained from the power balance between the input and output of the rectifier, is given by Equation (6).
The values of the case study are presented in Table 2, with the value of the ideal components in the resonant tank.
R A C = π 2 8 R o

4. Design of the Control Stage

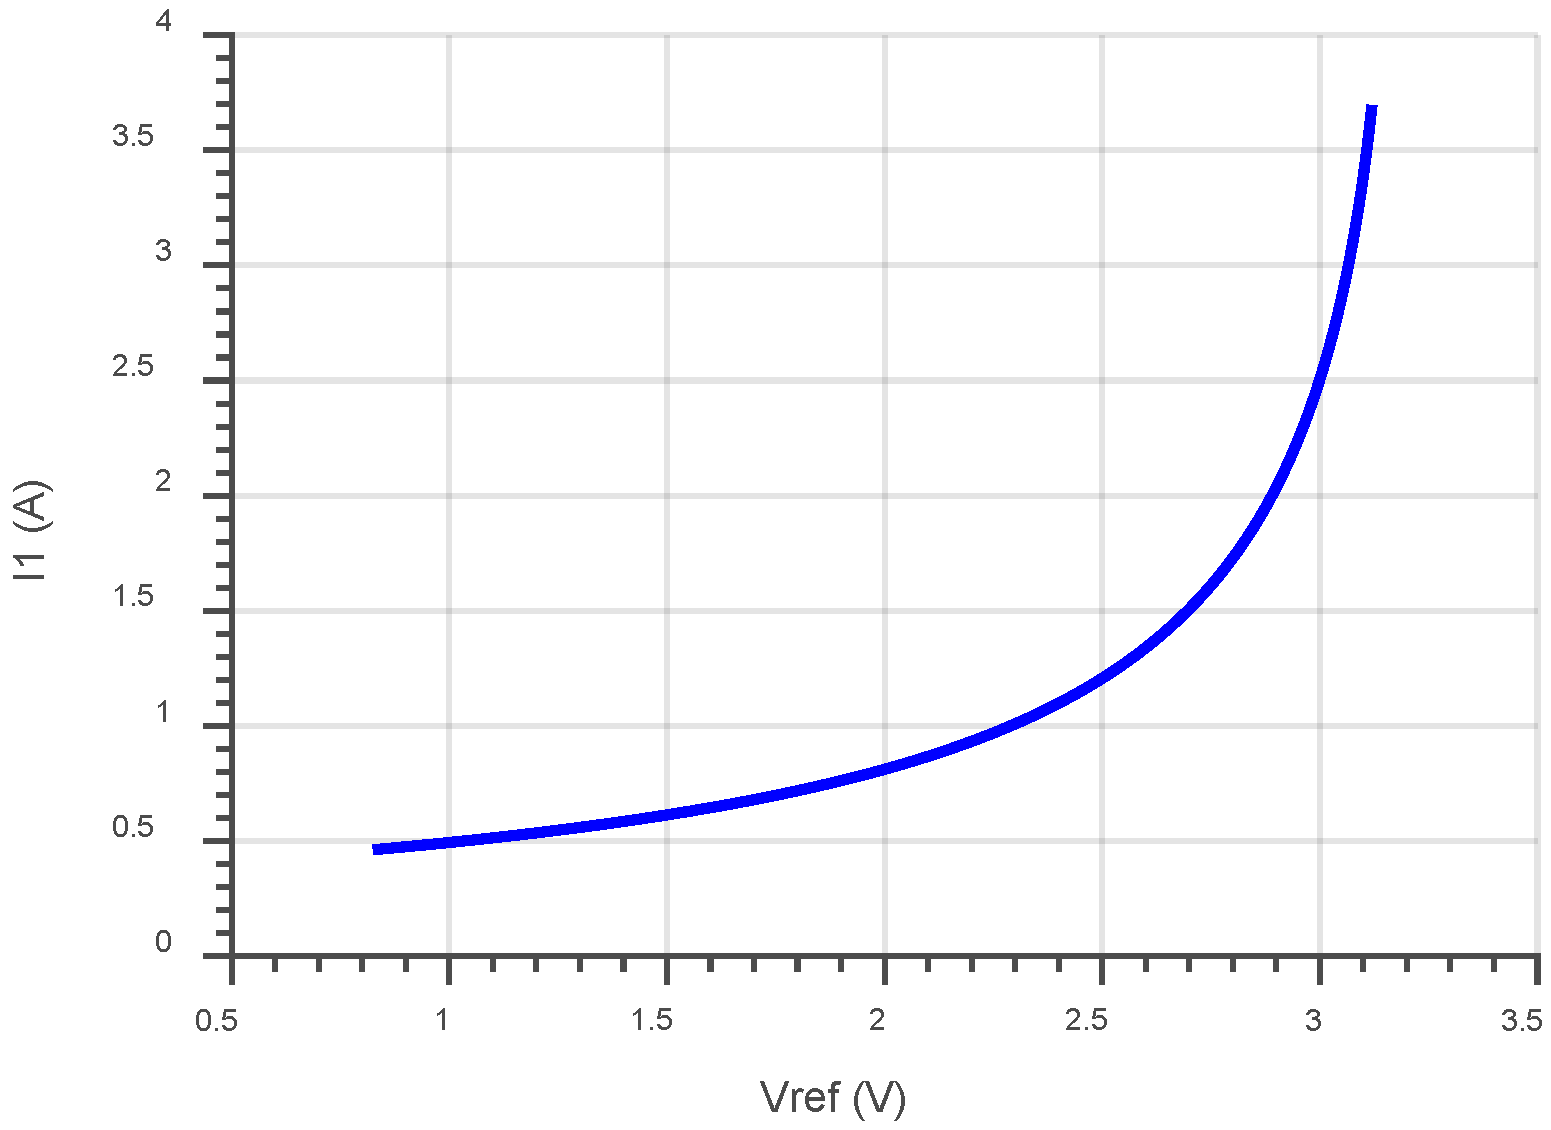
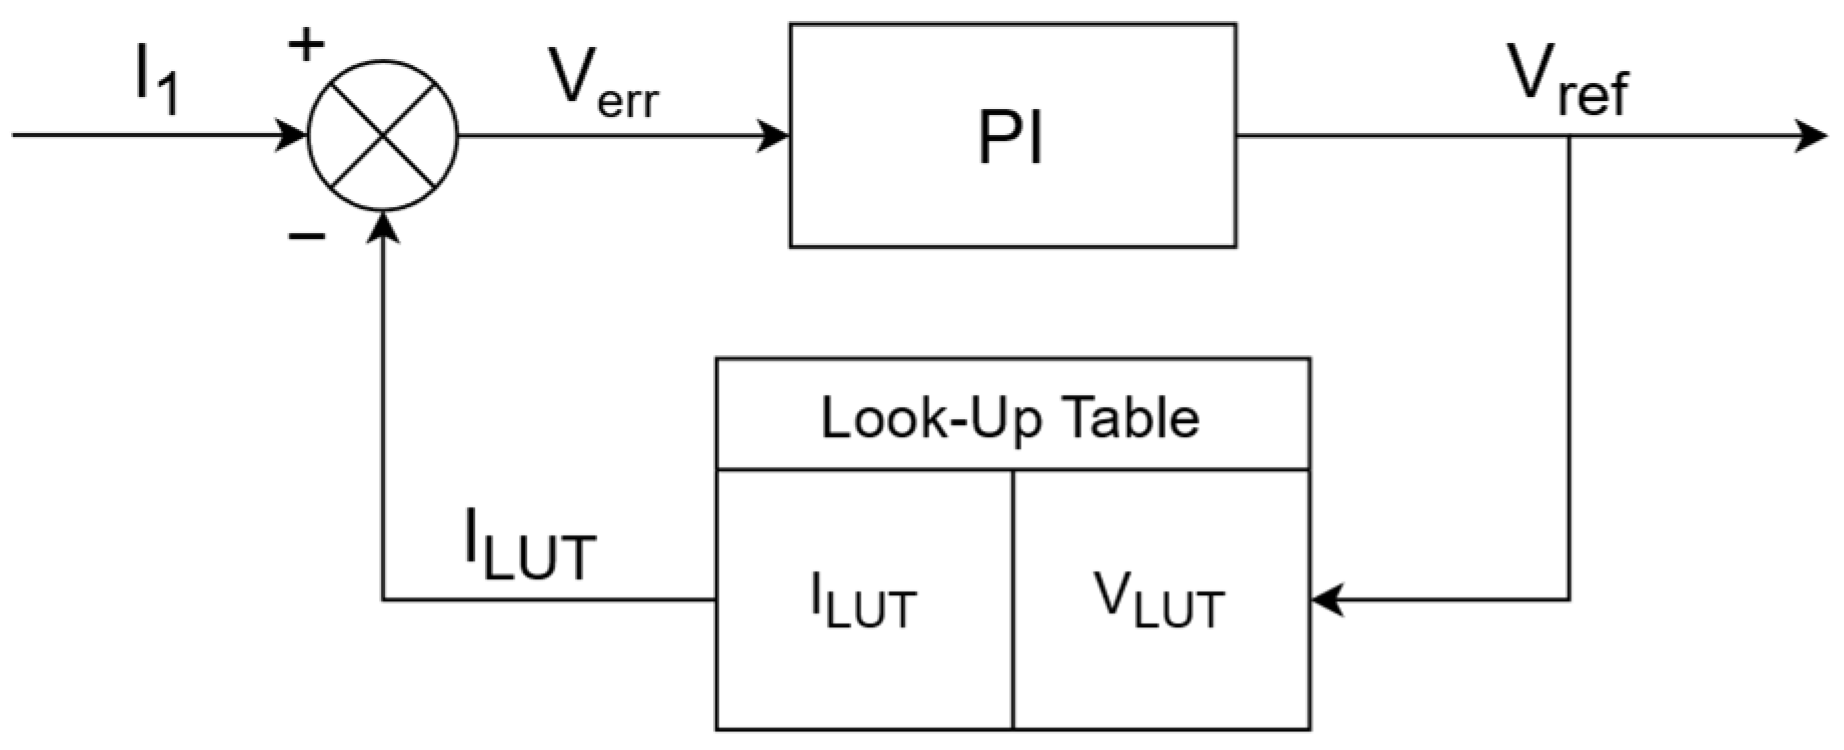
4.1. Control Strategy

In pacemakers, the distance and alignment of the coils, together with the type of tissue, tissue thickness, and respiration of the patient, result in a variation of the coupling factor k, which in turn alters the working point of the system.
Nevertheless, the system can be controlled by modifying primary side variables, including resonance frequency, PWM duty cycle, input voltage ( V i n ), and compensation impedance.
In the proposed control strategy, the frequency is maintained at the resonance value, and the system is regulated through the amplitude of the input voltage ( V i n ). This amplitude can be adjusted using a pre-regulator upstream of the class-D inverter. This adjustment allows the system’s output voltage to be controlled by changing the amplitude of the input waveform.
The proposed regulation method is based on measuring the current amplitude flowing through the primary coil. This current serves as a reference for the operation point, which depends on the coupling factor. This approach permits the regulation of the input voltage of the series–parallel compensation tank, thereby enabling the control of the system output voltage.
In this proposal, it is considered that the battery charger demands a constant current, I o . The input voltage specification for the battery charger is between 3.75 V and 6 V.
This study aims to identify the amplitude of V i n , using the amplitude of I 1 , for regulating the output voltage V o and considering an unknown coupling factor k . To achieve this, it is first necessary to establish the relationship between the current through R o , output current ( I o ), and the secondary current ( I 2 ). Subsequently, the secondary current ( I 2 ) can be related to the input voltage amplitude ( V i n ) through the equations presented in Table 1.
As shown below, once V i n is obtained as a function of the output current ( I o ), the current through the primary coil ( I 1 ) can be related to V i n (see Table 1). This allows the building of the look-up table (LUT).
Initially, an analysis of the power balance is conducted before C 2 and after the diode rectifier. The development of the equivalence results in the rectified output are twice the frequency of the input. When this is taken into account and incorporated into the system variables, the resulting equation is (7). Here, φ represents the load phase composed by the parallel of the capacitor C 2 and R A C .
P 2 = P o V o u t · I 2 2 · cos φ = V o · I o
The mean value of the rectified sine V o u t after the low-pass filter corresponds to the voltage value at the output V o (8).
V o = 2 π V o u t
The expression (9) is derived from (7) and (8), which establishes the relationship between the current amplitude in the secondary coil I 2 and the output I o .
I 2 = 4 π · c o s ( φ ) I o
Equation (10) is obtained from Table 1. Using Equation (9) in Equation (10), the values of V i n as a function of the current I o required at the output can be calculated, as noticed in (11). However, there are different values of V i n depending on each coupling value for the same I o .
V i n = I 2 · Z 1 Z 2 + ω k L 1 L 2 2 j ω k L 1 L 2
V i n = 4 π · c o s ( φ ) I o · Z 1 Z 2 + ω k L 1 L 2 2 j ω k L 1 L 2
The main objective of the control system is to utilize the measurement of the amplitude of the primary coil current ( I 1 ) as a reference to facilitate the adjustment of V i n by using the Equation (12) obtained from Table 1. Combining (11) and (12), Equation (13) is obtained, which relates the current I 1 with the coupling factor ( k ) for each I o . These two vectors collectively constitute the LUT.
I 1 = V i n · Z 2 Z 1 Z 2 + ω k L 1 L 2 2
k = 4 π · c o s ( φ ) · I o I 1 · Z 2 j ω L 1 L 2
Then, the procedure consists of measuring the primary coil current ( I 1 ) from (13) to calculate the coupling factor ( k ) and the known I o from (12) to calculate the V i n needed to obtain I 1 .
Figure 6 depicts the complete set of potential operation points for I 1 as a function of V i n and k . The blue curve represents the subspace of solutions for I 1 , as defined by Equation (12), plotted as a function of k and the vector V i n , constrained to the operation point specified by Equations (6) and (9), with I o = 100 mA. This provides a graphical representation of the LUT.
In order to provide the V i n values of the LUT, a step-down DC–DC converter is employed as a pre-regulator. This converter provides an output voltage V D C as a function of a reference voltage V r e f , utilizing a voltage loop feedback methodology analogous to that described in [14].
The relationship between V i n and the V D C is shown in Equation (5). Therefore, V D C changes by modifying V r e f , and by changing V D C , V i n is controlled. So, the relationship between V r e f and the I 1 can be established, as shown in Figure 7.
These transformations can be implemented in a final LUT, denoted as [ V L U T ,   I L U T ], the control of which is depicted in Figure 8.
The input to the LUT is V r e f , which generates a value of I L U T . This value of I L U T is compared with the current amplitude measurement I 1 . The error between I 1 and the LUT output I L U T causes V r e f to change successively, searching for the operation point. This process continues until it converges to the value of V r e f that provides the current I 1 of the operation point, with which a zero error between I L U T and I 1 is achieved. This allows for the regulation of the system’s output current.
It is important to note that LUT-based control, in a first approximation, does not compensate for the effects of aging, distortions, tolerances, or factors that may modify the pre-calculated table over time. Considering these effects would entail the use of a more complex LUT and additional identification algorithms.
Although the use of the LUT is justified by the rapid response and simplicity of implementation, in the case of requiring a complex multivariable LUT, it would be necessary to consider the use of other alternative methods of data storage or data generation that are initially more complex and based on a data-driven approach, machine learning, etc.

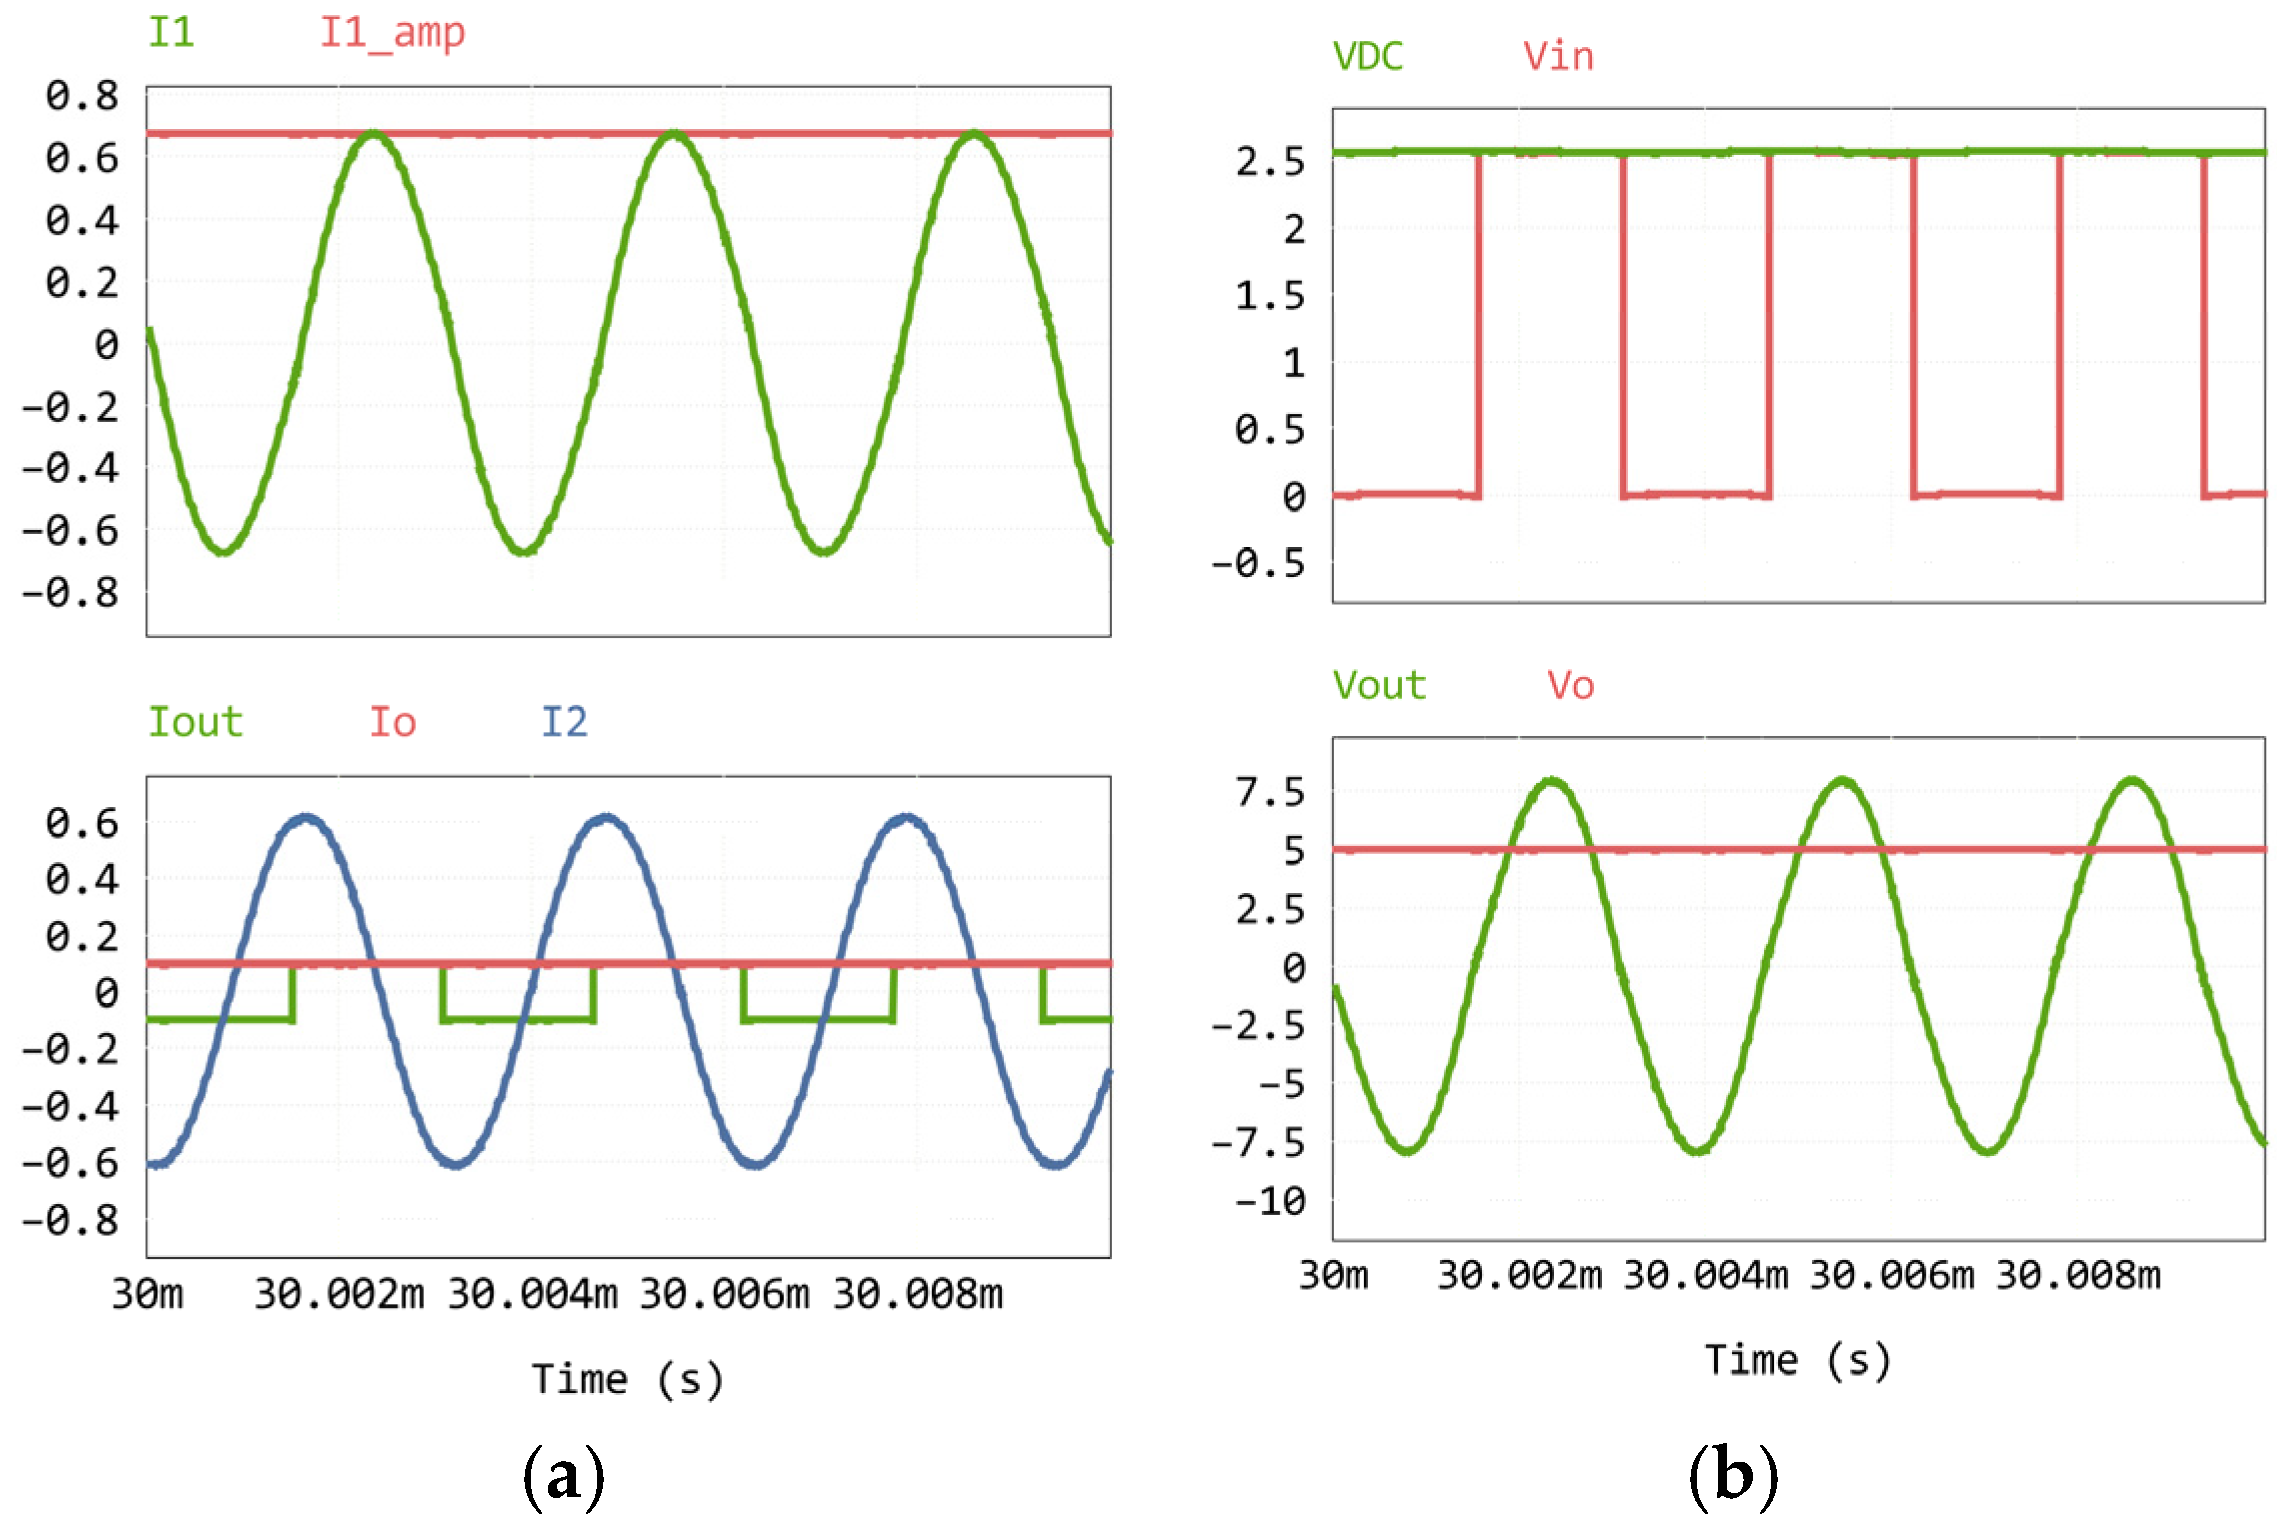
4.2. Simulation Results

The control strategy was validated through simulation in PSIM, utilizing the values presented in Table 2. The results are illustrated in Figure 9.
Figure 9a illustrates that the series–parallel tank operates at resonance, as shown in I 1 . The amplitude of I 1 is measured with a peak detector ( I 1 _ a m p ) and serves as the magnitude that is compared in the look-up table (LUT). The parallel tank output current I o u t is rectified and appears regulated at I o = 100   m A for a load R o = 50 Ω. I 2 is also sinusoidal at resonance. Figure 9b illustrates that the amplitude of V i n is V D C of the preregulator. V o u t is a sine wave with some harmonic content. The voltage at the load V o is a constant 5 V.
Figure 10 illustrates the impact of varying coupling values ( k ) within the range of 0.15 to 0.45. The reference voltage ( V r e f ) and, consequently, the input voltage ( V i n ) undergo a linear change in accordance with the coupling. By varying the reference voltage with the coupling, the amplitude of the current I 1 is modified to the value indicated in the look-up table (LUT) for that coupling.
The objective of maintaining a constant current ( I o ) of 100 mA with a maximum error of 0.61% has therefore been achieved. Furthermore, the model was tested with a ±20% variation in the output load, resulting in a rectifier current regulated between 90 and 110 mA, representing a ±10% variation. This yields an output voltage between 4.4 V and 5.4 V, which is within the range of the battery charger.

5. Experimental Verification

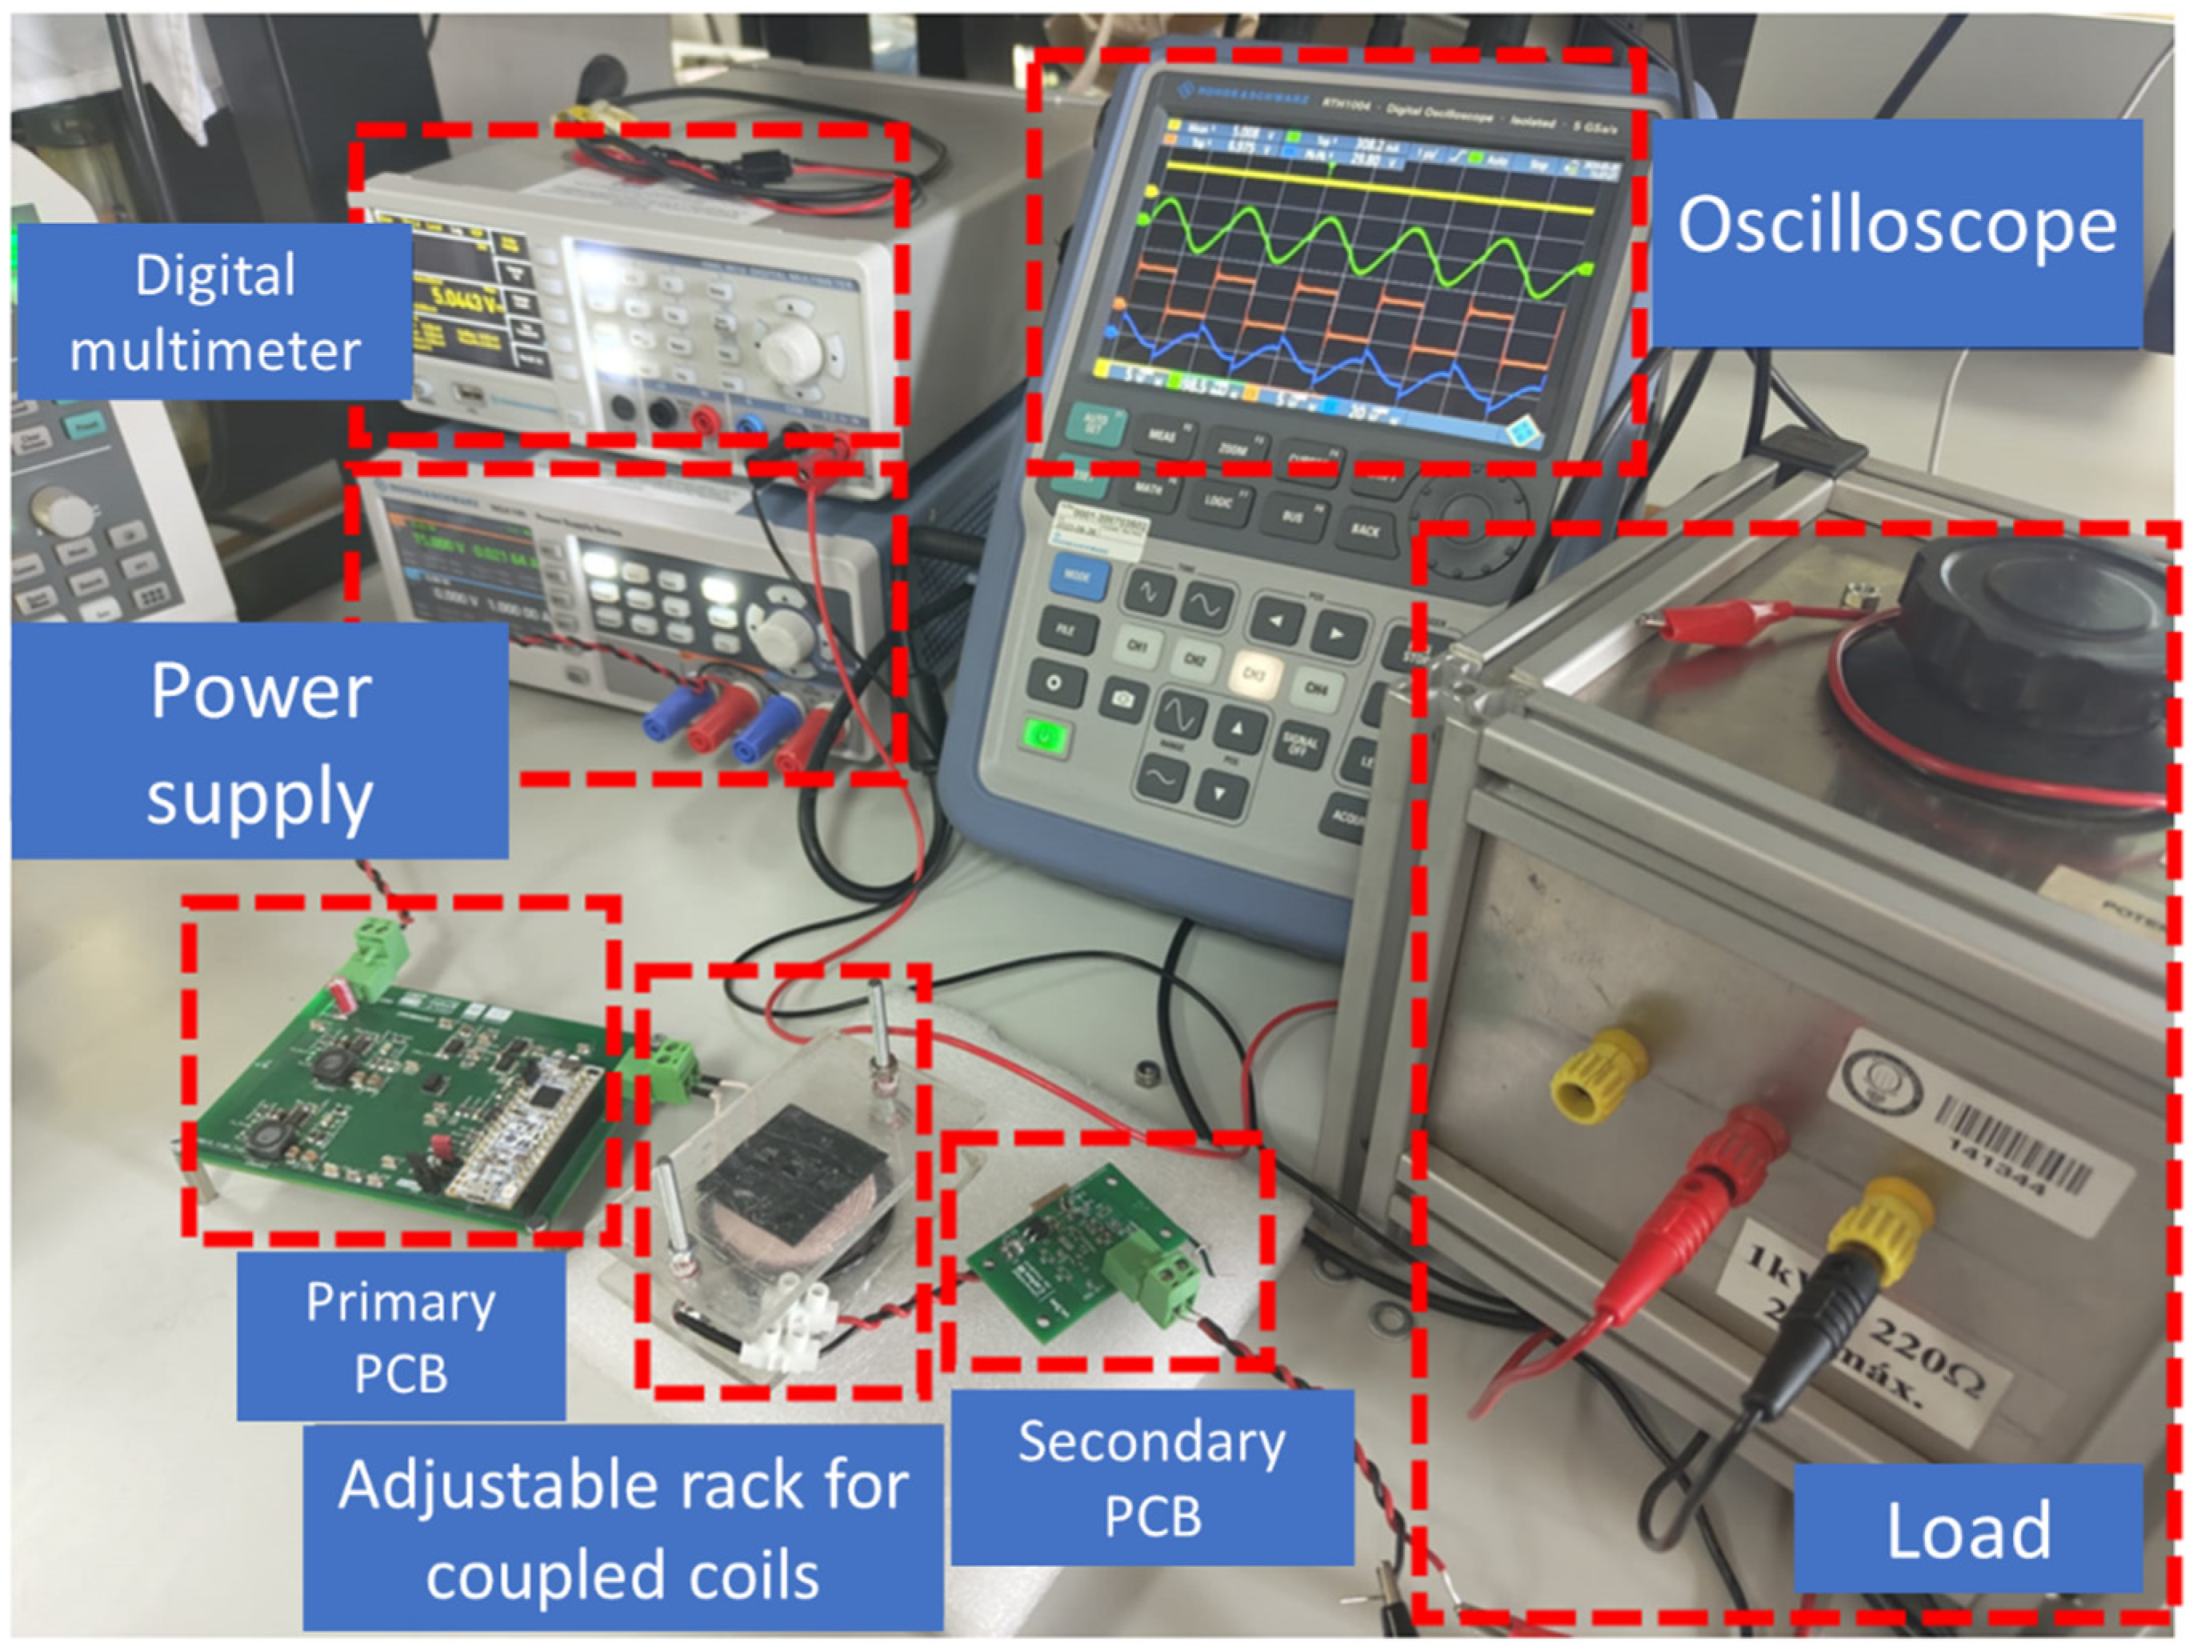
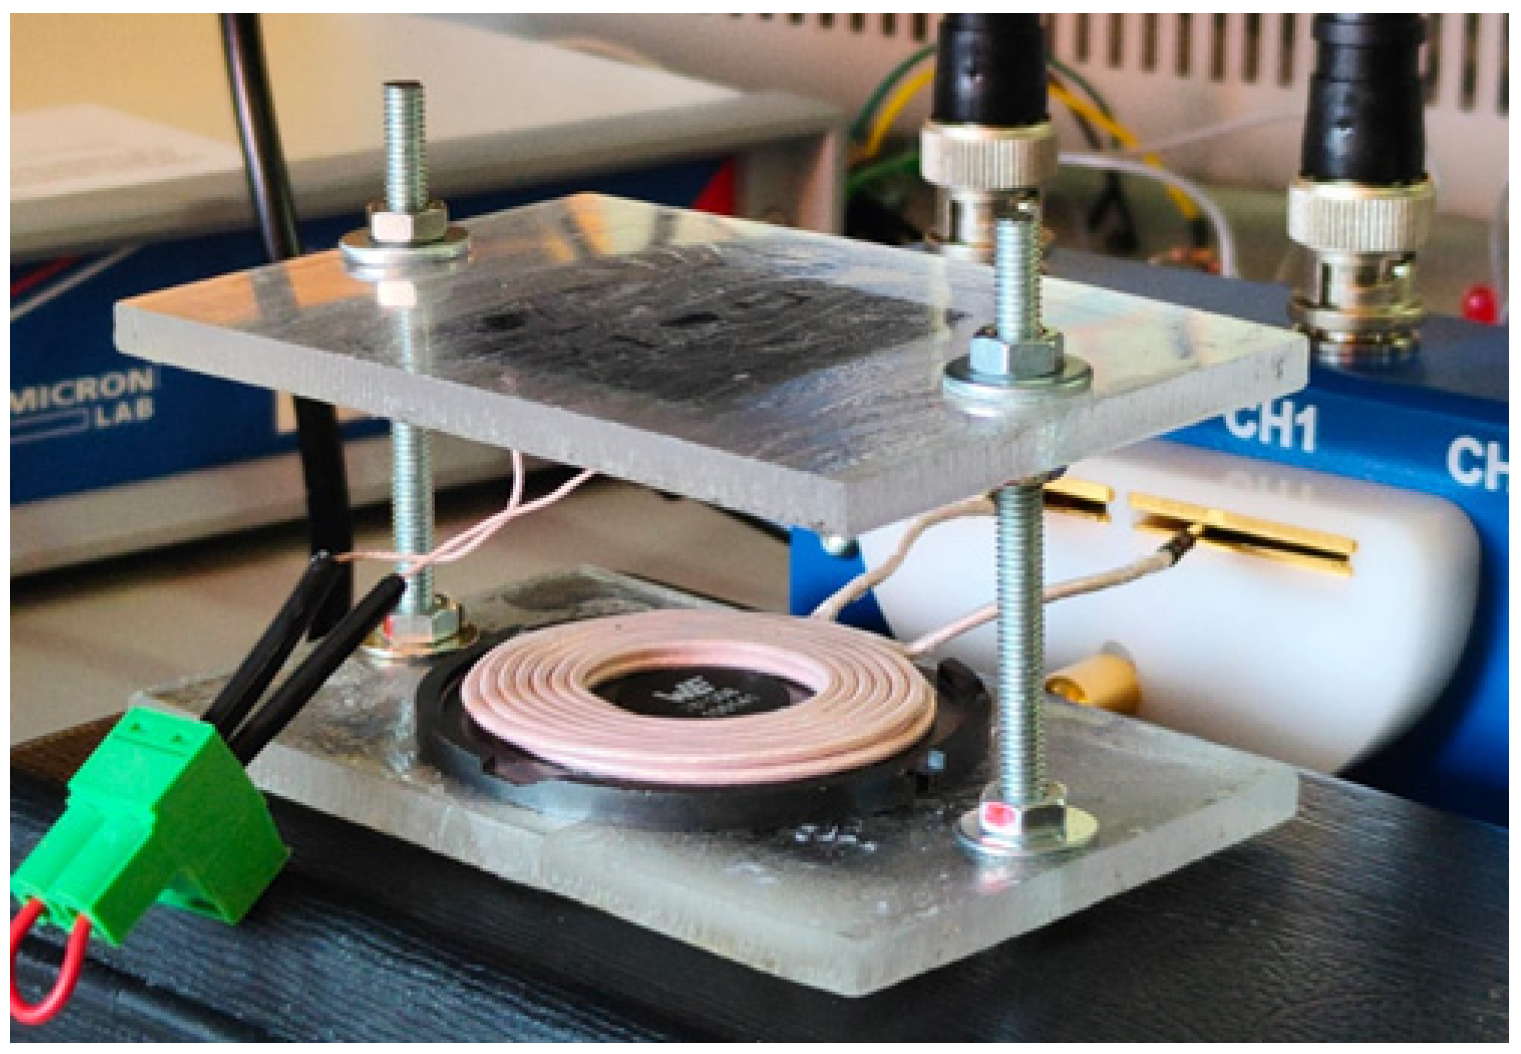
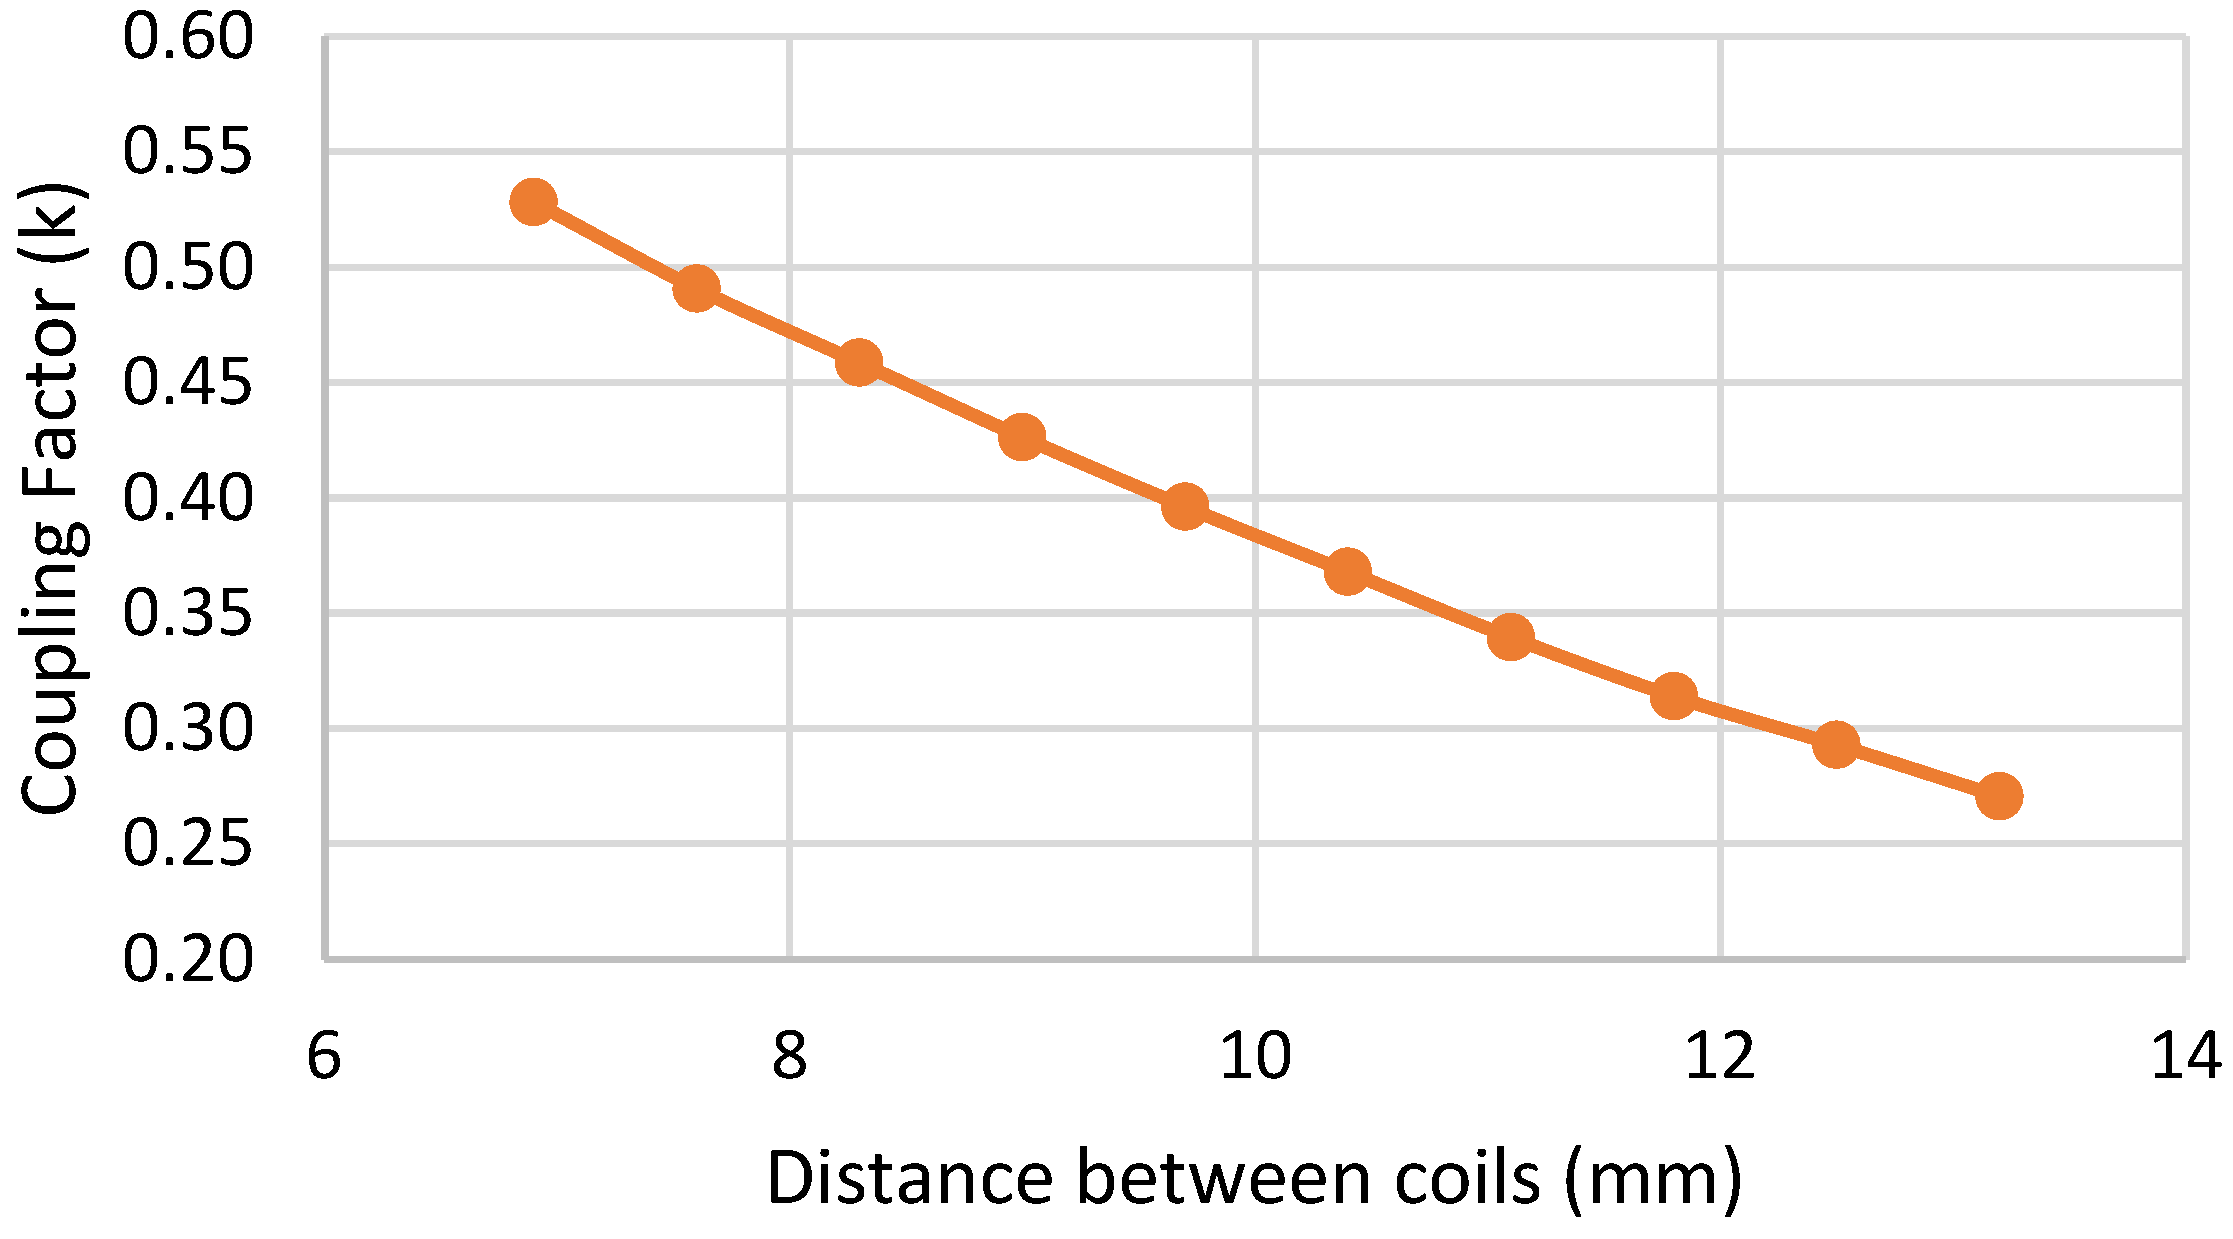
5.1. WPT Charger Setup

The experimental setup is illustrated in Figure 11. It comprises a closed-loop system incorporating an isolated-mass oscilloscope, voltage and current probes, a digital multimeter, a power supply, and a rheostat as the load. The setup simulates conditions with a 1 cm separation between coils, and the resulting waveforms are displayed on an oscilloscope.
In order to validate the control strategy, it is first necessary to empirically determine the range of coupling coefficients. The coupling factor depends on several factors, including distance, coil geometry, intermediate material, and angle. However, in the context of these tests, where coil geometry, intermediate material, and angle are constant, the coupling factor is only dependent on the distance between the coils, thus enabling the determination of the operational coupling range. A test bench was constructed to perform these measurements and maintain proper alignment between the coils, as illustrated in Figure 12. The experimental measurement of the k coupling factor was made using the BODE 100 impedance analyzer.
The results presented in Figure 13 indicate that the coupling range required for this study, which spans from 0.27 to 0.5, corresponds to an approximate distance range of 7 mm to 13 mm. This result is consistent with the pacemaker coupling values and the distance between the coils under the skin, which range from 8 mm to 12 mm, with a mean distance of 10 mm [19,27].

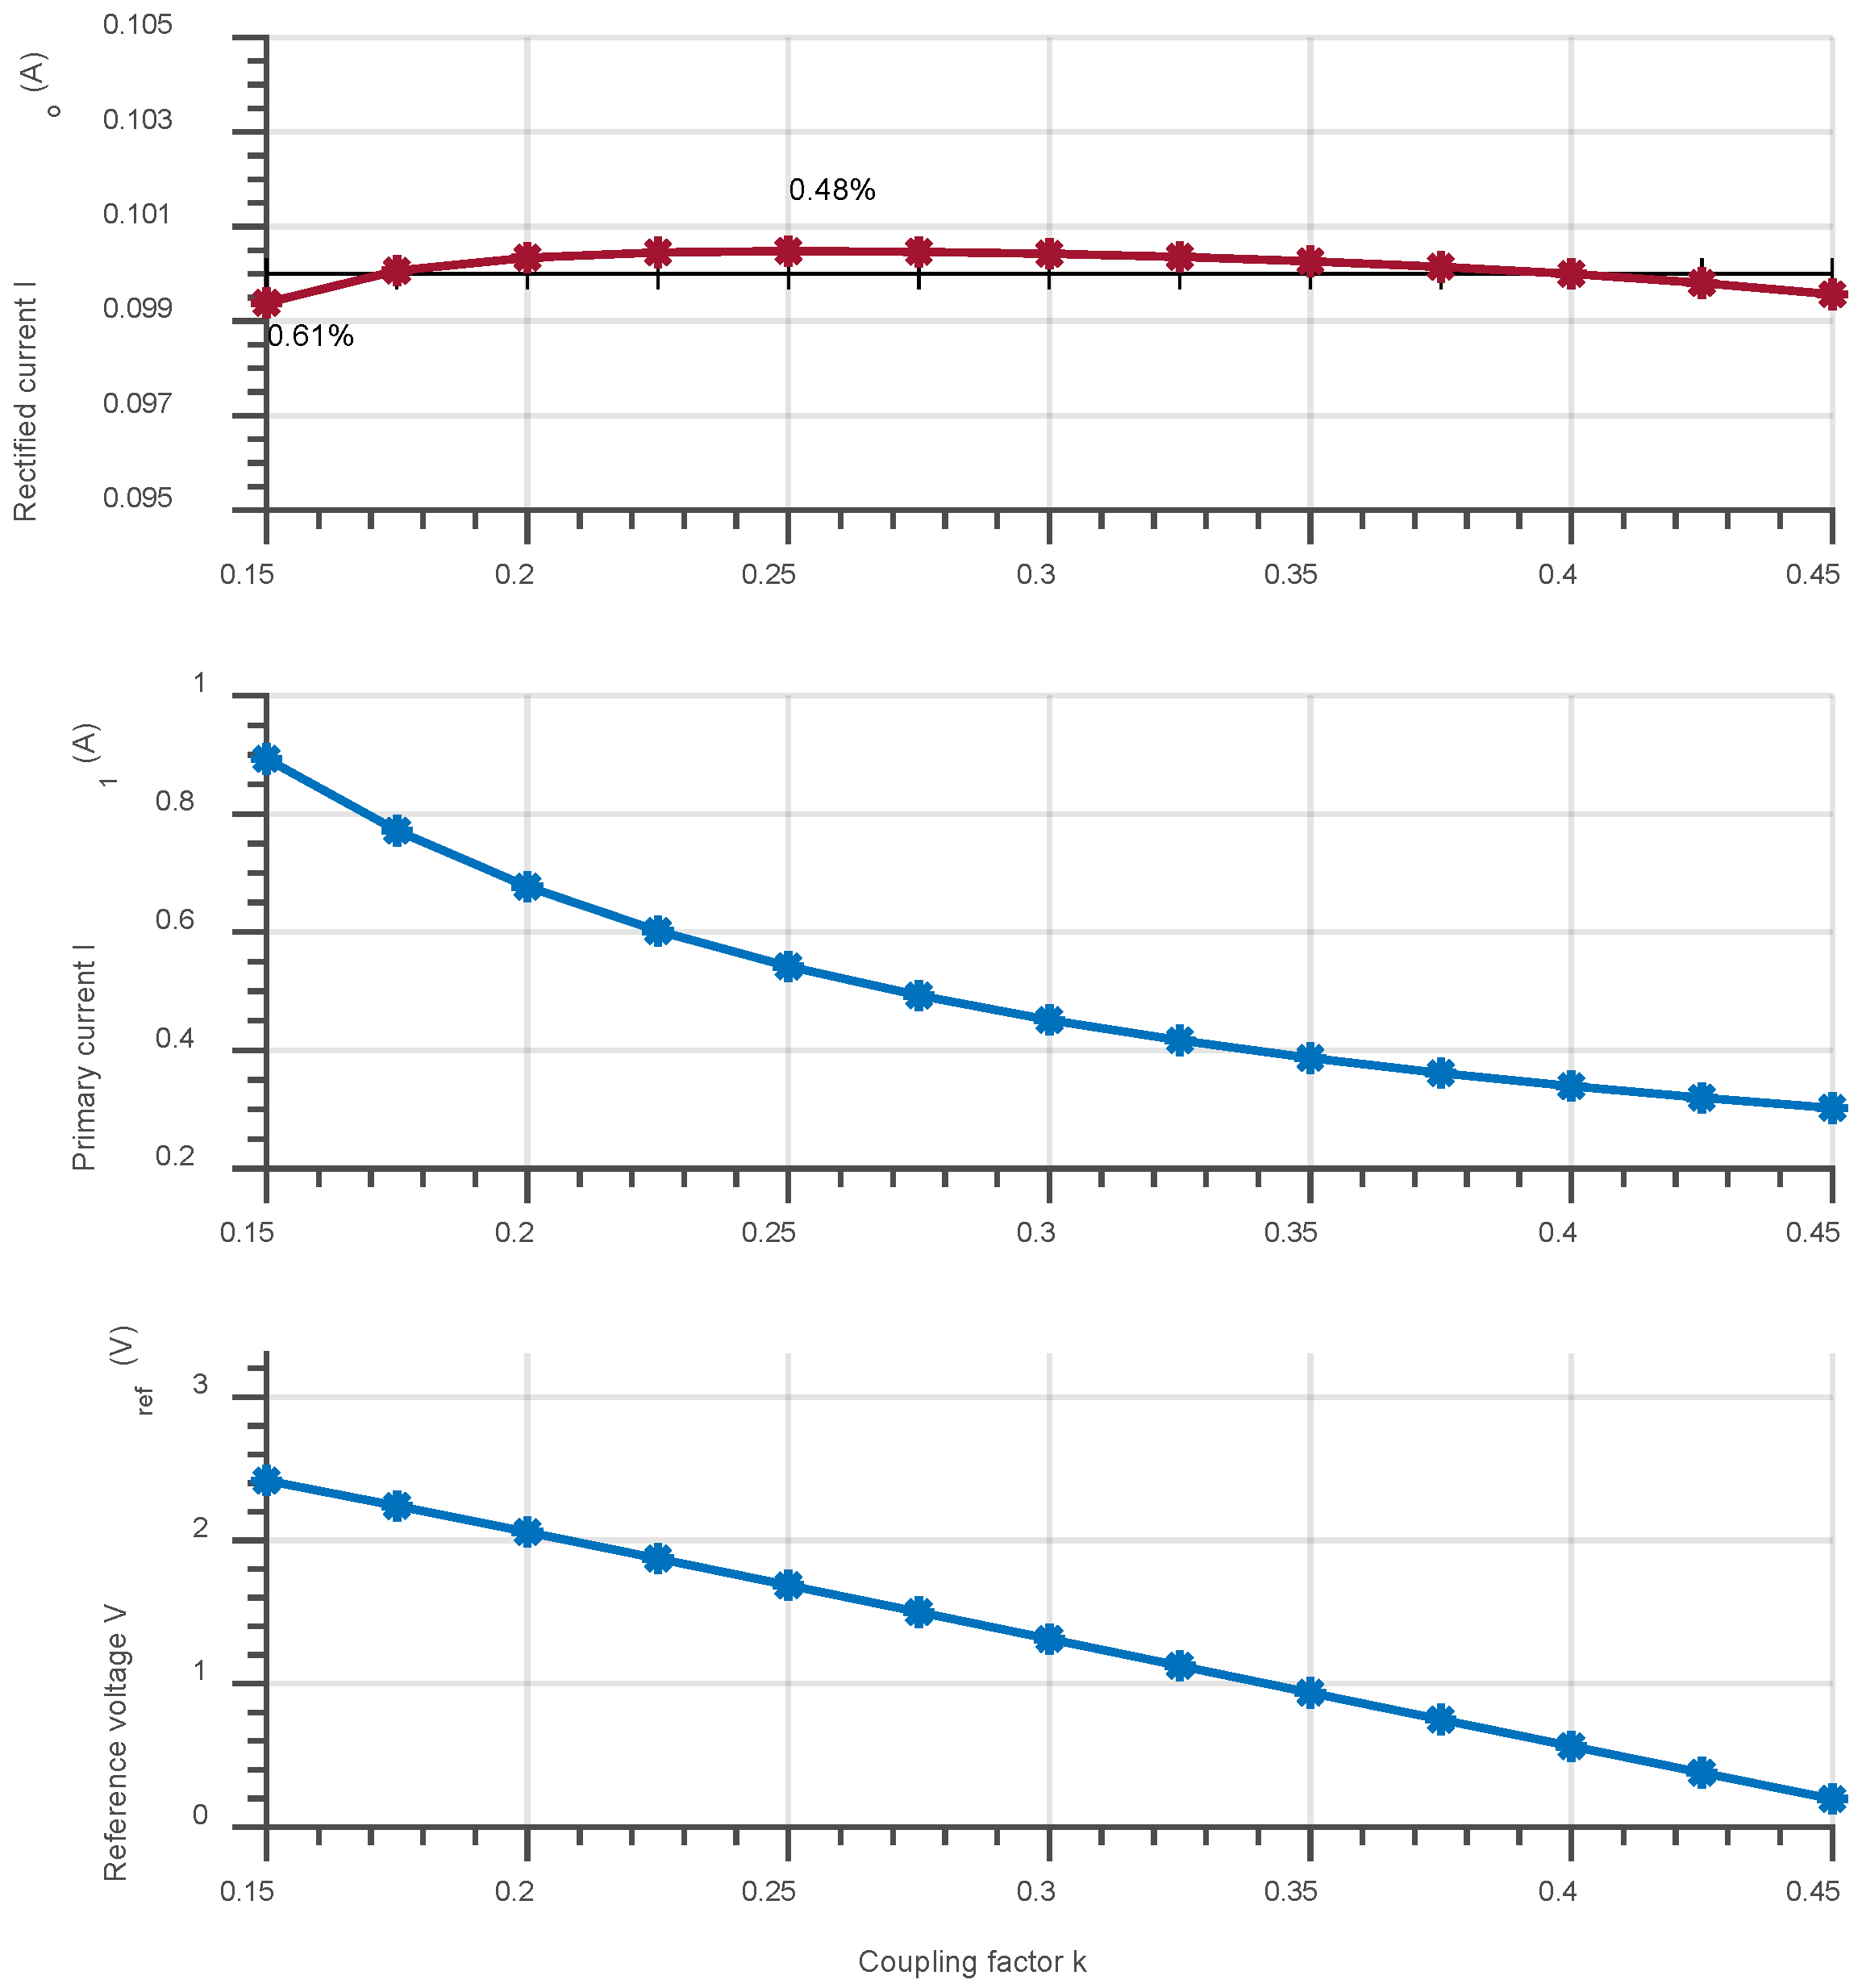
5.2. Experimental Results

The system waveforms illustrated in Figure 14 demonstrate the main operational characteristics. Channel 1 validates constant output voltage regulation through the converter, thereby allowing the output charger to be supplied. Channel 2, meanwhile, highlights a sinusoidal current ( I 1 ) with a frequency of 500 kHz and an amplitude of 308.1 mA. Channel 3 displays the alternating voltage signal generated by a class-D inverter, which excites the IPT series–parallel tank. The input voltage ( V i n ) produces a primary current ( I 1 ) that maintains a regulated output ( V o u t ) for this coupling state. The waveform’s sinusoidal nature on channel 4 aligns with the expected theoretical predictions, though a sharp transient jump associated with the inverter is noted, attributed to its half-bridge topology.
The system’s closed-loop behavior under varying coupling coefficients is detailed in Figure 15. Within the operational range of 8–12 mm (0.5 to 0.3 coupling factors), the output current remains regulated at 100 mA, exhibiting minimal error. Beyond this range, deviations occur, though performance remains within acceptable application thresholds (4.5–5.5 V). These results validate the predictive accuracy of the control algorithm’s look-up table (LUT).
Therefore, the error obtained both in simulation and through the experimental results is sufficiently low and within the input voltage limits of the internal battery charger used in the application. However, if this error were considered high or if the coupling factors were higher, a more accurate analysis would be required considering not only the main harmonic but also the rest of the harmonics in order to obtain the optimum operating frequency that improves the power transfer estimation, as indicated in [31].
The transient responses to coupling variations (Figure 16), provide further evidence of system stability. The system’s dynamic is designed to be slow to avoid current and voltage peaks, as speed is not a requisite function of battery systems. The control system consistently regulates voltage and current to maintain functional parameters.
The system’s behavior in response to load variations (±20%) results in a corresponding change in output current (92 mA at −20% load and 110 mA at +20% load). These values remain within the acceptable operational limits, thereby ensuring consistent power delivery to the load.
The efficiency in the coupling factor range (0.27 to 0.5) for a transmitted power of 0.5 W has an average value of 75%, with a minimum of 73% and a maximum of 77%, similar to those found in state-of-the-art models [2].
A CR2032 battery was used to evaluate the charging process. As expected, the battery charging evaluations given in Figure 17 demonstrated stable performance. The system demonstrated its ability to regulate the input voltage and maintain a constant charge current of 100 mA for a period of 1000 s, allowing for efficient and controlled power supply during coupling fluctuations.

6. Conclusions

This paper reviewed resonant IPT architectures for wireless charging in biomedical applications, focusing on pacemakers. A control architecture is proposed in this paper that regulates the output current and voltage from the primary side, eliminating the necessity for communication with the secondary side. A series–parallel topology (SP) was selected, modeled, and incorporated into the resonant IPT system design, considering the effects of the class-D inverter and full-bridge diode rectifier. A look-up table is used to control the output current and output voltage. This look-up table relates the input current and input voltage, and its data are based on the model proposed. The control strategy was verified with the simulator PSIM, demonstrating its accuracy with several operation points depending on the coupling factor (k). The system provides a 100 mA output at a resonant frequency of 500 kHz for coupling factors between 0.3 and 0.5, with a maximum error of less than 1%, maintaining an output voltage range within the battery charger input voltage limits, as represented by R o . The experimental results confirm the control strategy, obtaining the same values as the simulations.

Author Contributions

Conceptualization, V.H., P.R. and A.B.; methodology, V.H., P.R. and A.B.; software, V.H. and P.R.; validation, V.H. and P.R.; formal analysis, V.H. and A.B.; investigation, V.H. and A.B.; resources, A.B.; data curation, V.H.; writing—original draft preparation, V.H. and P.R.; writing—review and editing, V.H., A.B., C.F. and P.Z.; supervision, A.B.; project administration, A.B. and C.F.; funding acquisition, A.B. All authors have read and agreed to the published version of the manuscript.

Funding

This work has been partially supported by the Spanish Ministry of Science, Innovation, and Universities through the research project HIDRON (PID2020-116500RB-I00/AEI/10.13039/501100011033); by the Regional Council of Science, Universities, and Innovation of the Community of Madrid through the research project DROMADER-CM (Y2020/NMT-6584/SINERGICOS), and Grant TED2021-129240B-I00 funded by MICIU/AEI/10.13039/501100011033 and, as appropriate, by the “European Union NextGenerationEU/PRTR”.

Data Availability Statement

The original contributions presented in this study are included in the article. Further inquiries can be directed to the corresponding author(s).

Conflicts of Interest

The authors declare no conflicts of interest.

Abbreviations

The following abbreviations are used in this manuscript:
AIMDActive Implantable Medical Devices
IPTInductive Power Transfer
WPTWireless Power Transfer
MPEMaximum Permissible Exposure
SARSpecific Absorption Rate
SSSeries–Series
SPSeries–Parallel
PSParallel–Series
PPParallel–Parallel
FHAFirst Harmonic Approximation
ACAlternate Current
PWMPulse Width Modulation
LUTLook-Up Table

References

  1. Gururaj, S.; Applequist, A.; Bhattarai, S.; Appaji, A.M.; Kadambi, P. Self-Powered Cardiac Pacemaker: The Viability of a Piezoelectric Energy Harvester. In Proceedings of the 2020 International Conference on Communication Systems & Networks (COMSNETS), Bangalore, India, 7–11 January 2020; pp. 70–75. [Google Scholar] [CrossRef]
  2. Hueros, V.; Barrado, A.; Lázaro, A.; Fernández, C. A Review of Wireless Charging Systems for Cardiac Pacemakers. In Proceedings of the 2023 IEEE 17th International Conference on Compatibility, Power Electronics and Power Engineering (CPE-POWERENG), Tallinn, Estonia, 14–16 June 2023; pp. 1–6. [Google Scholar] [CrossRef]
  3. Cruciani, S.; Campi, T.; Maradei, F.; Feliziani, M. Numerical simulation of Wireless Power Transfer system to recharge the battery of an implanted cardiac pacemaker. In Proceedings of the 2014 International Symposium on Electromagnetic Compatibility, Raleigh, NC, USA, 4–8 August 2014; pp. 44–47. [Google Scholar] [CrossRef]
  4. Liu, X.Q.; Li, Y.H.; Min, L.; Ping, H. The Design and Manufacture of the Wireless Power Transmission System in the Cardiac Pacemaker. Appl. Mech. Mater. 2014, 596, 100–103. [Google Scholar] [CrossRef]
  5. Ryu, H.; Park, H.-M.; Kim, M.-K.; Kim, B.; Myoung, H.S.; Kim, T.Y.; Yoon, H.-J.; Kwak, S.S.; Kim, J.; Hwang, T.H.; et al. Self-rechargeable cardiac pacemaker system with triboelectric nanogenerators. Nat. Commun. 2021, 12, 4374. [Google Scholar] [CrossRef] [PubMed]
  6. Rao, S.; Chiao, J.-C. Body Electric: Wireless Power Transfer for Implant Applications. IEEE Microw. Mag. 2015, 16, 54–64. [Google Scholar] [CrossRef]
  7. Zurbuchen, A.; Haeberlin, A.; Pfenniger, A.; Bereuter, L.; Schaerer, J.; Jutzi, F.; Huber, C.; Fuhrer, J.; Vogel, R. Towards Batteryless Cardiac Implantable Electronic Devices—The Swiss Way. IEEE Trans. Biomed. Circuits Syst. 2017, 11, 78–86. [Google Scholar] [CrossRef]
  8. Kok, C.L.; Fu, X.; Koh, Y.Y.; Teo, T.H. A Novel Portable Solar Powered Wireless Charging Device. Electronics 2024, 13, 403. [Google Scholar] [CrossRef]
  9. Zhang, W.; Mi, C.C. Compensation Topologies of High-Power Wireless Power Transfer Systems. IEEE Trans. Veh. Technol. 2016, 65, 4768–4778. [Google Scholar] [CrossRef]
  10. Zhang, W.; Wong, S.-C.; Tse, C.K.; Chen, Q. Analysis and Comparison of Secondary Series- and Parallel-Compensated Inductive Power Transfer Systems Operating for Optimal Efficiency and Load-Independent Voltage-Transfer Ratio. IEEE Trans. Power Electron. 2014, 29, 2979–2990. [Google Scholar] [CrossRef]
  11. Xiao, C.; Wei, K.; Cheng, D.; Liu, Y. Wireless Charging System Considering Eddy Current in Cardiac Pacemaker Shell: Theoretical Modeling, Experiments, and Safety Simulations. IEEE Trans. Ind. Electron. 2017, 64, 3978–3988. [Google Scholar] [CrossRef]
  12. Shevchenko, V.; Husev, O.; Strzelecki, R.; Pakhaliuk, B.; Poliakov, N.; Strzelecka, N. Compensation Topologies in IPT Systems: Standards, Requirements, Classification, Analysis, Comparison and Application. IEEE Access 2019, 7, 120559–120580. [Google Scholar] [CrossRef]
  13. Fernandez, C.; Garcia, O.; Prieto, R.; Cobos, J.A.; Uceda, J. Overview of different alternatives for the contact-less transmission of energy. In Proceedings of the IEEE 2002 28th Annual Conference of the Industrial Electronics Society, IECON 02, Sevilla, Spain, 5–8 November 2002; IEEE: Piscataway, NJ, USA, 2002; pp. 1318–1323. [Google Scholar] [CrossRef]
  14. Hueros, V.; Barrado, A.; Fernández, C.; Mattavelli, P. Coupling and Load Estimation with Current and Voltage Primary Sensing in Free Communication Wireless Power Charging. In Proceedings of the IECON 2023-49th Annual Conference of the IEEE Industrial Electronics Society, Singapore, 16–19 October 2023; pp. 1–6. [Google Scholar] [CrossRef]
  15. Poole, J.E.; Gleva, M.J.; Mela, T.; Chung, M.K.; Uslan, D.Z.; Borge, R.; Gottipaty, V.; Shinn, T.; Dan, D.; Feldman, L.A.; et al. Complication Rates Associated with Pacemaker or Implantable Cardioverter-Defibrillator Generator Replacements and Upgrade Procedures. Circulation 2010, 122, 1553–1561. [Google Scholar] [CrossRef]
  16. Mallela, V.S.; Ilankumaran, V.; Rao, N.S. Technical Series Trends in Cardiac Pacemaker Batteries. Indian Pacing Electrophysiol. J. 2004, 4, 201. [Google Scholar]
  17. Vulfin, V.; Sayfan-Altman, S.; Ianconescu, R. Wireless power transfer for a pacemaker application. J. Med. Eng. Technol. 2017, 41, 325–332. [Google Scholar] [CrossRef] [PubMed]
  18. Campi, T.; Cruciani, S.; De Santis, V.; Feliziani, M. EMF Safety and Thermal Aspects in a Pacemaker Equipped with a Wireless Power Transfer System Working at Low Frequency. IEEE Trans. Microw. Theory Tech. 2016, 64, 375–382. [Google Scholar] [CrossRef]
  19. Cetin, S.; Demirci, Y.E. High-efficiency LC-S compensated wireless power transfer charging converter for implantable pacemakers. Int. J. Circuit Theory Appl. 2022, 50, 122–134. [Google Scholar] [CrossRef]
  20. Arana, J.I.; Bodegas, A.; Sainz, I. Longevidad de los marcapasos. Cuad. Estimul. Card. 2011, 11, 29–32. Available online: https://secardiologia.es/images/stories/secciones/estimulacion/cuadernos-estimulacion/11/longevidad-de-los-marcapasos.pdf (accessed on 1 March 2025).
  21. Xiong, Q. Wireless Charging Device for Artificial Cardiac Pacemaker. In Proceedings of the 4th International Conference on Information Technology and Management Innovation, Shenzhen, China, 12–13 September 2015; Atlantis Press: Dordrecht, The Netherlands, 2015. [Google Scholar] [CrossRef]
  22. van Schuylenbergh, K.; Puers, R. Inductive Powering: Basic Theory and Application to Biomedical Systems; Springer Science & Business Media: Berlin/Heidelberg, Germany, 2009. [Google Scholar]
  23. Campi, T.; Cruciani, S.; Palandrani, F.; De Santis, V.; Hirata, A.; Feliziani, M. Wireless Power Transfer Charging System for AIMDs and Pacemakers. IEEE Trans. Microw. Theory Tech. 2016, 64, 633–642. [Google Scholar] [CrossRef]
  24. Haerinia, M.; Shadid, R. Wireless Power Transfer Approaches for Medical Implants: A Review. Signals 2020, 1, 209–229. [Google Scholar] [CrossRef]
  25. Bocan, K.N.; Mickle, M.H.; Sejdić, E. Multi-Disciplinary Challenges in Tissue Modeling for Wireless Electromagnetic Powering: A Review. IEEE Sens. J. 2017, 17, 6498–6509. [Google Scholar] [CrossRef]
  26. Shadid, R.; Haerinia, M.; Roy, S.; Noghanian, S. Hybrid inductive power transfer and wireless antenna system for biomedical implanted devices. Prog. Electromagn. Res. C 2018, 88, 77–88. [Google Scholar] [CrossRef]
  27. Xiao, C.; Cheng, D.; Wei, K. An LCC-C Compensated Wireless Charging System for Implantable Cardiac Pacemakers: Theory, Experiment, and Safety Evaluation. IEEE Trans. Power Electron. 2018, 33, 4894–4905. [Google Scholar] [CrossRef]
  28. Patil, D.; McDonough, M.K.; Miller, J.M.; Fahimi, B.; Balsara, P.T. Wireless Power Transfer for Vehicular Applications: Overview and Challenges. IEEE Trans. Transp. Electrif. 2018, 4, 3–37. [Google Scholar] [CrossRef]
  29. Zhao, Q.; Niu, S.; Shao, Z.; Jian, L. Hull-Compatible Underwater IPT System with Enhanced Electromagnetic–Thermal Performance for USVs. Energies 2025, 18, 237. [Google Scholar] [CrossRef]
  30. Enssle, A.; Parspour, N. Power Loss Shifted Design of Inductive Energy Transfer Systems. IEEE Open J. Power Electron. 2020, 1, 113–123. [Google Scholar] [CrossRef]
  31. Niu, S.; Lyu, R.; Lyu, J.; Chau, K.T.; Liu, W.; Jian, L. Optimal Resonant Condition for Maximum Output Power in Tightly Coupled WPT Systems Considering Harmonics. IEEE Trans. Power Electron. 2025, 40, 152–156. [Google Scholar] [CrossRef]
Figure 1. Fundamental blocks of the proposed inductive power transfer system.
Electronics 14 01563 g001
Figure 2. Compensation tanks: (a) series–series, (b) series–parallel, (c) parallel–series, and (d) parallel–parallel.
Electronics 14 01563 g002
Figure 3. M-Model of Series–Parallel [30].
Electronics 14 01563 g003
Figure 4. Voltage gain as a function of k and frequency with the curves highlighted at constant frequency (valley in red) and at maximum gain at variable frequency (peak in blue).
Electronics 14 01563 g004
Figure 5. Electrical circuit of the proposed inductive power transfer system.
Electronics 14 01563 g005
Figure 6. Primary coil current ( I 1 ) as a function of coupling (k) and input voltage ( V i n ). In blue, the values for a current I o = 0.1 A.
Electronics 14 01563 g006
Figure 7. Primary coil current ( I 1 ) as a function of reference voltage ( V r e f ) proportional to V i n .
Electronics 14 01563 g007
Figure 8. Control loop diagram for the LUT.
Electronics 14 01563 g008
Figure 9. Simulated waveforms (a); primary and secondary currents; (b) input and output voltages.
Electronics 14 01563 g009
Figure 10. Variation of regulated output current and control variables for different coupling values.
Electronics 14 01563 g010
Figure 11. Designed wireless power system with the equipment used for its testing.
Electronics 14 01563 g011
Figure 12. Test bench for measuring coupling factor as a function of the distance between coils.
Electronics 14 01563 g012
Figure 13. Coupling factor (k) values as a function of distance between coils.
Electronics 14 01563 g013
Figure 14. Main waveforms of the system at k = 0.4 and R o = 50 Ω.
Electronics 14 01563 g014
Figure 15. Output voltage (Vout) and output current (Io) as a function of coupling factor k.
Electronics 14 01563 g015
Figure 16. Transient response of the system for coupling factor steps.
Electronics 14 01563 g016
Figure 17. Experimental battery charging test data plotted in MATLAB (R2023a).
Electronics 14 01563 g017
Table 1. Basic equations of series–parallel topology.
M-ModelSeries–Parallel
Z 1 R 1 + j ω L 1 1 ω C 1
Z 2 R 2 + j ω L 2 + R A C 1 + j ω C 2 R A C
Z r ω M 2 / Z 2
I 1 V i n Z 1 + Z r
I 2 j ω M Z 1 Z 2 + ω 2 M 2 V i n
I o u t I 2 · 1 1 + j ω C 2 R A C
V o u t I o u t R A C
G v j ω M Z 1 Z 2 + ω 2 M 2 R A C 1 + j ω C 2 R A C
Table 2. IPT-SP system simulation parameters.
ParametersValueUnit
f r 500kHz
L 1 10µH
L 2 10µH
R 1 50mΩ
R 2 200mΩ
C 1 10nF
C 2 10nF
R A C 60
Disclaimer/Publisher’s Note: The statements, opinions and data contained in all publications are solely those of the individual author(s) and contributor(s) and not of MDPI and/or the editor(s). MDPI and/or the editor(s) disclaim responsibility for any injury to people or property resulting from any ideas, methods, instructions or products referred to in the content.

