1. Introduction
Distribution network is oriented to end users straightforwardly. Its operational security, economy, and reliability affect people’s living standards and regional economic development extraordinarily [
1]. Meanwhile, power supply capability has gradually become one of the key factors in evaluating the operation status of distribution networks [
2]. As a concept for evaluating the load supply level of distribution networks under certain safety criteria, power supply capability can substantially entail the level of power supply service provided by distribution networks and indicate the risk of overrunning.
For the orderly popularization of electric vehicles (EVs), nowadays the integration of large-scale EVs has become a development tendency of distribution networks. However, the charging loads are distributed in different positions of distribution networks during staggered time periods, which will inevitably cause an enormous impact on the security and reliability of power supply in distribution networks [
3,
4]. The integration of large-scale EVs is equivalent to increase lots of random loads both in time and space, so that distribution networks should not only ensure the normal supply of the conventional loads, but also meet the demand of EV charging. Under such a pressure, once the loads exceed the limit of a feeder or transformer, relay protection will operate for the overload and cause power failure. Hence, it is worth studying whether the distribution network has sufficient capability to ensure the supply of both conventional loads and charging loads of EVs after their massive integration.
The influence of charging and discharging behavior of EVs on distribution network is summarized by a textual description in [
5] and the stochastic behavior of the overall system with EV loads and PV generation is assessed in [
6]. Current researches on the impact of EV integration mainly focus on four aspects as follows.
Charging loads: Most of the attention has been given to the influence on load curve [
7,
8,
9], as the charging loads are the basis of further study on the influence of EVs to grid. The mostly used method is Monte Carlo, and the usual simulation step is 1 h. Some scholars model the combined load including PV and EVs [
10], or including biomass-fueled gas engines and EVs [
11], in both of which the simulation step is adjusted to the smaller scale (10 minutes) and the correlation of the input variables is considered.
Energy efficiency management: Some scholars believe that the main drive for progressing EVs is the reduction of carbon emissions, so the studies also focus on how to allocate energy reasonably and reduce carbon emissions [
12];
Power quality: Disorderly charging of EVs will increase the power loss and voltage deviation so that the power quality is reduced. So scholars research the probabilistic method to verify the fulfilment of voltage constraints [
11]; the optimized charging mode [
7], the location of charging piles [
13], and the quantity configuration of EVs at each node of grid [
14] have been considered to guarantee power quality;
Operation mode: Generally, based on the simulation of charging loads, how to improve the security and reliability of the system is studied, for example, to establish the optimal model for peak-valley price period with the objective of minimizing the peak-valley difference rate of loads including EVs [
15].
In brief, few studies take the properties of EVs into account in present studies, since the charging behavior of EVs varies according to their classification. Charging loads are usually simulated according to the characteristics of different types of EVs. Besides, few researches have combined the impact of integration of EVs in distribution network with the power supply capability.
Based on the current research situation, the charging characteristics of three types of EVs (private car, bus, and taxi) are analyzed, and the spatial-temporal distribution of charging loads in a distribution network are simulated via Monte Carlo method in
Section 2. Then, the simulation results of EV charging load are added to the conventional loads at each period, so that the total supply capability (TSC) can be calculated in
Section 3. After that, an index called probability of insufficient supply capacity (PIC) of distribution network is presented to evaluate the risk of insufficient power supply capacity in
Section 4. Moreover, several strategies are proposed to relieve the risk caused by EV charging loads in
Section 5. Finally, in
Section 6, this paper takes the simplified distribution network of a typical power supply mode C-1 in China’s Fujian province as an example to verify the effectiveness of the evaluation index and improvement measures proposed.
2. Simulation of EV Charging Loads via Monte Carlo Method
To predict the charging loads of EVs reasonably is the basis to study the impact of integration of massive EVs in distribution networks. The charging loads depend on driving mileage, initial charging condition, initial charging time, charging duration, and charging power of EVs [
11,
12], but the loads cannot be processed by conventional methods for the random driving characteristics and the different behavior modes of different EVs in type [
16]. Simulation via the method of Monte Carlo is mainly used to qualify this research [
17,
18].
This paper focuses on three types of EVs: private car, bus, and taxi, analyzes their charging characteristics, and simulates the charging loads. The charging behavior of various EVs types is first analyzed and preset.
2.1. Private Cars
Generally speaking, private cars are driven for people’s commuting on weekdays, and for recreational activities on weekends or holidays [
19]. Here a weekday is chosen for charging simulation. The rush hours for private cars are usually from 7:00 to 8:00 and from 17:00 to 19:00. EVs are usually recharged in addition to these periods. In particular, private cars do not need to be charged every day. Thus, all the charging quantity of EVs mentioned in this paper refers to the daily charging demands, but not the EV population of the area. The charging characteristics are listed in
Table 1. Their state of charge (SOC) satisfies the normal distribution N (0.6, 0.01) [
20].
2.2. Buses
Buses are relatively fixed in driving habits, and their charging position can be considered to be determined initially, which starts around 6:00 and stops around 22:00. Generally, their operation peak periods are from 7:00 to 8:00 and from 17:00 to 18:00. Buses usually need to be charged twice a day. During the day, the charging period is from 9:00 to 16:00 using quick charging. During the charging period from 23:00 to 5:00 on the next day at night when they stop working, they use slow charge. The charging characteristics are listed in
Table 2. The SOC of both charges satisfies the normal distribution N (0.5, 0.01) [
20], and the initial charging time obeys the uniform distribution.
2.3. Taxis
For the own unique operating rules, taxis generally run in two shifts, and electric taxis should be fully charged before handing over [
21]. The driving routes are relatively unpredictable, so the charging positions are randomly selected in the whole distribution network. Usually there is a shift between 6:00 and 16:00. The taxis usually need to be charged twice a day. According to the shift and rest time, they should be charged quickly from 11:00 to 14:00 at noon and slowly from 0:00 to 5:00 at night. The charging characteristics are shown in
Table 3 below. SOC obeys the normal distribution N (0.3, 0.01) [
20].
2.4. Calculation Process
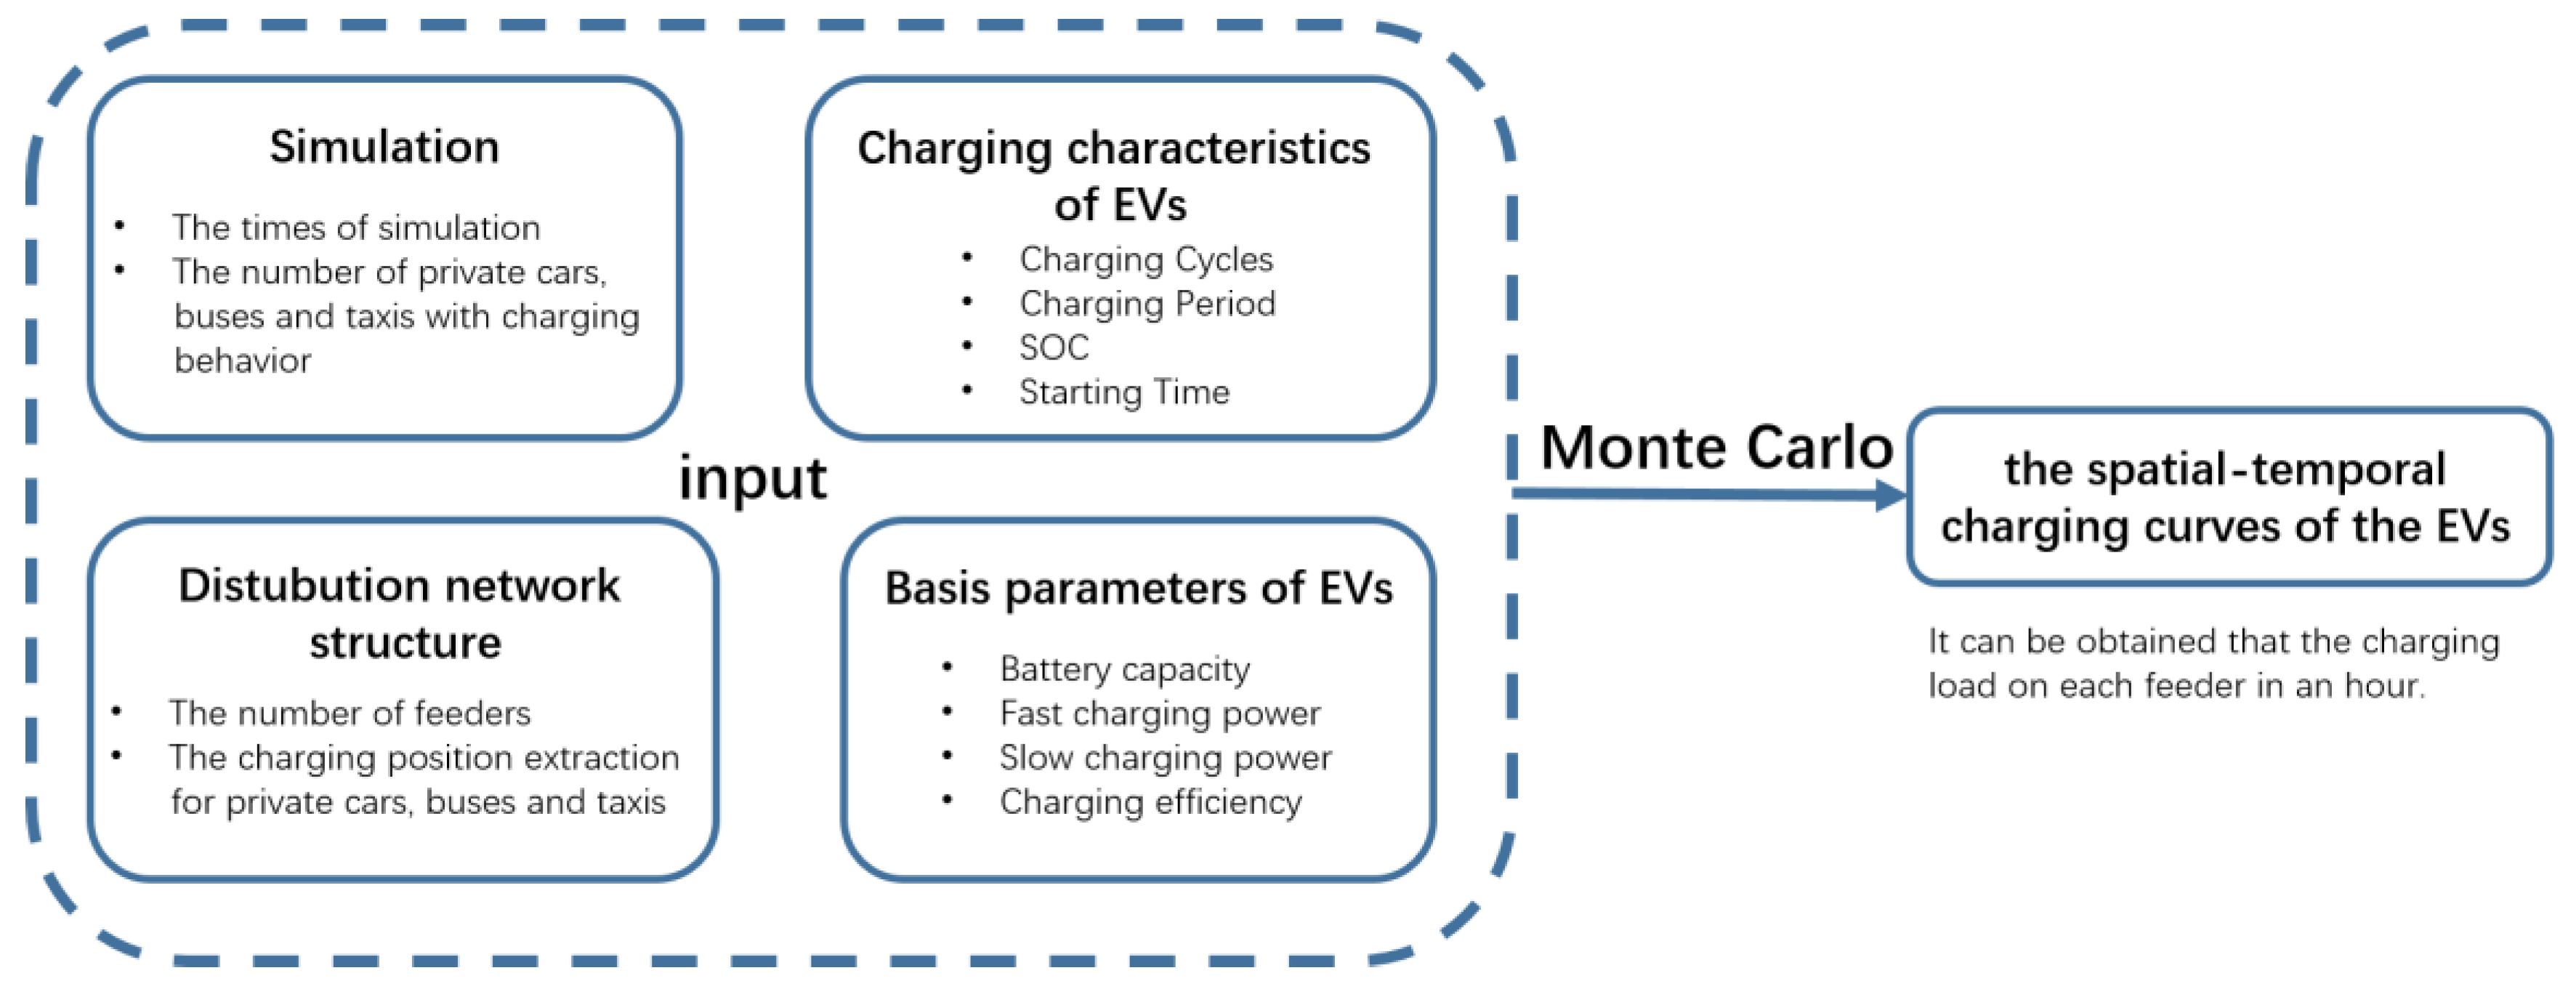
Based on the above analysis of charging characteristics of EVs, Monte Carlo method and statistical experience are used to extract the appropriate random number, and then substituted for calculation. After data integration, the charging process of EVs in the distribution network is simulated, and the spatial-temporal distribution of EVs charging loads are finally generated. The data generated by extracting random numbers include initial charging status, initial charging time, and charging position of EVs in the distribution network. SOC and initial charging time will be extracted according to the specific distribution derived from statistical experience, and charging position will be extracted according to the characteristics of different types of EVs. Charging duration is calculated via SOC using Equation (1).
Cn refers to the battery capacity of EVs;
Pn refers to the charging power;
η refers to the charging efficiency.
Finally, the spatial-temporal charging curves of the EVs can be obtained through the calculation of the above data. The process is summarized in
Figure 1.
3. Model of TSC Considering EV Integration
TSC of distribution network is defined as the maximum load that the distribution network can supply on the premise of the “N-1” criterion (considering both feeder “N-1” and main transformer “N-1”). The meaning of TSC covers not only the maximum loads of distribution network, but also the optimal distribution of loads under the working condition [
22,
23].
For the integration of a massive number of EVs, their charging behavior will inevitably lead to the increase of network load, which will affect the ability of “N-1” load transfer in case of fault, thus weakening the TSC and aggravating the pressure and burden of network operation. In order to fully study the impact of a massive number of EVs integrated in the distribution network, and lay the foundation for subsequent evaluation of the risk of insufficient supply capacity, a model of TSC calculation considering EV integration is established, which is associated with the perspective of period.
As for TSC calculation, the total loads in the distribution network are set as the objective function, including the loads of all main transformers (feeders). Simultaneously, the “N-1” criterion (consider both feeder “N-1” and main transformer “N-1”) are taken as constraints. Moreover, not only the conventional loads transfer constraint of the distribution network, but also the charging loads of the EVs should be considered in the feeder’s “N-1” constraint. The specific model is shown in Equations (2)–(7).
TSCt refers to the value of TSC during the tth period;
Pi refers to the loads supplied by transformer i;
Fm refers to the loads of feeder m;
trfmn refers to the loads of feeder n when “N-1” fault occurs on feeder m;
trtij refers to the loads supplied by transformer j when “N–1” fault occurs on transformer i;
RFn refers to the capacity of the feeder n;
Dn refers to the charging loads of EVs on feeder n;
an refers to whether the loads on feeder n include EVs, either 1 or 0;
Rj refers to the rated capacity of the transformer j.
The meanings of the formulas are as follows:
Equation (2) is the objective function for calculating TSC during the tth period, which indicates that TSC is the maximized value when adding up the loads supplied by all transformers.
Equations (3) and (4) are feeder segmentation constraint and constraint on the relationship between transformer loads and feeder loads, which means when fault occurs on feeder m, all loads transferred from the feeder m equals the original loads of the feeder m, and at the same time, the loads supplied by transformer equals loads of all feeders connected to it.
Equation (5) is constraint on the relationship between transformer loads transfer and feeder loads transfer. Moreover, the transformers are connected by feeders, so in case of faulty transform
i, the loads supplied by it must be transferred to nearby transformers, which is completed by feeders. Based on above reason, transformer loads transfer equals feeder loads transfer [
24].
Inequality (6) indicates that the original loads of feeder m and the charging loads of EVs at this location will be transferred to other feeders when fault occurs on feeder m, which is feeder “N-1” constraint, and the feeder cannot be overloaded after being transferred.
Inequality (7) is transformer “N-1” constraint, the meaning of which is when the transformer i fails, the sum of the loads transferred to transformer j and the original cannot exceed the rated capacity of the transformer j.
4. Probabilistic Evaluation of Power Supply Capability Considering EV Integration
4.1. PIC in a Distribution Network
A distribution network connects with users directly, and its operation safety, economy, and reliability can greatly affect people’s living standards and stable economic development. Whether a distribution network has sufficient supply capacity, which is the fundamental guarantee for the normal operation of the whole power system, is of great significance for terminal power supply. In addition, increasing resources such as distributed generators and EVs are accessing into the distribution networks rapidly and massively [
25]. Integrating a massive number of EVs is equivalent to put a large amount of uncontrollable loads into the distribution network. Under such circumstances, whether the distribution network has enough capacity to conserve the normal operation of the original equipment and concurrently, ensure the supply of EVs charging loads is extremely worthy of study.
However, definite evaluation indices can hardly evaluate a network with massive random loads both in time and space. Therefore, a probability evaluation index PIC is addressed to scientifically evaluate the risk of insufficient power supply capability after a massive number of EVs integrated, so as to evaluate the operation status of the distribution network unambiguously. In this way, effective control measures can be taken timely to improve the overall capacity of the distribution network.
4.2. Calculation Process
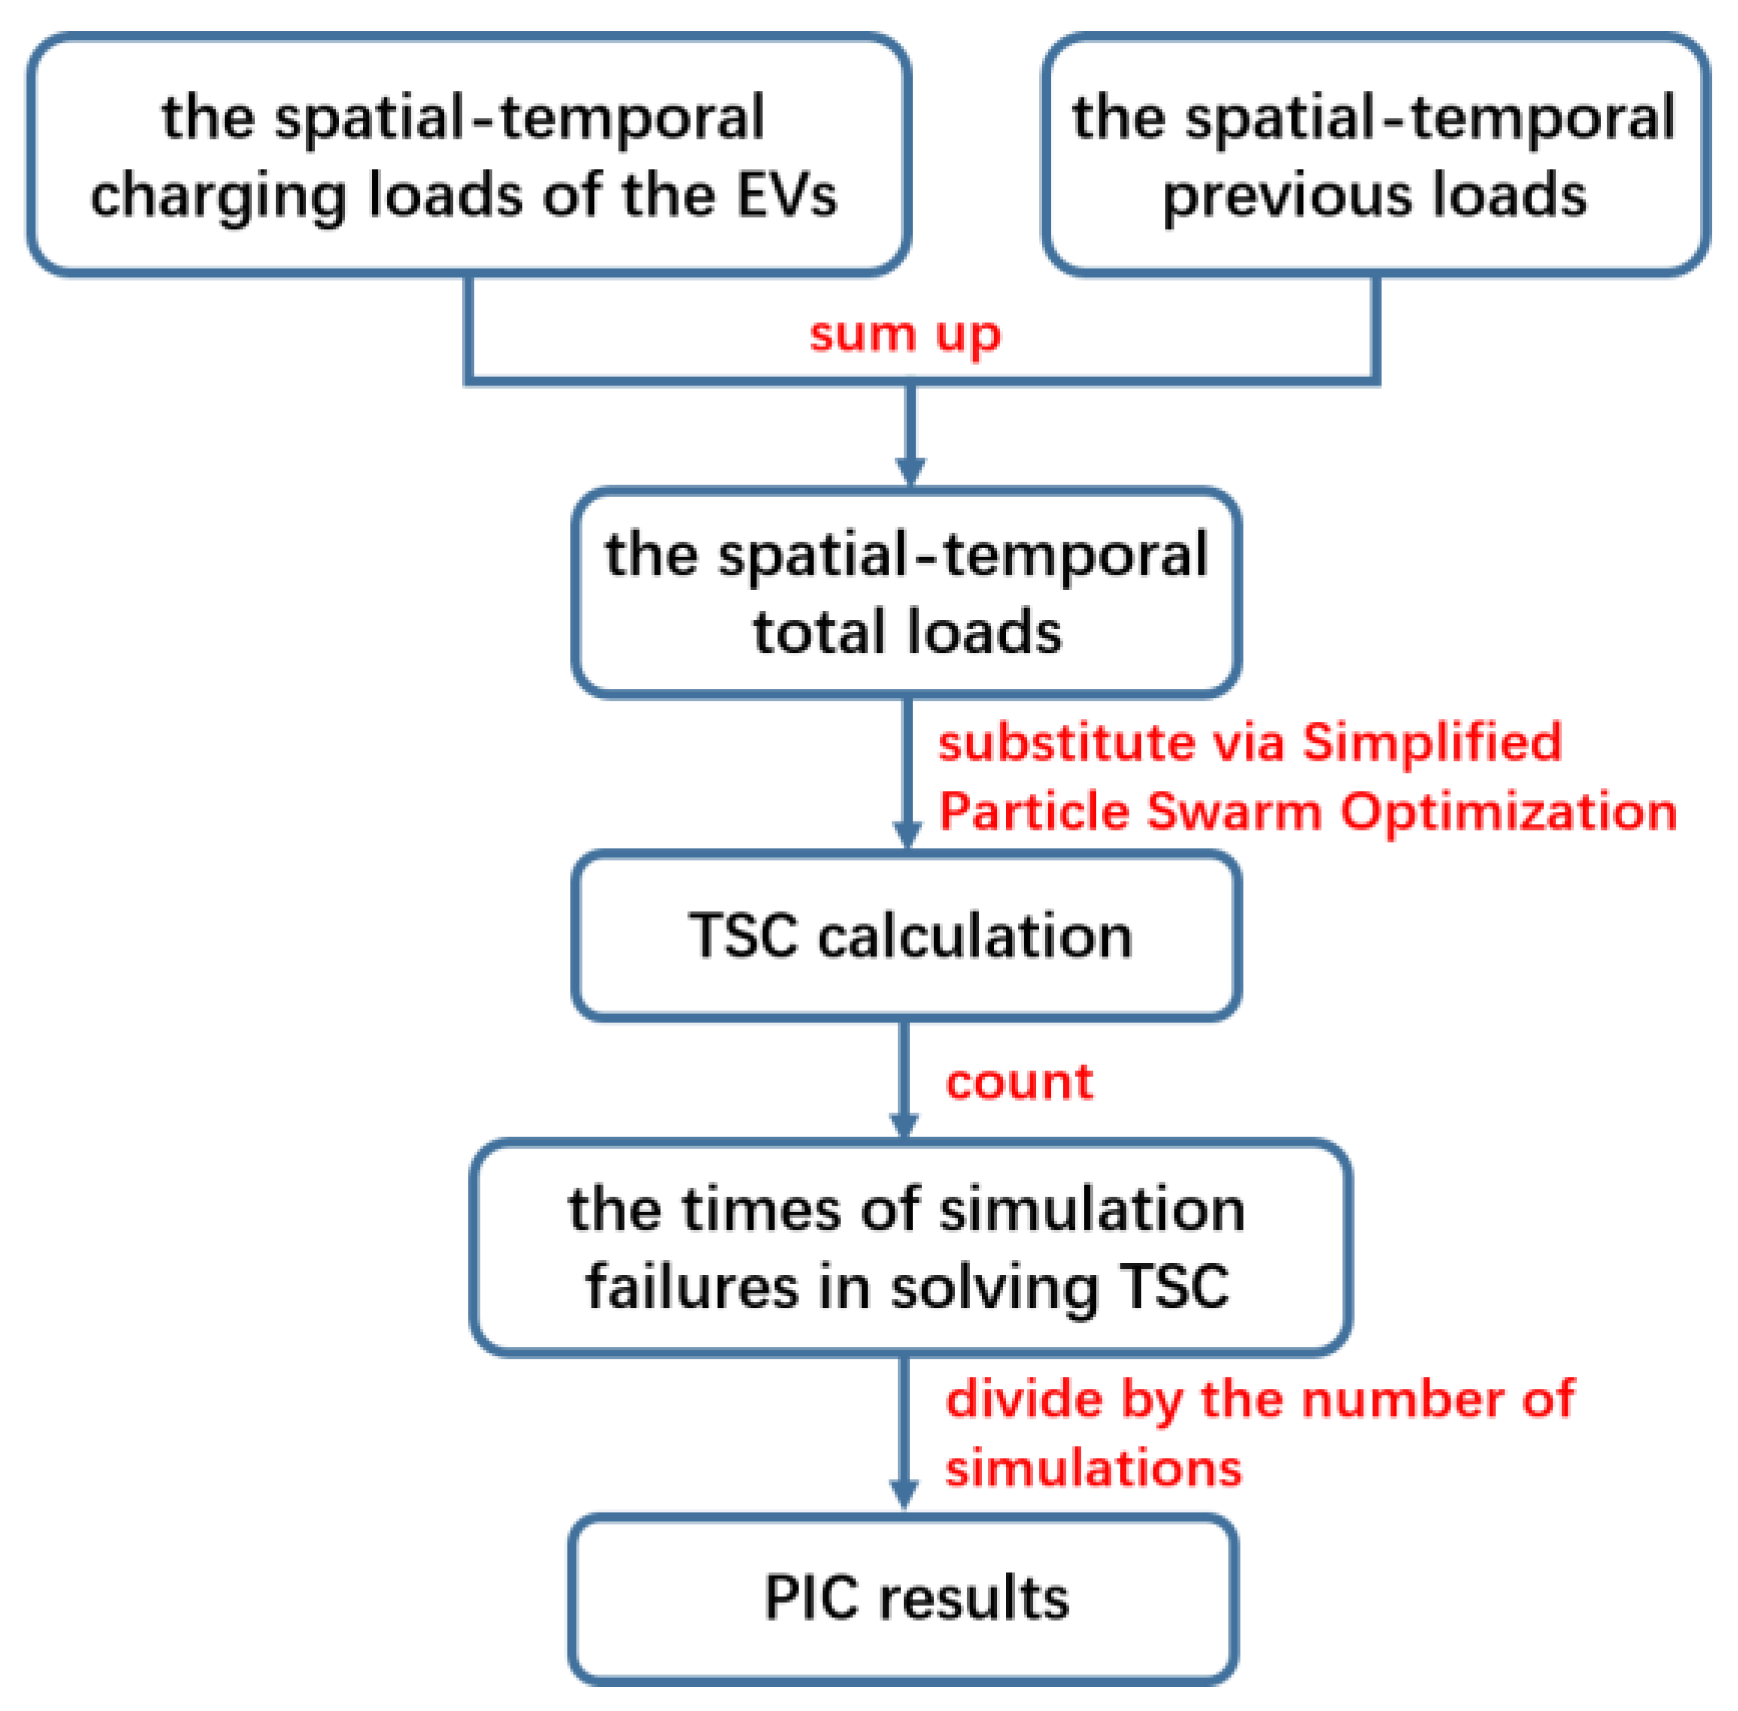
For the purpose mentioned above, TSC of a distribution network with EVs at each time section will be calculated first, and then the risk of insufficient power supply capacity can be evaluated using probabilistic and statistical method. Monte Carlo method is used to simulate the spatial-temporal distribution of EVs in distribution network in practice, and the simulation results are substituted for TSC calculation to evaluate the risk of insufficient power supply capacity.
When evaluating the risk of insufficient power supply capacity of distribution network, TSC cannot be simply compared with the existing loads value to calculate the PIC, since TSC is the extreme case when the loads of feeder achieves the optimal distribution.
If TSC value < total loads, power supply capacity of distribution network must be insufficient.
If TSC value = total loads, normal power supply can only be maintained when the loads are distributed at TSC status.
If TSC value > total loads, possibly the normal power supply cannot be guaranteed. When the distribution network operates according to the confirmed distribution of existing loads, it may not be able to supply power at TSC status.
The value of TSC is affected by factors such as capacity allocation of main transformers and distribution of feeders, which has nothing to do with the current loads distribution of the network. However, the above analysis shows that the TSC cannot evaluate the risk of insufficient power supply capacity. Therefore, in the calculation of TSC, the existing loads constraints of feeders in the distribution network will be fully taken into account, and TSC considering the existing loads distribution will be obtained. Specifically, inequality Equation (8) should be added to the above model.
This inequality indicates that the existing loads in the distribution network must be guaranteed to be supplied normally in the process of solving the TSC.
In conventional TSC calculation model, loads on feeders are not limited as the objective of the model is to find out an optimal load distribution that satisfies both security constraints (feeder, transformer capacity limits) and reliability constraints (“N-1” criterion for both feeders and transformers). Such a model is usually used to evaluate the power supply margins of a distribution network. However, in the modified TSC calculation model proposed above, EV charging loads, together with the conventional loads, are regarded as rigid constraints of the network. Thus, if the optimization model can be successfully solved, it means there still remain power supply margins of the network. Otherwise, if the model cannot be solved, it means the network cannot support such a load distribution within both security and reliability constraints. In other words, the model is now used to evaluate whether the maximum power supply capability is broken after the integration of EV charging loads, rather than to evaluate the power supply margins.
The calculation of charging loads of EVs needs to be simulated many times, so it will take a lot of work to substitute the simulation results into the calculation of TSC. Therefore, this paper chooses the simplified particle swarm optimization algorithm to solve the problem, which is quick in speed and high in accuracy. If the distribution network can supply power normally, the simplified particle swarm optimization algorithm can complete the calculation and work out the TSC value of the distribution network with EV integrated; but if the power supply capacity is insufficient, the algorithm cannot complete the calculation and will report an error. Finally, PIC can be calculated by counting the simulation times that cannot be solved, and the specific operation process is shown in
Figure 2 below.
5. Improvement Measures for Insufficient Power Supply Capacity via Modifying EV Charging Strategies
When massive EVs are integrated into a distribution network, the supply for charging loads brings pressure to the distribution network, which proposes new requirements for the safety and reliability of power supply in the distribution network. In such a pressure environment, once the loads exceed the limit of the distribution network, they will affect the normal operation of equipment in the network. Previously, PIC has been proposed as an index to evaluate the risk of overload of distribution network after EVs integrated. If reasonable and effective measures can be taken to reduce the PIC upon this fundament at the risk of insufficient power supply capacity, the safety and reliability of power supply in distribution network will be greatly improved [
26].
The charging strategy of EVs will be adjusted to improve the spatial-temporal distribution of charging loads, so as to reduce the PIC value. The following charging strategies are addressed:
Strategy 1: Limit the charging power of EVs. If the charging power of EVs decreases, they will take longer time to charge, which can disperse the charging loads of EVs in terms of time. The trend of loads is gentler on the whole, and the PIC at risk time can be attrited.
Strategy 2: Control the number or capacity of the EVs charging activities during risk periods. PIC can be counted at each period after EVs integrated via Monte Carlo simulation, and at the risk of PIC, the upper limit of charging number or capacity for EVs with charging behavior will be able to partly restrain the risk of overload (e.g., the maximum charge limit for EVs is 90% of total capacity, or limit the number of EVs charging during risk periods).
Generally speaking, adjusting the initial charging time of EVs at risk time can also reduce the PIC value. Changing the initial charging time of EVs will shift the interval and reduce the PIC value, but it may also cause overload during non-risk periods. Therefore, the adjustment of initial charging time should be moderate.
It is worth mentioning that the charging behavior of electric buses is poor in flexibility for their fixed working time. Hence in terms of charging strategy improvement, private cars and taxis are the main targets. The above strategies can be rationally combined to achieve better results in practice.
6. Examples Illustrate
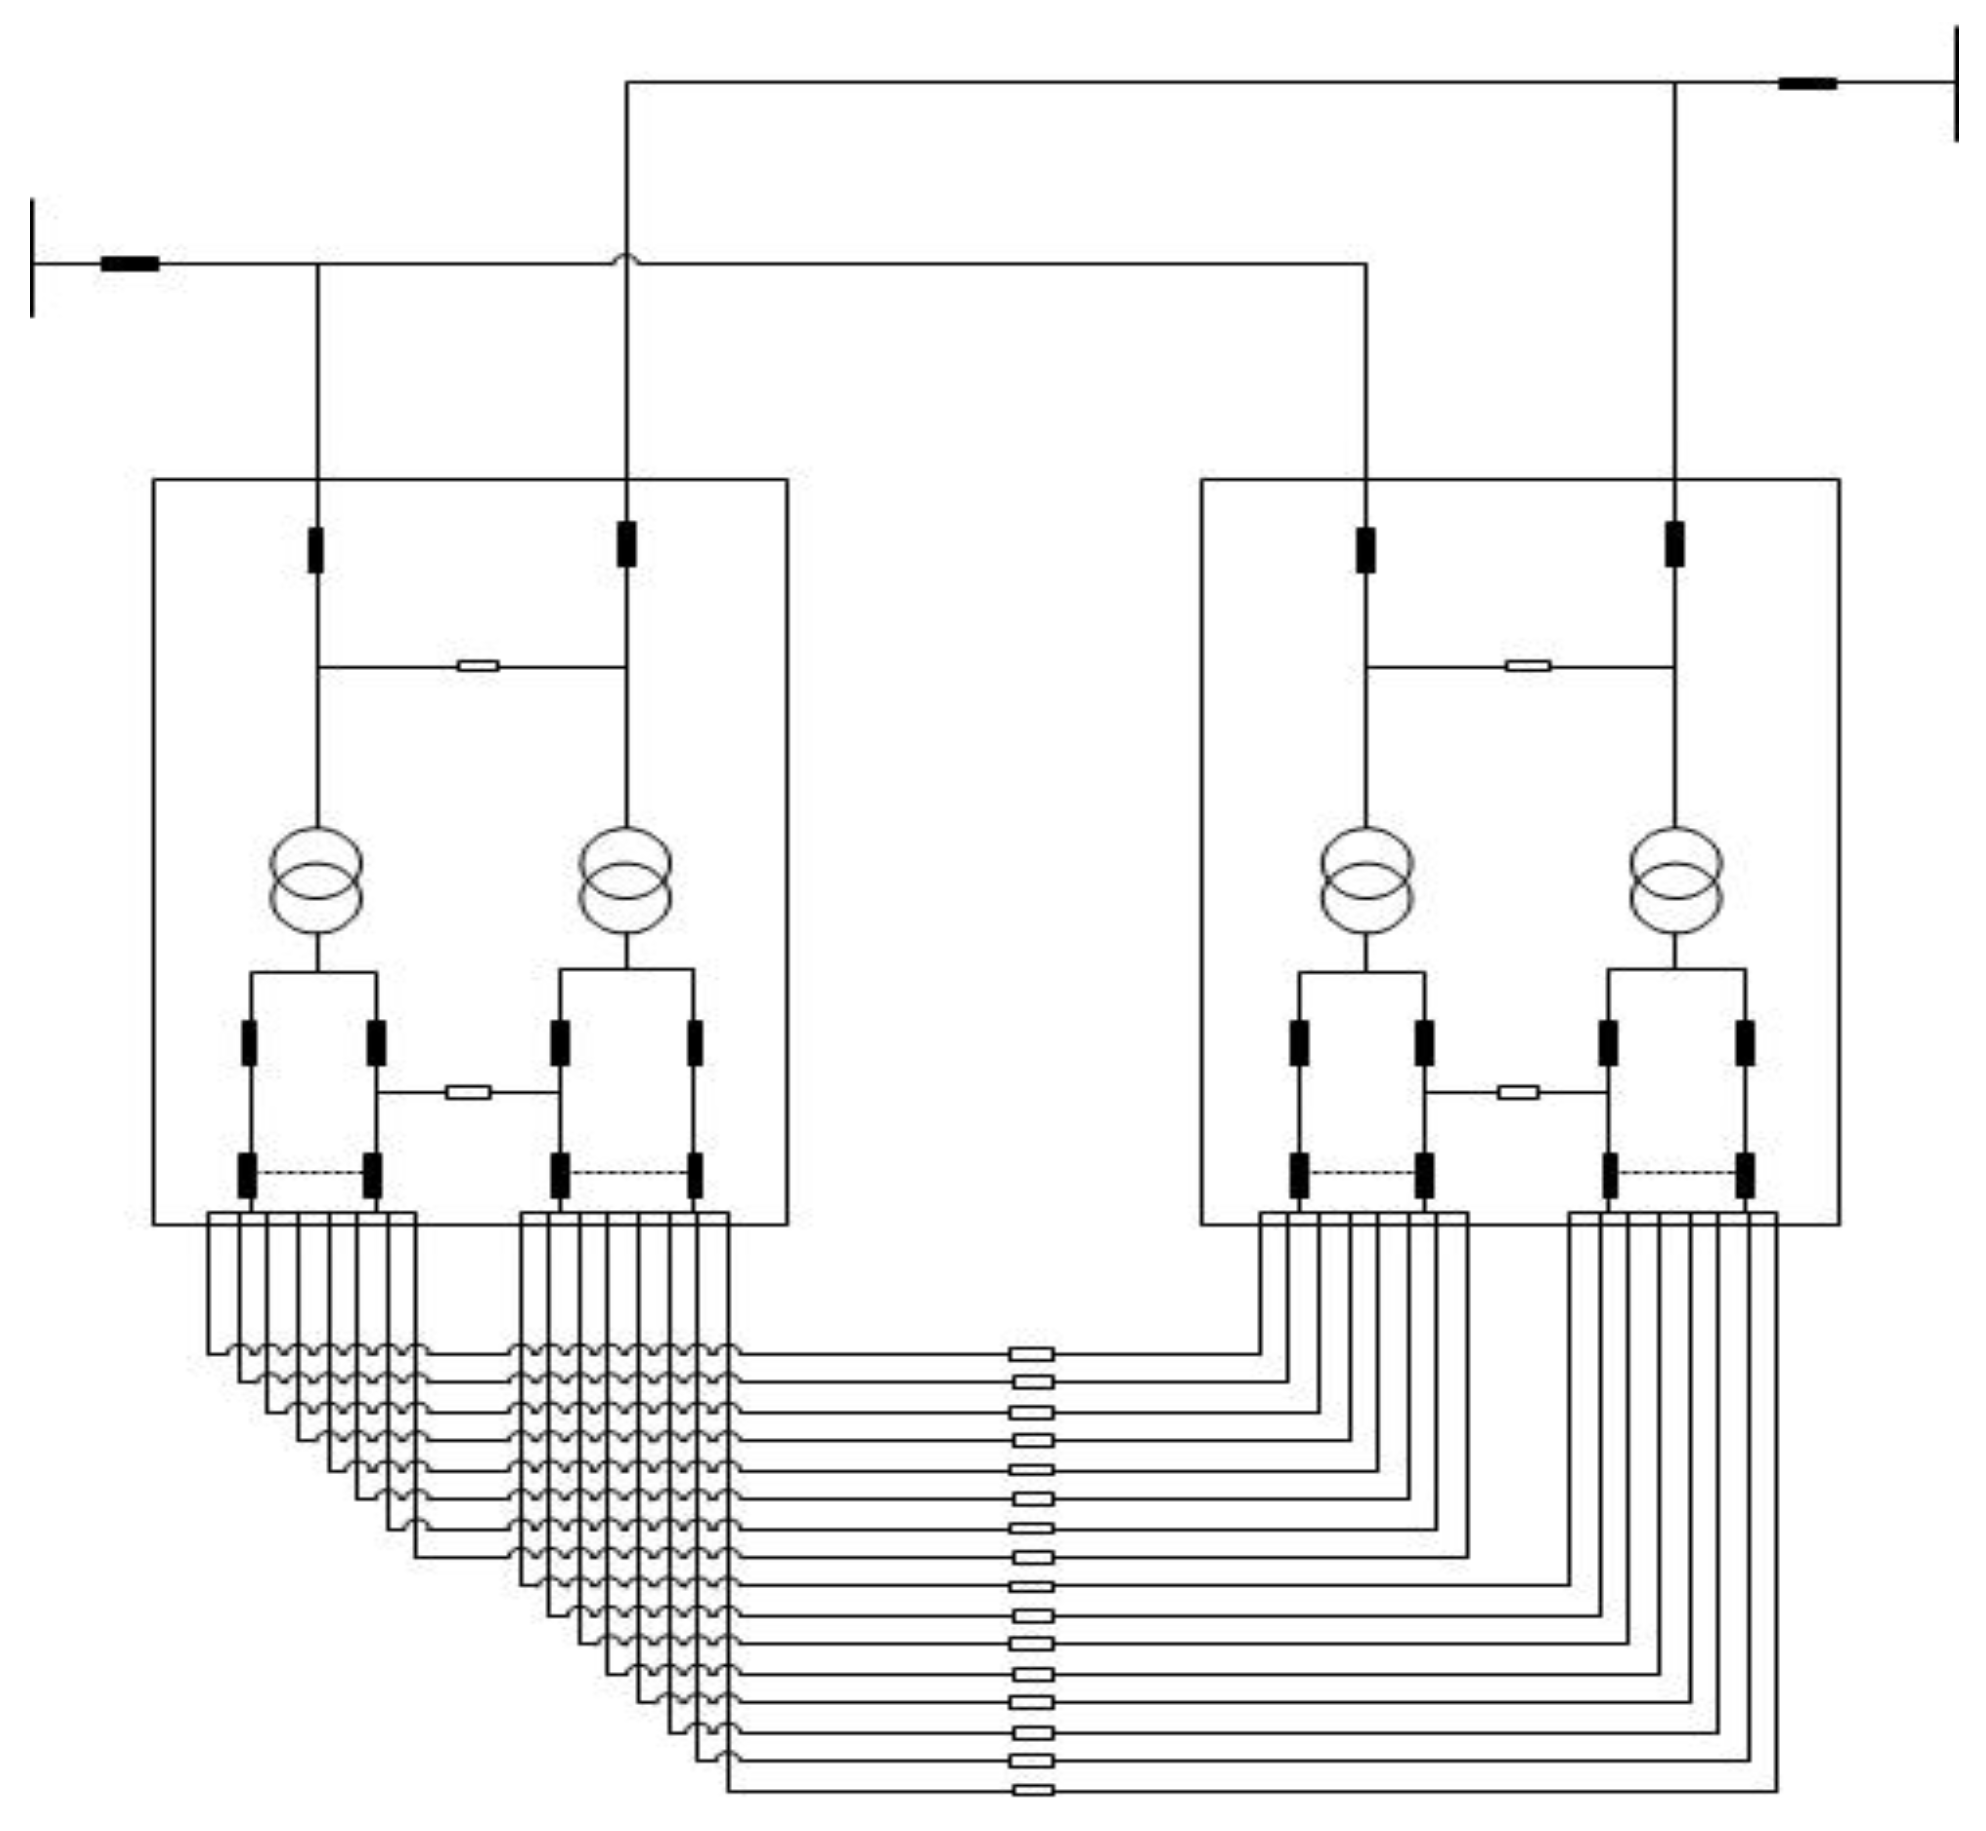
First, this paper chooses a typical distribution network structure, (simplified distribution network of typical power supply mode C–1 in China’s Fujian province, as shown in
Figure 3) and then simulates spatial-temporal distribution of the charging loads of a certain number of EVs with charging behaviors envisaged. Second, the charging loads distribution of EVs is substituted for the calculation of TSC, and PIC is then obtained. Finally, several improvement strategies, such as restricting the charging power of EVs, controlling the number of EVs with charging behavior, etc., are verified.
The distribution network used for illustration consists of two substations, each consisting of two main transformers, and the 10 kV side power supply area is connected by 32 feeders. Moreover, each main transformer has a capacity of 50 MVA and each feeder has a capacity of 8 MVA.
In terms of charging position extraction, the charging position of private cars is sampled on the first 20 feeders; the charging position of buses is determined and charging on feeders 1, 3, 5, 9, 14, 18, 21, 24, 27, and 30; the charging position of taxis is sampled on all the 32 feeders. The total times of simulations is set to 3000.
When no EV is integrated in this distribution network, its TSC is 100 MW.
In this paper, three scenarios are presupposed and improved respectively. Scenario 1 is for integration of EVs with currently the most commonly used charging parameters. Scenario 2 is for more EVs integration based on scenario 1. Scenario 3 is for integration of EVs with high charging powers.
Scenario 1 and 2 use the same charging power and different quantities, in which Scenario 2 has 10% more vehicles than Scenario 1. Similarly, Scenario 1 and Scenario 3 have the same quantities of EVs, but are different in the EVs’ fast charging and slow charging powers.
6.1. Scenario 1
As mentioned above, the spatial-temporal distribution of the charging loads of three types of EVs is first simulated, including private cars, buses, and taxis, and integrated into the distribution network. Private cars, buses, and taxis with charging behavior/demand everyday are taken for 4000, 300, and 1500, respectively.
The physical parameters of EVs are showed in
Table 4 as below, and the charging power values are set according to the most commonly used values in present practice (e.g., 16 A for 220 V single phase).
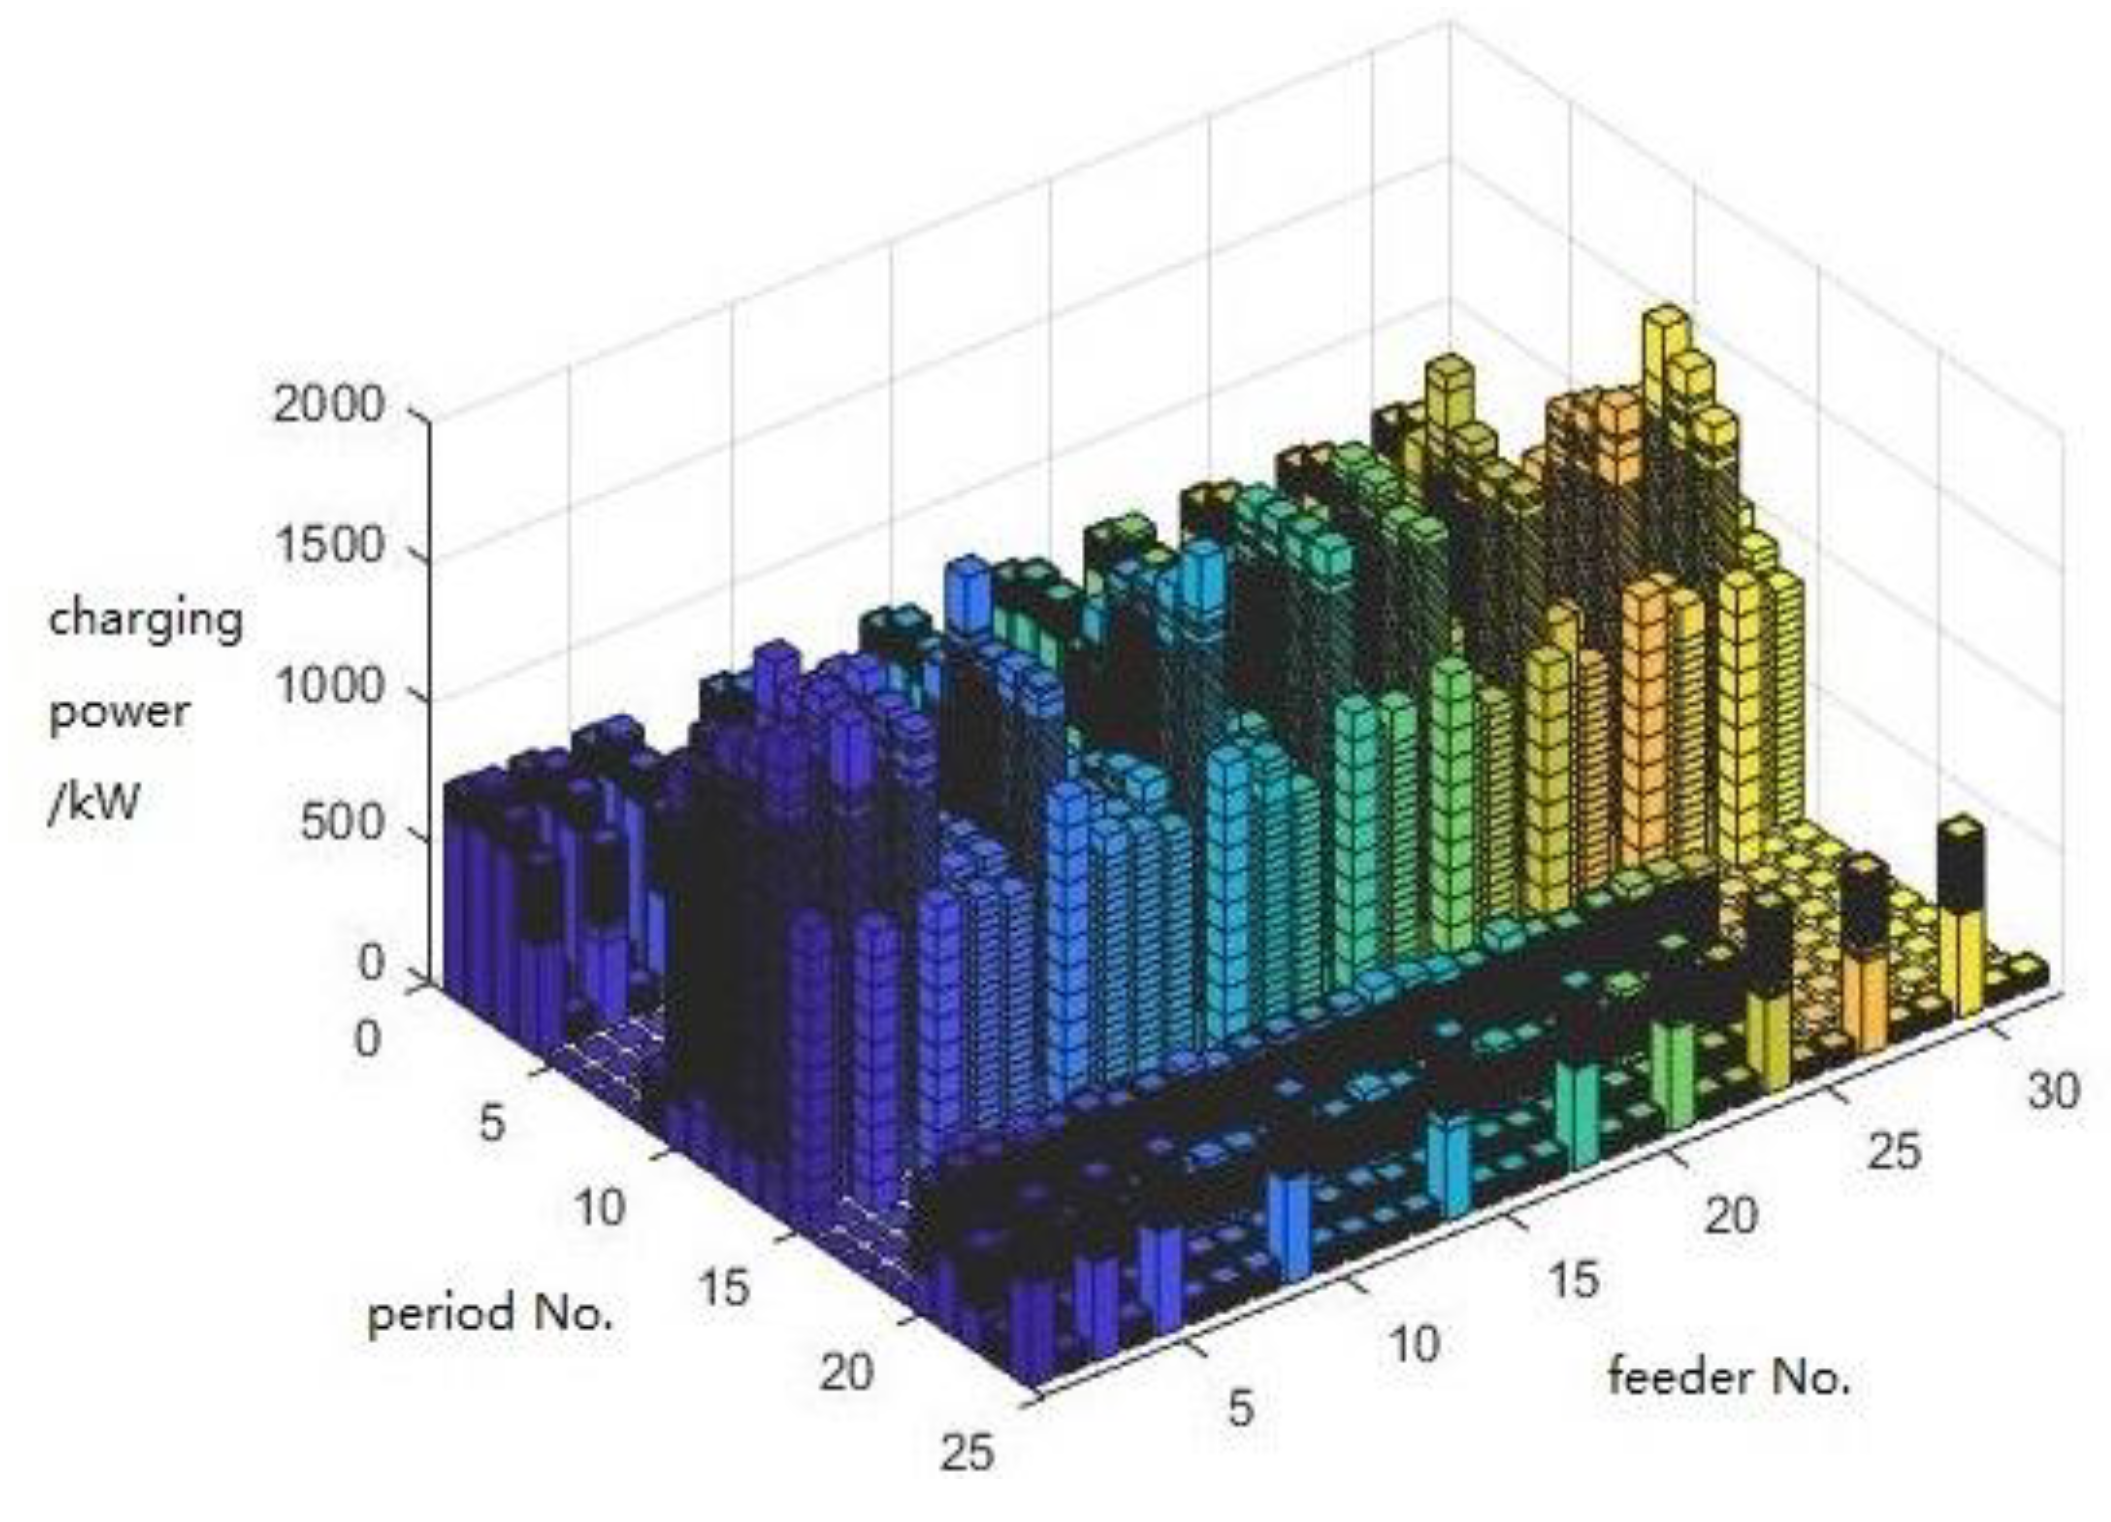
Based on the above analysis, the spatial-temporal distribution of EVs in the distribution network is simulated, among 32 feeders and including 24 periods, as shown in
Figure 4 below.
As shown in
Figure 4, the charging loads of EVs are relatively high around noon, because both buses and taxis charge fast during these periods, while private cars relatively less charge during these periods.
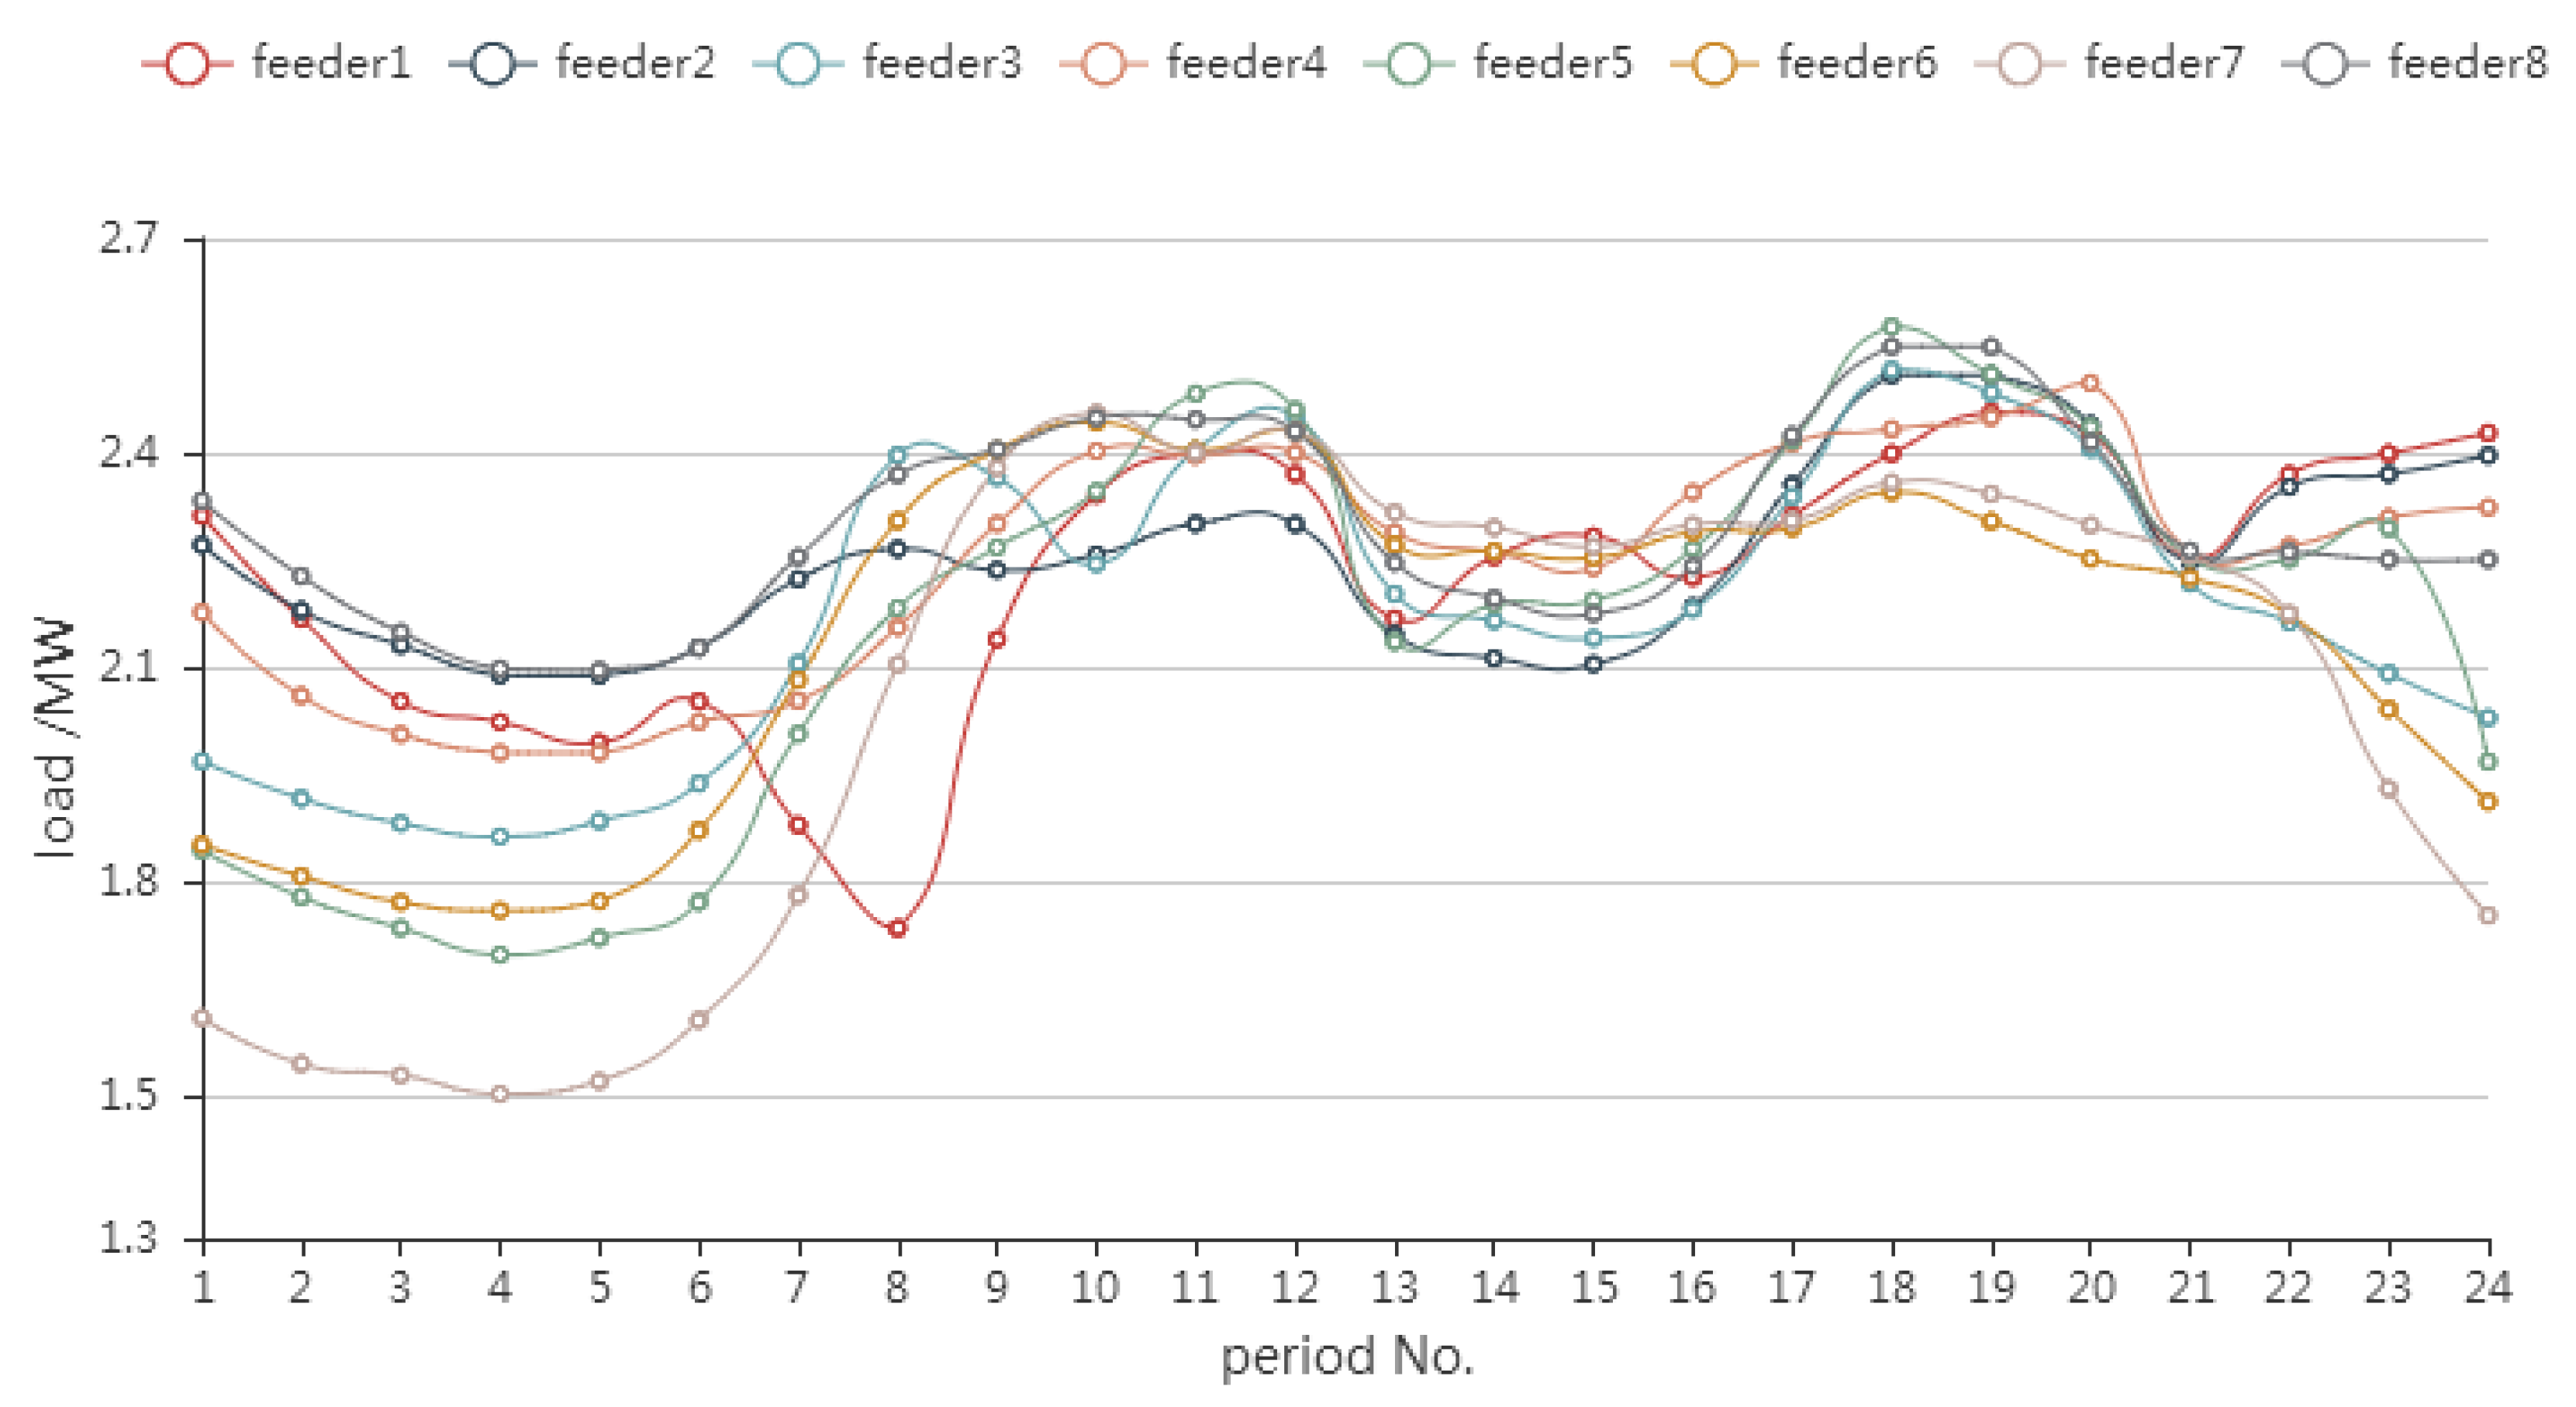
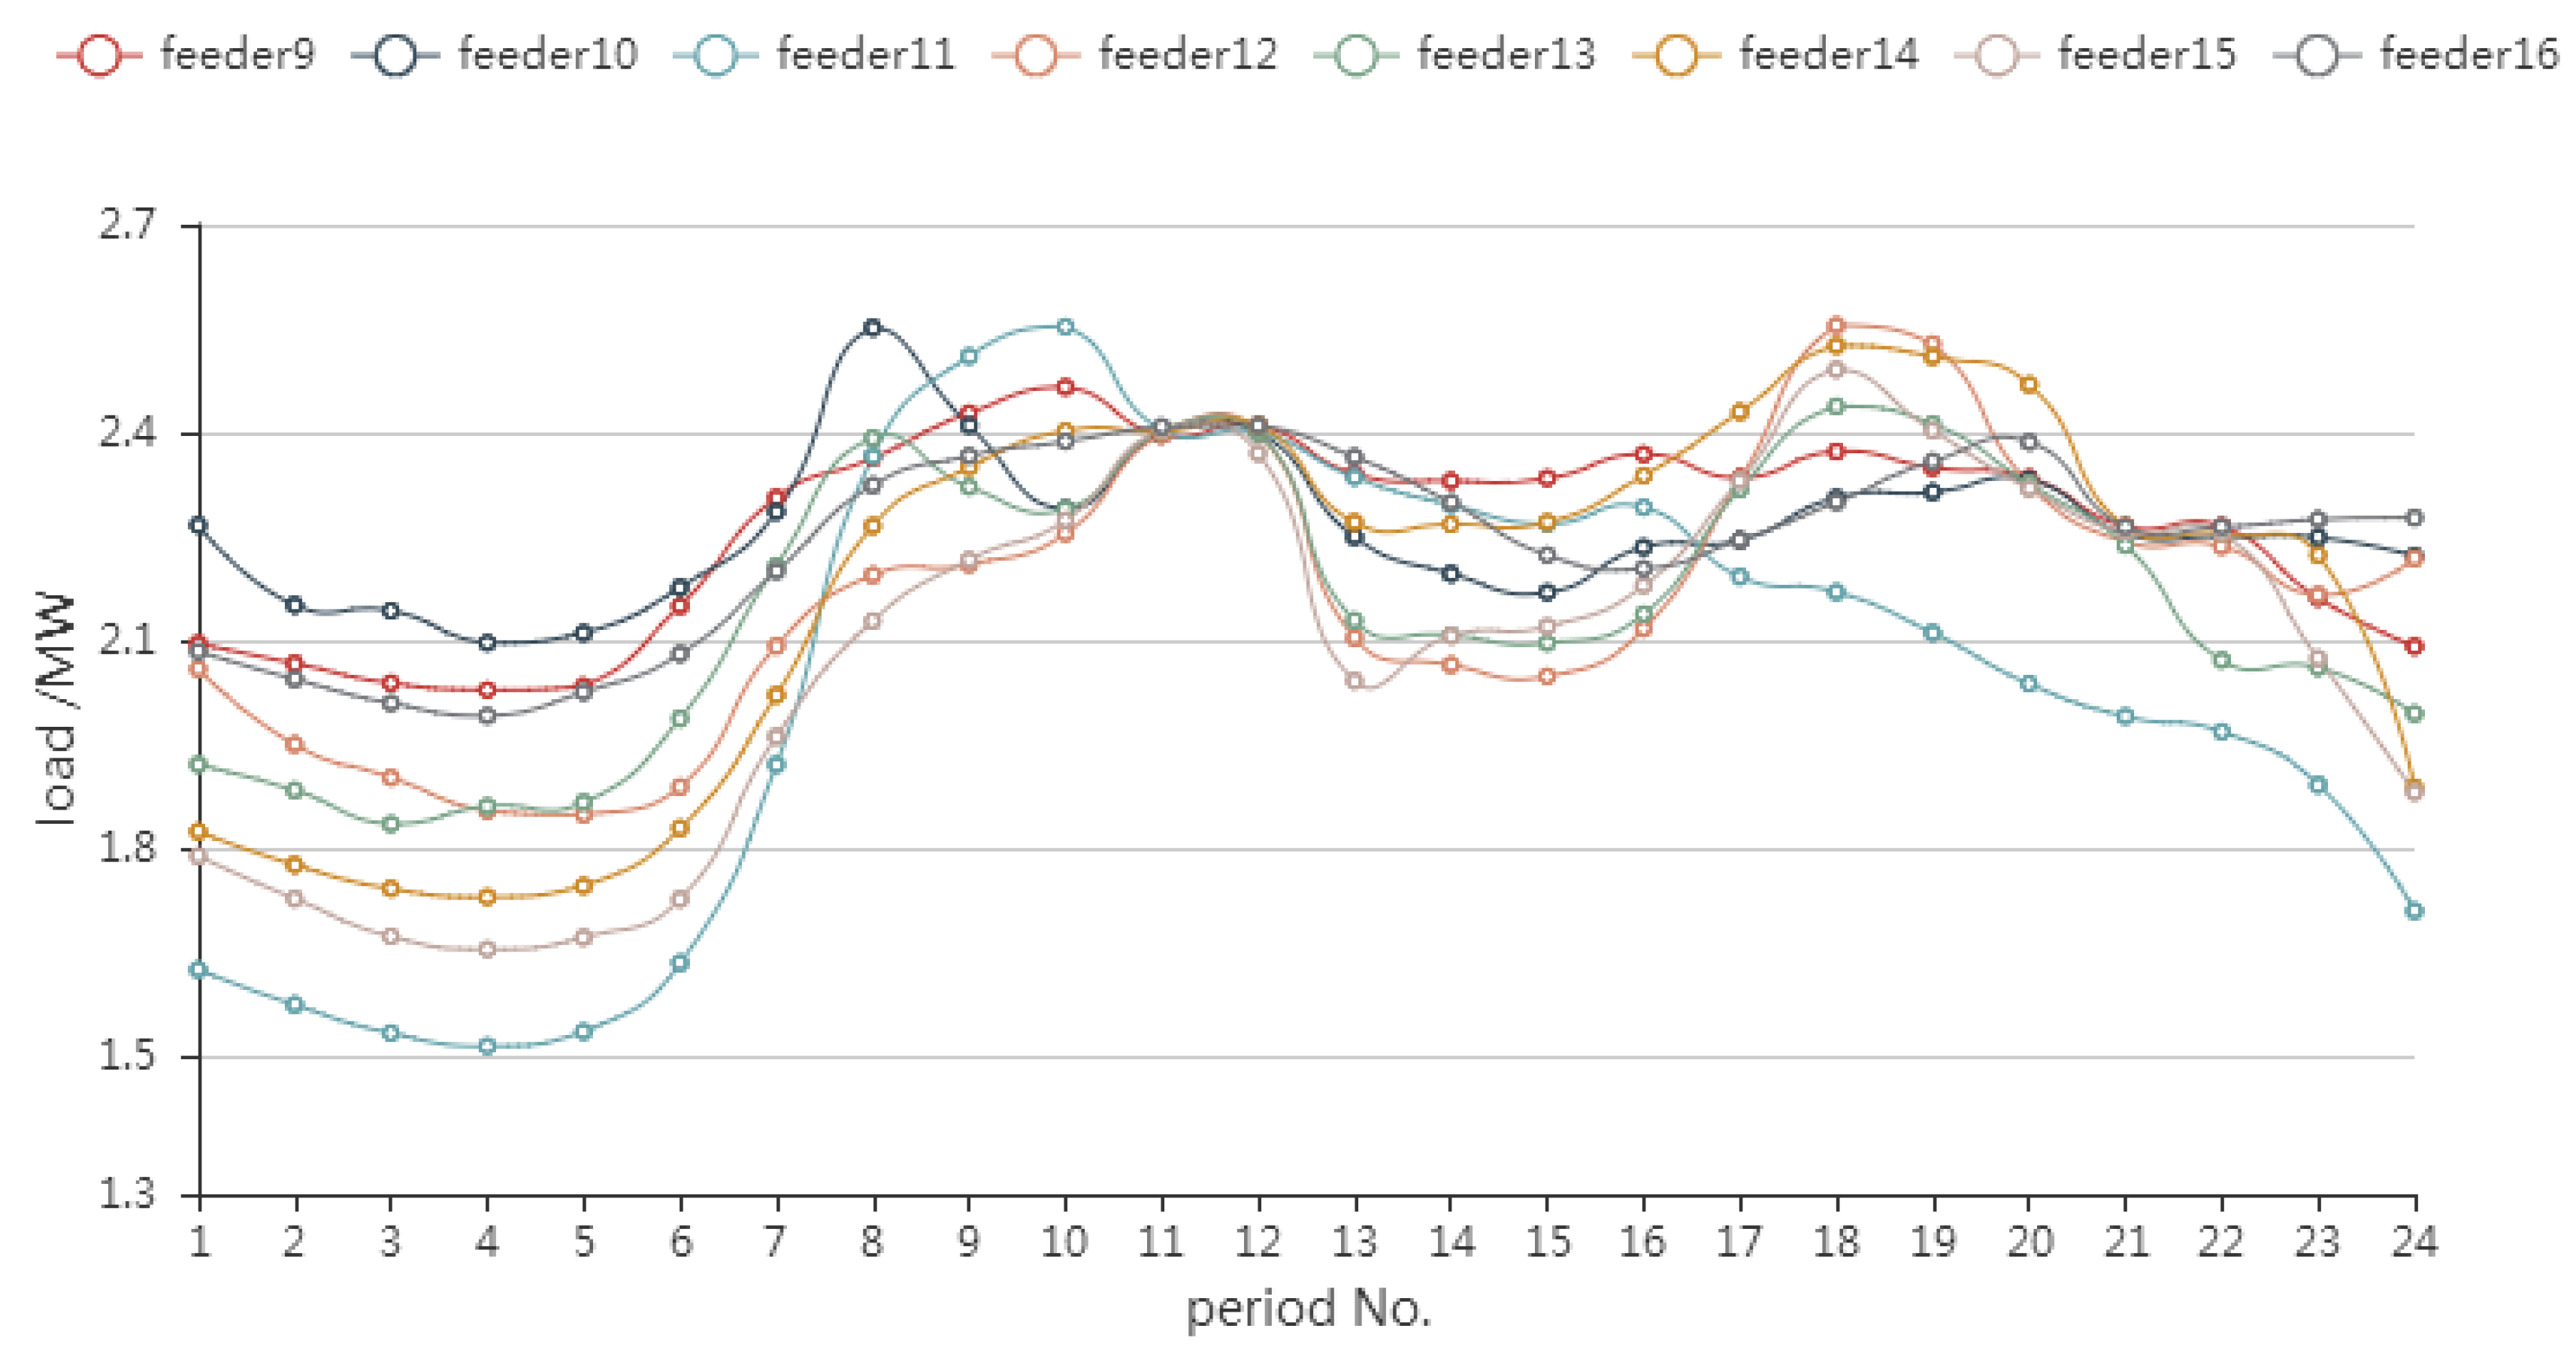
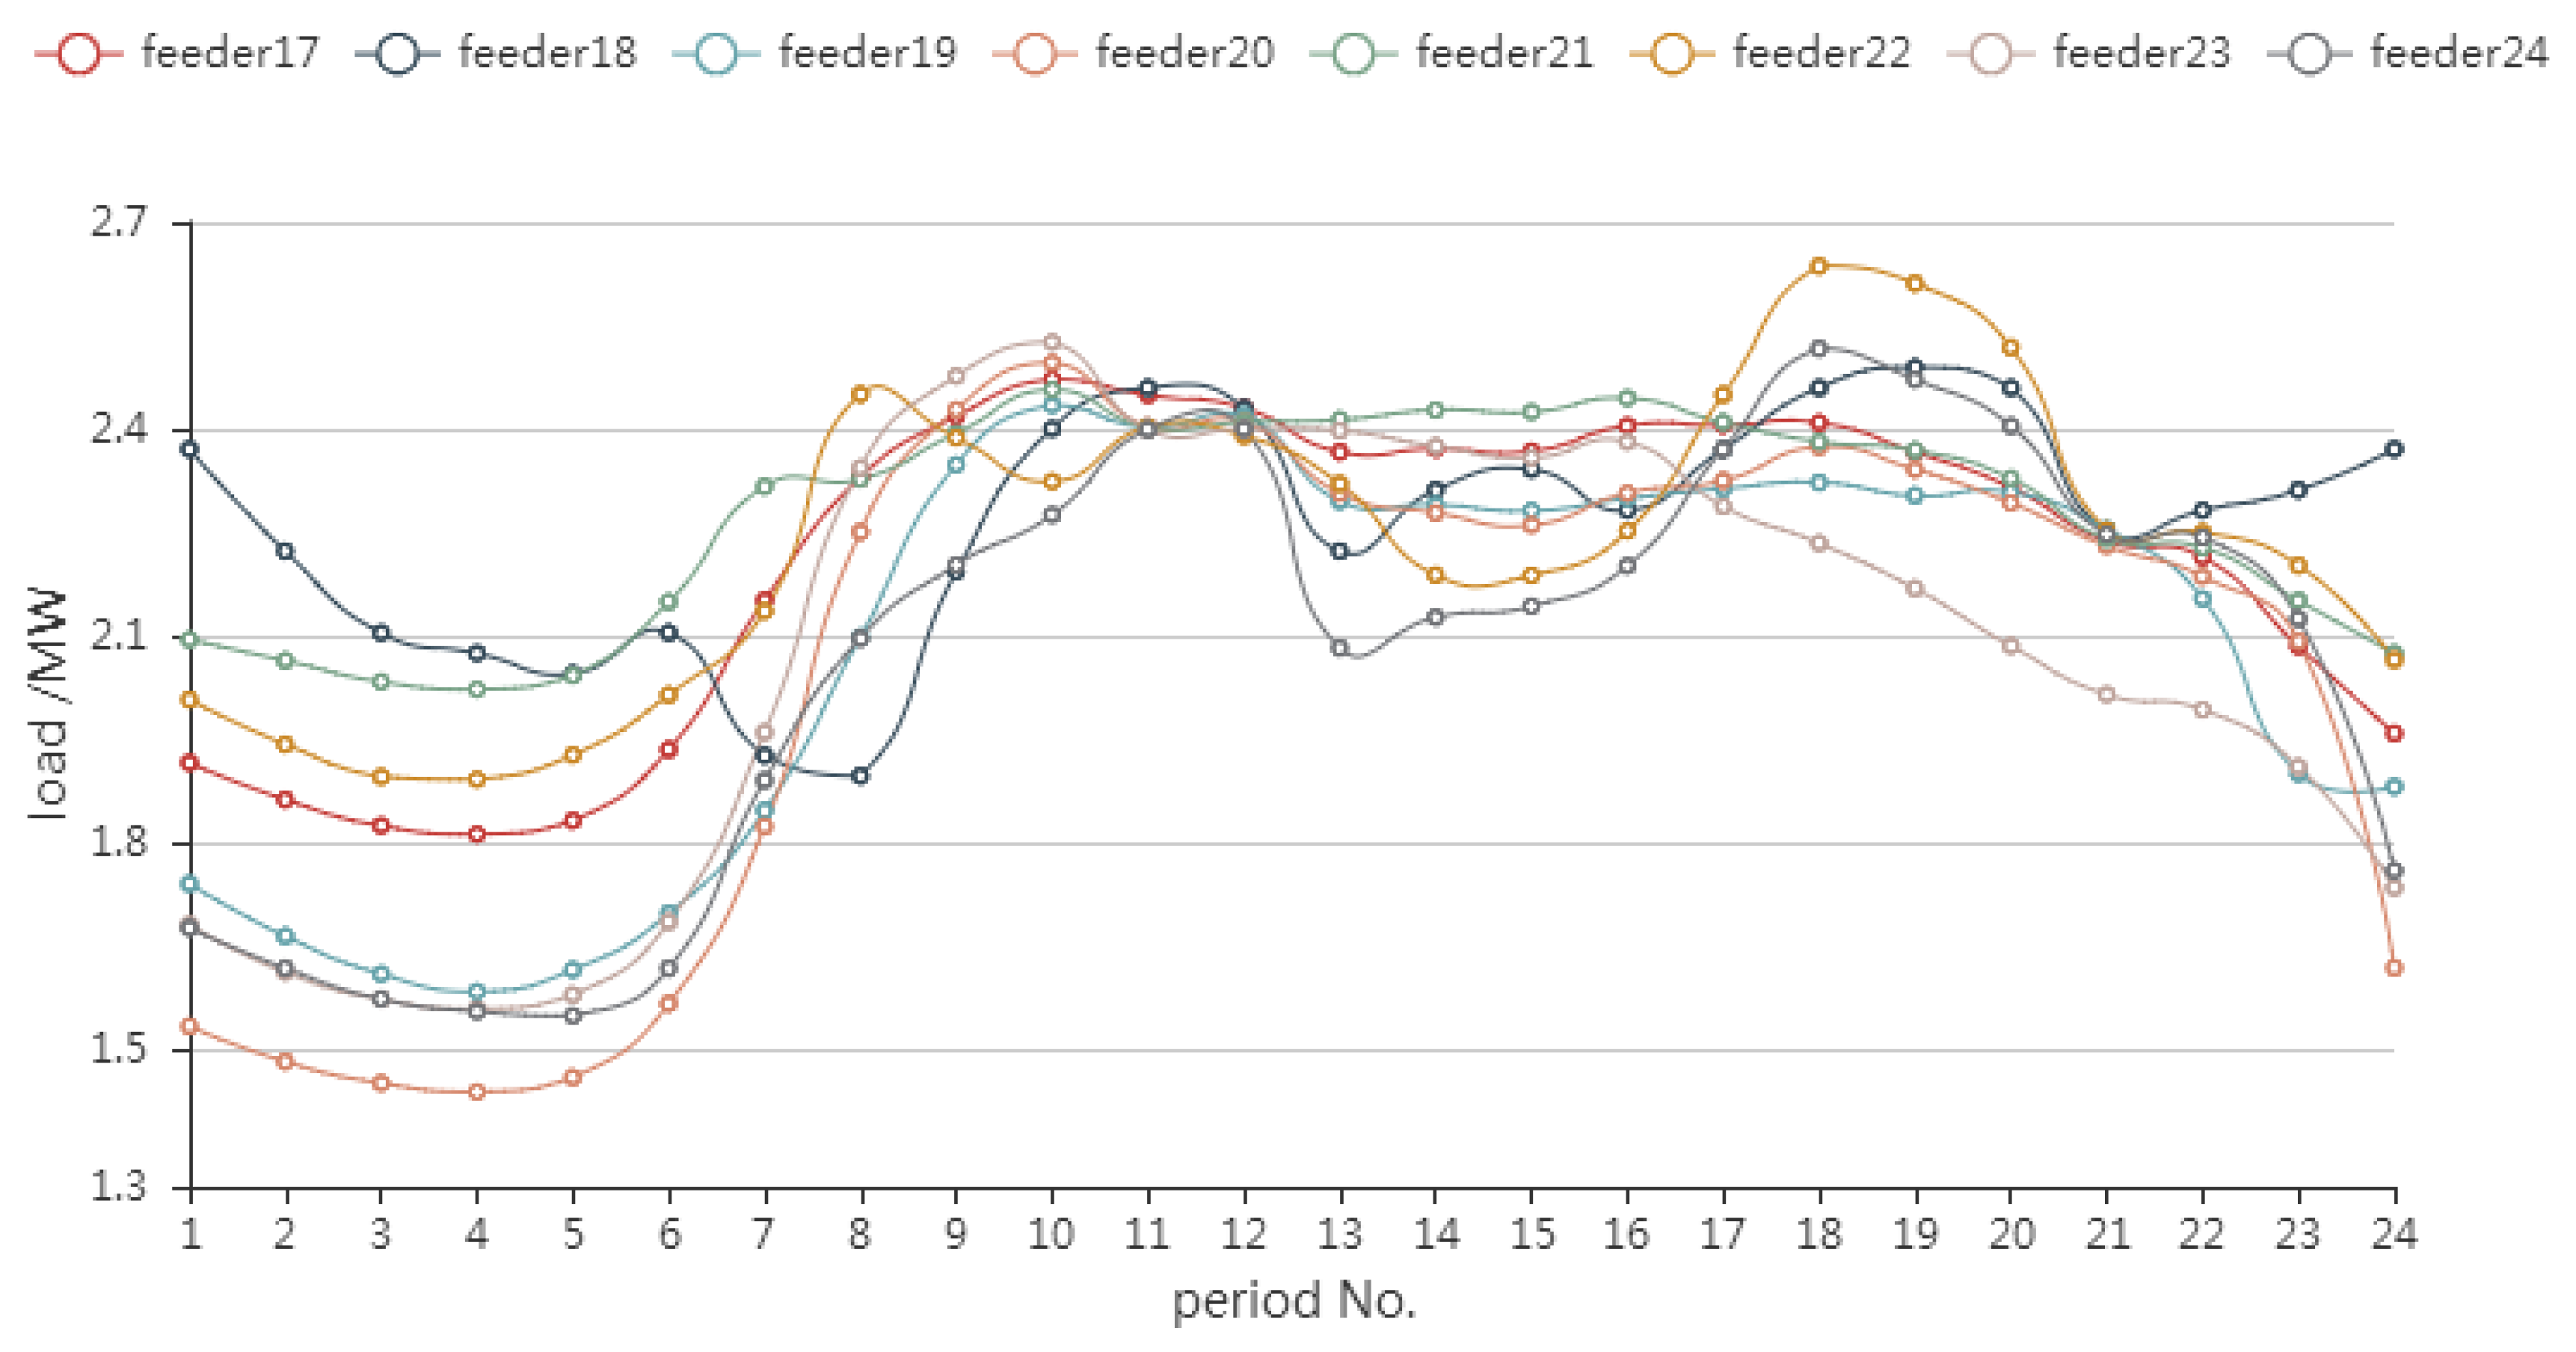
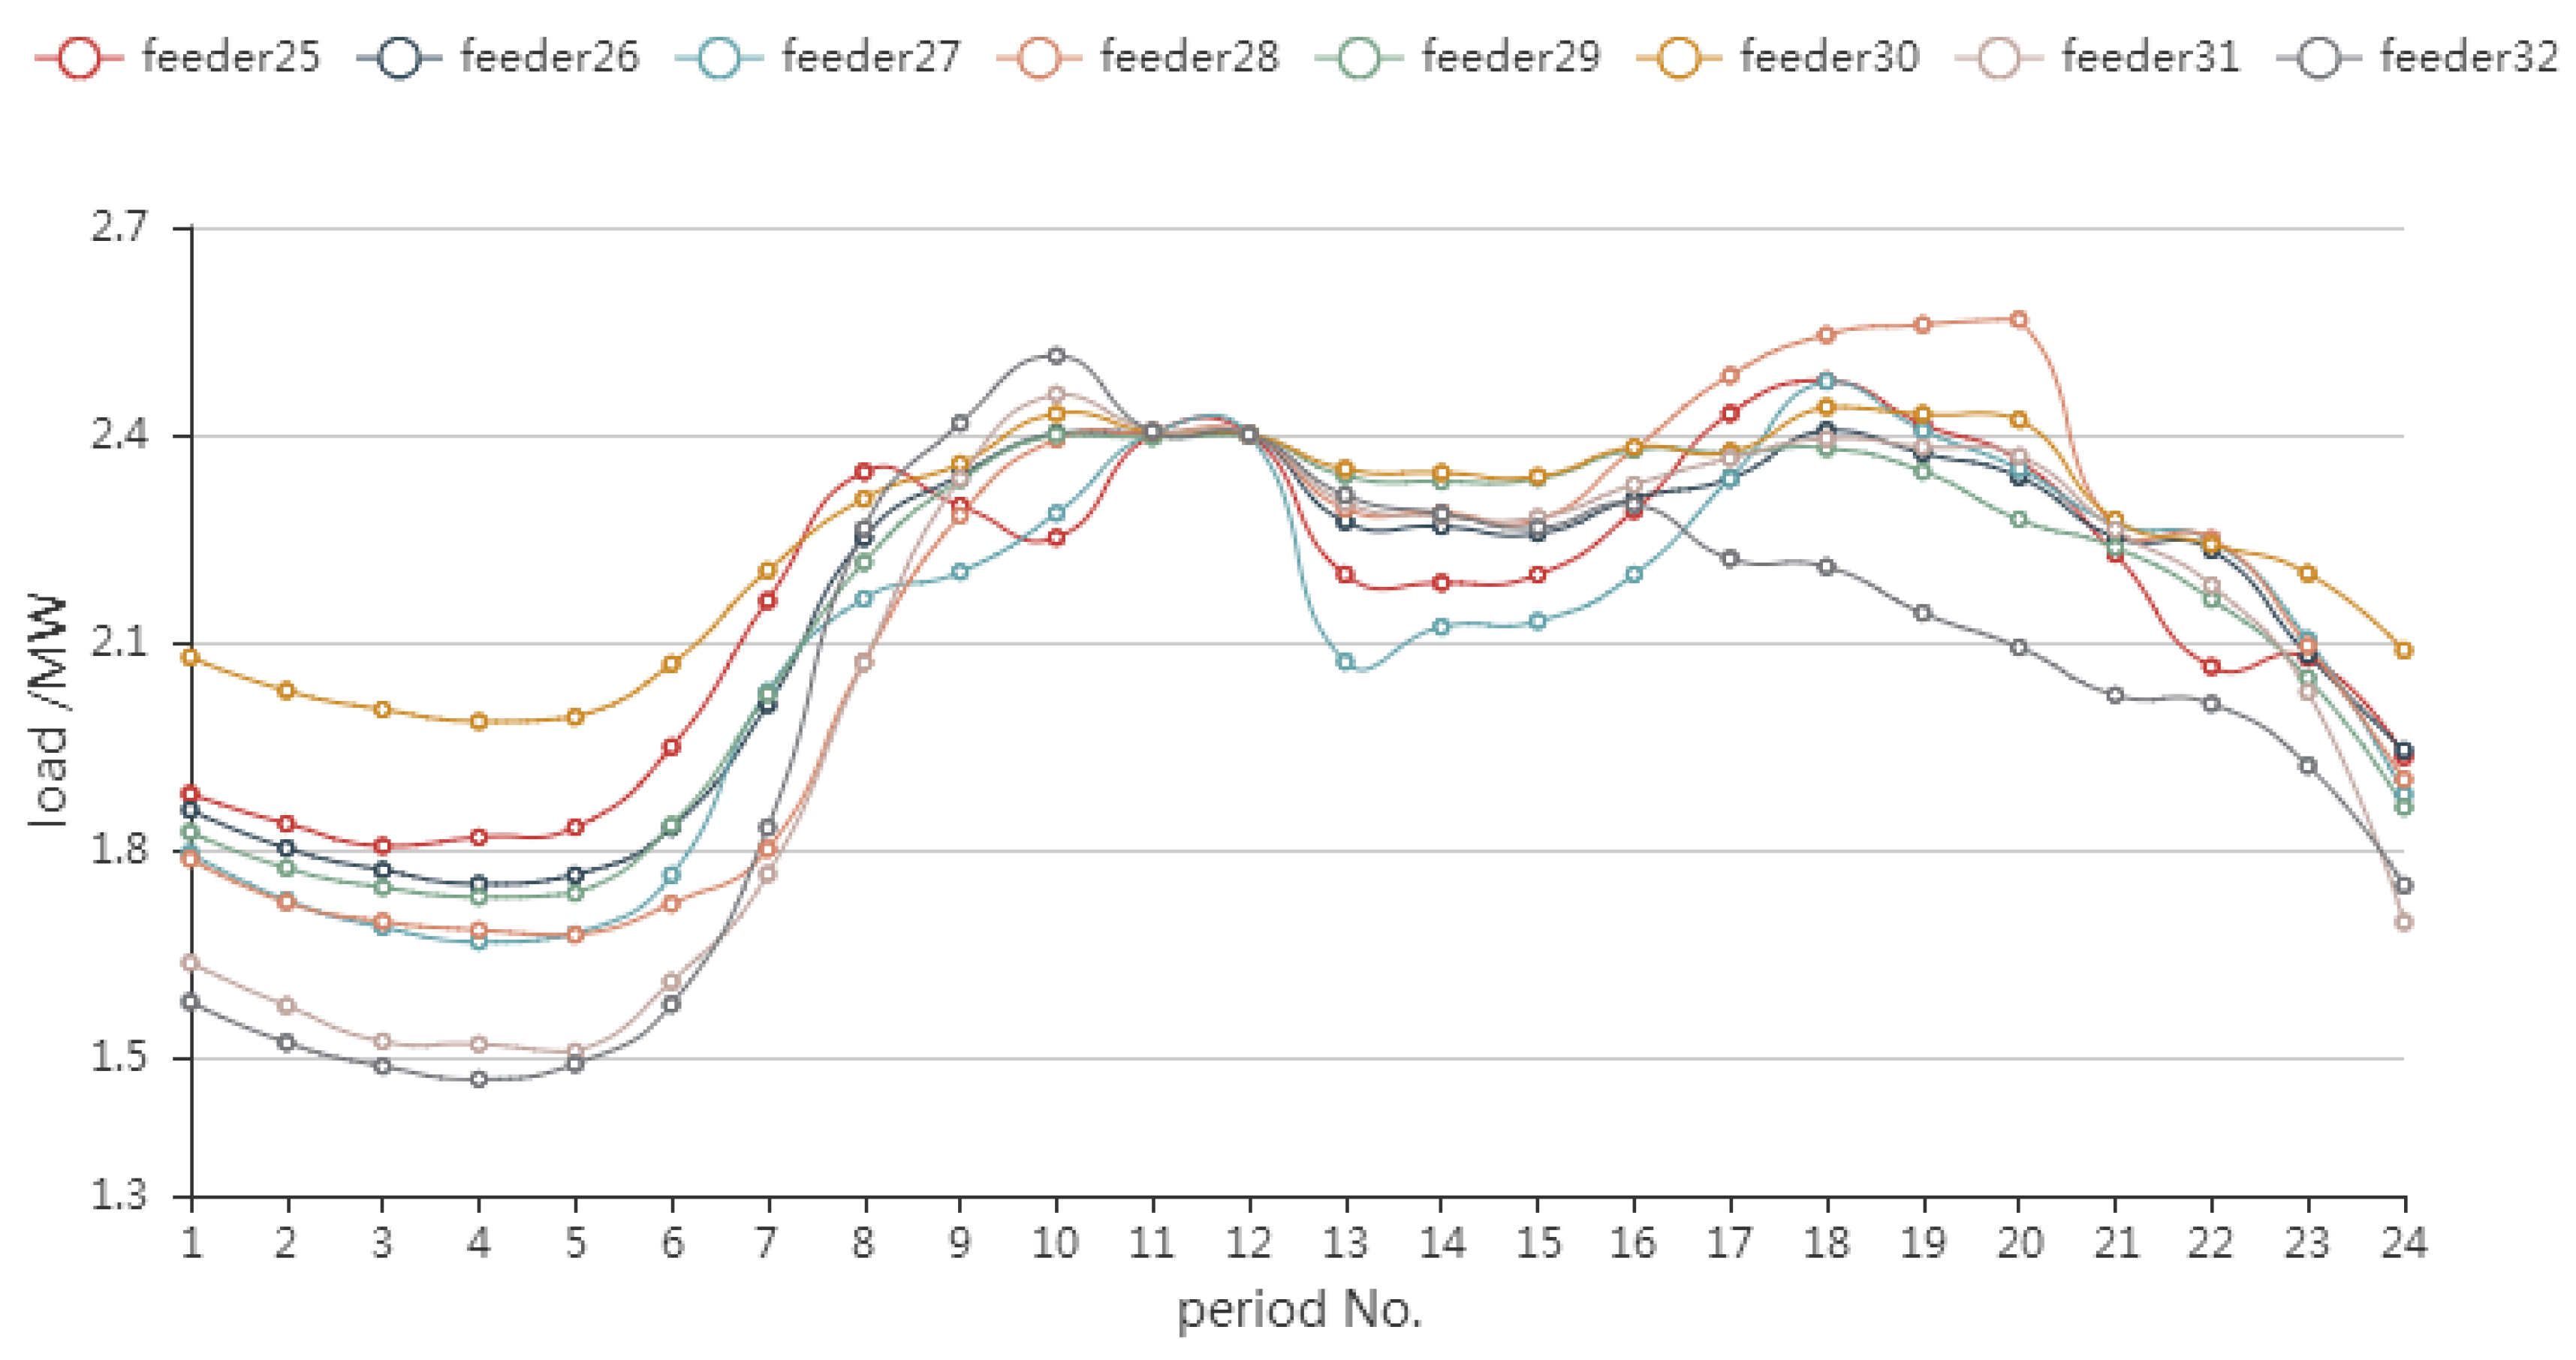
Taking each time period as the research object, the loads distribution data of 24 hours can be obtained, and each time period contains 3000 simulation data. On the basis of the existing loads of distribution network, which is quoted from real loads data of a distribution network, these data are substituted into the calculation of TSC. The real loads curves are shown as
Figure A1,
Figure A2,
Figure A3 and
Figure A4 in
Appendix A. The number of times that cannot be solved is counted. In other words, the number of times that the power supply capacity is insufficient in 3000 simulations is counted.
The results show that the value of PIC are zero for all the 24 periods, which means under Scenario 1 there is no risk of insufficient power supply capacity because the charging loads of EVs are not heavy for this distribution network at all.
6.2. Scenario 2
6.2.1. Calculation PIC of the Distribution Network
Under Scenario 2, assuming that the average parameters of the EVs are not improved and private cars, buses, and taxis with charging behavior/demand everyday are taken for 4400, 330, and 1650, respectively which are 10% more than Scenario 1. The physical parameters of EVs are showed in
Table 5 as below. The charging power values are set according to the average values in present practice as the same of Scenario 1.
Based on the above analysis, the spatial-temporal distribution of EVs in the distribution network is simulated, among 32 feeders and including 24 periods, as shown in
Figure 5 below.
In
Figure 5, the charging loads of EVs are higher around noon than in
Figure 4, because the quantities of buses and taxis with fast charging behavior increase during this period, and the charging loads increase slightly between 20:00 and 5:00 (the next day).
The PIC results are shown in
Table 6. The power supply capacity is mostly insufficient during the 11th, 12th, 13th, and 14th period, respectively. For the rest of the periods, the value of PIC are all 0.
The results show that after EVs integration, the distribution network has the risk of insufficient power supply capacity during the 11th, 12th, 13th, and 14th period under Scenario 2, among which the 12th and 13th period is more serious. The main reason is that a large number of buses and taxis are charged centrally at noon, resulting in a rapid increase in charging loads. Such a result is in accordance to the common sense qualitative and gives a quantitative evaluation of risk.
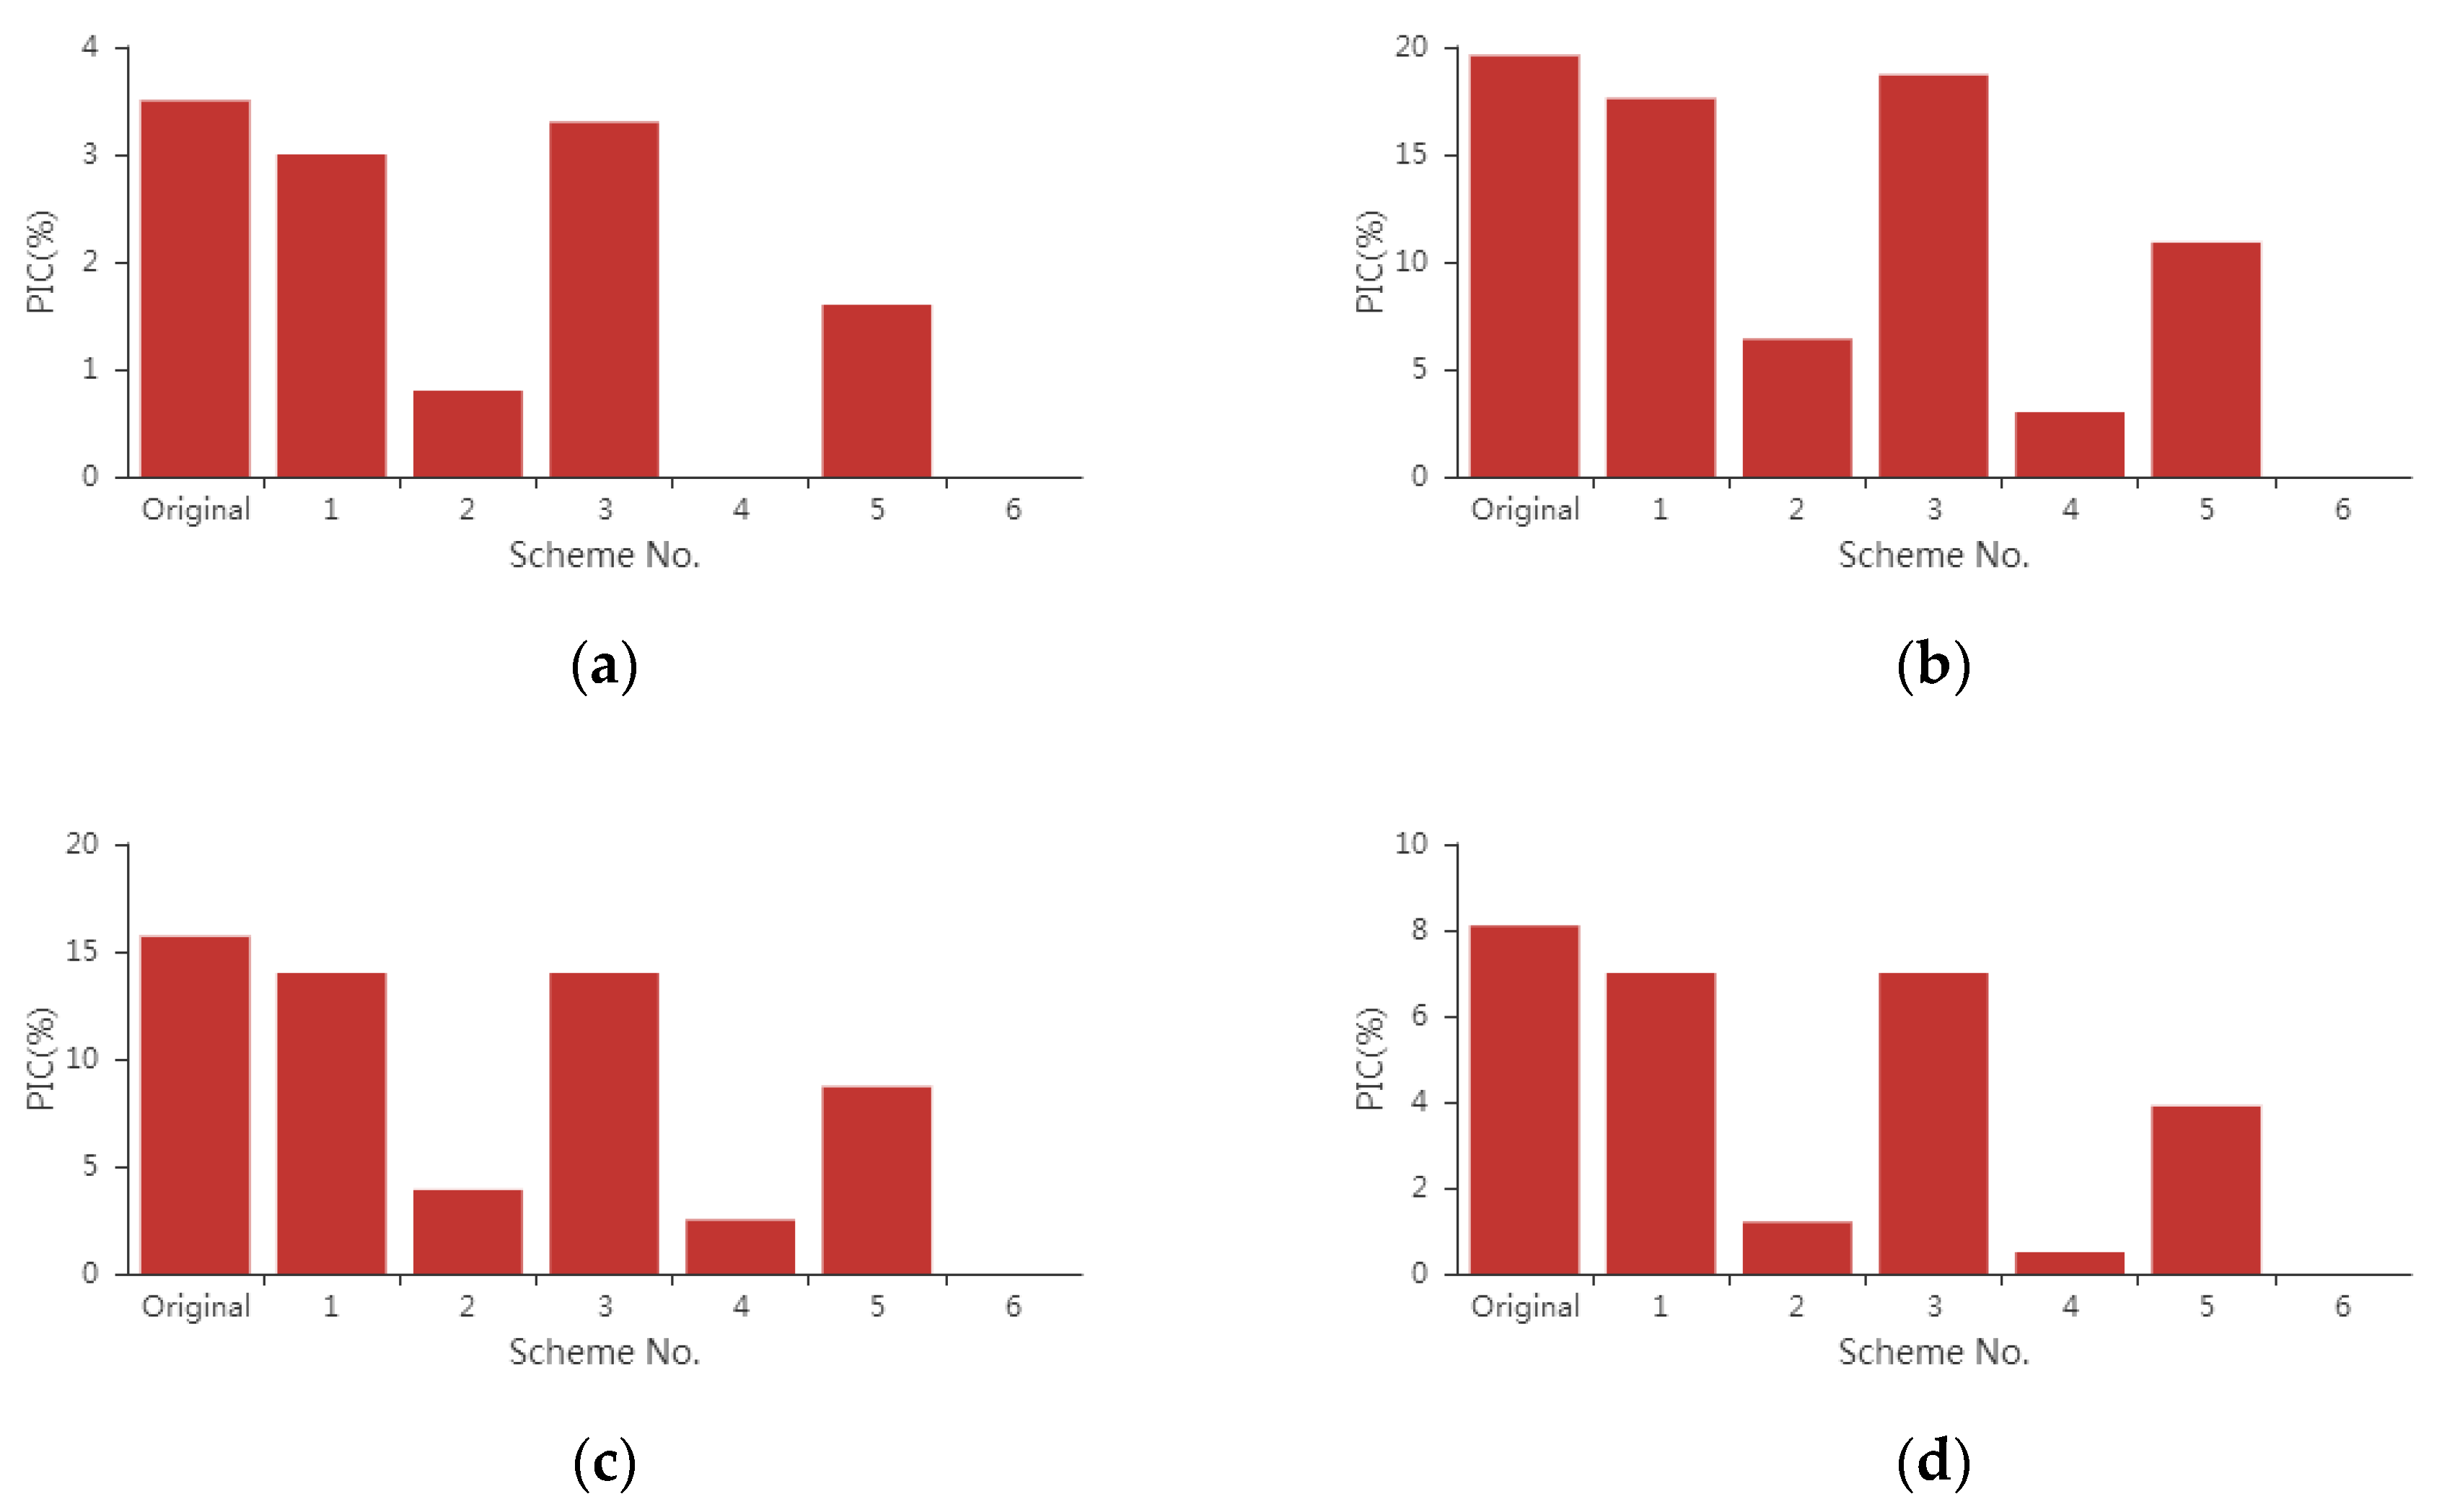
6.2.2. Improvement Measures to Reduce PIC
Above research shows that PIC exists during the 11th, 12th, 13th, and 14th period, accompanied by the risk of overload. The following six schemes will be adopted to improve the charging strategy of EVs.
Scheme 1: Reduce the slow charging power of private cars to 90%.
Scheme 2: Reduce the slow charging power of taxis to 90%.
Scheme 3: Reduce the charging limit for private cars with charging behavior to 95% of the total electricity during risk period.
Scheme 4: Reduce the charging limit for private cars with charging behavior to 95% of the total electricity during risk period, and to 90% for taxis with charging behavior.
Scheme 5: Reduce the slow charging power of private cars to 90%, and the charging limit for private cars with charging behavior to 90% of the total electricity during risk period.
Scheme 6: Reduce the slow charging power of private cars to 90%, and the charging limit for taxis with charging behavior to 90% of the total electricity during risk period.
According to the above scheme, the charging strategy is adjusted, the spatial-temporal distribution simulation of charging loads and the calculation of PIC are carried out. The final results are shown in
Figure 6.
After adopting the six schemes mentioned above, PIC during the 11th, 12th, 13th, and 14th period is reduced to a certain extent on the basis of the original scheme as can be seen in
Figure 6, and the risk of overload is improved.
Among the six schemes, schemes 2, 4, and 6 are involved in adjusting the charging behavior of the taxis.
Figure 6 shows that, PIC has changed markedly under these three schemes, while other schemes which only adjust private cars have little effect on the reduction of PIC. After reasonable speculation, charging loads during the risk period are greatly affected by taxis.
Results show that at the noon, the risk of insufficient power supply is caused by the fast charging loads of buses and taxis with high powers, but buses have the fixed departure times and routes, which are poor in flexibility for their fixed working time so that PIC can only be reduced by adjusting the charging behavior of taxis.
6.3. Scenario 3
6.3.1. Calculation PIC of the Distribution Network
Under Scenario 3, assuming that the charging parameters of the EVs are increased compared with Scenario 1, the charging power values are set according to the upper values in present practice, e.g., 32 A charging current limit for 220 V single phase charging according to China’s national standard GB/T 18487.1–2015. Besides, for the quick development of DC charging technology, the fast charging powers are set as comprehensive high values considering future development.
Private cars, buses and taxis with charging behavior/demand everyday are taken for 4000, 300, and 1500, as the same of Scenario 1. The physical parameters of EVs are set in
Table 7 as below.
Based on the above analysis, the spatial-temporal distribution of EVs in the distribution network is simulated, among 32 feeders and including 24 periods, as shown in
Figure 7 below.
The charging loads of EVs are relatively high around noon, because the quantities of buses and taxis with fast charging behavior increase during this period. The charging loads are also slightly higher after 20:00, because a large number of private cars charge during this period.
The results are shown in
Table 8, from which we can see that the power supply capacity is mostly insufficient during the 11th, 12th, 20th, and 21st period, respectively. For the rest of the periods, the value of PIC is 0.
The results show that the distribution network has the risk of insufficient power supply capacity during the 11th, 12th, 20th, and 21st period after EVs integration under Scenario 3, among which the 11th period is the most serious one.
6.3.2. Improvement Measures to Reduce PIC
Restricting Charging Power of EVs
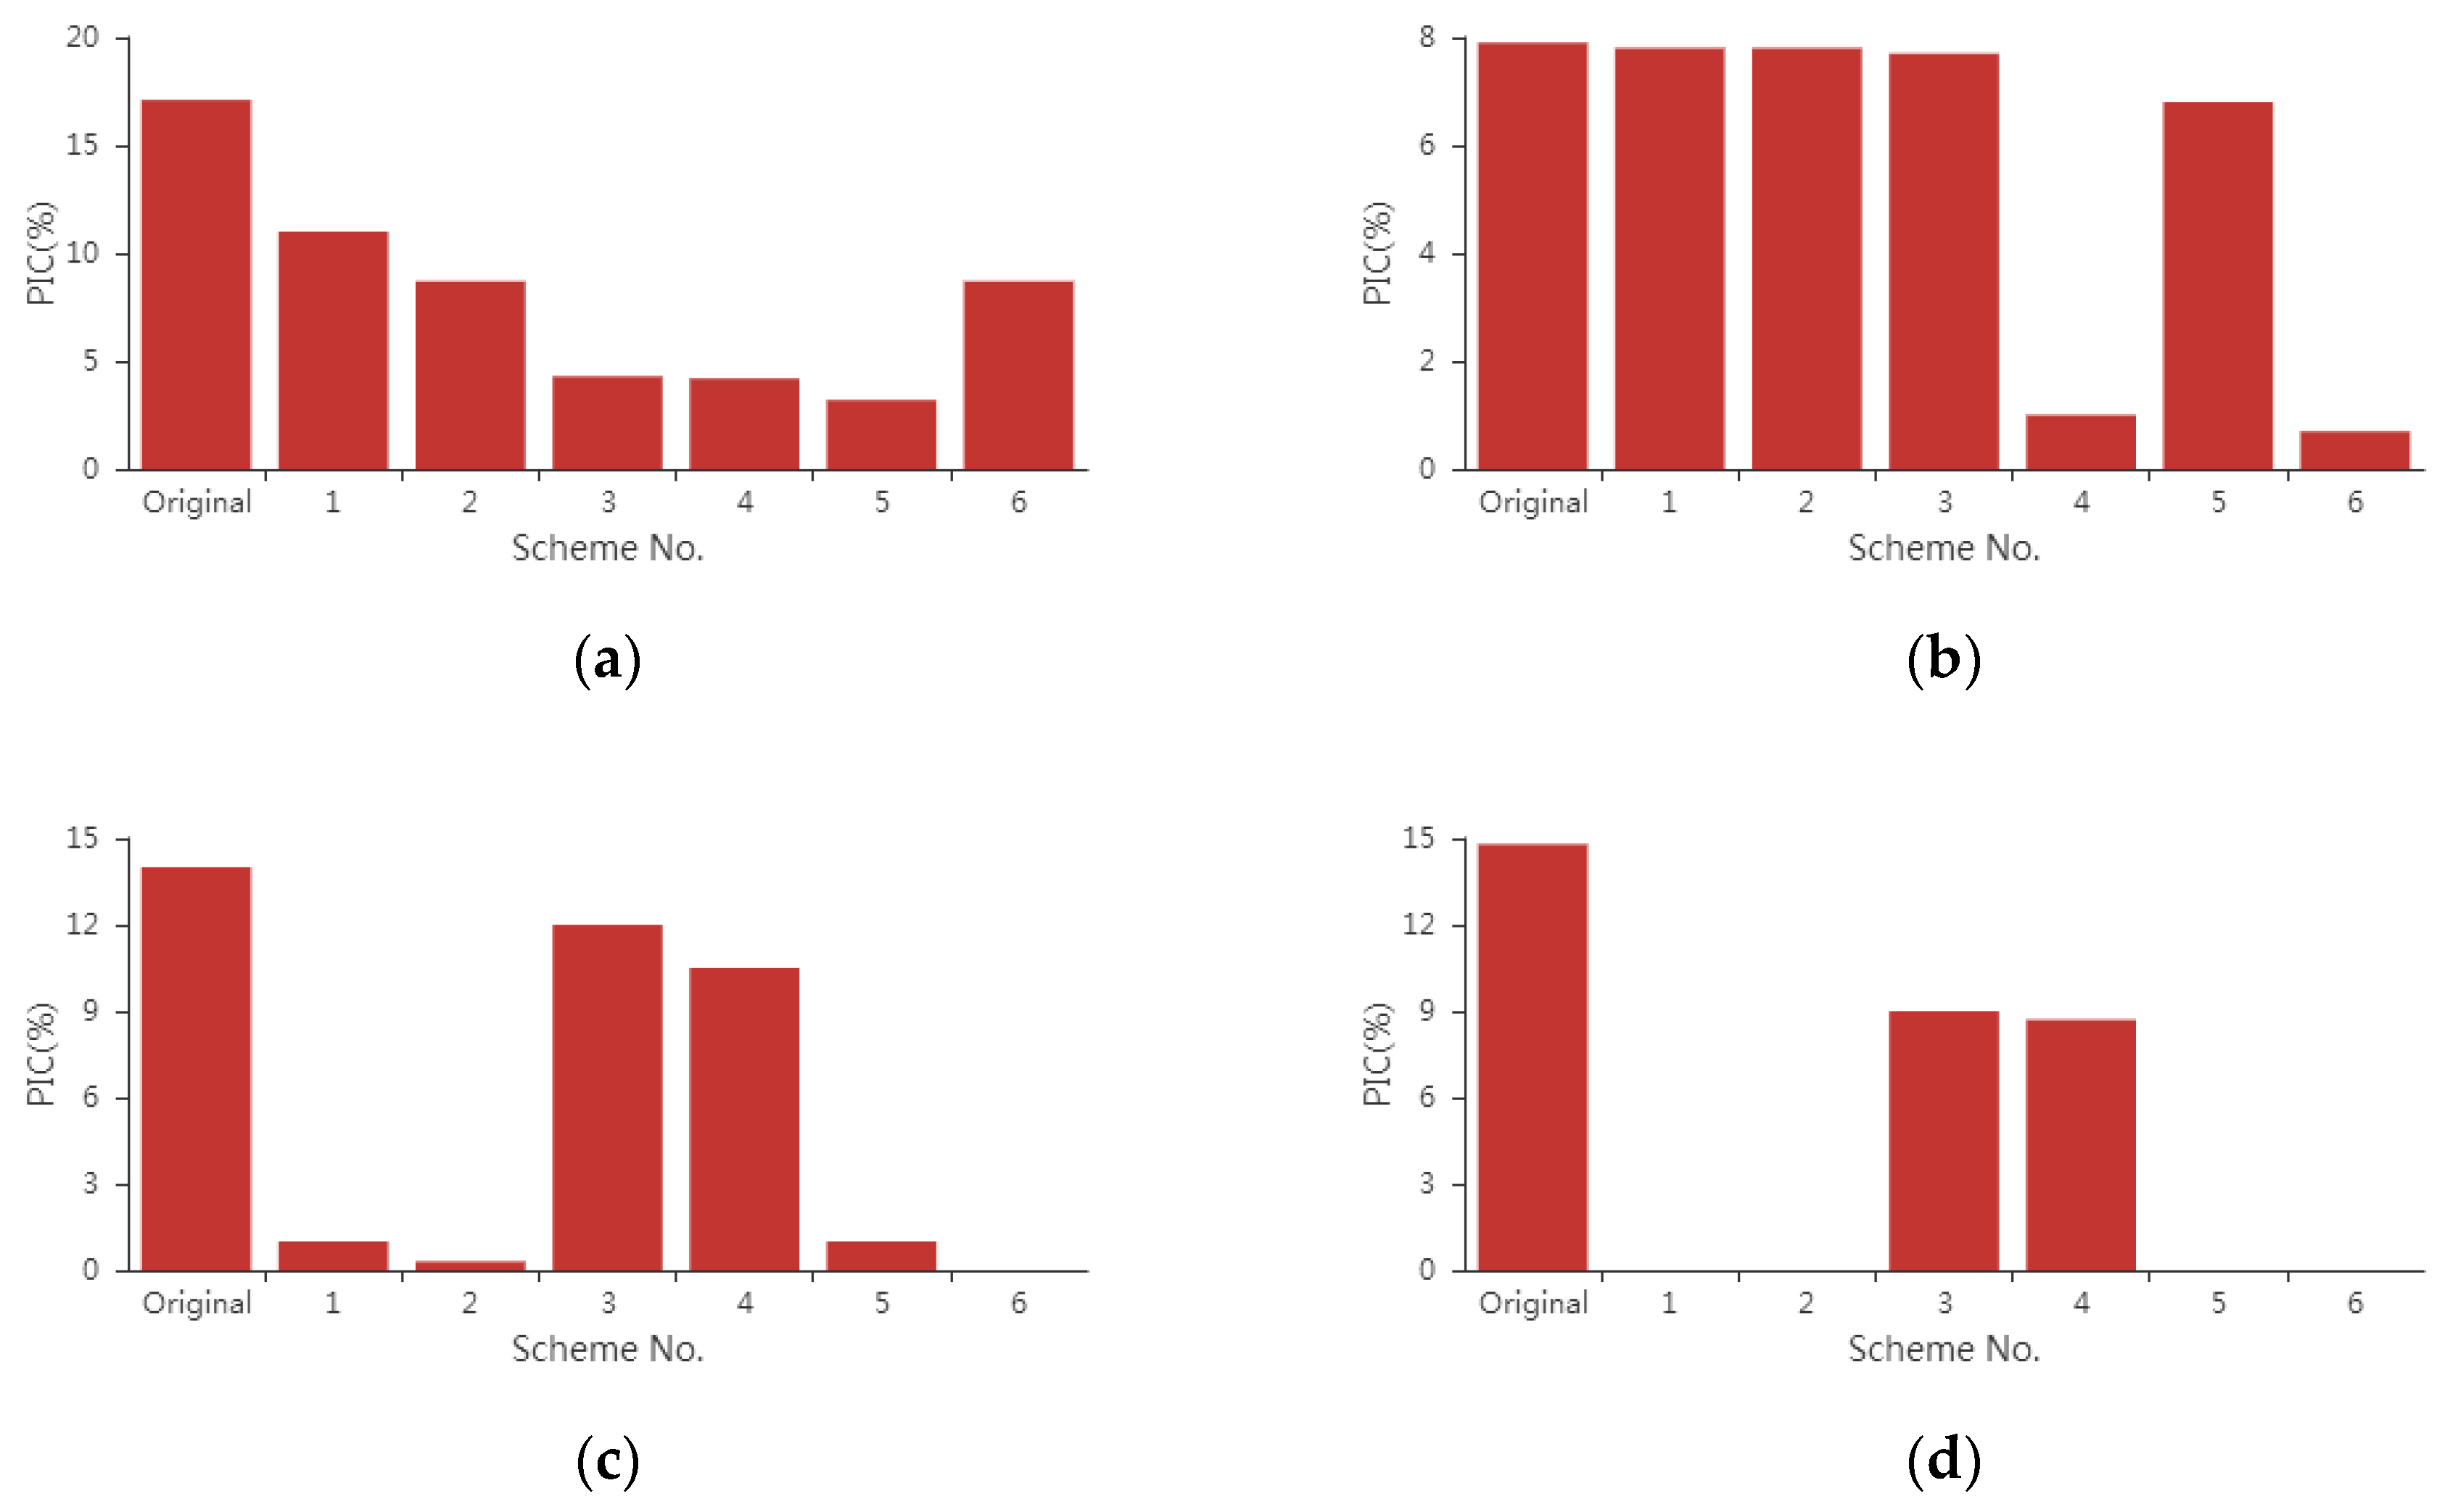
Above research shows that PIC exists during the 11th, 12th, 20th, and 21st period, accompanied by the risk of overload. The following six schemes will be adopted to improve the charging strategy of EVs which is slightly different from the schemes in Scenario 2.
Scheme 1: Reduce the slow charging power of private cars to 95%.
Scheme 2: Reduce the slow charging power of private cars to 90%.
Scheme 3: Reduce the charging limit for private cars with charging behavior to 95% of the total electricity during risk period.
Scheme 4: Reduce the charging limit for private cars with charging behavior to 95% of the total electricity during risk period, and to 90% for taxis with charging behavior.
Scheme 5: Reduce the slow charging power of private cars to 95%, and the charging limit for private cars with charging behavior to 95% of the total electricity during risk period.
Scheme 6: Reduce the slow charging power of private cars to 90%, and the charging limit for taxis with charging behavior to 90% of the total electricity during risk period.
According to the above scheme, the charging strategy is adjusted, the spatial-temporal distribution simulation of charging loads and the calculation of PIC are carried out. The final results are shown in
Figure 8.
After adopting the six schemes mentioned above, PIC during the 11th, 12th, 20th, and 21st period is reduced to a certain extent on the basis of the original scheme, and the risk of overload is improved.
The PIC of scheme 5 decreases mostly during the 11th period. Through comparison, it is found that the scheme is different from other schemes in that it adjusts the charging power and quantity of private cars at the same time. Therefore, the charging loads during 11th period are more affected by private cars, and taxis also have an impact on it.
Among the six schemes, only schemes 4 and 6 are involved in adjusting taxis charging behavior.
Figure 8b shows that PIC has changed markedly under these two schemes, while other schemes which only adjust private cars have little effect on the reduction of PIC. After reasonable speculation, charging loads during the 12th period are greatly affected by taxis.
In
Figure 8c,d, schemes 1, 2, 5, and 6 reduce PIC greatly, even assign the risk probability to 0. The deviation between these four schemes and schemes 3 and 4 is that they adjust the charging power. Therefore, charging loads during the 20th and 21st period are greatly affected by the charging power of private cars.
Results show that different targeted strategies are needed during different periods. Moreover, the times of insufficient power supply capacity cannot represent the degree of it, for example, during the 20th and 21st period PIC can be easily decreased but the PIC drop half on average during the 11th period, while the PIC during this periods of time are all mainly affected by private cars.
Controlling the Number of the EVs Charging Activities
The above experimental results show that risk during the 11th period is most affected by private cars, while during the 20th and 21st period by the charging power of private cars, and during the 12th period mainly by taxis. In order to advocate green and low-carbon, and alleviate the pressure of power supply capacity of distribution network, another improvement measure by controlling the charging quantity of private cars is proposed. In the original background, 4000 private cars are charged during a day, and thanks to this, reducing the number of private cars can also reduce the charging demands during risk periods.
It is found that the value of PIC drops steadily during the 11th period as the number of private cars decreases. Because of the influence of taxi charging behavior, its value during the 12th period is basically in a very small fluctuation range, which is about 8%, which is due to the randomness of the Monte Carlo method. PIC is basically reduced to zero during the 20th and 21st period, because there is a risk of insufficient power supply capacity, the degree of which is still light. Besides, it can also be proved from
Figure 8c,d that PIC can be easily reduced.
The specific values are shown in the
Table 9 as below.
During the 12th period, PIC is almost entirely affected by taxis. And the number of taxis also has an impact on the 11th period. In order to further alleviate the pressure of power supply capacity of distribution network, the number of taxis with charging behavior is also controlled, and in the original background, 1500 taxis are charged in one day.
As can been seen in
Figure 9, during the 11th and 12th period, after the number of taxis with charging behavior is limited, the PIC value is reduced to 0 at the same time. Therefore, the number of private cars with charging behavior should not exceed 3500, while 1200 for taxis in one day.
Furthermore, experimental results show that PIC risk can be totally eliminated by slightly reducing the number of private cars with charging behavior (e.g., 3990). The reason is that although PIC exists, the increase in TSC during both the periods is very low. With the less amount of private cars, albeit the charging power is not changed, the total electricity consumption is reduced, which is equivalent to limiting the charging power without changing the number of private cars.
7. Conclusions
Considering a massive number of EVs integrated into power distribution networks, this paper divides EVs into three kinds and simulates their charging loads via Monte Carlo method. Then, the simulated loads are added to the conventional TSC calculation model so that a modified TSC calculation model can be proposed. After that, a PIC index which can evaluate the probability of power supply capability insufficiency quantitatively is proposed. Furthermore, several improvement measures those can reduce the PIC is proposed. Finally, example illustrations on a practical distribution network are made and the effectiveness of the evaluation model and improvement measures is verified.
Results show that, because of the strong randomness of EV charging loads, both in time and space, the effect to power supply capability of a distribution network cannot be evaluated using a certainty index. Instead, a probabilistic index can evaluate the possible risk quantitatively. Quantitative analysis shows that risk periods are most likely to appear during noon. To reduce such risks, some measures from management side, such as restricting charging power, controlling charging quantity, can be effective rather than hardware upgrade. Thus, more EVs can be integrated safely with committed charging behaviors, especially during risk periods such as 11:00–14:00 and 20:00–21:00.
Various factors affect the power supply capability of a distribution network. Distributed generation, energy storage, and other measures can be further studied.


