1. Introduction
According to the National Oceanic and Atmospheric Administration (NOAA), insurance companies receive thousands of claims every year due to catastrophes produced by lightning storms (
https://www.ncdc.noaa.gov/billions/events (Visited on 28 September 2019)). Lightning damage occurs at small scales, most of the time affecting only a few individuals or buildings at a time [
1]. For that reason, it is well-known that such events are under-reported. In fact, statistics from the NOAA are based on extrapolations from small individual lightning-damage insurance claims. Annual losses are estimated to be about 300 million USD in the USA, with 300,000 lightning-related insurance claims, mainly related to lightning over-voltages, personal injuries, and deaths [
2]. In the United States, there is an average of 0.42 lightning deaths per million people every year. As an example, damage related to adverse atmospheric phenomena in 1992–1994 annually caused about 40 deaths and 700 injuries, and overall resulted in 400 million USD in losses. Only taking into account documented cases, between 1967 and 2010 there were close to 2000 deaths in India, and there were 132 in Brazil during 2009–2010 [
1]. Lightning detection is commercially relevant for insurance companies, and relevant when the information about the location of lightning flashes can be used to prevent injuries or to address prevention activities to diminish the damage, mainly for electrical utilities. It is also relevant to forest administration, because the impact of forest fires may be diminished if strike points can be found or predicted quickly beforehand [
3,
4]. Additionally, the high frequency with which planes fly through storms jeopardizes the life of passengers and crew. This is one of the most common causes of plane crashes. For instance, among the most alarming documented accidents are the flight Lockheed L-188A Electra in Peru in which more than 90 people died, or the Boeing 707-121 flight in the USA in which there were more than 80 victims. Another case in which lightnings produce fatal injuries is in wind farms (renewable energy companies), which suffer millions of dollars in losses due to windmills impacted by lightning, making them unusable.
At present, real-time lightning location is extremely important for the prevention of risk in workers doing maintenance operations in wind farms, high-voltage power lines, and as we have explained before, for airline companies. In particular, such companies can make use of these data before, during, and after flights. Before taking off, they could use it to plan a safe route. During the trip, planes use their weather station to avoid unexpected events. However, these may not detect cumulus clouds where they could run into lightning storms. For this reason, they use the information provided by lightning detection networks (LDNs). Lightning can also be very dangerous for operations inside the airport, such as refueling or aircraft maintenance, and detection is important for air traffic control to coordinate planes in order to avoid risky zones.
A significant challenge associated with lightning storms is the random nature of the exact geographic zone where thunder and lightning strike. Currently, there is a lack of tools to be able to measure and detect such affected geographic areas. As a result, emergency services are completely disoriented when lightning storms occur due to this lack of capabilities to detect the geographic region affected. Thus, their effectiveness is consequently significantly reduced. The response time of emergency services is critical to save lives and economic costs caused by injuries, fires, electrical short-circuits, et cetera.
Thus, the main aim of this research work was to produce an effective Internet of Things (IoT) network that is able, for the first time ever, not only to detect the lightning strikes occurring within the coverage area of a given IoT sensor, but also to geo-localize the geographic area where they have happened, with the main purpose of providing emergency services, insurance companies, and other search and rescue teams with innovative context-aware information to help improve their effectiveness. The architecture has been designed, prototyped and validated in both the lab environment and also in Valencia city and its surroundings.
This paper is organized as follows: the next section provides an introduction to the state of the art, focusing on the problem and the existing approaches. Then, a Materials and Methods section explaining how the project has been carried out is presented. Later, the tests and validation performed to detect and locate lightning on a stormy day are explained. Finally, a conclusion section is given to explain and justify the achievements of this work.
2. State of the Art
There are two clear sources of information available to provide information about real-time lightning strikes: either commercial IoT devices to can be deployed to create a private IoT sensor network, or commercial devices can be used in governmental IoT sensor networks that release data sets providing regional (country scale) or global information. Regional data sets provide information at the scale of a region or a country, for example, AEMET (Agencia Española de Meteorologia—Spanish Meteorological Agency) provides information in Spain. Analogously, the World Wide Lightning Location Network (WWLLN) [
5] provides data at global scale. These data sets usually provide information about the location, intensity, type, and polarity of lightning strikes. The following subsections explain these IoT sensor networks.
2.1. Operating Principles of Lightning Location Networks
Lightning location networks of sensors detect electromagnetic pulses emitted by lightnings and use power and distance data to locate them. Presently, there are two types of lightning location sensors for commercial use. On one hand are sensors that use the direction of the electromagnetic field received and the time required for the electromagnetic wave to arrive at sensors—this is known as time of group arrival (TOGA). On the other hand, sensors that scan higher frequencies when receiving an electromagnetic pulse in order to avoid detecting false strikes due to ionospheric rebounds. Strikes can be very easily detected in high frequencies from thousands of kilometers. In addition, it is worth mentioning that there are many lightning detection networks already being implemented with open-source data, both at regional and global scales.
2.2. Regional Networks
The Agencia Española de Meteorología (AEMET) lightning detection network (LDN) is similar to the USA National Lightning Detection Network (NLDN), the Canadian network (CLDN), and other networks having the same types of receivers (i.e., IMPACT 141T and IMPACT ES) [
3,
6,
7]. The AEMET network is combined with the IPMA network (Instituto Português do Mar e da Atmosfera) that operates in Portugal to provide global coverage in the Iberian Peninsula. The AEMET network uses 14 sensors and the IPMA network uses 4 sensors [
8]. The detection efficiency (DE) of the combined AEMET–IPMA network in the Iberian Peninsula is greater than 90% for lightning strikes greater than 5 kA [
8,
9], with accuracy much smaller than 0.5 km.
The objective of the AEMET–IPMA combined IoT network is the detection of cloud–ground (CG) flashes. The intra-cloud (IC) flashes are discarded in the post-processing of the data of the received signal; however, some strong IC flashes are included because of the processing system limitations, as occurs in NLDN and CLDN [
10,
11]. Thus, there is no absolute certainty about 100% of CG flashes, and a small percentage of IC flashes cannot be filtered out and are included in the AEMET–IPMA data. The flash information is available with 1 ms time resolution and with the peak current of the first strike assigned to the flash. The detection is carried out using both time-of-arrival and direction information through Improved Accuracy through Combined Technology (IMPACT), working with broadband signals between 1 kHz and 1 MHz.
2.3. Global Networks
The World Wide Lightning Location Network (WWLLN) is a ground-based lightning location network with global coverage that began operations in 2004. The WWLLN is operated by the University of Washington (USA) and the University of Otago (New Zealand). The network was deployed with the objective of achieving the detection of lightning strikes occurring anywhere in the world with a location accuracy better than 10 km [
12,
13,
14,
15,
16,
17]. The WWLLN stations are typically deployed at distances around 5000–15,000 km. These stations operate VLF (very low frequency) receivers that detect the emissions of lightning in the VLF band, which are wave packets propagating in the region between the ground and the lower ionosphere. These wave packets propagate in waveguide modes (TE, TM, or TEM) very similar to a parallel-plate waveguide, with frequencies between 1 and 20 kHz. The position of the ray in any network is obtained by simple triangulation, where it is very important to precisely determine the time of arrival of the signal from the point of fall of the lightning strike to each receiver.
The WWLLN is made up of more than 70 stations throughout the world. The whole network uses the TOGA method to estimate the location of each strike. However, this network has a spatial error of 5 km and a temporal error of 10 ms [
12,
18,
19]. Each strike needs the time of at least 5 sensors to be located by the network. These can be thousands of km away from the impact zone.
Because the Earth is round, every area of lightning impact is surrounded by stations, but not every sensor detects every strike. If lightning is produced in an area surrounded by stations which detect it, then it will receive a more precise location than another strike detected by fewer sensors. That is why the geographical distribution of sensors is very important. Only between 15% and 30% of the electrical discharges are detected by five or more detectors, mainly by the ones which emit higher radiation. The most recent research estimates that the location is only efficient for intensities of 30 kA or more (30% of all lightning strikes). To cover the whole planet with uniformly spaced sensors (around 1000 km of separation), around 500 nodes would be needed. For a separation of 3000 km, only around 60 would be necessary. Currently, this network is still under development.
Figure 1 shows the location of the stations composing the WWLLN, in chronological order until 2012.
Blitzortung is another world-wide non-commercial LDN that works thanks to a community of volunteers, mostly operating in Europe. People who provide data to the platform are allowed to use all the raw data for non-profit purposes, but if a station stops sending information, the user stops receiving reports. At present, the network is made up of more than 500 sensors. All of them work processing at VLF frequencies, from 3 to 30 kHz, with a sampling rate of 500 kHz, meaning that they record 1 ms of each detection and have an average delay of 3 to 20 s depending on the congestion of the network.
Figure 2 shows the sites where Blitzortung stations are located in Europe. This map was extracted directly from the user interface of the mentioned platform. Although only Europe is shown here, it must be stressed that there are more stations in the USA and China.
The same Blitzortung community has developed a receiver and gives volunteers the opportunity to buy each station for around €200; they cannot provide the data of other sources. It consists of a kind of amplifying and filtering circuit that processes and sends data by itself to the central station. This receiver can detect information up to thousands kilometers away, but only if propagation conditions and the energy of the strikes are suitable. All the lightning IoT networks that provide data sets publicly are based on expensive equipment that are in the ranges of of thousands of euros. In fact, in 2013 the final report of a large European consortium created to achieve a low-cost device to localize lightning strikes indicated as a main achievement the ability to detect them with less than 5900 EUR5. Thus, this Blitzortung sensor is probably the most cost-effective solution up to date with 200 EUR. However, this is far beyond the budget that is considered reasonable for an IoT device.
The main motivation and achievement of this project has been focused on reducing the price required to implement an IoT system that is able to perform a comparable level of accuracy with respect to the already existing network with a significant reduction on the capitals of the IoT system.
3. Materials and Methods
The key in the control of the low-cost budget resides on the integrated circuit (IC) used to develop the lightning detection system, based on the AS3935 lightning sensor. These IoT devices send information to a FIWARE-based [
20] monitoring architecture that is in charge of collecting and processing the information.
3.1. Integrated Circuit AS3935
The AS3935 from AustriaMicroSystems (AMS) is the first programmable IC able to detect and analyze the electrical activity of the atmosphere and estimate the distance to the position where lightning has been generated during a storm. This is possible thanks to the embedded algorithm that is even able to reject electromagnetic noise from its measures.
The communication of the sensor can be made both with Serial Peripheral Interface (SPI) and Inter-Integrated Circuits (IC). The features of this sensor are critical for the definition of a low-cost lightning detection system. A brief revision of the characteristics of the sensor can be summarized as follows:
Detection of both intra-cloud and cloud–ground lightning.
Detection of electromagnetic noise and rejection of these measures.
Allows the designer to establish a threshold between electromagnetic interference and strikes.
Allows communications both via SPI and IC.
Supply between 2.4 and 5.5 V.
Three states: off, low-energy, and active.
16LD-MLPQ encapsulation
The watchdog allows the continuous monitoring of signals that are inserted from the analog front-end (AFE). This is a functional block in charge of amplifying and demodulating the received signal. See
Figure 3 in order to localize the functional block. The AFE allows an active validation to be performed when the signal is passing a certain defined threshold and then the AS3935 sensor gives statistical estimations of the distance to the lightning. Distance is evaluated in the register 0x07 (containing 6 bits), which gives approximately a 2 km resolution.
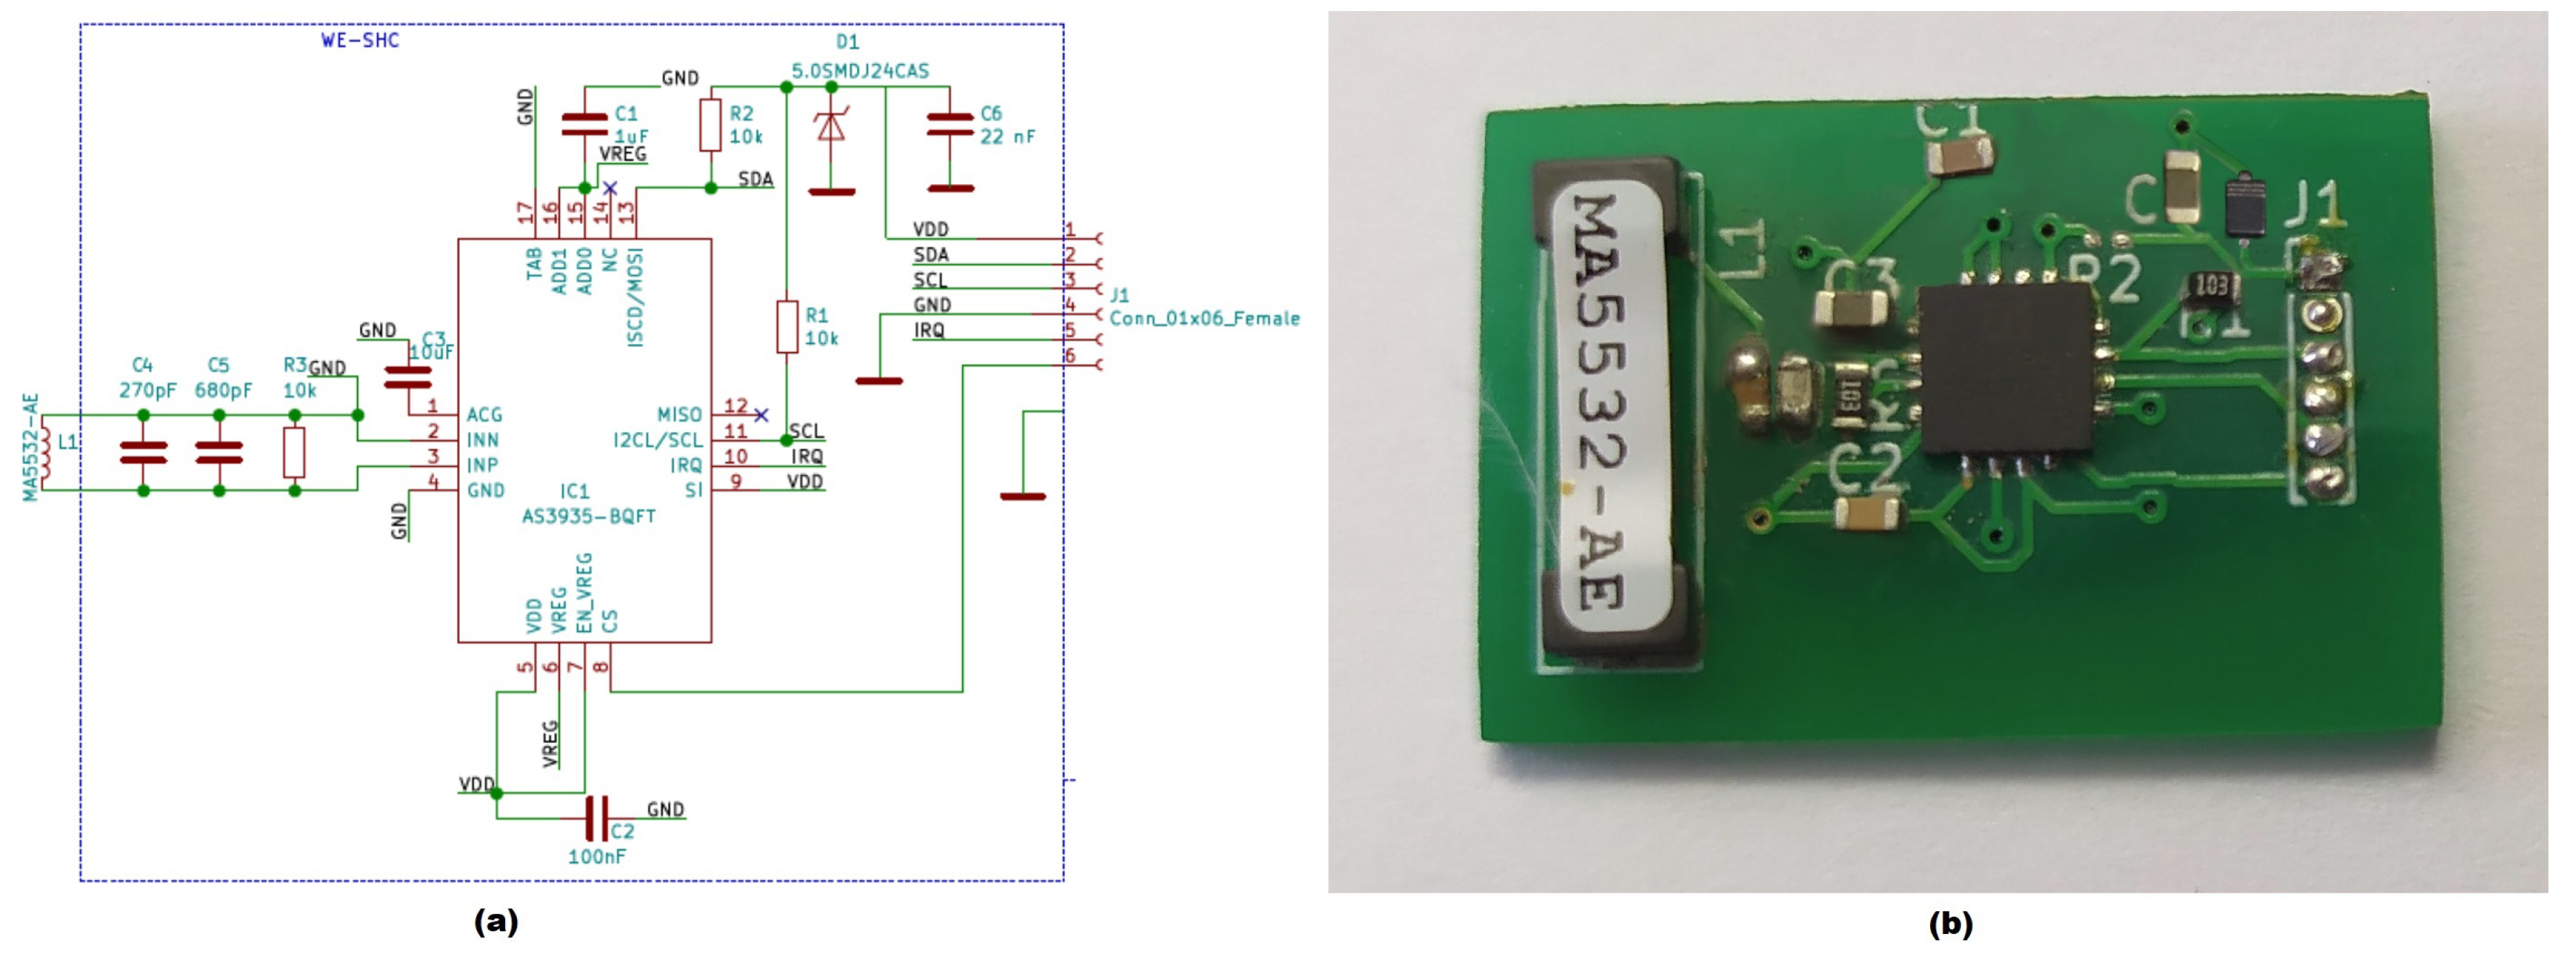
Figure 3 presents a block diagram of the operating principles of the IC AS3935. The printed circuit board (PCB) shown in
Figure 4 has been designed using kiCAD EDA (
http://www.kicad-pcb.org/ [Online] (Visited on 7 November 2019)) and printed. Both SPI and I2C interfaces were wired and all the balance in the resistance has been done. Our designs are slightly different in the sense that a low-layer PCB has been designed with the main idea of reducing the area required to deploy the sensor to a minimum. They are shown in
Figure 4b.
The AS3935 makes use of narrow-band receiving techniques with a center frequency of 500 kHz and a bandwidth of 33 kHz. For this reason, the antenna circuit has to be more sensible around this value by designing it to have a resonance frequency around 500 kHz. A variation of
kHz can be solved by tuning later. To achieve this requirement, the two antennas specified in
Table 1 were considered.
Although both of them have an inductance of 100
H in common, the MA5532-AE was chosen because it is more affordable. The design of the antenna’s circuit was done using the following formula to calculate the parallel capacitor:
where
and
L are known, 500 kHz and 100
H, and
has to be calculated by solving the equation shown below:
The calculated value for was 1 nF achieved with two capacitors of 270 pF and 680 pF. Finally, the Q-factor of the antenna was fixed at 15 with a 10 k resistor in parallel.
The cost of the node and the information system was computed considering the price of all the electronic components, apart from the IC AS3935. The PCB was elaborated taking into account EMC shielding criteria, by using a metallic enclosure in order to avoid other sources of electromagnetic noise. To filter the DC component, which can distort the signal, we added capacitors C5 and C6 in the circuit (see the schematic in
Figure 4). The metallic box (cabinet WE-SHC) connected to ground allowed a reduction of electromagnetic noise in the circuit, allowing a lower failure rate in detection. In order to do avoid affecting the performance of the detection, the MA-5532-AE electronic component was left outside of the protection of the metallic box.
The cost of the PCB and all its components is around 10 EUR. The PCB was directly connected to a Raspberry Pi 3 which costs another 30 EUR plus an additional SD Card, an outside box and a power supply (40 EUR). The final device has a final cost of 80 EUR.
The connection was done using the GPIO of the Raspberry Pi 3 in order to get serial access to the IC AS3935, and a software daemon implemented in Python performs periodic reads from such interfaces and publishes them in an AMPQ message bus. This message bus is used to deliver the information to the IoT information collection systems. As mentioned previously, the AS3935 is the only commercialized IC for lightning detection.
These specifications allow the design of a set of components to tune the frequency attending to the RLC circuit described as MA5532-AE and connection circuitry in
Figure 4. Attending to the output signal of the analog front-end (AFE), the noise floor level is determined and compared to a reference voltage known as the noise threshold. If this noise threshold is surpassed, the IC launches an interruption to inform the Raspberry Pi about a misoperation due to high input noise received in the antenna.
This threshold is established in bits 6:4 of register 0x01 of the IC. Then, a logic lightning algorithm is launched. This algorithm consists of three steps: (1) signal validation, (2) energy calculation, and (3) statistical signal estimation.
3.2. IoT Information Collection System: FIWARE Platform
This IoT network needs to run continuously, year-round, without interruption. Thus, an IoT platform was selected to collect information. In our case, it was decided to make use of FIWARE [
20], an open-source IoT monitoring dashboard that performs well for the purpose due to its versatility and possibilities of developing different types of systems depending on our requirements.
FIWARE is a open framework to develop Internet of Things (IoT) applications as well as support smart and context-aware behavior through the real-time processing of data at large scale and the analysis of big data. It was developed in the context of a FP7 European project led by Telefonica, IBM, and Thales, which also allowed the establishment of some ad-hoc standards to facilitate the development of smart solutions in different fields, such as smart cities, smart industries, smart health, etc.
FIWARE is composed of a set of general-purpose components called generic enablers (GEs), which are used together, allowing the development of smart IoT networks. These GEs cover a large number of functionalities, such as processing and storing data events, easy connection for IoT devices using a wide variety of protocols (UL, JSON, LWM2M), security (authentication and authorization), publication and monetization of context data resources, and data processing and visualization.
In any IoT network, it is necessary to collect, manage, process and show the environmental information. The FIWARE Orion Context Broker is the kernel of any platform built with this software. Moreover, this framework has a set of additional components, offering a great variety of new features to the system, such as process support, visualization support, access control support, etc.
Figure 5 shows the main architectural components of FIWARE. Our cloud architecture relies on the following GEs: (1) Orion (Context Broker)—this is the core of the system and is used as a mediator between the context creators/producers and context consumers; (2) Cygnus (context manager) is based on Apache Flume and its function is to store the context elements into persistent data sinks, such as file systems, data bases, or distributed streaming platforms; (3) IDAS (Intelligence Data Advanced Solution or IoT Agent: in our designed platform)—the IDAS deployed is the IoTAgent-JSON linked to a Mosquitto (MQTT broker), so the publish and subscribe model used with MQTT allows each node to send the context information to different topics by means of publications to which the IoT Agent is subscribed.
The architecture is composed of an IoT agent which is connected to the AMPQ message broker and receives information from all the IoT devices available in the network. This agent then inserts the information into the Mongo DB for persistence purposes. Then, in this case we are not using the FIWARE graphical interface directly but rather relying on RStudio (RStudio is available at
https://rstudio.com/) and Shiny (Shiny is available at
https://shiny.rstudio.com/). RStudio is directly integrated into FIWARE and thus able to receive data directly into the R statistical analysis tool. RStudio was used to implement the triangulation algorithms that provided the required level of accuracy. Shiny was used to make it possible to show the results of the data processing directly in the Google Maps interface using the Google Maps API.
4. Trilateration Algorithm
The RStudio widget in FIWARE was used to implement a location service in the software implementation. This location service consists of a program to continuously consult the database asking for new discoveries, and when more than three discoveries are made within a certain range of time, a location algorithm is applied.
There are several ways to estimate the location of points of interest (POIs) based on three or more reference points, using a trilateration algorithm [
21]. Trilateration is a mathematical method for calculating a point in space using distances from different reference points to other known geometrical entities.
In a 3D space, the POI is located at the intersection of the circumferences. Therefore, knowing the positions of centers of the circumferences and their radius, it is possible to estimate the location of the POI. The simplest case, and the case in question, is when the POI is centered in (, , ) and the equation to calculate it is the following:
For explanation purposes and mainly because the area where the deployment of this IoT system was carried out was Valencia, Spain, where there variation of altitude along the whole city is less than 10 m [
22], to simplify calculations we considered a 2D plane but the solution is directly extrapolatable to a 3D plane. The following assumptions were made:
Every station is at the same altitude.
Calculation can be simplified even more if we assume that one circumference is located at the origin of the coordinates, the second in the X axis and, the last, orthogonal to the others.
The coordinates of the station would remain as:
,
, and
. Taking into account these assumptions [
21], it is possible to deduce the following equation system:
The way to solve the previous equations is shown in the excerpt of R code depicted in Listing , using the geodetic coordinates and computing the lightning-fall points from the distances to the reference points , , and .
Listing 1.
Trilateration algorithm excerpt in R.
Listing 1.
Trilateration algorithm excerpt in R.
#using authalic sphere (GRS 1980 - EPSG:4088) #Convert geodetic Lat/Long to ECEF xyz deg2rad <- function(deg) {(deg * pi) / (180)} earthR <- 6371 x1 <- earthR * (cos(deg2rad(LatA)) * cos(deg2rad(LonA))) y1 <- earthR * (cos(deg2rad(LatA)) * sin(deg2rad(LonA))) z1 <- earthR * (sin(deg2rad(LatA))) x2 <- earthR * (cos(deg2rad(LatB)) * cos(deg2rad(LonB))) y2 <- earthR * (cos(deg2rad(LatB)) * sin(deg2rad(LonB))) z2 <- earthR * (sin(deg2rad(LatB))) x3 <- earthR * (cos(deg2rad(LatC)) * cos(deg2rad(LonC))) y3 <- earthR * (cos(deg2rad(LatC)) * sin(deg2rad(LonC))) z3 <- earthR * (sin(deg2rad(LatC))) P1 <- c(x1, y1, z1) P2 <- c(x2, y2, z2) P3 <- c(x3, y3, z3)
|
5. Results and Discussion
5.1. IoT Device Test
The efficiency and the right working conditions of the designed sensor were validated by some hardware tests. First, we tested the efficiency of our system in discriminating electromagnetic noise from real lightning. To do that, we were able to perform these tests in the anechoic chamber of the Würth Elektronik EiSoS company.
Figure 6a is a picture taken inside the anechoic chamber where the hardware test was performed.
Figure 6b shows the equipment to test the lightning detection sensor based on the AS3935. The lightnings that were most likely to be detected were those with an intensity close to 30 A. To check the correct functioning of the sensor, an electrostatic discharge gun (ESD3000) capable of producing pulses up to 30 kV was used. As expected, for voltages lower than 25 kV at a medium-long distance, the system indicated that electromagnetic noise had been detected. However, the closer we got to the sensors and at 30 kV, the greater the distance the stations indicated and the fewer times it filtered it as noise.
Figure 7 shows a plot of the detected signal when shooting the gun with 25 kV and around 30 A with an air discharge in AC. After applying the logic lightning algorithm, the distance (in km) registered was due to the concentration of energy in the short space.
Tests were performed by triggering electromagnetic pulses many times, increasing the distance to the antenna with each measurement [
23] from 1 cm to 20 cm, where the detector could identify the pulse as lightning. In the simulated test with the electrostatic guns, lightnings with energy below the current maximum were not detected as a lightning with this algorithm.
5.2. IoT Monitoring Test
Figure 8 describes the prototyped framework for the information collection of lightning detection and for the processing of this information to locate each lightning in a map-based application with RStudio.
5.3. Measurement Tests
According to the datasheet, the maximum distance our sensor can measure is 40 km. However, the precision range is not linear.
Table 2 was extracted from the documentation of the IC and explains the degradation of the detection efficiency over distance for different thresholds in the watchdog. Attending to this limitation, we established a maximum distance between nodes of 25 km, as this is the range that optimizes the distance versus detection efficiency.
A demo pilot network was implemented taking into account the aforementioned requirements and implementing the trilateration algorithm in RStudio with a mapping tool based on Google Maps.
Figure 9a shows the locations in Valencia where nodes were placed. The first station was placed in Torrent (a city near Valencia), the next station was placed in a location near the beach, and the last one was placed orthogonal to the others in the ETSE-UV (School of Engineering—University of Valencia).
Then, as a proof of functional validation,
Figure 9b presents the information obtained with the system working over 15 min during a storm on 13 September 2019. The orange markers are our nodes, yellow markers are lightnings detected, and purple lines are the distances from strikes to each node. This system had a coverage of the whole of Valencia City for a cost of less than 210 EUR (three IoT devices). It could last for years and will have a very low operational cost mainly due to the low power consumption associated with both the Raspberry Pi 3 and the IC utilized. This will allow our emergency systems to have detailed location information on where lightning strikes occur. The sensor node is powered with 3.3 V from the Raspberry Pi 3B+ GPIO. Additionally, the configuration was selected for an indoor environment. This is an initial stage of the project. In this prototype, we used a Raspberry Pi, but in the second stage we will use NodeMCU v3 with ESP32, which needs low power feed.
The sensor can have failures, and these measurements are discarded because before detecting a lightning strike the IC AS3935 does not process the discarded signals with the logic detecting algorithm. Although the signal is discarded for launching the location algorithm when a detection error is launched, a detection error is also generated and a repeat measurement request message is also sent to the IC.
6. Conclusions
In this paper, we presented the design, prototype, and deployment in the city of Valencia, Spain an IoT sensor network based on a set of distributed nodes able to locate lightning strikesdue to to the synchronization among their nodes and the trilateration algorithm implemented, using an open-source FIWARE platform with the support of big-data tools. We also designed a lightning detection system based on an AS3935 sensor. Although the designed system has a limited range due to its low performance, when combining several of these nodes within a large detection area within the mesh network, we found in our results that the performance was good—on the order of kilometers. We achieved a significant reduction in the capital costs required to build a lightning detection and location system. Thus, it can be concluded that by using this kind of low-cost sensor in the nodes, and these nodes within a sensor network, we can improve the accuracy for lightning strike detection and location. This work is a first stage of development. For future work, we will consider different issues and further developments: replace the Raspberry Pi with NodeMCU v3 with ESP32 with low power feeding; the use of edge computing; functional splitting; the use of dense networks with 5G (NB-IoT/LTE-M or LoRa communications for outdoor environments); etc.
Author Contributions
Conceptualization, J.S.-G., I.M.-F., and E.N.-C.; methodology, J.S.-G. and E.N.-C.; software, I.M.-F. and M.G.-P.; validation, I.M.-F. and S.F.-C.; funding acquisition, J.S.-G., S.F.-C., and E.N.-C.; data curation, I.M.-F. and J.M.A.-C.; writing—original draft preparation, I.M.-F. and J.S.-G.; writing—review and editing, E.N.-C., S.F.-C., J.M.A.-C., and M.G.-P.
Funding
This research was partially funded by the Spanish Government grant number FIS2017-90102-R and BIA2016-76957-C3-1-R (also co-funded with FEDER funds). The University of Valencia also partially supported this research with the grant UV-INV_EPDI19-995284.
Acknowledgments
Authors would like to thank Würth Electronik for their willingness to give access to their premises to perform tests. Authors would also like to thank the World Wide Lightning Location Network (
http://wwlln.net), a collaboration among over 50 universities and institutions, for providing some lightning location data used in this paper. Thanks also to the anonymous reviewers for their efforts to greatly improve this paper.
Conflicts of Interest
The authors declare no conflicts of interest.
References
- Holle, R.L. The Number of Documented Global Lightning Fatalities. In Proceedings of the 33rd International Conference on Lightning Protection, Estoril, Portugal, 25–30 September 2016. [Google Scholar]
- Curran, E.B.; Holle, R.L.; López, R.E. Lightning Casualties and Damages in the United States from 1959 to 1994. J. Clim. 2000, 13, 3448–3464. [Google Scholar] [CrossRef]
- Cummins, K.L.; Murphy, M.J.; Bardo, E.A.; Hiscox, W.L.; Pyle, R.B.; Pifer, A.E. A combined TOA/MDF technology upgrade of the US national lightning detection network. J. Geophys. Res. 1998, 103, 9035–9044. [Google Scholar] [CrossRef]
- Krider, E.P.; Noggle, R.C.; Pifer, A.E.; Vance, D.L. Lightning Direction-Finding Systems for Forest Fire Detection. Bull. Am. Meteorol. Soc. 1980, 61, 980–986. [Google Scholar] [CrossRef]
- WWLLN. Available online: http://wwlln.net/ (accessed on 29 August 2019).
- Huffines, G.R.; Orville, R.E. Lightning Ground Flash Density and Thunderstorm Duration in the Continental United States: 1989–96. J. Appl. Meteorol. 1999, 38, 1013–1019. [Google Scholar] [CrossRef]
- Pérez-Puebla, F. Cooperación entre las redes de rayos de España y Portugal. In Proceedings of the Jornadas Científicas de la Asociación Meteorológica Española, Badajoz, Spain, 11–13 February 2004. [Google Scholar]
- Santos, J.A.; Reis, M.A.; De Pablo, F.; Rivas-Soriano, L.; Leite, S.M. Forcing factors of cloud-to-ground lightning over Iberia: regional-scale assessments. Nat. Hazards Earth Syst. Sci. 2013, 13, 1745–1758. [Google Scholar] [CrossRef] [Green Version]
- Rodrigues, R.B.; Mendes, V.M.F.; Catalao, J.P.S. Lightning Data Observed With Lightning Location System in Portugal. IEEE Trans. Power Deliv. 2010, 25, 870–875. [Google Scholar] [CrossRef]
- Abarca, S.F.; Corbosiero, K.L.; Galarneau, T.J., Jr. An evaluation of the Worldwide Lightning Location Network (WWLLN) using the National Lightning Detection Network (NLDN) as ground truth. J. Geophys. Res. Atmos. 2010, 115. [Google Scholar] [CrossRef]
- Fleenor, S.A.; Biagi, C.J.; Cummins, K.L.; Krider, E.P.; Shao, X.M. Characteristics of cloud-to-ground lightning in warm-season thunderstorms in the Central Great Plains. Atmos. Res. 2009, 91, 333–352. [Google Scholar] [CrossRef]
- Dowden, R.L.; Brundell, J.B.; Rodger, C.J. VLF lightning location by time of group arrival (TOGA) at multiple sites. J. Atmos. Sol.-Terr. Phys. 2002, 64, 817–830. [Google Scholar] [CrossRef]
- Lay, E.H.; Holzworth, R.H.; Rodger, C.J.; Thomas, J.N.; Pinto, O., Jr.; Dowden, R.L. WWLL global lightning detection system: Regional validation study in Brazil. Geophys. Res. Lett. 2004, 31. [Google Scholar] [CrossRef] [Green Version]
- Jacobson, A.R.; Holzworth, R.; Harlin, J.; Dowden, R.; Lay, E. Performance Assessment of the World Wide Lightning Location Network (WWLLN), Using the Los Alamos Sferic Array (LASA) as Ground Truth. J. Atmos. Ocean. Technol. 2006, 23, 1082–1092. [Google Scholar] [CrossRef]
- Rodger, C.J.; Brundell, J.B.; Dowden, R.L. Location accuracy of VLF World-Wide Lightning Location (WWLL) network: Post-algorithm upgrade. Ann. Geophys. 2005, 23, 277–290. [Google Scholar] [CrossRef] [Green Version]
- Rodger, C.J.; Werner, S.; Brundell, J.B.; Lay, E.H.; Thomson, N.R.; Holzworth, R.H.; Dowden, R.L. Detection efficiency of the VLF World-Wide Lightning Location Network (WWLLN): Initial case study. Ann. Geophys. 2006, 24, 3197–3214. [Google Scholar] [CrossRef] [Green Version]
- Rodger, C.J.; Brundell, J.B.; Holzworth, R.H.; Lay, E.H. Growing Detection Efficiency of the World Wide Lightning Location Network. In American Institute of Physics Conference Series; AIP: College Park, MD, USA, 2009; Volume 1118, pp. 15–20. [Google Scholar] [CrossRef]
- Dowden, R.L.; Brundell, J.B.; Rodger, C.J. World-wide lightning location using VLF propagation in the earth ionosphere waveguide. IEEE Antennas Propag. Mag. 2008, 50, 40–60. [Google Scholar] [CrossRef] [Green Version]
- Nicora, M.G.; Quel, E.J.; Bürgesser, R.E.; Ávila, E.E.; Rosales, A.; Salvador, J.O.; D’Elia, R. La actividad eléctrica atmosférica en Argentina. Estimación de la tasa de mortalidad anual por acción de caídas de rayos. Asociación Física Argentina. ANALES AFA 2014, 25, 151–156. [Google Scholar] [CrossRef] [Green Version]
- Fiware. Available online: https://www.fiware.org/developers/ (accessed on 1 October 2019).
- Cotera, P.; Velazquez, M.; Cruz, D.; Medina, L.; Bandala, M. Indoor Robot Positioning Using an Enhanced Trilateration Algorithm. Int. J. Adv. Robot. Syst. 2016, 13, 110. [Google Scholar] [CrossRef] [Green Version]
- Valencian Topography. Available online: https://es-es.topographic-map.com/maps/6o2m/Comunidad-Valenciana/ (accessed on 29 August 2019).
- Rakov, V.A.; Uman, M.A. Lightning: Physics and Effects; Cambridge University Press: Cambridge, UK, 2007. [Google Scholar]
© 2019 by the authors. Licensee MDPI, Basel, Switzerland. This article is an open access article distributed under the terms and conditions of the Creative Commons Attribution (CC BY) license (http://creativecommons.org/licenses/by/4.0/).

 ,
, 