1. Introduction
Electromagnetic waves have huge potential for various applications such as wireless communication, micro processing, and sensing, and as a result, they will become indispensable in our daily lives. In recent years, millimeter waves or terahertz waves, with wavelengths shorter than microwaves and longer than infrared, have been attracting considerable attention. One of the features of these waves is their combination of high resolution and non-destructiveness. Therefore, a number of imaging methods that use these waves have been reported [
1,
2,
3]. However, since these waves generally propagate in straight lines and attenuate immediately in lossy media, such methods frequently encounter technical issues due to the deterioration of information-carrying detection signals and their physical separation due to multipath propagation. From a microscopic point of view, an electromagnetic wave includes two components: electric and magnetic fields with their spatial distributions varying in time. This is significantly different from other waves, like sonic waves, which can be interpreted in terms of single-variable wave propagation.
When we impose specific boundary conditions on electromagnetic waves, there is a wave component with a wavenumber vector that does not propagate spatially and concentrates around the boundaries or interfaces with exponential attenuation. This phenomenon corresponds to an evanescent wave, and in classical cases it has only been observed in the optical region [
4]. In a microscopic view, when the evanescent waves get close to a conductive plate, oscillations are excited in the free electrons in the plate surface. This phenomenon is called a surface plasmon polariton (SPP) or simply, a surface wave [
5,
6,
7,
8], and it has been used in applications such as biosensors, chemical sensors and field enhancement in spectroscopy [
9,
10,
11]. As described above, although an SPP can be excited only in the optical region, a similar phenomenon, with the concentration and oscillation of electric fields on the surface of a conductive plate, has also been confirmed at lower frequencies than optical bands. These are called spoof surface plasmon polaritons (SSPP) [
12,
13,
14,
15,
16], and are broadly considered to be a unique phenomenon involving a metamaterial. One of the features of SSPPs that is not observed in other propagating modes, is the concentration of its electric field at interfaces, so that it has the potential to give us significant information about objects near such surfaces without complex signal processing. The standard example of an SSPP structure is a metal hole array (MHA), which is a conductive plate with periodic holes [
17,
18,
19,
20]. An MHA is considered to be a macroscopic effective medium in terms of controlling relative permittivity by the structural parameters of its holes. Since its structure has only a few parameters, an MHA is expected to serve as a ready-to-use functional and practical medium as well as a readily available sample for experiments [
21]. Therefore, many studies of SSPPs on MHAs have been reported, although so far, they have focused on static properties as SSPP applications.
In this study, a two-dimensional imaging method using an MHA as a dynamic functional material is proposed for permittivity imaging, mainly aimed at a non-invasive medical diagnostic. Specifically, the proposed method uses the intentional formation of electromagnetic defects in the uniform electric distributions of SSPPs on an MHA, where the defect is formed by scanning a metallic needle across the surface of the MHA. Viewed another way, the proposed method is also a non-destructive diagnostic method used as a dynamic dielectric sensor for an MHA, which is sensitive to the side opposite the needle-scanned surface. Compared to other non-destructive diagnosis tools such as confocal microscopy and near-field optical microscopy, an advantage of the proposed method is that the electromagnetic properties of subsurface tissues can be measured because surface waves in millimeter or terahertz wave bands have deeper skin penetration depths than those in optical frequency bands [
22,
23,
24]. At present, the imaging of inner issues is typically achieved using a destructive method such as CT (Computer Tomography) or some other high-cost technique such as MRI (Magnetic Resonance Imaging). Actually, conventional imaging methods face difficulties arising from these issues [
25,
26,
27]. Biomedical imaging based on the electromagnetic properties of biomedical tissues is considered to be an effective method because the electromagnetic properties of a malignant tumor and normal breast tissue are different [
28].
In
Section 2, the excitation mechanism of SSPPs on an MHA is described. In
Section 3, the numerical analysis of the electromagnetic properties of an MHA, such as transmittance and reflectance, and the localized distortion of the electric fields of the SSPP mode around the MHA with a conductive probe (a needle-like conductor) is demonstrated. In
Section 4, we report one- and two-dimensional imaging experiments including the experimental demonstration of biomedical diagnosis in the case of a rat lung that apply the localized distortion mechanism, with the use of an MHA targeting conductive, dielectric, and biomedical samples.
2. The Basis of Spoof Surface Plasmon Generation
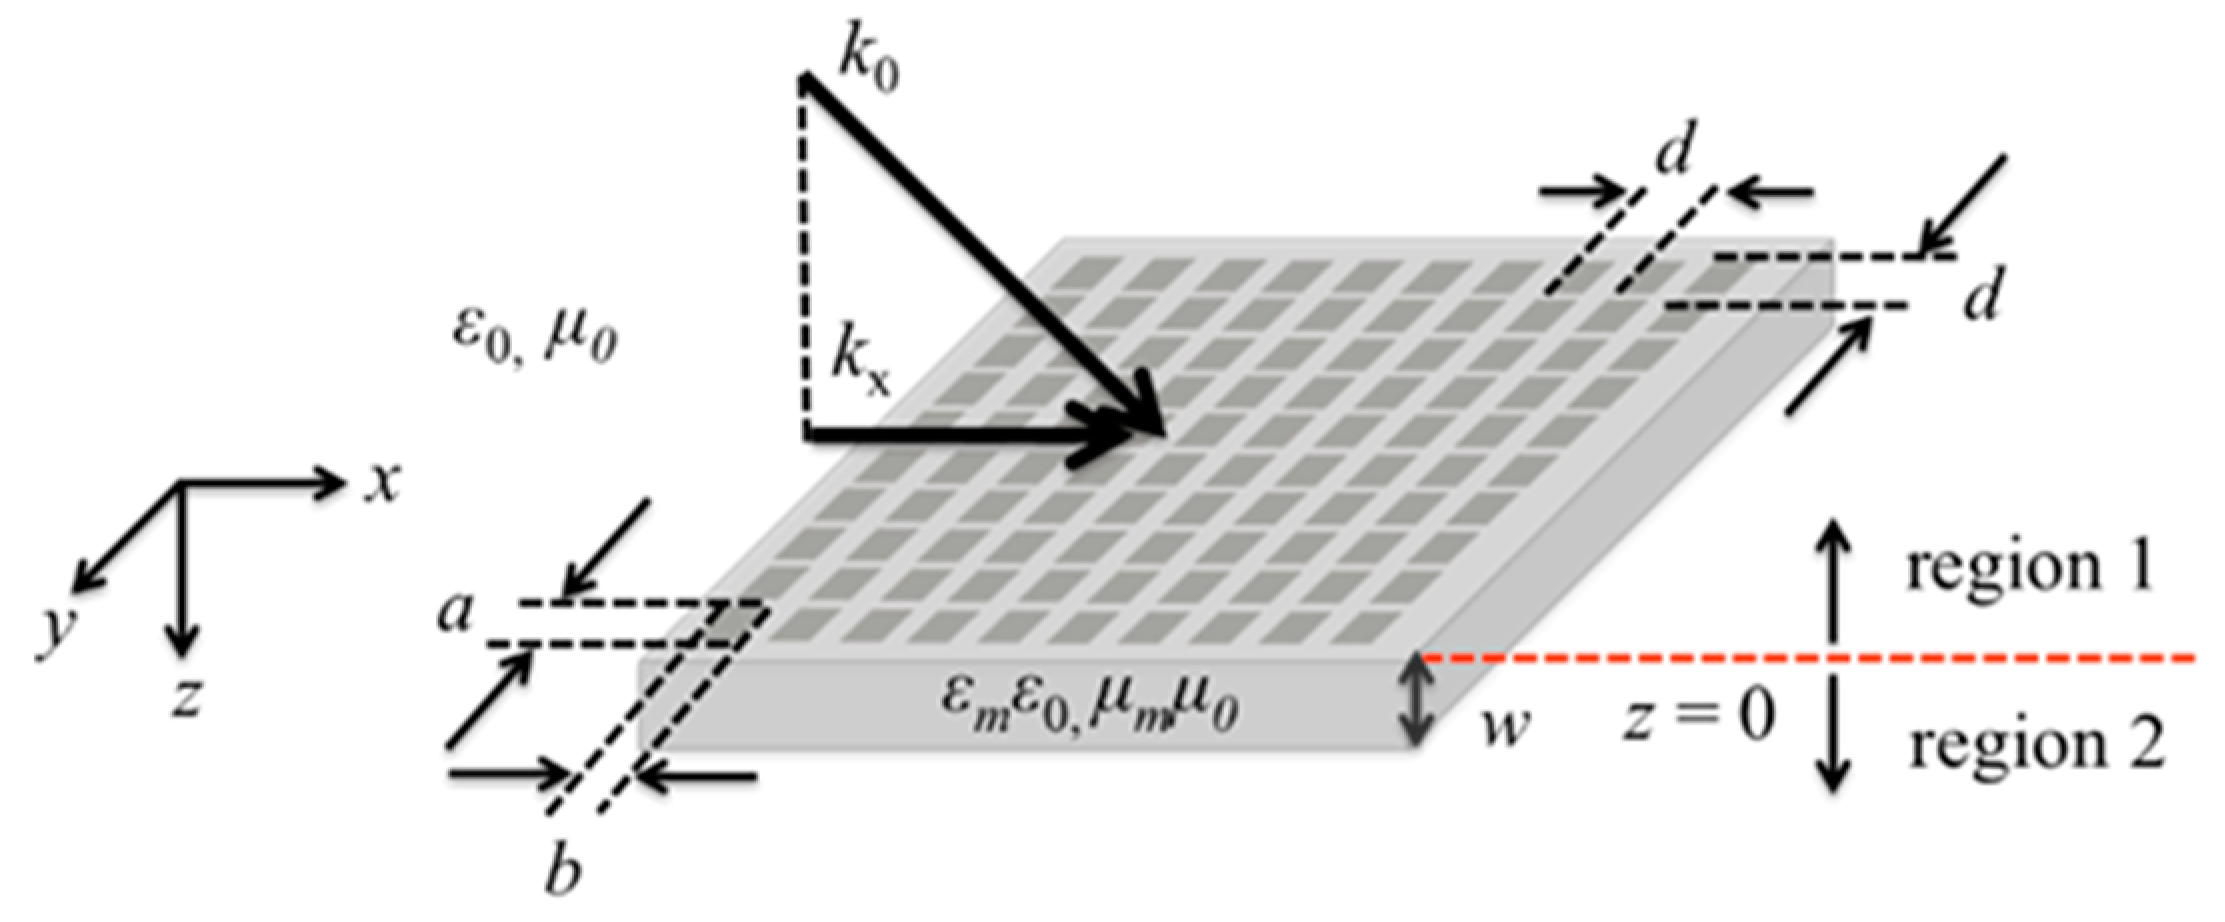
The SSPP phenomenon was discovered by Pendry et al. who also derived the theory of its generation. Here, SSPP is used for imaging by detecting the local deformation of its propagation modes. Therefore, in order to explain the proposed imaging method, we begin with the theoretical derivation of SSPP generation as its basis. First of all, the mechanism of SSPP generation on an MHA is explained. In order to describe SSPP generation on an MHA, the electromagnetic model of the process is introduced. In this study, the MHA has holes whose size is the same order of magnitude as the wavelengths of incident waves. The model is shown in
Figure 1. In this model, the MHA is treated as a uniform, effective medium with a frequency-based response to incident waves. As shown in
Figure 1, we consider that with the incidence of optimized millimeter waves, electric fields concentrate in and around an MHA that has two-dimensional waveguide arrays (period
d, cross section
p ×
q, depth
w,) extended to infinity. It is assumed that the incident waves are TM-polarized optimal waves. Note that the electric field-vector of the wave has only
x- and
z- components, and the magnetic field-vector has only
y-component in the situation. In the derivations, the coupling phenomenon between the dispersion relation of the incident waves and the waveguide modes is considered. That is, the electric fields are considered to be concentrated on the surface, and this distribution forms longitudinal waves. Thus, the SSPP modes are generated on the MHA.
Before beginning the derivation of SSPP generation, the definitions of the electric and magnetic properties in two regions are introduced. In
Figure 1, Region 1 indicates the space on the upper side of the MHA, and Region 2 indicates the space inside the holes of the MHA. Since Region 1 is filled with vacuum, the permittivity and the permeability in Region 1 are
ε0 and
μ0 respectively. On the other hand, as described above, since the MHA is presumed to be a macroscopically uniform medium, the MHA has to have an effective relative permittivity of
εm and a relative permeability
μm that is frequency dependent [
12]. When electromagnetic waves whose frequency is below a cut-off frequency are introduced to an MHA, waves are attenuated with fundamental mode [
29]. Therefore, the electric fields of incident waves are expressed as below.
Note that in this manuscript, time oscillation terms are omitted for convenience of formulation if necessary. Here,
E0 is a constant value, and expression (1) indicates that
Ex = 0 at the edges of the holes. Therefore, the
x-component and
z-component of an incident wavevector
kx and
kz can be expressed as
where
εh and
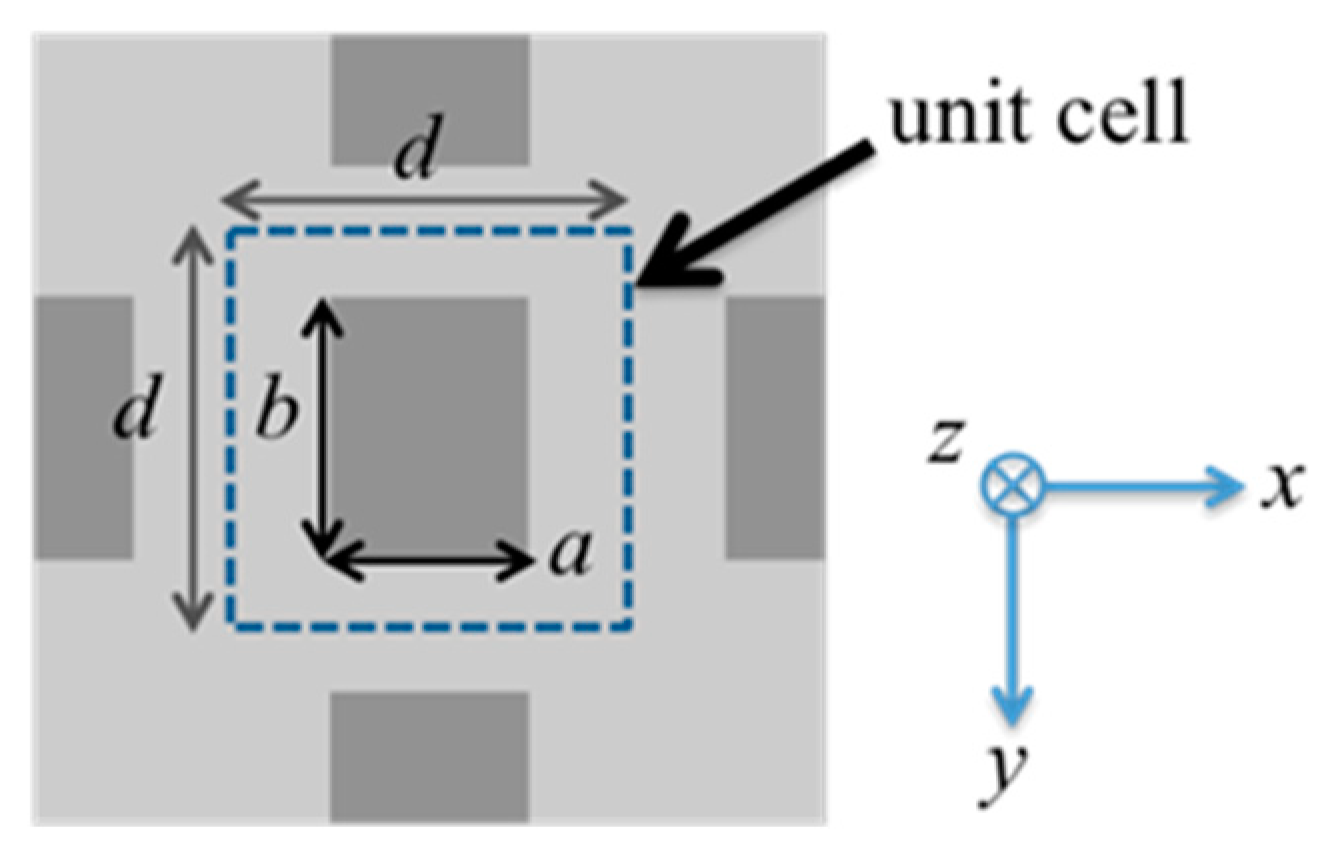
μh are respectively, the relative permittivity and relative permeability in the holes of the MHA. At this point, remembering the precondition that the MHA is a macroscopic medium and has an effective relative permittivity, for example, when focused on a unit cell of the MHA (shown in
Figure 2), the macroscopic wave vector only has a component in the
z-direction
kz’ because the waveguide mode occurs only in the holes and provides no propagation in the
x- and
y- directions. From the above discussions,
kz’ can be expressed as below.
where
c0 is the velocity of light in a vacuum. The wave number of
kz’ and that of
kz should be essentially the same value, because the unit cell in
Figure 2 has one waveguide and there is no propagation in the conductive medium of the MHA. Therefore, the equation below is obtained by using the expression
kz =
kz’.
On the other hand, in the matching procedure at
z = 0, the instantaneous flow of energy across the surface has to be considered by treating the unit cell as both a microscopic and a macroscopic medium. With the average electric fields of the unit cell regarded as a macroscopic medium
Since the two expressions (7) and (8) for the instantaneous flow of energy across the surface must have the same value, the equation
is always useful. With this equation and expressions (5)–(8), the effective relative permittivity
εm and relative permeability
μm can be obtained as below.
where
ωp is a cutoff frequency, and
εh is the relative permittivity and
μh is the relative permeability in the holes of the MHA. Expression (10) confirms that the effective relative permittivity of the MHA is frequency dependent. Thus, the MHA can be treated as an electromagnetic functional material.
On the other hand, remembering the magnetic field of the incident waves, this can be also solved by a wave equation for the value of
Hy. Here, in discussing the generation of SSPPs in the MHA, we start by considering the magnetic field near the MHA. First, the wave equation for
Hy is obtained by considering the Maxwell equations.
where
εr and
μr are the relative permittivity and the relative permeability. With the precondition that the TM wave is incident to the MHA, it is considered that if SSPPs occur on the surface of the MHA, they must propagate along the
x-direction. Also, since the incident magnetic field has the propagation constants of
x and
z, the y component of the magnetic field vector
Hy can be expressed thus,
where
k|| is the wavenumber of an SSPP, and
h(
z) is the amplitude of the magnetic field, depending only on the value of
z. Substituting expression (12) into expression (11), the equation for
h(
z) is obtained. It has the form
where
ki is the wavenumber of the magnetic field. In Region 1,
k1 = (
k||2 −
ω2ε0μ0)
1/2, in Region 2,
k2 = (−
ω2εmμmε0μ0)
1/2. In Region 2, when regarding the MHA as a macroscopic medium, there is no propagation of the EM waves in
x-
y directions, and
k1 and
k2 are required to have positive values. Considering the solution of equation (13), as the value of |
z| increases, the value of the amplitude
h(
z) is supposed to decrease exponentially. From these assumptions, the relative equation obtained is:
At
z < 0
On the other hand, at
z ≥ 0
When considering the boundary condition of the electromagnetic field and magnetic field between Region 1 and Region 2 (at
z = 0), the tangent components of the electric field and the magnetic field in Region 1 and Region 2 must have the same value. This condition corresponds to the condition of conventional surface plasmon generation, that is
The above expression is often used to derive the dispersion relation of a surface plasmon. However, expression (16) can also be used to derive the dispersion relation of the SSPP. By squaring expression (16) and using expression (10) and the values of
k1 and
k2, the dispersion relation that is fundamental to comprehending the results in this paper is obtained. That is,
Note that the formula
c20 = 1/
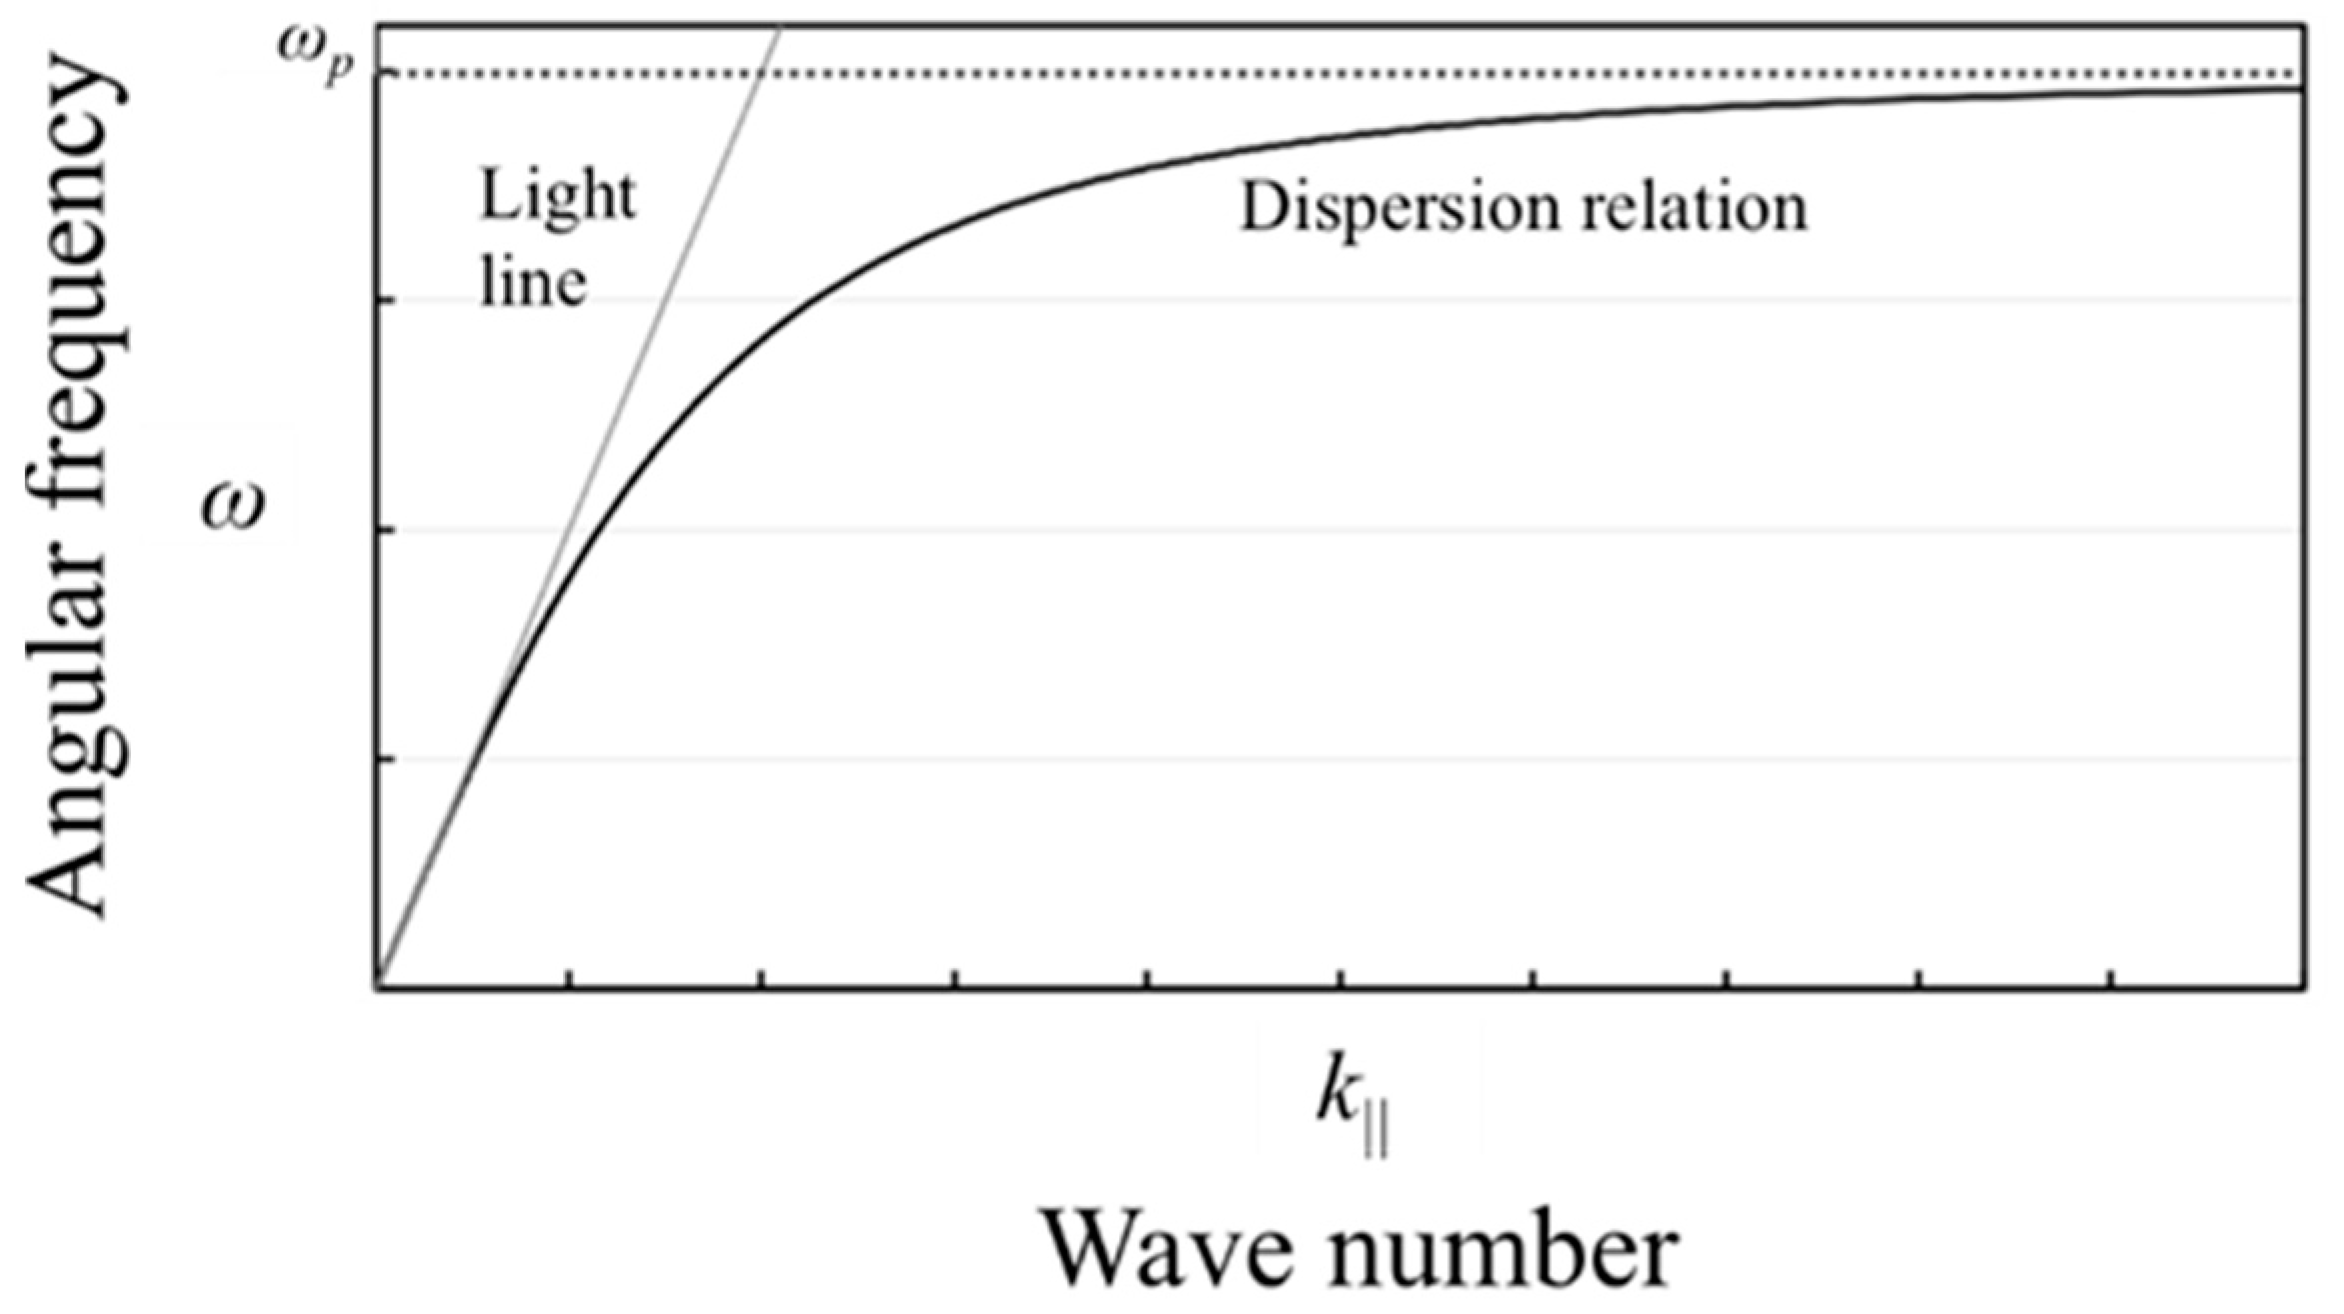
ω2ε0μ0 is used when deriving expression (17). The above expression is called the SSPP dispersion relation. The curve of the dispersion relation is shown in
Figure 3. If an angular frequency
ω is close to the cutoff frequency
ωp, the wavenumber
k|| diverges to infinity. In other words, the SSPP modes stop propagating then. On the other hand, as the value of
ω approaches zero, the dispersion relation curve comes close to a light line, although they do not cross each other, as shown in
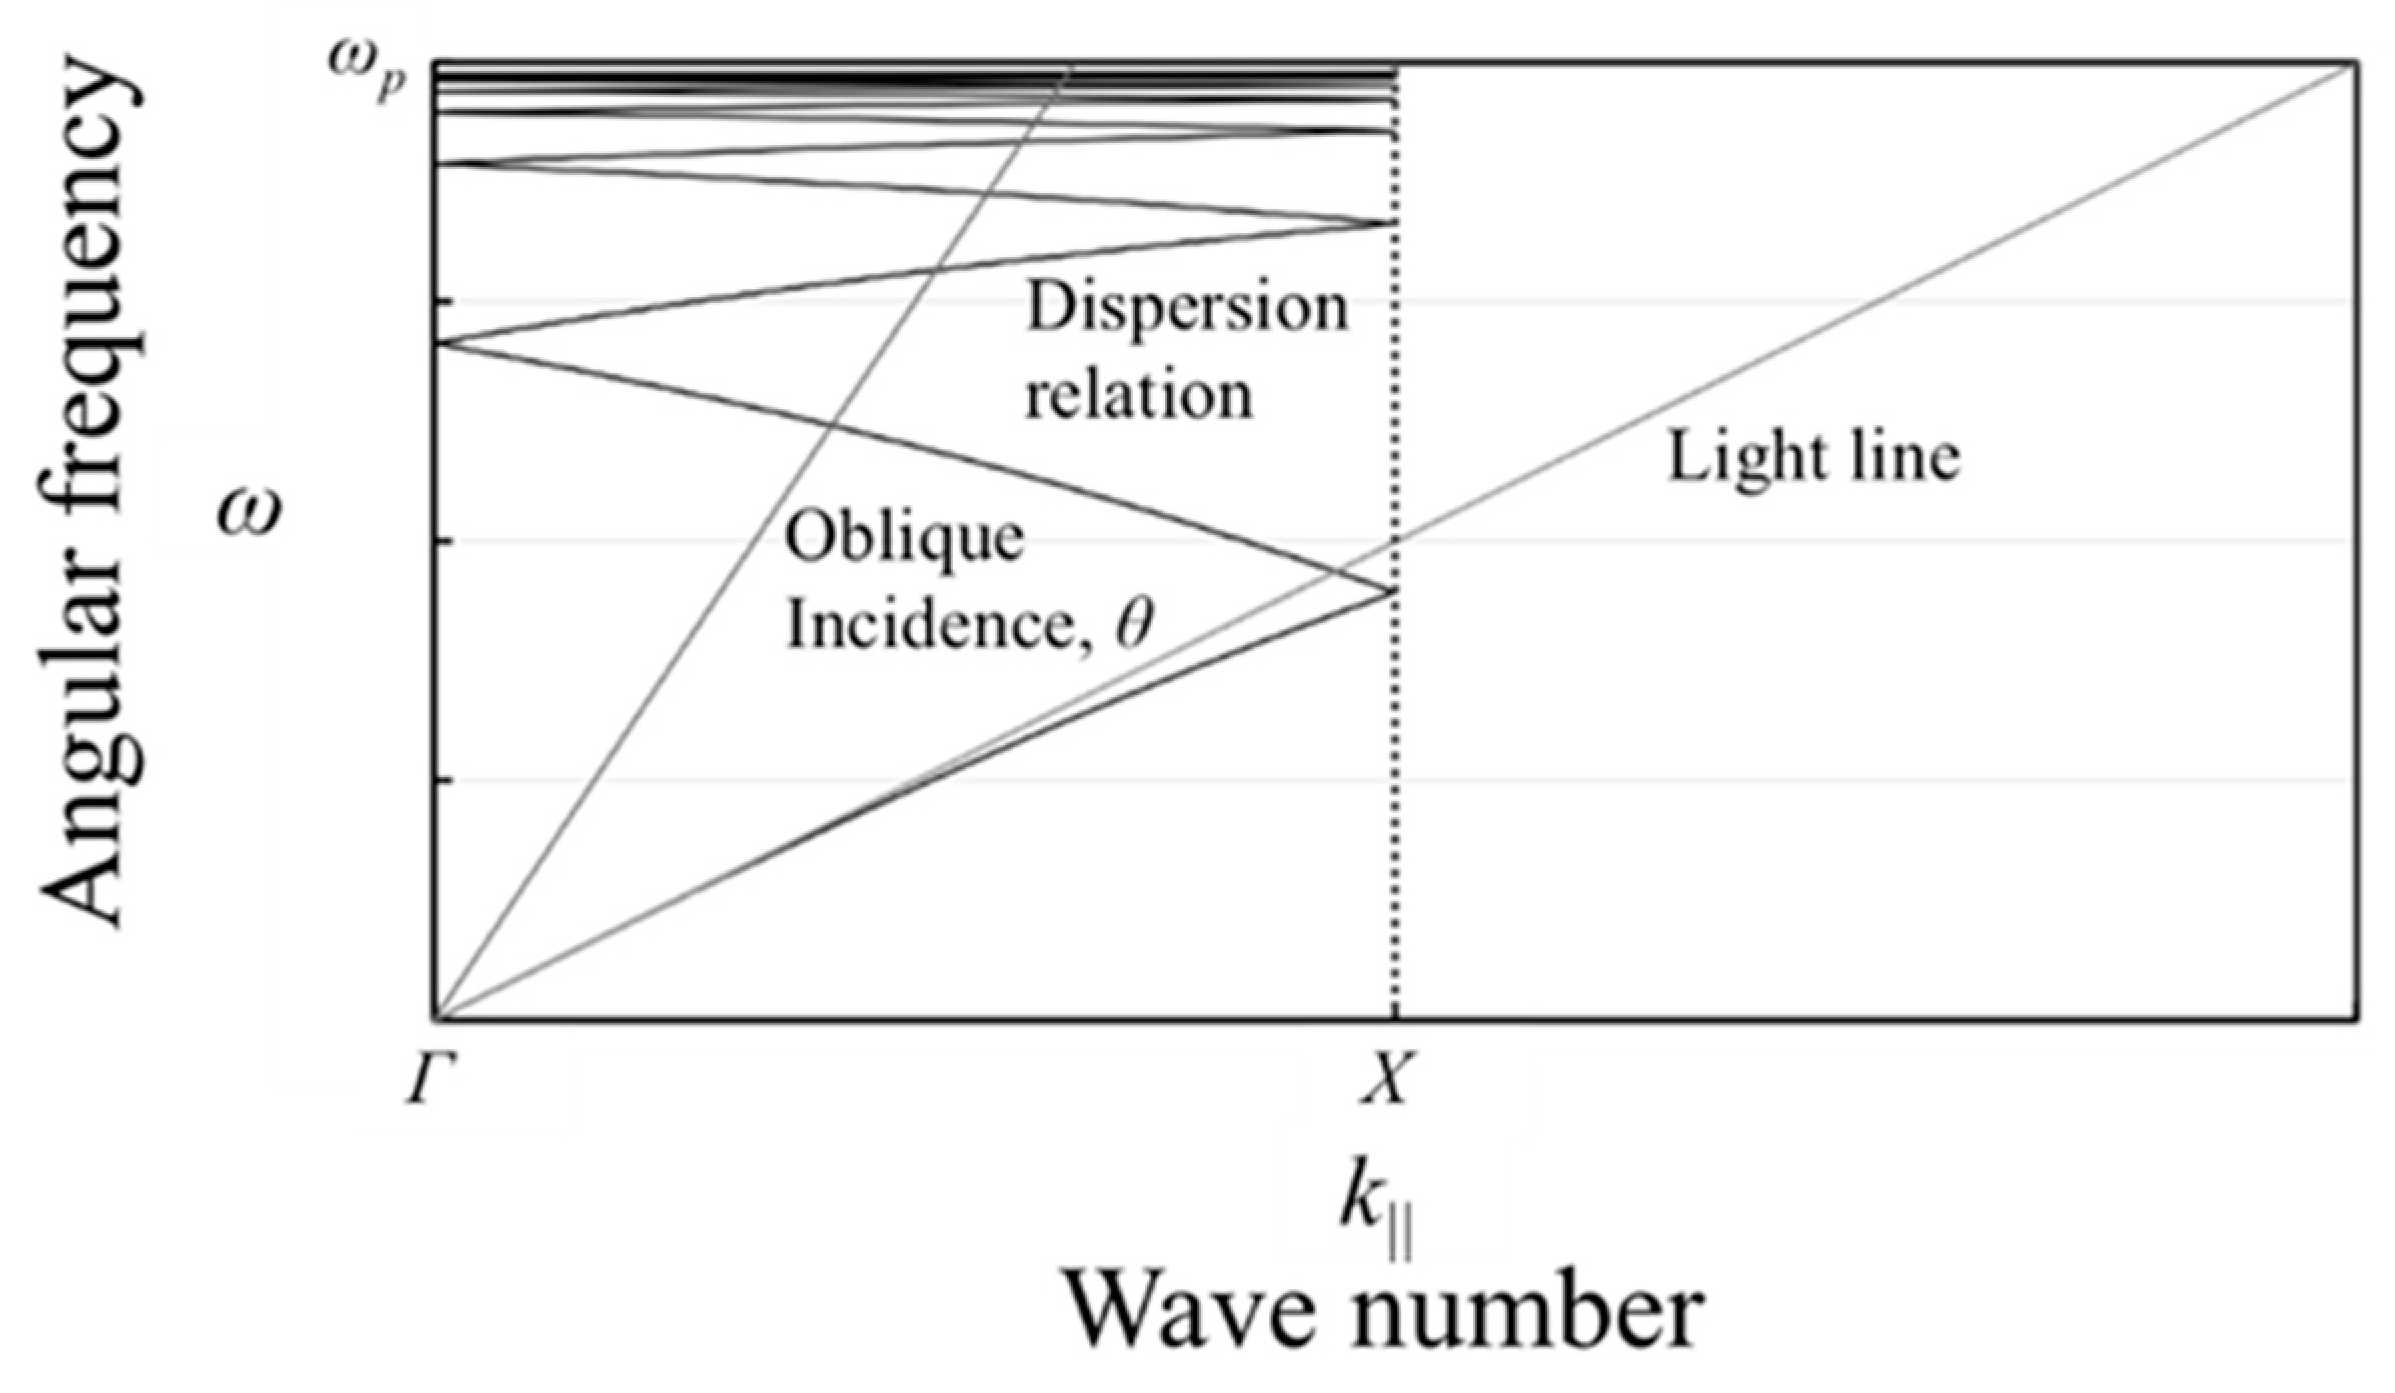
Figure 3. Therefore, if an actual dispersion relation corresponds to this curve, SSPP modes are not generated. However, since the MHA is a periodic structure, it has to be treated as a two-dimensional crystal. Therefore, it should be considered that lattice scattering effects are occurring in the MHA. Here, introducing the reciprocal lattice of its structure, the definition of the wavenumber
k|| can be replaced as
where
Gx and
Gy are the reciprocal lattice vectors in the
x-direction and
y-direction, respectively. So, the dispersion relation of the MHA in infinite space is also replaced by one with the spatial periodicity shown in
Figure 4.
Figure 4 confirms that there are intersection points between the actual dispersion relation and a light line. Therefore, SSPPs are indeed generated in the MHA, especially when the angular frequency
ω is close to the cutoff frequency
ωp. If the SSPPs are generated on the surface of the incidence side of the MHA, the waves are also generated on the opposite side because the waves transmitted through the waveguides of the MHA also couple with the SSPP mode in the same way as with the incident waves. The important feature of an SSPP mode is the concentration of the electric field on the MHA. Therefore, we focused on a modification of the concentrated electric fields for a novel use as an imaging method.
3. Electromagnetic Numerical Analyses of The MHA and Electromagnetic Distortion
In
Section 2, we overviewed the physical basis of SSPP propagation and its dispersion, which showed that its frequencies are in fact caused and assured by the MHA. The concentration of its fields around the propagation interface was also pointed out, leading to potential applications of this propagation mode to 2D permittivity imaging that requires field uniformity over the area to be surveyed. However, the SSPP itself cannot provide us with local information on its responses to an electric field or permittivity, so in this section we confirm the effects of defect introduction on SSPP propagation.
Electromagnetic numerical analyses were performed to reconfirm the electromagnetic properties of the MHA predicted in
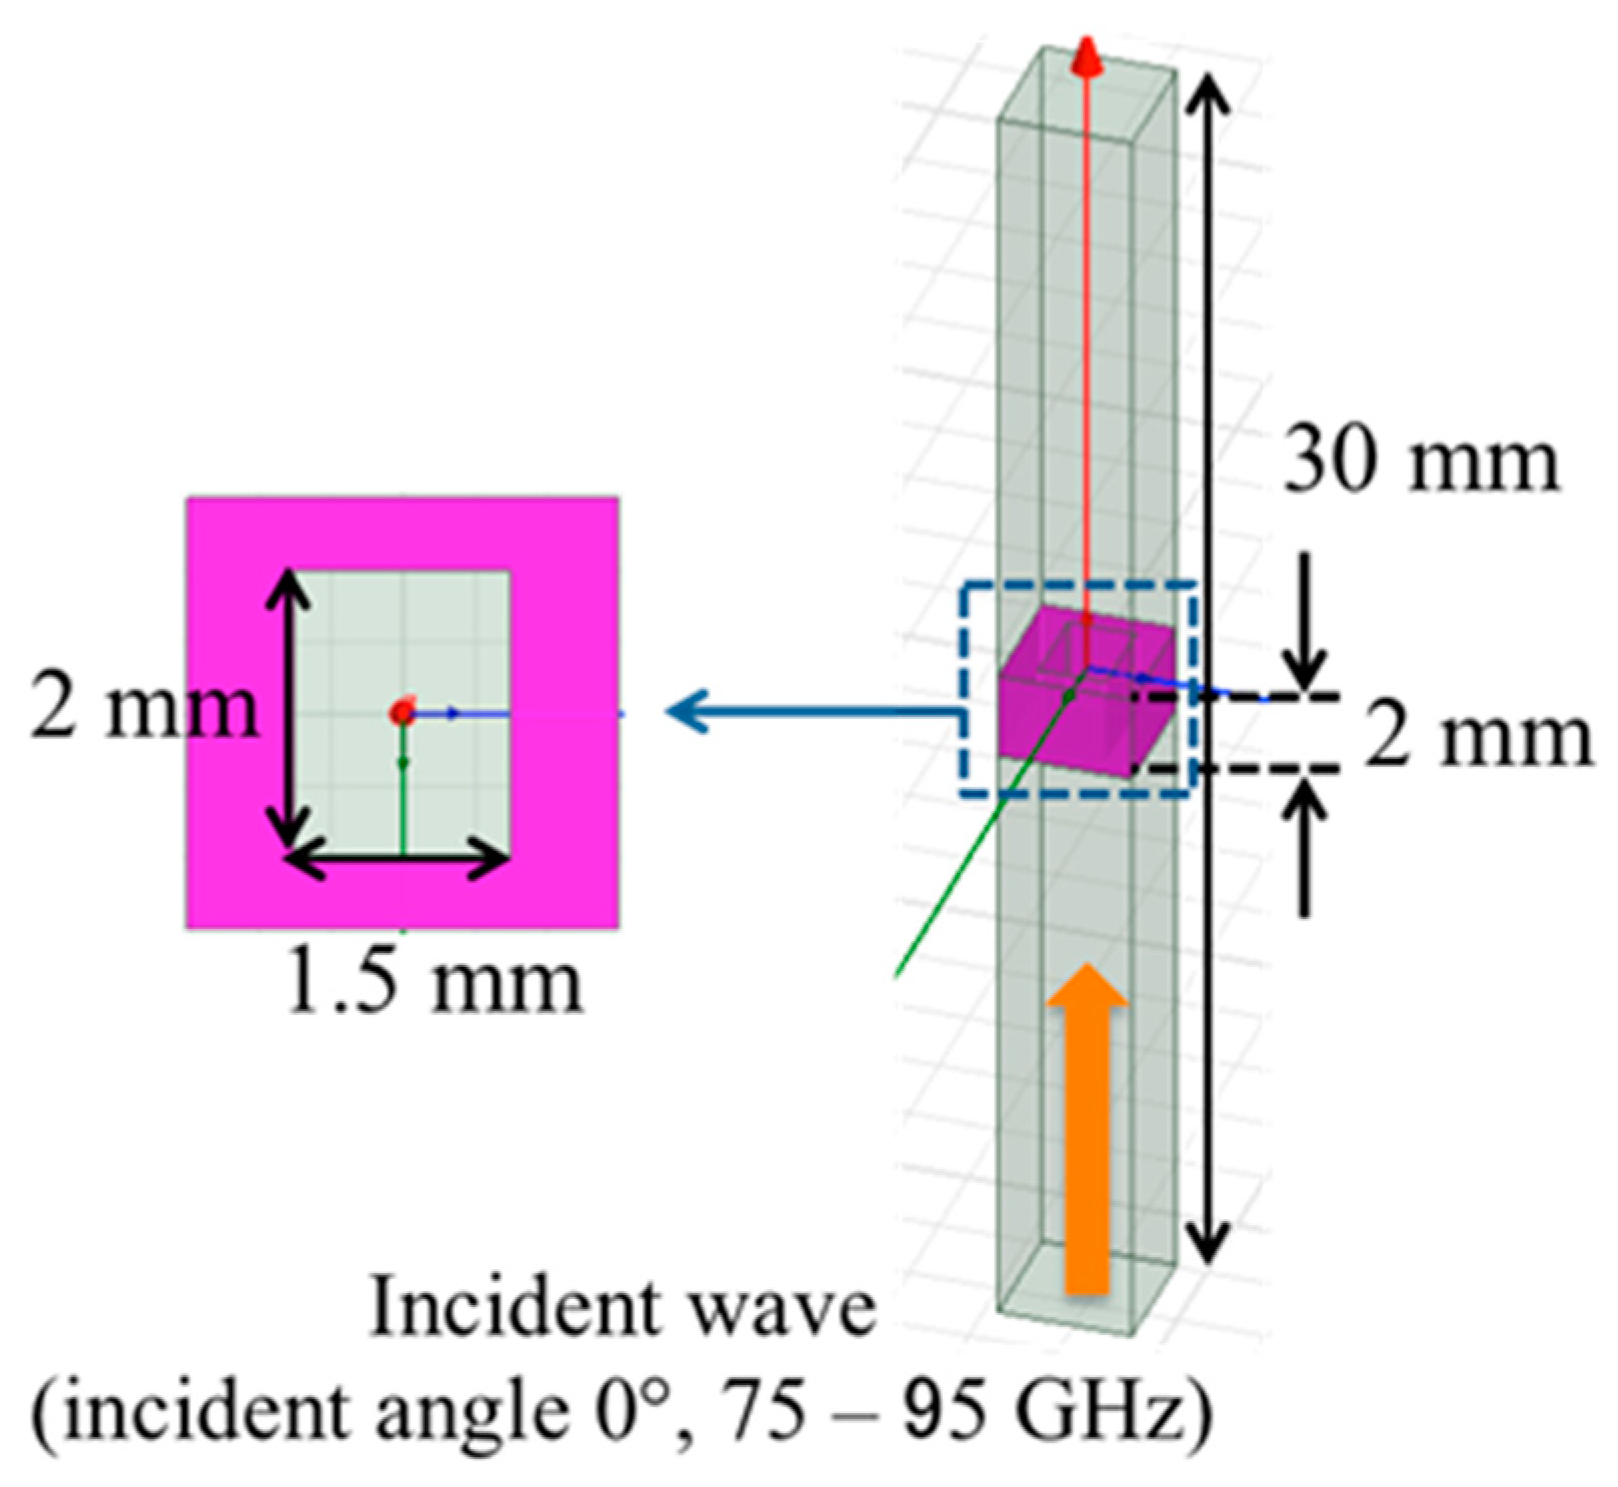
Section 2 and to specify the electromagnetic field distortion on the MHA by a needle-like conductor.
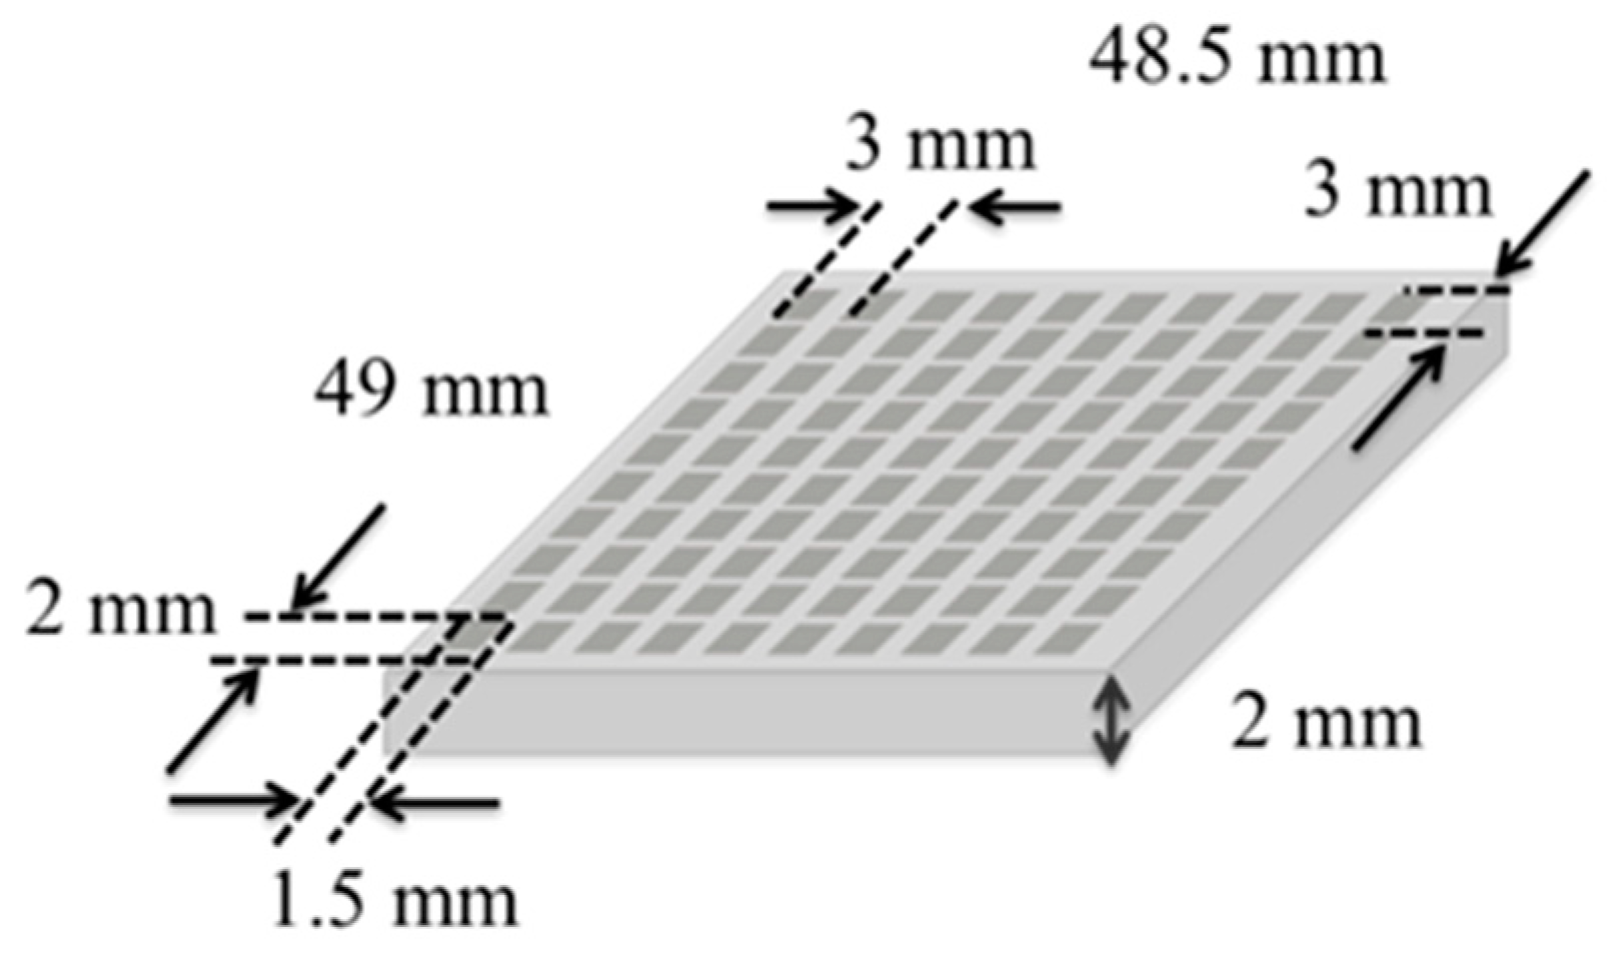
Figure 5 shows the analytical model using an electromagnetic simulator (HFSS R18, Ansys, Canonsburg, PA, USA). In this simulation model, the MHA is made of copper and its thickness is 2 mm. The size of the embedded waveguide is 2 mm × 1.5 mm and the period in both the
x- and
y- directions is 3 mm. The coordinate notations used here correspond to those in
Section 2. Periodic boundary conditions applied to the sides of the model yield a hypothetical infinite area of SSPP propagation, and the incident surface (underside, port 1) is on the side opposite the receiving surface (topside, port 2) along the long side of the model, which explains the macroscopic wave propagation; they are defined as a Floquet port. Assuming the dispersion relation shown in
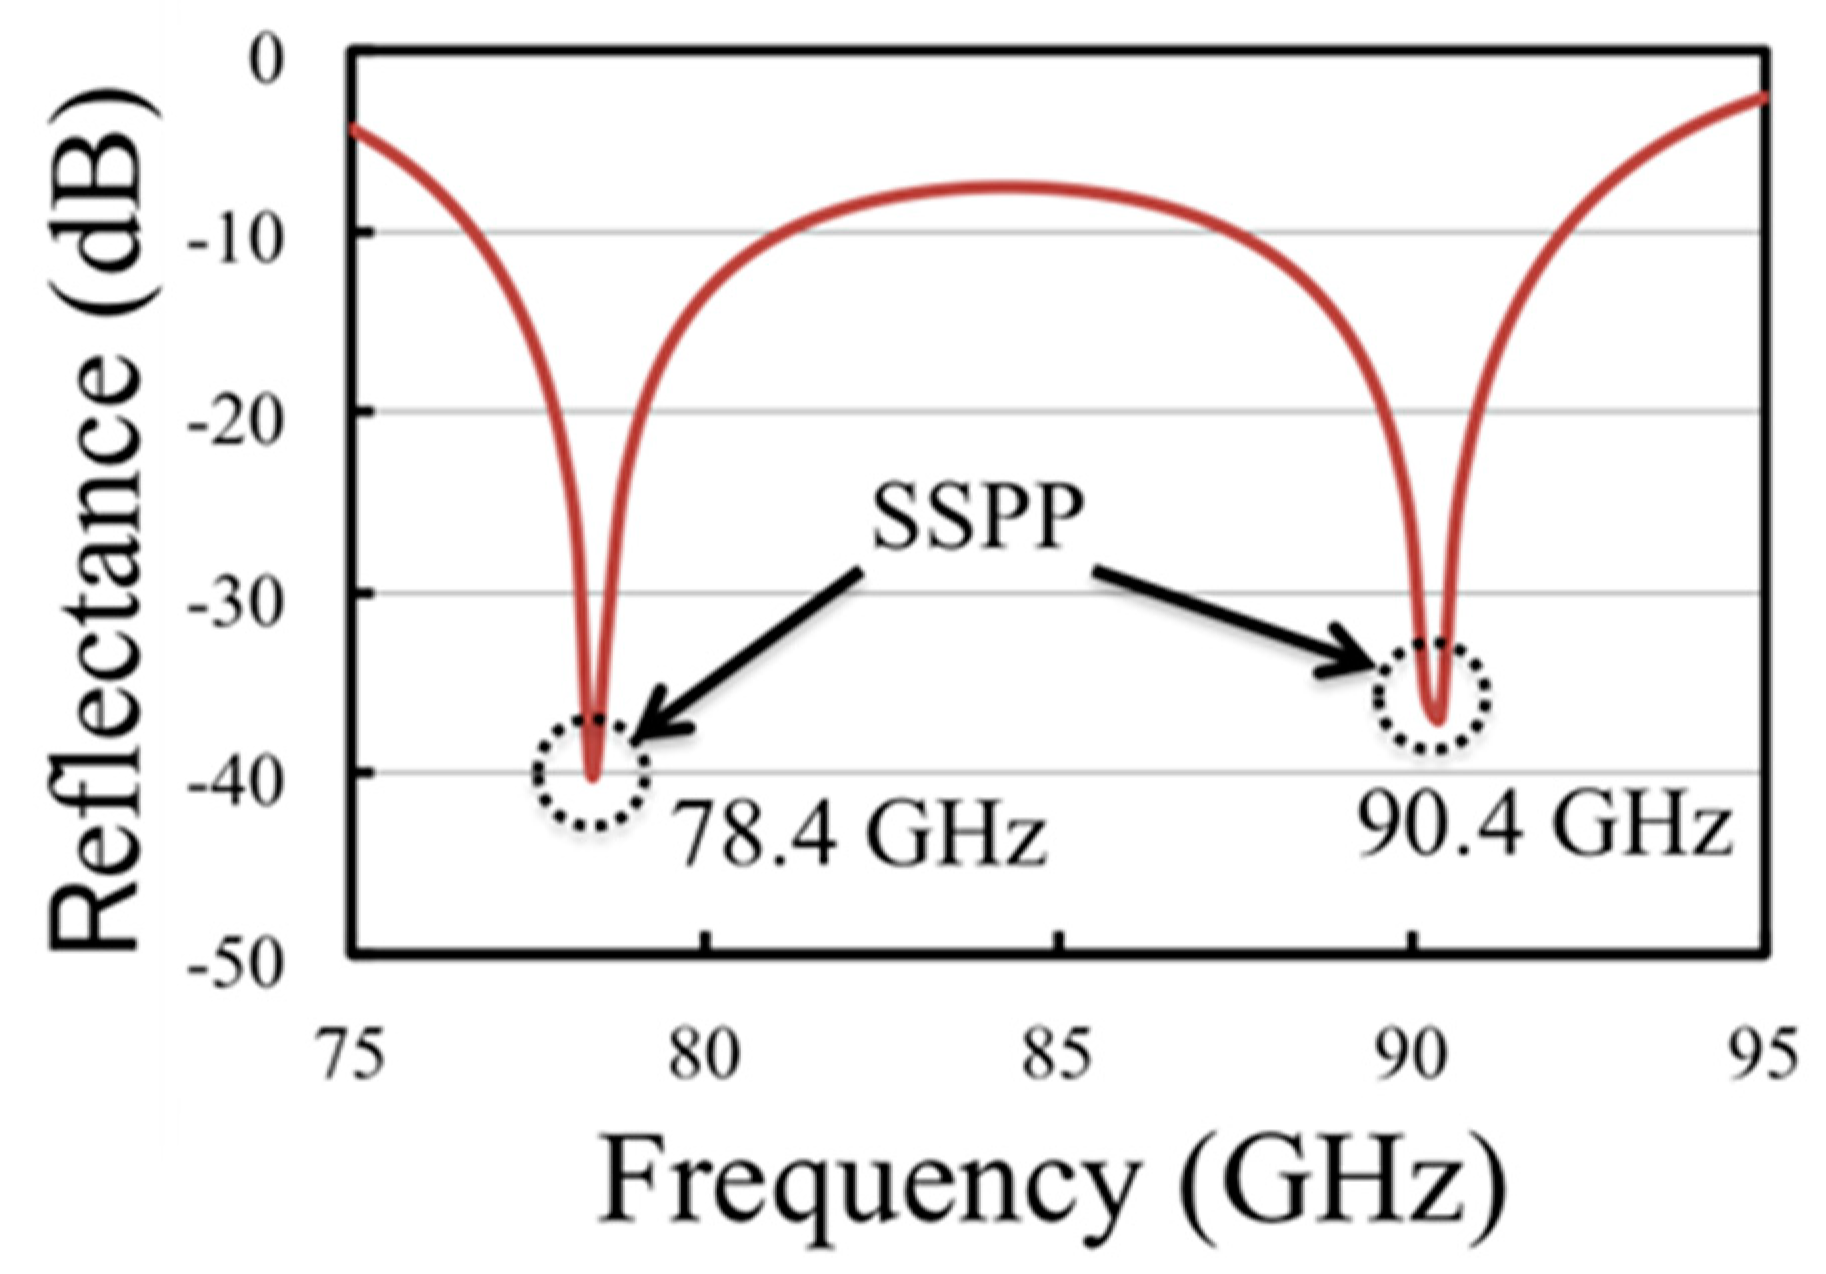
Figure 4 for the MHA, SSPP modes exhibit resonant frequencies in a range lower than the cutoff frequency. To confirm this prediction,
S-parameters (
S11 and
S21) are analyzed under the above conditions in our numerical calculation, as shown in
Figure 6 and
Figure 7.
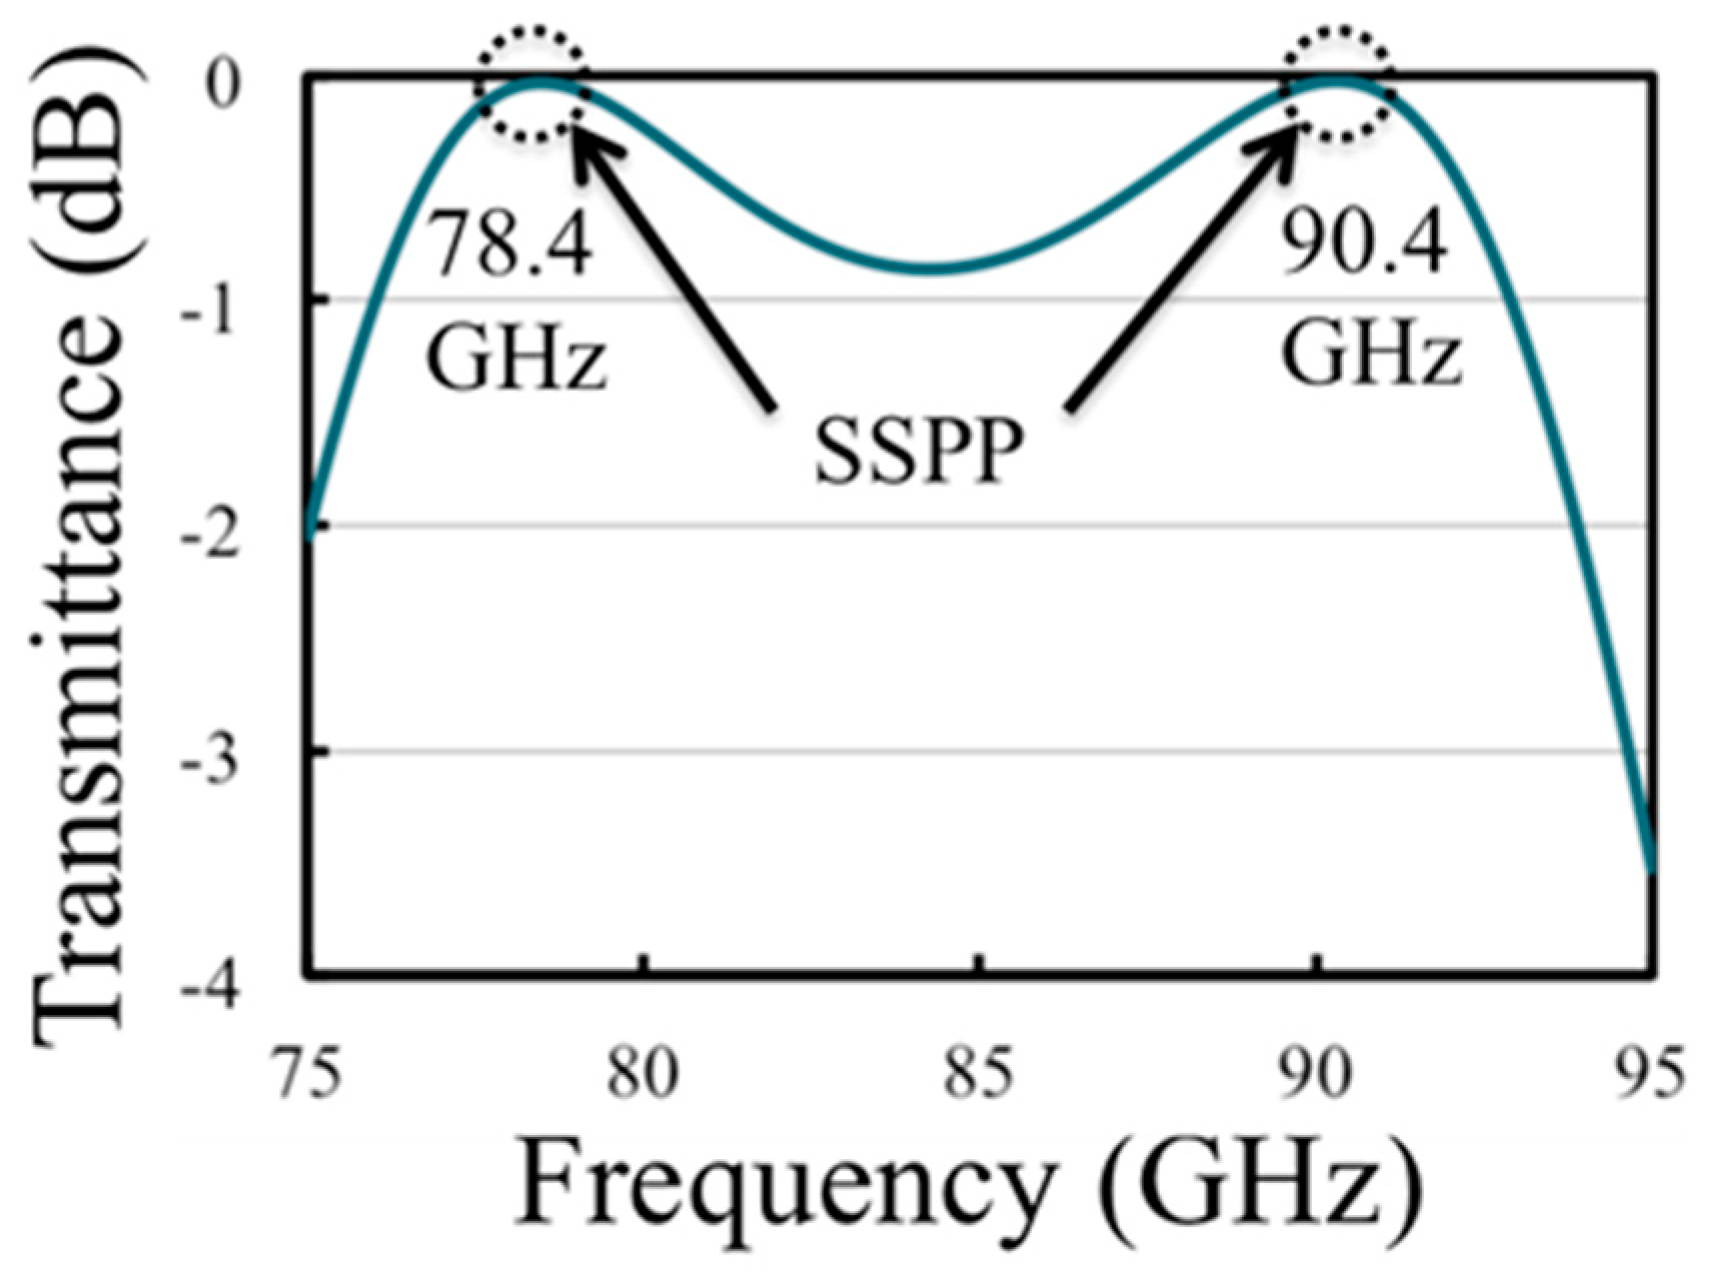
In
Figure 6 and
Figure 7, the frequency spectrum of the transmission rate has peaks around 78.4 GHz and 90.4 GHz. This indicates the existence of at least two resonant frequencies in the MHA. These two resonances coincide with the intersection points of the dispersion relation of the SSPP and the light line in
Figure 4; at these frequencies, energy conversion from the mode in free space propagation to the SSPP mode is smooth, thanks to good wave matching conditions. This phenomenon was termed extraordinary transmission as one of the features of an MHA [
17,
18,
19,
20,
21]. In other words, at 78.4 GHz and 90.4 GHz, SSPP generation/propagation is possible where SSPP modes are able to uniformly concentrate electric fields on and in the vicinity of MHAs due to the multiple lattice scattering described in Equation (18).
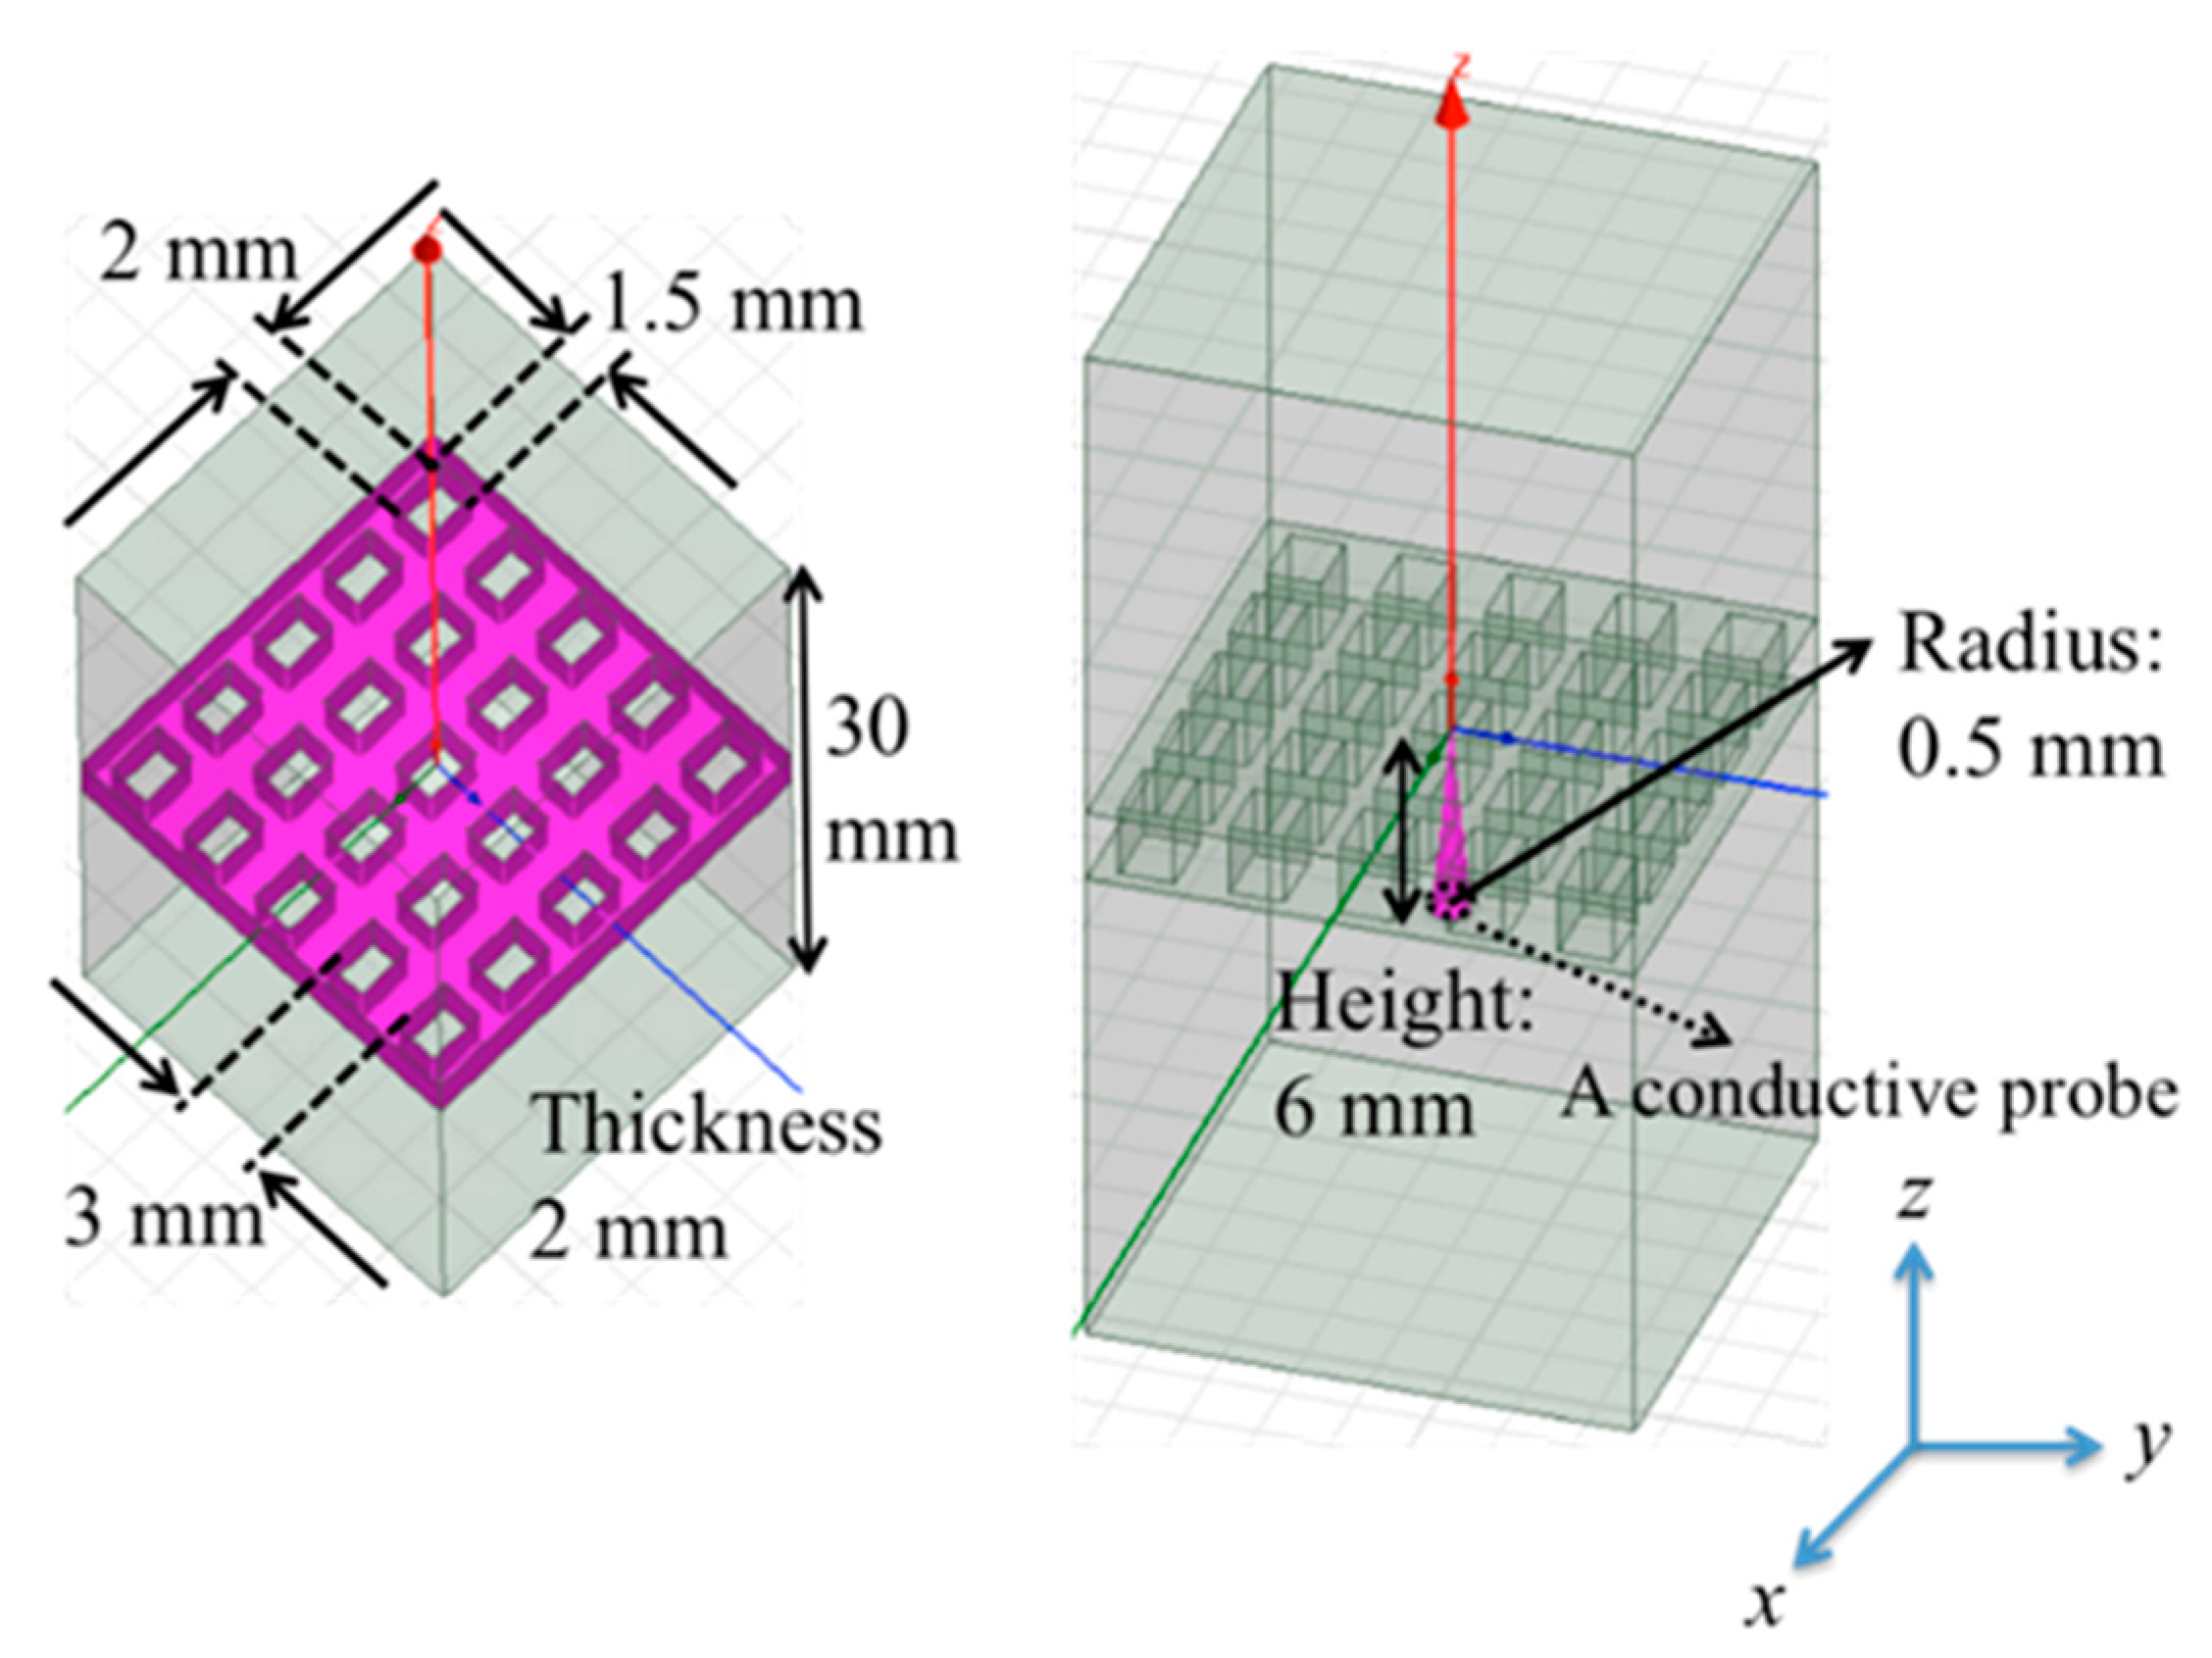
In this uniform 2D field, localized distortion is induced by inserting a needle-like conductor into a hole of the MHA. Electric fields are distorted strongly at sharp conductive boundaries, a phenomenon known as the near field effect [
30], unlike wave propagation that includes a dispersion relation. Such distorted electric fields decay spatially with a wavelength-order attenuation constant. For this reason, another set of two analytical models (shown in
Figure 8) was tested in our simulation runs. One has the MHA equipped with a conductive probe, and the other has only the MHA with its periodic 2D structure. That is, although the shape of both MHAs is the same as that in the model in
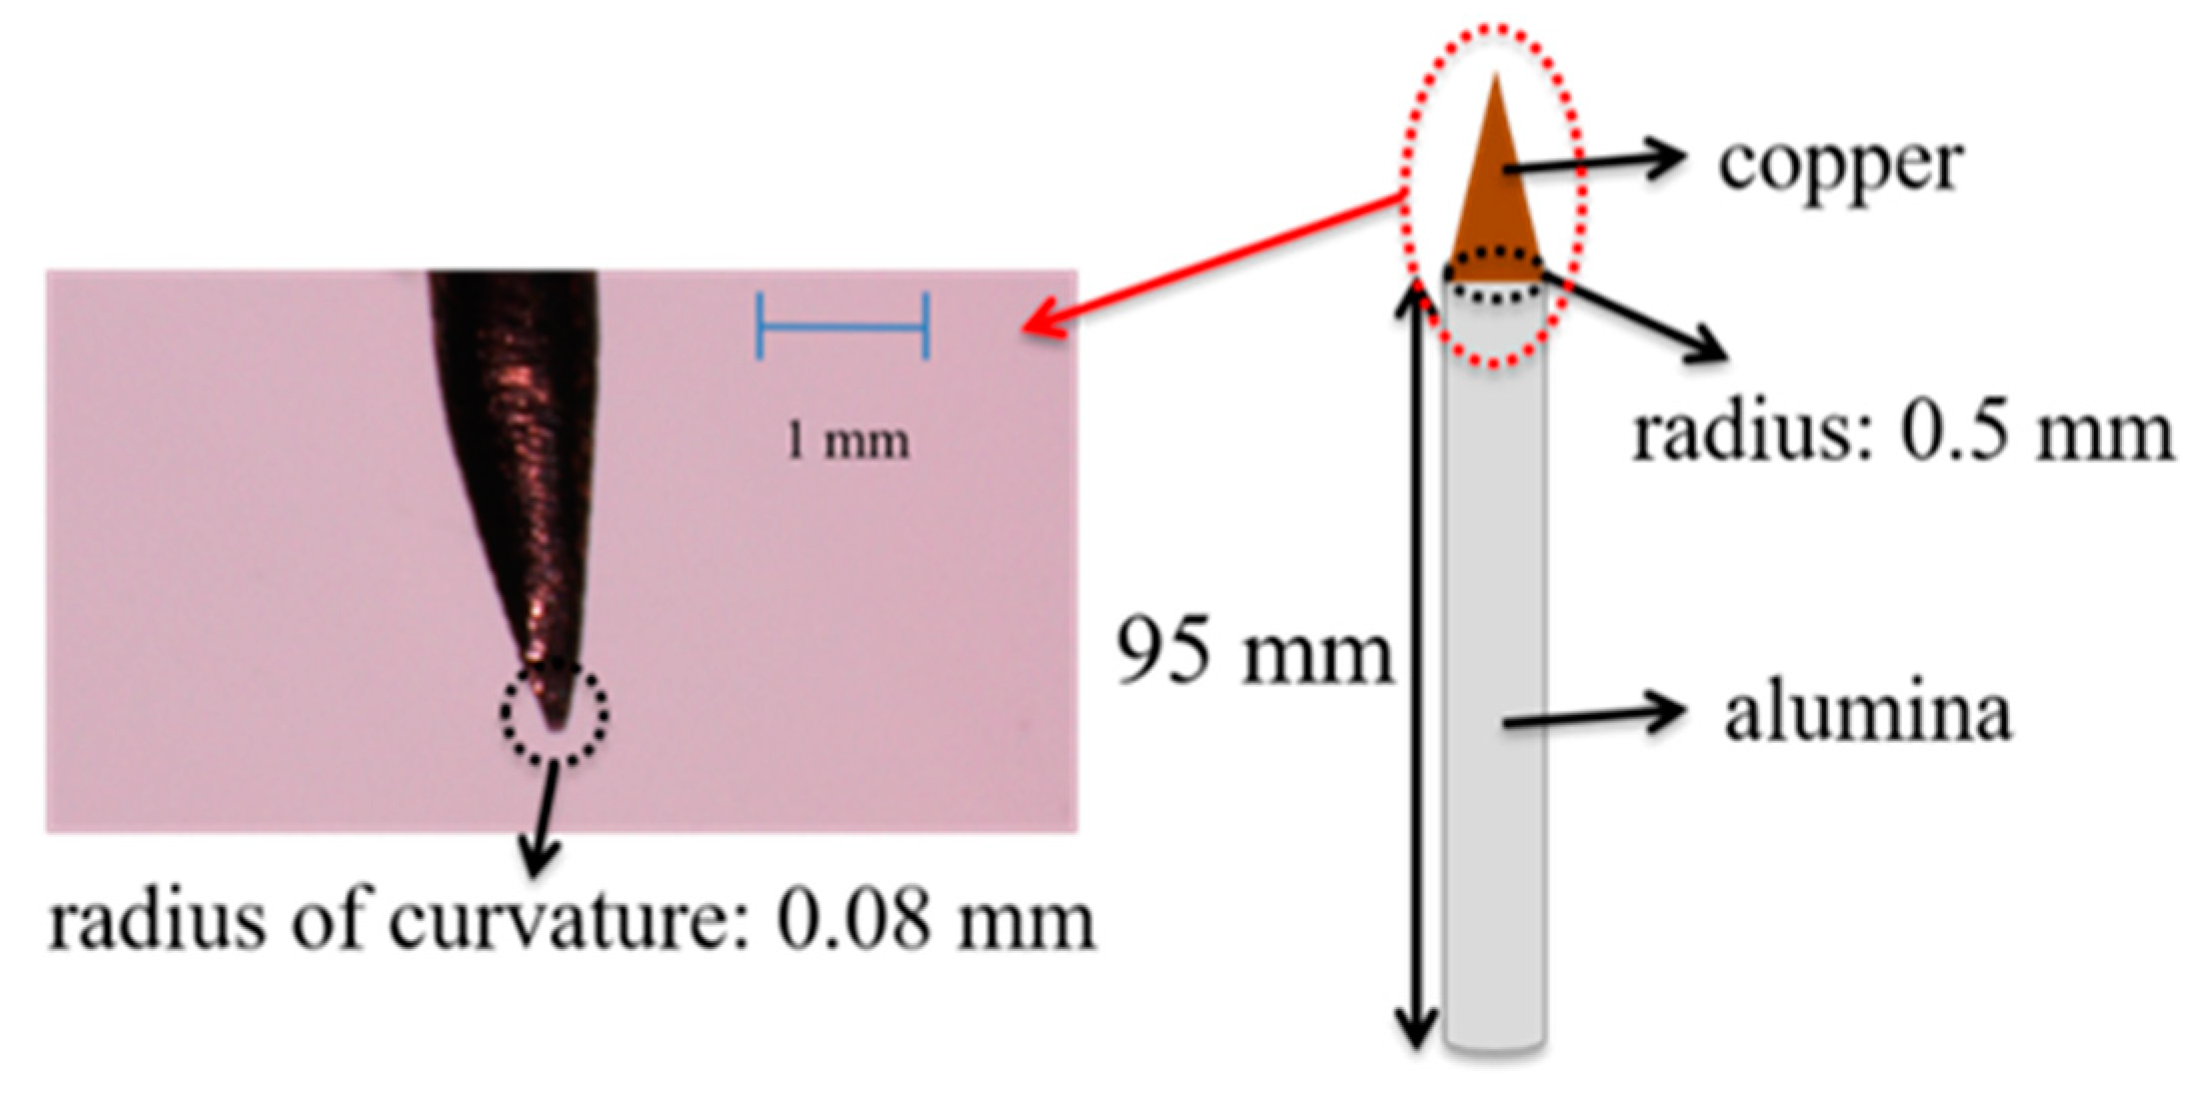
Figure 5, the model has 5 × 5 holes in order to observe the difference in electric field distributions between case 1, insertion of a conductive probe in the MHA, and case 2, removal of the conductive probe. Note that the model of a conductive probe is positioned in or near a center hole. The probe has a cone shape, with a radius at the bottom plane of 0.5 mm and a height of 6 mm. Under these conditions, by using the model as shown in
Figure 8, the electric field distributions of the two cases were monitored at 78.4 GHz, which is a candidate for the SSPP frequency near the resonant frequency observed in
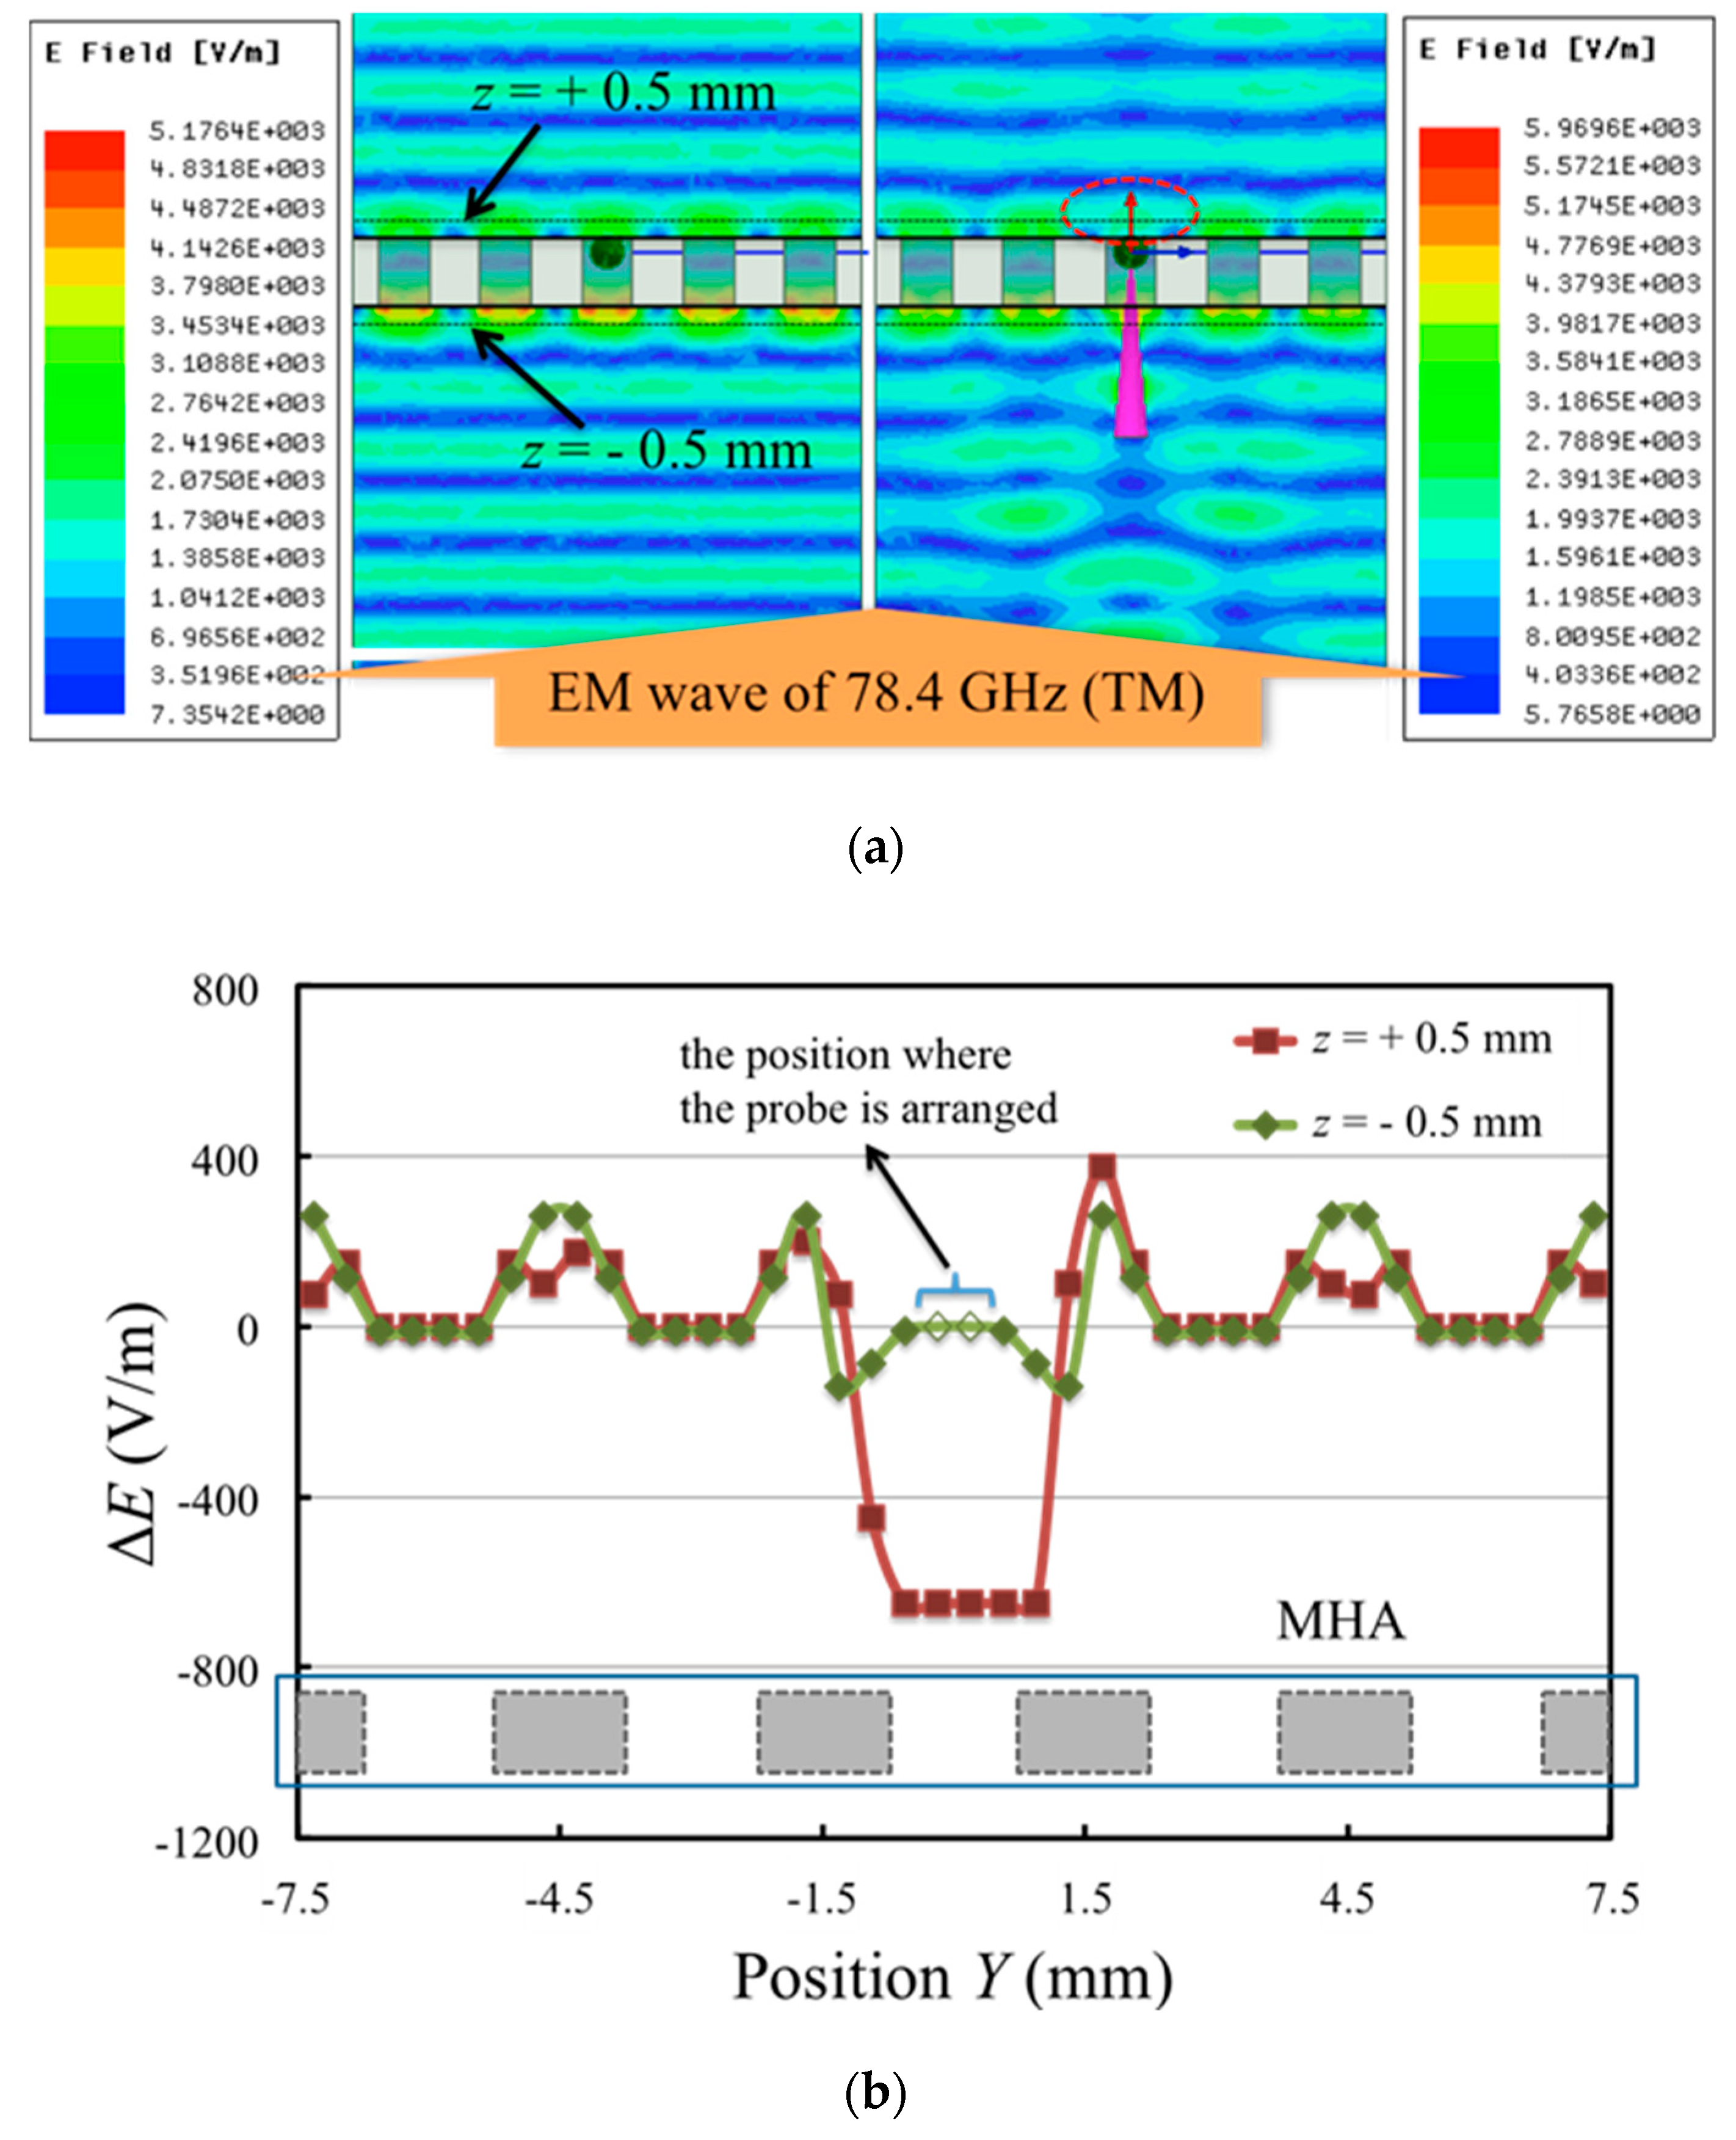
Figure 6. The results of the distributions in the two cases and their numerical comparison at z = +0.5 mm and −0.5 mm, are shown in
Figure 9.
From
Figure 9a, in the case on the left, electric fields are concentrated around the MHA, which is unlike the electric fields of the waveguide mode because those fields are concentrated not around holes but in holes. However, the results indicate that the fields are like compression waves, strongly affected by existing holes. Since the distribution of the fields around the MHA is symmetrical in the
y-
z plane, the electric-field distributions are partial components of an SSPP. This fact is consistent with a feature of SSPPs in which the mode expands its field on the side opposite the incident side when the mode is excited at an incident side. This result shows that the fields distribute by a coupling phenomenon between the SSPP mode and transmission waves. On the other hand, in the case on the right, looking at the electric distribution in the red circle, it was found that the electric field distributions are less concentrated than the distributions at the same region in the case on the left, while field distributions of the other holes in the case on the right are at the same level as those in the case on the left. These facts indicate that the electric fields in the region with the red circle are locally distorted by a conductive probe. Consequently, the results specifically show that localized electromagnetic distortions can be generated by inserting a conductive probe in a hole of an MHA.
From
Figure 9b, as shown in the numerical results in the case of
z = +0.5 mm in
Figure 9a, it was found that there are significant differences in the region around a conductive probe. This is because the electric field distribution on the MHA is deformed by the insertion of a conductive probe, as displayed in
Figure 9a. On the other hand, from the numerical results in the case of
z = −0.5 mm, it was found that the difference between the two electric field distributions under the MHA is much smaller than the one on the MHA. This might be explained by the suggestion that the field distributions around the MHA are only distorted by a near-field effect. From these results, the differences in the two cases are potentially sufficient to detect the information in the deformed distributions because in practice, these differences are detected as signal intensities related to the square of the electric field.
The discussion above suggests that by taking the difference between the electric-field distributions of the holes when a conductive probe is inserted, and when not, local signals in the limited vicinity of each hole of the MHA can be obtained with detectable intensities and enhanced spatial resolution.
4. Two-Dimensional Imaging Experiments Using MHA and a Conductive Probe
In
Section 3, the numerical results showed that an SSPP propagates in the MHA when electromagnetic waves at optimal frequencies enter the plate, and that its propagation can be locally deformed by a conductive metallic probe. To detect wave media information at the deformation point where electromagnetic waves enter the MHA, scattered waves generated apart from reflected waves play important roles in the frequency range, which includes the incidence of optimal waves. In the experiments discussed in this section, we used scattered waves, which exhibit the characteristics of local electromagnetic distribution [
31]. Transmitter and receiver antennae, and a conductive probe are the main diagnostic tools manipulated for signal detection.
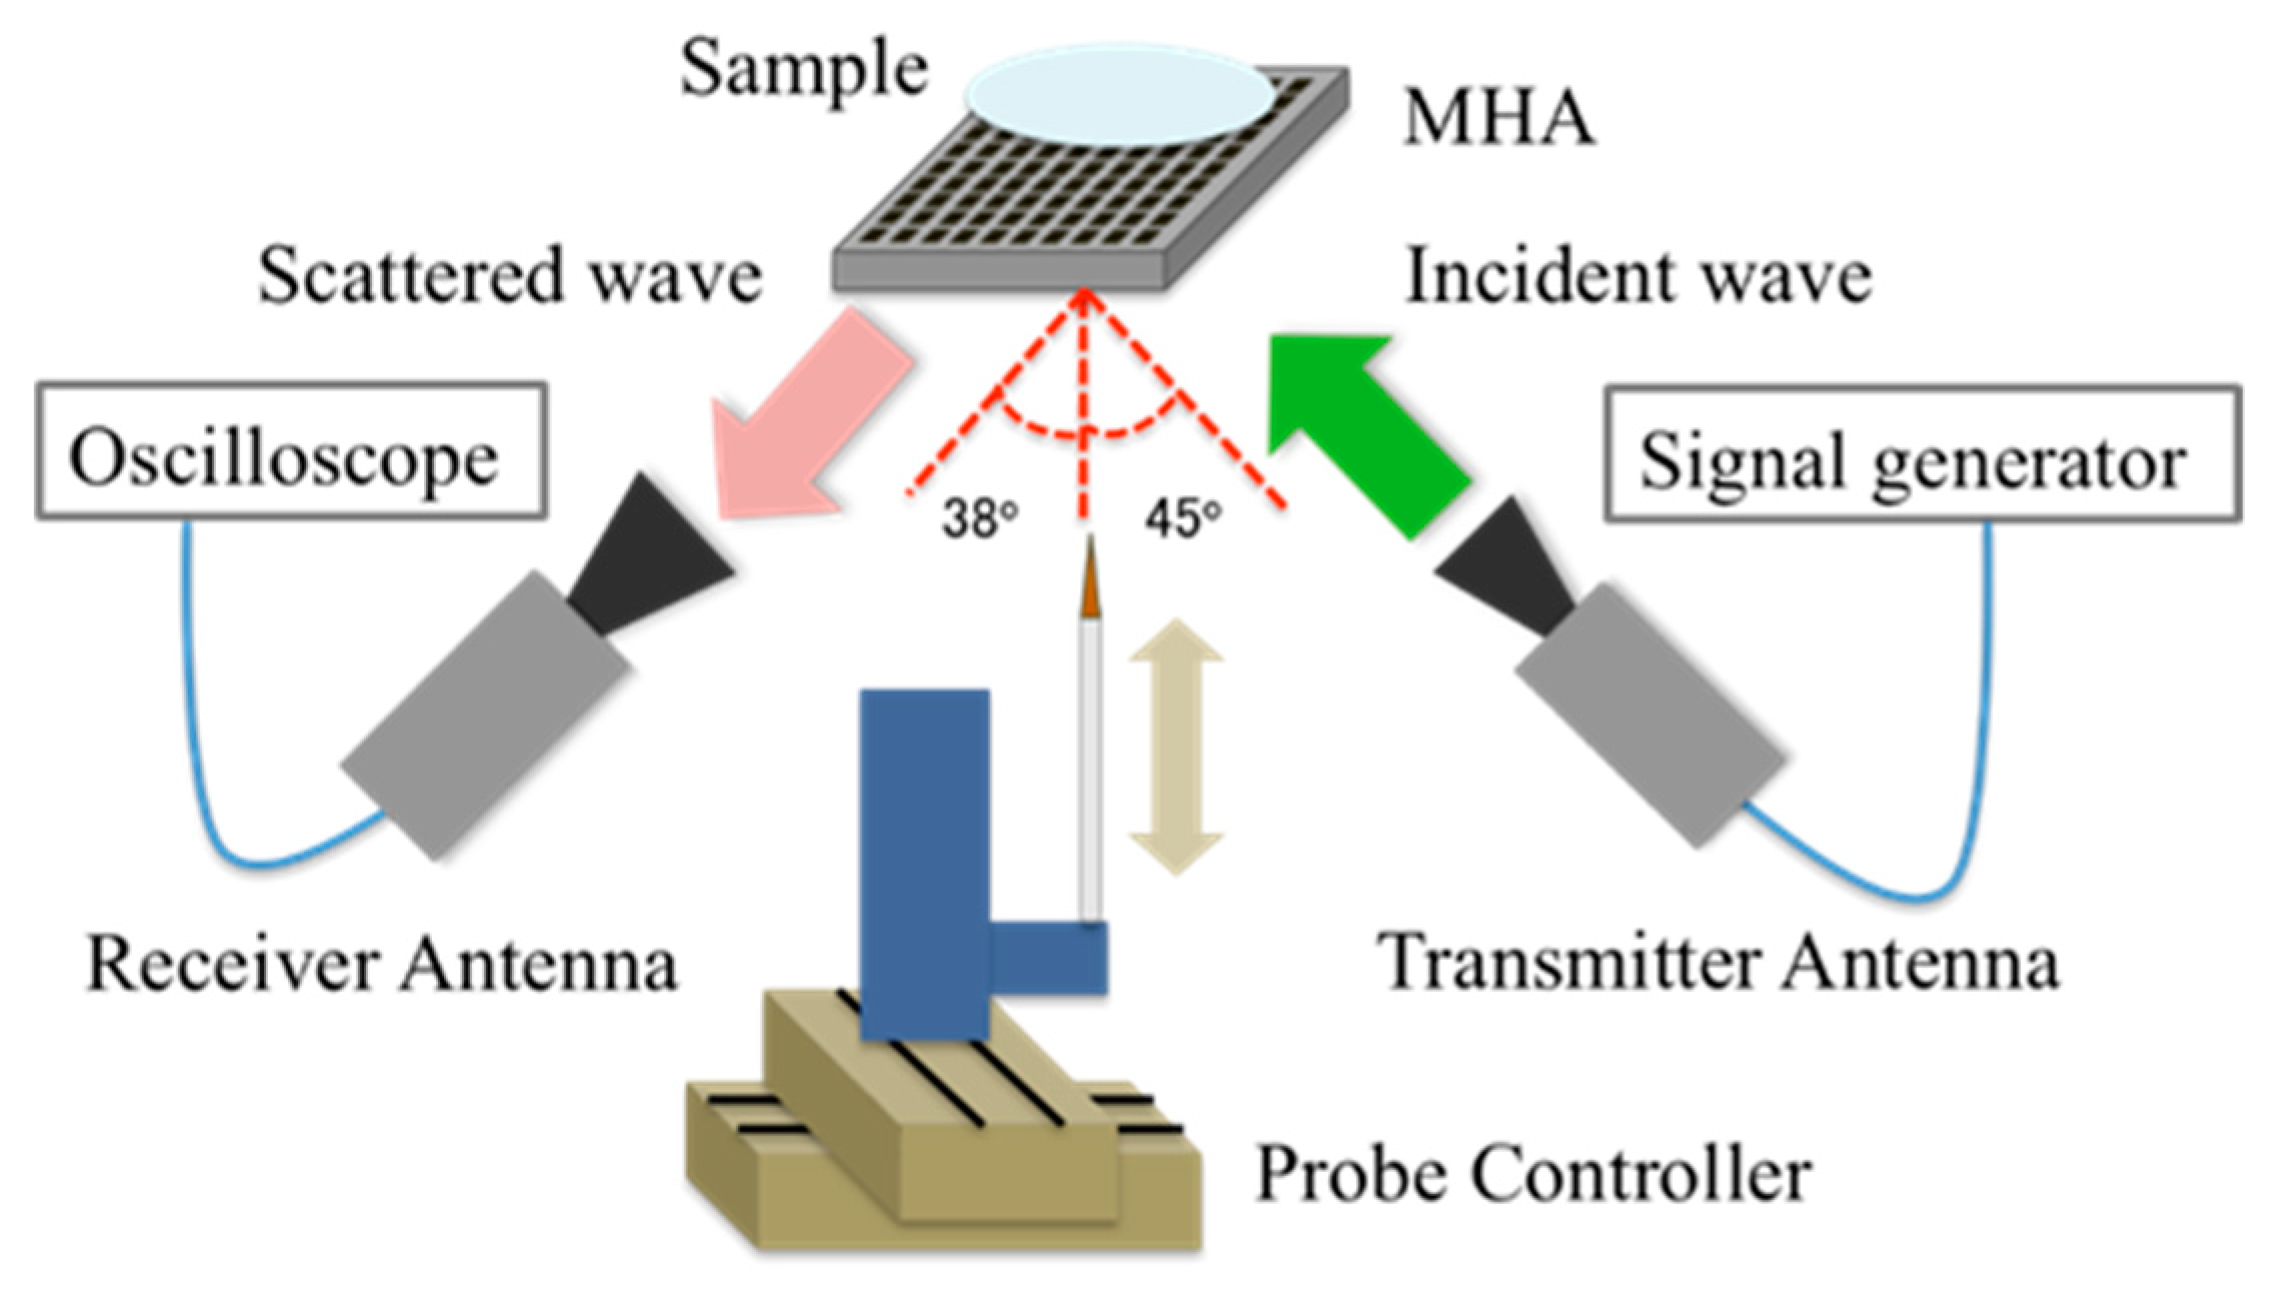
We performed experiments on one- and two-dimensional imaging using an MHA with structural parameters that were the same as those in the analytical model, and the MHA was equipped with a scanning conductive probe. After the one-dimensional imaging experiments, two-dimensional imaging experiments were performed using conductive and dielectric samples. Finally, we demonstrated a biomedical diagnosis in the case of a rat lung by using the system. The experimental system is shown in
Figure 10,
Figure 11 and
Figure 12, with a schematic view of the corresponding MHA and the conductive probe.
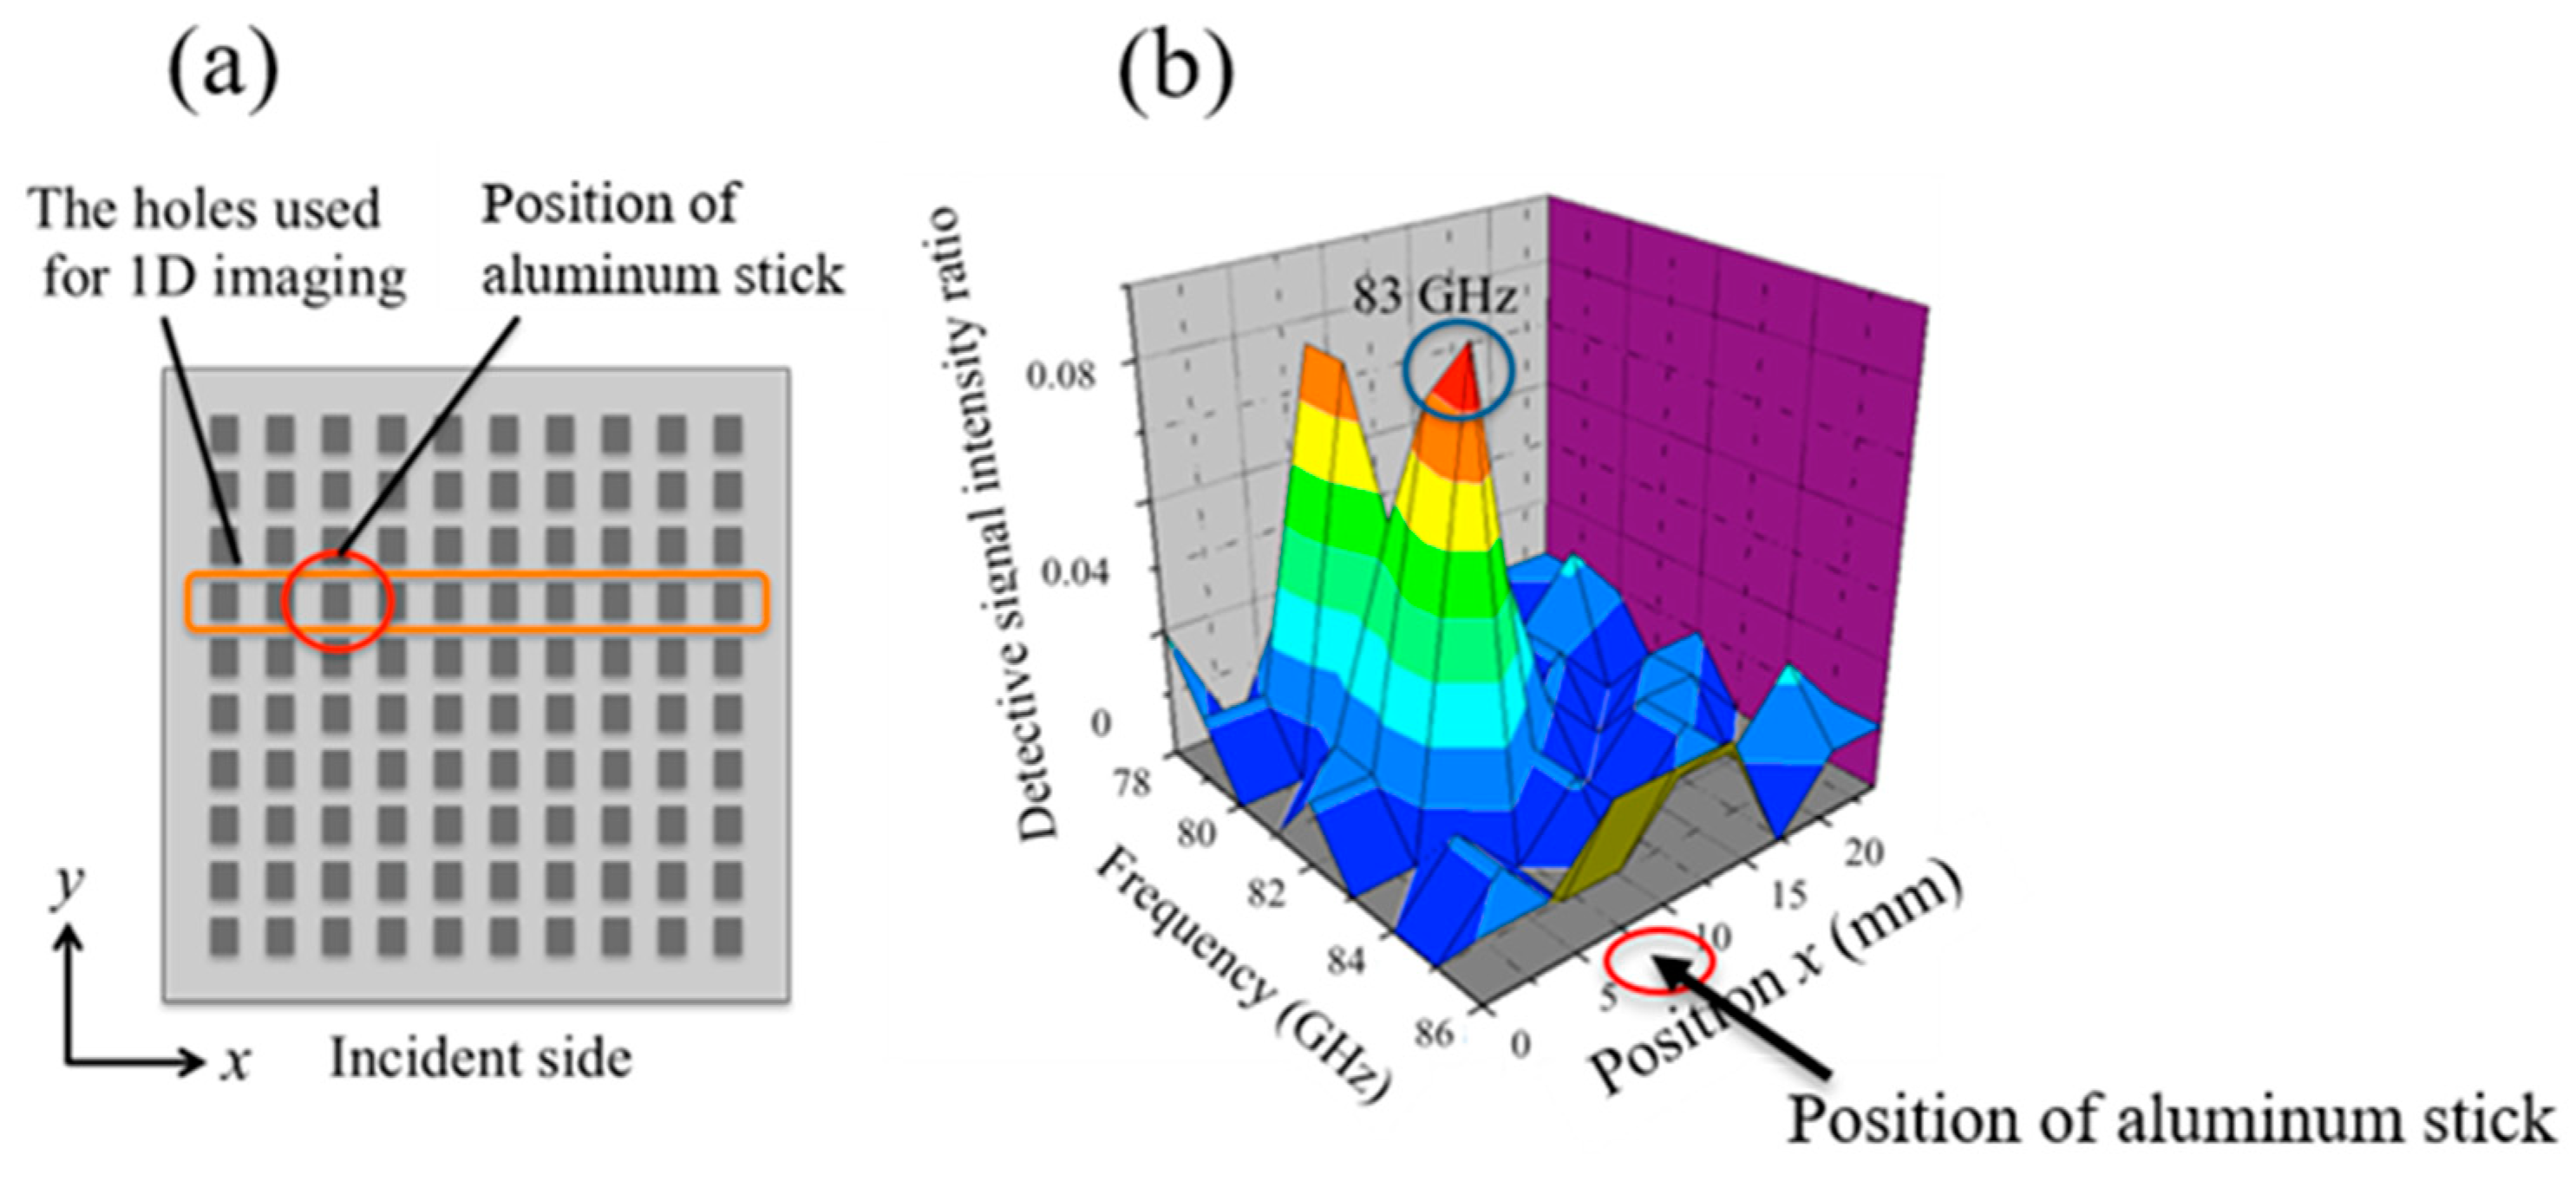
As suggested by the above analyses, we searched for the most appropriate frequency for electromagnetic-wave experiments in the optimal bands for SSPP propagation, by using one-dimensional imaging experiments, which gave us simple and straightforward evidence as the conductive probe scanned along one line. With the incidence of electromagnetic waves at 78–86 GHz from a transmitter antenna into the structure shown in
Figure 11, SSPPs form on the MHA and scattered waves are emitted, partly at the reflection angle of 38 degree. For a specific diagnostic sequence, two signals detected by a receiver antenna were recorded; in case 1: the conductive probe is inserted into a hole of the MHA, and in case 2: the conductive probe is removed from the MHA. By repeating the process, the signals in case 1 and case 2 of all the used holes shown in
Figure 13 were obtained. Subtracting the signal of case 2 from that of case 1 for each hole, the differential signals of all the holes create one signal data set with a spatial profile. The processes described above were conducted for the following two series; for data set A; a sample (cylindrical aluminum stick, radius 1.6 mm, height 110 mm) on the MHA and for data set B; the sample was removed from the MHA. Finally, the one-dimensional imaging map was completed by subtracting the signals of data set A from those of data set B. The sample, and the results as an example are shown in
Figure 13.
Figure 13 shows that the detected signals of a conductive sample obtained at
x ~ 8 mm, which corresponds to the location of the sample, are remarkable when electromagnetic waves in the frequency range of 78–80 GHz and around 83 GHz are incident. It also indicated that other waves cannot detect significant signals. Since the incident angle at each hole of the MHA differs slightly from the reflective angle in the system, detection capacity might depend on the frequency of incident waves to some degree. For this reason, using a longer distance from the MHA to the transmitter and receiver antennas may provide greater uniformity in SSPPs generated on the MHA. From the results shown in
Figure 13, we fixed the operation frequency at 83 GHz.
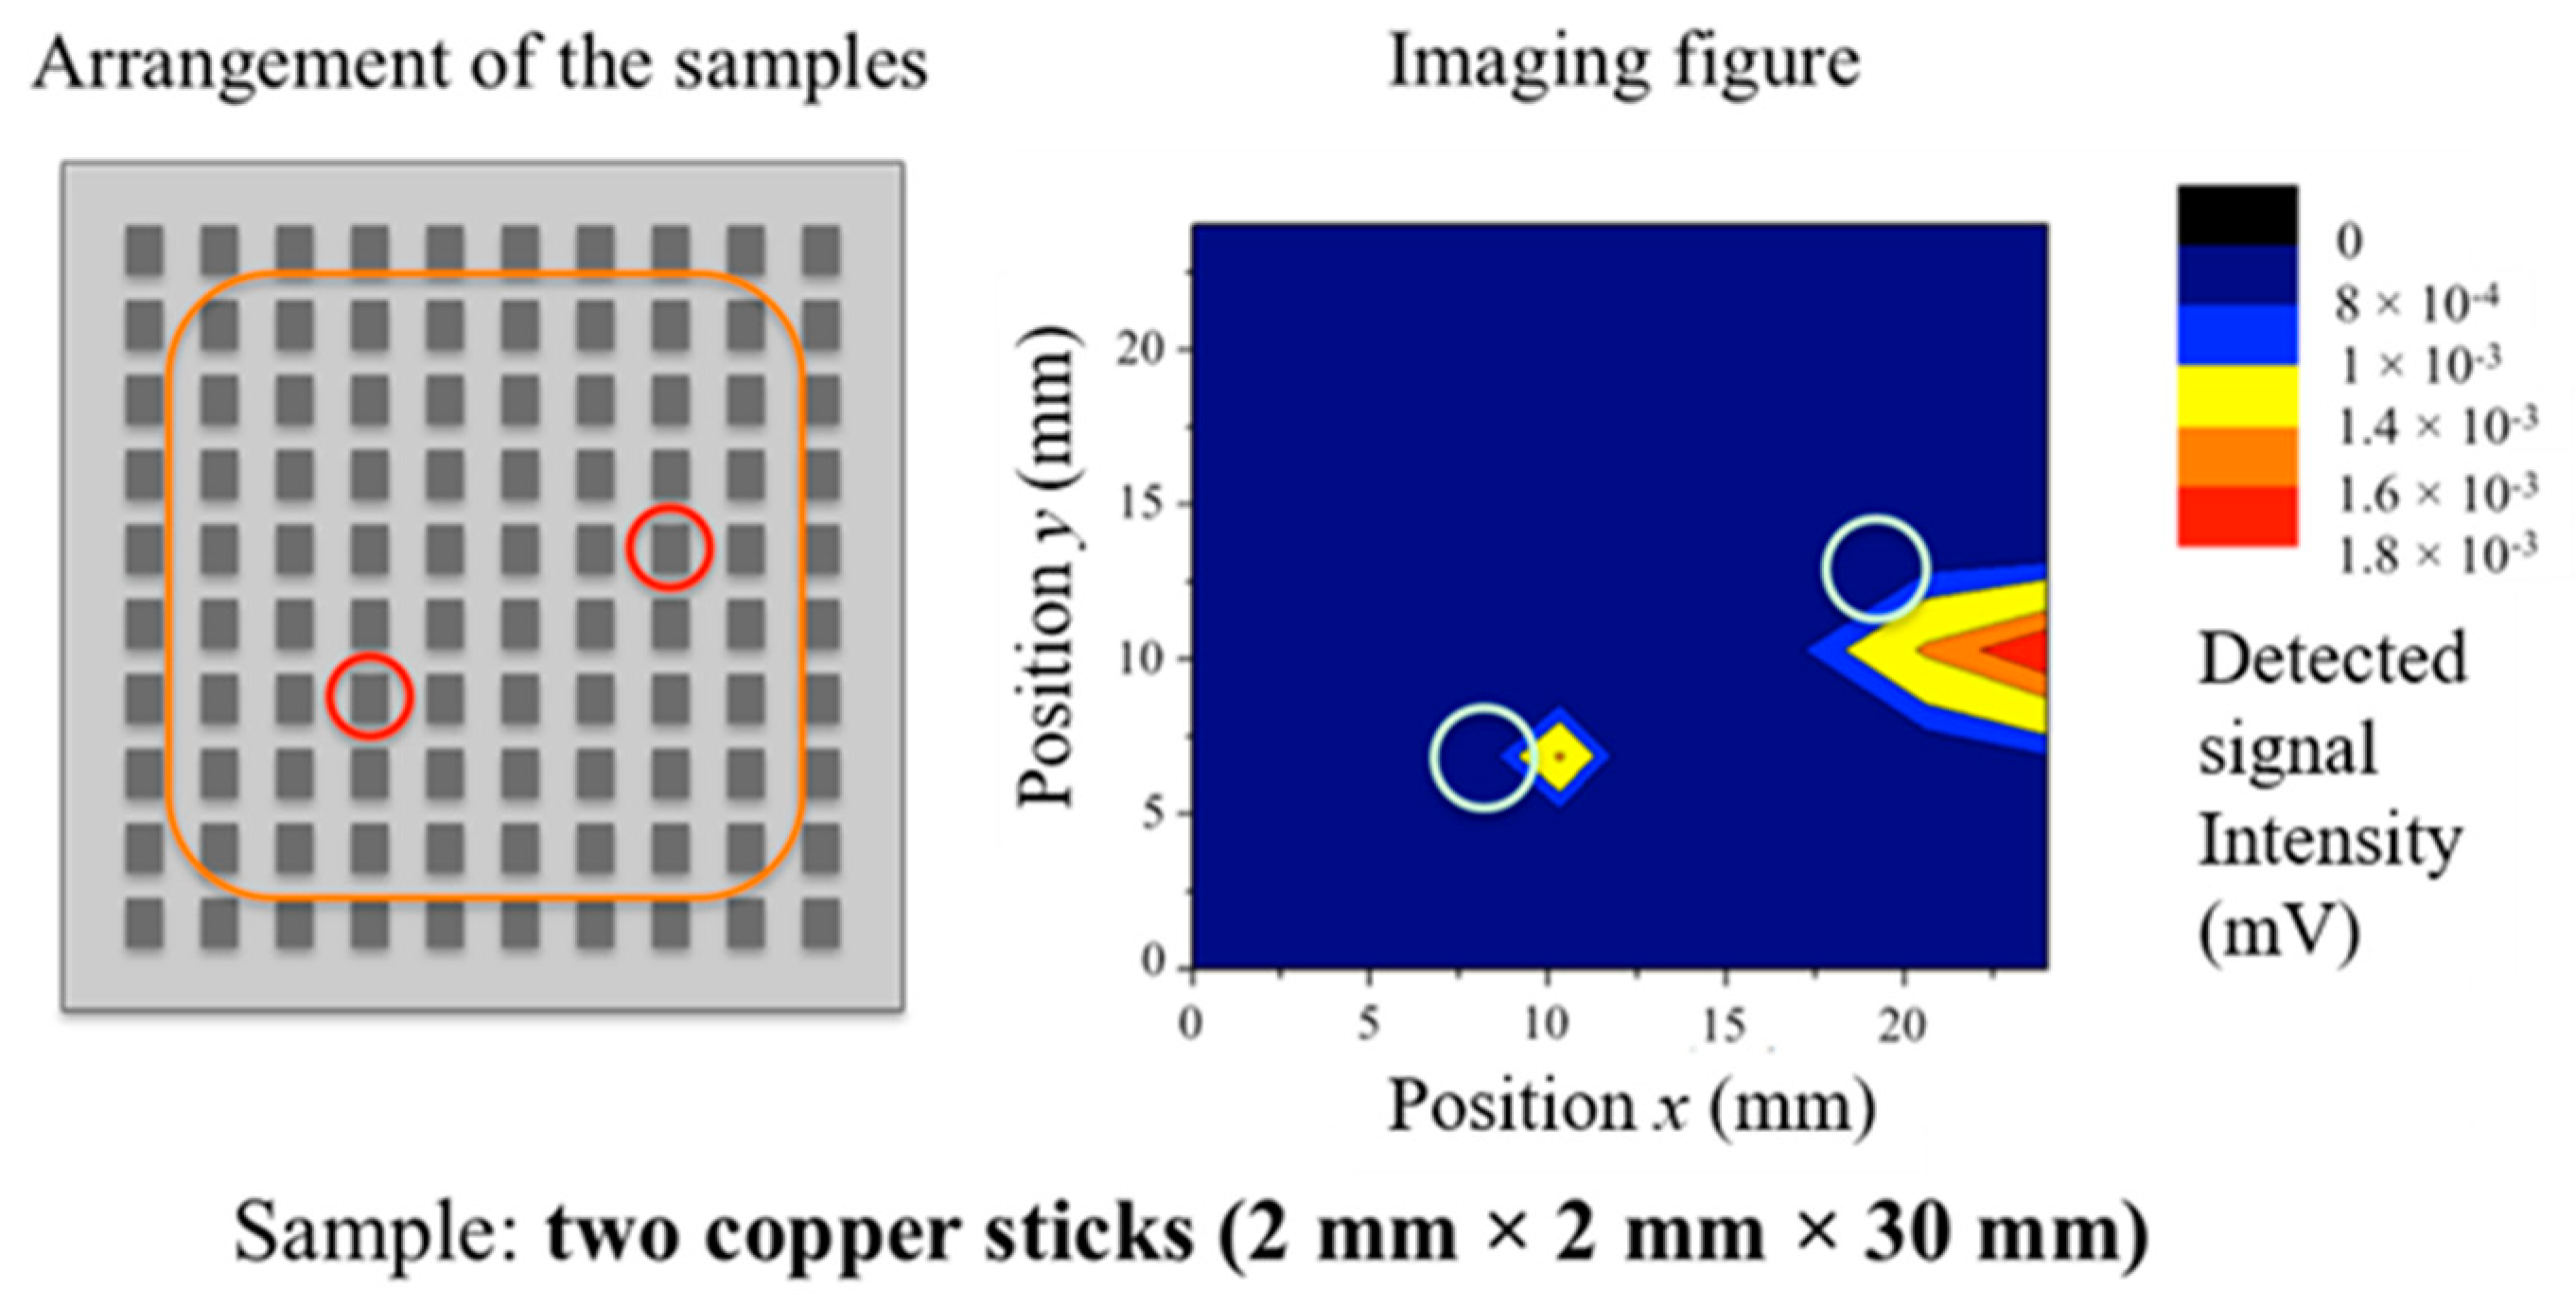
After the selection of the wave frequency based on the one-dimensional experiment, we performed experiments for two-dimensional permittivity imaging. Three samples with different permittivity values were provided, and we used them for two-dimensional imaging experiments, using an experimental system similar to that shown in
Figure 10,
Figure 11 and
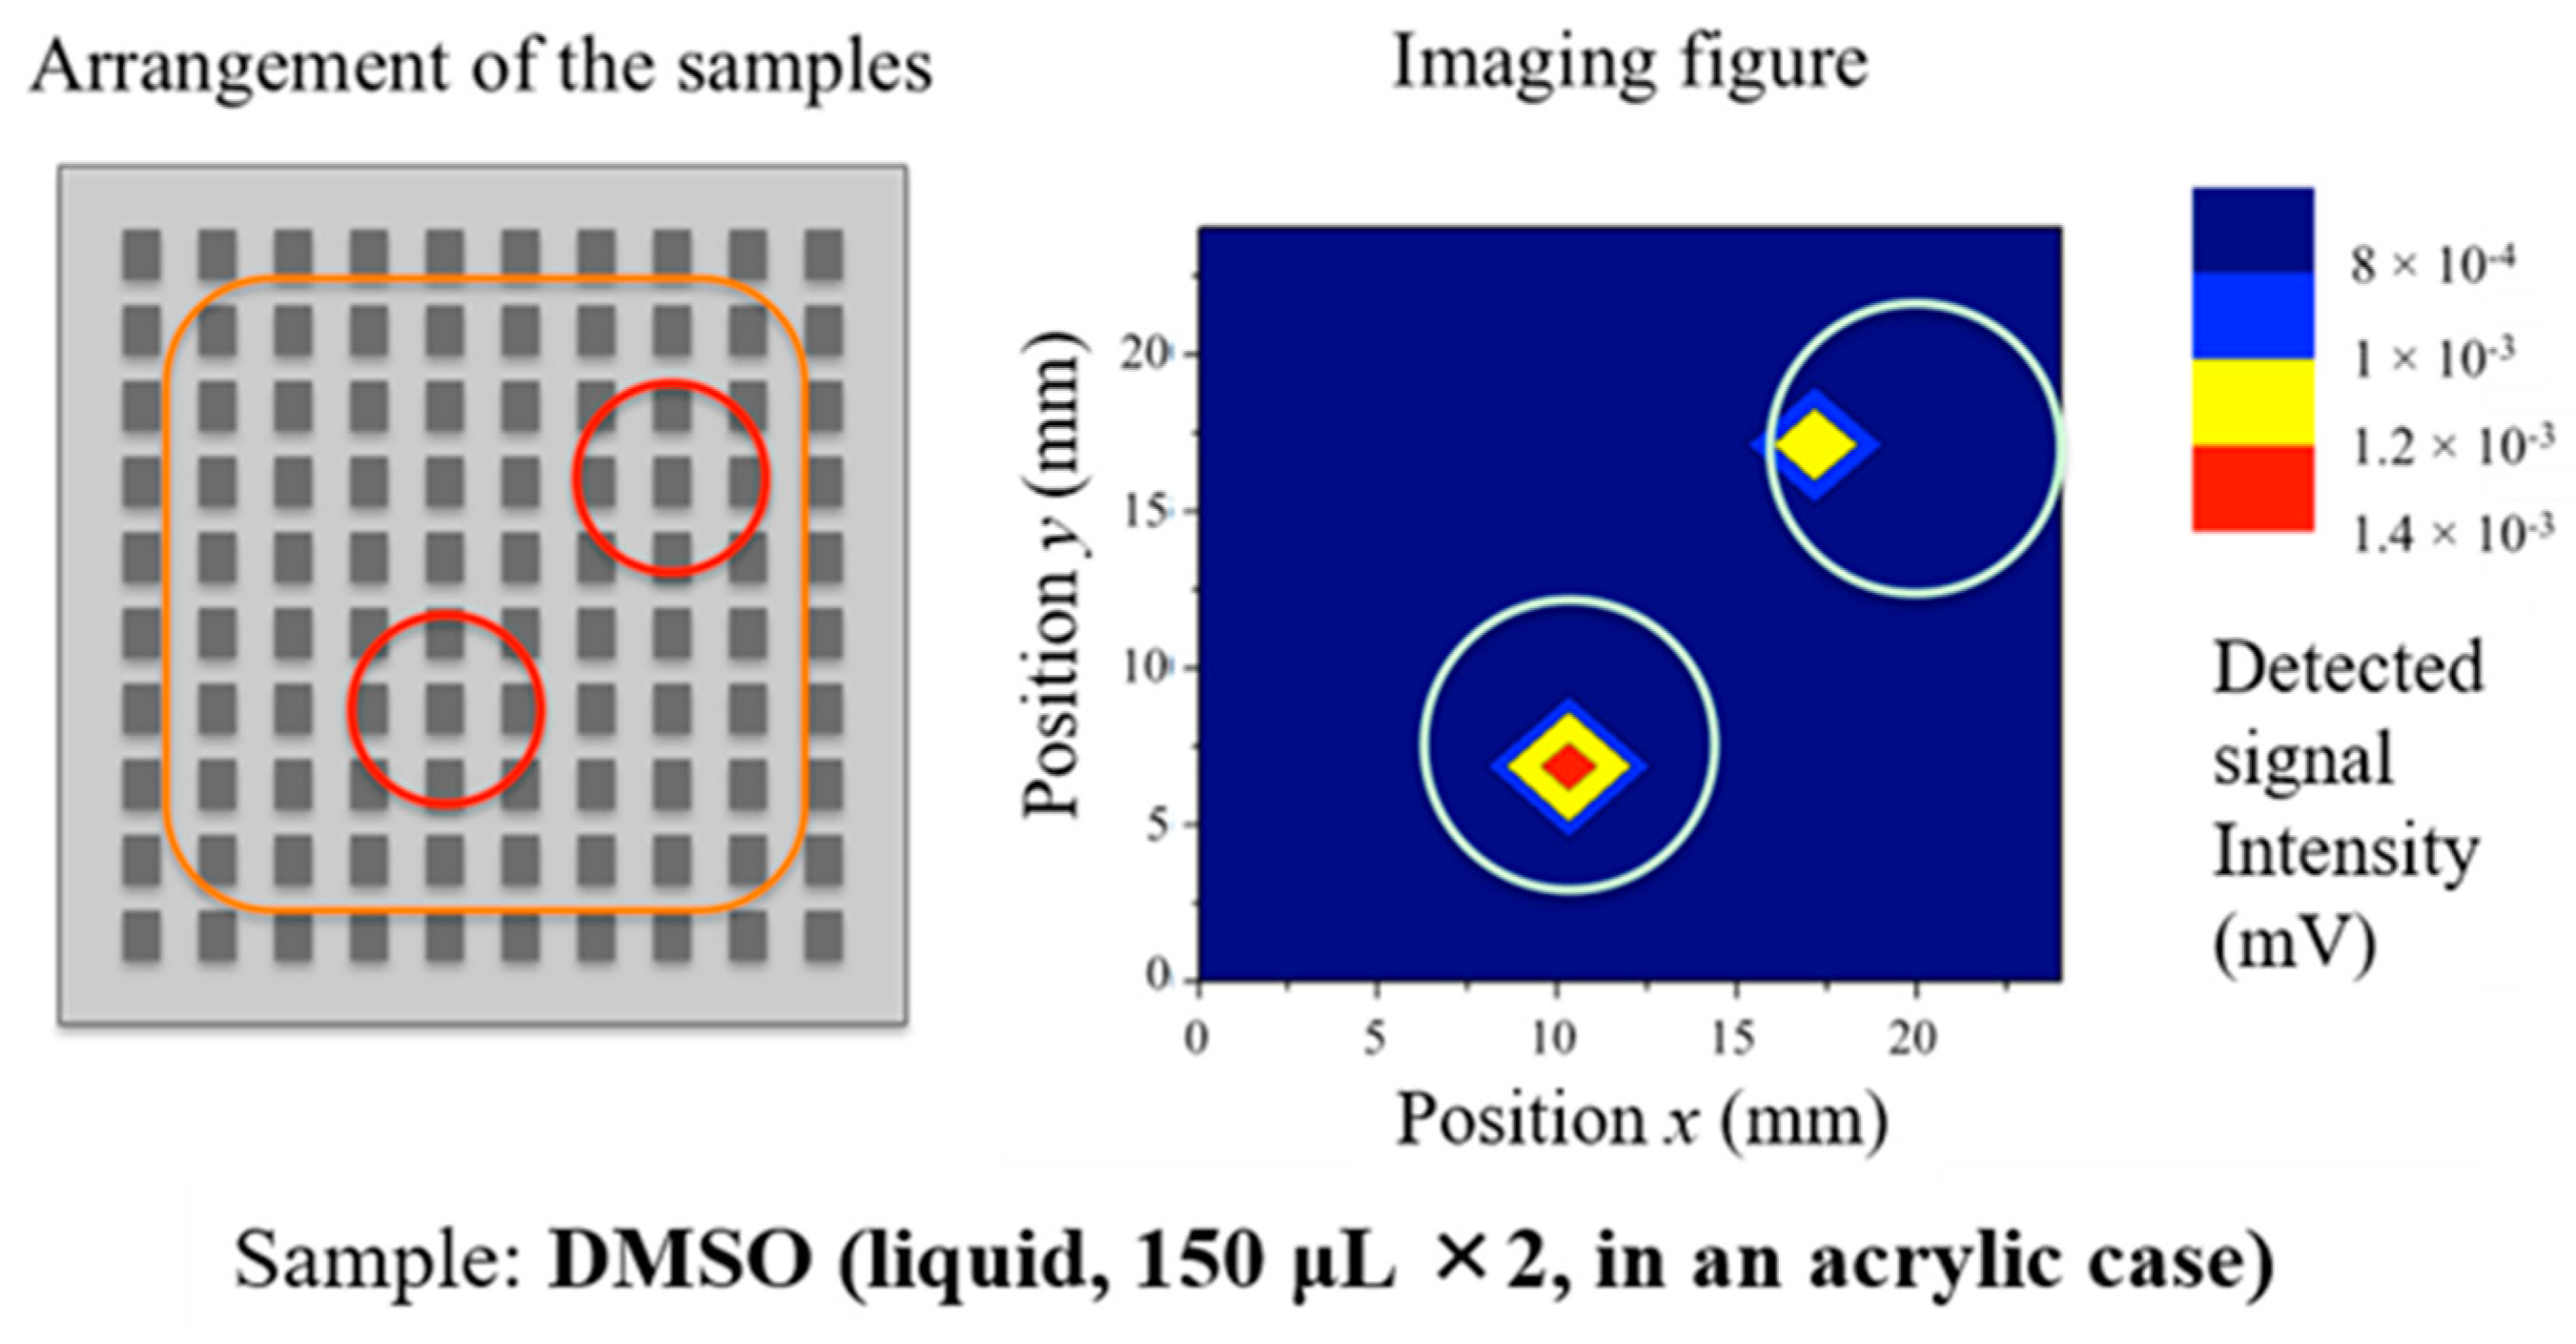
Figure 12. Similar to the one-dimensional imaging experiments, the samples were set up on the MHA, and optimal signals were assured by executing the process described above (two procedures for data sets A and B in which cases 1 and 2 are for profiling). The samples included one conductive material, copper sticks, and a dielectric solid and liquid, an alumina stick and DMSO (dimethyl sulfoxide). The values of relative permittivity of alumina and DMSO are 9.9 and 43 – j10.9, respectively, in the millimeter-wave band. DMSO works as a biomaterial phantom in our experiment, since its permittivity is nearly equal to that of the human body [
32]. To contain the liquid DMSO in the setup, an acrylic capsule array was used as a supporting experimental tool. Therefore, when comparing signals, in data set A the sample was on and in; in data set B, the sample was removed from the MHA and an acrylic capsule array was set up in the same position on the MHA in both cases. The results of the two-dimensional imaging experiments for these three types of sample are shown in
Figure 14,
Figure 15,
Figure 16 and
Figure 17.
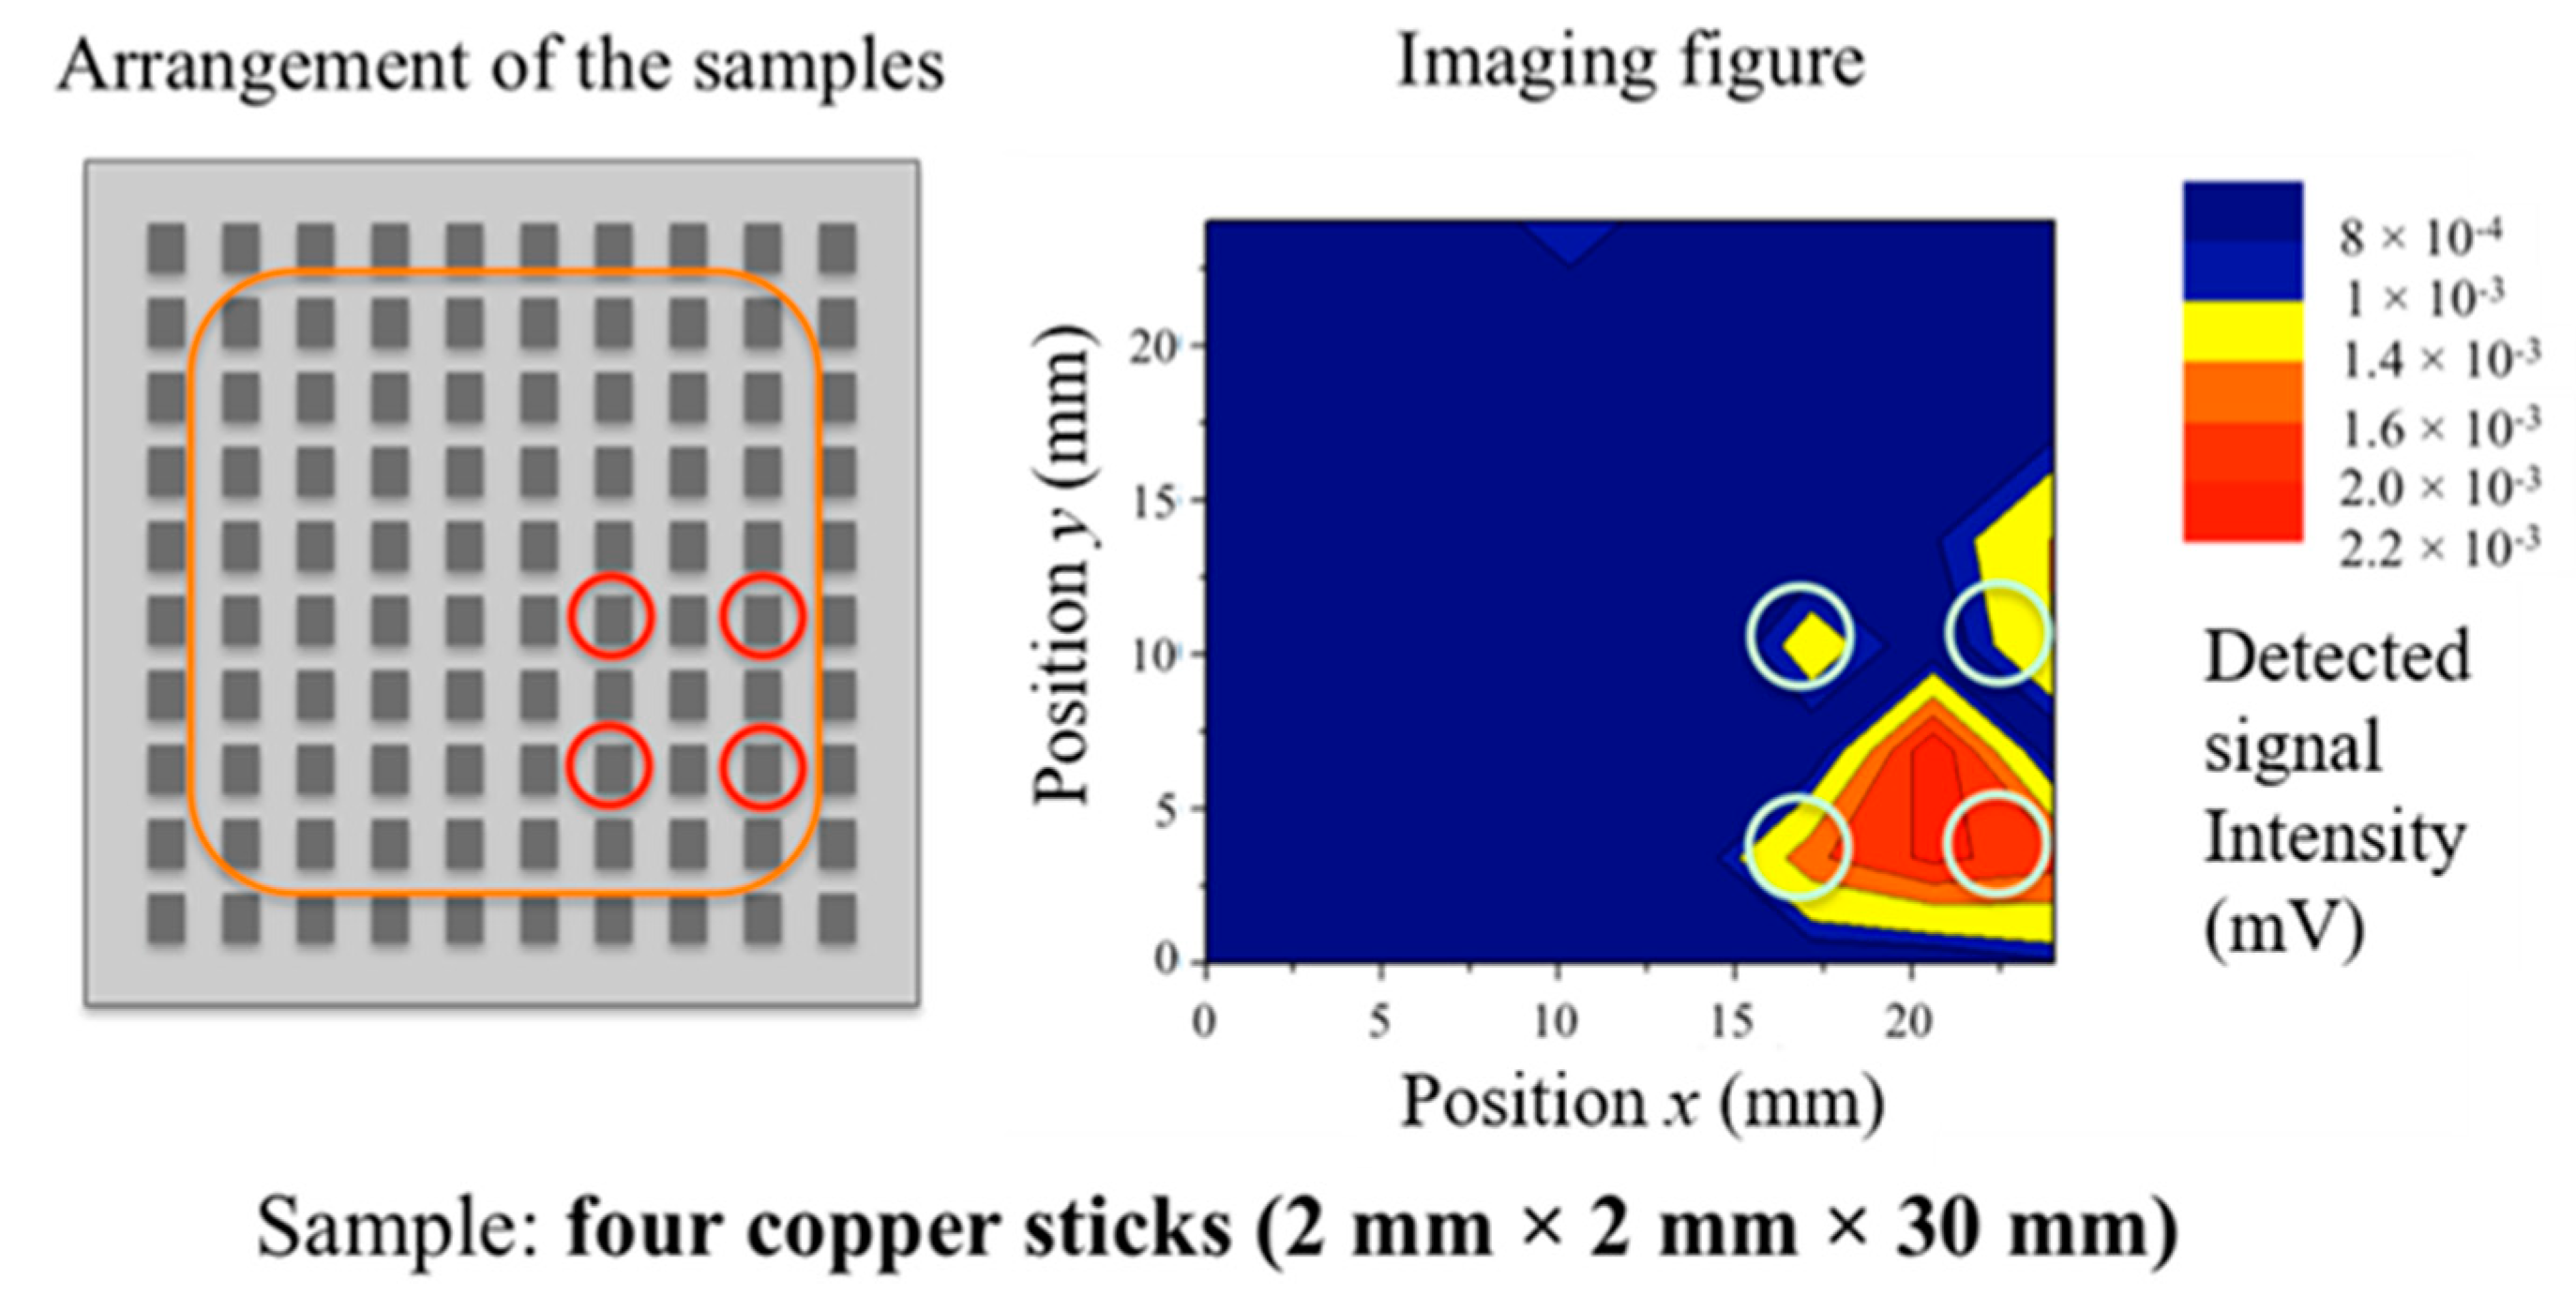
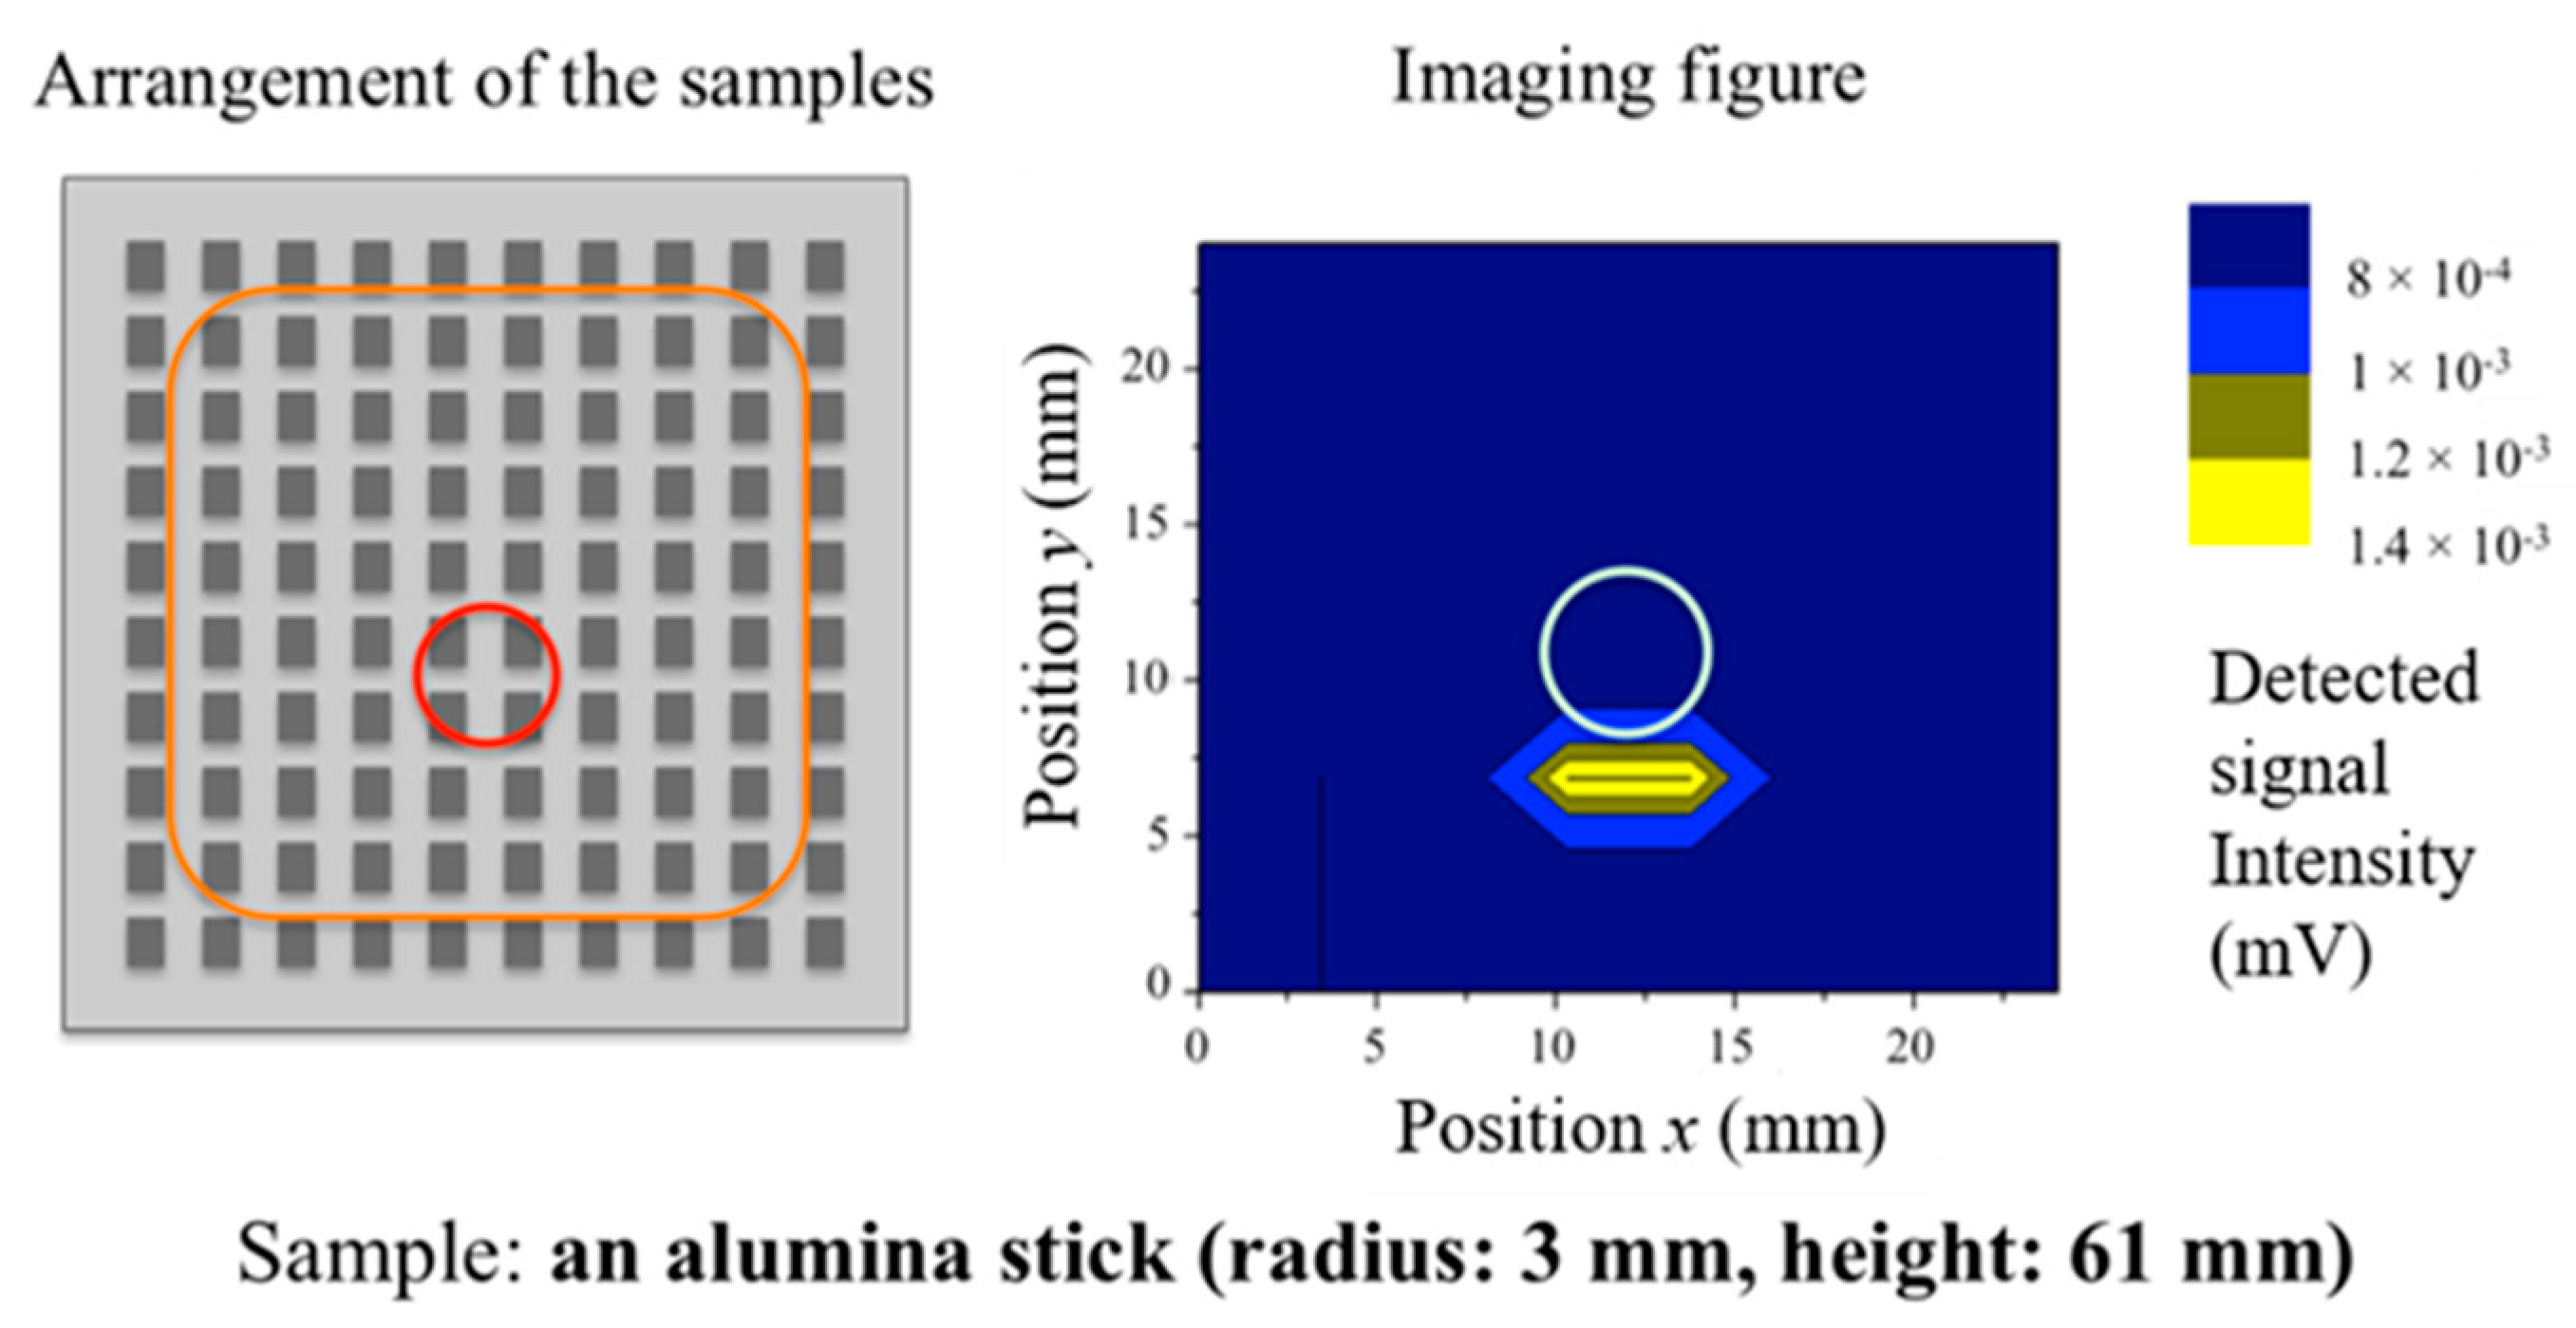
In
Figure 14 and
Figure 15, although the positions of the detected signals are slightly different from the actual positions of the samples, the existence of the conductive samples was clearly detectable and related to their position. Also, in
Figure 16 and
Figure 17, the results confirm the detection of dielectric samples at almost their proper positions even when the positions of the samples varied, though DMSO is a lossy material. These results show the effectiveness of the use of concentrated electric distributions for permittivity signal detection in this scheme, which differs from conventional methods of signal detection in the microwave band. Also, comparing the results of the conductive samples (
Figure 14 and
Figure 15) to those of the dielectric samples (
Figure 16 and
Figure 17), the positions of the detected signals of the former are less accurate than those of the latter. Considering the fact that the electric distributions of SSPPs are distorted to a greater extent by conductors than by dielectrics, the detection accuracy in the latter case may be superior to that in the former case. Furthermore,
Figure 14 and
Figure 15 suggest that the detection accuracy for samples near corners is low in comparison with that of samples on inner locations. Since, in these experiments, the MHA has a limited size and SSPPs on the MHA are reflected at its corners, the electric distribution of SSPPs near corners tends to be non-uniform. Therefore, the distributions in the vicinity of its corners are not stable, and the detection accuracy of samples on corners tends to be low. By using an MHA with a larger number of holes, the detection capacity might be sufficiently accurate for practical use. On the other hand, the maximum values of the detected signal intensities of conductive samples are more intense than those of dielectric samples. In general, electric fields are affected more by conductors than dielectrics because of the boundary condition on the surface of conductors. Since DMSO has the large value of the imaginary part, it is consistent with the fact that the average value of the detected signal intensities in the case of the alumina sample was larger than that of DMSO. However, sufficient signal intensities were monitored in both cases for practical imaging, since the intensities satisfied the dynamic ranges of dB-order in the experiments. The results in all the cases confirm that the proper signals are obtainable at a mm-order distance by using the proposed method. This is an advantage over the conventional sensing method in which lasers or other strong light sources are required in the optical range.
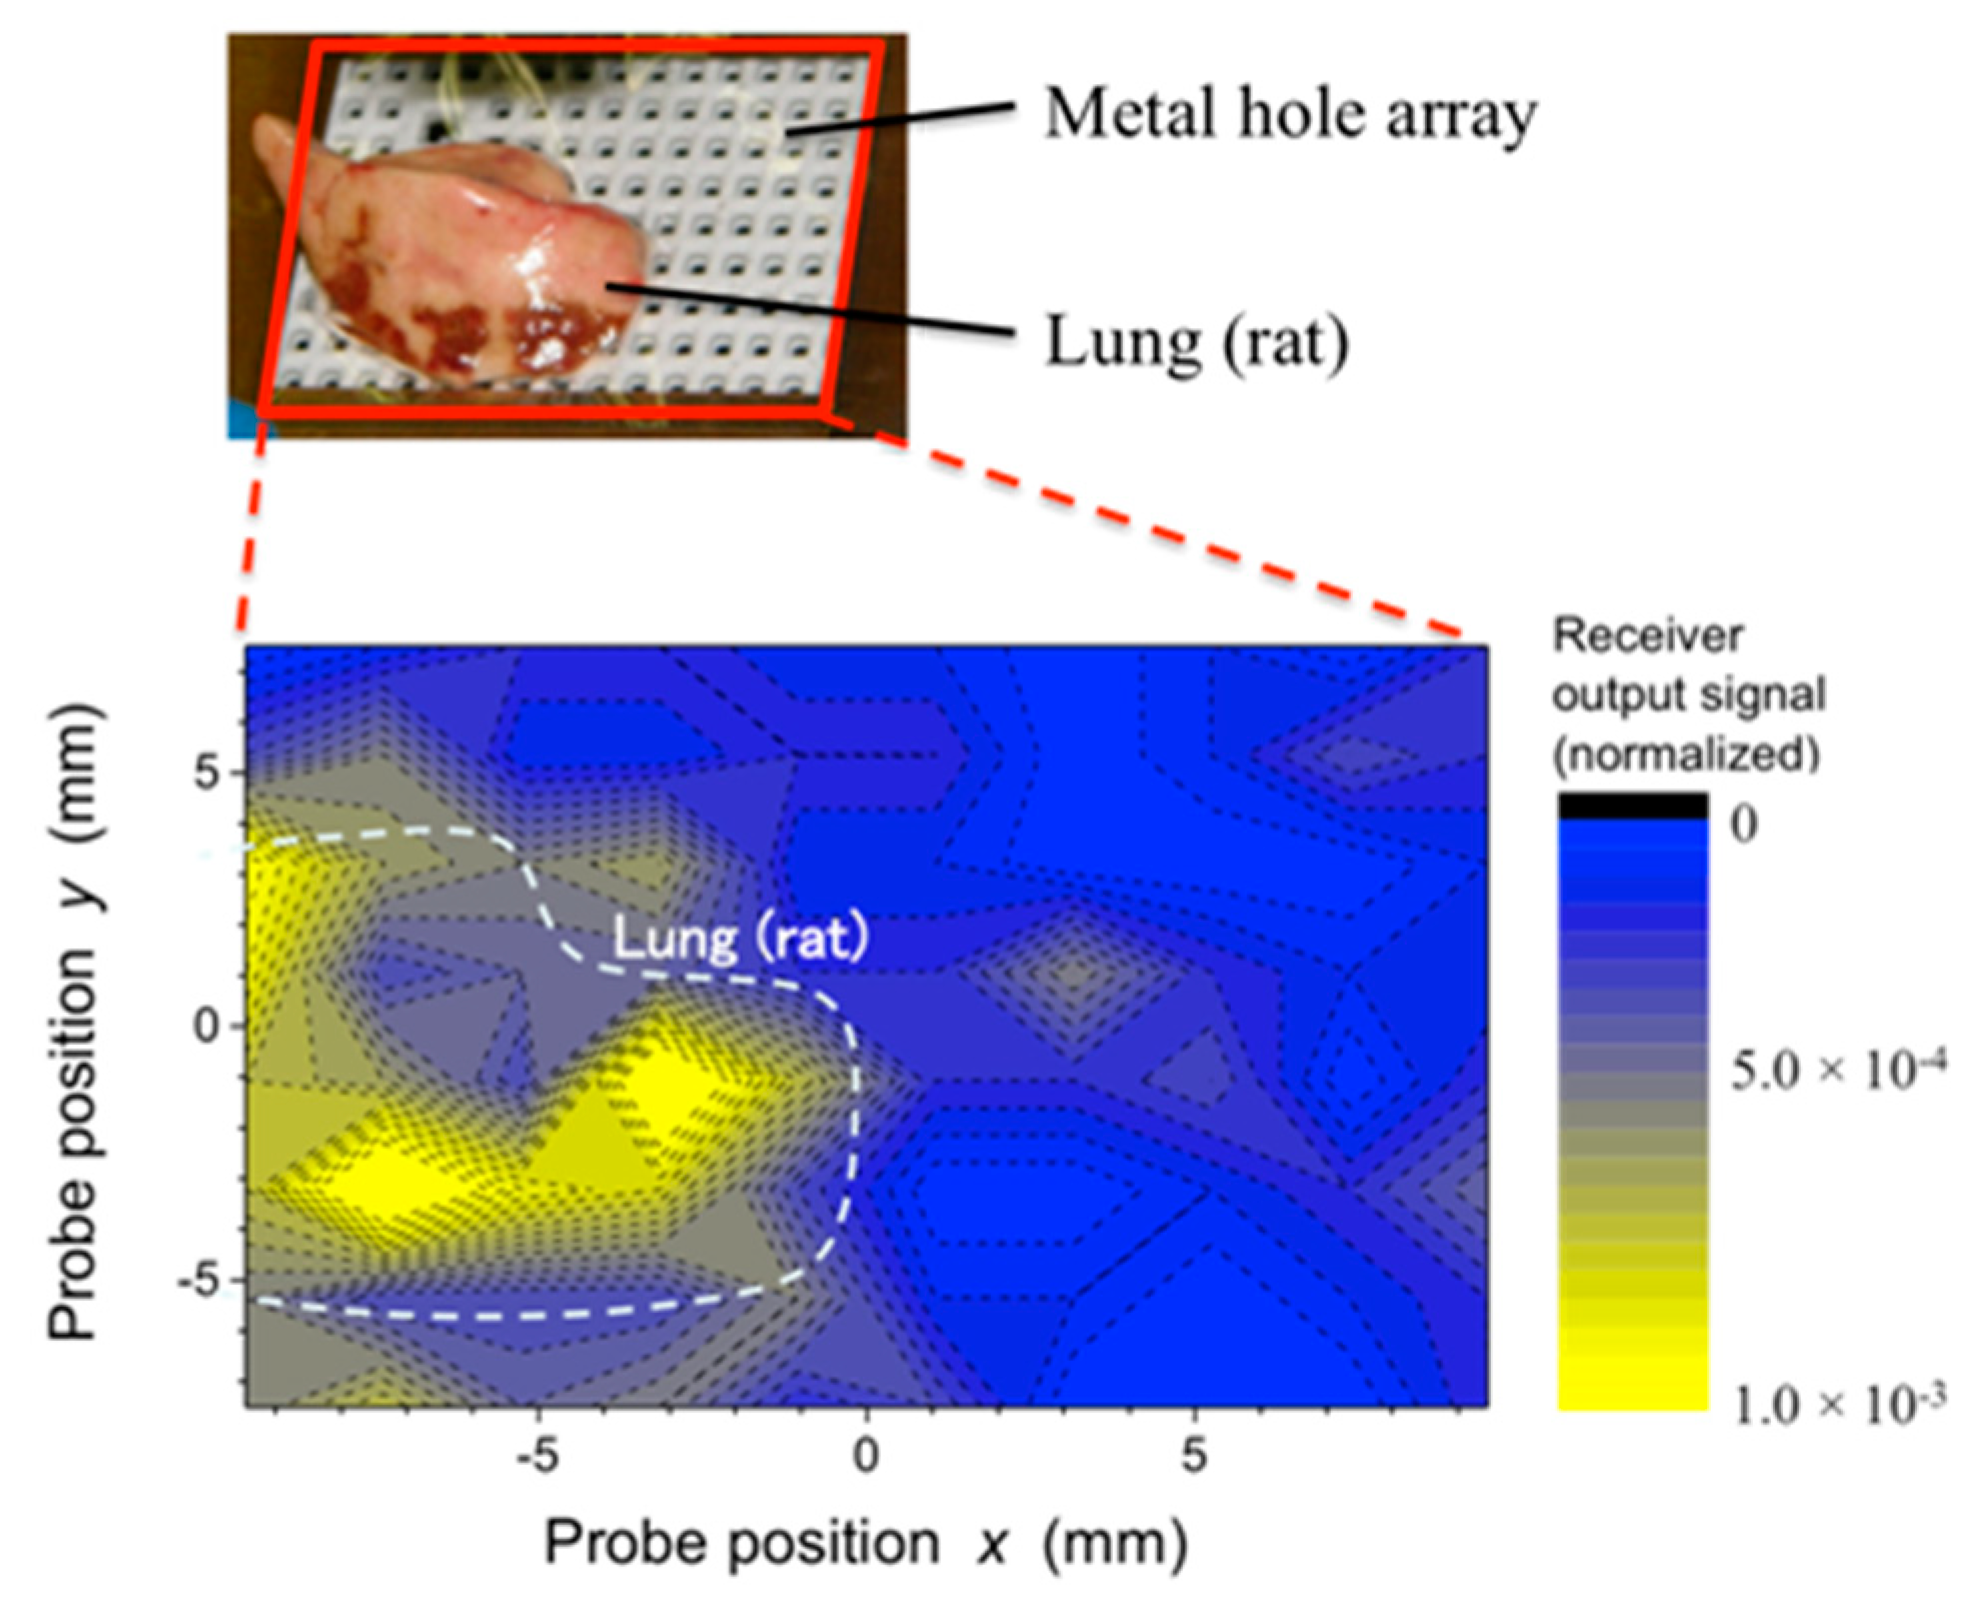
The above discussions support the feasibility of a biomedical diagnosis that uses the proposed system. Finally, the result of the biomedical diagnosis in the case of a rat lung is reported. As shown in
Figure 18, the results confirm a detection of the sample in more than half of the area. Although there is some slight signal misdetection, it shows that two-dimensional dialectic responses of the biomedical sample can be obtained in the proposed system.
The above discussions and results indicate that the proposed method can be used for 2D imaging of permittivity distribution, and may be useful for biomedical diagnosis after optimization as a medical facility tool.


