Article

Development of a Utility Model for the Measurement of Global Radiation in Photovoltaic Applications in the Internet of Things (IoT)

by
Rus-Casas C.
1,2,*,
Hontoria L.
1,2,
Fernández-Carrasco J.I.
2,
Jiménez-Castillo G.
1 and
Muñoz-Rodríguez F.
1,2
1
Department of Electronic and Automatic Engineering, Universidad de Jaen, 23071 Jaen, Spain
2
Centre for Advanced Studies in Energy and Environment CEAEMA, Universidad de Jaen, 23071 Jaen, Spain
*
Author to whom correspondence should be addressed.
Electronics 2019, 8(3), 304; https://doi.org/10.3390/electronics8030304
Submission received: 31 January 2019 / Revised: 26 February 2019 / Accepted: 5 March 2019 / Published: 8 March 2019
(This article belongs to the Special Issue Advanced Hardware Implementations for IoT Systems and Applications)

Abstract

:
In order to develop future projects in the field of photovoltaic solar energy, it is essential to accurately know the potential solar resources. There are many methods to estimate the incident solar radiation in a certain place. However, most of them are very expensive or do not have the ideal characteristics for good monitoring of a particular photovoltaic installation. For these reasons, an electronic device connected to the internet of things (IoT) is presented in this paper which manages to measure global radiation in photovoltaic applications. The device developed has been patented in the Spanish Patent and Trademark Office. It presents some features that make it very suitable to measure photovoltaic installations with the advantage of being a low cost and very reliable device. The device has been tested to determine global horizontal irradiance obtaining a correlation coefficient R2 = 0.994.

1. Introduction

Renewable energies have proven to be very reliable energies for the future world energy scenario. There are many such energies, and the degree of technical and economic maturity of all of them is very varied, although in general they are all very technologically advanced and are beginning to be, or already are, fully competitive economically against “conventional” energies [1].
The growth of the installed power capacity of renewable energies during the period 2001–2015 can be seen in Figure 1, obtained from the International Renewable Energy Agency (IRENA) 2017 report [2]. It is noteworthy that, from 2012, the accumulated power of renewable energies began to be higher than those of non-renewable energies, and continues thus. The accumulated power of renewable energies presents variable behavior. That is to say, it does not present continuous growth, but there are years in which it increases and others in which it decreases. The maximum value reached 145 GW in 2007. However, observing Figure 1, we see that the evolution of accumulative power of renewable energies is of continuous growth, reaching a maximum value of 154 GW in 2015, and as mentioned above, it has consistently obtained higher values than non-renewable energies since 2001.
Of all the renewable energies, it is interesting to highlight photovoltaic solar energy [3] for different reasons. In relation to its growth and degree of maturity it is undoubtedly one of the renewable energies with better future prospects. More than twenty years of photovoltaic (PV) market development have resulted in the deployment of over 403 GW of PV systems throughout the world. In Figure 2 the evolution of the cumulative PV installations in GW from 2007 to 2017 can be observed. Reference International Energy Agency (IEA) report 2018 [4].
Likewise, photovoltaic systems have special characteristics that provide them with added values as electricity production systems. The modularity of photovoltaic systems stands out in particular. This implies that facilities of the desired size can be designed depending on the use of the installation. Designing facilities of the necessary size and adapting the generation curves to those of electric consumption makes possible a better correlation between production and consumption, thus reducing the period of overcapacity that exists in large facilities. The performance of a photovoltaic system could depend on the seasonal effects, weather and the system quality, therefore it is essential to measure and analyze the energy production of the system. In this sense, a solar monitoring system was designed in order to measure the electrical and weather parameters of thirteen photovoltaic plants. These plants were of at least seven years old where measured data reflects the electrical energy production was as expected for the same system at the weather conditions during these seven years [5].
Currently the distribution companies carry out the installation of smart meters for remote reading of consumptions. This will facilitate the integration of renewable generation in electricity distribution networks. The new technological capabilities can respond to the new demands, configuring a true milestone in the management of smart electric networks or smart grids [6,7]. These intelligent networks must make a reality the “smart cities” that are an emerging paradigm worldwide. The “Smart Cities” are supported by studies on the energy behavior of cities around the world. Such is the scope of the issue that the European Commission, in its draft proposals for the imminent call of the Horizon 2020 program, marks Smart Green as a priority line of action [8].
All the advances mentioned must help the photovoltaic systems to reach the ‘grid parity’ [9,10] with other systems of production of energy and allow the constant development, sustained and without need of subsidies. The development of elements that make the energy coming from the photovoltaic systems pour “intelligently” to the grid will contribute to improve energy efficiency and energy management, which will maximize the integration of renewable energies in buildings and local electrical networks.
Both non-renewable energies and renewable energies need raw material for their operation: For example, coal or oil, in the case of non-renewable energies; or wind or water in the case of renewable energies. In the case of photovoltaic solar energy, the raw material used is the solar radiation received in the photovoltaic installation [11,12]. Correctly estimating this global radiation or available solar resource is one of the main aspects that can help the development and improvement of photovoltaic systems. Depending on the available solar resource, the energy obtained from photovoltaic systems can also be evaluated, as well as the development of diagnostic tools that favor energy self-consumption based on this type of energy. By measuring global radiation, an optimal location [13] of solar prospecting can be found that maximizes operational efficiency and also helps make investment decisions [14,15]. The objective of this work is to present a registered utility model with which the global radiation is monitored. This utility model will be especially indicated for applications based on photovoltaic solar energy since it has good characteristics for its integration in the monitoring of photovoltaic systems [16,17,18].
The work presented here has been organized as follows. This first part is the introduction. Subsequently, the different methods that are usually used to obtain global radiation will be indicated. As a third part, the utility model developed by the authors of this work with the aim of setting up a low-cost monitoring system is presented. This section consists of two parts, one dedicated to the hardware of the measurement system developed and another to the software of the same. Some of the first results obtained are presented in part 4, to finalize the work with the conclusions obtained, as well as indication of possible improvements and future actions.

2. Obtaining Global Radiation in Photovoltaic Applications, Previous Experiences

As previously indicated, in any photovoltaic system it is important to have the most reliable knowledge possible of the solar radiation incident on it. The global radiation (G) that affects a horizontal surface is formed by three components: the beam or direct component (B), the diffuse component (D) and the albedo or reflected component (R). The direct component is that which comes directly from the sun, while the diffuse component is that which comes from the rest of the atmosphere, mainly by dispersion of part of the solar radiation incident on it. Finally, the albedo component corresponds to the percentage of radiation that comes from the reflection of any surface [19]. In Equation (1) the expression that defines the global radiation is shown as the sum of its different components:
G (α, β) = B (α, β) + D (α, β) + R (α, β)
where α and β represent the orientation and inclination of the surface from which the measurement is made respectively. In very sunny climates between 20% and 30% of the radiation on horizontal surfaces is diffuse. More typically, the beam diffuse mix lies in the range 40–60% according to mean sunniness. Diffuse radiation thus forms a significant part of the resource [20].
It should also be noted that obtaining the measure of radiation can be useful in other fields that require knowledge of this variable, such as meteorological studies related to climate change [21], analysis of passive solar systems, or agriculture, as well as programming irrigation systems or bioclimatic architecture, among many others [22,23].
Knowing the global radiation received by photovoltaic systems is necessary for its design and for the evaluation of its energy productivity [24], as well as knowing its economic profitability. To carry out initial studies of the energy behavior of a photovoltaic installation, it is usually sufficient to know the monthly averages of global radiation. However, it may be necessary to know the value of G at a specific time, with different temporal resolutions when monitoring a photovoltaic installation in order to know the energy productivity of each moment as well as detecting faults in its operation. Also, if the photovoltaic installation has a certain inclination and orientation the different values of the global radiation in the plane of the generator under study can be obtained by applying the corresponding mathematical expressions or any software application that solves this problem [25,26].
In the next section, some experiments for obtaining global radiation, obtained from the scientific literature, will be summarized, focusing specifically on photovoltaic applications.

2.1. Pyranometers

The instrument to measure the global radiation traditionally used is the pyranometer [27,28]. The pyranometers have a field of vision equivalent to a half sphere. A pyranometer is usually formed of a black surface, consisting of a set of thermocouple junctions, a white disc that limits angular acceptance, and two transparent, semicircular and concentric shells made of glass. These dome-shaped covers protect the sensor from thermal convection, and from rain, wind and dirt.
With the pyranometer you can measure both the global radiation and the diffuse and albedo components. To measure only the diffuse component of the global irradiance, a screen-like system will be placed to perform the shading, thereby hindering the direct component. In the case of measuring the albedo radiation, the pyranometer is placed in inverted position. Finally, it is frequently used to measure the global solar radiation received at the same inclination as the receiving surface. In this case, it is placed coplanar to the receiving surface.
It is considered that the measurement of global solar irradiation incident on a flat surface through a pyranometer in the field of photovoltaic applications is the most reliable [29,30], since the desired physical magnitude is directly measured, and not estimated from other observations. Although it is important to note that the use of a pyranometer for the measurement of global solar radiation outside the field of research is not widespread, due to its high cost.

2.2. Satellites

The second method used to obtain the available solar resource in a certain area is the use of satellite images [31,32]. Generally, geostationary satellites are used. The pioneers in this methodology were Tarpley (1979 [33] and Gautier (1980) [34].) There are satellites that store images of areas and this information is then processed by models of image processing, which allow estimation of G. The data are presented in databases (sometimes for the use of the databases the researcher must pay, but other times they are freely available).
In the case that solar horizontal global radiation data are used by means of satellite images, the parameter value of large areas is obtained simultaneously, favoring the analysis in our case of the study of the photovoltaic potential in a given area. It is important to take into account that, in this case, these are not monitored data of the PV so when they are used in photovoltaic applications, it may not match the data of a certain time because of the changing sky conditions in times of cloudiness.

2.3. Calibrated Cells or Modules

The third option began to be used in the first monitoring of photovoltaic systems, where there were not enough records of solar radiation data. So the use of calibrated cells or calibrated modules manufactured with the same materials as the photovoltaic modules of the installation itself were used. The methodology followed in this case, is to take advantage of the relationship between the electrical power they generate and the solar irradiance that these components receive.
In order to perform this measurement reliably, it is necessary that the cells or photovoltaic modules are calibrated. The calibration can be done in a laboratory, or using a pyrometer as a pattern [35]. Otherwise, the cell or module can be calibrated using a solar simulator [36]. To automate its measurement process, a shunt resistor is placed and its short-circuit current is measured, which will be proportional to the received radiation. In this way, the intensity is directly transformed into an electrical signal. They have the advantage that the values that both provide, electrical power generated and received solar radiation, are very reliable since the cells or modules are calibrated by using the same technology as those installed in the photovoltaic system that you want to measure. Later, there are mathematical models to evaluate solar irradiation using a cell or a photovoltaic module [37,38,39].

2.4. Other Devices

Finally, many other devices that are used or have been used throughout the evolution of solar radiation measurement methods such as photodiodes, calorimetric sensors, thermomechanical sensors or thermoelectric sensors can be highlighted.
Of these devices, one of the most used is photodiodes [40]. These devices are based on the photovoltaic effect and are often used when portable and low cost meters are required. The photodiodes present a linear response to the visible spectrum, which is used to measure the solar radiation that is sought. Initially, an exhaustive study of the photodiode characteristics sheet should be carried out to verify if the response and the wavelength of the radiation to be measured is adequate. It will also be taken into account that the photodiode is encapsulated with its corresponding signal conditioning to obtain a better response and greater immunity to noise [41]. Other aspects that should be taken into account when using these devices are the area sensitive to radiation (mm2) and the spectral sensitivity (A/W), to obtain the value of global horizontal irradiance (GHI) (W/m2). There are also complete experiences, such as in our case, in which the complete data acquisition system is designed, including signal conditioning [42,43].

3. Materials and Methods Used for the Patented Utility Model for the Measurement of Solar Radiation

Knowing the different methods that are used to obtain the data of the horizontal global solar radiation received in a certain place, it is deduced, as has been emphasized in the previous point, that they are usually very expensive methods and systems and that it is difficult to have the data in real time in the photovoltaic installation that is going to be analyzed.
With the idea of improving these two characteristics, it is proposed to create a low-cost solar radiation measurement system, in which it is easy to integrate these data with the data of the installation to be studied and to allow solar radiation to be evaluated in real time. Our team of researchers has developed a prototype that has been protected as a utility model submitted for evaluation by the Spanish Patent and Trademark Office [44]. After the expert evaluation process, it has been protected with publication number ES1214734, which is described below [45].
In the diagram of Figure 3 the hardware solution of the utility model is shown. It can be seen that the developed utility model obtains the global horizontal irradiance (GHI) and acquires and transmits it using an internet of things (IoT) channel to be integrated into the monitoring system of a photovoltaic generator. In this sense the GHI data can be integrated and will make possible the energy evaluation of the photovoltaic system.

3.1. The Sensor and Its Conditioning

The sensor used for the measurement of GHI is the integrated circuit TSL230RD (Texas Advanced Optical Systems (TAOS), Premstaetten, Austria) that accurately measures solar radiation using a matrix of photodiodes. The assembly is based on the demonstrated utility of this sensor for the reliable measurement of horizontal global radiation.
The TSL230RD is programmable and, as shown in Figure 4, combines a configurable silicon photodiode and a current-to-frequency converter into a single complementary metal-oxide-semiconductor (CMOS) integrated circuit. Table 1 shows the functionality of its entries.
The sensitivity of the device can be selected with the inputs S1 and S0. So the number of active receivers of the photodiode matrix is controlled. Depending on the application for which it is used, in this case, the value of GHI to be measured a higher or lower sensitivity will be selected, Table 2. If we select a very high sensitivity, it will be able to detect small GHI levels.
In the case of the utility model presented, a “1x” sensitivity will be used, so the pins would be in “S0 High (H)” and “S1 Low(L)”. A high sensitivity is not necessary since, being a GHI meter for photovoltaic applications, values lower than 150 W/m2 are values that do not allow the operation of the installations to generate energy [46].
Pins S2 and S3 control the scaling of the output frequency, as shown in Table 3; this adaptation in frequency will allow the microprocessor of the data acquisition system to use synchronization for the reading of the square wave that is obtained as a function of the value of GHI.
The option of pins “S2 and S3 High” has been selected, so the value of the frequency is divided by 100. For the capture of the frequency and its later interpretation, a very precise sampling time control is necessary. Therefore, one of the interruption inputs available in the microprocessor will be used, which ensures that any changes that will allow the number of pulses per second of the integrated circuit to be quantified in a very precise manner are taken care of as a priority.
The sensor has been protected from the weather by a dome in a waterproof box that allows it to measure properly on the outside, as shown in Figure 5.

3.2. Data Acquisition and Communications System

The measurement systems based on microcontroller are also often used for solar photovoltaic system, driven by economic reasons [47]. Microcontrollers were used to measure humidity, temperature and solar radiation (photovoltaic sensor cell) parameters [48]. Weather monitoring stations have also used microcontrollers as data acquisition (DAQ) devices in order to measure the wind speed, wind direction, ambient temperature, atmospheric pressure and solar radiation [49,50,51]. A remote monitoring system for photovoltaic water pumping systems was designed and tested using a microcontroller; the prototype could measure both weather and electrical parameters [52]. A microcontroller was used as the DAQ device, which is part of a low cost system to measure irradiance and temperature with BPW34 photo diode LM35 DZ temperature sensors [42]. Open-source electronic platforms, which combine hardware and software, are quite widespread. An example of these platforms is Arduino, which has been used in a variety of designs. A low-cost prototype based on Arduino allows a real-time and remote control of wine physical and chemical parameters in the barrel [53]. Mini Arduino Nanos were presented as cost effective and versatile components for acquiring and recording data to measure the current and voltage parameters of photovoltaic systems, loads and battery, as well as to estimate state of charge of the battery [54].
The acquisition of GHI data measured by the TSL230RD sensor is done with the data acquisition card (TAD) Arduino UNO. As mentioned above, it is a low cost card whose use is quite widespread, due to the large amount of existing documentation on monitoring projects that use devices based on Arduino, [55]. The Arduino platform allows the use of free software, as well as exchanging opinions with the community that uses this platform which encourages learning in a self-taught way. Table 4 shows the characteristics of the TAD used.
Another important aspect is that the acquisition of the data includes a temporary reference of the moment in which the data of GHI is taken. To incorporate this functionality, the acquisition of data is completed with the installation of a real time clock (RTC), model DS1307 (Maxim Integrated TM, San Jose, CA, USA). In this way each data of GHI has its temporal reference in the form of seconds, minutes, hours, day, month and year in which the measure is taken. In this way, parameter G will be part of the procedure that evaluates the energy and operation of the photovoltaic system under study.
The sensor, TSL230, has two types of results: a pulse train and a square wave. In the case of the developed prototype, the square wave output that has a 50% duty cycle will be used with the Arduino data acquisition card. To connect the sensor to the data acquisition card, a 100 nF capacitor is placed as close as possible to the power pins. The sensor connects terminals 1, 5, 7 and 8 to 5 V; pin 6 to pin 2; and terminals 2, 3 and 4 to ground. For communications, the circuit is connected through the I²C communication bus to the Arduino card, in addition to assigning a temporary reference to the data acquired to control the sampling time of the GHI, in this case it is 1 min.
The system is completed by selecting the means by which a user of the system accesses the measured data of GHI. For this, the device that has been used is an Arduino expansion card: Arduino Ethernet Shield, which enables communication via Ethernet, connecting to a local network socket and the TAD through the serial peripheral interface (SPI). Now the system will have an IP address that can be accessed when it is connected to a router.
Finally, to store the information of the utility model, an internet of things (IoT) platform will be used. Nowadays, there are numerous free access IoT platforms. Although all of them allow storing data in real time, the one chosen in the proposed monitoring system is ThingSpeak, which was chosen due to its compatibility with the data acquisition system used and its possibilities for the analysis and visualization of the data. Access to it can be configured so that a username and password are required, or so that it is accessible to anyone who knows the web address. The IoT platform will allow storage and processing of information of the utility model in addition to having the information in any site that has a network

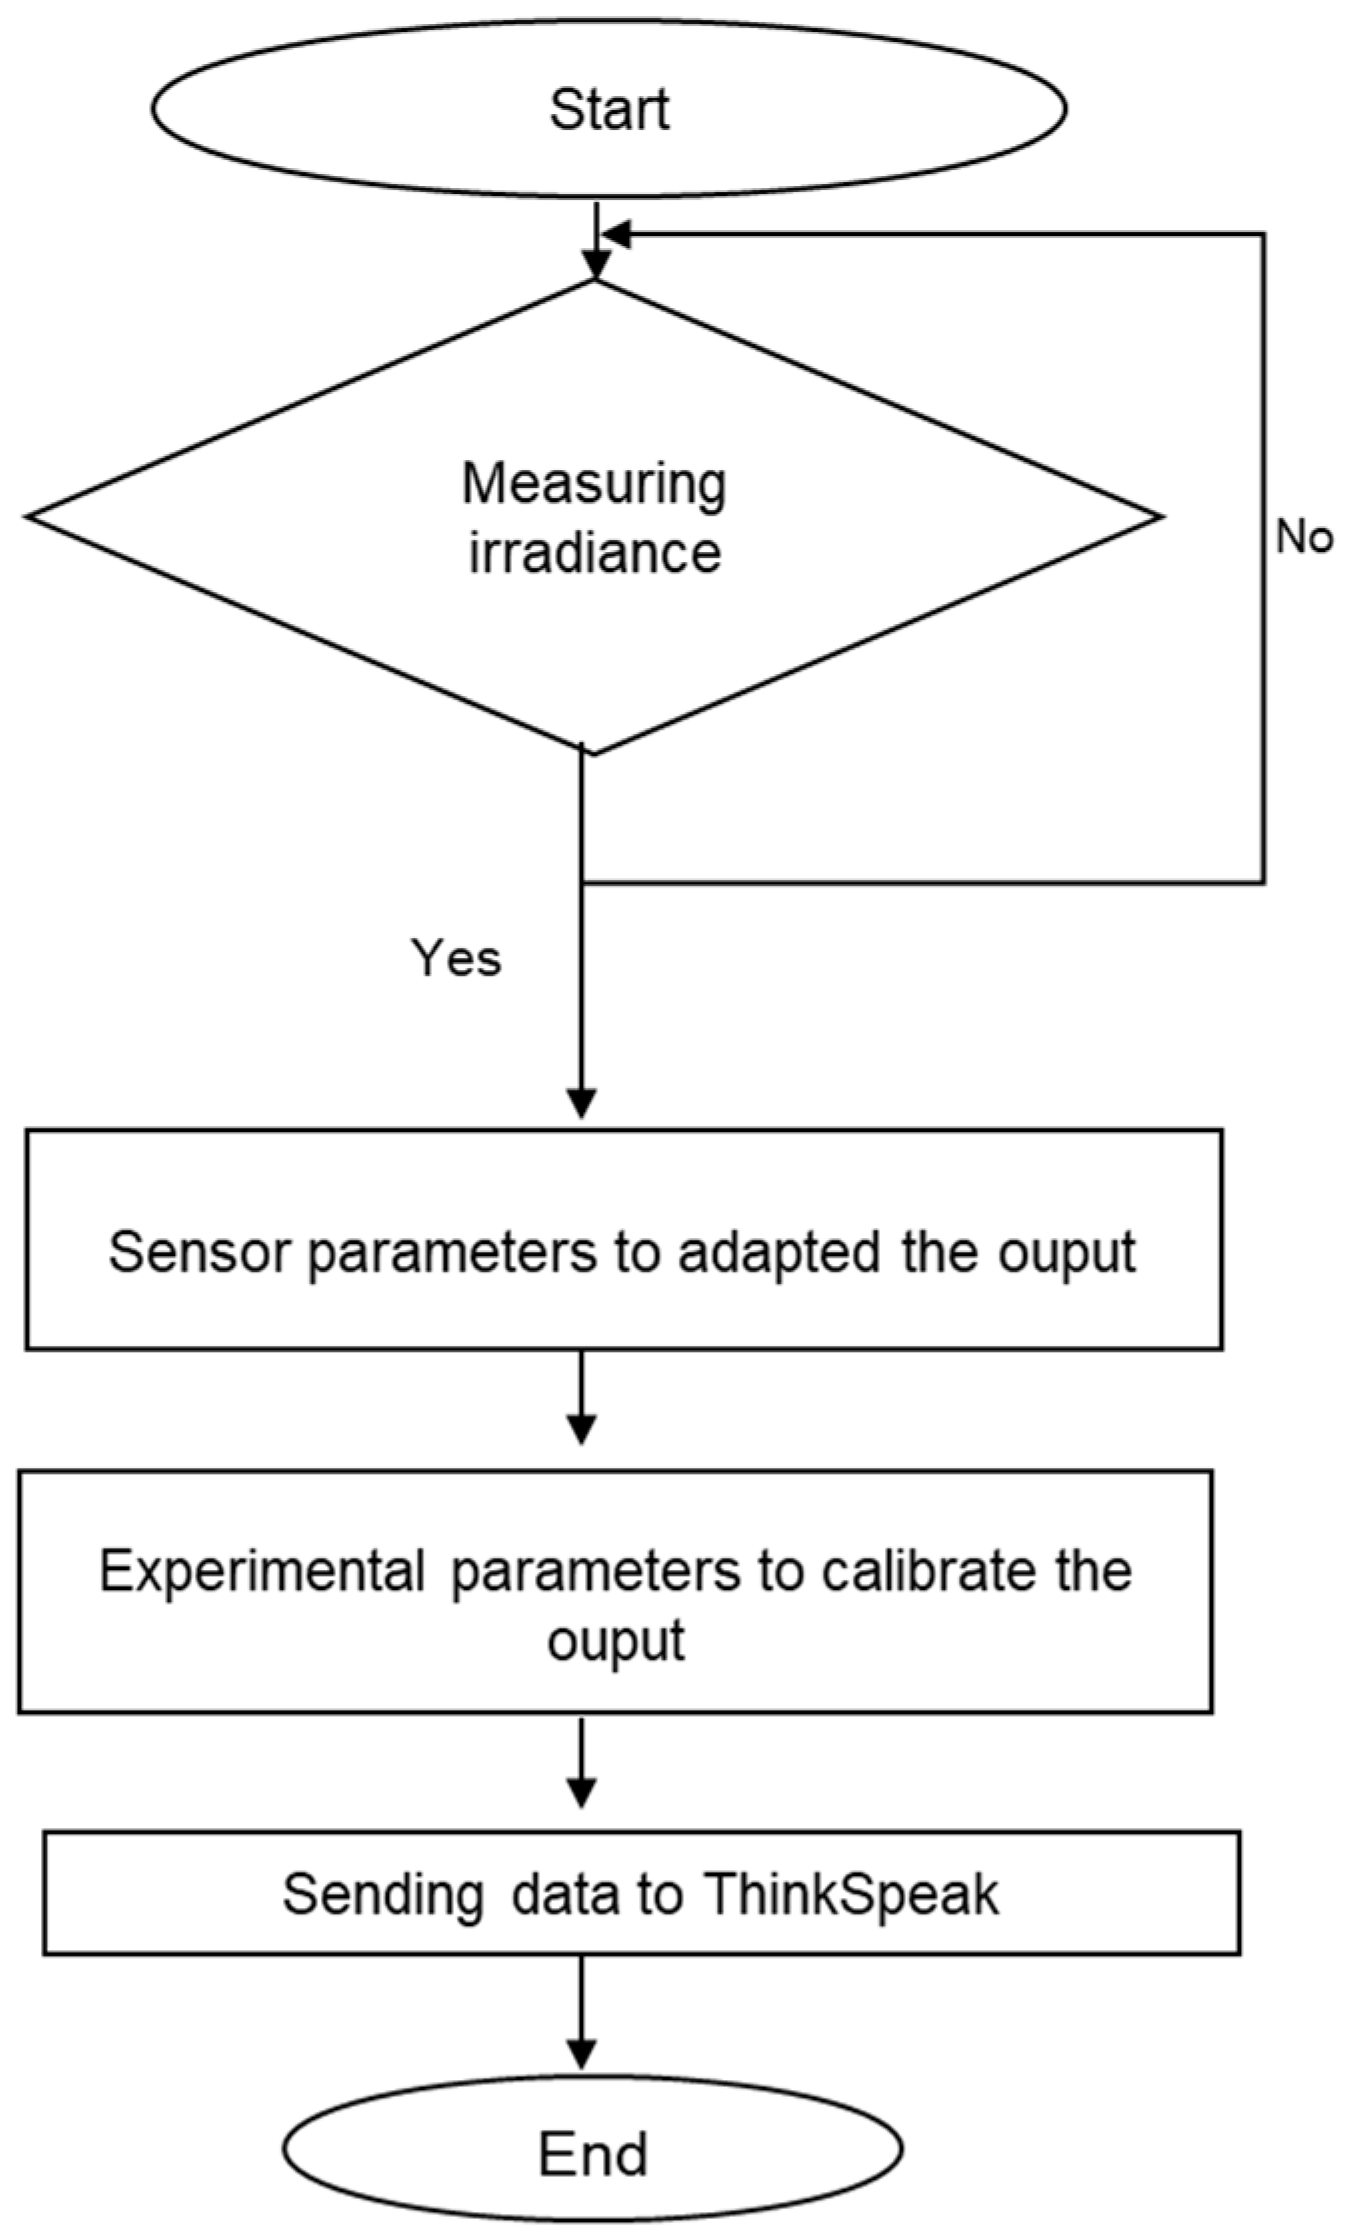
3.3. Software Solution for the Utility Model

To perform the code that controls the utility model, follow the steps explained in the flow chart shown in Figure 6.
Part (a) shows the initial sequence of the programming in which the software solution in the utility model must configure the system to recognize the hardware that composes it.
Firstly, the libraries to be used are included so that Arduino is able to detect the sensor model, as well as the rest of the electronic components that have been connected to it. The next step is to define all the variables involved in the monitoring that is going to be carried out. Later, the specific parameters of the Wi-Fi communication system and the RTC clock are configured for the temporary reference of the design system. Finally, the programming to store the data in the ThingSpeak channel is addressed. In order to carry out the programming of the part dedicated to communications, the channel and password must be specified in ThingSpeak, so that it is possible to write the monitored data of horizontal global radiation in said channel.
In Figure 7 the flow chart of the procedure for programming the radiation sensor (TSL230RD) is shown. The technical data are obtained from the sensor’s data sheet. Its numerical values have been described previously. At the programming level, it must be taken into account that each time the sensor produces a pulse with rising edge, an interruption will be activated and the counting of the number of pulses will begin. The program, in order to operate with the sensor signal, in frequency, must perform the conversion between the numbers of pulses between the time it takes to obtain them according to the value of the horizontal global radiation to which it is exposed. Next, the constant that must be entered is calculated by making a query on the sensor’s data sheet. With this last step, the scale factor for the frequency is obtained, as well as the correspondence factor between the output and its value in a μW/cm2.
In Figure 6b, the execution sequence for the acquisition of horizontal global radiation by Arduino is shown. The main program supports two modes of operation: check mode and normal mode. Therefore, you can do a system check or off-line mode in which you can make system adjustments. In this case, for the software adjustments to be made, the status of a control variable is queried. If the answer is positive, the data is sent to the serial port (operating mode as test or test) and if it is negative, they are not sent (normal operating mode). In normal operation mode or online operation mode in which horizontal global radiation data will be available in the ThingSpeak channel with the above mentioned sampling specifications.

4. Experimental Results and Discussion

Among the methods for obtaining the global solar radiation reviewed above, it can be highlighted that the two methods most commonly used in research are pyranometers and methodologies based on the use of satellite images, both due to the quality of the data from solar radiation obtained with them. Nevertheless, they present some drawbacks: In the case of the pyranometer, it is a very economically expensive system; and in the case of horizontal global radiation data obtained with satellite images, it has the disadvantage that it does not provide real-time data in the photovoltaic system that is being analyzed. For these reasons, now there are other options used for the measurement of the horizontal global radiation, and often these are lower cost systems.
Initially the alternatives focused on the photovoltaic devices by means of calibrated cells or modules. Their response to the variation of solar radiation is well known, although a little reliability of the measurement is lost. Currently more and more studies are using other devices that provide low-cost solutions with real-time analysis, to measure the behavior of a photovoltaic installation, as well as the integration of information in smart grids.
In the results section we want to show the behavior of the sensor used to measure the horizontal global radiation in the calibration procedure of the utility model (Figure 8, Figure 9 and Figure 10). The utility model has been calibrated using a reference meteorological station, Meteodata Geonic model (Geonica, Madrid, Spain), are provided with Eppley Piranometers (which are classified as “Secondary standards” per ISO 9060) located on the terrace of the Center for Advanced Studies in Energy and Environment of the University of Jaen (latitude 37.826° N), to obtain the calibration constant to relate the output of the sensor with its corresponding value of G in W/m2.
Figure 8, Figure 9 and Figure 10 show in a superimposed manner the data of the pyranometer of the meteorological station that has been used as a standard and those obtained by the utility model in the calibration process. Three days have been chosen so that the behavior of the prototype can be shown in three very different days: a clear day (Figure 8), a very cloudy day with low global radiation (Figure 9) and a very cloudy day, but with a high global radiation value (Figure 10).
In Figure 11 the measured global horizontal irradiance, expressed in W/m2 of the two types of equipment (the pyranometer pattern and the utility model) is shown, obtaining a correlation coefficient R2 = 0.9945, which gives an idea of the relative measure of the degree of linear association between both measures, as well as the reliability of the designed utility model.
The campaign of measures has been one full year with a broad sample of days with different meteorological profiles. Finally, Figure 12 shows graphs representing the temporal evolution of global horizontal irradiance in the city of Jaen (Spain) on the days corresponding to seasonal changes: 20 March 2016 (spring equinox), 21 June 2016 (summer solstice), 22 September 2016 (autumn equinox) and 21 December 2016 (winter solstice).

5. Conclusions

The aim of this work is to describe an electronic device that has been registered as a utility model in the Spanish patent and trademark office. This device measures the global radiation on a horizontal surface. Once calibrated with a reference pyranometer and tested, it has obtained a correlation coefficient R2 = 0.9945, a value that confirms the reliability of the designed utility model. The latter will be especially suitable for photovoltaic solar energy applications since it provides, apart from great accuracy, good characteristics for its integration in the monitoring of photovoltaic systems.
The proposed prototype has a novel use of a sensor which provides a frequency output proportional to the radiation it is exposed. The sensor has been evaluated for one year. For the evaluation, it has been subjected to real operating conditions. The utility model is completed with a data acquisition system in which sensor’s frequency signal is directly connected to the interruption of the microprocessor of the Arduino UNO board. This solution allows a measurement of the signal by the microprocessor (16 MHz), which will be a priority.
In addition to its reliability, the researchers highlight its low cost and the prompt availability of radiation data, wherever it is located, since it uses an IoT channel as data storage. This data ubiquity makes the prototype an interesting irradiance meter to be used in smart grid type applications.
Moreover, if the irradiance at a given photovoltaic installation is measured, the harvested energy may be estimated by the photovoltaic generator at different operating conditions and at different reporting intervals. In order to contribute to intelligent distributed energy, further investigation may be achieved in order to manage the detection of failures in the system (i.e., the production in the next hours is not as expected, regarding the consumption that the system has previously estimated) and take the appropriate measures to ensure the availability of energy.

6. Patents

Rus-Casas, C.; Hontoria, L.; Aguilar-Peña, J.; Muñoz-Rodríguez, F.J.; Fernández-Carrasco, J.I.; Jiménez-Torres, M. Sistema para la monitorización de la radiación solar. Modelo de utilidad U201830617. 2018. http://www.oepm.es/pdf/ES/0000/000/01/21/47/ES-1214734_U.pdf.

Author Contributions

All authors contributed equally to this work.

Funding

This research was funded by the Agencia Estatal de Investigación (AEI) and the Fondo Europeo de Desarrollo Regional (FEDER) aimed at the Challenges of Society (Grant No. ENE 2017-83860-R “Nuevos servicios de red para microredes renovables inteligentes. Contribución a la generación distribuida residencial”). The authors wish to thank the Centrefor Advanced Studies in Energy and Environment CEAEMA, of the University of Jaen to Project Nuevos parámetros para la optimización del autoconsumo con sistemas fotovoltaicos. Contribución a la generación de energía distribuida inteligente.

Acknowledgments

The authors wish thank to the University of Jaen for the programme: “Plan de Apoyo a la I+D+I 2014-2015. Prorrogado hasta 2016”. We also would like to acknowledge anonymous reviewers for their kind and interesting comments that have helped us to improve the manuscript.

Conflicts of Interest

The authors declare no conflict of interest.

References

  1. Renewables 2018 Global Status Report. A Comprehensive Annual Overview of the State of Renewable Energy; REN21 Secretariat: Paris, France, 2018; ISBN 978-3-9818911-3-3.
  2. IRENA (International Renewable Energy Agency). REthinking Energy 2017: Accelerating the Global Energy Transformation; Irena: Abu Dhabi, UAE, 2017; ISBN 9789295111059. [Google Scholar]
  3. Luque, A.; Hegedus, S. Handbook of Photovoltaic Science and Engineering; John Wiley & Sons: Hoboken, NJ, USA, 2011; ISBN 0470976128. [Google Scholar]
  4. International Energy Agency. Trends 2018 in Photovoltaic Applications 23. Report IEA PVPS T1-34:2018; International Energy Agency: Paris, France, 2018; pp. 73–91. [Google Scholar]
  5. Beránek, V.; Olšan, T.; Libra, M.; Poulek, V.; Sedláček, J.; Dang, M.Q.; Tyukhov, I.I. New monitoring system for photovoltaic power plants’ management. Energies 2018, 11, 2495. [Google Scholar] [CrossRef]
  6. Shafiullah, G.M.; Oo, A.M.T.; Ali, A.B.M.S.; Wolfs, P. Smart grid for a sustainable future. Smart Grid Renew. Energy 2013, 4, 23–34. [Google Scholar] [CrossRef]
  7. Bayindir, R.; Colak, I.; Fulli, G.; Demirtas, K. Smart grid technologies and applications. Renew. Sustain. Energy Rev. 2016, 66, 499–516. [Google Scholar] [CrossRef]
  8. European Commission. Energy 2020. A Strategy for Competitive, Sustainable and Secure Energy; European Commission: Brussels, Belgium, 2010. [Google Scholar]
  9. Aguilera, J.; Almonacid, G.; Hontoria, L.; Muñoz, E.; Pérez, P.J.; Terrados, J.; Vidal, P.G. The CPV challenge (Part I): Achieving grid parity. In CPV Today; First Conferences Ltd.: London, UK, 2009; pp. 970–978. [Google Scholar]
  10. Talavera, D.L.; Muñoz-Rodriguez, F.J.; Jimenez-Castillo, G.; Rus-Casas, C. A new approach to sizing the photovoltaic generator in self-consumption systems based on cost–competitiveness, maximizing direct self-consumption. Renew. Energy 2019, 130, 1021–1035. [Google Scholar] [CrossRef]
  11. Garg, H.P.; Datta, G. Fundamentals and characteristics of solar radiation. Renew. Energy 1993, 3, 305–319. [Google Scholar] [CrossRef]
  12. Iqbal, M. An Introduction to Solar Radiation; Elsevier: Amsterdam, The Netherlands, 2012; ISBN 0323151817. [Google Scholar]
  13. Lave, M.; Kleissl, J. Optimum fixed orientations and benefits of tracking for capturing solar radiation in the continental United States. Renew. Energy 2011, 36, 1145–1152. [Google Scholar] [CrossRef]
  14. Jiménez-Torres, M.; Hontoria, L.; Fernández-Carrasco, J.; Rus-Casas, C. OrientSol 3.0. Nuevo laboratorio virtual sobre el recurso solar. Era Sol. 2015, 187, 38–45. [Google Scholar]
  15. Jiménez-Torres, M.; Rus-Casas, C.; Lemus-Zúiga, L.G.; Hontoria, L. The Importance of Accurate Solar Data for Designing Solar Photovoltaic Systems—Case Studies in Spain. Sustainability 2017, 9, 247. [Google Scholar] [CrossRef]
  16. Jiménez-Castillo, G.; Muñoz-Rodríguez, F.J.; Rus-Casas, C.; Hernández, J.C.; Tina, G.M. Monitoring PWM signals in stand-alone photovoltaic systems. Measurement 2019, 134, 412–425. [Google Scholar] [CrossRef]
  17. Torres, M.; Muñoz, F.J.; Muñoz, J.V.; Rus, C. Online monitoring system for stand-alone photovoltaic applications—Analysis of system performance from monitored data. J. Sol. Energy Eng. 2012, 134, 34502. [Google Scholar] [CrossRef]
  18. Vidal, P.G.; Jiménez-Torres, M.; Hontoria, L.; Almonacid, G.; Rodríguez, F.M.; Fernández-Carrasco, J.I.; Rus-Casas, C. Advances in the monitoring of photovoltaic systems. Use of the Internet of Things (IoT) of a photovoltaic installation. In Proceedings of the EMR2017: The Energy & Materials Research Conference, Lisbon, Portugal, 5–7 April 2017. [Google Scholar]
  19. Casas, C.R.; Rodriguez, F.M.; Hontoria, L.; Higueras, P.P.; Talavera, D.L.; Almonacid, F.; Aguilera, J.; Aguilar, J.D.; Almonacid, G.; Rodrigo, P. Instalaciones Fovotoltaicas; Multimedia, J.E., Ed.; Joxman Editores: Jaen, Spain, 2010; ISBN 9788492623464. [Google Scholar]
  20. Scharmer, K.; Page, J.K.; Wald, L.; Albuisson, M.; Czeplak, G.; Bourges, B.; Aguiar, R.; Lund, H.; Joukoff, A.; Terzenbach, U. The European Solar Radiation Atlas Vol. 1: Fundamentals and Maps; Presses de l’Ecole des Mines: Paris, France, 2000; ISBN 2911762215. [Google Scholar]
  21. Qu, Z.; Gschwind, B.; Lefèvre, M.; Wald, L. Improving HelioClim-3 estimates of surface solar irradiance using the McClear clear-sky model and recent advances in atmosphere composition. Atmos. Meas. Tech. 2014, 7, 3927–3933. [Google Scholar] [CrossRef] [Green Version]
  22. Ferrández-Pastor, F.J.; García-Chamizo, J.M.; Nieto-Hidalgo, M.; Mora-Martínez, J. Precision Agriculture Design Method Using a Distributed Computing Architecture on Internet of Things Context. Sensors 2018, 18, 1731. [Google Scholar] [CrossRef] [PubMed]
  23. Martínez-Rubio, A.; Sanz-Adan, F.; Santamaría-Peña, J.; Martínez, A. Evaluating solar irradiance over facades in high building cities, based on LiDAR technology. Appl. Energy 2016, 183, 133–147. [Google Scholar] [CrossRef]
  24. Pérez-Higueras, P.; Muñoz-Rodríguez, F.J.; Adame-Sánchez, C.; Hontoria-García, L.; Rus-Casas, C.; González-Rodríguez, A.; Aguilar-Peña, J.D.; Gallego-Álvarez, F.J.; González-Luchena, I.; Fernández, E.F. High-concentrator photovoltaic power plants: Energy balance and case studies. In High Concentrator Photovoltaics; Springer: Berlin/Heidelberg, Germany, 2015; pp. 443–477. [Google Scholar]
  25. Rodrigo, P.; Pérez-Higueras, P.J.; Almonacid, F.; Hontoria, L.; Fernández, E.F.; Rus, C.; Fernández, J.I.; Gómez, P.; Almonacid, G. Calculation of direct normal irradiation from global horizontal irradiation. AIP Conf. Proc. 2012, 1477, 391–393. [Google Scholar]
  26. Rus-Casas, C.; Hontoria, L.; Jiménez-Torres, M.; Muñoz-Rodríguez, F.J.; Almonacid, F. Virtual laboratory for the training and learning of the subject solar resource: OrientSol 2.0. In Proceedings of the 2014 XI Tecnologias Aplicadas a la Ensenanza de la Electronica (Technologies Applied to Electronics Teaching) (TAEE), Bilbao, Spain, 11–13 June 2014; pp. 1–6. [Google Scholar]
  27. Garg, H.P.; Garg, S.N. Measurement of solar radiation—II. Calibration and standardization. Renew. Energy 1993, 3, 335–348. [Google Scholar] [CrossRef]
  28. Thekaekara, M.P. Solar radiation measurement: Techniques and instrumentation. Sol. Energy 1976, 18, 309–325. [Google Scholar] [CrossRef]
  29. López-Lapeña, O.; Pallas-Areny, R. Solar energy radiation measurement with a low–power solar energy harvester. Comput. Electron. Agric. 2018, 151, 150–155. [Google Scholar] [CrossRef]
  30. Rus-Casas, C.; Aguilar, J.D.; Rodrigo, P.; Almonacid, F.; Pérez-Higueras, P.J. Classification of methods for annual energy harvesting calculations of photovoltaic generators. Energy Convers. Manag. 2014, 78, 527–536. [Google Scholar] [CrossRef]
  31. Gueymard, C.A.; Wilcox, S.M. Assessment of spatial and temporal variability in the US solar resource from radiometric measurements and predictions from models using ground-based or satellite data. Sol. Energy 2011, 85, 1068–1084. [Google Scholar] [CrossRef]
  32. Perez, R.; Kmiecik, M.; Herig, C.; Renné, D. Remote monitoring of PV performance using geostationary satellites. Sol. Energy 2001, 71, 255–261. [Google Scholar] [CrossRef]
  33. Tarpley, J.D. Estimating incident solar radiation at the surface from geostationary satellite data. J. Appl. Meteorol. 1979, 18, 1172–1181. [Google Scholar] [CrossRef]
  34. Gautier, C.; Diak, G.; Masse, S. A simple physical model to estimate incident solar radiation at the surface from GOES satellite data. J. Appl. Meteorol. 1980, 19, 1005–1012. [Google Scholar] [CrossRef]
  35. Nofuentes, G.; Aguilera, J.; Santiago, R.L.; De La Casa, J.; Hontoria, L. A reference-module-based procedure for outdoor estimation of crystalline silicon PV module peak power. Prog. Photovolt. Res. Appl. 2006, 14, 77–87. [Google Scholar] [CrossRef]
  36. Gómez-Moreno, Á.; Casanova-Peláez, P.J.; Palomar-Carnicero, J.M.; Cruz-Peragón, F. Modeling and Experimental Validation of a Low-Cost Radiation Sensor Based on the Photovoltaic Effect for Building Applications. Energies 2016, 9, 926. [Google Scholar] [CrossRef]
  37. Vigni, V.L.; La Manna, D.; Sanseverino, E.R.; di Dio, V.; Romano, P.; di Buono, P.; Pinto, M.; Miceli, R.; Giaconia, C. Proof of concept of an irradiance estimation system for reconfigurable photovoltaic arrays. Energies 2015, 8, 6641–6657. [Google Scholar] [CrossRef]
  38. Seyedmahmoudian, M.; Mekhilef, S.; Rahmani, R.; Yusof, R.; Renani, E.T. Analytical modeling of partially shaded photovoltaic systems. Energies 2013, 6, 128–144. [Google Scholar] [CrossRef]
  39. Almonacid, F.; Rus, C.; Pérez, P.J.; Hontoria, L. Estimation of the energy of a PV generator using artificial neural network. Renew. Energy 2009, 34, 2743–2750. [Google Scholar] [CrossRef]
  40. Vera, L.; Cuestas, C.; Firman, A.; Cáceres, M.; Busso, A. Desarrollo de un medidor portátil de irradiancia, par, temperatura y humedad. In Proceedings of the XXXIX Reunión de Trabajo de la Asociación Argentina de Energías Renovables y Medio Ambiente (ASADES), La Plata, Argentina, 25–28 October 2016. [Google Scholar]
  41. Patil, A.; Haria, K.; Pashte, P. Photodiode Based Pyranometer. Int. J. Adv. Sci. Eng. Technol. 2013, 1, 29–33. [Google Scholar]
  42. Parthasarathy, S.; Anandkumar, N.V. Development of Low Cost Data Acquisition System for Photo Voltaic System. Int. J. Innov. Res. Sci. Eng. Technol. 2016, 5, 12850–12856. [Google Scholar]
  43. Garg, H.P.; Garg, S.N. Measurement of solar radiation—I. Radiation instruments. Renew. Energy 1993, 3, 321–333. [Google Scholar] [CrossRef]
  44. Ministerio de Industrira Comercio y Tursmo Oficina Española de Patentes y Marcas. Available online: http://www.oepm.es/es/index.html (accessed on 24 January 2019).
  45. Rus-Casas, C.; Hontoria, L.; Aguilar-Peña, J.; Muñoz-Rodríguez, F.J.; Fernández-Carrasco, J.I.; Jiménez-Torres, M. Sistema Para la Monitorización de la Radiación Solar. U.S. Patent 201,830,617, 11 September 2018. [Google Scholar]
  46. Almonacid, F.; Rus, C.; Pérez-Higueras, P.; Hontoria, L. Calculation of the energy provided by a PV generator. Comparative study: Conventional methods vs. artificial neural networks. Energy 2011, 36, 375–384. [Google Scholar] [CrossRef]
  47. Erraissi, N.; Raoufi, M.; Aarich, N.; Akhsassi, M.; Bennouna, A. Implementation of a low-cost data acquisition system for “PROPRE.MA” project. Meas. J. Int. Meas. Confed. 2018, 117, 21–40. [Google Scholar] [CrossRef]
  48. Rosiek, S.; Batlles, F.J. A microcontroller-based data-acquisition system for meteorological station monitoring. Energy Convers. Manag. 2008, 49, 3746–3754. [Google Scholar] [CrossRef]
  49. Ameur, S.; Laghrouche, M.; Adane, A. Monitoring a greenhouse using a microcontroller-based meteorological data-acquisition system. Renew. Energy 2001, 24, 19–30. [Google Scholar] [CrossRef]
  50. Benghanem, M. Measurement of meteorological data based on wireless data acquisition system monitoring. Appl. Energy 2009, 86, 2651–2660. [Google Scholar] [CrossRef]
  51. Devaraju, J.T.; Suhas, K.R.; Mohana, H.K.; Patil, V.A. Wireless Portable Microcontroller based Weather Monitoring Station. Meas. J. Int. Meas. Confed. 2015, 76, 189–200. [Google Scholar] [CrossRef] [Green Version]
  52. Mahjoubi, A.; Mechlouch, R.F.; Ben Brahim, A. A low cost wireless data acquisition system for a remote photovoltaic (PV) water pumping system. Energies 2011, 4, 68–89. [Google Scholar] [CrossRef]
  53. Di Gennaro, S.F.; Matese, A.; Mancin, M.; Primicerio, J.; Palliotti, A. An open-source and low-cost monitoring system for precision enology. Sensors 2014, 14, 23388–23397. [Google Scholar] [CrossRef]
  54. Fanourakis, S.; Wang, K.; McCarthy, P.; Jiao, L. Low-cost data acquisition systems for photovoltaic system monitoring and usage statistics. In IOP Conference Series: Earth and Environmental Science; IOP Publishing: Bristol, UK, 2017; Volume 93, p. 12048. [Google Scholar]
  55. Evans, B.W. Arduino Programming Book; Creative Commons: Mountain View, CA, USA, 2007; ISBN 978-1-4302-3240-7. [Google Scholar]
Figure 1. Renewable and non-renewable power capacity additions. 2001–2015. Source International Renewable Energy Agency (IRENA) 2017 [2].
Electronics 08 00304 g001
Figure 2. Evolution of the cumulative PV installations in GW from 2007 to 2017. Source IEA [4].
Electronics 08 00304 g002
Figure 3. Architecture implemented for the development of the utility model that measures global radiation (G). Real time clock (RTC).
Electronics 08 00304 g003
Figure 4. (a) Block diagram of the integrated circuit (b) Description of the sensor terminals.
Electronics 08 00304 g004
Figure 5. Image of the sensor before encapsulation.
Electronics 08 00304 g005
Figure 6. (a) Initial hardware configuration utilized (b) Flow diagram of the software solution of the utility model.
Electronics 08 00304 g006aElectronics 08 00304 g006b
Figure 7. Flow diagram of signal acquisition of the radiation sensor.
Electronics 08 00304 g007
Figure 8. Evolution of global horizontal irradiance (GHI) on a sunny day, 2 May 2016.
Electronics 08 00304 g008
Figure 9. Evolution of global horizontal irradiance on a cloudy day of low radiation, 8 May 2016.
Electronics 08 00304 g009
Figure 10. Evolution of global horizontal irradiance on a cloudy day of high radiation, 22 May 2016.
Electronics 08 00304 g010
Figure 11. Correlation coefficient R2, obtained by means of two methods.
Electronics 08 00304 g011
Figure 12. Evolution of global horizontal irradiance 20 March 2016 (spring equinox) 21 June 2016 (summer solstice), 22 September 2016 (autumn equinox), 21 December 2016 (winter solstice).
Electronics 08 00304 g012
Table 1. Terminals of the TSL230RD with which the sensitivity of the integrated circuit is selected.
FunctionEntryDescription
GND4Ground
OUT6Frequency scale
S0,S11,2Sensitivity
S2,S37,8Frequency
VDD5Input Voltage
Table 2. Values of the terminals of the TSL230RD for the adjustment of the sensitivity in the integrated circuit.
S1S0Sensitivity
LLElectrical Current less
LHx1
HLx10
HHx100
Table 3. Values of the TSL230RD terminals for the adjustment of the frequency in the integrated circuit.
S3S2Scale (Divided by)
LL1
LH2
HL10
HH100
Table 4. Characteristics of the data acquisition card.
FeaturesArduino UNO
MicrocontrollerATmega328
Input voltage7 V–12 V
No. I/O digital pins14 (6 Outputs pulse-width modulation (PWM))
No. analogical inputs6
Flash Memory32 KB
Clock Frequency16 MHz

