Improving the Dipping Step in Czochraski Process Using Haar-Cascade Algorithm


Abstract
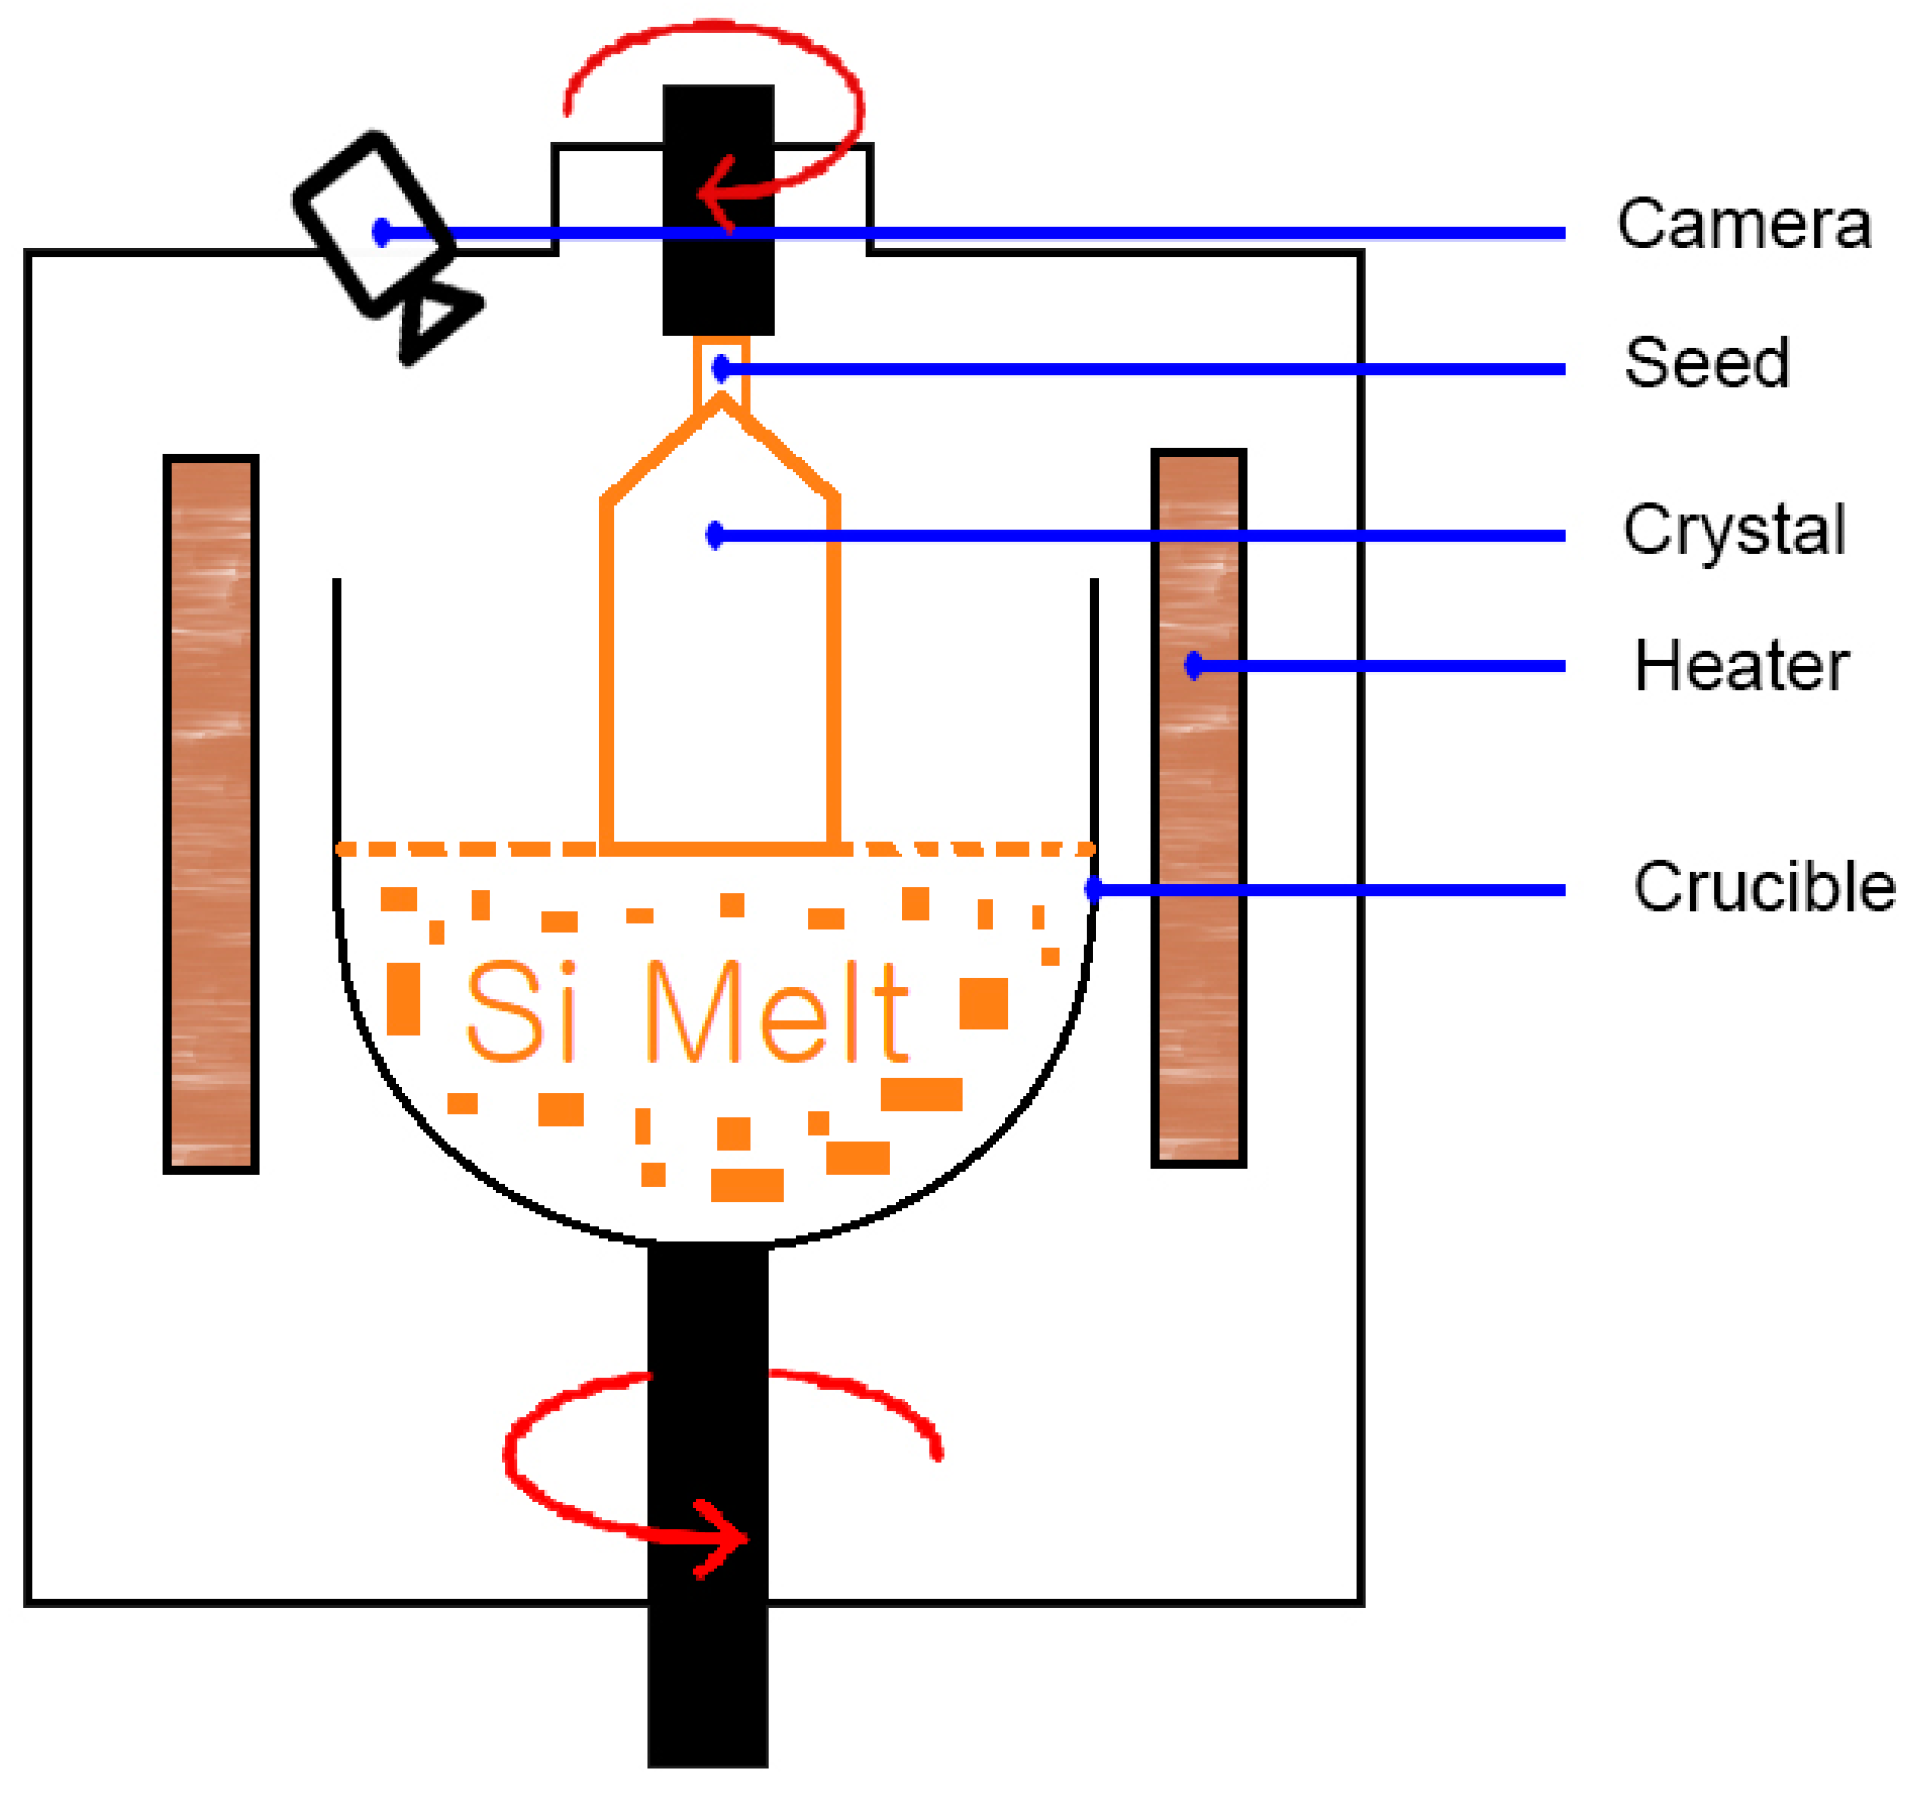
:1. Introduction
2. Materials and Methods
2.1. Related Work
2.2. Applying Haar Cascade in Dipping Step
2.2.1. Applying Image Processing and Computer Data Analysis
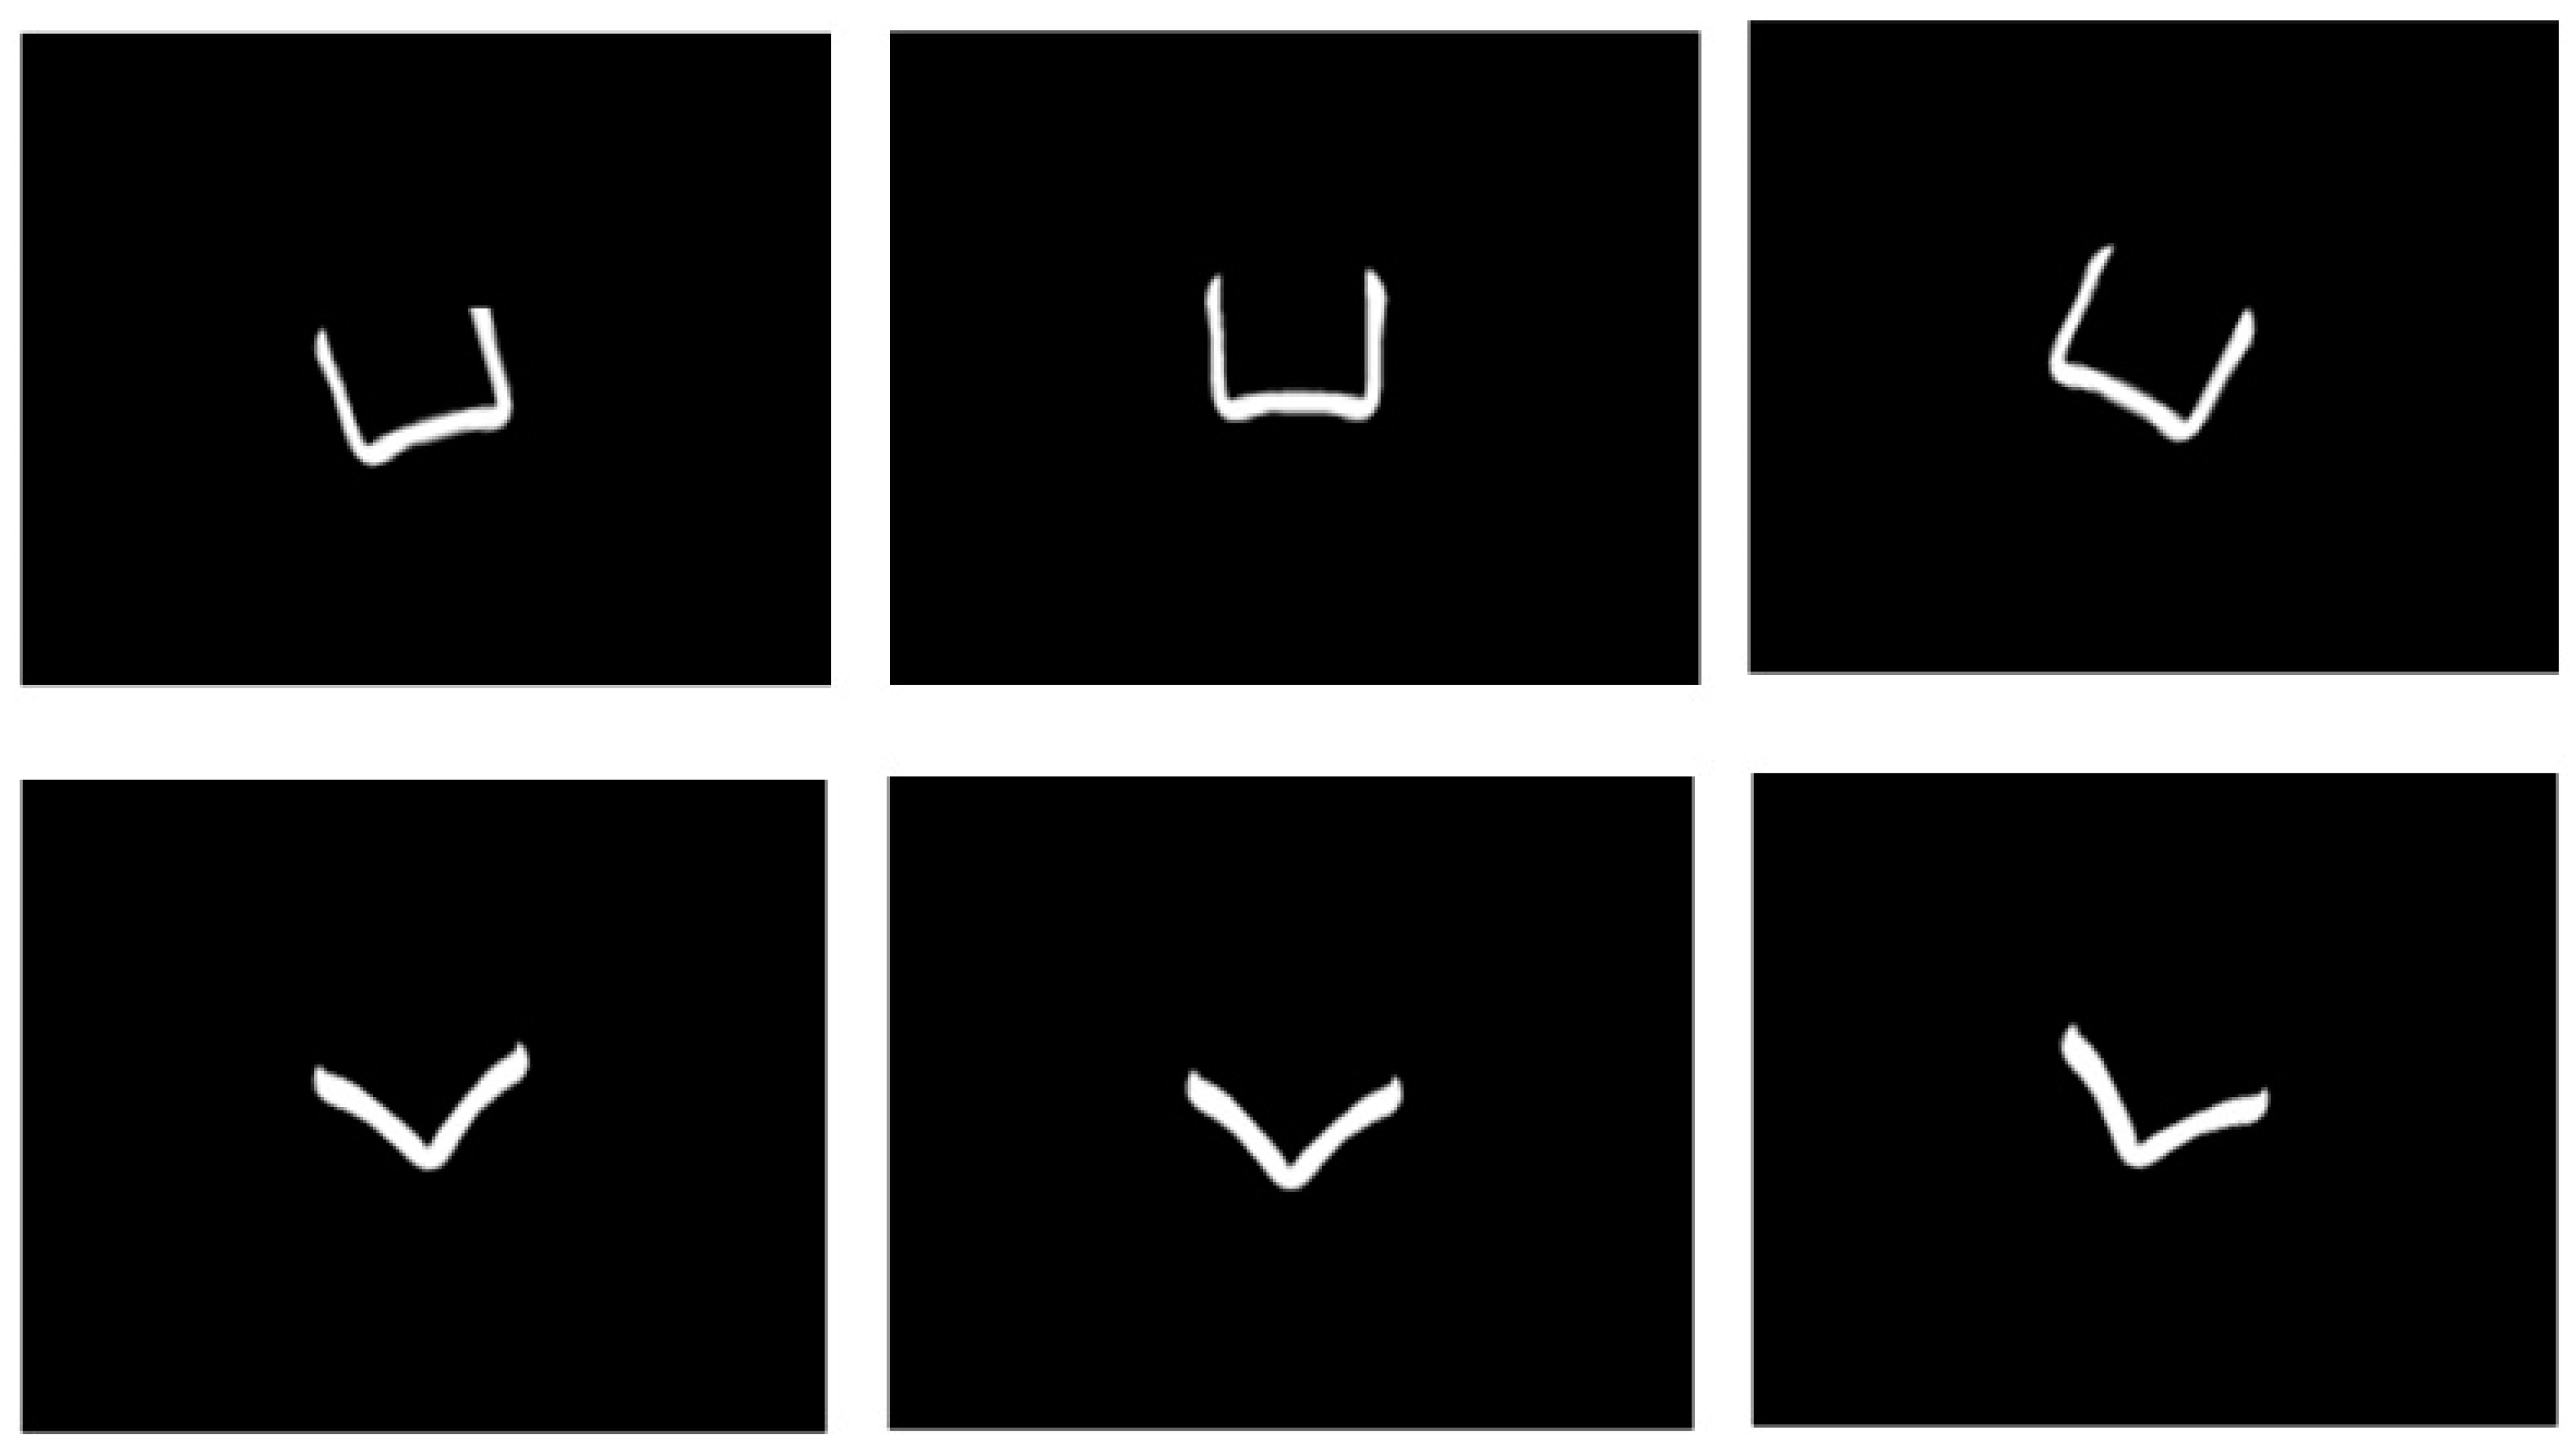
2.2.2. Detecting the Shape Using an Algorithm
2.2.3. Classifying the Shape Obtained
2.2.4. Training the Machine to Recognize the Need-to-Find Object
2.2.5. Applying the Cascade Classifier for Detecting Good Dipping
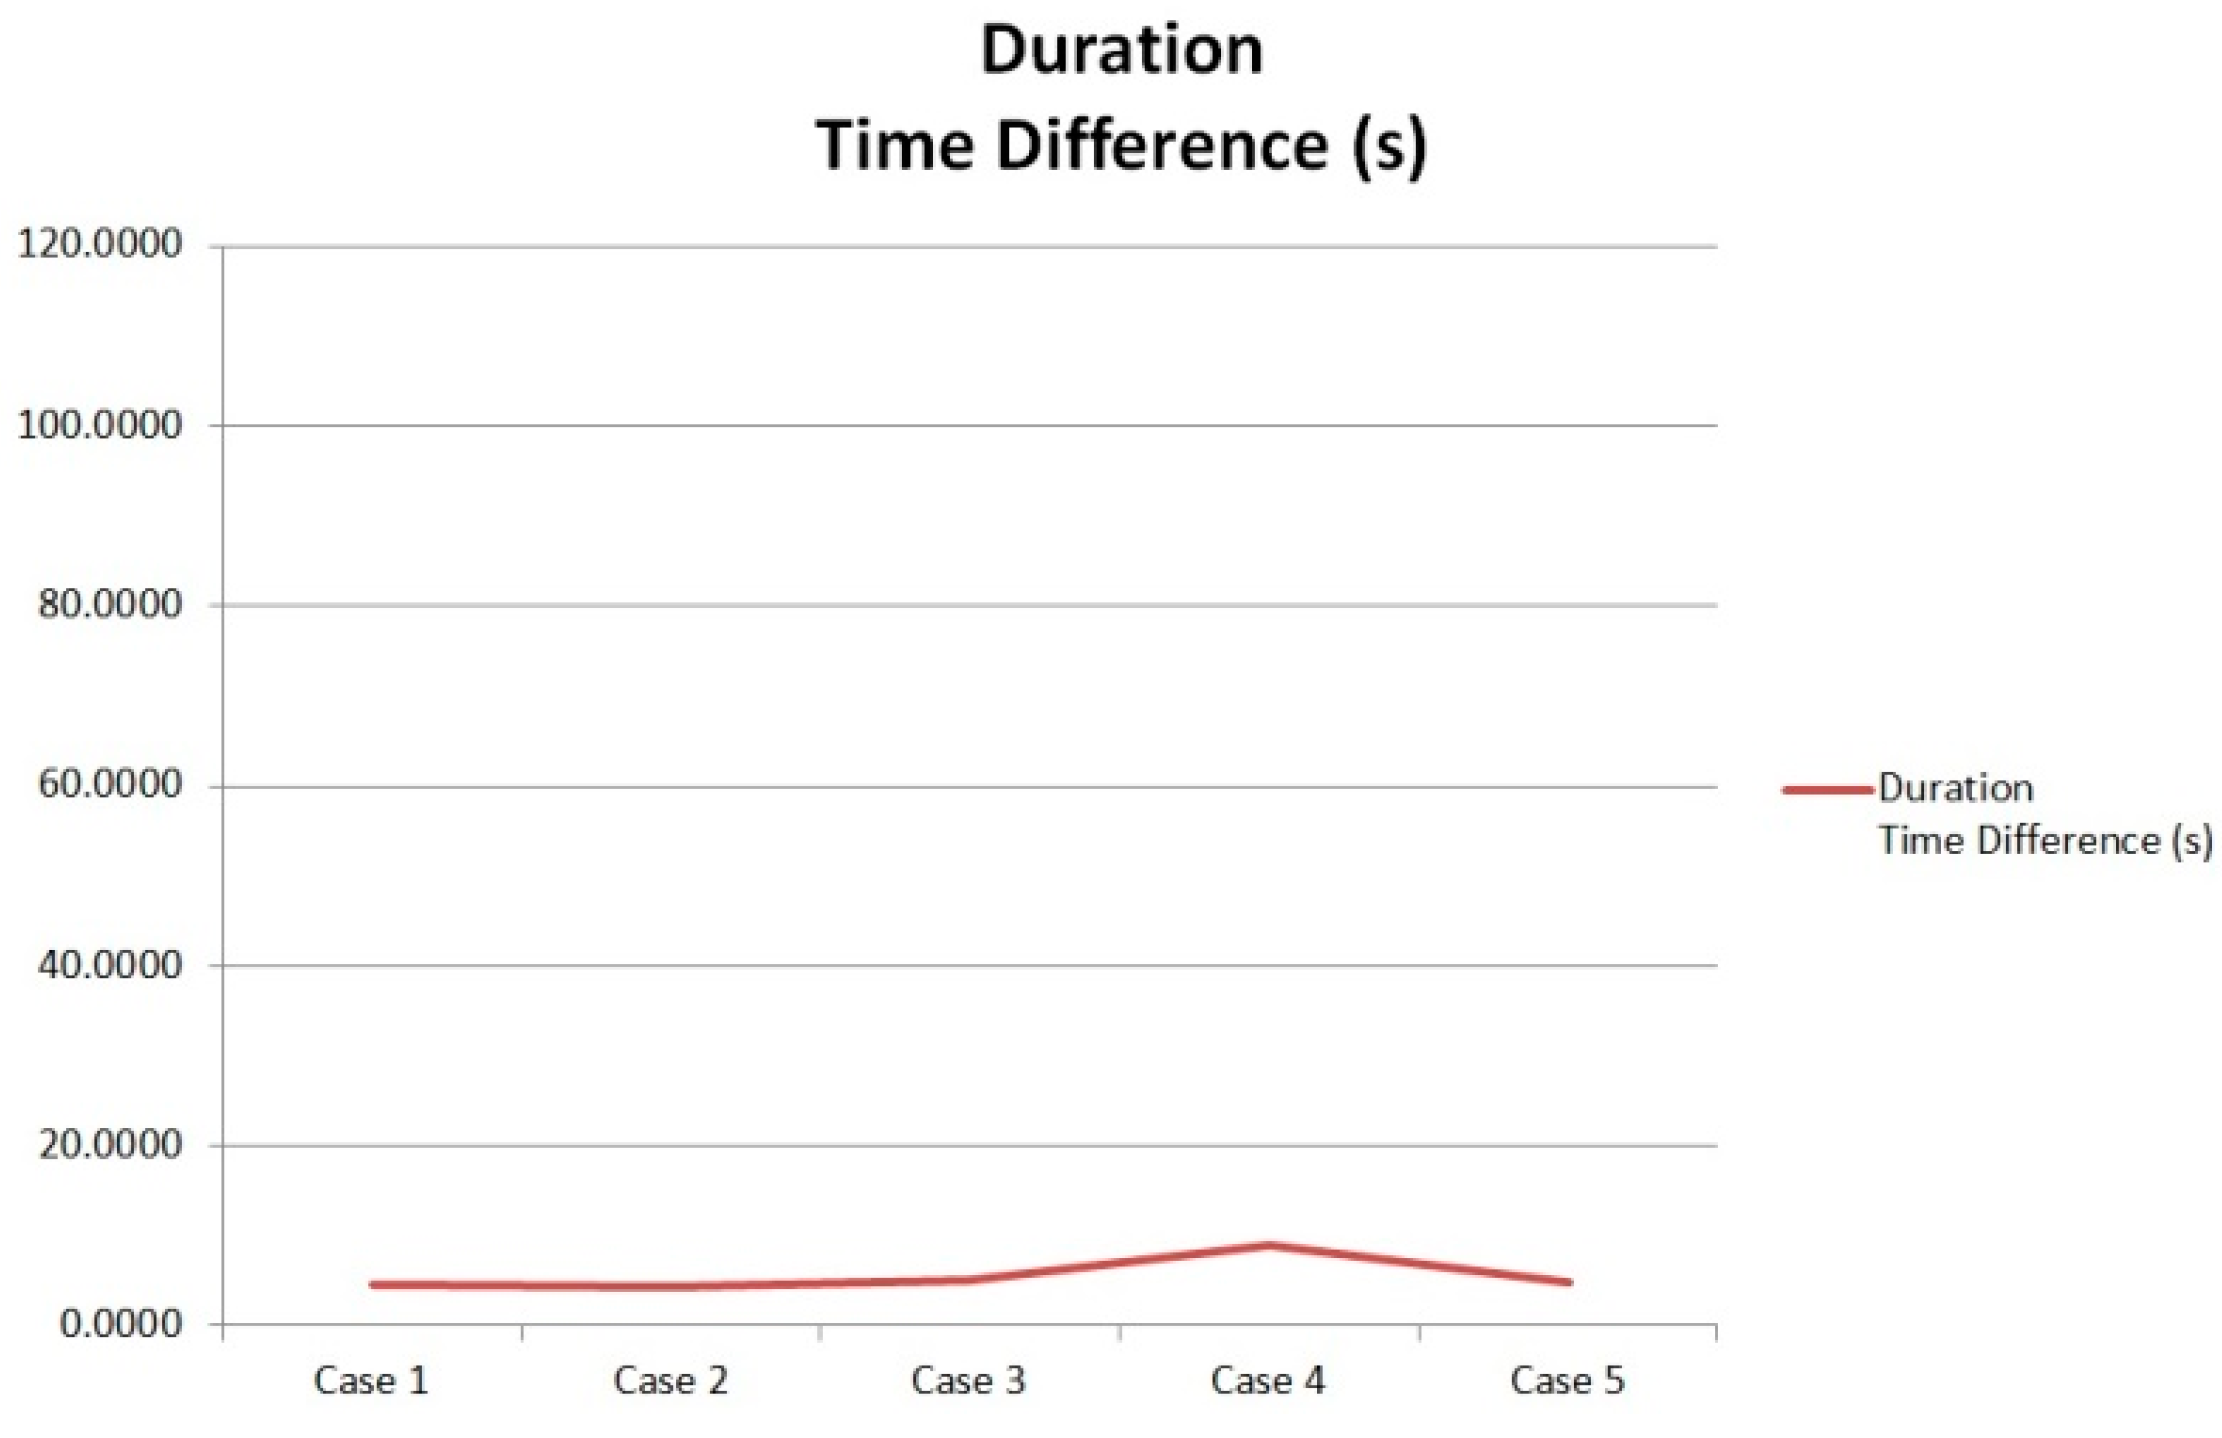
3. Experiment Results
4. Discussion
5. Conclusion
Author Contributions
Funding
Conflicts of Interest
References
- Smil, V. Energy and Civilization: A History; Chapter 5; The MIT Press: Cambridge, MA, USA, 2017; pp. 237–295. [Google Scholar]
- Jochen, F.; Ammon, W.; Muller, G. Czochralski Growth of Silicon Crystals. In Handbook of Crystal Growth, 2nd ed.; Rudolph, P., Ed.; Elsevier: London, UK, 2015; pp. 45–104. [Google Scholar]
- Czochraski, J. A new method for the measurement of the crystallization rate of metals. Z. Phys. Chem. 1918, 92, 219–221. [Google Scholar]
- Teal, G.K.; Little, J.B. Growth of germanium single crystals. Phys. Rev. 1950, 78, 647. [Google Scholar]
- Digges, T.G.; Hopkins, R.H.; Seidensticker, R.G. The basis of automatic diameter control utilizing “bright ring” meniscus reflections. J. Cryst. Growth 1975, 29, 326–328. [Google Scholar] [CrossRef]
- Itsumi, M.; Akiya, H.; Ueki, T. The composition of octahedron structures that act as an origin of defects in thermal SiO2 on Czochralski silicon. J. Appl. Phys. 1995, 78, 5984. [Google Scholar] [CrossRef]
- Kakimto, K. Development of Crystal Growth Technique of Silicon by Czochralski Method. Acta Phys. Pol. A 2013, 124, 227–230. [Google Scholar] [CrossRef]
- Winkler, J.; Robenack, K. Observer based determination of the crystal diameter in Czochralski crystal growth utilizing algorithmic differentiation. In Proceedings of the 2012 9th International Multi-Conference on Systems, Signal and Devices (SSD), Chemnitz, Germany, 20–23 March 2012; pp. 1–6. [Google Scholar]
- Winkler, J.; Neubert, M.; Rudolph, J. A review of the automation of the Czochralski crystal growth process. Acta Phys. Pol. 2013, 124, 181–192. [Google Scholar] [CrossRef]
- Jing, C.J.; Imaishi, N.; Yasuhiro, S.; Miyazawa, Y. Three-dimensional numerical simulation of oxide melt flow in Czochralski configuration. J. Cryst. Growth 2016, 216, 372–388. [Google Scholar] [CrossRef]
- Kim, C.M.; Kim, S.R.; Ahn, J.H. Development of Auto-seeding System Using Image Processing Technology in the Sapphire Crystal Growth Process via the Kyropoulos Mehod. Appl. Sci. 2017, 7, 371. [Google Scholar] [CrossRef]
- Wang, X.Z.; de Anda, J.C.; Roberts, K.J. Real-Time Measurement of the Growth Rates of Individual Crystal Facets Using Imaging and Image Analysis: A Feasibility Study on Needle-shaped Crystal of L-Glutamic Acid. Chem. Eng. Res. Des. 2007, 85, 921–927. [Google Scholar] [CrossRef]
- Wang, X.; Roberts, K.; Ma, C. Crystal Growth measurement using 2d and 3d imaging and the perspectives for shape control. Chem. Eng. Des. 2008, 63, 1173–1184. [Google Scholar] [CrossRef]
- Mohammad, H.T.; Shirin, O.; Ebrahim, M. Influence of active afterheater on the fluid dynamics and heat transfer during Czochralski growth of oxide single crystals. CrystEngComm 2011, 13, 5088–5093. [Google Scholar]
- Ding, J.; Liu, L. Real-time prediction of crystal/melt interface shape during Czochraski crystal growth. CrystEngComm 2018, 20, 6925–6931. [Google Scholar] [CrossRef]
- Amit, K.; Jyotirmay, B.; Muralidhar, K. Thermal Modeling of Crystal Growth by Czochraski Method including Radius Control. J. Sci. Ind. Res. 2002, 61, 607–616. [Google Scholar]
- Jin, T.; Shengdeng, W.; Jianwei, C. Research on Measure Method of Diameter of Partial Circle Based on CCD. Semicond. Technol. 2007, 32, 574–576. [Google Scholar]
- Han, X.J.; Wang, X.M.; Zhao, Q. Image Processing for the use of crystal production monitor. Chin. J. Sens. Actuators 2006, 19, 346–348. [Google Scholar]
- Viola, P.; Jones, M. Rapid Object Detector using a Boost Cascade of Simple Features, Rapid object detection using a boosted cascade of simple features. IEEE CVPR 2001, 1, 511–518. [Google Scholar]
- Yoav, F.; Robert, E.S. A Short Introduction to Boosting. J. Jpn. Soc. Artif. Intell. 1999, 14, 771–780. [Google Scholar]
- Soo, S. Seminar University of Tartu. Available online: http://ds.cs.ut.ee/Members/artjom85/2014dss-course-media/Object%20detection%20using%20Haar-final.pdf (accessed on 14 May 2019).


| Name | Data | Name | Data | Name | Data |
|---|---|---|---|---|---|
| Number of States: | 20 | Boost Type: | GAB | Maximal Weak Tree: | 100 |
| Number of Threads: | 7 | Minimal Hit Rate: | 0.995 | Number of Positives: | 1150 |
| Acceptance Ratio Break Value: | −1 | Maximal False Alarm Rate: | 0.5 | Number of Negatives: | 8850 |
| Feature Type: | Haar | Weight Trim Rate: | 0.95 | - | - |
| Haar Feature Type: | Basic | Maximal Depth Weak Tree: | 1 | - | - |
| Case | Process’s Name | Good Dipping Images | False Detect Images | Accuracy Rate (%) | Duration Time Difference (s) |
|---|---|---|---|---|---|
| Case 1 | ICZ | 11455 | 45 | 99.60869565 | 4.578 |
| Normal CZ | 11500 | ||||
| Case 2 | ICZ | 11516 | 34 | 99.70562771 | 4.289 |
| Normal CZ | 11550 | ||||
| Case 3 | ICZ | 11473 | 67 | 99.41941075 | 5.184 |
| Normal CZ | 11540 | ||||
| Case 4 | ICZ | 11329 | 101 | 99.11636045 | 8.937 |
| Normal CZ | 11430 | ||||
| Case 5 | ICZ | 11468 | 52 | 99.54861111 | 4.819 |
| Normal CZ | 11520 | ||||
© 2019 by the authors. Licensee MDPI, Basel, Switzerland. This article is an open access article distributed under the terms and conditions of the Creative Commons Attribution (CC BY) license (http://creativecommons.org/licenses/by/4.0/).
Share and Cite
Phuc, L.T.H.; Jeon, H.; Truong, N.T.N.; Hak, J.J. Improving the Dipping Step in Czochraski Process Using Haar-Cascade Algorithm. Electronics 2019, 8, 646. https://doi.org/10.3390/electronics8060646
Phuc LTH, Jeon H, Truong NTN, Hak JJ. Improving the Dipping Step in Czochraski Process Using Haar-Cascade Algorithm. Electronics. 2019; 8(6):646. https://doi.org/10.3390/electronics8060646
Chicago/Turabian StylePhuc, Le Tran Huu, HyeJun Jeon, Nguyen Tam Nguyen Truong, and Jung Jae Hak. 2019. "Improving the Dipping Step in Czochraski Process Using Haar-Cascade Algorithm" Electronics 8, no. 6: 646. https://doi.org/10.3390/electronics8060646
APA StylePhuc, L. T. H., Jeon, H., Truong, N. T. N., & Hak, J. J. (2019). Improving the Dipping Step in Czochraski Process Using Haar-Cascade Algorithm. Electronics, 8(6), 646. https://doi.org/10.3390/electronics8060646