Article

Multi-Scale Dense Attention Network for Stereo Matching

1
School of Microelectronics, Tianjin University, Tianjin 300072, China
2
Tianjin Key Laboratory of Imaging and Sensing Microelectronic Technology, Tianjin University, Tianjin 300072, China
*
Author to whom correspondence should be addressed.
Electronics 2020, 9(11), 1881; https://doi.org/10.3390/electronics9111881
Submission received: 17 September 2020 / Revised: 29 October 2020 / Accepted: 4 November 2020 / Published: 9 November 2020
(This article belongs to the Section Computer Science & Engineering)

Abstract

:
To improve the accuracy of stereo matching, the multi-scale dense attention network (MDA-Net) is proposed. The network introduces two novel modules in the feature extraction stage to achieve better exploit of context information: dual-path upsampling (DU) block and attention-guided context-aware pyramid feature extraction (ACPFE) block. The DU block is introduced to fuse different scale feature maps. It introduces sub-pixel convolution to compensate for the loss of information caused by the traditional interpolation upsampling method. The ACPFE block is proposed to extract multi-scale context information. Pyramid atrous convolution is adopted to exploit multi-scale features and the channel-attention is used to fuse the multi-scale features. The proposed network has been evaluated on several benchmark datasets. The three-pixel-error evaluated over all ground truth pixels is 2.10% on KITTI 2015 dataset. The experiment results prove that MDA-Net achieves state-of-the-art accuracy on KITTI 2012 and 2015 datasets.

1. Introduction

The depth information of objects is quite important for many computer vision tasks such as three-dimensional reconstruction, robot navigation, and autonomous driving. Recently, stereo vision, as a technology to obtain depth information from stereo image pairs, has been widely used in various fields [1,2]. As the core task of binocular system, the accuracy of stereo matching affects the performance of the entire binocular vision system.
The classic pipeline of stereo matching algorithm includes four steps: computing matching cost, aggregating cost, optimizing disparity, and post-processing [3]. Many different methods [4,5,6] are proposed to achieve the matching cost calculation with neighbor pixels. For example, Zabih and Woodfill [7] introduced a non-parametric local transformation to the matching cost computation and proposed the Census change whose main idea is to use the relative order statistics of the pixel values in the local area instead of directly using the pixel value.
Deep learning has developed rapidly in recent years, showing strong image understanding capabilities. The convolutional neural network (CNN) was first applied to stereo matching for the calculation of matching cost [8]. CNN was used to extract features from images and computing the similarity score between patches. The matching cost is then processed by the cross-based cost summary module and the semi-global matching module. Inspired by the significant improvement that CNN yields, many neural networks-based algorithms were put forward, but most of them use CNN to solve the problem of computing the similarity score [8,9]. Recently, researches on end-to-end CNN methods were put forward in the stereo matching field. DispNet [10] shows that the procedures of traditional algorithms can be integrated in stereo matching by using a CNN.
Although the performance of CNN-based algorithms has gained great improvement on several benchmarks, some difficult problems still exist in disparity estimation of pixels in ill-posed regions. Context information can be understood as the relationship between an object and its surrounding environment or between an object and its components. It can help to make better disparity estimation of the pixels in ill-posed areas. Therefore, global context information should be incorporated for more accurate matching.
There are some other methods trying to obtain context information features for better disparity estimation in the stereo image pairs. GC-Net [11] introduces 3D CNN to stereo matching to regularize cost volume. GC-Net uses a stacked encoder-decoder structure in 3D CNN to better utilize context information. PSMNet [12] employs a spatial pyramid pooling module to extract context information.
In many semantic segmentation works, integrating features of different scales is a crucial method to exploit context information and compensate for the low-level structure information loss caused by the deep network. High-level features have richer semantic information, but the resolution is low, and the ability to perceive details is poor. Therefore, the key is to recover the high-level features to high-resolution and fuse them with the low-level features. In Reference [13], a novel method named sub-pixel convolution is dedicated to compensating the information loss caused by traditional interpolation upsampling. In addition, in Reference [14], a novel upsampling block is proposed to fuse multi-scale features.
In this paper, a multi-scale dense attention network (MDA-Net) is proposed to exploit context information for better depth estimation. The dual-path upsampling (DU) block is introduced to better fuse features of different scales. The attention-guided context-aware pyramid feature extraction (ACPFE) block is proposed for high-level features to extract richer context information. The contributions of this paper are summarized as follows:
  • A novel network without any post-processing for stereo matching is proposed;
  • The DU block is introduced as a more effective upsampling method of fusing multi-scale features;
  • The ACPFE block is adopted to extract richer context information.
The remainder of this paper is structured as follows. In Section 2, the architecture of MDA-Net is explained in detail. In Section 3, the experiment results are presented. Finally, in Section 4, the conclusion is described.

2. Multi-Scale Dense Attention Network

The architecture of the MDA-Net is shown in Figure 1, which contains three parts: Siamese feature extraction, 3D matching net, and disparity regression. Detailed descriptions will be provided in the following subsections.

2.1. Siamese Feature Extraction

There are four parts of the Siamese feature extraction module: shallow feature extraction, stacked dense blocks, dual-path upsampling blocks, and attention-guided context-aware pyramid feature extraction blocks. The structure of the Siamese feature extraction module is shown in Figure 2.

2.1.1. Shallow Feature Extraction

Motivated by PSMNet, three 3 × 3 convolutional filters are used instead of large filters such as 7 × 7 convolutional filters in other studies for shallow feature extraction. Shallow feature extraction can help highlight low-level structure information.

2.1.2. Stacked Dense Blocks

In order to further improve the information mining between layers, reduce the complexity of network calculations, and reduce the use of redundant layers, DenseNet [15] is chosen as the backbone of this module. DenseNet directly connects all layers to realize the feature reuse and improve network efficiency. In MDA-Net, three identical dense blocks are stacked for feature extraction learning. The growth rate of our dense block is 24 which means each layer in dense blocks will output 24 feature maps. Since there have much more inputs for the dense block as the network going deeper, the 3 × 3 convolution layer of each dense block here includes a 1 × 1 convolution layer as the bottleneck layer. The bottleneck layer can help to reduce the number of input features and integrate the characteristics of each channel. The transition layers, including a 1 × 1 convolution layer and a 2 × 2 Avgpooling layer, are added to the module between every dense block to reduce the size of feature map and compress the network further.

2.1.3. Dual-Path Upsampling Block

For the better fusion of different size feature maps generated by different dense blocks, a dual-path upsampling block is introduced to replace bilinear upsampling. Traditional bilinear upsampling uses handcrafted interpolate functions which cannot change adaptively for different feature maps.
Motivated by References [13,14], the sub-pixel convolutional layer is introduced. Using sub-pixel convolutional layers, feature maps realize the upsampling process from low resolution to high resolution. The sub-pixel convolution can be regarded as the inverse process of sampling because it uses convolution layers to obtain low-resolution images to form a large high-resolution image. The structure of DU block is shown in Figure 3. The DU block adopts two upsampling methods to restore the high-level features F h i g h to high resolution. The features upsampled via bilinear upsampling get F b u , and the features upsampled via sub-pixel convoluition get F s u b . Then a pixel-summation which gets F s u m is conducted between F s u b and F l o w . Finally F b u is concated with F s u m , so that F c can contain the information of F h i g h and F l o w .

2.1.4. Attention-Guided Context-Aware Pyramid Feature Extraction Block

As mentioned before, obtaining rich context information features is very beneficial to the disparity estimation of the corresponding points especially in ill-posed regions. Existing CNN models [16,17] adopt a spatial pyramid pooling module to extract context information, mainly using pooling layers with different convolution kernel sizes. Similar to pyramid feature extraction in Reference [18], we take the outputs of Dense Block 2 and Dense Block 3 to extract multi-scale features. The architecture of ACPFE block is shown in Figure 4. The outputs of Dense Block 2 and Dense Block 3 are taken as the inputs of two ACPFE block. Atrous convolutions are adopted to capture multi-receptive-field features without pooling loss information. There are a 1 × 1 convolutional layer and three atrous convolutions whose dilation rates are set to 3, 5, and 7. Then the feature maps are combined. After that, motivated by the SENet [19], a channel-wise attention method is introduced to re-weight the channel features and enhance the channel features with the most information. The feature map after global average pooling K a t t ( F ) can be computed as follows:
K a t t ( F ) = W 2 ( δ ( β ( W 1 ( A v g P o o l ( C ( F ) ) ) ) ) ,
A ( F ) = σ ( K a t t ( F ) ) C ( F ) + C ( F ) ,
where δ , β , σ represent batch normalization, ReLU function, and sigmoid function respectively. W 1 , W 2 are the weights of the fully connected (FC) layer. means element-wise multiplication. Finally, the feature A ( F ) is split into four C × H × W streams. The four streams are then summed using an element-wise summation.

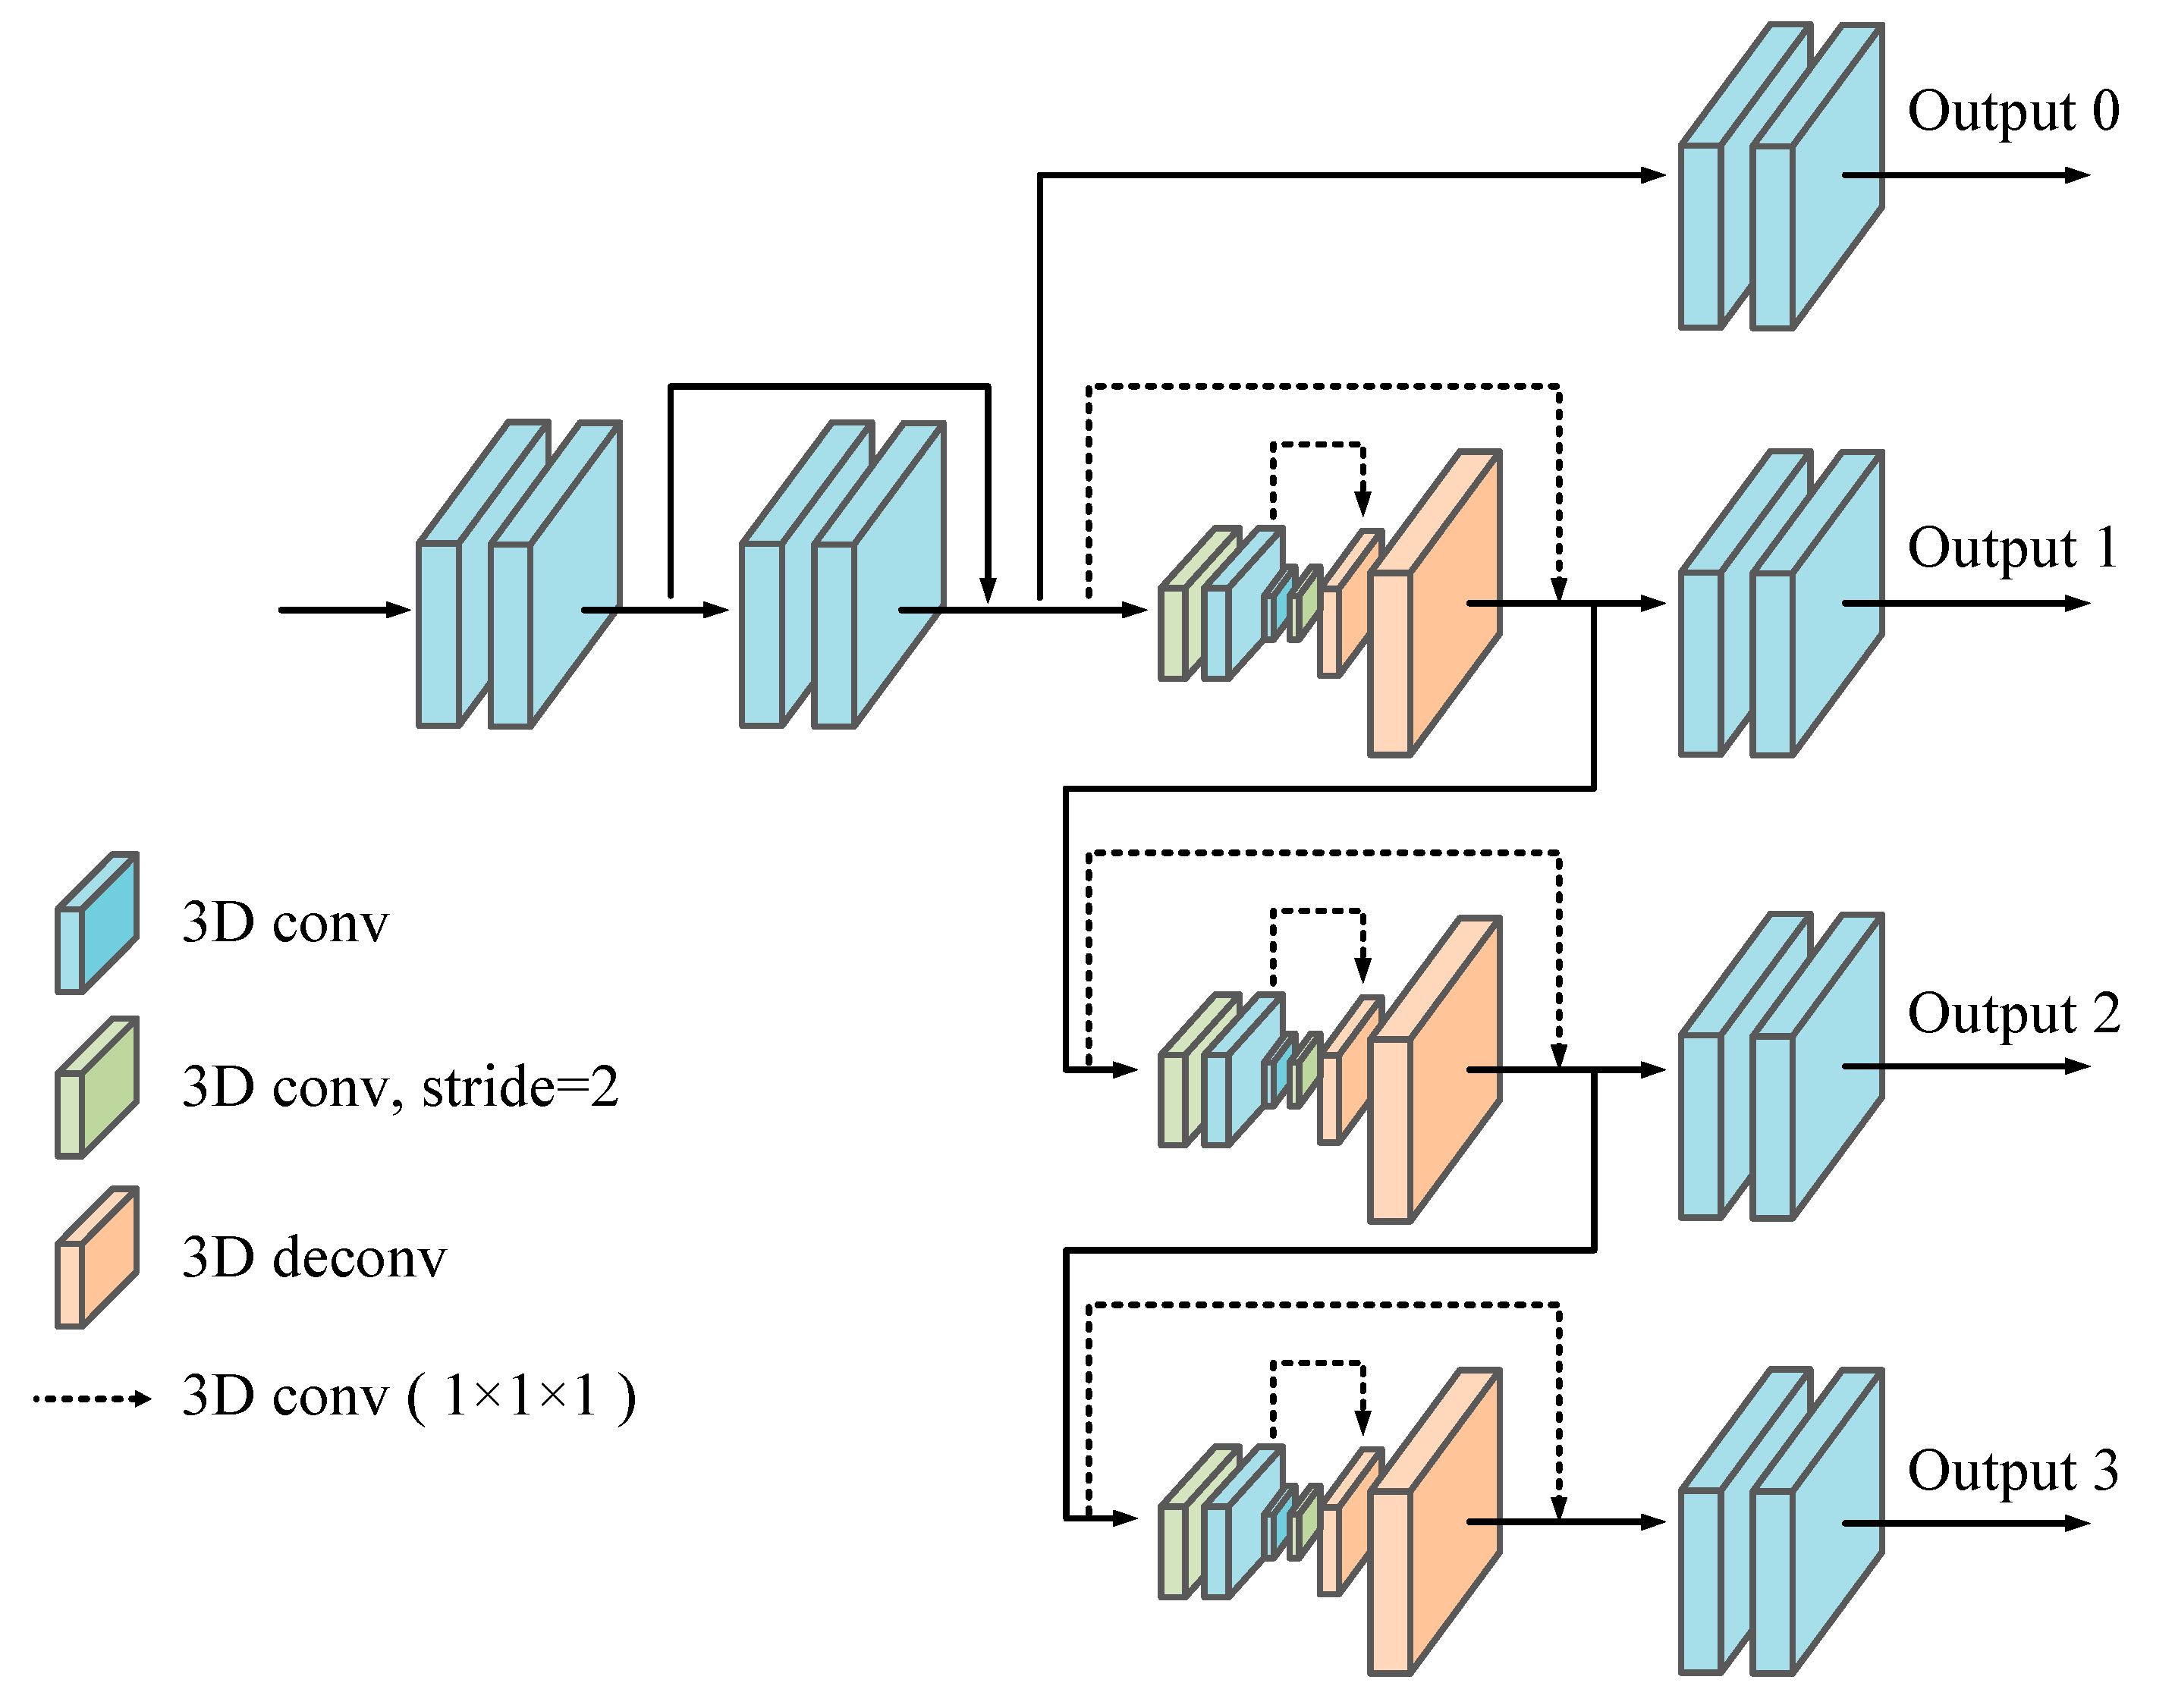
2.2. 3D Matching Net

In most end-to-end stereo matching networks, a 3D convolution network is used to realize the disparity calculation. Motivated by PSMNet and GC-Net, a 3D convolution network is introduced in this paper to learn more context information from the dimensions of height, width, and parallax. The network uses an encoding-decoding structure to reduce the large amount of computational burden caused by 3D convolution. In the encoder part, 3D convolution with a stride of 2 is used for down-sampling, and in the decoder part, 3D deconvolution with a stride of 2 is adopted symmetrically to restore the size of matching cost volume. Due to the loss of spatial information, PSMNet connects the matching cost volume in the encoder and decoder. In this paper, motivated by Reference [20], a 1 × 1 × 1 3D convolution layer is used to replace the original shortcut connection, seen as dashed lines in Figure 5. The architecture of the 3D matching net is shown in Figure 5. The network is composed of three stacked 3D encoding-decoding networks. It uses multi-scale features to fully extract context information and reduces the computational burden. Finally, the size of cost volume is restored to H × W × D through bilinear interpolation to perform the following disparity regression calculation.

2.3. Disparity Regression and Loss Function

A disparity regression module, as proposed in GCNet is applied in this paper. For each output from the 3D matching net, there are two 3D convolution layers applied to form a four-dimensional volume. The volume is then upsampled to the input size and converted by a Softmax function. The Softmax function will produce a probability for each volume. The predicted disparity d ^ is calculated as:
d ^ = d = 0 D m a x d × σ ( c d ) ,
where c d refers to the predicted cost and σ ( ) refers to the softmax operation which mathematical expression is:
σ ( z j ) = e z j k = 1 K e z k   ,
The four predicted disparity maps can be denoted as d 0 , d 1 , d 2 , d 3 . Smooth L1 function is chosen for its robustness and low sensitivity. The calculation formula of the loss function of MDA-Net is shown as follows:
L ( d ,   d ^ ) =   i = 1 4 λ i s m o o t h L 1 ( d i d ^ i )   ,
in which:
s m o o t h L 1 ( x ) =   { 0.5 x 2 ,                                           i f   | x | < 1   | x | 0.5 ,                               o t h e r w i s e   ,
where d represents the ground-truth disparity, d ^ represents the predicted disparity, and λ i denotes the coefficients for ith disparity prediction.

3. Experiments

The model proposed above was evaluated on three datasets: KITTI 2012, KITTI 2015 and Scene Flow. Datasets and some experimental details are described in Section 3.1 and Section 3.2. Some ablation studies for the DU block and ACPFE block are shown in Section 3.3. The performance comparison of the model is discussed in Section 3.4.

3.1. Datasets

The Scene Flow dataset [21] is a collection of synthetic stereo datasets consisting of three parts: Flyingthings3D, Driving, and Monkaa. The Flyingthings3D part contains a large number of floating random objects; the driving part is captured by a driving car in open street scenes; the pictures in the Monkaa part are monkeys in the forest. This dataset contains 35,454 training images of size 960 × 540 and 4370 testing images of the same size. There are not only indoor scenes but also outdoor scenes in this dataset.
The KITTI 2015 dataset [22] is a dataset with real-world scenes of driving cars. It provides 200 training images of size 1240 × 376 with LIDAR ground-truth disparity and 200 testing pairs of the same size. This study randomly selected 180 pairs of stereo images in the training set as the training set of MDA-Net, and the remaining 20 pairs of stereo images as the validation set.
The KITTI 2012 dataset [23] is a dataset with real-world scenes of driving cars. This dataset provides 194 training images of size 1240 × 376 with LIDAR ground-truth disparity and 195 testing image pairs of the same size. In the experiment of this paper, 180 pairs of stereo images in the training set are randomly selected as the training set of MDA-Net, and the remaining 14 image pairs are used as the validation set.

3.2. Experimental Details

The MDA-Net architecture was implemented using PyTorch platforms using Adam optimizer [24] with β 1 = 0.9, β 2 = 0.999. MDA-Net is trained on 2 Nvidia TITAN-X GPUs with 12 GB memory. The parameters of outputs are set as λ 0 = 0.5,   λ 1 = 0.5,   λ 2 = 0.7,   λ 3 = 1.0. The image pairs are cropped to size 512 × 256 randomly. The maximum disparity value is set as D m a x = 192 .
For Scene Flow, the network is trained for 16 epochs. The learning rate is set as 0.001 at the beginning, then it is reduced by one-half after epoch 10, 12, and 14. The learning rate ends at 0.000125. The full image whose size is 960 × 540 is fed into the network. To better evaluate the network, less than 10% pixels in the test set are removed since the disparity of those pixels is larger than the D m a x that we set.
For KITTI 2012/2015, the network is fine-tuned for another 300 epochs using the model which is pre-trained on Scene Flow datasets. The fine-tuning learning rate is set as 0.001 at first and reduced by one-tenth after epoch 200. The test images are zero-padded on the top and right side to obtain the same size 1280 × 384 .

3.3. Ablation Study

Ablation studies are performed on the proposed module to verify the effectiveness. The studies are performed on the final pass version of Scene Flow dataset and validation set of KITTI 2015 dataset. For Scene Flow, the end-point error (EPE) is used to measure the accuracy of the algorithm. EPE calculates the Euclidean distance between the disparity map and the ground-truth, and takes the average of the entire image. The calculation formula of EPE is as follows:
E P E = 1 N i N ( d i d ^ i ) 2 ,
For KITTI 2015, the three-pixel-error (3PE) is used to measure the accuracy of the algorithm. 3PE selects the pixels whose absolute value of the difference between the disparity map and ground-truth exceeds 3, and calculates the proportion of the entire image. The calculation formula of 3PE is as follows:
3 P E = 1 N i N Φ ( | d i d ^ i | , 3 ) × 100 % ,
in which:
Φ ( p , q ) = { 1 ,   p > q 0 , p q ,
The results of experiments with different network structures are shown in Table 1 and Table 2. First, the stacked dense blocks are tested and set as the baseline for the next comparison. Then the effectiveness of the DU block is proven by comparing the performances using bilinear upsampling method and using the DU block. The comparison result shows that using both sub-pixel convolution and bilinear upsampling method can improve the performance from 1.99% to 1.83% on KITTI 2015 dataset. The EPE reduces from 0.704 px to 0.691 px on Scene Flow dataset. The result shows that using DU blocks to fuse multi-scale features can improve the accuracy of stereo matching effectively. Besides, because of the introduction of sub-pixel convolution, the complexity of this network also increases. The total number of parameters increases from 4.36 M to 4.88 M and the number of FLOPs increases from 128.25 G to 130.37 G. The sub-pixel convolution includes the interpolation function implicitly in the convolution layer for the network to learn adaptively for different pixels, so the accuracy and complexity grow at the same time. The ACPFE module uses atrous convolution to extract the context information and uses channel-wise attention to enhance the channel features with the most information. The experiment result shows that the introduction of ACPFE module can help reduce the 3PE on KITTI 2015 dataset from 1.83% to 1.75% and decrease the EPE on Scene Flow dataset from 0.691 px to 0.679 px. In addition, the total number of parameters increases from 4.88 M to 5.13 M, and the number of FLOPs increases from 130.37 G to 130.96 G. It has proven that the ACPFE module effectively improves the accuracy of network with a small increase in calculation and complexity.

3.4. Performance Comparison

The MDA-Net is tested on three datasets: SceneFlow dataset, KITTI 2012 dataset, and the KITTI 2015 dataset. The experiment results are shown in Figure 6. The error maps present the differences between the predicted disparity map and the ground-truth in the form of pixels. It can be seen from the results that MDA-Net can obtain dense disparity maps in a variety of real road scenes and simulated scenes, especially in weak texture areas such as walls and car bodies on the map, which significantly improves the matching accuracy and reduces the probability of mismatch.
In order to further verify the results of MDA-Net, the test set images obtained in this paper are submitted to the KITTI dataset website for online evaluation, and compared with several typical algorithms based on deep learning in recent years. Performance comparisons are shown in Table 2 and Table 3. “D1-fg”, “D1-bg”, “D1-all” mean that the error is evaluated over foreground regions, background regions, and all ground truth pixels. In Table 2, “all” refers to that it has taken all pixels in testing images into consideration in the error estimating process, whereas “Noc” refers to that only taken the pixels in non-occluded regions. In Table 4, “2 px”, “3 px”, “5 px” means two-pixel-error, three-pixel-error, five-pixel-error respectively. “Ours” in the table is the best performance method of this paper, corresponding to the “Dense Block + DU Block + ACPFE” Module in Table 1.
In the KITTI 2015 dataset, the network proposed has achieved better accuracy than the network listed. Figure 7 shows some disparity results generated by GC-Net, SGM-Net [25], PDS-Net, and our proposed MDA-Net. In addition, the error maps (the blue points in the error map indicate the correct matching point, yellow points mean mismatched points, black points mean ignored points) given by the KITTI 2015 evaluation are shown in Figure 7. The yellow boxes in Figure 7 mark the parts where the matching results of each network are poor. The figure shows that MDA-Net generates more accurate disparity maps in untextured areas such as walls, the body of car, and lawn in Figure 7.
The algorithm proposed is also compared with some excellent algorithms on the KITTI 2012 dataset. Compared with the network listed in the table, the MDA-Net has achieved the best accuracy. Figure 8 shows part of the disparity map generated by GC-Net, SGM-Net, PDS-Net, and the MDA-Net network proposed in this paper and the error map given by the KITTI 2012 dataset (black points in the error map indicate the correct matching points, white points mean the mismatch points). The yellow boxes in the figure mark the parts where the matching results of each network are poor. The figure shows that the MDA-Net generates more accurate disparity maps in the reflective surface area such as walls and the body of car in Figure 8.

4. Conclusions

Recently, many CNN-based stereo matching algorithms have achieved excellent performance. However, it still remains some problems in estimating disparity in some ill-posed regions. This paper introduces an end-to-end network named MDA-Net and proposes two modules, the DU block, and the ACPFE module. Corresponding ablation experiments prove that the proposed module effectively improves the context information extraction ability of MDA-Net. The MDA-Net can obtain a dense disparity map even in the untextured areas and texture repetitive areas, such as the areas where roads, walls, and vehicles in the datasets. Compared with several types of classic networks in recent years, MDA-Net achieves better overall accuracy than other state-of-art methods on the KITTI 2012 and KITTI 2015 datasets. The experiment results also prove that MDA-Net generates more accurate disparity maps in the ill-posed regions such as reflective surface regions, untextured regions on KITTI 2012, and KITTI 2015 datasets.

Author Contributions

Conceptualization, Y.C.; methodology, Y.C.; software, Y.C.; validation, Y.C.; data curation, Y.C.; writing—original draft preparation, Y.C.; writing—review and editing, J.X. and Z.G. All authors have read and agreed to the published version of the manuscript.

Funding

This work was supported by the National Key R&D Program of China (2019YFB2204302).

Conflicts of Interest

The authors declare no conflict of interest.

References

  1. Chen, X.; Zhu, Y. 3D Object Proposals for Accurate Object Class Detection. IEEE Trans. Pattern Anal. Mach. Intell. 2018, 40, 1259–1272. [Google Scholar] [CrossRef] [PubMed] [Green Version]
  2. Zhang, C.; Li, Z.; Cheng, Y.; Cai, R.; Chao, H.; Rui, Y. MeshStereo: A Global Stereo Model with Mesh Alignment Regularization for View Interpolation. In Proceedings of the IEEE International Conference on Computer Vision (ICCV), Santiago, Chile, 7–13 December 2015; pp. 2057–2065. [Google Scholar]
  3. Scharstein, D.; Szeliski, R.; Zabih, R. A Taxonomy and Evaluation of Dense Two-Frame Stereo Correspondence Algorithms. In Proceedings of the IEEE Workshop on Stereo and Multi-Baseline Vision (SMBV), Kauai, HI, USA, 9–10 December 2001; pp. 131–140. [Google Scholar]
  4. Mei, X.; Sun, X.; Dong, W.; Wang, H.; Zhang, X. Segment-Tree Based Cost Aggregation for Stereo Matching. In Proceedings of the IEEE Conference on Computer Vision and Pattern Recognition (CVPR), Portland, OR, USA, 23–28 June 2013; pp. 313–320. [Google Scholar]
  5. Yang, Q. A non-local cost aggregation method for stereo matching. In Proceedings of the 2012 IEEE Conference on Computer Vision and Pattern Recognition, Providence, RI, USA, 16–21 June 2012; pp. 1402–1409. [Google Scholar]
  6. Zhang, K.; Lu, J.; Lafruit, G. Cross-Based Local Stereo Matching Using Orthogonal Integral Images. IEEE Trans. Circuits Syst. Video Technol. 2009, 19, 1073–1079. [Google Scholar] [CrossRef]
  7. Zabih, R.; Woodfill, J. Non-parametric local transforms for computing visual correspondence. In Proceedings of the European Conference on Computer Vision (ECCV), Berlin, Germany, 2–6 May 1994; pp. 151–158. [Google Scholar]
  8. Žbontar, J.; Lecun, Y. Stereo Matching by Training a Convolutional Neural Network to Compare Image Patches. J. Mach. Learn. Res. 2016, 17, 1–32. [Google Scholar]
  9. Shaked, A.; Wolf, L. Improved Stereo Matching with Constant Highway Networks and Reflective Confidence Learning. In Proceedings of the IEEE Conference on Computer Vision and Pattern Recognition (CVPR), Honolulu, HI, USA, 21–26 July 2017; pp. 6901–6910. [Google Scholar]
  10. Guney, F.; Geiger, A. Displets: Resolving stereo ambiguities using object knowledge. In Proceedings of the IEEE Conference on Computer Vision and Pattern Recognition (CVPR), Boston, MA, USA, 7–12 June 2015; pp. 4165–4175. [Google Scholar]
  11. Kendall, A.; Martirosyan, H.; Dasgupta, S.; Henry, P.; Kennedy, R.; Bachrach, A.; Bry, A. End-to-End Learning of Geometry and Context for Deep Stereo Regression. In Proceedings of the IEEE International Conference on Computer Vision Workshops (ICCV Workshops), Venice, Italy, 22–29 October 2017; pp. 66–75. [Google Scholar]
  12. Chang, J.; Chen, Y. Pyramid Stereo Matching Network. In Proceedings of the IEEE Conference on Computer Vision and Pattern Recognition (CVPR), Salt Lake City, UT, USA, 18–23 June 2018; pp. 5410–5418. [Google Scholar]
  13. Shi, W.; Caballero, J.; Huszár, F.; Totz, J.; Aitken, A.P.; Bishop, R.; Rueckert, D.; Wang, Z. Real-Time Single Image and Video Super-Resolution Using an Efficient Sub-Pixel Convolutional Neural Network. In Proceedings of the IEEE Conference on Computer Vision and Pattern Recognition (CVPR), Las Vegas, NV, USA, 27–30 June 2016; pp. 1874–1883. [Google Scholar]
  14. Sun, H.; Li, C.; Liu, B.; Zheng, H.; Feng, D.D.; Wang, S. AUNet: Attention-guided dense-upsampling networks for breast mass segmentation in whole mammograms. Phys. Med. Biol. 2020, 65, 055005. [Google Scholar] [CrossRef] [PubMed] [Green Version]
  15. Huang, G.; Liu, Z.; Maaten, L.V.D.; Weinberger, K.Q. Densely Connected Convolutional Networks. In Proceedings of the IEEE Conference on Computer Vision and Pattern Recognition (CVPR), Honolulu, HI, USA, 21–26 July 2017; pp. 2261–2269. [Google Scholar]
  16. He, K.; Zhang, X.; Ren, S.; Sun, J. Spatial Pyramid Pooling in Deep Convolutional Networks for Visual Recognition. IEEE Trans. Pattern Anal. Mach. Intell. 2015, 37, 1904–1916. [Google Scholar] [CrossRef] [PubMed] [Green Version]
  17. Zhao, H.; Shi, J.; Qi, X.; Wang, X.; Jia, J. Pyramid Scene Parsing Network. In Proceedings of the IEEE Conference on Computer Vision and Pattern Recognition (CVPR), Honolulu, HI, USA, 21–26 July 2017; pp. 6230–6239. [Google Scholar]
  18. Zhao, T.; Wu, X. Pyramid Feature Attention Network for Saliency Detection. In Proceedings of the IEEE/CVF Conference on Computer Vision and Pattern Recognition (CVPR), Long Beach, CA, USA, 15–20 June 2019; pp. 3080–3089. [Google Scholar]
  19. Hu, J.; Shen, L.; Sun, G. Squeeze-and-Excitation Networks. IEEE Trans. Pattern Anal. Mach. Intell. 2020, 42, 2011–2023. [Google Scholar] [CrossRef] [PubMed] [Green Version]
  20. Guo, X.; Yang, K.; Yang, W.; Wang, X.; Li, H. Group-Wise Correlation Stereo Network. In Proceedings of the IEEE/CVF Conference on Computer Vision and Pattern Recognition (CVPR), Long Beach, CA, USA, 15–20 June 2019; pp. 3268–3277. [Google Scholar]
  21. Mayer, N.; Ilg, E.; Häusser, P.; Fischer, P.; Cremers, D.; Dosovitskiy, A.; Brox, T. A Large Dataset to Train Convolutional Networks for Disparity, Optical Flow, and Scene Flow Estimation. In Proceedings of the IEEE Conference on Computer Vision and Pattern Recognition (CVPR), Las Vegas, NV, USA, 27–30 June 2016; pp. 4040–4048. [Google Scholar]
  22. Menze, M.; Geiger, A. Object scene flow for autonomous vehicles. In Proceedings of the IEEE Conference on Computer Vision and Pattern Recognition (CVPR), Boston, MA, USA, 7–12 June 2015; pp. 3061–3070. [Google Scholar]
  23. Geiger, A.; Lenz, P.; Urtasun, R. Are we ready for autonomous driving? The KITTI vision benchmark suite. In Proceedings of the IEEE Conference on Computer Vision and Pattern Recognition (CVPR), Providence, RI, USA, 16–21 June 2012; pp. 3354–3361. [Google Scholar]
  24. Kingma, D.; Ba, J. Adam: A Method for Stochastic Optimization. arXiv 2014, arXiv:1412.6980. [Google Scholar]
  25. Seki, A.; Pollefeys, M. SGM-Nets: Semi-Global Matching with Neural Networks. In Proceedings of the IEEE Conference on Computer Vision and Pattern Recognition (CVPR), Honolulu, HI, USA, 21–26 July 2017; pp. 6640–6649. [Google Scholar]
  26. Pang, J.; Sun, W.; Ren, J.S.; Yang, C.; Yan, Q. Cascade Residual Learning: A Two-Stage Convolutional Neural Network for Stereo Matching. In Proceedings of the IEEE International Conference on Computer Vision Workshops (ICCV Workshops), Venice, Italy, 22–29 October 2017; pp. 878–886. [Google Scholar]
  27. Jie, Z.; Wang, P.; Ling, Y.; Zhao, B.; Wei, Y.; Feng, J.; Liu, W. Left-Right Comparative Recurrent Model for Stereo Matching. In Proceedings of the IEEE Conference on Computer Vision and Pattern Recognition (CVPR), Salt Lake City, UT, USA, 18–23 June 2018; pp. 3838–3846. [Google Scholar]
  28. Yang, G.; Zhao, H.; Shi, J.; Deng, Z.; Jia, J. SegStereo: Exploiting Semantic Information for Disparity Estimation. In Proceedings of the European Conference on Computer Vision (ECCV), Munich, Germany, 8–14 September 2018; pp. 660–676. [Google Scholar]
  29. Tulyakov, S.; Ivanov, A.; Fleuret, F. Practical Deep Stereo (PDS): Toward applications-friendly deep stereo matching. arXiv 2018, arXiv:1806.01677. [Google Scholar]
  30. Zhang, F.; Wah, B.W. Fundamental Principles on Learning New Features for Effective Dense Matching. IEEE Trans. Image Process. 2018, 27, 822–836. [Google Scholar] [CrossRef] [PubMed]
Figure 1. An overview of multi-scale dense attention network (MDA-Net).
Electronics 09 01881 g001
Figure 2. The structure of the Siamese feature extraction.
Electronics 09 01881 g002
Figure 3. The architecture of dual-path upsampling block (DU block).
Electronics 09 01881 g003
Figure 4. The architecture of attention-guided context-aware pyramid feature extraction (ACPFE).
Electronics 09 01881 g004
Figure 5. The detailed structure of the 3D matching net.
Electronics 09 01881 g005
Figure 6. Depth visualization results on the test sets of different datasets. From top to down, left images, generated disparity maps, and error maps.
Electronics 09 01881 g006
Figure 7. Visualizations of the depth results of KITTI stereo 2015 test set. The first column shows the left images.
Electronics 09 01881 g007
Figure 8. Visualizations of the depth results of KITTI stereo 2012 test set. The first column shows the left images.
Electronics 09 01881 g008
Table 1. Evaluation of MDA-Net with different settings.
MethodsKITTI 2015
(>3 px)
Scene Flow
(EPE)
Dense Block1.99%0.7043 px
Dense Block + DU Block1.83%0.6905 px
Dense Block + DU Block + ACPFE Module1.75%0.6785 px
Table 2. Evaluation of MDA-Net with different settings.
MethodsParamsFLOPs
Dense Block4.36 M128.25 G
Dense Block + DU Block4.88 M130.37 G
Dense Block + DU Block + ACPFE Module5.13 M130.96 G
Table 3. The comparison results on KITTI 2015 test set.
Title 1All (%)Noc (%)
D1-BgD1-FgD1-AllD1-BgD1-FgD1-All
GC-Net [11]2.216.162.872.025.582.61
SGM-Net [25]2.668.643.662.237.443.09
CRL [26]2.483.592.672.323.122.45
LRCR [27]2.555.423.032.234.192.55
PSMNet [12]1.864.622.321.714.312.14
SegStereo [28]1.884.072.251.763.702.08
MDA-Net (ours)1.763.772.101.613.381.90
Table 4. The comparison results on KITTI 2012 test set.
Title 12 px3 px5 pxMean Error
NoxAllNocAllNocAllNocAll
GC-Net [11]2.713.461.772.301.121.460.60.7
PDSNet [29]3.824.651.922.531.121.510.91.0
MC-CNN [4]3.905.452.433.631.642.390.70.9
PSMNet [12]2.443.011.491.890.901.150.50.6
SegStereo [28]2.663.191.682.031.001.210.50.6
CNNF + SGM [30]3.785.532.283.481.462.210.70.9
MDA-Net (ours)2.272.831.401.780.831.080.50.5
Publisher’s Note: MDPI stays neutral with regard to jurisdictional claims in published maps and institutional affiliations.

