Article

The Experimental Modeling of Quad-Rotor Actuators with Undefined Hardware Errors for Safety-Flight

1
Department of Electrical, Electronics and Communication Engineering, Korea University of Technology and Education, Cheonan 31253, Chungnam, Korea
2
Department of Electromechanical Convergence Engineering, Korea University of Technology and Education, Cheonan 31253, Chungnam, Korea
*
Author to whom correspondence should be addressed.
Electronics 2020, 9(4), 579; https://doi.org/10.3390/electronics9040579
Submission received: 12 February 2020 / Revised: 22 March 2020 / Accepted: 26 March 2020 / Published: 29 March 2020
(This article belongs to the Section Systems & Control Engineering)

Abstract

:
The speed error of actuators during the flight of a quad-rotor is included in the attitude error, and this error is immediately corrected by the pilot’s observation. As the control authority of the quad-rotor changes to a computer system, the correction of the error is calculated and performed by the attitude sensor and the mathematical model of the quad-rotor. However, there is a response error to the control signal despite driving the same motor, which causes different results from the model prediction and affects the stability of the flight. Therefore, the response characteristics of hardware represented by the same mathematical model but having errors should be reflected in the modeling of the quad-rotor. In this paper, the response error of the actuators assembled with the same propellers and motors is verified through experiments. The actuators model that reflects this error is presented, and the thrust coefficient range by the propellers is also presented. Additionally, the speed error of actuators due to the voltage drop of the battery was verified through experiments, and a method for applying this error to the actuator model is presented.

1. Introduction

Multi-rotors, one class of unmanned aerial vehicles (UAV), have the advantage of being able to vertically land and take off in small spaces. Multi-rotor types of UAVs are used for applications such as disaster searches, aerial applications, and aerial photography for broadcasting or mapping. With the expansion of the private UAV market, it is expected that the importance of research on UAV control and the development of various related technologies will be increased [1]. Embedded systems for controlling UAVs are developed and supplied in general-purpose form. Advances in embedded systems have provided an environment in which UAVs can be operated with simple operation, allowing the general public to utilize the quad-rotor through simple training. In particular, for the quad-rotor type of UAV the pilot is able to efficiently operate it because the body is light and maneuverable.
The main research trends regarding the quad-rotor system are its hardware control and autonomous flight path tracking. In these cases, the dynamics of the quad-rotor is critically important. The quad-rotor system’s dynamic equation is defined by Euler–Lagrangian or Newton–Euler equations after “+” or ”x” direction alignment of actuator parts. Al-Saedi et al. modeled the quad-rotor using a “+” configuration and used the dynamics ruled by Newtonian equations [2]. Bouabdallah et al. assembled their own platform for testing their algorithms, which is known as non-linearity cancellation technique. Their platform is also a “+” configuration and they use the dynamics defined by Euler–Lagrangian [3]. Elruby et al. used software for estimating the moment of inertia. Their quad-rotor system is also a “+” configuration and uses the dynamic defined by Newton–Euler [4]. The research results of flight path tracking have achieved effective results in the two-dimensional plane by using the dynamics described above, but the results of altitude tracking were not satisfying. The main reason for these results is that the motor speed response characteristics and thrust coefficient errors are not considered in the defined dynamics. The quad-rotor system’s dynamic equation is also defined and used in the research of the minimum path flight using the TSP algorithm and the research aiming to solve the minimum energy problem during autonomous flight. Dorling, K. et al. used a traveling salesperson problem with a drone (TSP-D) to reduce energy consumption. They created a delivery network and evaluated the relationship between battery weight and flight time with a budget [5]. Gandolfo, Daniel C., et al. suggested a path-following controller, in which the quad-rotor speed is a dynamic profile that varies with the geometric requirements of the desired path. They evaluated the relationship between quad-rotor speed and energy consumption, and showed that the oscillation of the z-axis direction occurred as the battery was consumed [6]. However, there is a limitation: that the battery is limited to flying time without considering the effect of battery voltage drop on motor rotational speed. Allouch et al. provided another perspective regarding the battery in the quad-rotor. They performed stability assessments through qualitative and quantitative methods and showed that the drop due to battery discharge was the cause of the high ranking [7]. It shows that the voltage drop of the battery on the quad-rotor flight should be taken into account. Because of the risk of a fast rotating actuator, the control of the quad-rotor is started with a simulation. The approach to controlling the motion of quad-rotor was developed using a variety of techniques, such as fuzzy logic [8], sliding-mode control [9], adaptive control [10], and robust control [11], among others. These control mechanisms assume the availability of a reliable mathematical model of the quad-rotor. However, the actual quad-rotors have the error compared with the mathematical model, which undermines the completeness of the control mechanism. Thus, a near-realistic quad-rotor model is required.
The quad-rotor consists of four motors with propellers, sensors for the attitude control, a controller for flight commands, a battery to drive the electronic devices, and a body for assembling whole parts. The thrust generated by the four motors and the propellers is related to the altitude change and the flight speed of the quad-rotor. Additinoally, the direction of flight is determined by tilting the quad-rotor at different motor speeds. The quad-rotor is assembled with the same model of motor and propeller, but the same control signal can not guarantee the same speed due to the motor speed response characteristics and thrust coefficient error by flapping. Additionally, the voltage drop of the battery occurs as the flight time of the quad-rotor becomes longer, and it affects the rotational speed of the motor. Therefore, quad-rotor modeling should include the motor speed response characteristics and thrust coefficient errors of the propeller for flight stability, and safety functions, such as regression at low voltage or emergency landing.
In this paper, we propose the variant thrust coefficient for the motor modelling of the quad-rotor. The motors’ performances were different despite assembling the vehicles with the same motors and propellers, so we tried to experimentally verify to the motor performance error and thrust coefficient errors of the propeller. We conducted experiments to measure the thrust and torque during flight and reflected the measured motor performance error and thrust coefficient to the quad-rotor system. Additionally, we developed an algorithm to apply the effect of battery voltage drop to the propeller dynamics and analyzed the considerations for the future control system. Section 2 presents the experimental setup and methods. Section 3 deals with experiments to verify hardware error. Section 4 deals with the analysis results of the experiment. Finally, Section 5 summarizes conclusions and presents suggestions for future research.

2. Testbed for Motor Model Configuration Reflecting Motor Performance Error

A quad-rotor is an aircraft that flies under control of thrust generated by propellers and motors. The speed control of the motor in the quad-rotor is open-loop control, and the speed error is included in the attitude error. If the pilot controls the quad-rotor, this attitude error is immediately corrected by the pilot’s observations, but if a controller controls the quad-rotor, it is calculated and controlled from the attitude sensor and the quad-rotor model. Thus, the quad-rotor control using a controller requires modeling of the quad-rotor, and if the same kind of hardware is modeled, the generated model is the same. However, even electronics of the same model may have performance errors, and the results expected by the model may differ from the actual results. Therefore, it is necessary to include errors caused by hardware when modeling the quad-rotor.
There are three kinds of errors caused by hardware during the quad-rotor modeling. The first is the speed error caused by the component problem that makes up the motor. The quad-rotor consists of the same four motors, but errors exist because each motor does not have the same speed response characteristics due to manufacturing errors, and the pilot corrects these errors during the flight. However, errors due to differences in motor performance should be reflected in the motor model of the quad-rotor, as the controller corrects flight stability during path tracking or autonomous flight. The second is the thrust error caused by the propeller. The propeller is mounted on the motor and rotates, producing thrust, and the thrust produced by the same motor rotational speed shall be the same. However, the thrust error is caused by the flapping, which vibrates up and down due to the imbalance of speed between advancing and retreating blades when the propeller rotates at high speed. This error causes thrust error, and thrust error by the propeller should be reflected in the motor model of quad-rotor. The third is a speed error caused by a voltage drop in the battery when the same control signal is applied. The speed control of the BLDC (brushless direct current) motor used to configure the quad-rotor connects to the ESC (electronic speed controller) and uses PWM (pulse width modulation) as the control signal, and applies the same signal to all motors for rotating at the same speed. However, if the flight time of quad-rotor increases, the battery voltage drop occurs, and the rotational speed of the motor is reduced compared to when it is operated with a fully charged battery at the same control signal. The effects of the battery voltage drop should also be included in the motor model, as control signals must also be applied differently to keep the rotational speed. This chapter describes the design of experimental devices and their methods to measure the motor performance error and thrust error and to measure the effect of a battery voltage drop on the motor’s rotational speed.

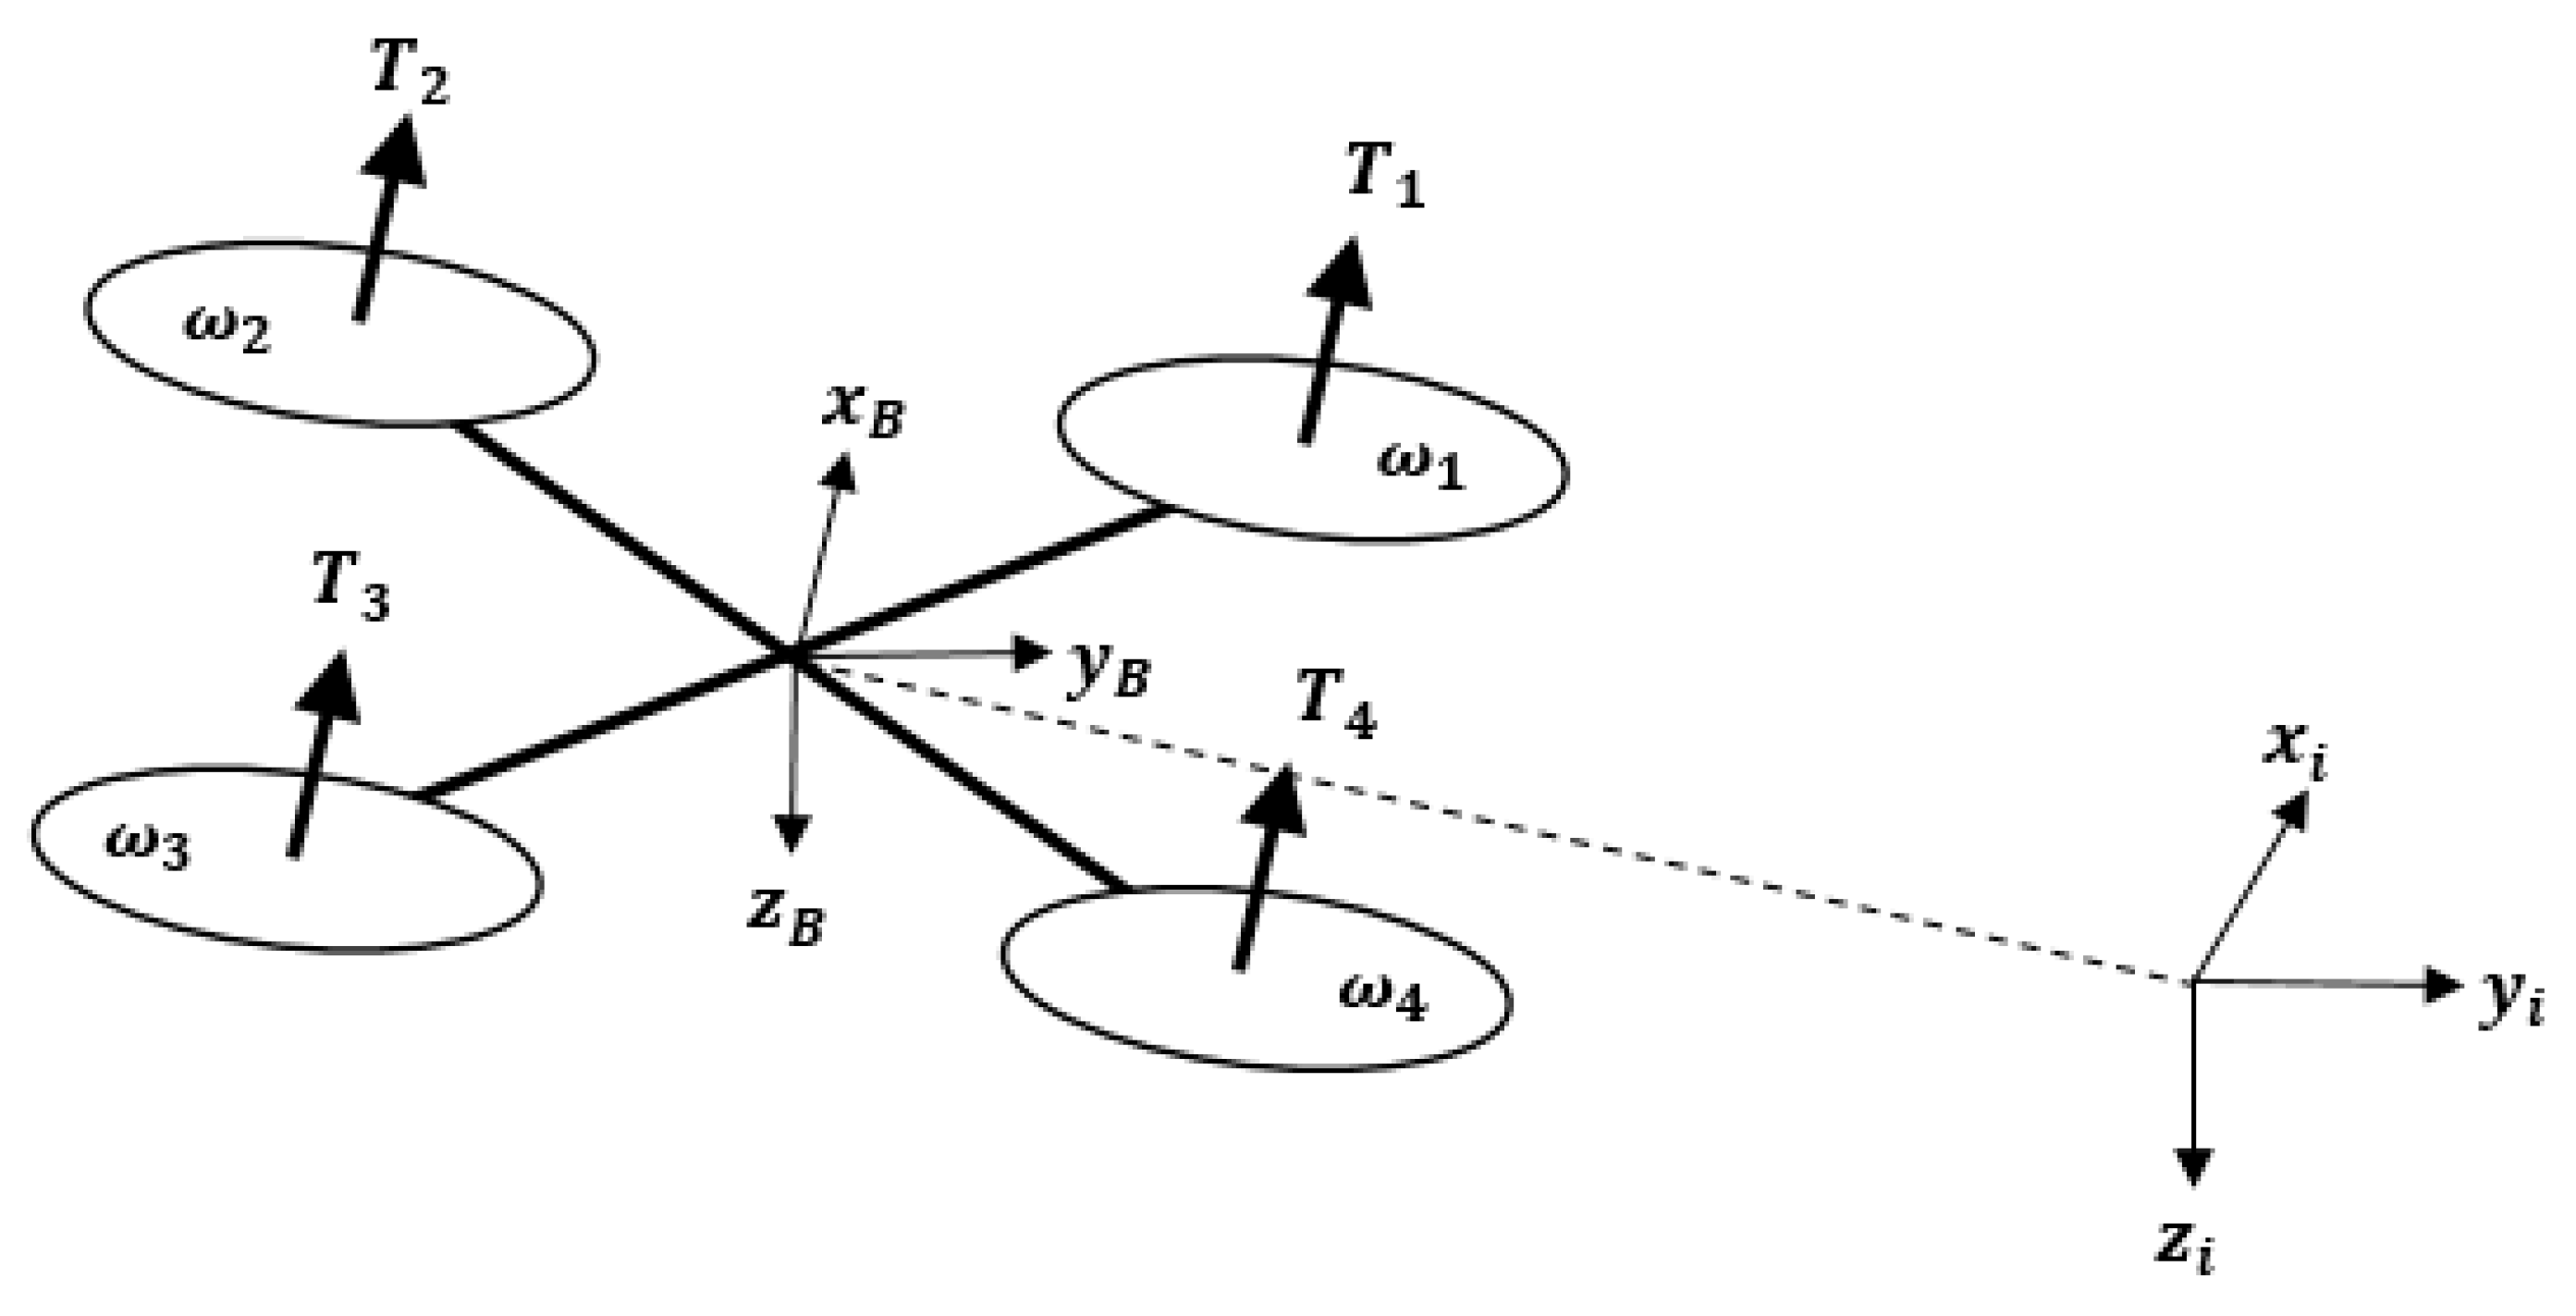
2.1. The Unstable Factor of Flight

In Figure 1, the quad-rotor is driven according to the alignment direction of the propeller, can turn in three directions, and has a total of four inputs. Since it is possible to move and rotate on three axes of x, y, and z in three-dimensional space, the quad-rotor has six degrees of freedom, but the control input is four degrees of freedom. The quad-rotor has under-actuation characteristics with less control input freedom compared to system freedom. The translation equations of motion for the quad-rotor are based on Newton’s second law, and they are derived in the inertial frame [12].
m r ¨ = [ 0 0 m g ] + R T B
In Equation (1), the center of mass of the quad-rotor r = [ x   y   z ] T describes the absolute coordinate expressed as the distance from the inertial frame to the body frame, m describes the weight of the quad-rotor, and g describes the gravitational acceleration. The rotation R from the body frame to the inertial frame describes the orientation of the quad-rotor. T B describes the thrust generated by the body frame and is the sum of the thrust produced by each of the motors and propellers on the quad-rotor. Equation (2) describes thrust T i produced by the i th motor and propeller.
T i = 1 2 C T ρ A r r 2 ω i 2
In Equation (2) ρ , A r , and r represent air density, area by the rotation of the propeller, and radius of the propeller, respectively. C T describes an aerodynamic coefficient, and ω i describes the speed of the i th motor. The thrust T i is shown to vary with propeller speed and air density, and the quad-rotor has a maximum altitude limit so that air density can be considered as a constant. Thus, Equation (2) can be simplified as follows.
T i = k f ω i 2
In Equation (3), k f is the thrust coefficient, including C T , A r , ρ ,   and r . When the quad-rotor is horizontal, the force against gravity in the quad-rotor is the only thrust resulting from the rotation of the propeller, and this value is proportional to the square of the angular velocity of the propeller following Equation (3). The force generated on the x i and y i is 0, and the z i is expressed in Equation (4) by sum all of the thrust produced by the four motors and propellers.
T B = [ 0 0 k f ( ω 1 2 + ω 2 2 + ω 3 2 + ω 4 2 ) ]
In Equation (4), the z-axis of the quad-rotor is set in the same direction as the gravitational direction, and thrust is the negative sign because it is set in the opposite direction of gravity. The quad-rotor is controlled by four control input U = [ U 1 U 2 U 3 U 4 ] , as shown in Equation (5), which is valid for an “x” configuration [13].
[ U 1 = T B U 2 = τ θ U 3 = τ ϕ U 4 = τ ψ ] = [ k f 2 2 d k f 2 2 d k f k m k f 2 2 d k f 2 2 d k f k m k f 2 2 d k f 2 2 d k f k m k f 2 2 d k f 2 2 d k f k m ] [ ω 1 2 ω 2 2 ω 3 2 ω 4 2 ]
In Equation (5), the thrust T B is responsible for the altitude and the rate of altitude change of the quad-rotor. The equation of the total moment acting on the quad-rotor is as shown in Equation (6) by Equations (4) and (5).
T B = [ 0 0 U 1 ]
If Equation (1) is solved using Equation (6), rotation matrix and acceleration can be obtained in each axis as follows [14].
x ¨ = U 1 m ( s i n ϕ s i n ψ + c o s ϕ c o s ψ s i n θ )
y ¨ = U 1 m ( c o s ϕ s i n ψ s i n θ c o s ψ s i n ϕ )
z ¨ = g U 1 m ( c o s ϕ c o s θ )
The position of the quad-rotor is determined from the thrust T B and attitude of the quad-rotor from Equations (7), (8), and (9). In this case, thrust T B is determined by the thrust coefficient and the angular velocity of the propeller from Equations (3) and (4). The following section discusses the construction of an experimental device. Determine the motor speed response characteristics by measuring the propeller angular speed w i ( i = 1 , 2 , 3 , 4 ) , and determine the range of thrust coefficient k f by measuring the thrust.

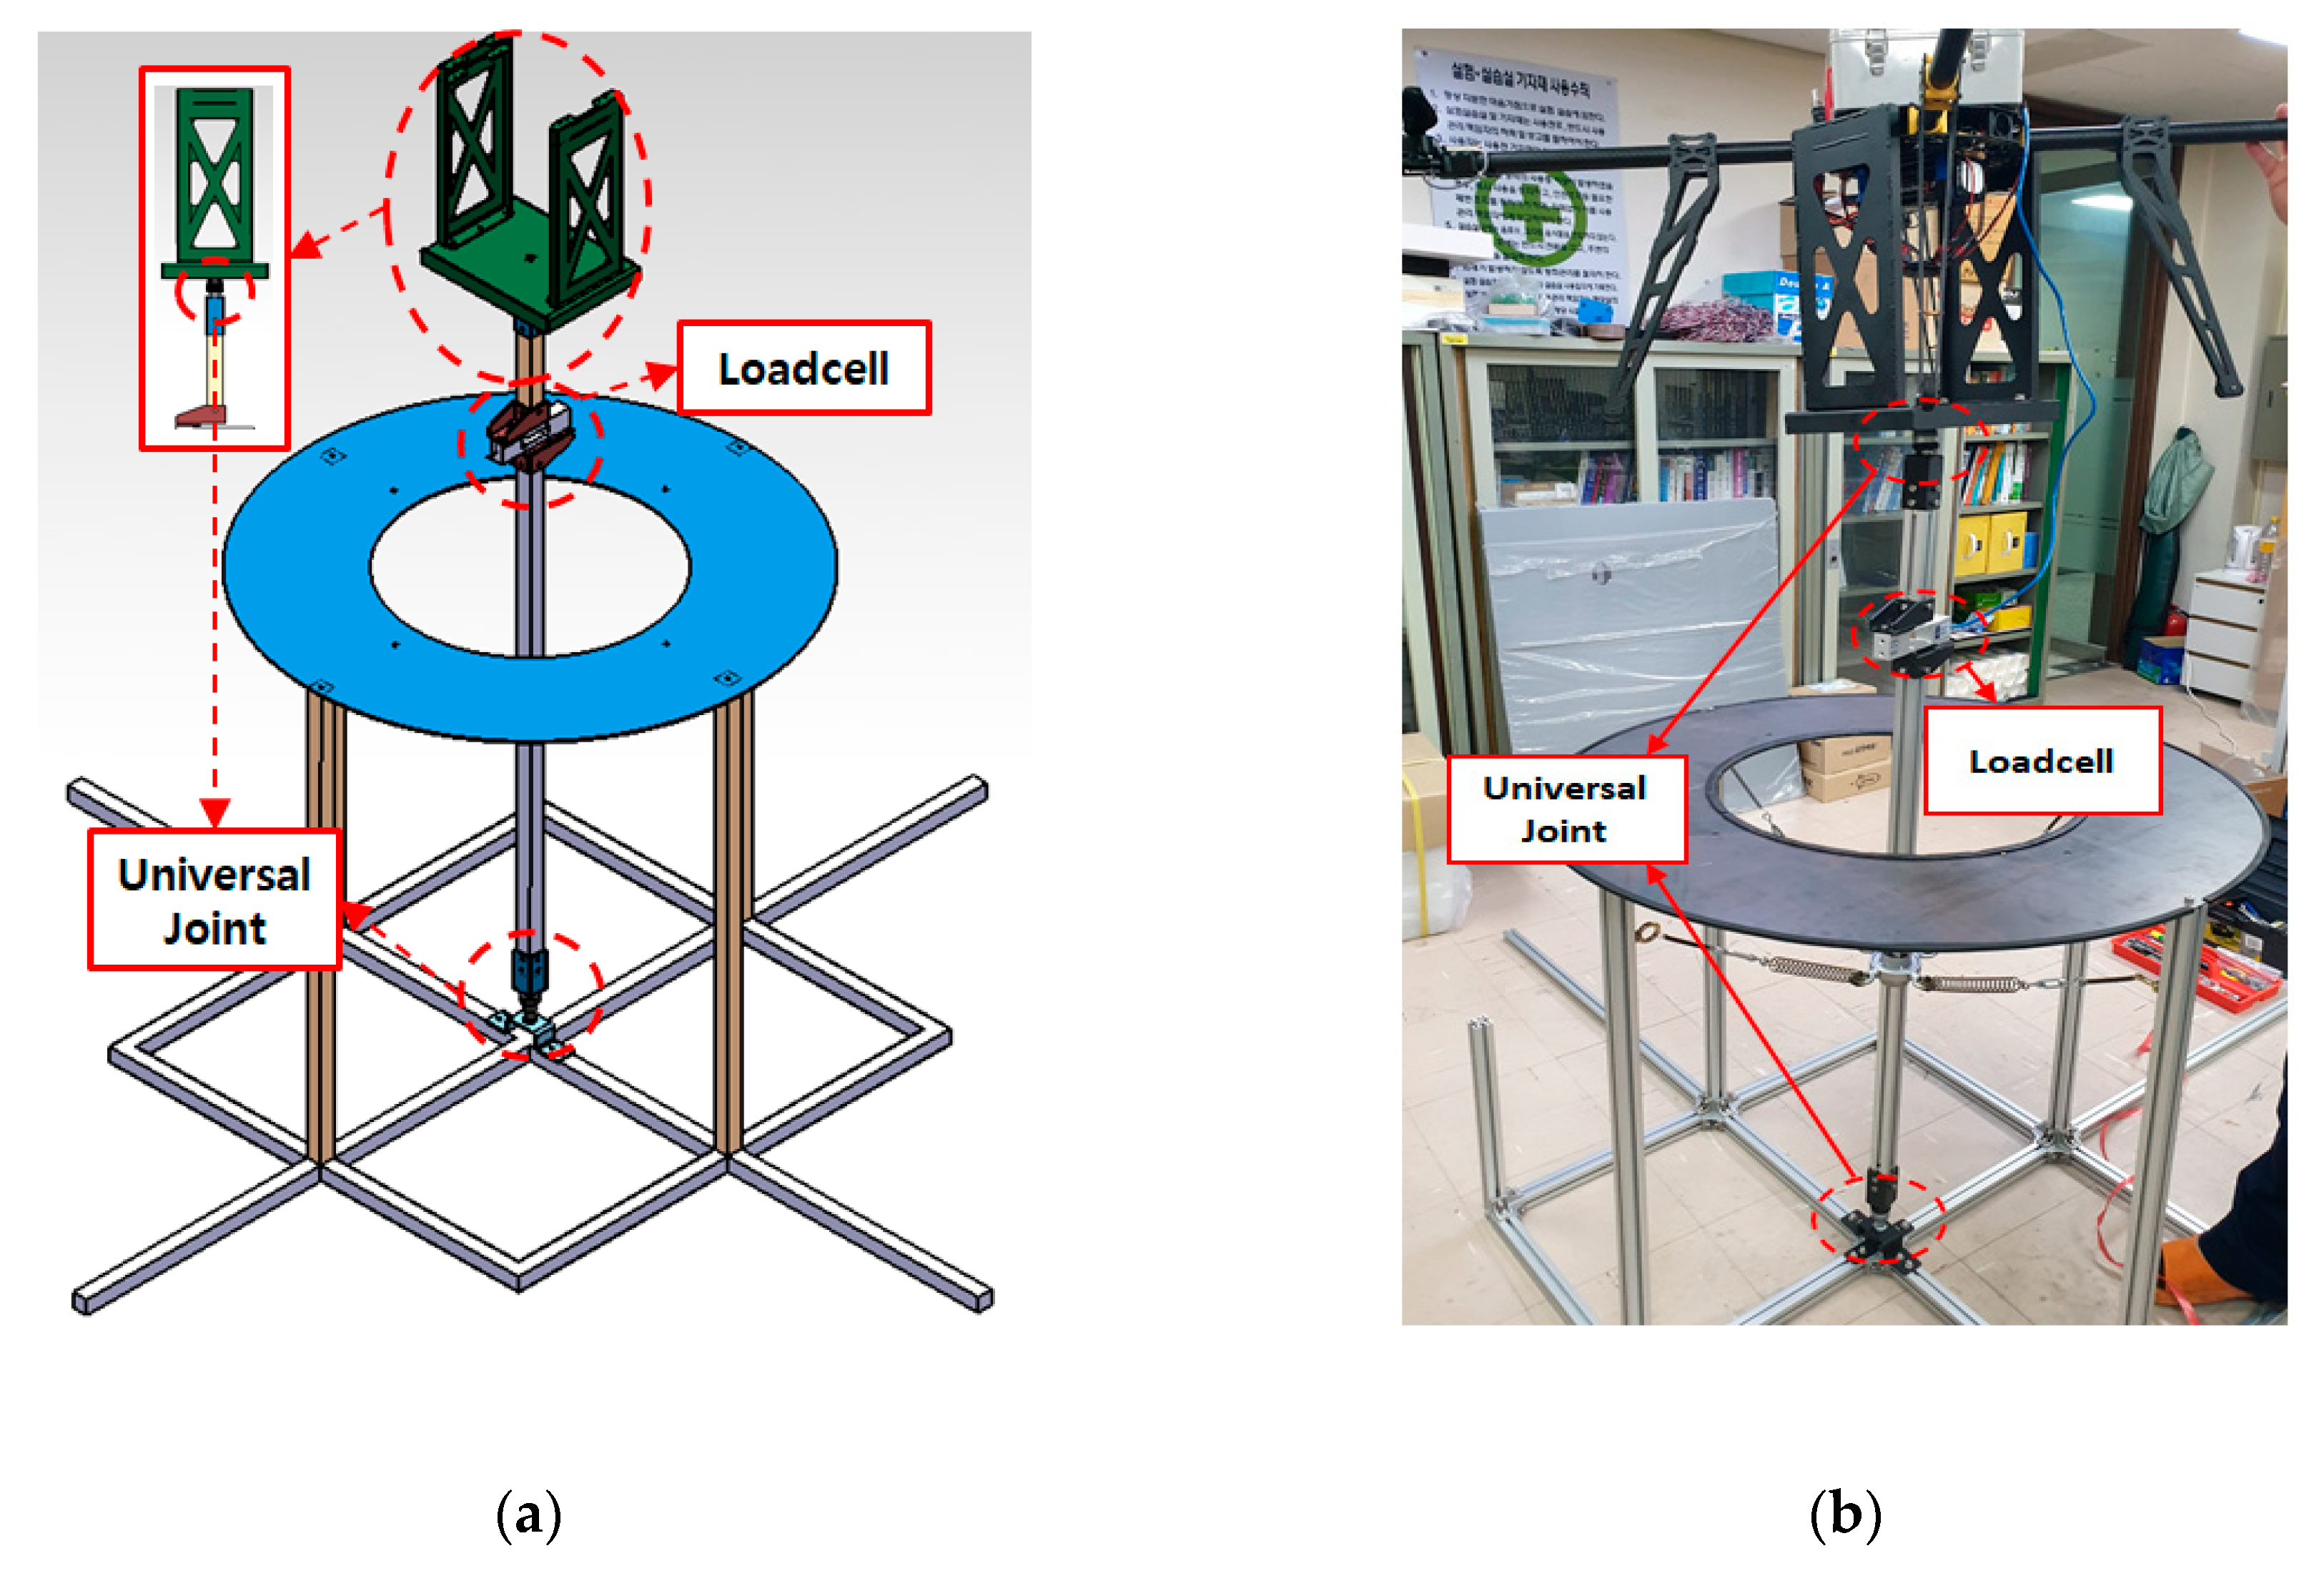
2.2. Configuring Testbed

In this paper, a testbed was constructed for data acquisition by a precisely controlled control signal. Table 1 shows the specifications of the parts for the quad-rotor, and Figure 2 shows the configuration and data acquisition block diagram of the quad-rotor for experiments.
In Figure 2, hardware for data acquisition of quad-rotor consists of the controller for motor rotation command, the load cell for thrust measurement, the IMU (Inertial Measurement Unit) for attitude measurement, and the infrared sensor for motor rotation speed measurement. All the measured data are sent to the PC using Bluetooth.
The BLDC motor used in the quad-rotor is connected to the ESC and is controlled by the PWM signal. When the pilot controls the quad-rotor, the control signal is the PWM generated by the RF controller, and the range of the signal is 1.1 ms (bottom)–1.52 ms (center)–1.94 ms (top) (tested with Futaba T10J). The signal for motor rotation to operate the quad-rotor with the controller is programmed to be output in 10 us units within the same range as the control signal generated from the RF controller. Figure 3 shows the motor control signal output from the controller in the quad-rotor.
Normally, the ESC connected to the BLDC motor is manually initialized using an RF controller to recognize the control range. In this paper, the ESCs’ control range initializations of four motors are simultaneously performed using the hardware configuration shown in Figure 2 and the range of control signal shown in Figure 3.
The rotational speed of the motor is calculated by the ratio of the motor circumference and the reflector length after measuring the signal generated by the reflector using the infrared sensor. Figure 4 shows the reflector length, motor diameter, and the distance between the infrared sensor and reflector.
In Figure 4, the length of the reflector is 10 mm, the diameter of the BLDC motor used is 46 mm, and the distance between the reflector and the infrared sensor is 2 mm. The signal is measured by the infrared sensor only when the reflector passes the infrared sensor during one revolution of the motor, and the rotational speed of the motor was calculated in RPM as shown in Equation (10).
RPM = 60 s t × 24.92 ° 360 °
The speed measurement performance using the infrared sensor is verified by comparing the signals measured by the oscilloscope and the controller when the four motors rotate at an arbitrary speed. Figure 5 shows the measured infrared signal using the oscilloscope, and Figure 6 shows the measured infrared signal using the controller.
In Figure 5, the infrared sensor signals are measured by the oscilloscope to (M1 = 1715 us), (M2 = 1780us), (M3 = 720 us), and (M4 = 732 us). In Figure 6, the infrared sensor signals are measured by the controller to (M1 = 1712.52 us), (M2 = 1788.12 us), (M3 = 720.52 us), and (M4 = 736.29 us). The errors between the measured signals by the controller and the oscilloscope are (M1 = 2.48 us), (M2 = 8.12 us), (M3 = 0.52 us), and (M4 = 4.29 us), and the maximum error occurs in M2. The error resulting from the oscilloscope’s time/div resolutions is also included in the infrared sensor signal measurement, so the rotational speed measured in that system can be considered almost correct.
The thrust of the quad-rotor is measured using the loadcell, and the output of the loadcell is really small at 2 mV / V, so the data are output in 0.01 g units using the HX711 that is the ADC for weigh scale application. The thrust of the quad-rotor is measured by configuring the experimental device as shown in Figure 7.
In Figure 7, the degrees of freedom of roll, pitch, and yaw were established by a universal joint at the center axis of the bottom of the testbed. The upper and lower link were combined into a loadcell to measure the vertically-generated thrust of the quad-rotor, and sensor data and rotational speed were transmitted to PC via Bluetooth.

3. Experiments on Hardware Affecting Motor Performance

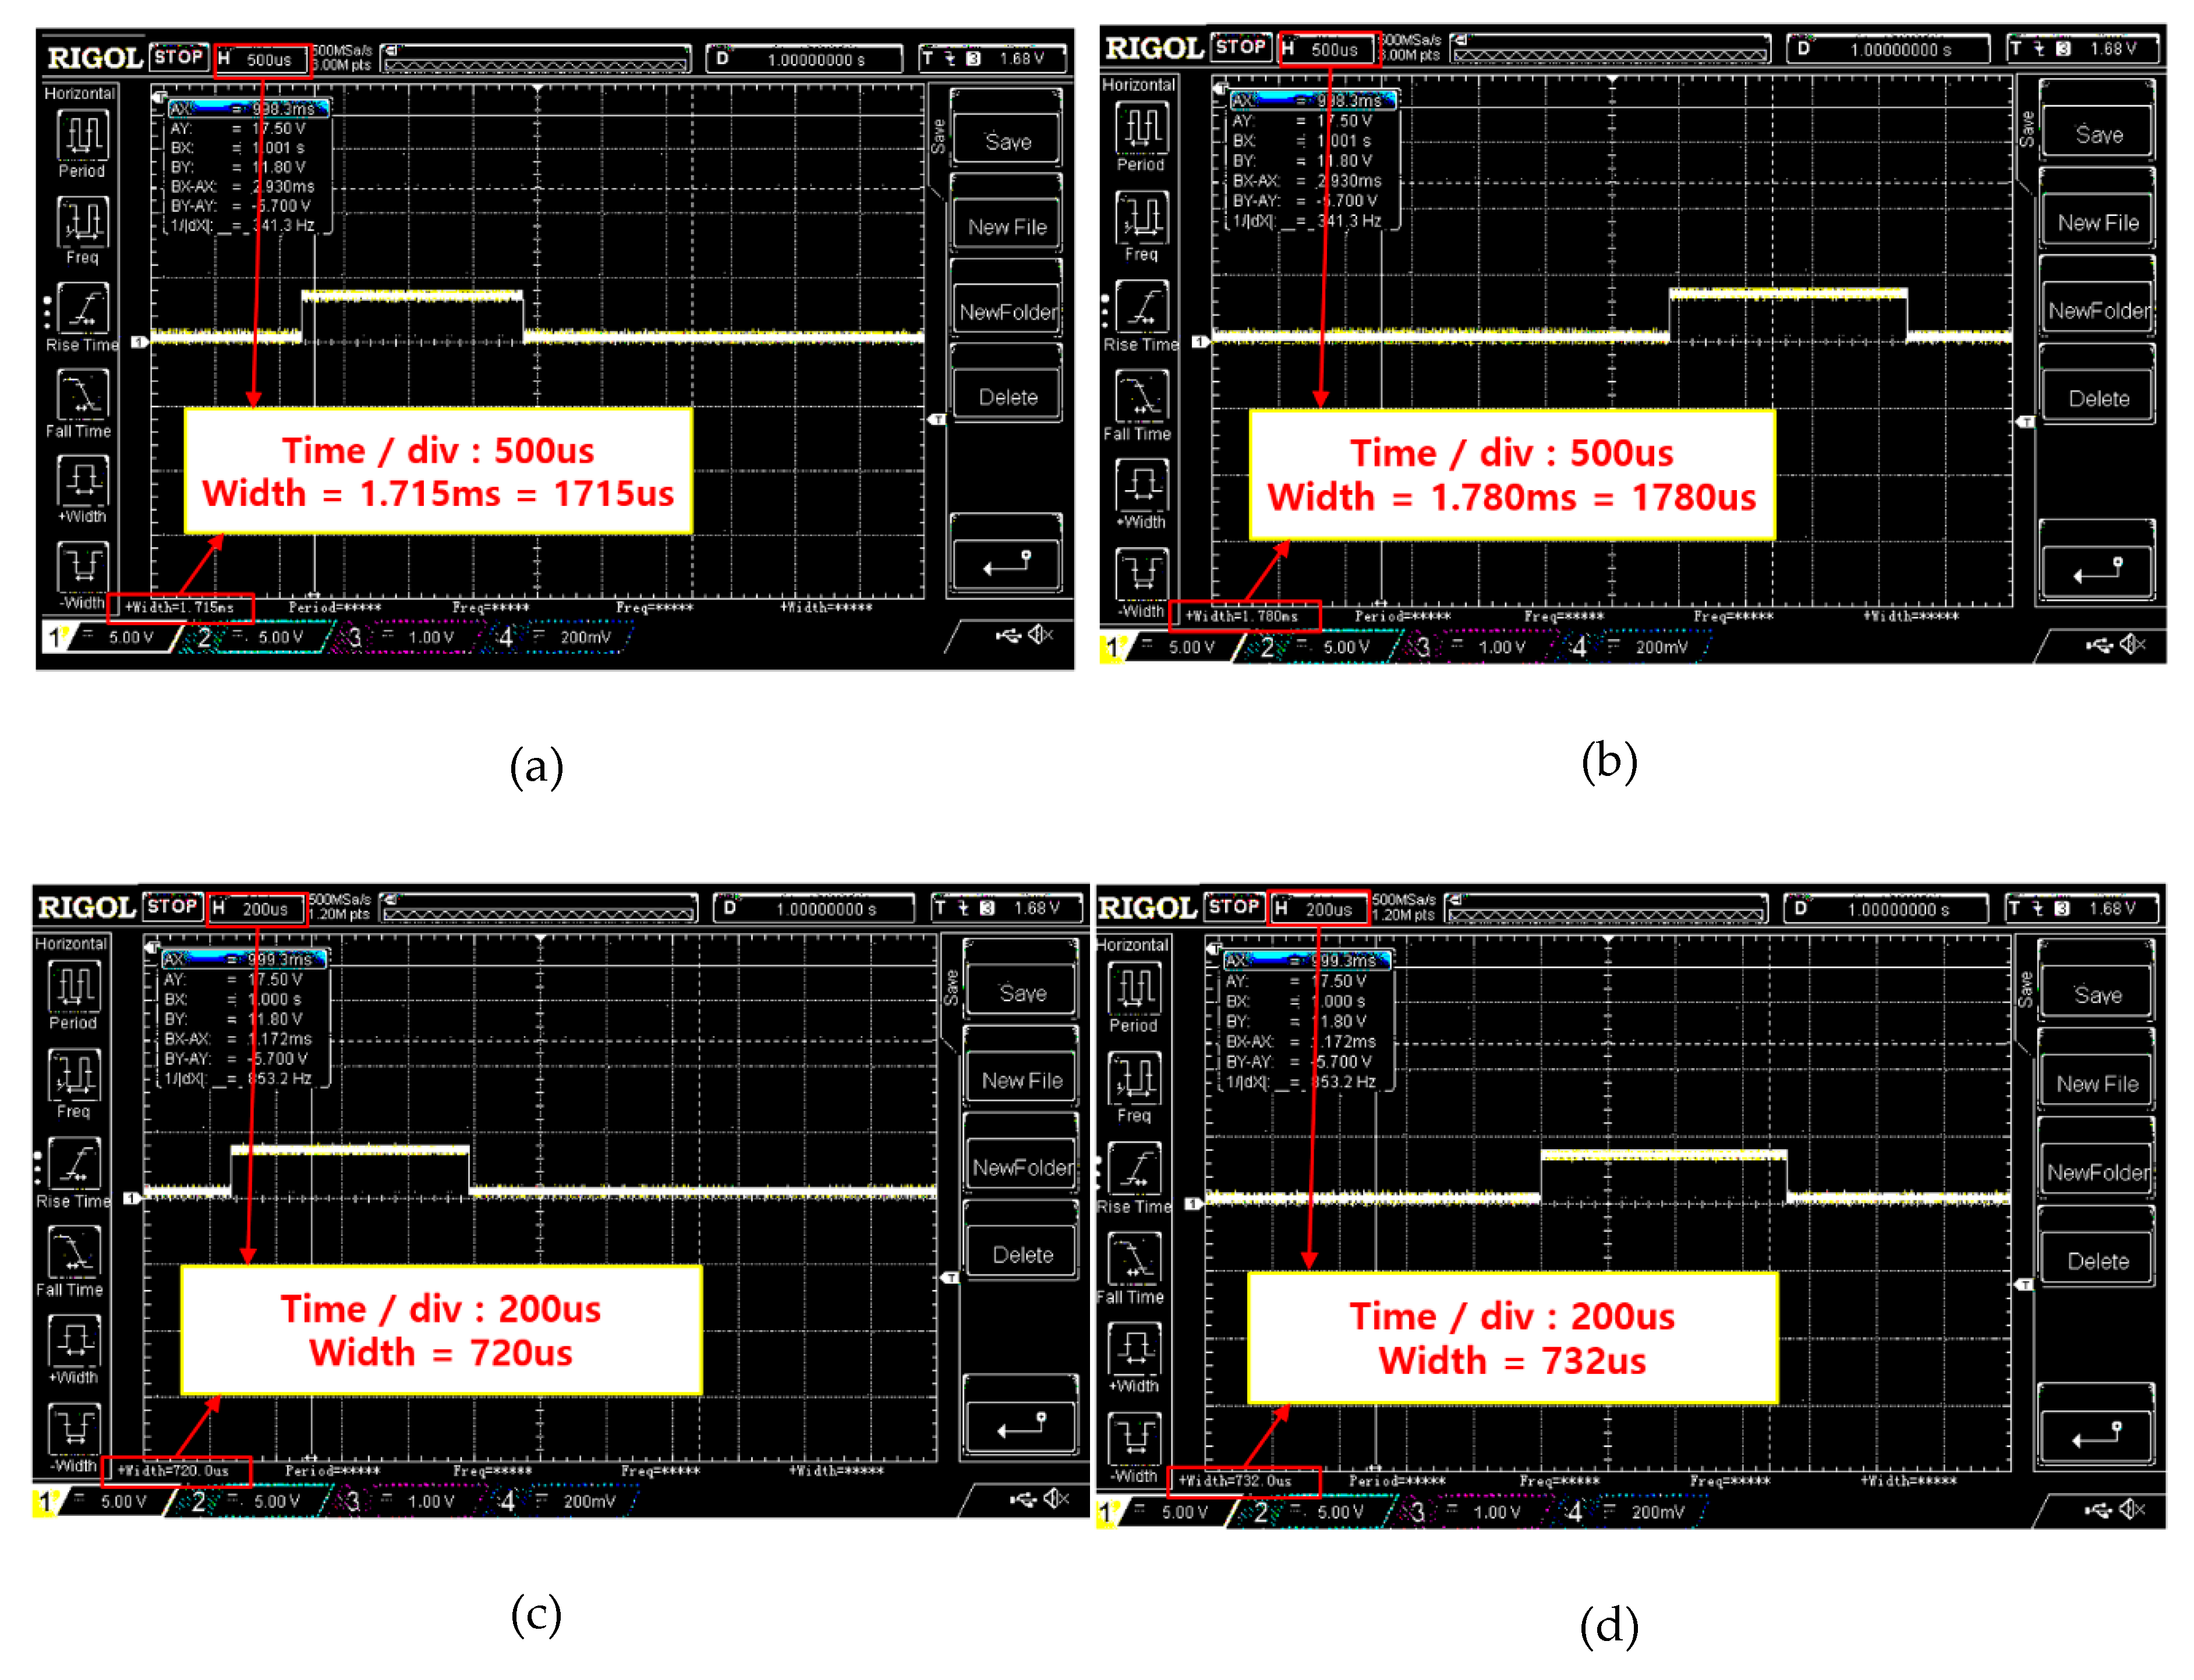
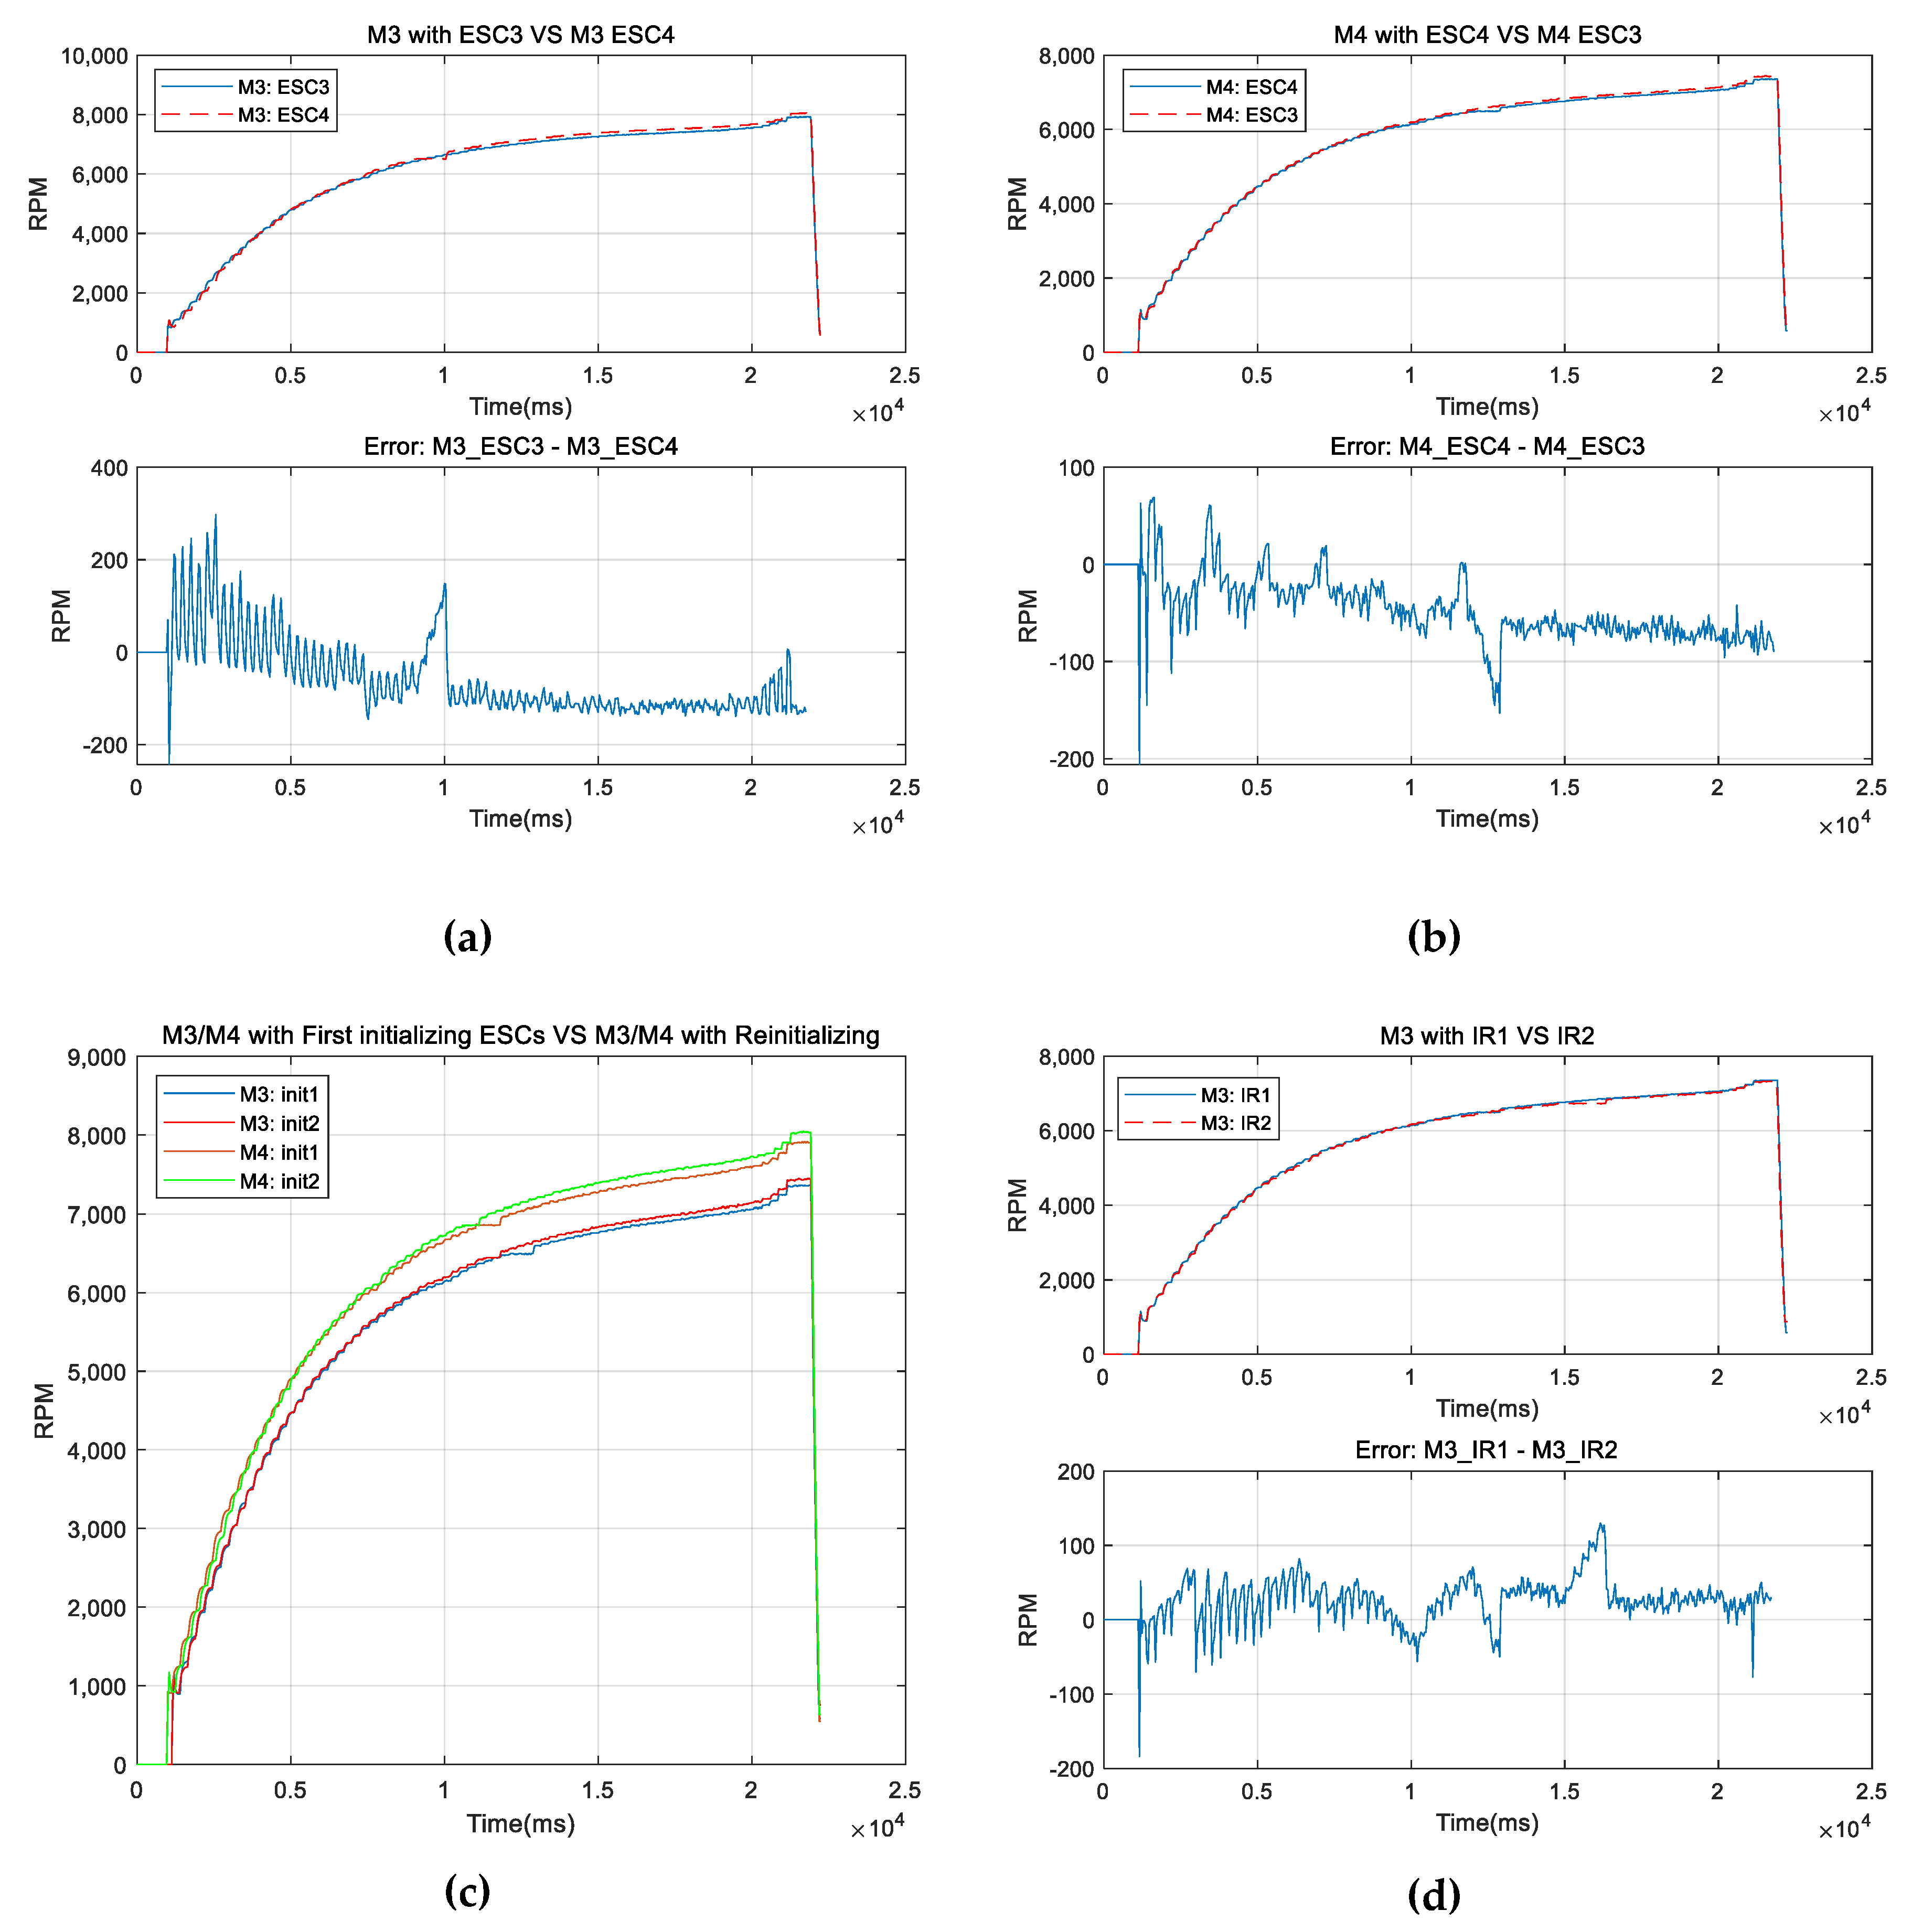
3.1. Experiments for the Performance of the Actuator Assembled with Motor and Propeller

The BLDC motor used in the quad-rotor has a performance of 320 kV, and three experiments are conducted to evaluate the performance of the motor itself controlled by the ESC. In all experiments, the change in motor-driven signals was carried out as follows.
Supply voltage: 25.2 V
Start
Step 1. Ready to ESC with 1.1 ms control signal for M1 to M4
Step 2. Change control signals from 1.1 ms to 1.94 ms
     if control signal time is less than 1.94 ms
          2.1 increase control signal: 10 us
          2.2 keep the control signal during 270 ms
          2.3 acquire data at 40ms intervals
     else
       2.4 Set control signal to 1.1 ms
       2.5 go to End
End
For the observation of significant motor speed changes with the change in motor-driven signals, the unit of change in motor-driven signals was determined to be 10 us. The holding time was determined at 270 ms as the minimum time for minimizing the effect of the battery voltage drop during the experiment and stabilizing changes in speed.
Experiment A was carried out by simultaneously driving all the motors in the quad-rotor with the motor-driven signal change procedure to measure motor performance error. Figure 8 shows the results of Experiment A.
During the experiment, data were received at 40 ms intervals; the horizontal axis is the experiment’s time, and the vertical axis is RPM. Figure 8 shows that there is a performance error despite using the same model of motor and ESC. M1 and M3 started the first rotation at 1.15 ms, and M2 and M4 started at 1.16ms. The highest performing motor is M4, and the lowest performing motor is M3. The error between the two motors is up to 682 rpm for the same control signal.
Experiment B was performed to verify that the motor performance error measured in Experiment A was affected by the number of motors simultaneously driven. Experiment B was repeated four times by driving only one motor at a time from M1 to M4 according to the motor driven-signal change procedure. Figure 9 shows the RPM of each motor measured in Experiments A and B.
Figure 9 shows the performance comparison results from the different numbers of motors driven. Each motor shows almost the same performance with the maximum error (M1: 2.01%), (M2: 2.93%), (M3: 1.91%), (M4: 2.14%) in all sections. As a result, it was confirmed that the performance was minorly affected when several motors were driven at the same time.
Experiment C was performed to verify the cause of the performance error between the motors shown in Figure 8. Experiment C (a) was performed to determine the effect of ESC on motor performance errors. The ESC of the highest performance (M4) and the lowest performance (M3), with the most significant performance differences, were switched, and the experiment was carried out following the motor-driven signal change procedure. Experiment C (b) was performed to determine the effect of ESC initialization errors on motor performance errors. The ESC’s signal recognition range was reinitialized using the same signal range, and the experiment was carried out following the motor-driven signal change procedure. Experiment C (c) was performed to verify the effect of the infrared sensor on motor performance error to measure motor rotational speed. The infrared measurement systems of M3 and M4 were switched, and the experiment was carried out following the motor-driven signal change procedure. Figure 10 shows the results.
Figure 10a shows the rotational speed of M3 measured in Experiments A and C (a), and Figure 10b shows the rotational speed of M4 measured in Experiments A and C (a), respectively. The maximum errors (M3: 3.35%) and (M4: 3.77%) of each motor in Figure 10a,b are similar to the experiment shown in Figure 8, and as a result, the ESC is not the cause of the motor’s performance error. Figure 10c shows maximum errors (M3: 3.86%) and (M4: 3.54%) and still shows that the performance of the M4 is significantly better than that of the M3. The initialization of ESCs did not affect motor performance errors. Figure 10d shows the rotational speed of M3 measured in Experiment A, and the rotational speed of M3 measured in Experiment C (c), respectively. The results of Experiment C (c) also show similar results in Figure 8 and indicate that the performance error was not caused by a measurement error. The results of Experiment C in Figure 10 show that the performance error between motors occurs in motors, although it is the same model motor.
Based on the results of the previous experiments, Experiment D was performed to determine the effect of motor performance error on the thrust of the quad-rotor. Thrust was measured by carrying out the experiment following the motor-driven signal change procedure.
In Figure 11, the positive region of the y-axis is RPM, and the negative region is the thrust expressed in g. Except for the data of 1.1–1.15 ms, the period wherein the motor does not rotate by the control signal, the RPM of each motor is defined as shown in Equation (11) using the result of Figure 11. Mathematical approximation models for Equation (11) are determined using polynomial trend lines by software (Grapher 14).
R P M M n = A x 5 + B x 4 + C x 3 + D x 2 + E x + F
In Equation (11), the output is RPM, and the input is the duty ratio of the control signal. In Table 2, A, B, C, D, E, and F are the coefficients for each RPM equation of each motor; R-value means correlation coefficient, R2 value means coefficient of determination, and P-value means probability value. The R values of all motor equations, which are close to 1 are very similar to the measured signal graph, the R 2 also shows results close to 1 for all four motor expressions, indicating that almost all measured values through experiments are on the regression line.

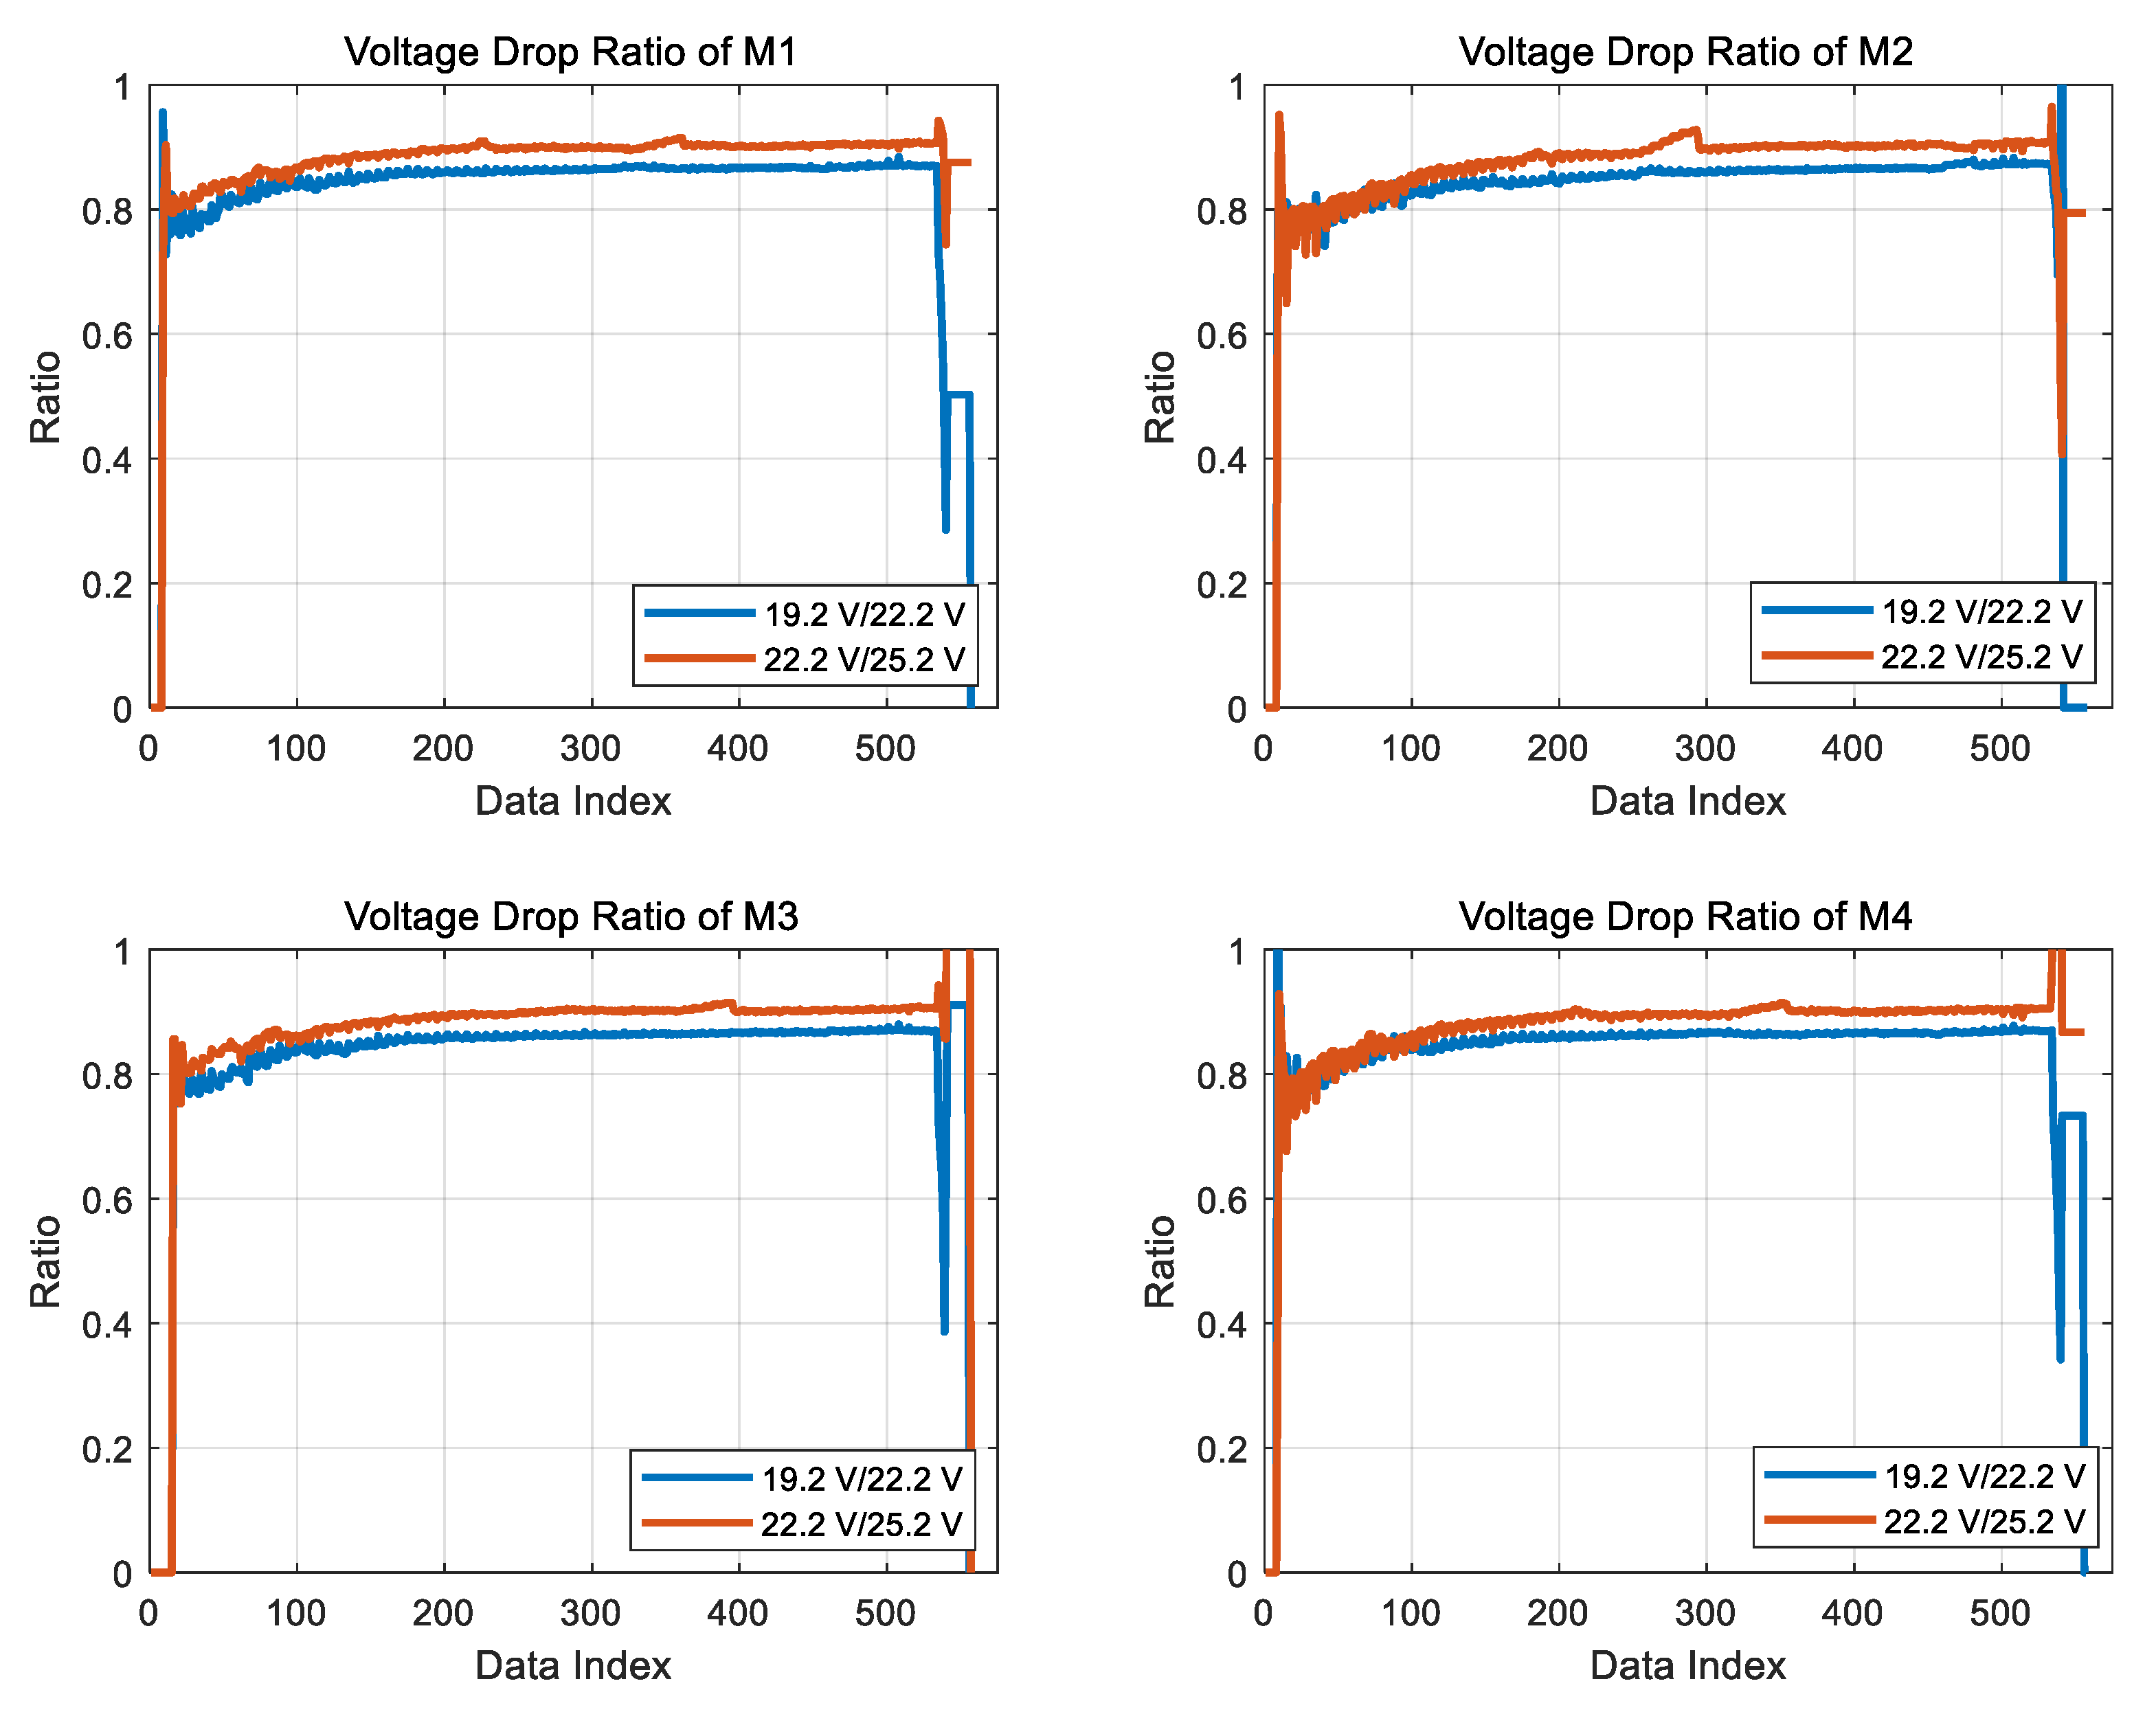
3.2. Experiments for the Performances of Motors while Changing Battery Voltage

The energy source of the quad-rotor is the battery, and the number of battery cells depends on the motors used. In this experiment, the Li-Po (lithium polymer) battery, which has six cells with 5000 mAh and 30 C discharging capability, is used to operate the 320 kV BLDC motor. Typically, the standard voltage per cell of Li-Po is 3.7 V, 4.2 V per cell when fully filled, and the over-discharge termination voltage when discharged is 2.7 V or lower per cell. Experiment E is performed to verify the effect of a battery voltage drop on the performance of the motor. Figure 12 shows the rotational speed of each motor as the battery voltage conditions change in Experiment E.
Figure 12 shows that the performance of the motor varies depending on the battery voltage. Additionally, the gap between motor performance differences depending on battery voltage is observed in similar shape for all four motors. The maximum RPM values are shown in Table 3.
Table 3 shows that M2 and M4 motors still perform better than M1 and M3, even when the battery voltage drops. It also shows that under all battery voltage conditions, the ranking of the motor’s maximum rotational speed is (M2 > M4 > M1 > M3). The correlations between RPMs by changing voltage are shown in Figure 13 by the ratio of (Mx rpm at 25.2 V) to (Mx rpm at 22.2 V) and the ratio of (Mx rpm at 22.2 V) to (Mx rpm at 19.2 V).
In Figure 13, the reduction rate of motor speed due to voltage drop is calculated except before the motor is stabilized and after the motor is stopped. The mean of Mx RPM (22.2 V)/Mx RPM (25.2 V) for each motor is about 0.889, and the mean of Mx RPM (19.2 V)/Mx RPM (22.2 V) is about 0.87. This result shows that the reduction of the rotational speed of the motor by the battery voltage drop is almost linear. The results of Experiment E shown in Figure 12 and Figure 13 indicate that the motor-driven signal must reflect the battery voltage drop to achieve the desired thrust during a quad-rotor flight.

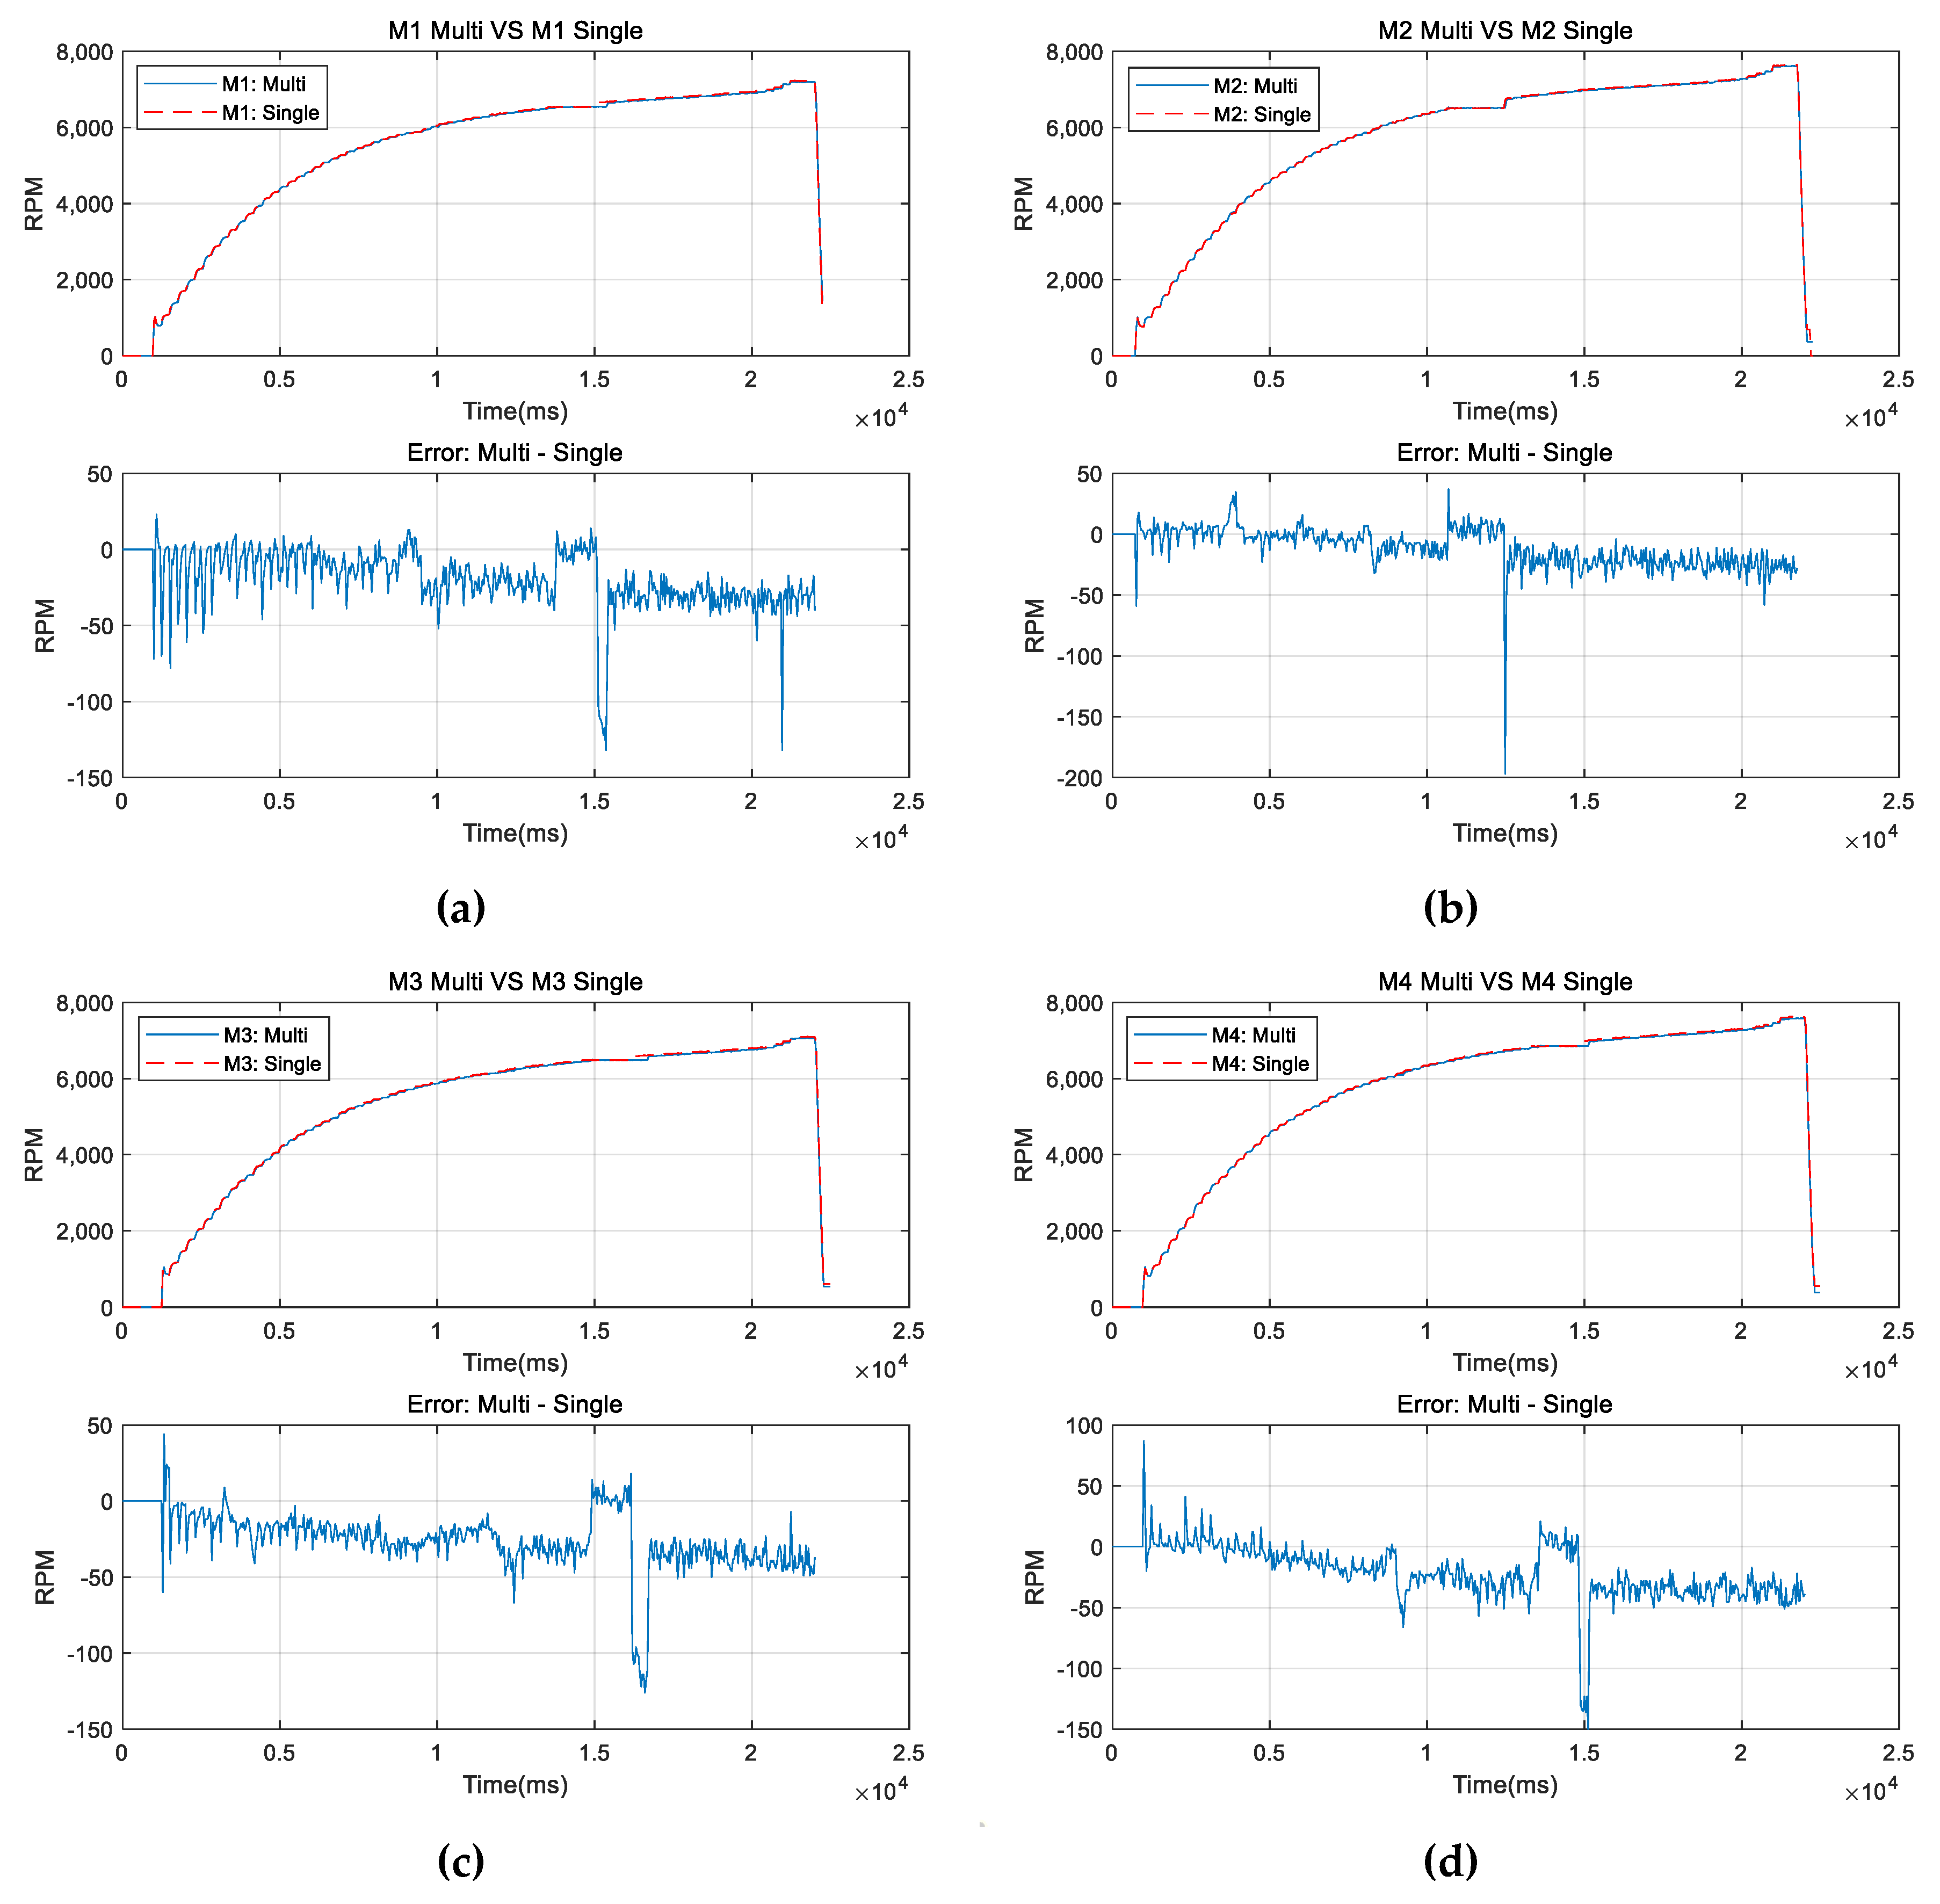
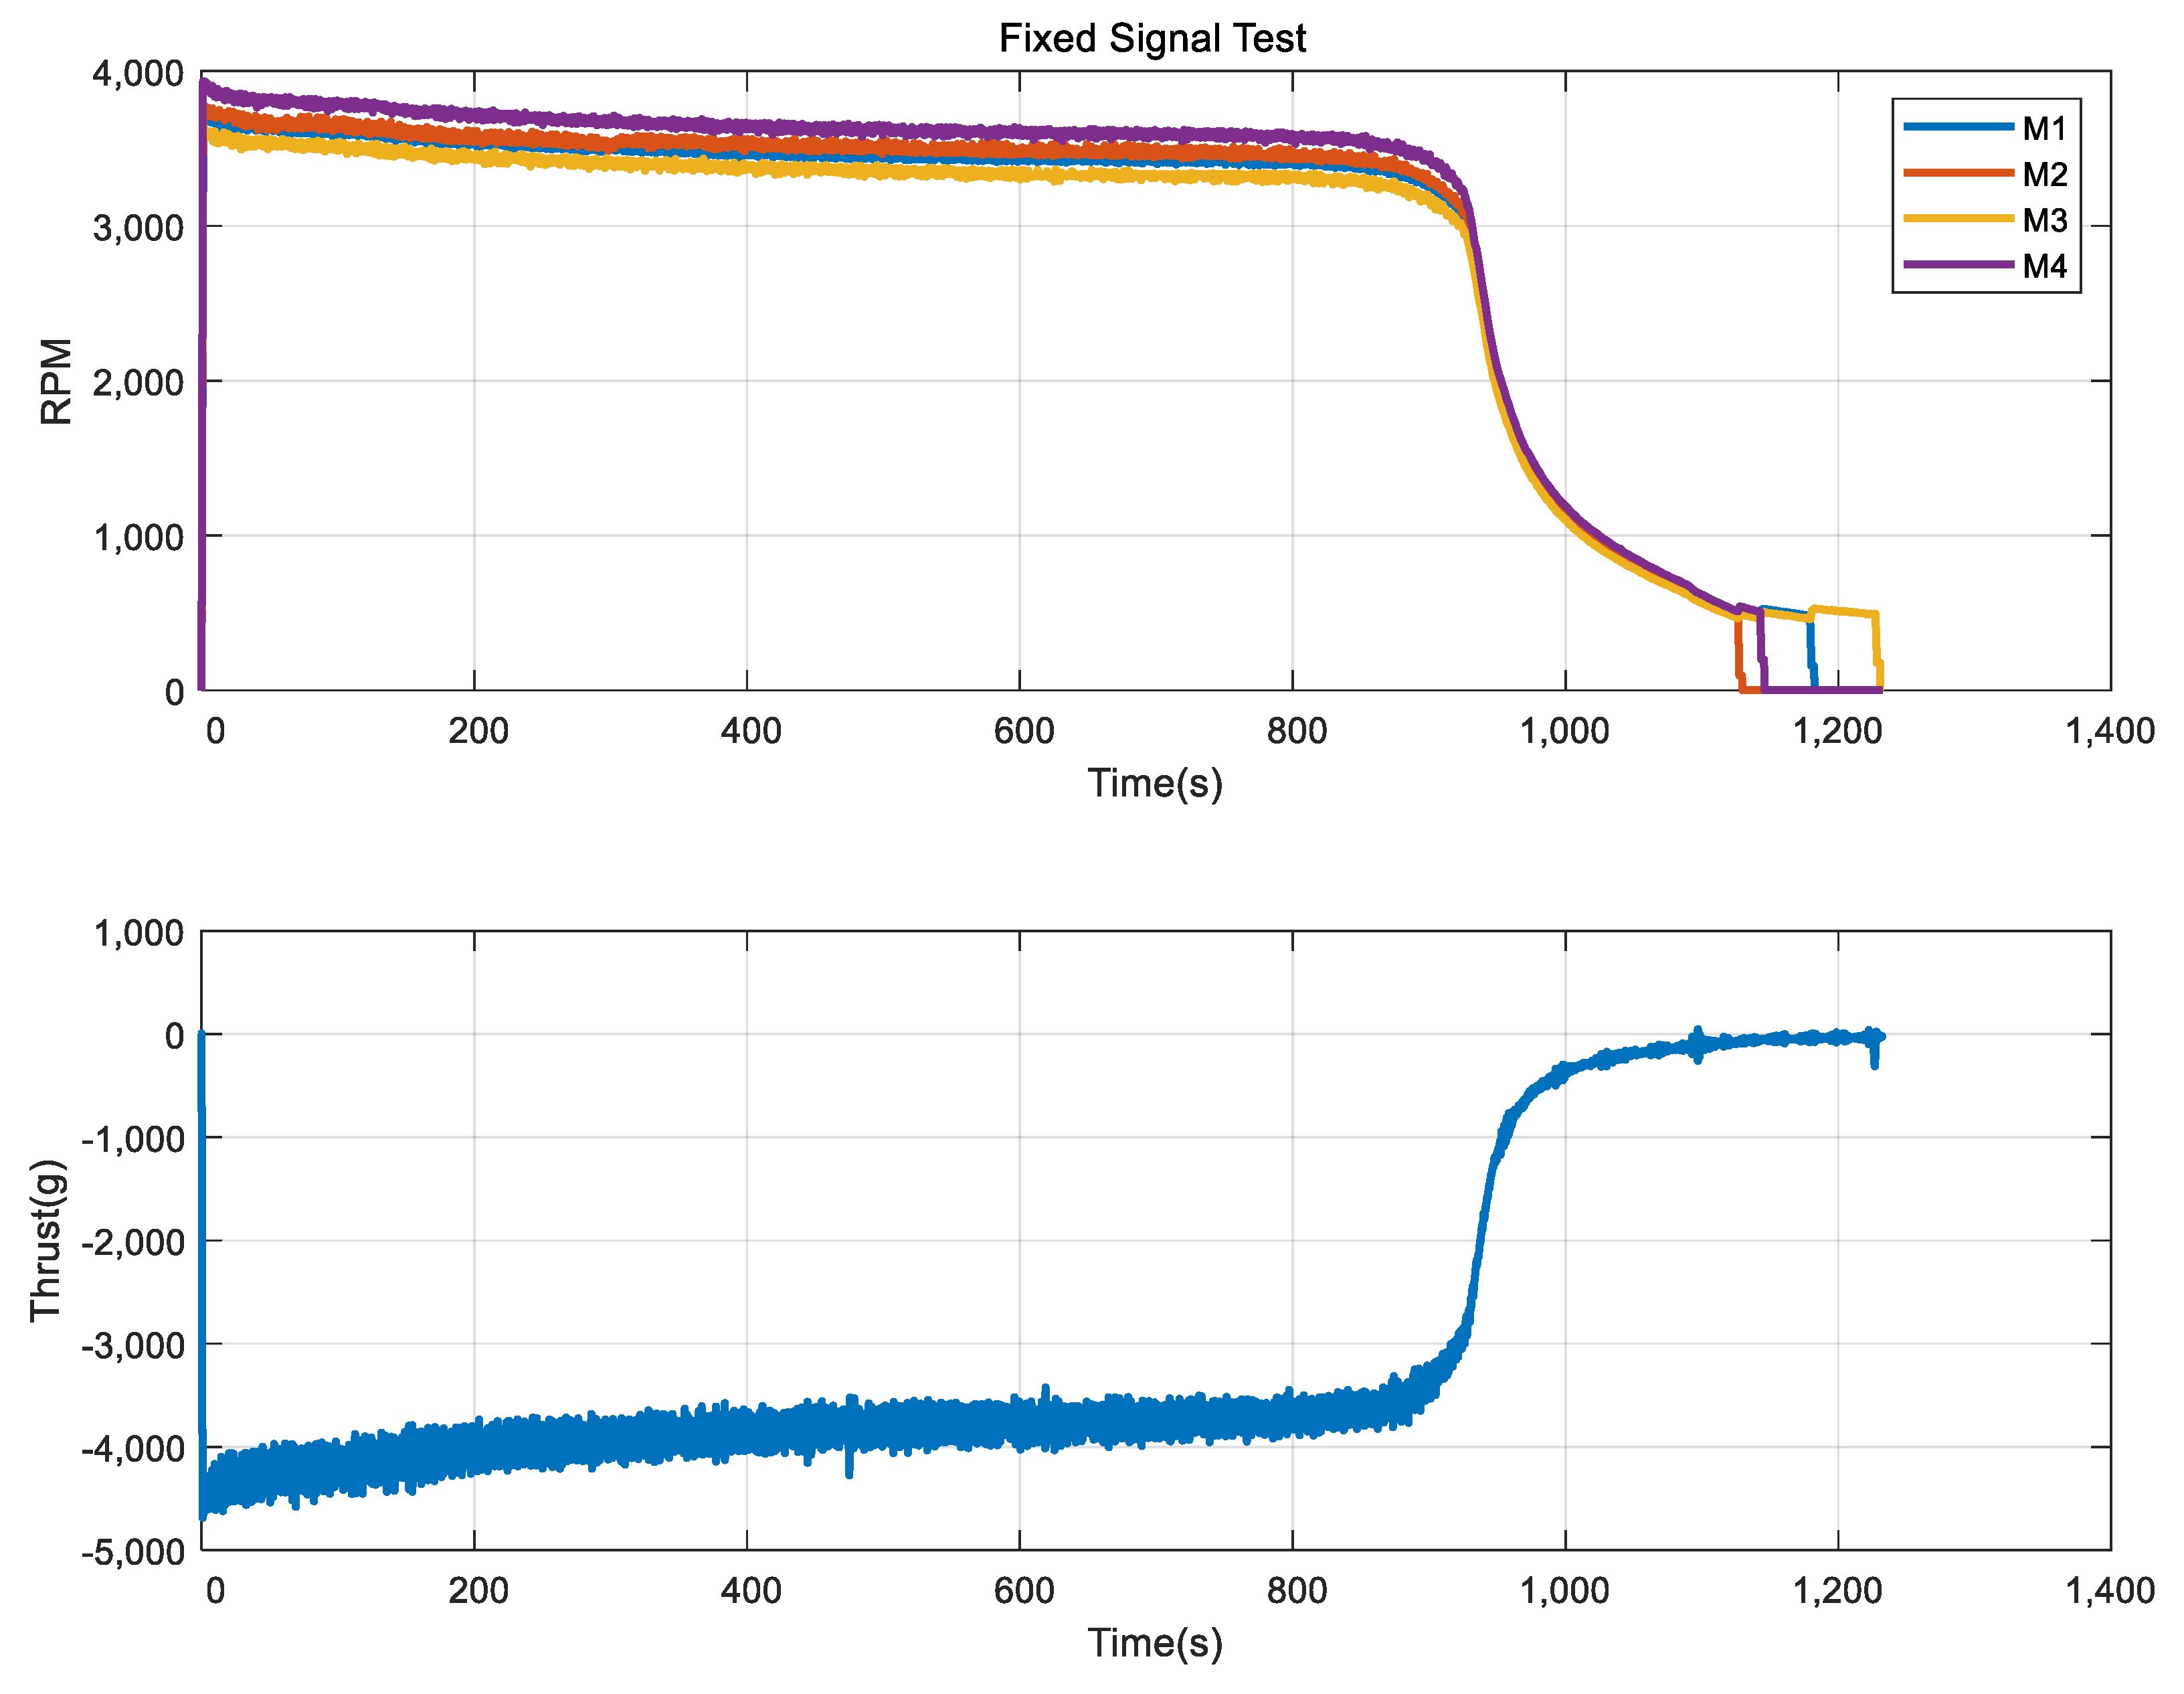
3.3. Experiments for the Performances of Motors when Maintaining the Control Signal until Stopping the Rotation

Experiment E showed that the reduction in battery voltage affected the rotational speed of the motor and that the rotational speed of the motor was reduced almost linearly. Based on the results of Experiment E, Experiment F is performed to verify the effect of reduced battery voltage on thrust. The weight of the quad-rotor used in the experiment is about 4114 g and the flight starts when the total thrust of the four motors exceeds the load. Using the experimental results in Figure 11, the control signals for each motor are selected—(M1: 1.60 ms), (M2: 1.59 ms), (M3: 1.59 ms), and (M4: 1.58 ms)—so that the total sum of thrust is close to 4,114 g, and the signals are maintained until the motor is no longer rotating. Figure 14 and Table 4 show the results of the experiment.
In Figure 14, all motors’ speeds steadily decrease until 880 s, and the slope of the decrease in RPM begins to increase after 880 s. After 900 s, the slope of the decrease in RPM is almost vertical. The speed of each motor is reduced by (M1: 372RPM), (M2: 391RPM), (M3: 379RPM), and (M4: 397RPM), and thrust is reduced by about 997.71 g. Table 3 lists the data at intervals of 100 s. Data of 0.28 s and 1s show that the motor has begun to rotate and has stabilized at speed to the motor-driven signal. The ratio of rotational speed at 1 s and 900 s for each motor was calculated and compared with the results of Experiment E. The ratio of M1 is calculated to be about 0.884, the ratio of M2 is calculated to be about 0.879, the ratio of M3 is calculated to be about 0.876, and the ratio of M4 is calculated to be about 0.874. The results shown are similar to the results of Experiment E, indicating that the motor’s rotational speed varies almost linearly with reduced battery voltage. Additionally, the thrust of the quad-rotor is calculated as the change rate of about 0.735, so T B in Equation (4) almost satisfies the relationship proportional to the square of ω , and the coefficient k f is expected to be very small. This result can be used to calculate the correlation coefficient c T of propeller and thrust.

4. Result and Analysis

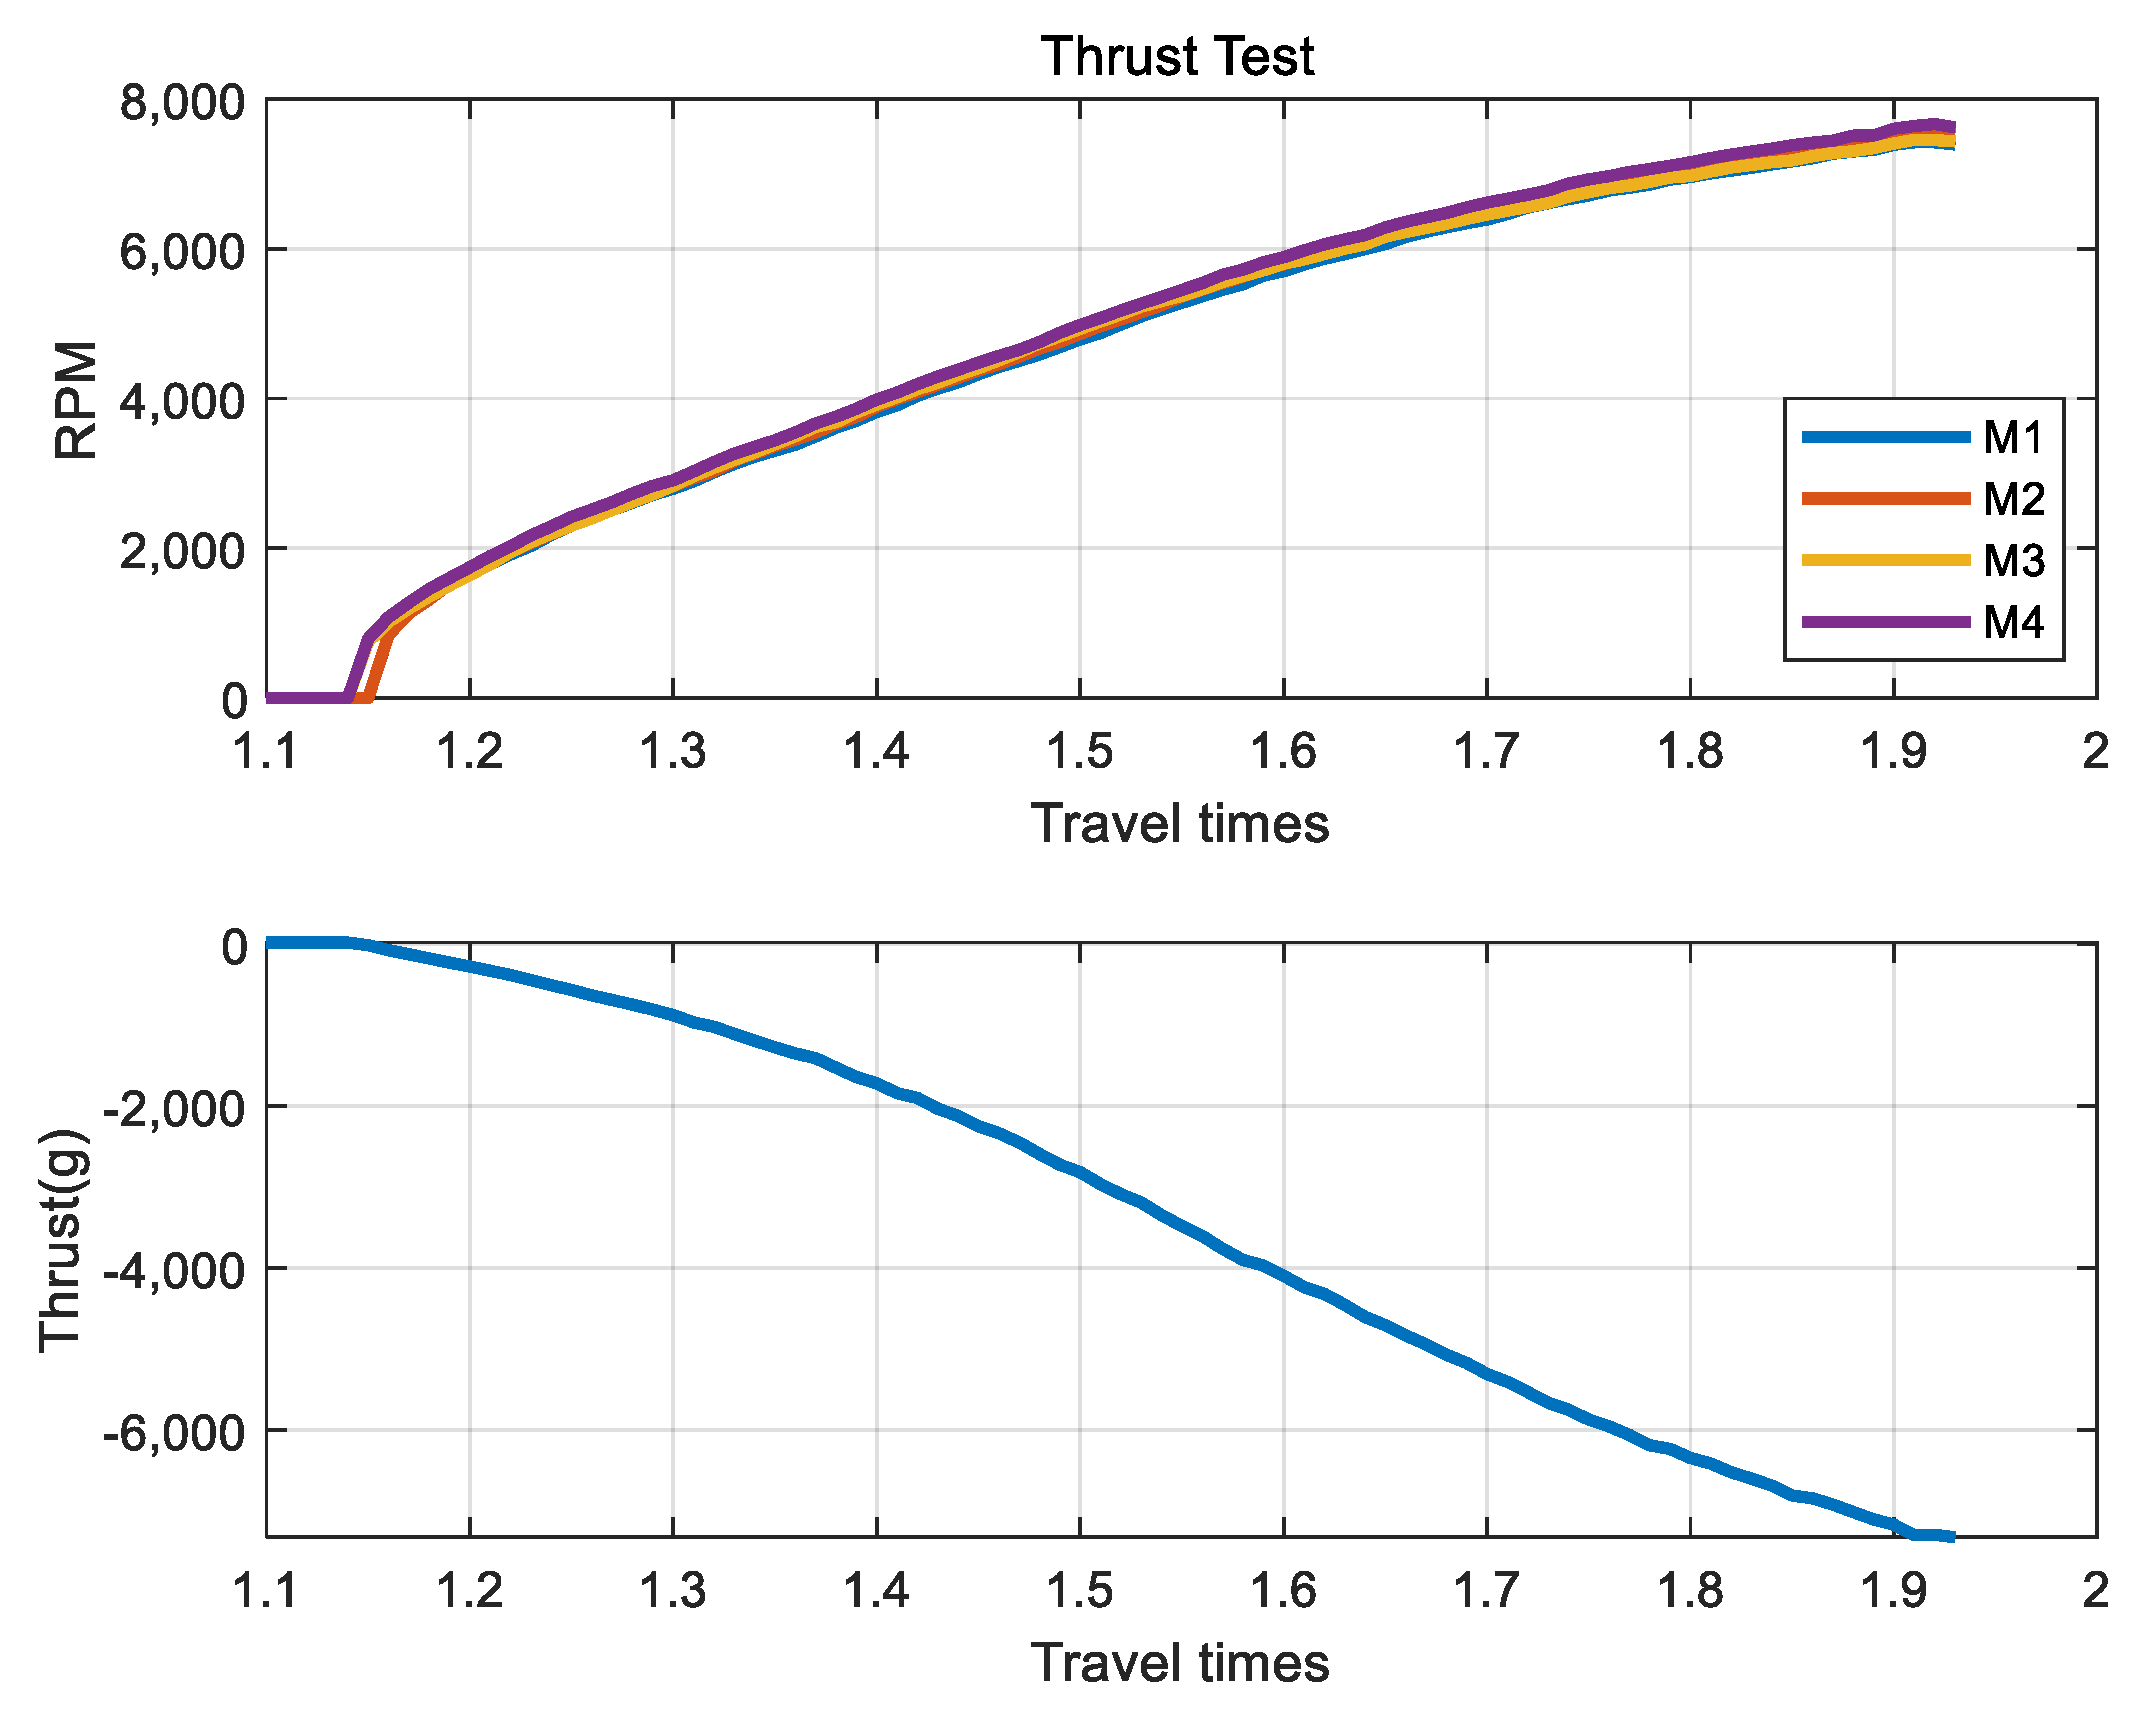
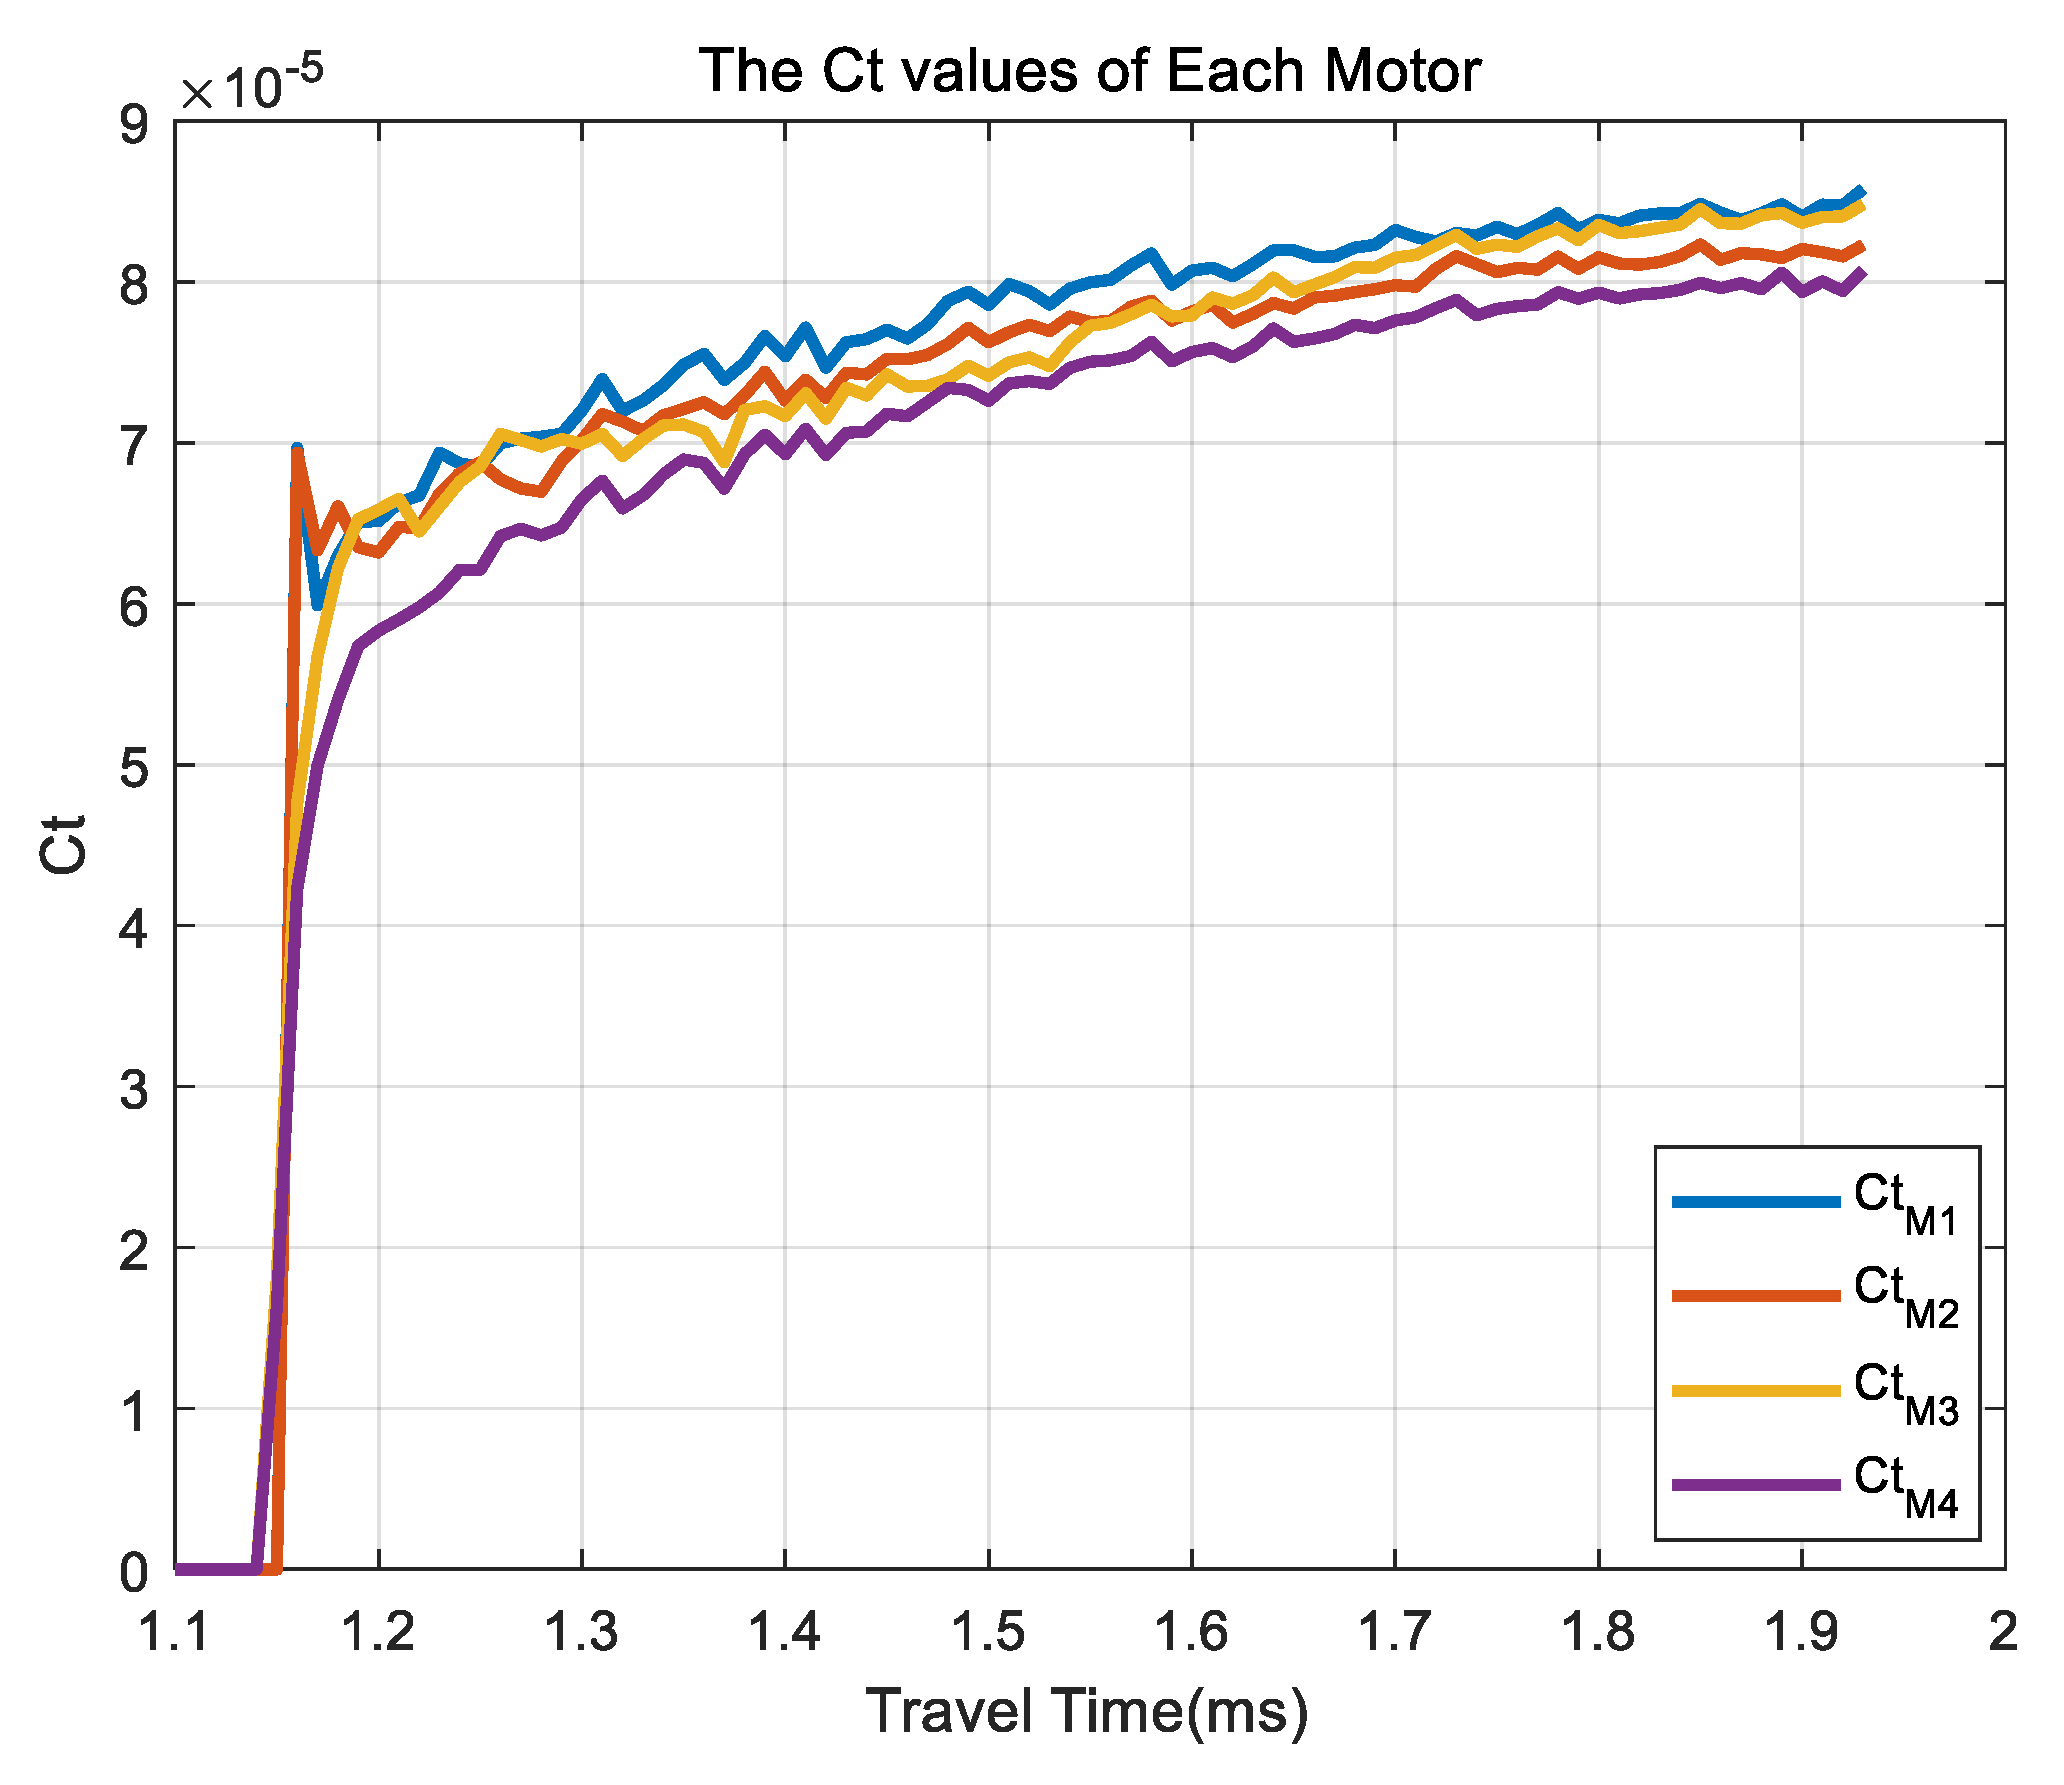
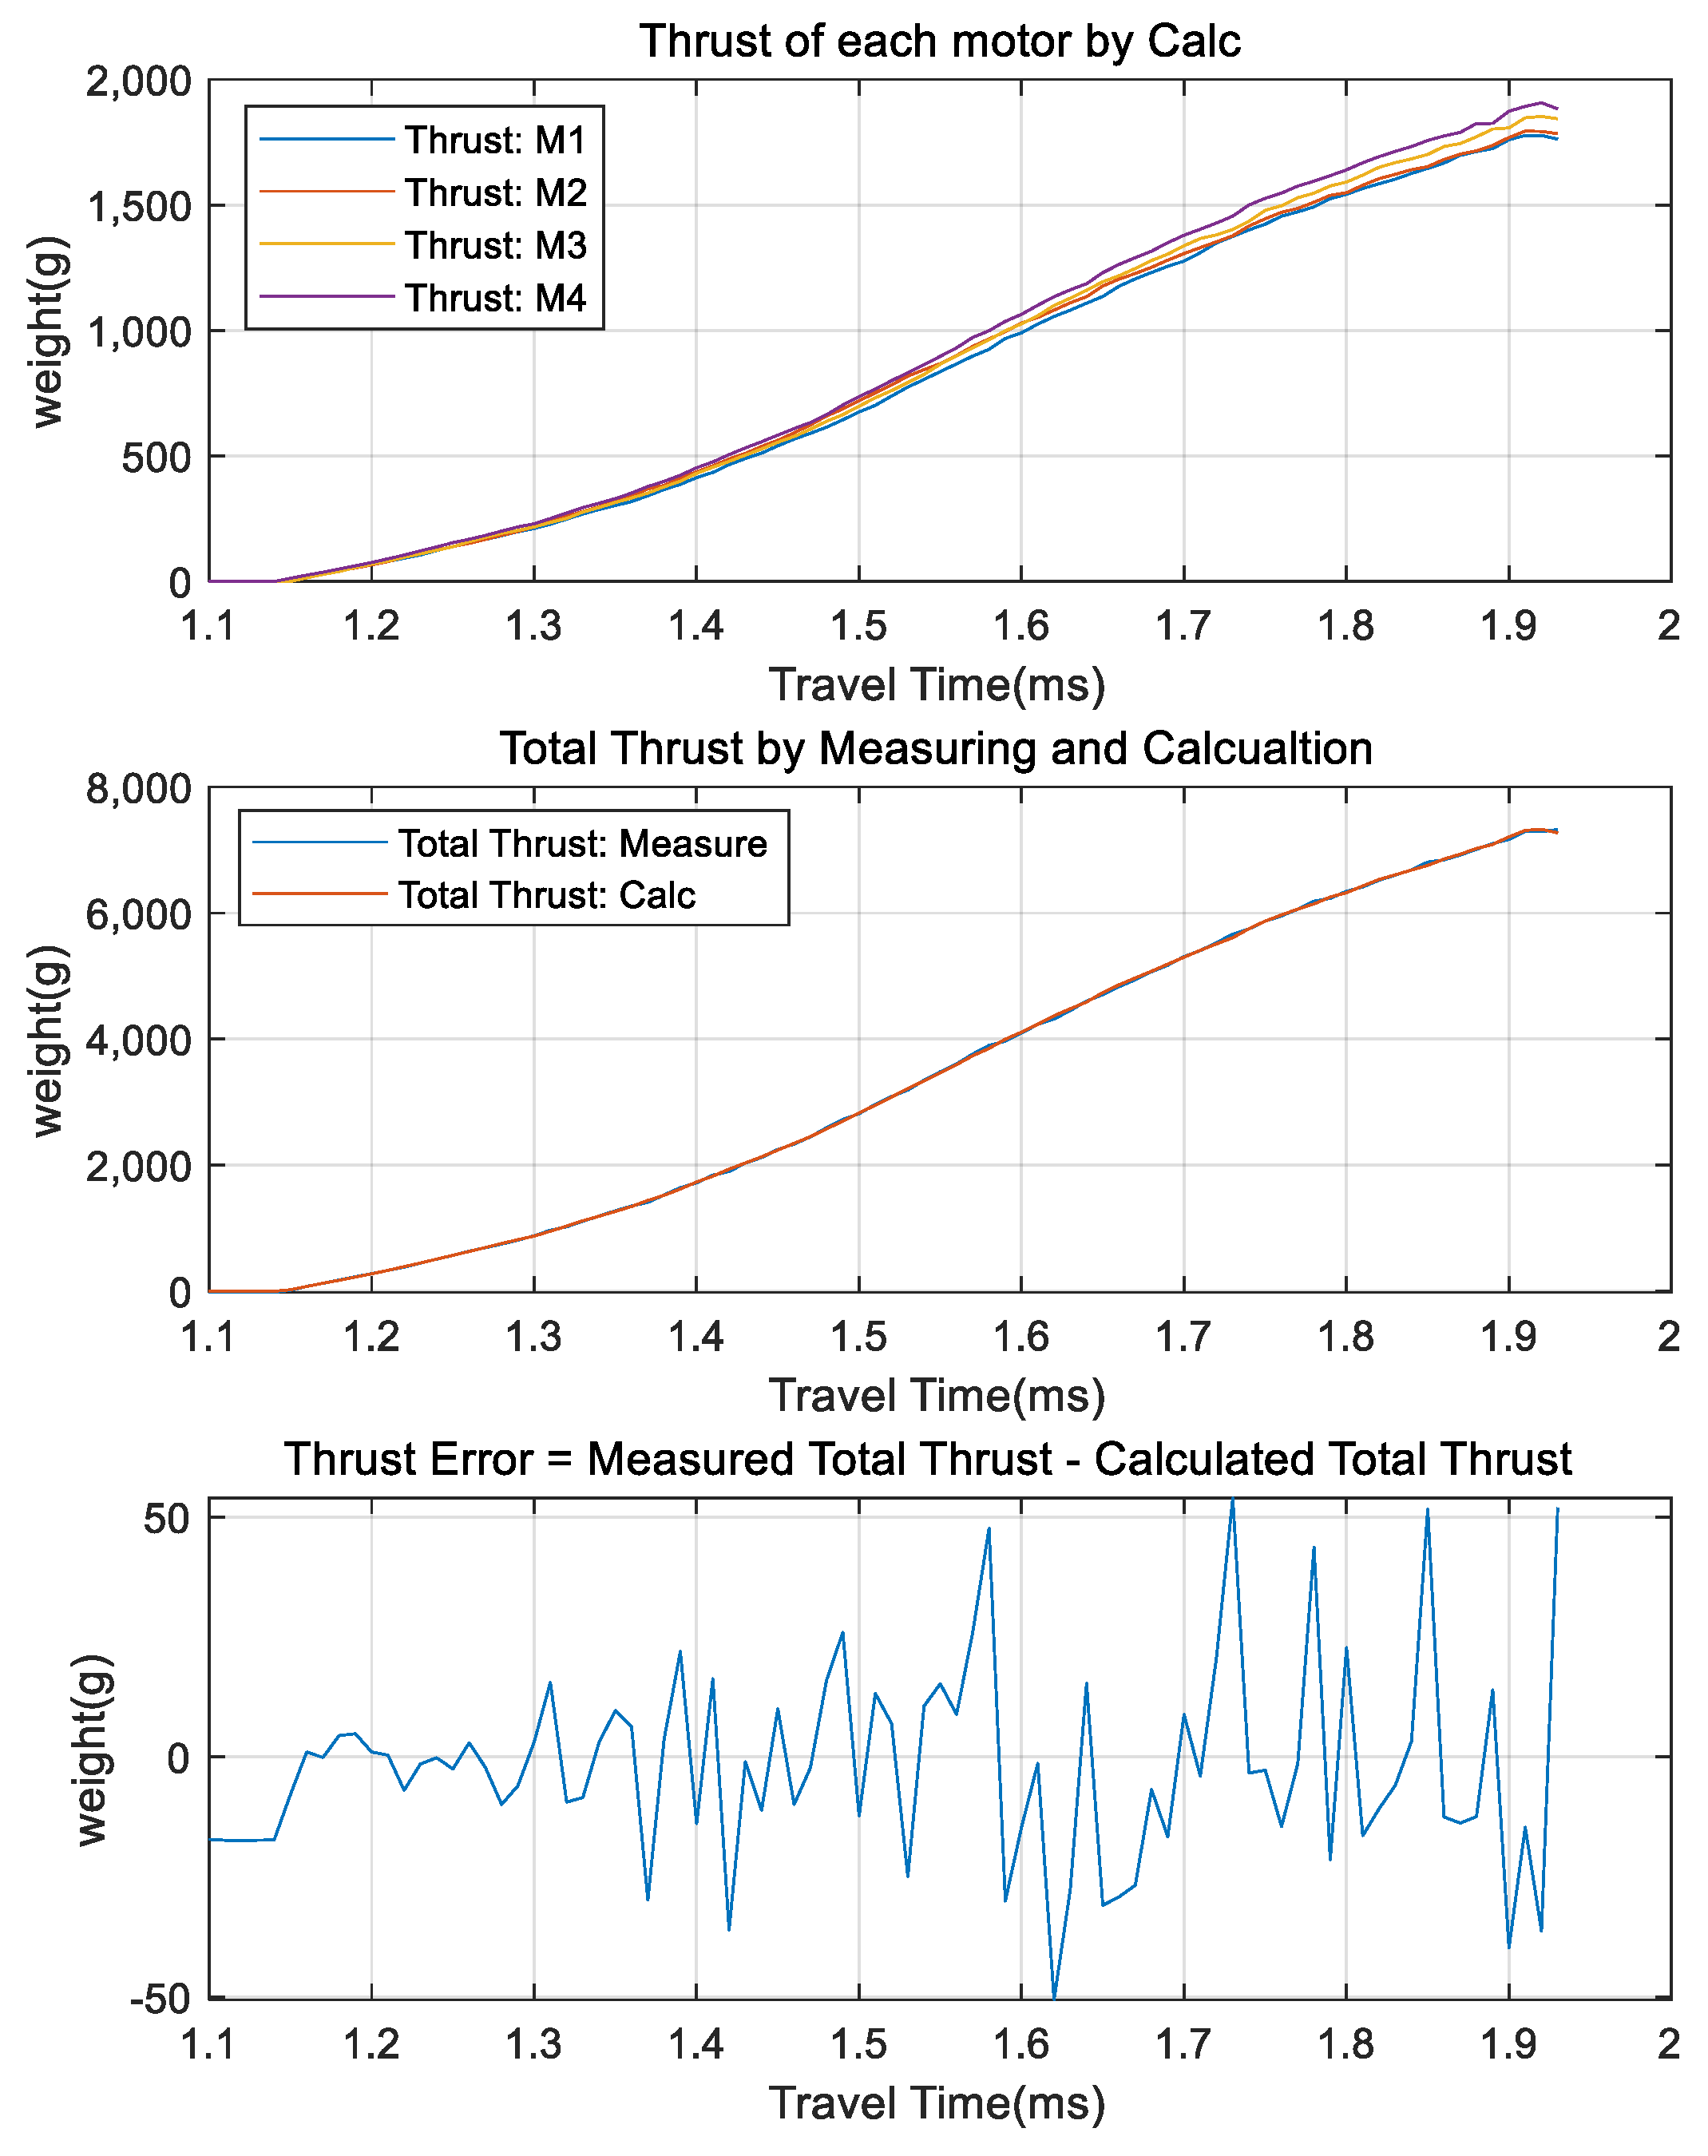
4.1. Coefficient of Relation between Propeller and Thrust c T

The relationship between the experimental results in Figure 11 and k f = 1 2 C T ρ A r r 2 in Equation (3) is shown in Figure 15 and Table 5. The control inputs of the quad-rotor with the under-actuation characteristics are four thrusts, and if c T is determined as a constant, the control input error is generated, which affects the flight stability of the quad-rotor. Therefore, c T , which is the correlation coefficient between propeller speed and thrust, also needs to be considered as variable rather than a constant. Figure 16 shows the result of determining c T as a constant.
In Figure 15, the range of c T for each actuator is shown as (M1: 5.9914 × 10⁻⁵–8.5758 × 10⁻⁵), (M2: 5.67198 × 10⁻⁵–8.48079 × 10⁻⁵), (M3: 6.33296 × 10⁻⁵–8.22869 × 10⁻⁵), (M4: 4.22985 × 10⁻⁵–8.07188 × 10⁻⁵). Experiment A and Experiment D, showed that increasing the high time of the motor-driven signal increases the rpm, and increasing rpm increases the thrust. Figure 15 shows the c T values calculated using the results and Equation (3), and the changes of c T value for each actuator are observed with a similar shape. This shape shows the motor’s performance difference as a gap in the c T value of each motor, and the highest performance M4 is the smallest. Table 5 shows the c T values at similar RPMs. In Figure 8, M2 and M3 show significant performance error, but the c T values in Table 5 are similar, and the performances of M2 and M4 are similar, but the differences in c T values are significant. This means that the propeller states of M2 and M3 are similar, and the propeller states of M2 and M4 differ. This shows that c T is also variable according to the change in the RPM of the propeller, and the results of the calculation by fixing c T as a constant are shown in Figure 16.
Figure 16 is the result of calculating c T as a constant, and the c T has changed to those of 5.0E-05, 6.0E-05, 7.0E-05, and 8.0E-05 in the range shown in Figure 15. Even with very small changes in the c T , the thrust of each motor, which is the control input, is showing a significant error. The thrust calculated from the c T of 5.0E-05, 6.0E-05, 7.0E-05, is significantly lower in performance, and the c T of 8.0E-5 with the most similar results is also shown to be of a higher performance after the initial start and lower performance while reaching the maximum RPM. This result means that c T should be reflected as a variable element when modeling quad-rotor.

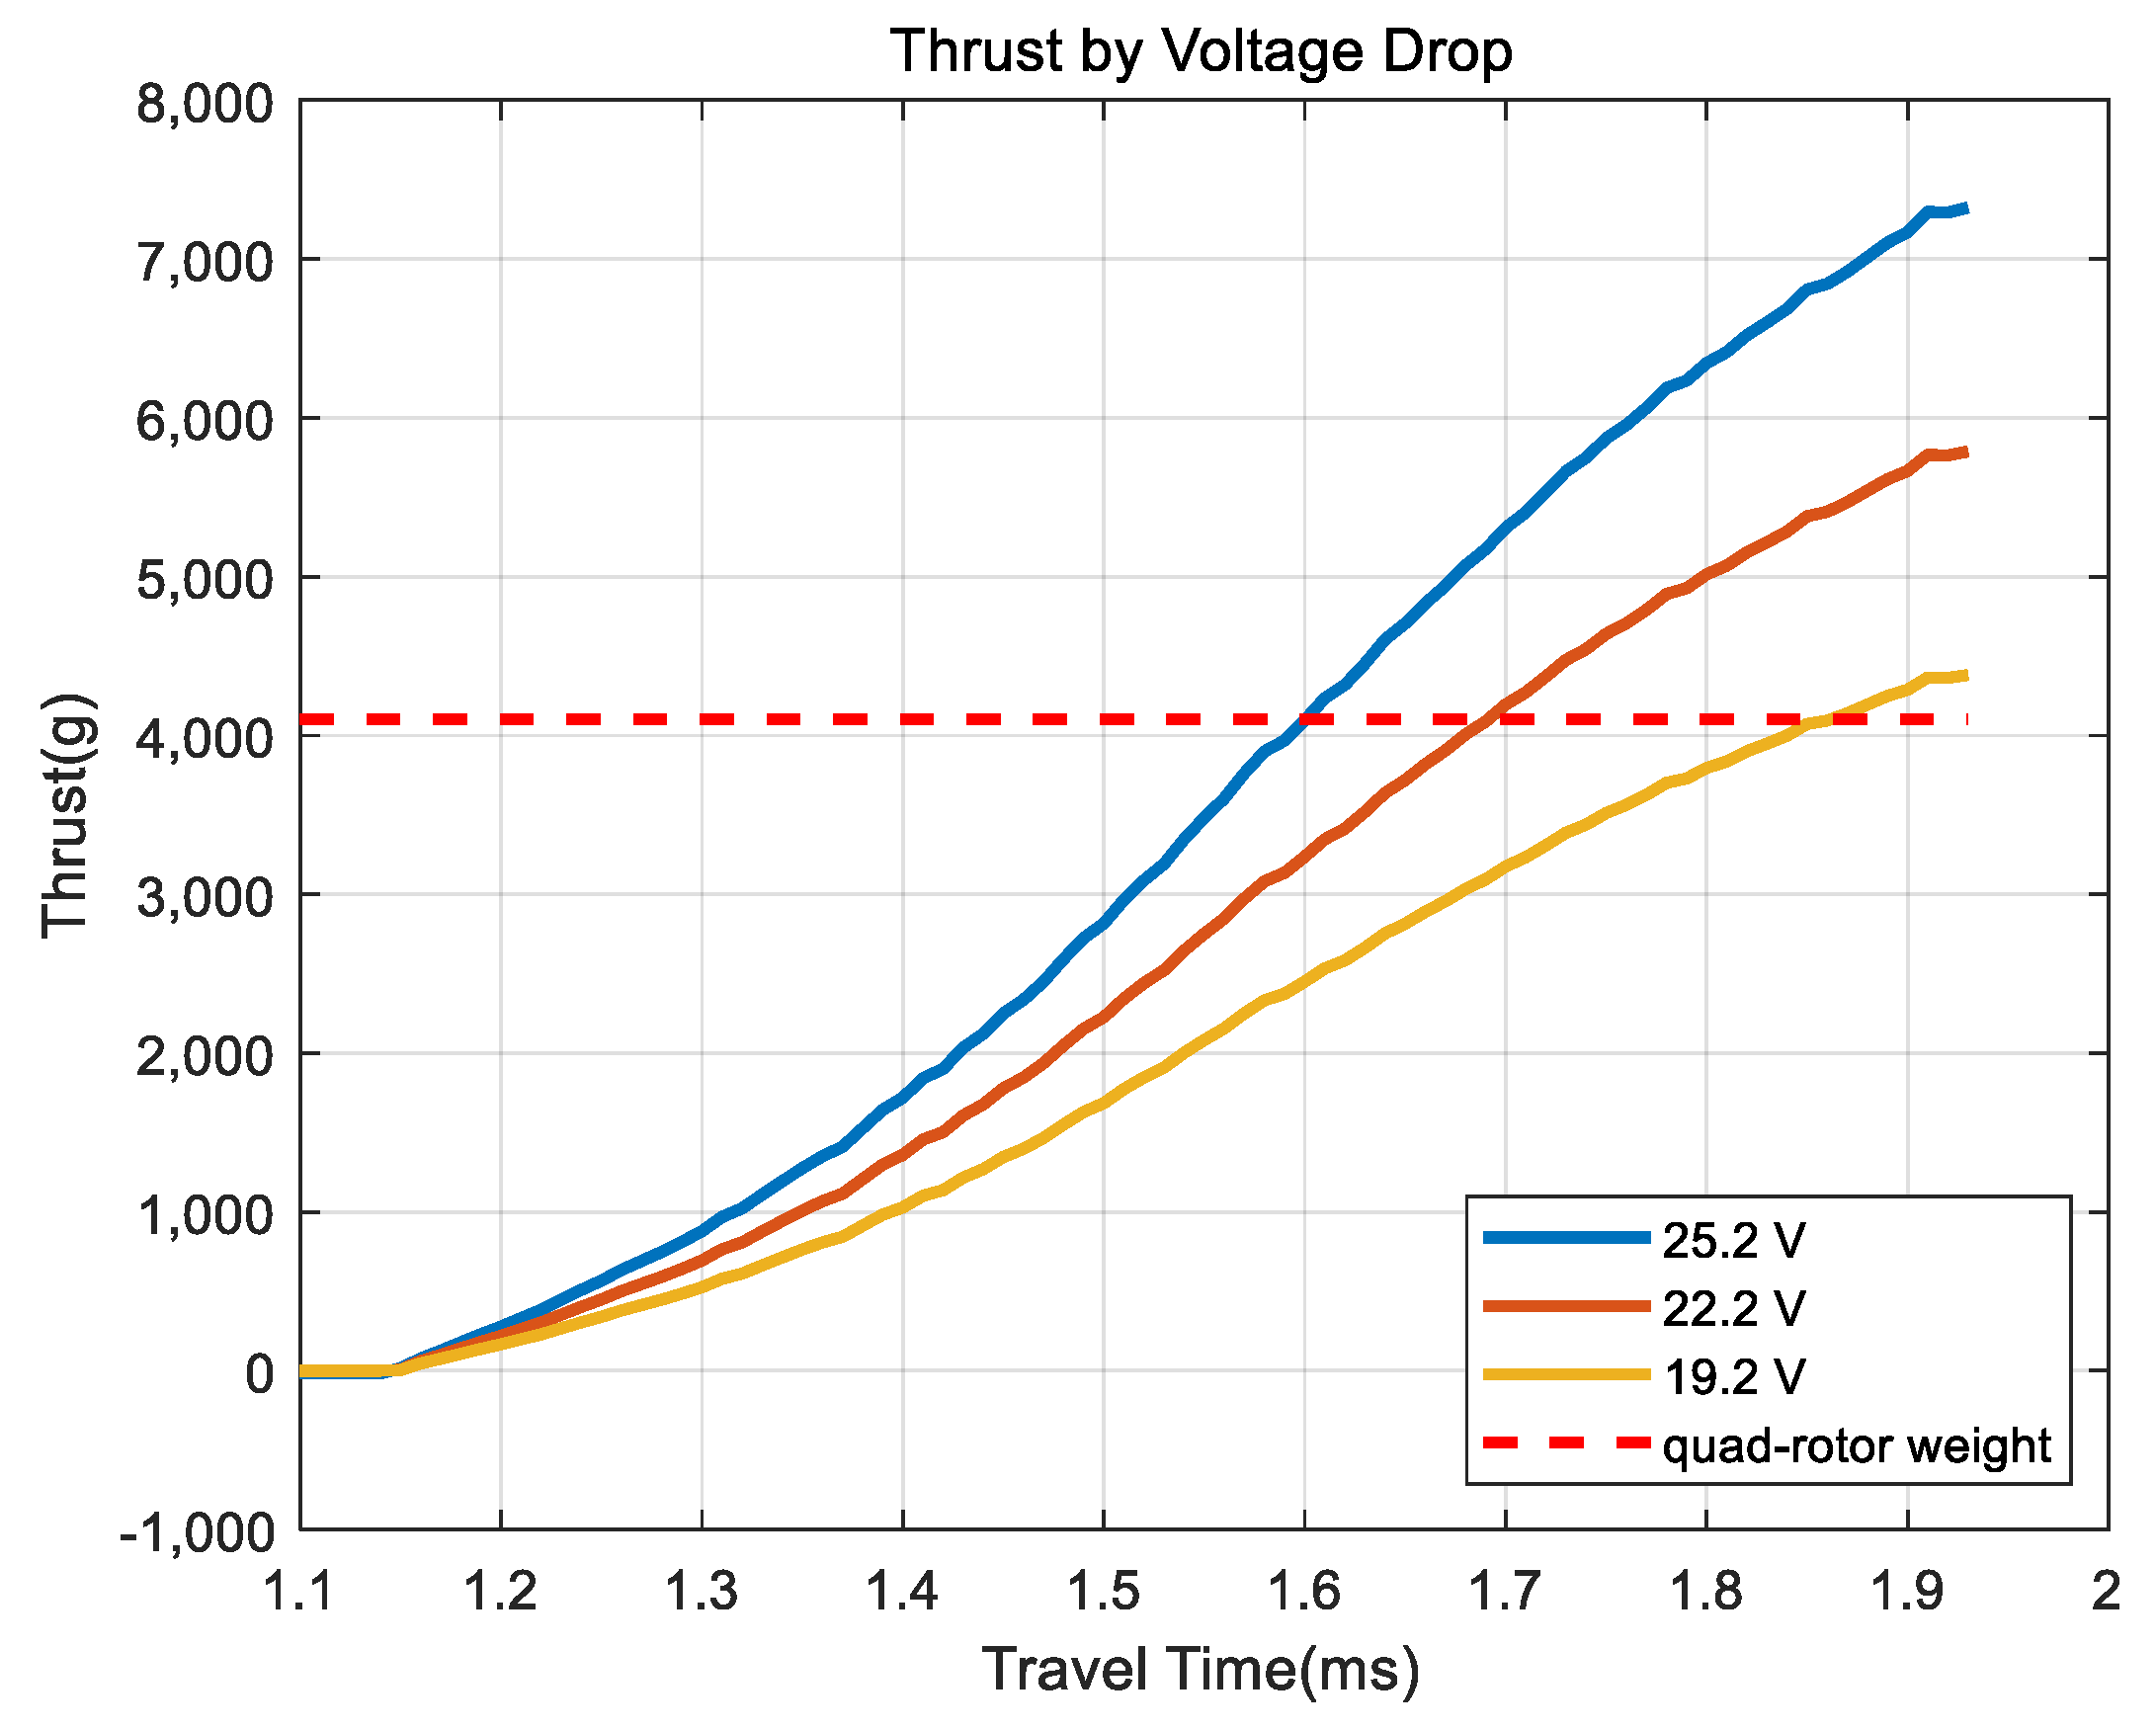
4.2. Relationship between Voltage Drop and Thrust

The motors of the quad-rotor are driven using the battery, and the voltage of the battery is determined by the motor. In this paper, 6C 320 kV motor was used, this has the performance of standard voltage of 22.2 V, full charge of 25.2 V, and minimum discharge voltage of 19.2 V, and if discharged below 19.2 V, the battery will be destroyed. Using the characteristics of this battery and motor experiments to changing voltage, as shown in Figure 12 and Figure 13 and thrust measurements given in Figure 11, the result of thrust can be obtained as shown in Equation (12). Figure 17 shows each actuator thrust curves by Equation (12).
T h r u s t R P M = 4.43 × 10 16 x 5 5.39 × 10 12 x 4 + 1.99 × 10 8 x 3 1.13 × 10 4 x 2 + 0.045 x 9.51
Figure 18 shows that in order to fly the quad-rotor with a weight of 4114 g, the thrust must be over its weight, but there is a section that does not produce the necessary power to fly between 22.2 and 19.2 V. Currently, some flight controllers for the flight of quad-rotors offer options for safe flights through battery limitations among a number of additional options, but their limitation about the battery that does not destroy is the minimum range. But the battery voltage limits should be chosen by ability to fly, not as the range of non-destructive batteries.

5. Conclusions

In this paper, we verified the response characteristics and performance errors due to the drive part and battery voltage drop, which are composed of the same hardware through experiments and examined the effect of the error on the quad-rotor. It also presented how to construct a motor model to reflect the performance of the actual motor and achieve accurate thrust in the quad-rotor model. Figure 19 shows one of the typical quad-rotor modeling methods [15].
In Figure 19, the output of the external planner block is assumed to be a command for following a path or performing a mission. The controller block converts the command signal transmitted from the external planner block into the appropriate control command according to the quad-rotor status and then transfers it to the motor command block. The motor command block outputs the actual motor drive signal according to the current quad-rotor setting (“+” or “X”). The motor dynamics block converts the signal from the motor command block to RPM and delivers it to the quad-rotor dynamic block. The quad-rotor block outputs the current position and attitude through calculations using the RPM delivered from the motor dynamics block. This is a general quad-rotor modeling. If the motor dynamics block is mathematically configured in the Figure 19, all motors will output the same speed for the same motor-driven signal. However, the actual quad-rotor contains hardware errors. Therefore, when delivering the motor rotational speed to the quad-rotor dynamic block, the proposal is to deliver the actual motor response and to calculate the correct thrust to include flight instability for configuring the better controller. In this paper, the fact that actuators with the same hardware have errors is verified through the experimental results in Figure 8 to Figure 10, and the effect of these errors is shown in Figure 16. Accordingly, a model consisting of Equation (11) and Table 2 is proposed through the experimental results in Figure 11 for the actuators with performance errors. The experiment results from Figure 12, Figure 13 and Figure 14 also showed that the rotational speed error of the actuator for the same control signal is caused by a voltage drop in the battery, which should be considered when operating the quad-rotor. The effect of the battery voltage drop can be applied as follows using the actuator model for the control signal given by Equation (11), and the result of Figure 17 presented by Equation (12).
(i)
Create a thrust lookup table for each voltage of the entire control range of the actuator using Equations (11) and (12).
(ii)
Calculate the RPM and thrust of current voltages using the voltage drop ratio in Figure 13 and Equations (11) and (12).
(iii)
Estimate the correct motor control signals in the lookup table of i) using current voltages and the thrust calculated in ii).
The actuator model, which includes the effects of speed error and battery voltage drop, can be modeled close to the actual quad-rotor by applying it, instead, to the motor dynamics block in Figure 19. Since the effect of battery voltage drop can be used to obtain motor control signals that can maintain the same thrust, it is also useful to implement safety functions such as emergency landing if there is no motor control signal corresponding to thrust generated from current voltage.
In future research, we will make experimental measurements of dynamic parameters and combine them with the results of this paper to complete the dynamic model of the quad-rotor. In addition, we will design the controller using the dynamic model of the quad-rotor and build a 3D observation simulator to evaluate the dynamic model of the quad-rotor and controller.

Author Contributions

Conceptualization, H.C.C.; Data curation, S.H.J.; Methodology, S.H.J. and J.K.; Project administration, H.C.C.; Software, S.H.J. and J.K.; Validation, H.C.C.; Visualization, S.H.J. and J.K.; Writing—original draft, S.H.J.; Writing—review & editing, S.H.J. and H.C.C. All authors have read and agreed to the published version of the manuscript.

Funding

This paper was supported by the Graduate School Research Program of KOREATECH.

Conflicts of Interest

The authors declare no conflict of interest.

References

  1. Omari, S.; Hua, M.D.; Ducard, G.; Hamel, T. Hardware and software architecture for nonlinear control of multirotor helicopters. IEEE/ASME Trans. Mechatron. 2013, 18, 1724–1736. [Google Scholar] [CrossRef] [Green Version]
  2. Al-Saedi, F.A.T.; Sabar, R.A. Design and implementation of autopilot system for quadcopter. IJCSET 2015, 5, 190–199. [Google Scholar]
  3. Balasubramanian, E.; Vasantharaj, R. Dynamic Modeling and Control of Quad Rotor. Int. Eng. Technol. 2013, 5, 63–69. [Google Scholar]
  4. Elruby, A.Y.; El-Khatib, M.M.; El-Amary, N.H.; Hashad, A.I. Dynamic modeling and control of quadrotor vehicle. In Proceedings of the International Conference on Applied Mechanics and Mechanical Engineering (15th International Conference on Applied Mechanics and Mechanical Engineering), Cairo, Egypt, 29–31 May 2012; Volume 15, pp. 1–10. [Google Scholar]
  5. Dorling, K.; Heinrichs, J.; Messier, G.G.; Magierowski, S. Vehicle routing problems for drone delivery. IEEE Trans. Syst. Man Cybern. Syst. 2017, 47, 70–85. [Google Scholar] [CrossRef] [Green Version]
  6. Gandolfo, D.C.; Salinas, L.R.; Brandão, A.; Toibero, J.M. Stable path-following control for a quadrotor helicopter considering energy consumption. IEEE Trans. Control Syst. Technol. 2016, 25, 1423–1430. [Google Scholar] [CrossRef]
  7. Allouch, A.; Koubaa, A.; Khalgui, M.; Abbes, T. Qualitative and quantitative risk analysis and safety assessment of unmanned aerial vehicles missions over the internet. IEEE Access 2019, 7, 53392–53410. [Google Scholar] [CrossRef]
  8. Razinkova, A.; Kang, B.J.; Cho, H.C.; Jeon, H.T. Constant altitude flight control for quadrotor UAVs with dynamic feedforward compensation. Int. J. Fuzzy Log. Intell. Syst. 2014, 14, 26–33. [Google Scholar] [CrossRef] [Green Version]
  9. Liu, Z.; Liu, X.; Chen, J.; Fang, C. Altitude control for variable load quadrotor via learning rate based robust sliding mode controller. IEEE Access 2019, 7, 9736–9744. [Google Scholar] [CrossRef]
  10. Yang, S.; Xian, B. Energy-based nonlinear adaptive control design for the quadrotor UAV system with a suspended payload. IEEE Trans. Ind. Electron. 2019, 67, 2054–2064. [Google Scholar] [CrossRef]
  11. Poultney, A.; Kennedy, C.; Clayton, G.; Ashrafiuon, H. Robust tracking control of quadrotors based on differential flatness: Simulations and experiments. IEEE/ASME Trans. Mechatron. 2018, 23, 1126–1137. [Google Scholar] [CrossRef]
  12. İrfan, Ö. Mathematical Modelling and Simulation of Quadrotor. IOSR J. Electr. Electron. Eng. 2017, 12, 11–18. [Google Scholar]
  13. Nagaty, A.; Saeedi, S.; Thibault, C.; Seto, M.; Li, H. Control and navigation framework for quadrotor helicopters. J. Intell. Robot. Syst. 2013, 70, 1–12. [Google Scholar] [CrossRef]
  14. Sattar, M.A.; Ismail, A. Modeling and fuzzy logic control of a quadrotor UAV. Int. Res. J. Eng. Technol. 2017, 4, 1494–1498. [Google Scholar]
  15. Bouabdallah, S.; Murrieri, P.; Siegwart, R. Design and control of an indoor micro quadrotor. In Proceedings of the IEEE International Conference on Robotics and Automation, New Orleans, LA, USA, 26 April–1 May 2004; Volume 5, pp. 4393–4398. [Google Scholar]
Figure 1. The quad-rotor reference frames.
Electronics 09 00579 g001
Figure 2. Constituents of quad-rotor for experiments. (a) Block diagram for data acquisitions; (b) electronic devices of quad-rotor.
Electronics 09 00579 g002
Figure 3. The motor control signal at the controller in the quad-rotor. ※ Travel time: signal range limited to a maximum signal duration from 1.1 ms to 1.94 ms.
Electronics 09 00579 g003
Figure 4. Measuring the rotational speed of the motor using the infrared sensor. (a) Diameter of motor and length of reflector; (b) the distance between the reflector and the infrared sensor.
Electronics 09 00579 g004
Figure 5. The infrared sensor signal measured with the oscilloscope. (a) Infrared sensor output of M1; (b) infrared sensor output of M2; (c) infrared sensor output of M3; (d) infrared sensor output of M4.
Electronics 09 00579 g005
Figure 6. The infrared sensor signal measured with the controller.
Electronics 09 00579 g006
Figure 7. Configuring the testbed. (a) 3D modeling for the testbed; (b) assembling the testbed.
Electronics 09 00579 g007
Figure 8. Experiment A result of motor speed response to changing control signals when four motors drive at the same time.
Electronics 09 00579 g008
Figure 9. The Experiment B result of motor speed response to changing control signals when only one motor drives. (a) M1: single driven vs. multi driven; (b) M2: single motor vs. multi motors; (c) M3: single motor vs. multi motors; (d) M4: single motor vs. multi motors.
Electronics 09 00579 g009
Figure 10. The results of Experiment C to find the cause of the speed error. (a) The experiment of the electronic speed controller’s (ESC) replacement: ESC3 to ESC4 in M3; (b) the experiment of ESC’s replacement: ESC4 to ESC3 in M4; (c) the experiment after re-initialization of ESCs; (d) the experiment of the infrared sensor replacement.
Electronics 09 00579 g010
Figure 11. The experiment D result of the actuator assembled with motor and propeller.
Electronics 09 00579 g011
Figure 12. The Experiment E results of change operating voltages.
Electronics 09 00579 g012
Figure 13. Ratio of Mx RPM (22.2 V) to Mx RPM (25.2 V) and Mx RPM (19.2 V) to Mx RPM (22.2 V).
Electronics 09 00579 g013
Figure 14. The results of Experiment F: maintaining control signal.
Electronics 09 00579 g014
Figure 15. c T values of each motor by experiment.
Electronics 09 00579 g015
Figure 16. Result of thrust by changing c T .
Electronics 09 00579 g016
Figure 17. Comparison of thrust by measurement and thrust by calculation.
Electronics 09 00579 g017
Figure 18. Change of thrust by voltage drop at same control signals.
Electronics 09 00579 g018
Figure 19. The block diagram of quad-rotor modeling.
Electronics 09 00579 g019
Table 1. Materials and specifications of quad-rotor.
MaterialsSpecifications
Weight(including all electronic devices and battery)4104 g
Distance from motor to center48 cm
Blade diameter38.1 cm
Pitch11.43 cm
Signal controllerAtmel SAM3X8E ARM Cortex-M3
BLDC MotorTarot 4114/320 kV
Electronic Speed ControlsHobbywing XRotor 40 A
LoadcellCAS BCL-20 L / 196.2 N
Table 2. Coefficient of each motors for Equation (11).
Coefficient M 1 M 2 M 3 M 4
A96,971.9570,285.7113,929.199,966.76
B−60,835−545,492−891,809−781,732
C2,368,2231,680,1692,770,3502,425,397
D−3,661,048−2,573,780−4,274,581−3,737,661
E2,823,7691,974,6133,289,1492,874,194
F−870,918−608,759−1,011,358−883,911
R0.99988940.99991350.99989960.9999200
R 2 0.99977880.99982700.99979920.9998401
PLess than 0.0001Less than 0.0001Less than 0.0001Less than 0.0001
Table 3. Maximum RPM of each motor with different voltages.
VoltageM1(RPM)M2(RPM)M3(RPM)M4(RPM)
25.2 V7240763570767603
22.2 V6569692864096881
19.2 V5713605155705977
Table 4. The results of the experiment maintaining the control signal.
Time (s) M 1 M 2 M 3 M 4 Loadcell (g)
13716363437533923−4527.87
1003632350236353805−4164.27
2003579344435473721−3928.84
3003503341735243661−3811.55
4003477338335403642−3872.88
5003478335635033646−3688.79
6003443332834713608−3832.85
7003410332234983604−3726.53
8003419331534513576−3793.38
880.43344324333743526−3537.16
932.962787270628122898−2423.78
Table 5. Comparing c T of each motor in similar range of RPM.
RPM M 1 M 2 M 3 M 4
Error c T Error c T Error c T Error c T
244037.713 × 10−597.166 × 10⁻⁵−77.261 × 10⁻⁵−267.048 × 10⁻⁵
304067.986 × 10−5−127.478 × 10⁻⁵−17.623 × 10⁻⁵−87.327 × 10⁻⁵
352057.982 × 10−527.857 × 10⁻⁵−47.882 × 10−5127.538 × 10−5
404008.278 × 10−5−58.149 × 10⁻⁵−87.953 × 10−587.732 × 10⁻⁵
440028.410 × 10−5−68.302 × 10⁻⁵−98.080 × 10⁻⁵−97.858 × 10⁻⁵

