Ergonomic Guidelines of Head-Up Display User Interface during Semi-Automated Driving


Abstract
:1. Introduction
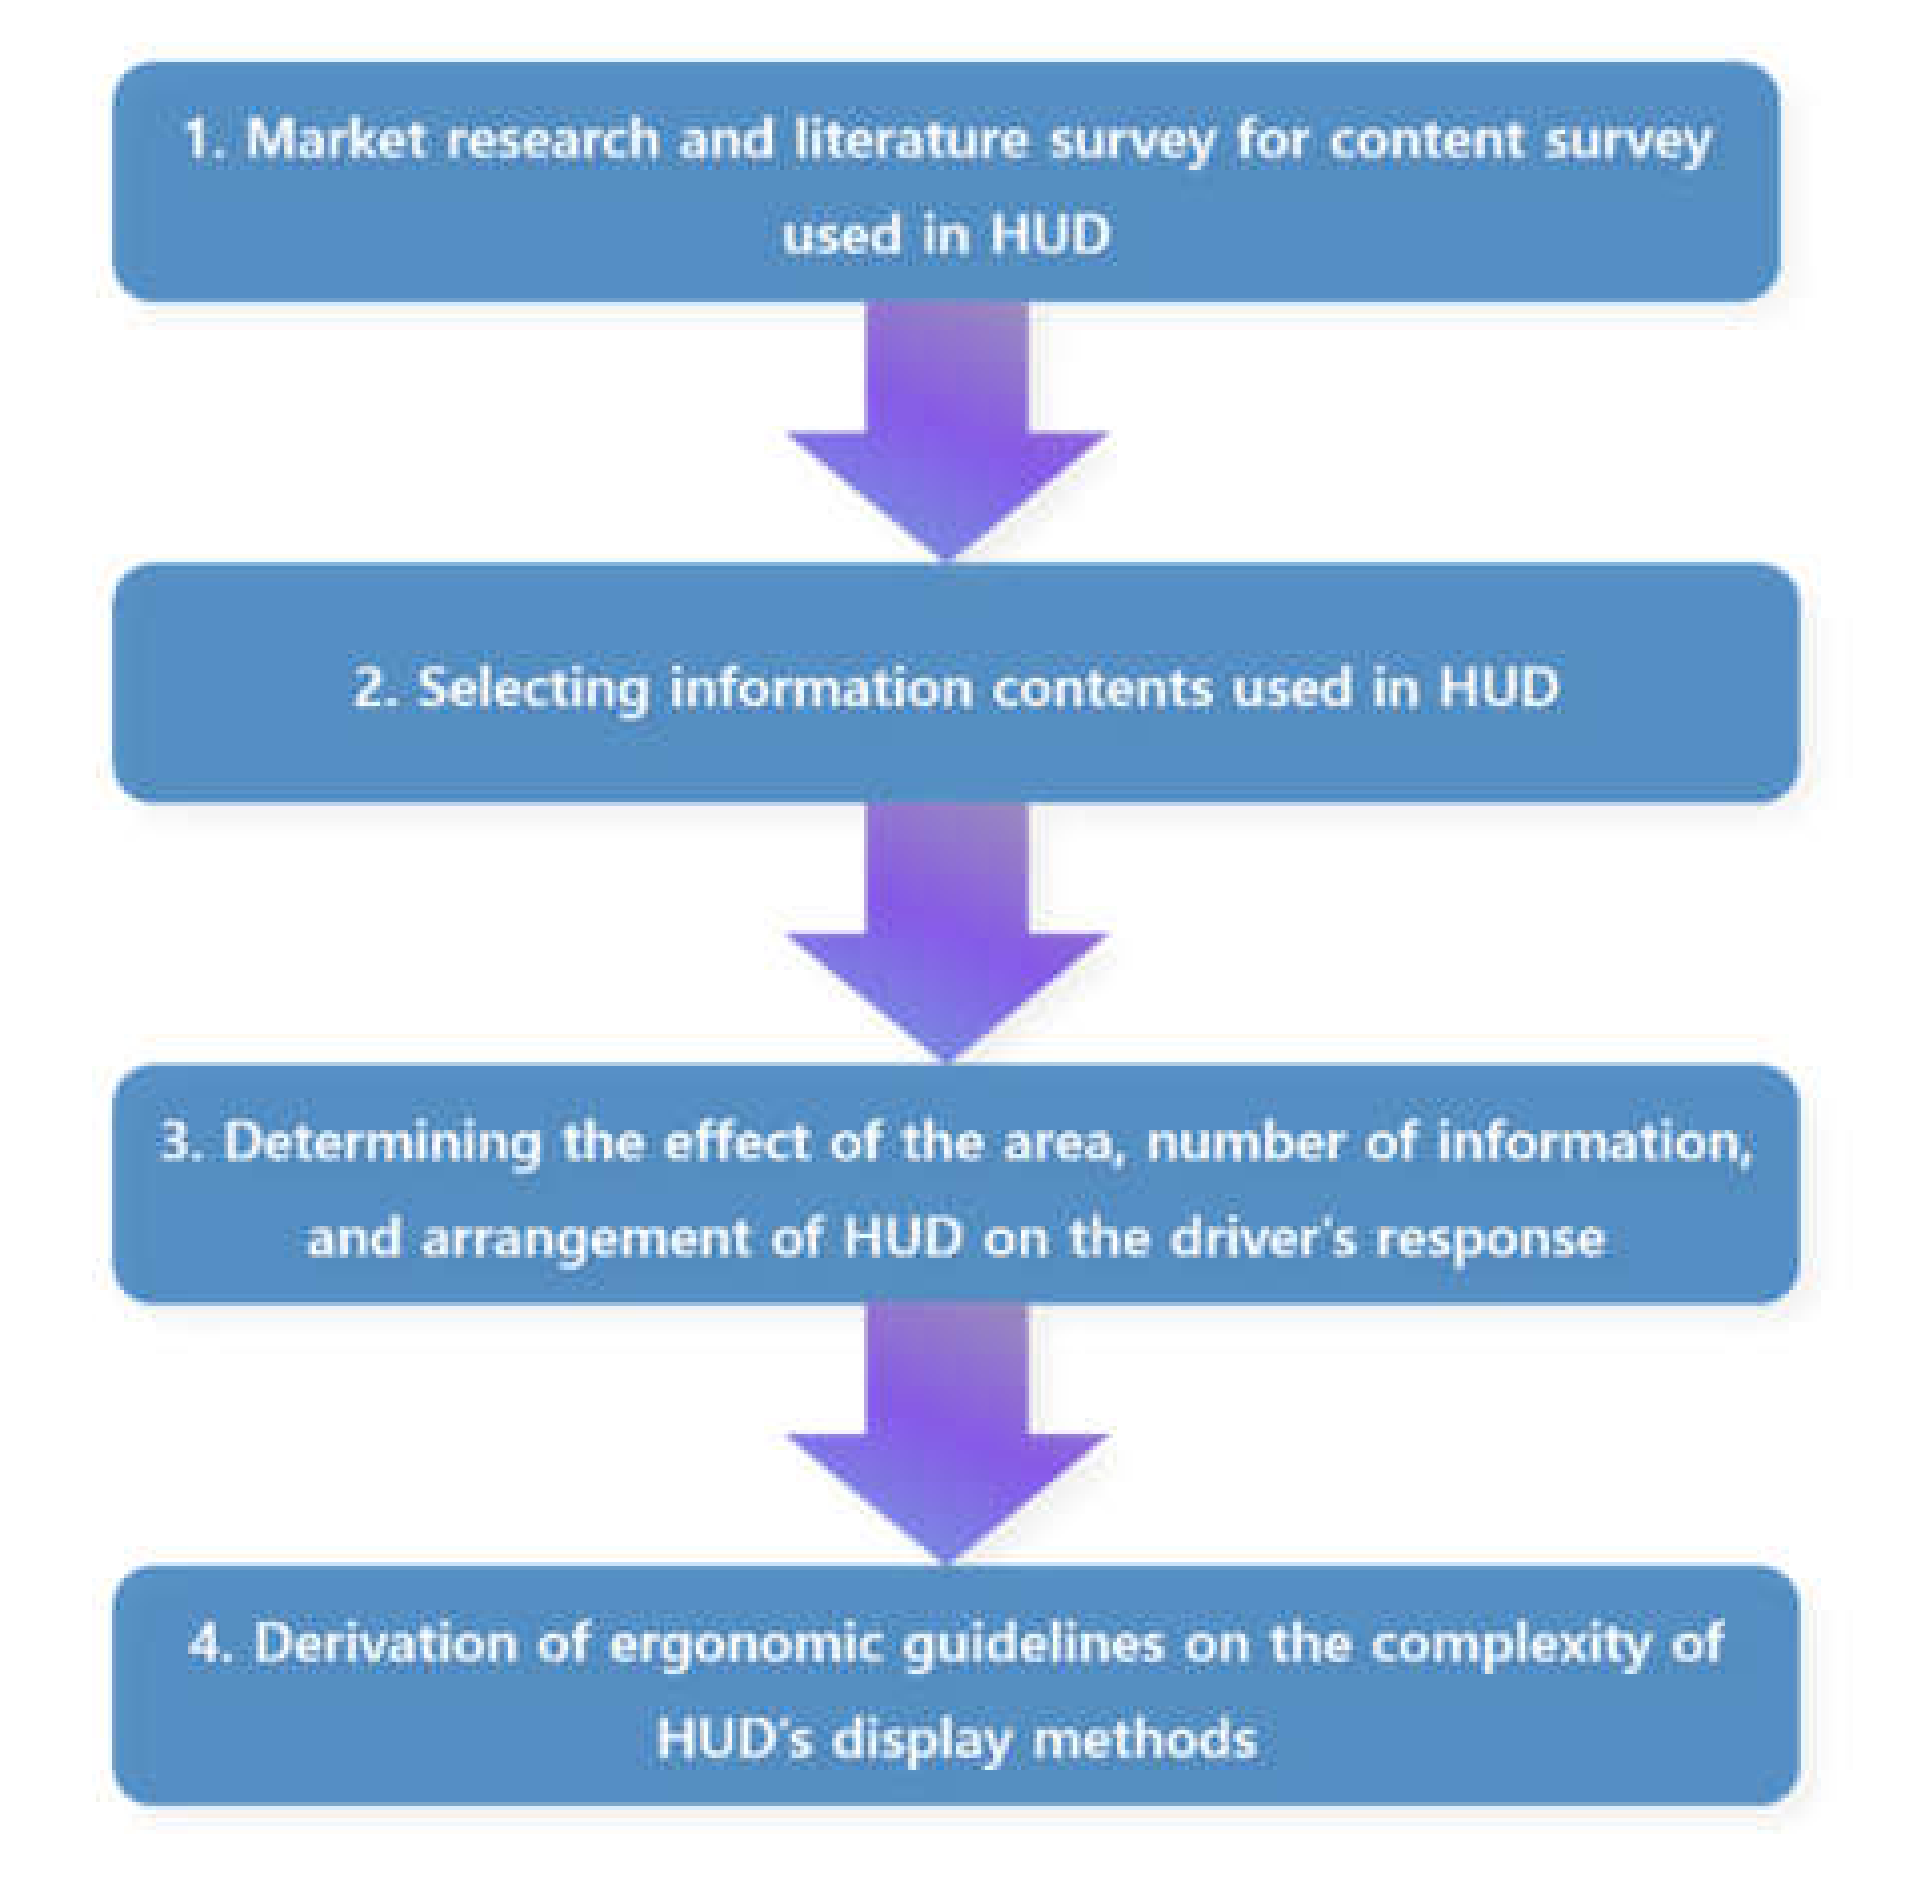
2. Research Objectives
3. First Experiment
3.1. Method
3.1.1. Participants
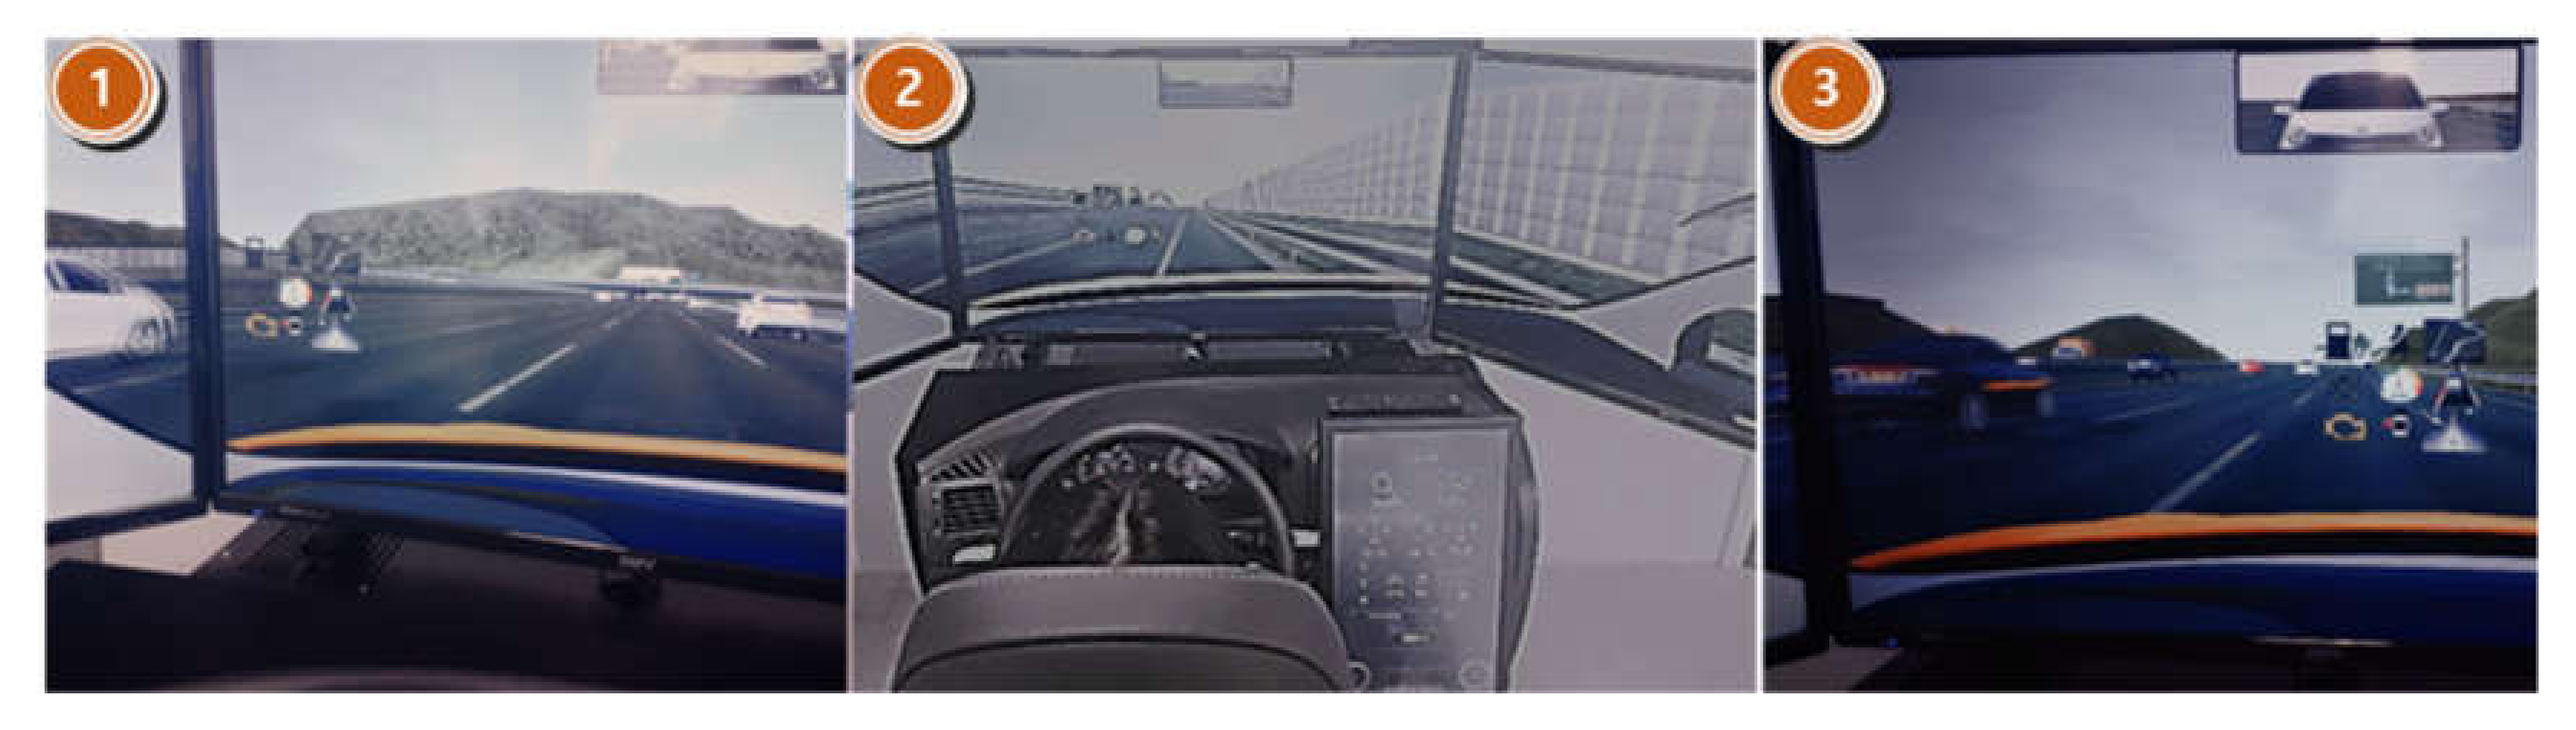
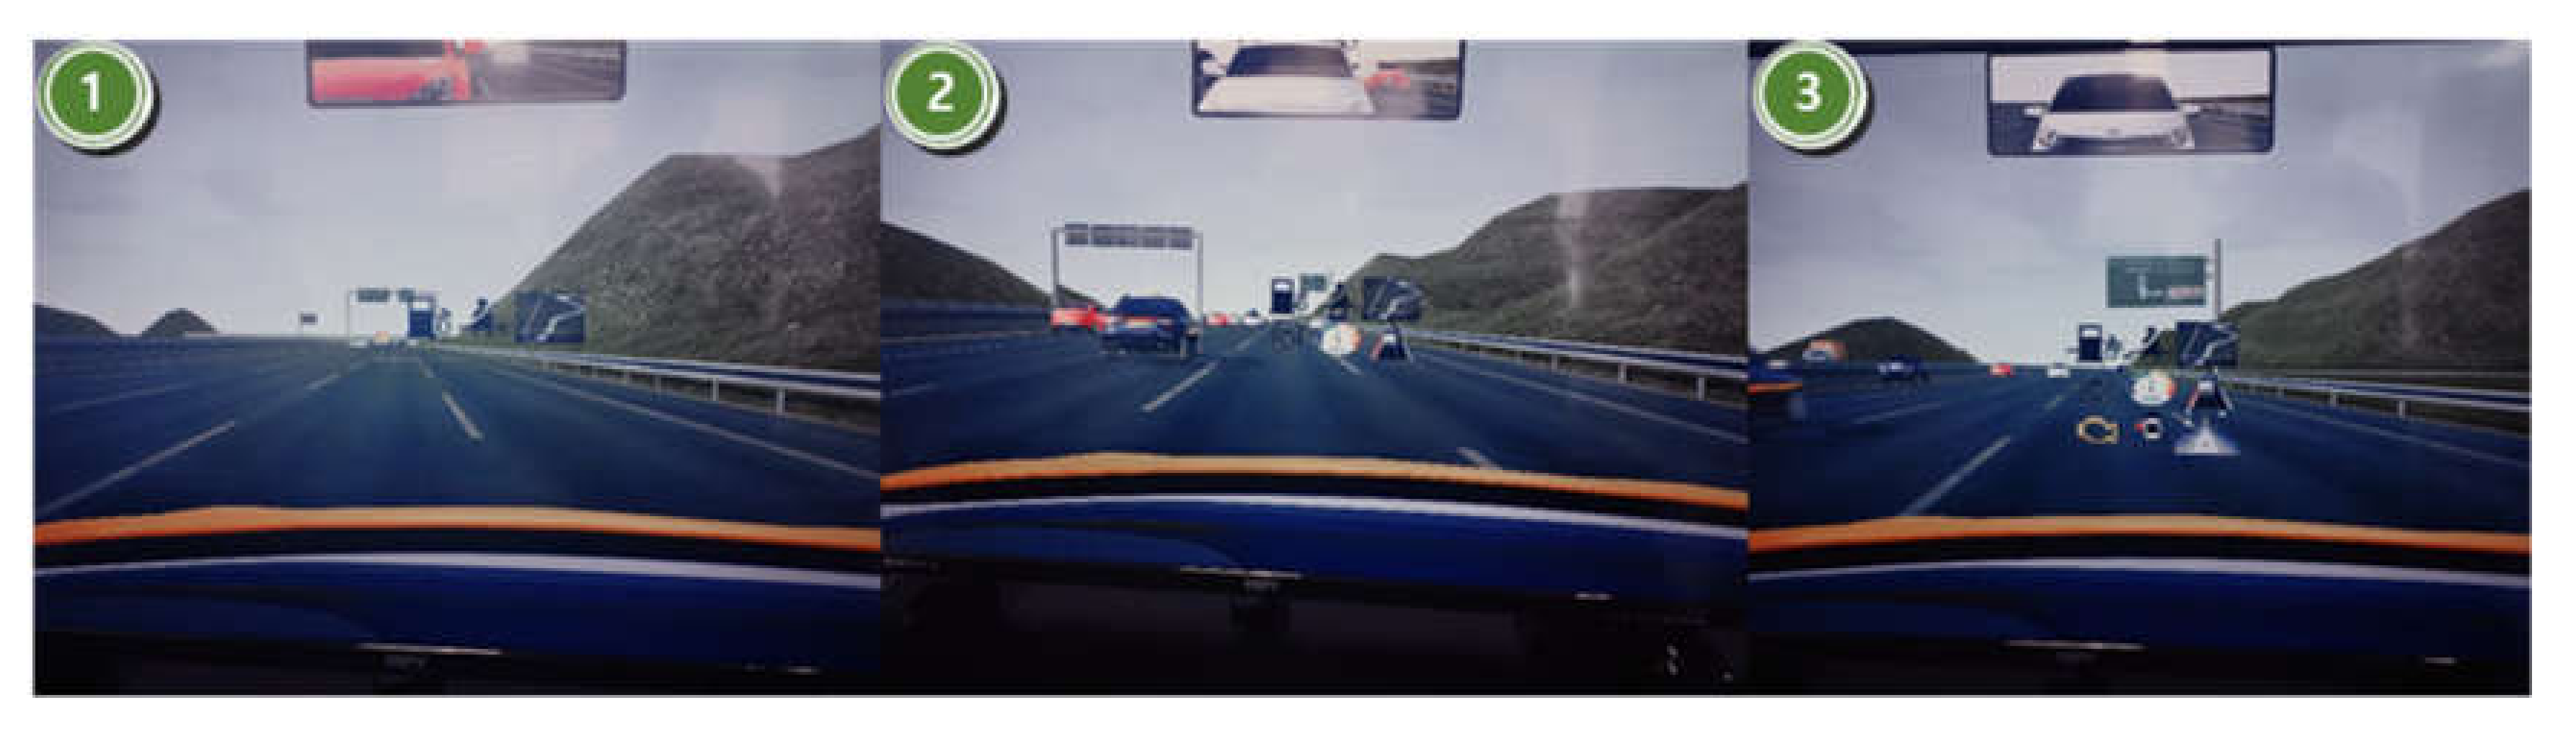
3.1.2. Apparatus
3.1.3. Experimental Design
3.1.4. Experimental Procedure
3.2. Results of First Test
3.2.1. Error Rate
3.2.2. Importance Level
4. Second Experiment
4.1. Method
4.1.1. Participants
4.1.2. Apparatus
4.1.3. Experimental Design
Experimental Variables
Dependent Variables
4.1.4. Experimental Procedure
4.2. Results of Second Test
4.2.1. Reaction Time
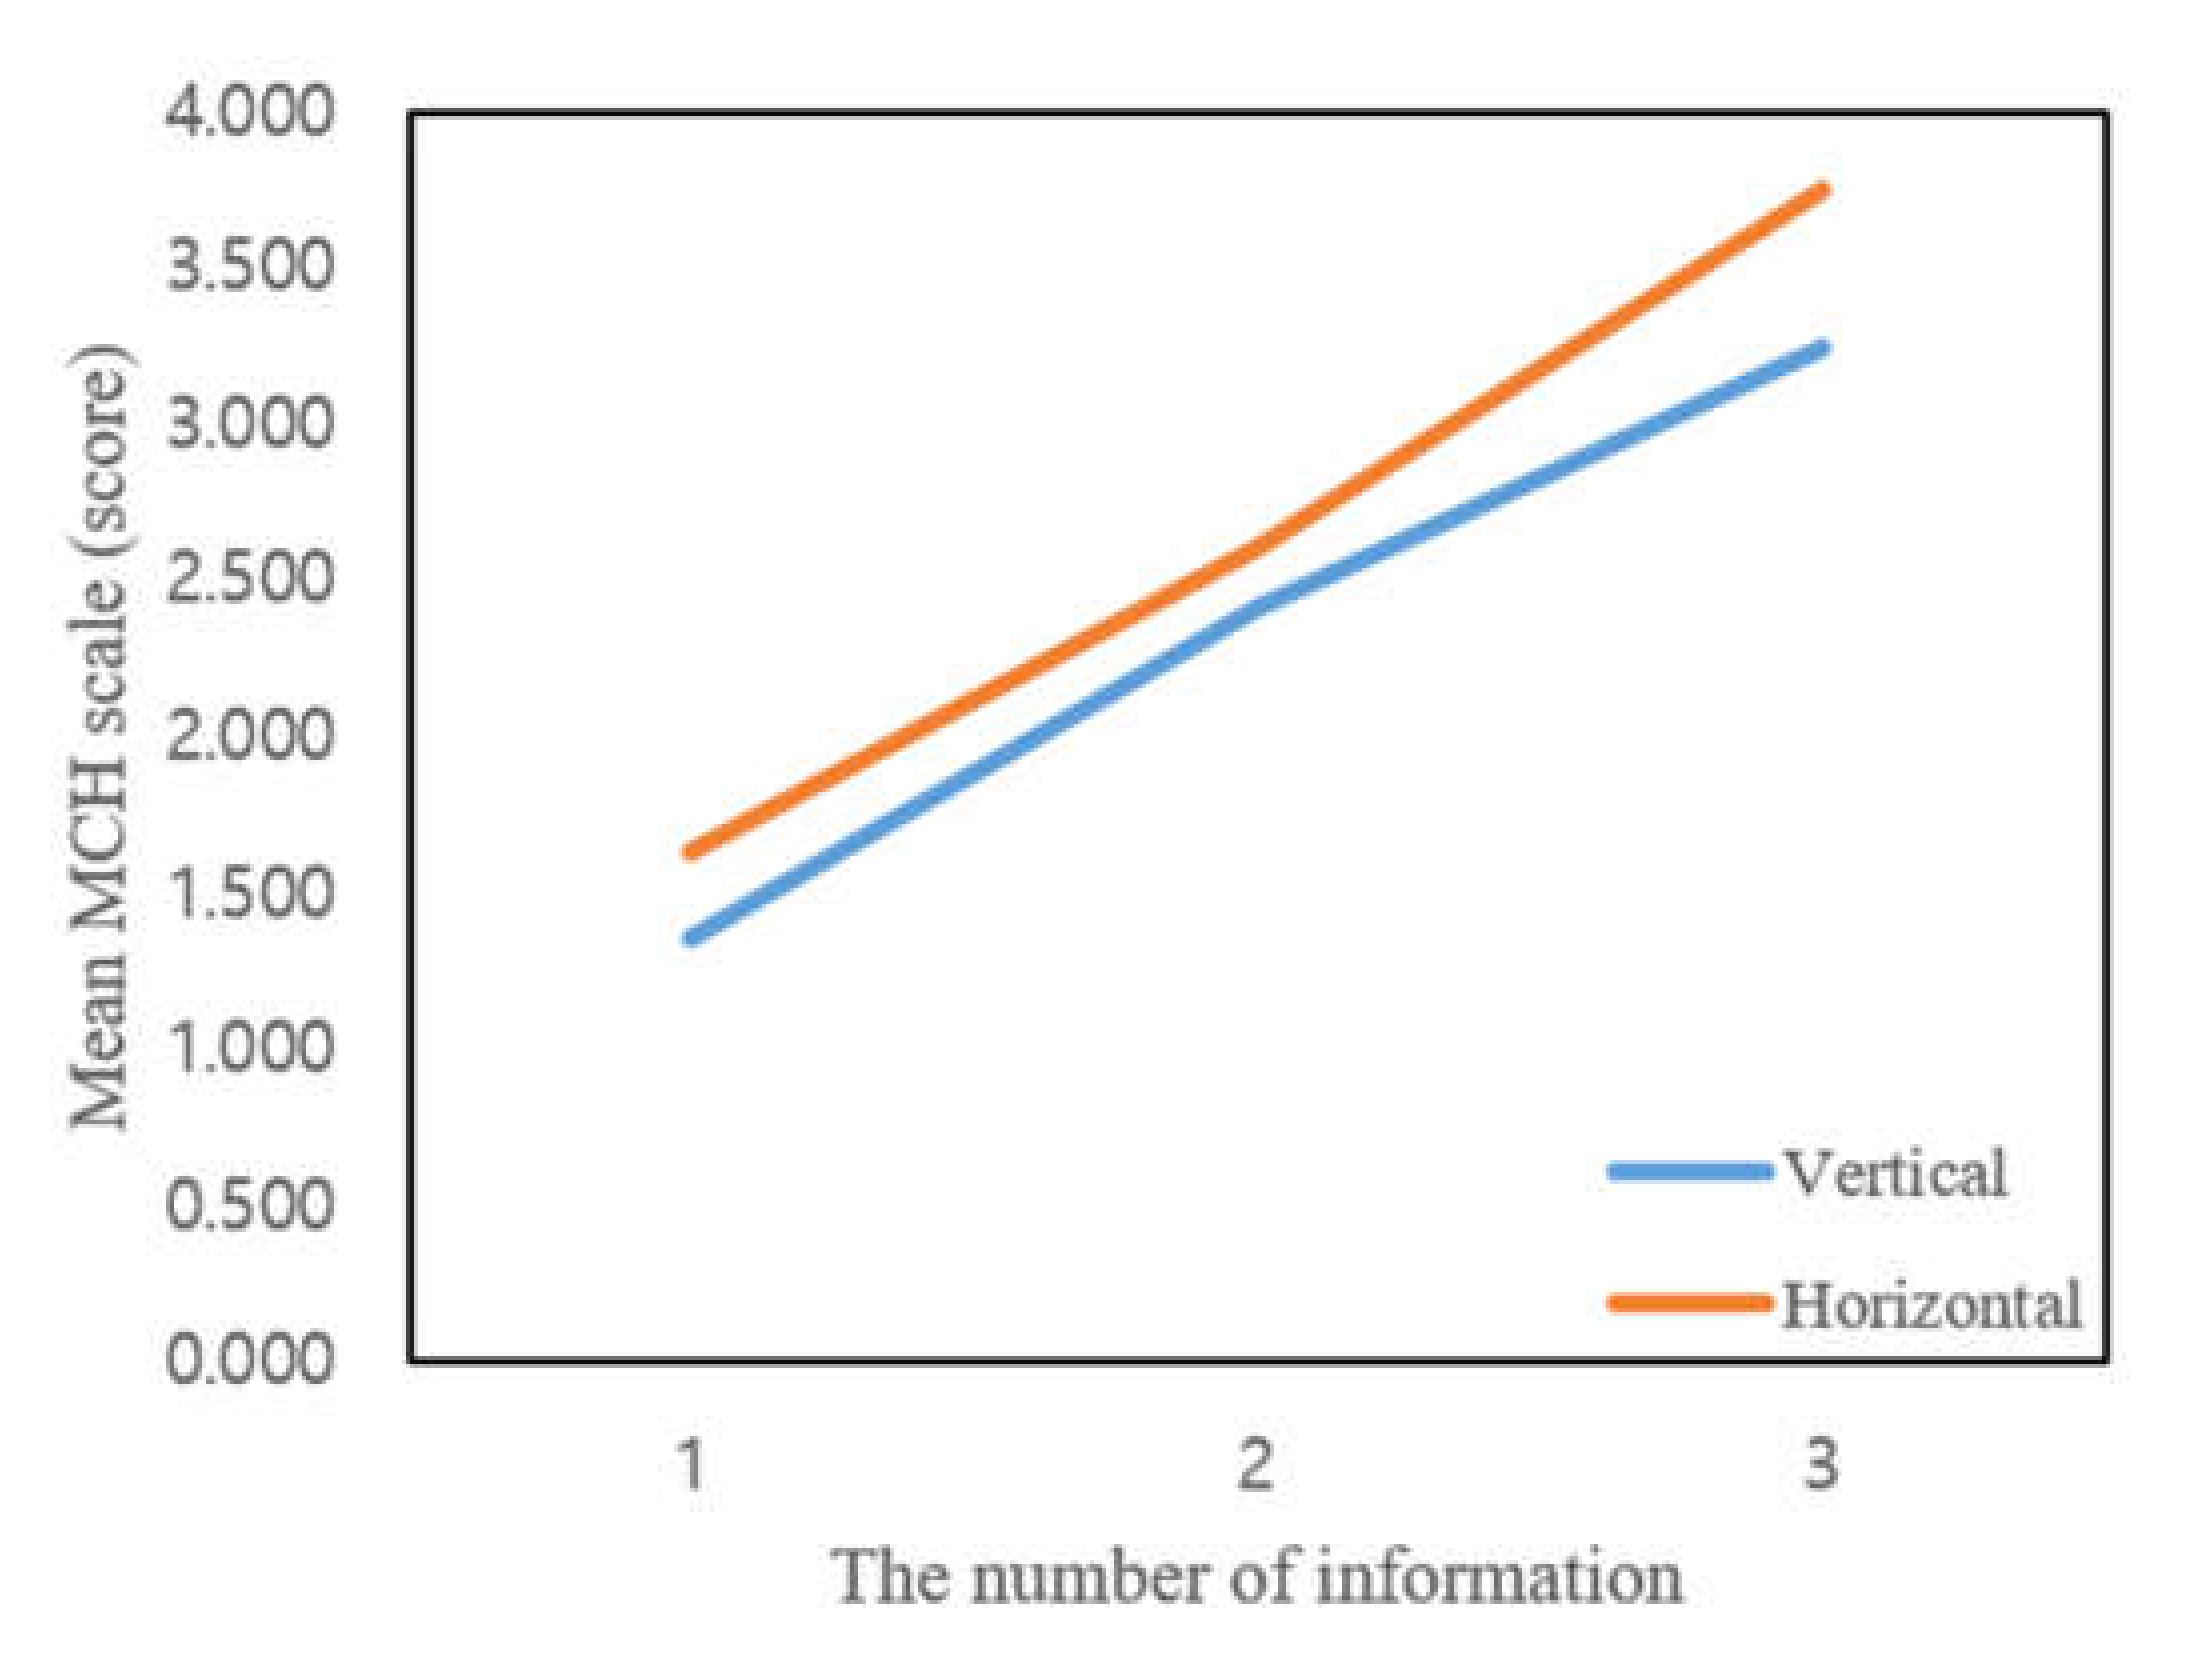
4.2.2. Subjective Workload
5. Discussion
6. Conclusions
Author Contributions
Funding
Conflicts of Interest
References
- Wagner, D.; Birt, J.A.; Snyder, M.D.; Duncanson, J.P. Human Factors Design Guide for Acquisition of Commercial-off-the-Shelf Subsystems, Non-Developmental Items, and Developmental Systems; No. DOT/FAA/CT-96/1; DOT, FAA Technical Center: Atlantic City, NJ, USA, 1996. [Google Scholar] [CrossRef]
- Kohlhaas, R.; Schamm, T.; Lenk, D.; Zöllner, J.M. Towards driving autonomously: Autonomous cruise control in urban environments. In Intelligent Vehicles Symposium (IV); IEEE: Gold Coast, Australia, 2013; pp. 116–121. [Google Scholar] [CrossRef]
- Gabbard, J.L.; Fitch, G.M.; Kim, H. Behind the Glass: Driver Challenges and Opportunities for AR Automotive Applications. Proc. IEEE 2014, 102, 124–136. [Google Scholar] [CrossRef]
- Lee, J.M.; Ju, D.Y. Prioritization analysis for contents sensibility evaluation of the future mobility. Korean J. Sci. Emot. Sensib. 2018, 21, 3–16. [Google Scholar] [CrossRef]
- Park, K.; Jung, E.S.; Im, Y. Affective Design of Automotive Center Fascia Display: Focused on Regional Preference. J. Ergon. Soc. Korea 2019, 38, 279–289. [Google Scholar] [CrossRef]
- SAE. Automated Driving: Levels of Driving Automation Are Defined in New SAE International Standard J3016; Society of Automotive Engineers: Warrendale, PA, USA, 2014. [Google Scholar]
- Tretten, P. Information Design Solutions for Automotive Displays: Focus on HUD. Ph.D. Thesis, Luleå Tekniska Universitet, Luleå, Sweden, 2011. [Google Scholar]
- Shahriar, S.T.; Kun, A.L. Camera-View Augmented Reality: Overlaying Navigation Instructions on a Real-Time View of the Road. In Proceedings of the 10th International Conference on Automotive User Interfaces and Interactive Vehicular Applications—AutomotiveUI, Toronto, ON, Canada, 23–25 September 2018; Volume 18, pp. 146–154. [Google Scholar] [CrossRef]
- Topliss, B.H.; Pampel, S.M.; Burnett, G.; Gabbard, J.L. Evaluating Head-Up Displays across Windshield Locations. In Proceedings of the 11th International Conference on Automotive User Interfaces and Interactive Vehicular Applications—AutomotiveUI, Utrecht, The Netherlands, 22–25 September 2019; Volume 19, pp. 244–253. [Google Scholar] [CrossRef]
- Häuslschmid, R.; Ren, D.; Alt, F.; Butz, A.; Höllerer, T. Personalizing Content Presentation on Large 3D Head-Up Displays. PRESENCE Virtual Augment. Real. 2019, 27, 80–106. [Google Scholar] [CrossRef]
- Large, D.R.; Kim, H.; Merenda, C.; Leong, S.; Harvey, C.; Burnett, G.; Gabbard, J. Investigating the effect of urgency and modality of pedestrian alert warnings on driver acceptance and performance. Transp. Res. Part F Traffic Psychol. Behav. 2019, 60, 11–24. [Google Scholar] [CrossRef]
- Kim, K.H.; Jang, J.C.; Han, S.C. Current Status and Prospect of Automotive Augmented Reality. In KEIT PD Issue Report; KEIT: Daegu, Korea, 2015; pp. 13–29. [Google Scholar]
- Häuslschmid, R.; Osterwald, S.; Lang, M.; Butz, A. Augmenting the Driver’s View with Peripheral Information on a Windshield Display. In Proceedings of the 20th International Conference on Intelligent User Interfaces ACM, Atlanta, GA, USA, 29 March–1 April 2015; pp. 311–321. [Google Scholar] [CrossRef]
- Brian, R. Vehicle Displays and Interfaces Symposium. Burton Manor Conference Center Livonia; Automotive IQ: Berlin, Germany, 2016. [Google Scholar]
- Beggiato, M.; Hartwich, F.; Schleinitz, K.; Krems, J.; Othersen, I.; Petermann-Stock, I. What would drivers like to know during automated driving? Information needs at different levels of automation. In Proceedings of the 7. Tagung Fahrerassistenzsysteme, Munich, Germany, 25–26 November 2015. [Google Scholar]
- Wickens, C.D.; Hollands, J.G.; Banbury, S.; Parasuraman, R. Engineering Psychology & Human Performance; Psychology Press: Hove, UK, 2015. [Google Scholar]
- Naujoks, F.; Purucker, C.; Wiedemann, K.; Marberger, C. Noncritical State Transitions during Conditionally Automated Driving on German Freeways: Effects of Non–Driving Related Tasks on Takeover Time and Takeover Quality. Hum. Factors 2019. [Google Scholar] [CrossRef]
- Bark, K.; Tran, C.; Fujimura, K.; Ng-Thow-Hing, V. Personal Navi: Benefits of an Augmented Reality Navigational Aid Using a See-Thru 3D Volumetric HUD. In Proceedings of the 6th International Conference on Automotive User Interfaces and Interactive Vehicular Applications, Seattle, WA, USA, 17–19 September 2014; pp. 1–8. [Google Scholar] [CrossRef]
- Schneider, M.; Bruder, A.; Necker, M.; Schluesener, T.; Henze, N.; Wolff, C. A field study to collect expert knowledge for the development of AR HUD navigation concepts. In Proceedings of the 11th International Conference on Automotive User Interfaces and Interactive Vehicular Applications Adjunct Proceedings—AutomotiveUI, Utrecht, The Netherlands, 22–25 September 2019; Volume 19, pp. 358–362. [Google Scholar] [CrossRef]
- Eyraud, R.; Zibetti, E.; Baccino, T. Allocation of visual attention while driving with simulated augmented reality. Transp. Res. Part F Traffic Psychol. Behav. 2015, 32, 46–55. [Google Scholar] [CrossRef]
- Rusch, M.L.; Schall, M.C.; Gavin, P.; Lee, J.D.; Dawson, J.D.; Vecera, S.; Rizzo, M. Directing driver attention with augmented reality cues. Transp. Res. Part F Traffic Psychol. Behav. 2013, 16, 127–137. [Google Scholar] [CrossRef] [Green Version]
- Na, J.Y.; Baek, S.D.; Heo, J.Y. Head-Up Display (HUD) Interface Design of Navigation co-nsidering User’s Decision Context. In Proceedings of the 5th HCI KOREA, Jeongsun, Kangwon, Korea, 8–10 Feburary 2017. [Google Scholar]
- Meixner, G.; Häcker, C.; Decker, B.; Gerlach, S.; Hess, A.; Holl, K.; Klaus, A.; Lüddecke, D.; Mauser, D.; Orfgen, M.; et al. Retrospective and future automotive infotainment systems—100 years of user interface evolution. In Automotive User Interfaces; Springer: Cham, Switzerland, 2017; pp. 3–53. [Google Scholar] [CrossRef]
- Park, K.B.; Jung, E.S.; Ban, K.M.; Im, Y.J. A Study about classification of the areas of Head-Up Display(HUD) on Driving. J. Ergon. Soc. Korea 2018, 37. [Google Scholar] [CrossRef]
- Von Sawitzky, T.; Wintersberger, P.; Riener, A.; Gabbard, J.L. Increasing trust in fully automated driving: Route indication on an augmented reality head-up display. In Proceedings of the 8th ACM International Symposium on Pervasive Displays—PerDis, Palermo, Italy, 12–14 June 2019; Volume 19, pp. 1–7. [Google Scholar] [CrossRef]
- Park, J.W.; Kim, J.; Park, J.; Lee, Y.J.; Lee, Y.J. Information Design of Smart Car Navigation based on Driving Context. In Proceedings of the 61th Transactions of the Korean Society of Automotive Engineers, Jeju, Korea, 19–21 May 2016. [Google Scholar]
- Park, K.B. A Study on the Type of Information Presentation for the Head Up Display in Passenger Vehicles. Master’s Thesis, Korea University, Seoul, Korea, 2019. [Google Scholar] [CrossRef]
- Hong, S.P.; Kim, S.M.; Park, S.J.; Jung, E.S. A Study on Designing of a Menu Structure for the Instrument Cluster IVIS using Taguchi Method. J. Ergon. Soc. Korea 2010, 29, 39–46. [Google Scholar] [CrossRef] [Green Version]
- Gu, B.R.; Ju, D.Y. Comparative Analysis of Requirements for Information Presentation on In-vehicle Display Systems by Driving Career. Korean Soc. Automot. Eng. 2016, 24, 668–676. [Google Scholar] [CrossRef]
- Lee, Y.H.; Yoo, H.S.; Pan, Y.H. Content Guidelines for Multi-Display User Experience in Autonomous Vehicles. J. Ergon. Soc. Korea 2017, 36. [Google Scholar] [CrossRef]
- Cho, Y. Augmented Reality (AR) Head-Up Display (HUD) Design Study for Prevention of Car Accident Based on Graphical Design, Sensitivity and Conveyance of Meaning. Arch. Des. Res. 2015, 28, 103–117. [Google Scholar] [CrossRef]
- Wu, H.; Shou, S. Automotive Cockpit Design 2020; Chalmers University of Technology Department of Product and Production Engineering Division of Design and Human Factors: Göteborg, Sweden, 20 November 2011. [Google Scholar]
- DIN EN ISO 15008. Straßenfahrzeuge—Ergonomische Aspekte von Fahrerinformations und Assistenzsystemen—Anforderungen und Bewertungsmethoden der Visuellen Informationsdarstellung im Fahrzeug; DIN Deutsches Institut für Normung: Berlin, Germany, 2009. [Google Scholar]
- Wierwille, W.W.; Casali, J.G. A validated rating scale for global mental workload measurement applications. In Proceedings of the 27th Human Factors Society Annual Meeting, 10–14 October 1983; Sage Publications: Norfolk, Virginia, USA; Volume 27, pp. 129–133. [Google Scholar] [CrossRef]
- Riener, A.; Kun, A.L.; Gabbard, J.; Brewster, S.; Riegler, A. ARV 2018: 2nd Workshop on Augmented Reality for Intelligent Vehicles. In Proceedings of the 10th International Conference on Automotive User Interfaces and Interactive Vehicular Applications—AutomotiveUI, Toronto, ON, Canada, 23–26 September 2018; Volume 18, pp. 30–36. [Google Scholar] [CrossRef]
- Tufano, D.R. Automotive HUDs: The Overlooked Safety Issues. Hum. Factors 1997, 39, 303–311. [Google Scholar] [CrossRef] [PubMed]
- Nicholas, J. Ward, Andrew Parkes, Head-up displays and their automotive application: An overview of human factors issues affecting safety. Accid. Anal. Prev. 1994, 26, 703–717. [Google Scholar]
- Gish, K.W.; Staplin, L. Human Factors Aspects of Using Head UP Displays in Automobiles: A Review of the Literature; DOT HS 808 320; NHTSA: Washington, DC, USA, 1995. [Google Scholar]
- Kun, A.L.; Tscheligi, M.; Riener, A.; van der Meulen, H. ARV 2017: Workshop on Augmented Reality for Intelligent Vehicles. In Proceedings of the 9th International Conference on Automotive User Interfaces and Interactive Vehicular Applications Adjunct—AutomotiveUI 2017, Oldenburg, Germany, 24–27 September 2017; Volume 75, pp. 47–51. [Google Scholar] [CrossRef]
- Jesus, V.; Gilberto, O.-G. Methodology for the design of automotive HUD graphical interfaces. DYNA 2018, 85, 161–167. [Google Scholar] [CrossRef]
- Park, J.; Cho, C.; Baek, S.; Park, W. Effect of automotive head-up display (HUD) imagery location on driver preference associated with use of scrolling list while driving. In Proceedings of the 19th Triennial Congress of the International Ergonomics Association, Melbourne, Australia, 9–14 August 2015. [Google Scholar]
- Morita, K.; Sekine, M.; Tsukada, Y.; Okada, T.; Toyofuku, Y. Consideration on Appropriate Display Area for Head-Up Displays; SAE Technical Paper No. 2007-01-3512; SAE: Warrendale, PA, USA, 2007. [Google Scholar] [CrossRef]
- Weintraub, D.J.; Haines, R.F.; Randle, R.J. Head-up display (HUD) utility, II: Runway to HUD transitions monitoring eye focus and decision times. In Proceedings of the 29th Human Factors Society Annual Meeting, Baltimore, MD, USA, 29 September–3 October 1985; SAGE Publications: Thousand Oaks, CA, USA; Volume 29, pp. 615–619. [Google Scholar] [CrossRef]
- Wittmann, M.; Kiss, M.; Gugg, P.; Steffen, A.; Fink, M.; Pöppel, E.; Kamiya, H. Effects of display position of a visual in-vehicle task on simulated driving. Appl. Ergon. 2006, 37, 187–199. [Google Scholar] [CrossRef]
- Nunes, A.; Wickens, C.; Yin, S. Examining the viability of the Neisser search model in the flight domain and the benefits of highlighting in visual search. In Proceedings of the 50th Human Factors and Ergonomics Society Annual Meeting, San Francisco, CA, USA, 16–20 October 2006; Sage Publications: Thousand Oaks, CA, USA; Volume 50, pp. 35–39. [Google Scholar] [CrossRef]
- Remington, R.W.; Johnston, J.C.; Ruthruff, E.; Gold, M.; Romera, M. Visual search in complex displays: Factors affecting conflict detection by air traffic controllers. Hum. Factors 2000, 42, 349–366. [Google Scholar] [CrossRef]
- Donkor, G.E. Evaluating the impact of Head-Up Display complexity on peripheral detection performance: A driving simulator study. Adv. Transp. Stud. 2012, 28, 5–16. [Google Scholar]
- Plavšic, M.; Duschl, M.; Tönnis, M.; Bubb, H.; Klinker, G. Ergonomic design and evaluation of augmented reality based cautionary warnings for driving assistance in urban environments. Proc. Int. Ergon. Assoc. 2009. [Google Scholar]
- Tonnis, M.; Klinker, G. Effective control of a car driver’s attention for visual and acoustic guidance towards the direction of imminent dangers. In Proceedings of the 2006 IEEE/ACM International Symposium on Mixed and Augmented Reality, Santa Barbard, CA, USA, 22–25 October 2006; pp. 13–22. [Google Scholar] [CrossRef]
- Doshi, A.; Cheng, S.Y.; Trivedi, M.M. A novel active heads-up display for driver assistance. IEEE Trans. Syst. Man Cybern. Part B Cybern. 2008, 39, 85–93. [Google Scholar] [CrossRef] [PubMed] [Green Version]
- Haeuslschmid, R.; Shou, Y.; O’Donovan, J.; Burnett, G.; Butz, A. First steps towards a view management concept for large-sized head-up displays with continuous depth. In Proceedings of the 8th International Conference on Automotive User Interfaces and Interactive Vehicular Applications, Ann Arbor, MI, USA, 24–26 October 2016; pp; pp. 1–8. [Google Scholar] [CrossRef]
- Liu, Y.C. Effects of using head-up display in automobile context on attention demand and driving performance. Displays 2003, 24, 157–165. [Google Scholar] [CrossRef]
- Wang, C.W.; Jung, H.Y.; Na, Y.J.; Min, S.D. Analysis of Brain activity quotient change of HUD location and Color. In Proceedings of the 46th Journal of Korean Institute of Electrical Engineers, Muju, Jeonbuk, Korea, 15–17 July 2015. [Google Scholar]
- Betancur, J.A. Physical Variable Analysis Involved in Head-Up Display Systems Applied to Automobiles. In Augmented Reality-Some Emerging Application Areas; InTech. ISO: Romana, Croatia, 2011; p. 690. [Google Scholar] [CrossRef] [Green Version]
- Kim, M.J.; Pan, Y.H. A Study on the relationship between cognitive level and size according to the importance of vehicle Head-Up Display channeled information. J. Korea Des. Knowl. 2015, 33, 163–170. [Google Scholar]
- Klauer, S.G.; Dingus, T.A.; Neale, V.L.; Sudweeks, J.D.; Ramsey, D.J. The Impact of Driver Inattention on Near-Crash/Crash Risk: An Analysis Using the 100-Car Naturalistic Driving Study Data; National Highway Traffic Safety Administration: Washington, DC, USA, 2006. [Google Scholar]
- Ulahannan, A.; Cain, R.; Thompson, S.; Skrypchuk, L.; Mouzakitis, A.; Jennings, P.; Birrell, S. User expectations of partial driving automation capabilities and their effect on information design preferences in the vehicle. Appl. Ergon. 2020, 82. [Google Scholar] [CrossRef] [PubMed]
- Ulahannan, A.; Jennings, P.; Oliveira, L.; Birrell, S. Designing an Adaptive Interface: Using Eye Tracking to Classify How Information Usage Changes over Time in Partially Automated Vehicles. IEEE Access 2020, 8, 16865–16875. [Google Scholar] [CrossRef]


| Categorization of factors | |||
|---|---|---|---|
| No. | Urgency | GDI (General Driver Information) | IVIS (In-Vehicle Information System) |
| 1 | Low window washer fluid | Speedometer | Excessive speed status |
| 2 | Low fuel level | Trip computer | Lane change help |
| 3 | Engine stall | Outside temperature | Road image at night or poor weather conditions |
| 4 | Oil pressure | Cruise control | External speed control |
| 5 | Anti-lock braking system (ABS) failure | Multimedia | Road hinders image |
| 6 | Low tire pressure | Phone | Navigator |
| 7 | Door is ajar | Buckle seatbelt reminder | Video of passengers |
| 8 | Malfunctioning light bulb | Which door is ajar | Status of driver |
| The Level of the Number of Information | Total Factor Quantity | Urgency | GDI | IVIS |
|---|---|---|---|---|
| 1 | 3 | 1 | 1 | 1 |
| 2 | 6 | 2 | 2 | 2 |
| 3 | 9 | 3 | 3 | 3 |
| Source | SS | df | MS | F | p |
|---|---|---|---|---|---|
| The number of information | 149.807 | 2 | 74.904 | 115.691 | <0.000** |
| Area of HUD | 6.001 | 2 | 3.000 | 5.037 | 0.016* |
| Arrangement of HUD | 12.097 | 1 | 12.097 | 34.612 | <0.000** |
| The number of information × area of HUD | 1.193 | 4 | 0.298 | 0.658 | 0.625 |
| The number of information × arrangement of HUD | 0.383 | 2 | 0.192 | 0.566 | 0.576 |
| Area of HUD × arrangement of HUD | 0.285 | 2 | 0.143 | 0.807 | 0.459 |
| The number of information × area of HUD × arrangement of HUD | 0.793 | 4 | 0.198 | 0.833 | 0.511 |
| Source | SS | df | MS | F | p |
|---|---|---|---|---|---|
| The number of information | 144.009 | 2 | 72.005 | 138.529 | <0.000** |
| Area of HUD | 9.509 | 2 | 4.755 | 3.883 | 0.036* |
| Arrangement of HUD | 5.671 | 1 | 5.671 | 5.037 | 0.046* |
| The number of information × area of HUD | 2.102 | 4 | 0.525 | 2.143 | 0.091 |
| The number of information × arrangement of HUD | 0.898 | 2 | 0.449 | 1.370 | 0.275 |
| Area of HUD × arrangement of HUD | 0.454 | 2 | 0.227 | 0.576 | 0.570 |
| The number of information × area of HUD × arrangement of HUD | 1.435 | 4 | 0.359 | 1.464 | 0.230 |
© 2020 by the authors. Licensee MDPI, Basel, Switzerland. This article is an open access article distributed under the terms and conditions of the Creative Commons Attribution (CC BY) license (http://creativecommons.org/licenses/by/4.0/).
Share and Cite
Park, K.; Im, Y. Ergonomic Guidelines of Head-Up Display User Interface during Semi-Automated Driving. Electronics 2020, 9, 611. https://doi.org/10.3390/electronics9040611
Park K, Im Y. Ergonomic Guidelines of Head-Up Display User Interface during Semi-Automated Driving. Electronics. 2020; 9(4):611. https://doi.org/10.3390/electronics9040611
Chicago/Turabian StylePark, Kibum, and Youngjae Im. 2020. "Ergonomic Guidelines of Head-Up Display User Interface during Semi-Automated Driving" Electronics 9, no. 4: 611. https://doi.org/10.3390/electronics9040611