1. Introduction
The phase, amplitude, and frequency of utility voltage are critical information for the operation of inverter-based distributed generators. Therefore, fast and accurate detection of these voltage parameters is essential to ensure good quality for the power supplied to the grid network. In this regard, the synchronization block of power converters should be able to quickly detect fault events in the grid, like voltage sags, to avoid the deep impact that they have on the estimated parameters of the grid voltage, which is especially strong for the case of the estimated frequency [
1].
There are several methods reported in the literature [
2,
3,
4] for obtaining the grid voltage parameters. Among them, the Second-Order Generalized Integrator–Frequency-Locked Loop (SOGI-FLL) is popular due to its simplicity of implementation and low computational requirements [
5,
6]. The SOGI-FLL behaves well under grid normal conditions and even with some amount of harmonic distortion. The behavior of the SOGI-FLL is well studied in the literature. In [
7,
8,
9], the SOGI-FLL was presented as the coupling between its two main parts, the SOGI and the FLL, whose dynamics correspond to that of a second-order system. However, the behavior of the SOGI-FLL is deeply perturbed by voltage sags, which produce high distortion peaks in the FLL response [
10,
11,
12].
A voltage sag, or dip, is defined by the IEEE 1159 as a short-time reduction in the grid voltage amplitude due to a fault in the line, which can be caused by a short circuit, overload, or starting of large motors [
13,
14,
15,
16]. A voltage sag can have a duration that can range from of 0.5 cycles to 1 min and can go from 0.9 per-unit (pu) to 0.1 pu in voltage magnitude. According to their duration, voltage sags are classified into three categories: instantaneous sags lasting from 0.5 cycles to 30 cycles, momentary sags from 30 cycles to 3 s, and temporary sags from 3 s to 1 min. If the sag lasts more than 1 min, it is classified as an undervoltage. In the same way, a voltage swell is defined as a short-time increase in the grid voltage amplitude due to a single line-to-ground fault or by the de-energization of a very large load, among other causes. Voltage swells are classified also into the same three categories made for voltage sags. Voltage swells can be instantaneous, from 0.5 cycles to 30 cycles and for voltage magnitudes that range from 1.1 pu to 1.8 pu; momentary, from 30 cycles to 3 s and for voltage magnitudes that range from 1.1 pu to 1.4 pu; and temporary, from 3 s to 1 min and for voltage magnitudes that range from 1.1 pu to 1.2 pu. The impact of strong voltage swells such as 1.8 pu in the SOGI-FLL estimated frequency is also high, as in the case of 0.2 pu voltage sags [
17,
18,
19,
20,
21].
To the authors’ knowledge, there are no papers in the literature dealing with the alleviation of the perturbations induced by voltage sags or swells in the SOGI-FLL estimated frequency. However, this distortion can be reduced by simply using a saturation block after the FLL, in order to restrict the output frequency between the grid boundaries where an unlimited time of operation is required, i.e., from 49 Hz to 51 Hz. So, once the frequency reaches one of the saturation bounds during a fault, it will return to normal operation after some recovering time from the fault disappearance.
As a first objective, we propose to further improve the SOGI-FLL response in the event of a voltage sag beyond the basic saturation approach described above. This is accomplished by modeling the system as a finite state machine (FSM) in which different states of the SOGI-FLL are identified. During the perturbation caused by the fault, the FSM algorithm moves through these different states, eventually returning to the normal operation state after the fault is gone. Then, different FLL gains are employed for each of the defined states, which are optimally tuned by a series of trial and error simulations and lead to a better and faster transient response after a voltage sag. The structure of the proposed FSM-based method is simple and only involves the addition of a small computational burden regarding the basic SOGI-FLL approach. Second, the same FSM algorithm is applied for voltage swells, due to the fact that they cause a perturbation in the frequency response that is symmetric and opposite to that of voltage sags. The response for a 1.8 pu voltage swell is like a mirror of the response to a 0.2 pu voltage sag [
21,
22,
23,
24,
25,
26,
27]. Consequently, the same FSM is applied to voltage swells with a few additional considerations that make the algorithm more versatile.
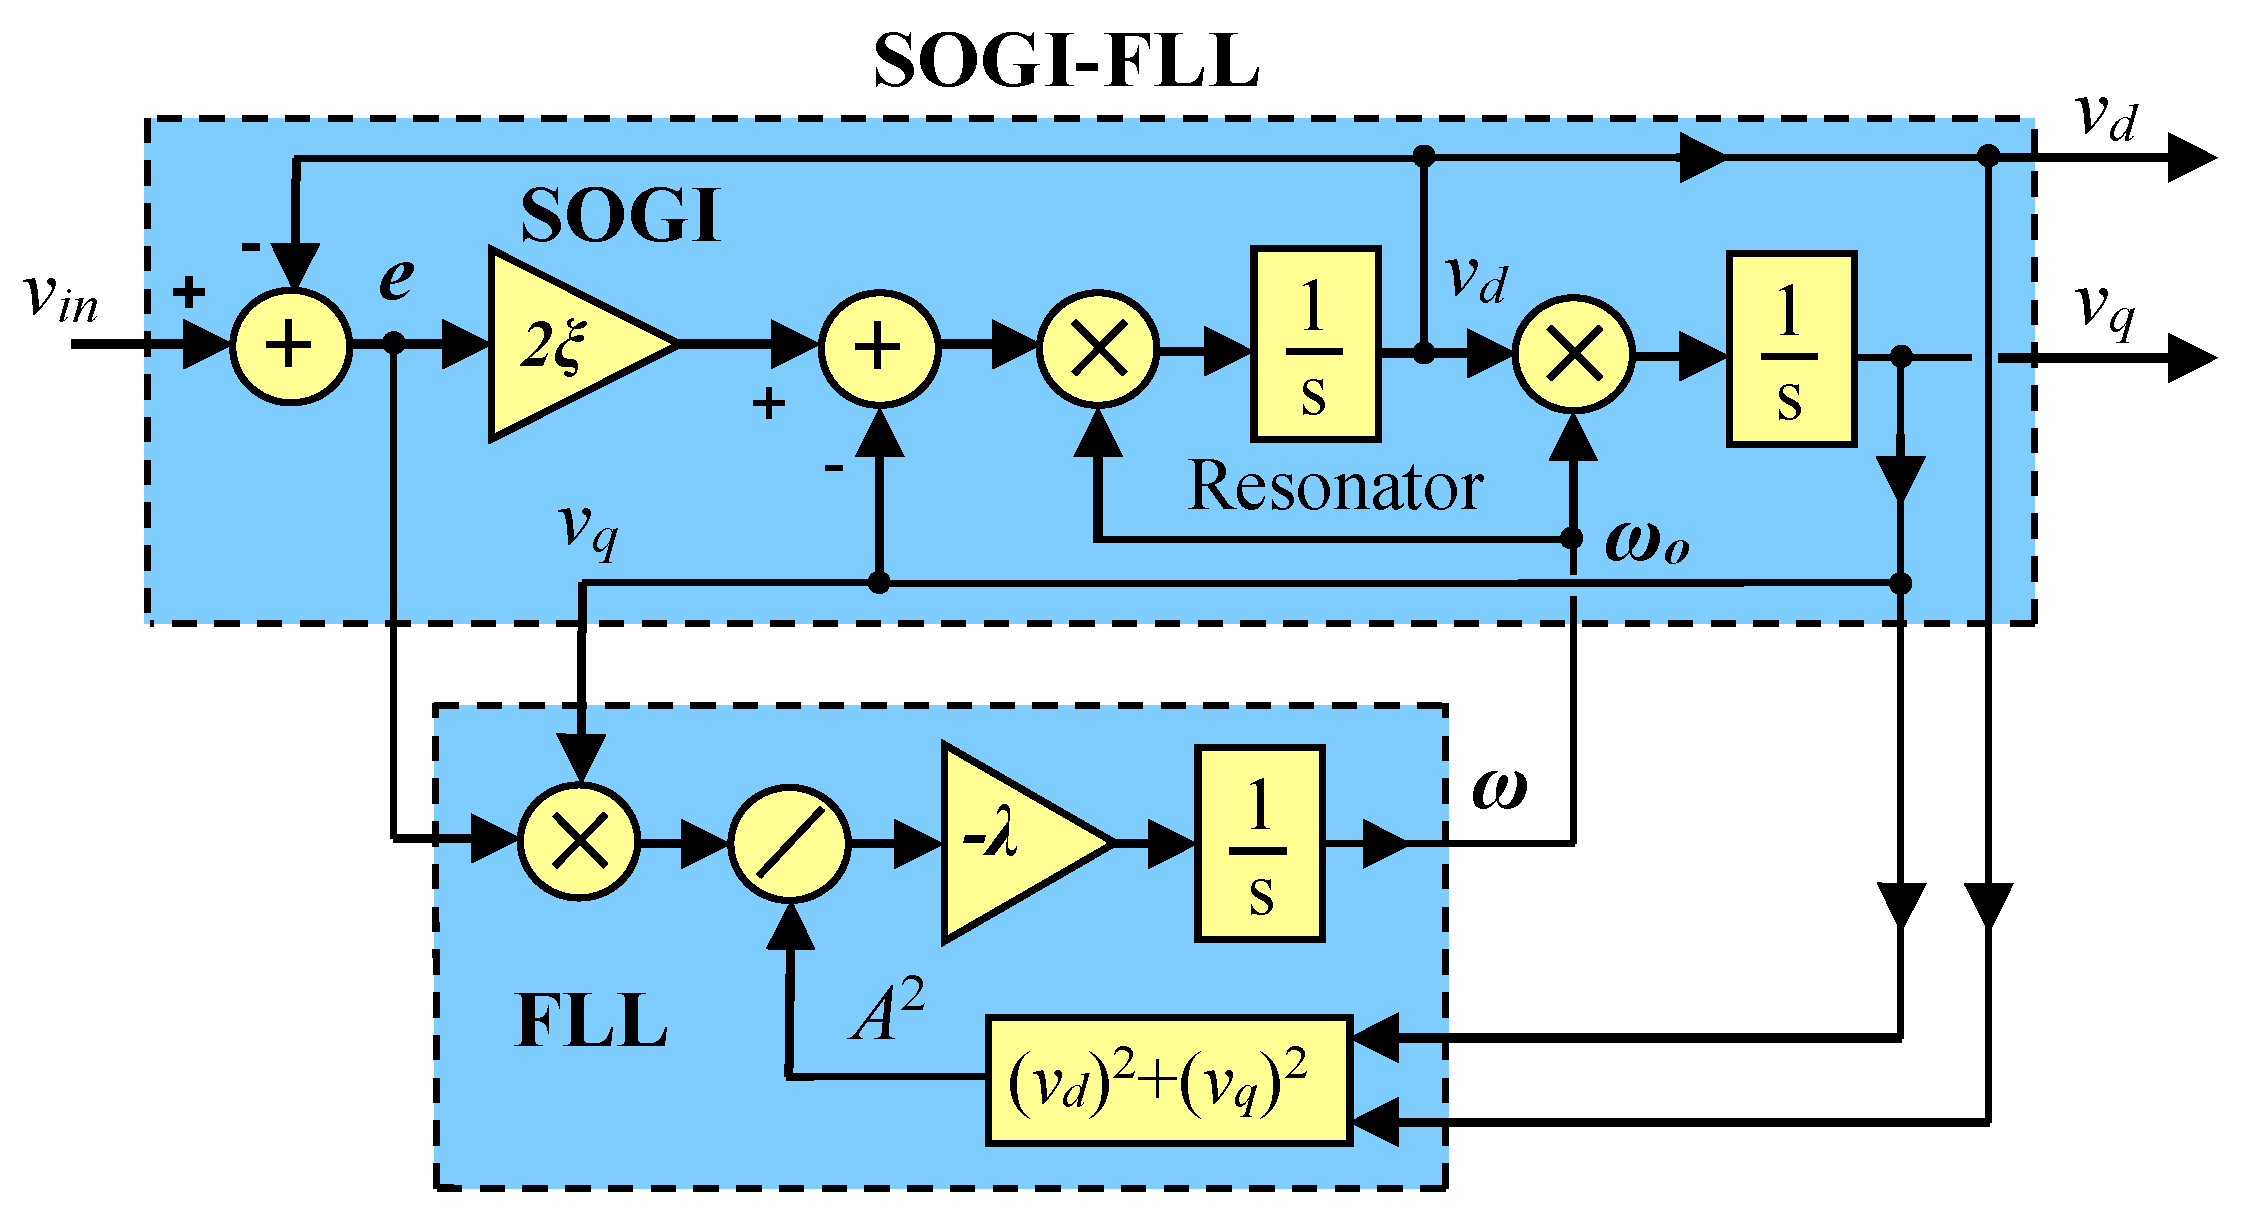
2. SOGI-FLL Response to Voltage Sags
The structure of the SOGI-FLL is shown in
Figure 1, where
is the input grid voltage,
is the center frequency of the SOGI filter,
and
are its in-phase and quadrature-phase outputs, and
is the FLL estimated grid frequency acting as the center frequency of the SOGI filter.
The SOGI has band-pass filter (BPF) behavior for
and low-pass filter (LPF) behavior for
, with their transfer functions defined as [
6]
The linearized model of the SOGI-FLL at a quasi-locked operating point has second-order dynamic behavior to a frequency change, described in [
2] as
where
is the grid frequency and
is its nominal value.
As seen in (3), the transient response of the estimated frequency to a change in the grid frequency is determined by the system parameters, i.e., the SOGI filter damping factor and the FLL gain . These same parameters are responsible for the estimated frequency behavior under whatever input voltage condition, either nominal or perturbed. In particular, the frequency response is greatly distorted in the case of voltage sag faults, exhibiting high nonlinear oscillating peaks.
For SOGI-FLL normal operation, these parameters are designed according to an inherent trade-off between the rejection of harmonic distortion at the SOGI outputs (1)–(2) and the transient response to frequency step perturbation in the grid voltage (3). An optimal value for the rejection of harmonics was used in [
2,
3] by choosing
for the SOGI gain. Also, an optimal damping factor of
was recommended in [
2] for the transient response to a frequency step perturbation. According to (3), this damping factor leads to FLL gain
, with
rad/s.
The response of the SOGI-FLL to a voltage sag depends on the moment when the fault happens. When the faults take place at non-zero input voltage, they first induce in the estimated frequency a transient peak above the 50 Hz nominal level, followed by a second transient peak below 50 Hz (see
Figure 2a). Conversely, when the faults happen only at zero crossing input voltage, they first produce a peak below 50 Hz, followed by another peak above 50 Hz (see
Figure 2b).
In the following, the responses in
Figure 2a,b will be referenced as type-a and type-b, respectively.
Figure 2 shows the responses to different voltage sag depths, namely, 20%, 40%, 60%, 80%, and 90%. Type-a sags happen at 0.195 s, when the grid voltage amplitude is negative, and type-b sags happen at 0.2 s, when the grid voltage is at zero crossing. A type-a sag response is also produced for positive values of grid voltage. The SOGI-FLL parameters are
and
(rad/s
2).
As seen in
Figure 2, type-a and -b voltage sags have a high impact on the estimated frequency that increases with the sag depth.
Figure 3 shows the evolution of the peak-to-peak amplitude of the estimated frequency distortion with the depth of type-a (upper subplot) and type-b (lower subplot) sags. Note that in both cases the perturbation trend is nonlinear but increases with the sag depth. Also, it is worth mentioning that although type-b voltage sags induce higher distortion in the estimated frequency, their likelihood of occurrence is much lower than that of type-a faults.
In view of
Figure 2, the SOGI-FLL performance could be improved by limiting the estimated frequency distortion, which would allow faster system recovery after the fault. A straightforward solution to achieve this could simply be to saturate the estimated frequency at the boundaries where continuous or unlimited time of operation is required in the grid network (49 Hz and 51 Hz, respectively, for European grid codes), which is explained next.
4. FSM Modification for Grid Frequency Tracking and Response to Grid Harmonics
The FSM was initially designed and simulated working at a constant 50 Hz grid nominal frequency, with fixed saturation bounds at ±1 Hz relative to the nominal value (or ±2π rad/s). Therefore, the FSM could not work properly when the grid frequency is outside these boundaries. The FSM scheme was then modified to be able to track the grid frequency changes. The modification can be seen in
Figure 12 and consists of including an LPF in the path supplying the estimated grid frequency
ω to the FSM. The LPF is first-order and has the following transfer function:
where
is the LPF output and
is its cutoff frequency (rad/s).
The LPF was designed to have a low cutoff frequency with the purpose of achieving the average of the estimated frequency, i.e.,
where <–> denotes the average. Then, the LPF transient response is slow and serves as an analog memory of the value that the estimated grid frequency ω had just before the fault event. The
signal was introduced as a new input to the FSM and is used for defining the saturation bound levels, which are now variable. The saturation bounds are determined during normal operation of the FSM, at state S1, and are defined as
where
. and
are the FSM upper and lower saturation bounds (rad/s).
The functioning of (8), (9) can be well understood using the time response depicted in
Figure 13, which shows the FSM and
transient responses to an 80% depth voltage sag happening at t = 0.195 s. The LPF had a cutoff frequency of
rad/s.
In
Figure 13, it can be seen how
very quickly reaches the upper saturation bound
at the end of the time interval from 0.1950 s to 0.1964 s, during which the FSM is in the S1 normal operation state. At this point (t = 0.1964 s),
and the FSM state changes from S1 to S3. It is also at this moment that the value of
is stored in an inner memory variable named
for later use. Then,
is defined as
According to
Figure 13,
rad/s and
rad/s. Note that
is slightly away from the nominal
50 rad/s value, which supposes that
is a little bit displaced from the ideal value of
·51 rad/s. However, the effect over the behavior of
is negligible.
Consequently, the fixed upper 51 Hz and lower 49 Hz saturation bounds employed in
Figure 6 are replaced by the new saturation variables
and
determined by (8) and (9), respectively, which are stored in inner variables.
Moreover, the return of the FSM to the normal operating conditions state S1, defined in
Figure 6 for the transitions from S4 to S1 and from S5 to S1, has also changed. Now,
is used instead of
as center of the
narrow band, i.e.,
Then, when
is confined within these bounds, the
counter is started and the return to S1 is decided if
. The counter
is reset when
leaves the band, which can happen due to unexpected interference or to the presence of huge levels of harmonic distortion in the grid. Otherwise, in normal conditions,
progressively stabilizes, the counter
starts to count when condition (11) is met, and the FSM returns to state S1 when
. The value of
can be set to adjust the time needed to return to the normal operation state once the band
Δ has been reached. Upon return to state S1, the integrator of the LPF is initialized to the actual grid frequency, i.e.,
(see
Figure 13c), which supposes that the system is ready again to face a new fault.
Finally,
Figure 14 depicts the results obtained when considering three different scenarios which have in common the occurrence of an 80% depth voltage sag at
. In the first scenario, the grid frequency goes from 50 Hz to 50.5 Hz at
(blue line), while it remains at 50 Hz in the second scenario (red line) and goes down to 49.5 Hz also at
in the third scenario (green line). It can be seen how the FSM algorithm is able to follow the step frequency changes and the voltage sags properly. Also, the FSM keeps a saturation band of
Hz on the grid frequency.
The same modification explained in this section for tracking the grid frequency changes allows the system to respond to faults happening in grid networks distorted by harmonics.
Figure 15 shows the behavior of
and
when an 80% depth voltage sag takes place at t = 0.195 s in a grid distorted by a 5th harmonic with 3% amplitude.
It can be seen in
Figure 15 how the FSM can work properly with the distorted grid voltage. The condition for being able to handle harmonic distortion is that the peak-to-peak amplitude
of the distortion in the grid frequency should be less than the boundary width, i.e.,
Then, the setting of the value for the boundary should take into consideration the maximum harmonic distortion that the FSM has to face. Also, a proper value for should be chosen to determine a reasonable time for returning the state of the FSM to S1.
5. Swell Fault and Short Transient Response Capability
Figure 16 depicts the response of the SOGI-FLL to voltage swell perturbations ranging from 1.1 pu to 1.8 pu, with optimal parameters
and
rad/s
2. This figure shows that swell perturbations have a different distortion impact than voltage sags on the SOGI-FLL estimated frequency.
Notice in
Figure 16 that for swells happening at non-zero input voltage moments (type-a), the perturbations almost do not reach the
saturation bounds in almost all cases. So, for type-a swells, the FSM will not act. However, for swells happening at zero voltage (type-b), the perturbations surpass the established
bounds for fault levels ranging from 1.3 pu to 1.8 pu, and the FSM can be applied to these cases to improve the response.
In conclusion, for type-b swells ranging from 1.3 pu to 1.8 pu,
will reach
and the FSM can be applied in the same way that it was applied for voltage sags, provided that the variable
defined in (4) is appropriately modified. For instance, a 1.3 pu swell can be treated by the FSM like a voltage sag of 30% depth if the variable
is set to
pu. In the same way, a 1.8 pu swell can be treated by the FSM as a sag having
, or 80% depth. Therefore, the FSM can be applied to voltage sags and swells in the same way by using the following relation instead of (4):
where
holds for voltage sags and
for voltage swells, and abs(–) represents the absolute value function. The block diagram depicted in
Figure 17 clarifies this issue well and is used in the algorithm to differentiate a voltage sag from a voltage swell.
The FSM from here on incorporates the algorithm of
Figure 17 and uses Equation (13) to respond in the same way to voltage sags or swells.
Figure 18 illustrates the response of the SOGI-FLL-FSM to several voltage swells (
Figure 18a,b) and sags (
Figure 18c,d) with different durations. Fault events in
Figure 18a,c extend for four cycles, while those in
Figure 18b,d do so for two cycles, which correspond to the shorter event duration that does not result in overlapped transients at the beginning and at the end of the faults. As fault transients, we consider here the event of a voltage swell or sag and recovery to nominal grid voltage in a short time.
In
Figure 18a,b, the swells rise to 1.8 pu and then return to 1 pu. In
Figure 18c,d, the sags go down to 0.2 pu and then return to 1 pu. Notice in these figures that the FSM can respond well to both type of faults, which can improve the capability to respond to short-time-duration transients.
Finally, the SOGI-FLL-FSM response to the same voltage sag as that in
Figure 18d is shown in
Figure 19 when the grid voltage is affected by a 5th harmonic distortion with 4% amplitude. Notice in this figure that the response is similar to that achieved in
Figure 18d, but in this case the harmonic distortion is reflected in the estimated frequency response.
6. Discussion
In this paper we aimed to improve the response of the SOGI-FLL to voltage sags since it is highly sensitive to this kind of fault. We first showed the scope of this problem for a given set of gain parameters. Then, we proposed a simple solution by using a saturation block placed after the FLL integrator to limit the frequency response to the grid operating bounds of 51 Hz and 49 Hz. After that, we proposed an FSM as a way to operate with different SOGI-FLL gains through the pattern developed by the system frequency response to the fault. A set of five stages was identified in the frequency response of the SOGI-FLL to a voltage sag fault. These stages were used to construct an FSM algorithm. The FSM was designed to work on two types of patterns that were identified in the frequency response: type-a and type-b patterns, caused by faults happening at no zero crossing and at zero crossing of the grid voltage, respectively. The FSM allows for defining different SOGI-FLL gains for the different FSM states, according to the fault pattern. The response of the SOGI-FLL was then optimized by a series of trial and error simulations in order to achieve the best responses to given voltage sags with depths ranging from 40% to 90%. Analytical functions relating the system parameters to the sag depths were fitted to the gains obtained by this procedure, facilitating operation with any voltage sag depth. Finally, simulations proved the feasibility of this method that improves the response of the SOGI-FLL to voltage sags and reduces the recovery time involved in the transient perturbation. Moreover, an LPF was incorporated into the defined FSM in order to track the grid frequency changes, including harmonic distortion. Finally, the FSM was also applied to voltage swells, showing that it is able to handle both kind of faults: sags and swells. More research should be performed in order to reduce the number of stages of the FSM and simplify the overall structure. Further research should be performed regarding several aspects, such as applying more elaborate tuning methods for the SOGI-FLL-FSM, which is a nontrivial task due to the increased nonlinearity introduced by the saturation and the highly transient nature of the analyzed sag and swell perturbations. Research should also be performed regarding the introduction of the error signal of the SOGI structure into the FSM algorithm in order to accelerate the response to a fault and reduce the time response. Moreover, the FSM idea can be applied to other grid monitoring approaches and its performance assessed compared with the actual approach.


