Abstract
The operation of the subway would change the distribution of the ground potential along the rail, forming a DC loop through the grounding points in a nearby regional power grid and threatening the operational safety of the power system. In this paper, a new DC potential distribution calculation method along the subway is firstly proposed. Secondly, a grid grounding DC loop model is built on the foundation of the stray current principle. Thirdly, factors affecting the current in the grid are also presented and discussed based on the grounding loop model. Finally, a subway operation simulation platform is set up in a laboratory to simulate the operation of subway in situation, and the rationality of the model presented in this paper has been effectively verified.
1. Introduction
Mass transit is becoming more and more popular in the transportation system. It has significant advantages due to its large carrying capacity, high speed and safety [1]. The developing mass transit has become more closely linked to the power grid. The DC traction power supply system is commonly used in subways with steel rails as a return path [2,3]. It is not absolutely insulated between the rail and soil after a long period of operation, which causes stray current flow, resulting in non-uniform potential distribution along the rail [4,5,6,7,8,9]. Potential difference between grounding positions in an interconnected power system causes DC intrusion into power system. DC intrusion has impacts on transformers in the regions near the rail, causing DC bias, transformer loss and other undesirable phenomena [10,11,12]. The DC bias of a transformer generates noise, vibration, and partial over-heating, which endangers the safety of the power system. It is of practical significance to do research on the influence of subway stray current on transformers of urban power grids to explore the treatment plan.
In the past few years, considerable attention has been paid to the effects of DC intrusion into the power system [13]. The issue of DC intrusion has been studied in two aspects, including the direct current transmission aspect and the geomagnetic induction current aspect. Pan Zhuohong et al. proposed that the impedance distribution between substations was a critical parameter for determining direct current distribution, and the relationship between DC invading current and grounding grid size was quantified by proposing a computational model [14]. It was found by Yan Xudong and other researchers that the direct current of the power supply side was mainly affected by the primary side of the transformer, while the path of direct current and the equivalent resistance distribution characteristics of the DC network were affected by the receiving power grid in DC transmission [15]. Zhao Jie studied the influence of the ground line on the direct current distribution and concluded that the presence of the ground line had little effect on the transformer neutral point current [16]. Liu Shili and other scholars studied the influence of a HVDC transmission system on the traction transformer in the electrified railway power supply system by establishing a simulation model in CDEGS [17].
Although some encouraging progress have been made, the problem of DC intrusion caused by subway operation is less successful and still requires further research. There are few studies on DC intrusion caused by subways from the circuit perspective. The DC intrusion caused by subway has different influence law in comparison to the DC intrusion caused by long distance direct current transmission in the power grid and thus it is worthwhile to devote much effort to this area [18,19,20,21,22,23].
In this paper, the theoretical analysis of grounding current distribution in the regional power grid around the subway is proposed. Based on the horizontal two-layer soil model, the mathematics of calculating the potential distribution along the rail are proposed on the foundation of Green’s function principle. Based on the subway operation circuit model and power system model, a DC current loop is established to solve the influence of stray current to the power grid through the node-voltage method. Each parameter in the circuit is given according to the actual project, and a relevant simulation tool is used to explore the influence law of the subway operation on the regional power grid. By comparing the calculation result of the model and the simulation result, the rationality of the DC model proposed in this paper is verified. A relative experiment is designed to verify the rationality of the research in this article.
2. Theoretical Analysis of DC Intrusion in Nearby Power Grid Caused by Subway Operation
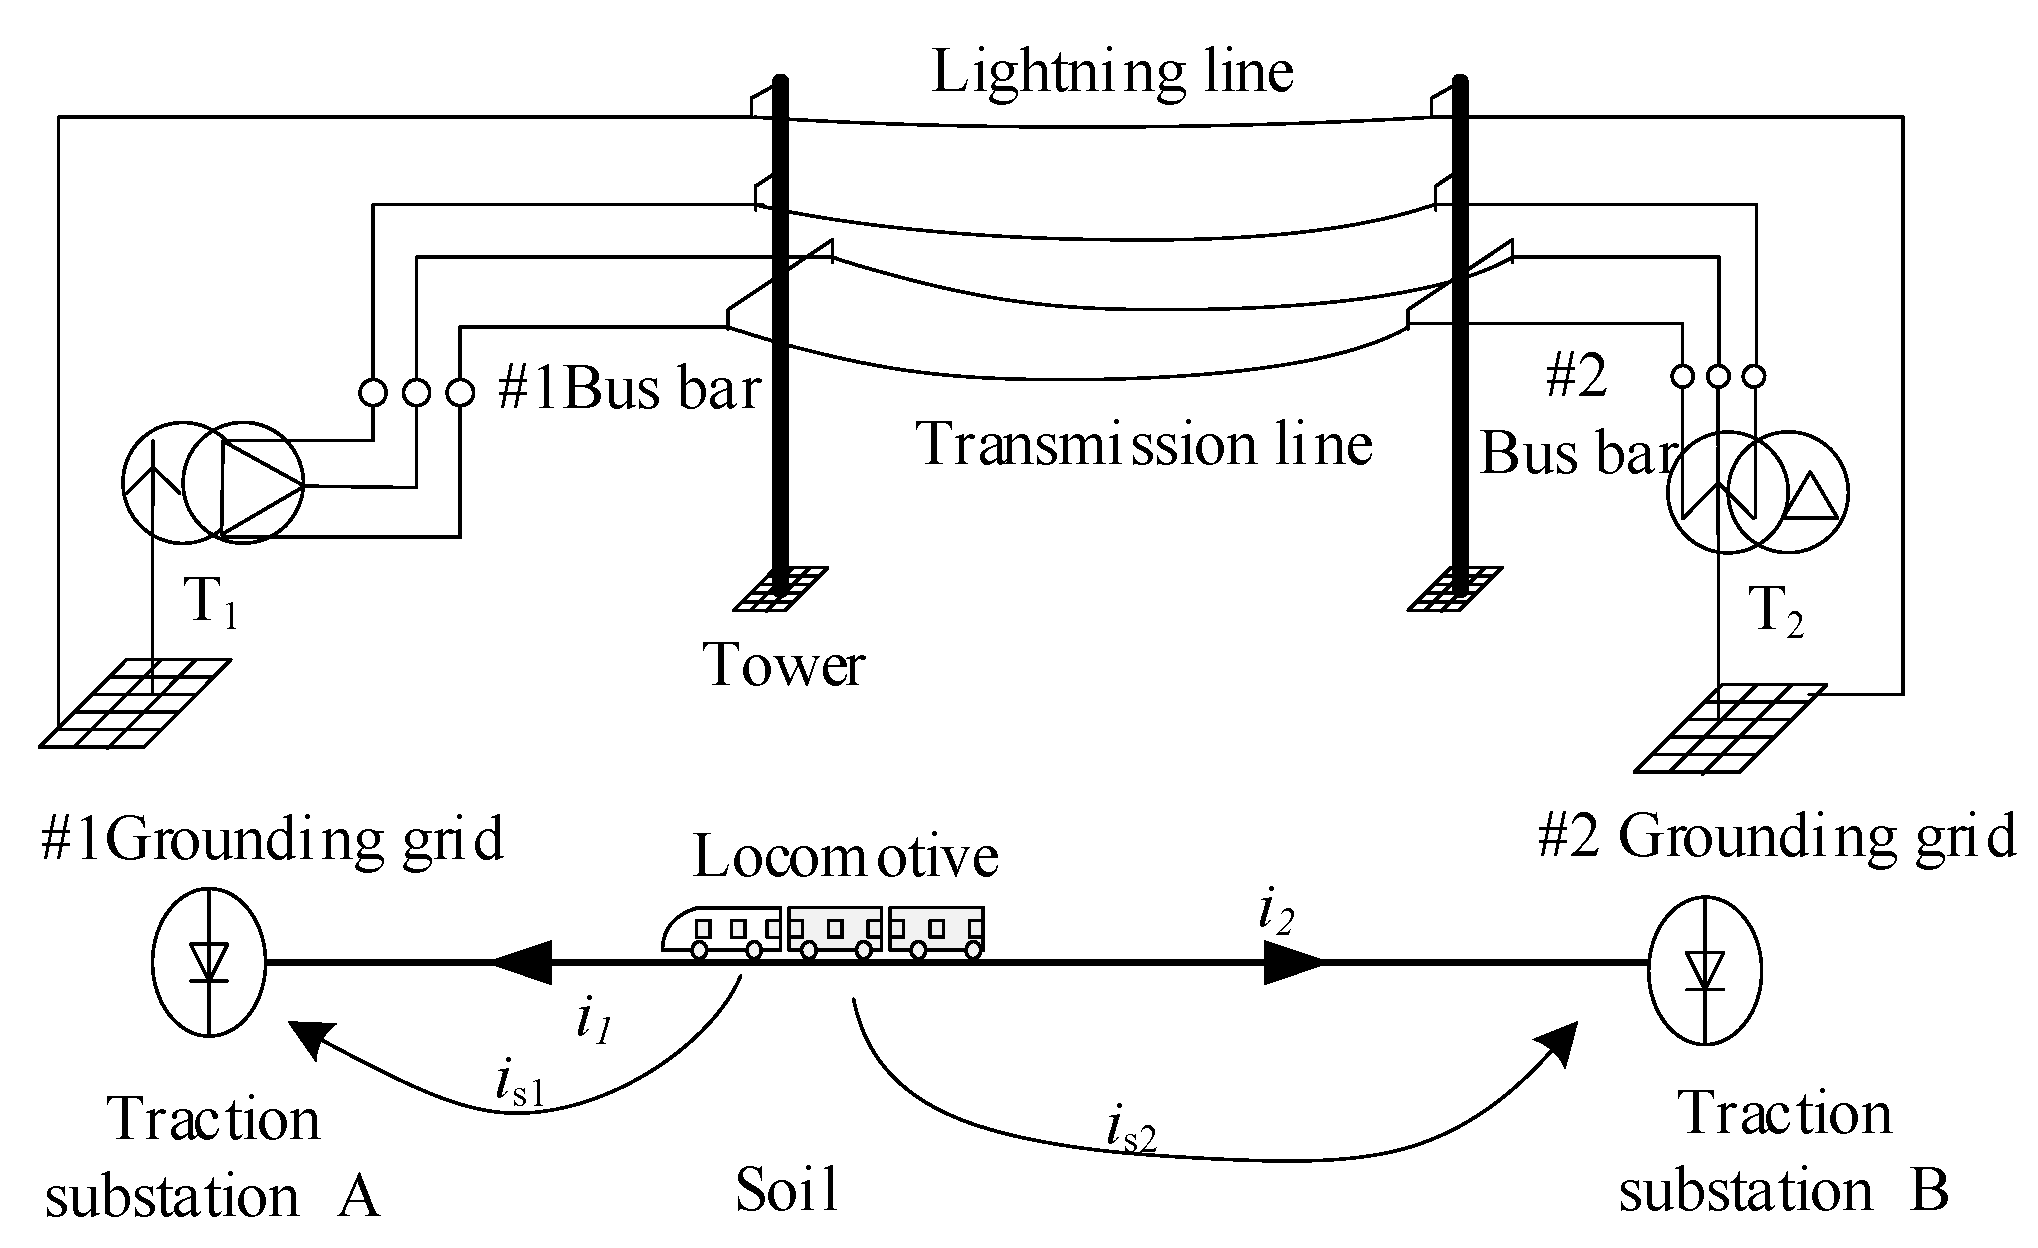
The theoretical principle of DC intrusion caused by stray current is shown in Figure 1.
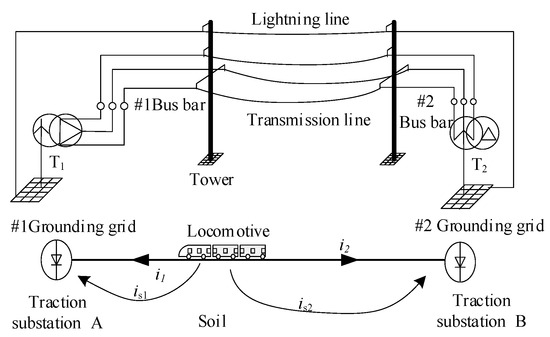
Figure 1.
DC schematic diagram of grounding circuit caused by metro.
It is indicated how the stray current influences the power grid in this figure. Grounding points, including electric poles or the ground grid of the substations along the subway, form a DC current loop. The direct current flows between transformers, transmission lines and lightning lines. When subway compartment lies between substation A and station B, an un-uniform potential distribution along the line is generated by stray currents is1 and is2. The grounding points at transformer T1 and transformer T2 have a potential difference, which causes a ground loop to form through the AC grid and the earth, causing DC intrusion into the grid.
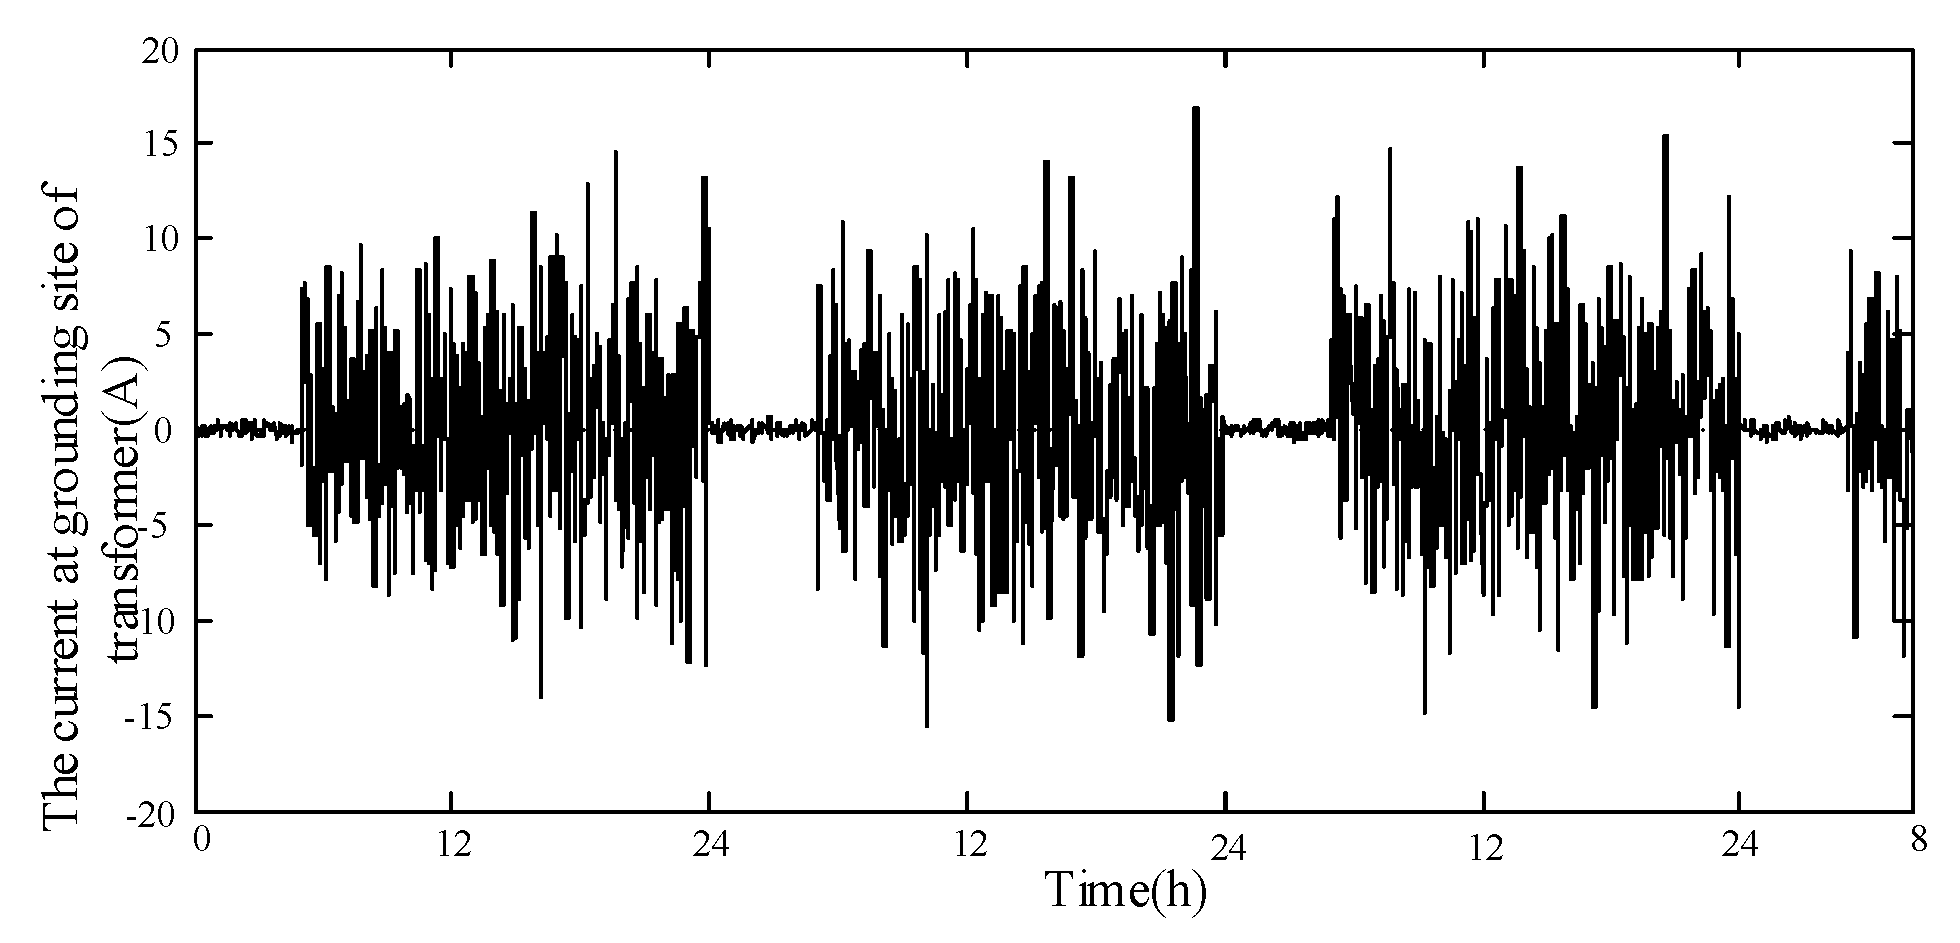
The measured waveform of the neutral point current waveform of the main transformer with DC bias near the subway is shown in Figure 2.

Figure 2.
The measured waveform of the neutral point current of the main transformer.
The neutral point current of transformer is affected by the operation of subway. The current in the neutral point of the main transformer has obvious macro periodicity. During the subway operation time segment—the period from 5 a.m. to 12 a.m.–the amplitude significantly increases.
2.1. The Formation Principle Of Grounding DC Loop
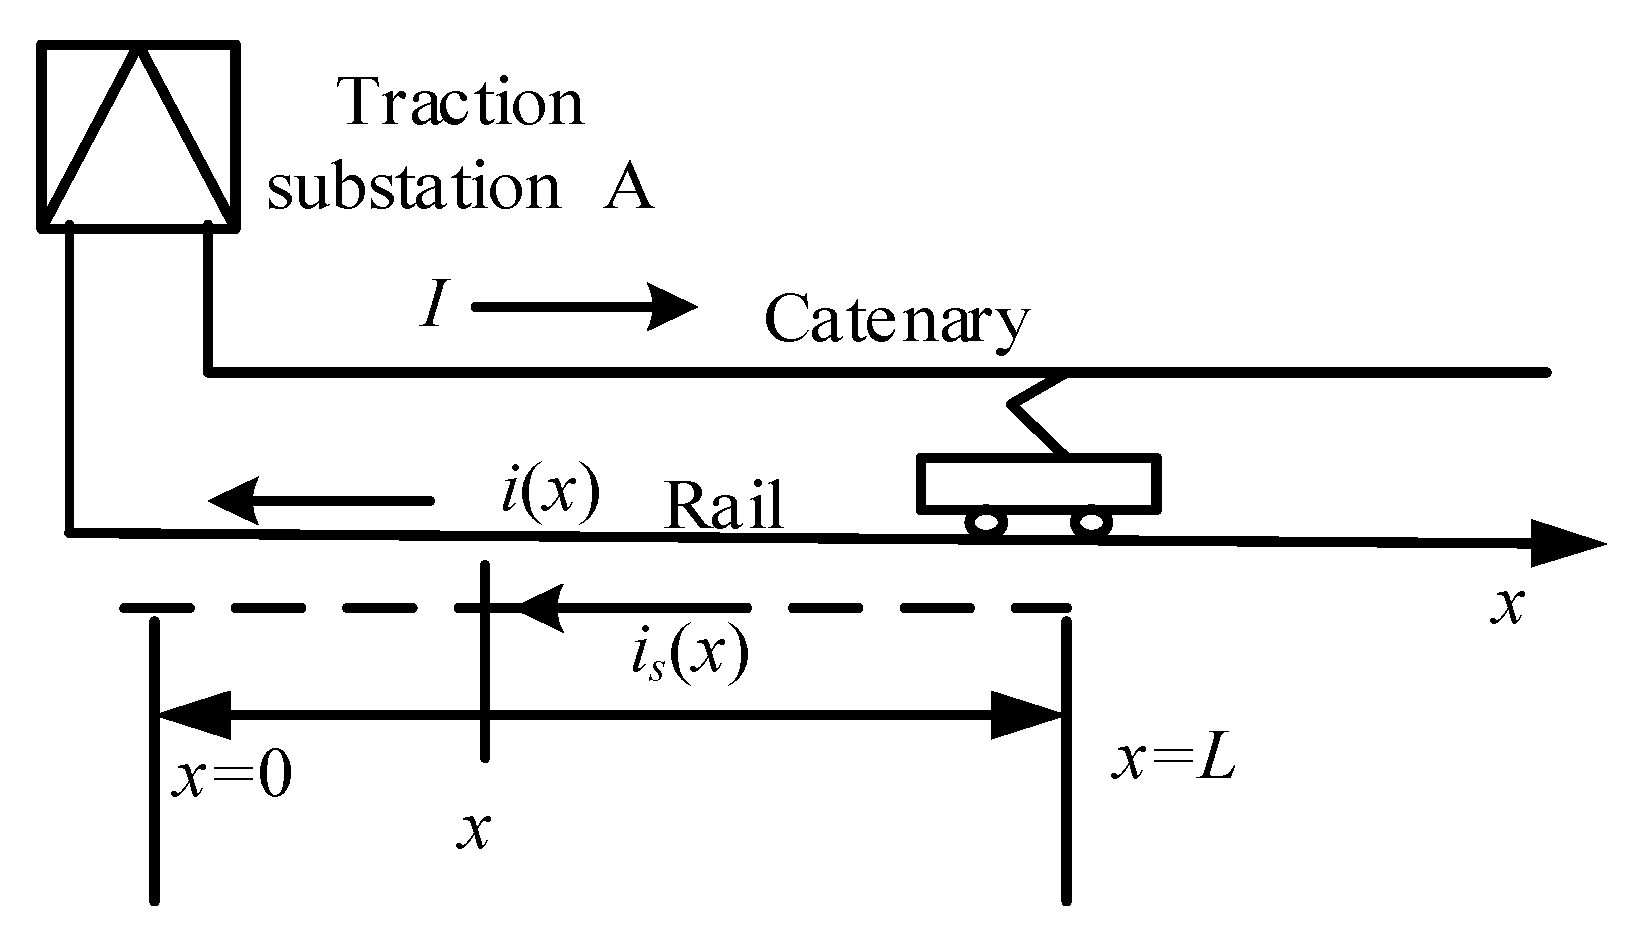
In this paper, a mathematical method for calculating the potential distribution near the subway is proposed. Two methods of power supply to the subway mode are widely used, including single-side feeding and two-side feeding. The impact of subway operation is larger in the case of the single-side power supply mode. A diagram of the single side power supply mode of a subway is presented in Figure 3. As shown in Figure 3, I represents the load current of the locomotive and L represents the distance between the locomotive and substation. The traction station is assumed at point O; the current positive direction is set the same as the direction of the subway compartment; and the current i(x) flowing through rail is a function of x calculated by the formula is(x) = Ii(x).
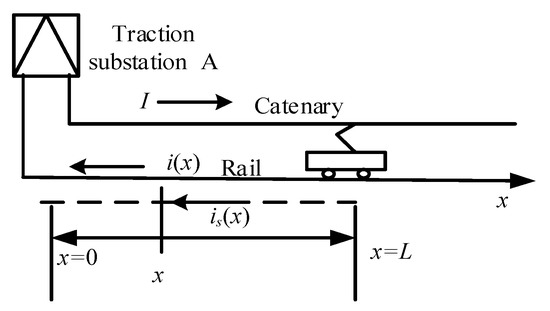
Figure 3.
Unilateral power supply system of the metro.
The potential distribution along the subway is affected by many factors, including the soil structure, the power supply mode of the subway, and the driving position of the locomotive. To simplify the analysis to find the effect of each factor in the mathematical model, the following assumptions are made:
- (1)
- There is no leakage current of the traction grounding grid. It is assumed that all the stray current is caused by the operation of the subway.
- (2)
- The equivalent resistance of the rails, the steel mesh in the track bed and the resistivity of soil are well regulated equivalently. The subway tunnel is regarded as a line type.
- (3)
- The material of the catenary is viewed as a good conductor without resistance.
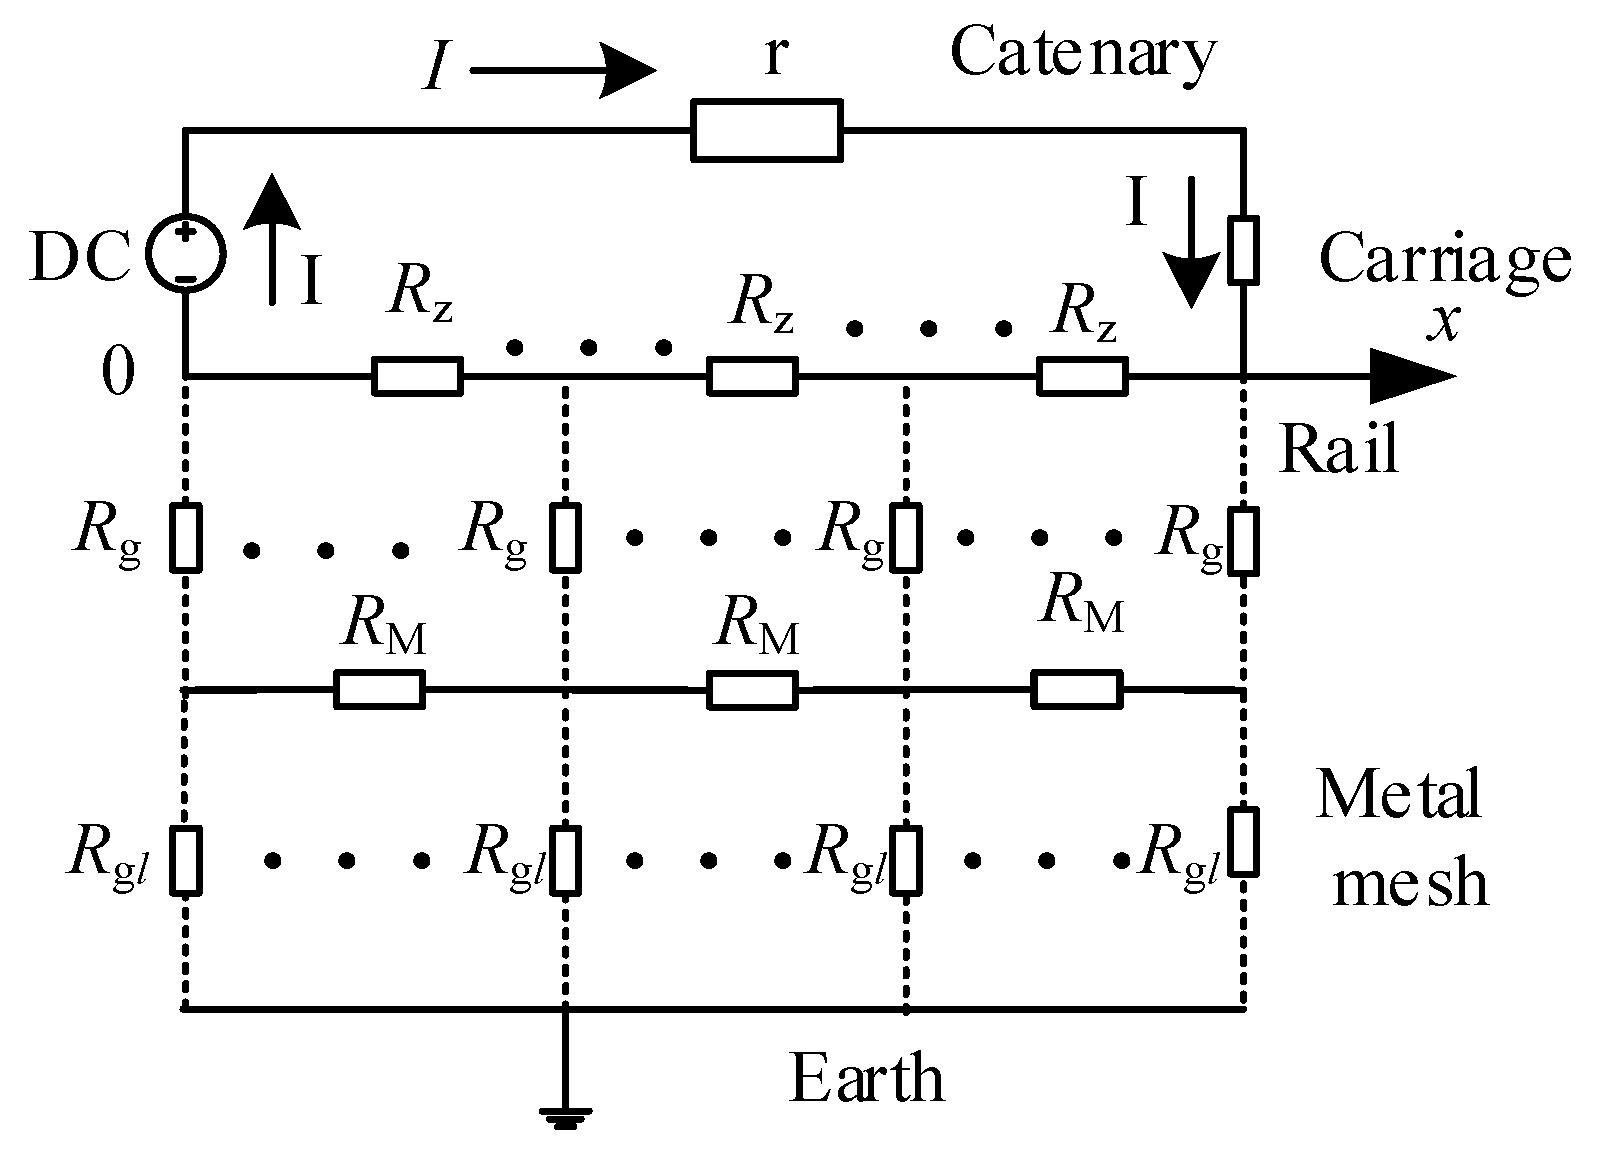
There are applicable models for the general operation of a subway. The mathematical model is shown in Figure 4, including a carriage, rail, drainage facilities and nearby regional power system.

Figure 4.
Track-buried metal-earth equivalent circuit model.
There are two main equivalent models of locomotives widely used, including the current source model and constant voltage source model. The current source model was selected for simulation and calculation in this paper. A time-varying current source is selected to represent the total current source in the equivalent DC loop, which is numerically equal to the sum of the traction current flowing in the rail and the stray current in the soil. The traction current of the engine is represented by current source I, which is a time-varying current source.
The longitudinal equivalent resistance of two rails (Rz, in Ω/km) and the transition resistance between the rail with the buried metal (Rg, in Ω/km) can be obtained from the Engineering Design Manual. r is the resistance of the catenary in Ω/km, Rgl is the transition resistance from the buried metal to ground in Ω/km, and RM is the longitudinal resistance of the buried metal structure in Ω/km.
The voltage u(x) at any point x on the rail is a function of the position x, in V. The stray current is (x) at the position of x is a function of x, in A. On the foundation of Kirchhoff’s voltage principle, combined with the calculation of the node voltage and branch current of the calculation model, u(x) and is (x) are given as follows:
where
Differential form of formula (1) is given as formula (2), and general solution of formula (2) is given as Equation (3):
A, B are undetermined coefficients, where
The current i(x) is presented as:
Border conditions are assumed as i(x = 0) = I and i(x = L) = I, then A and B are obtained as:
The expressions of voltage u(x) and current i(x) are obtained as:
From formula (7), when the concentration parameter is used, the expression of the stray current from the rail to the soil is:
For each position on the rail, the stray current flowing into the earth is negative while the current flowing from the earth to the rail is positive. Then, the distributed stray current density function of the soil is obtained by Equation (8) as follows:
In the model, rails are assumed as ideal conductors with evenly distributed resistance. It is supposed that the current is I, and each point of the rail from the point (0,0,h) to the point (L,0,h) has leakage of current. The Green’s function expression in the horizontal two-layer soil by the equivalent complex image method is used to solve the ground potential distribution function in the horizontal plane along the line: u(x, y, z) = f(L, x, y, z, h, H, I, ρ1, ρ2).
Since the structure of soil is mostly double-layered, it was focused on the study of two-layer soil distribution in this paper. The rail is divided into numerous parts by the discrete sampling method. Every part is seen as a current source. The vector of sources is dis = [dis1 dis2 dis3...disn], where n→∞. According to the superposition theorem combined with the horizontal two layers of soil Green’s function expression, the potential distribution caused by the stray current into the ground is given as Ug(x,y,z) as follows:
where rn (n = 1,2,3,4) in the formula are as follows:
, , , , , k is the reflection coefficient given as .
2.2. Grid Grounding Model of Loop DC Distribution Network
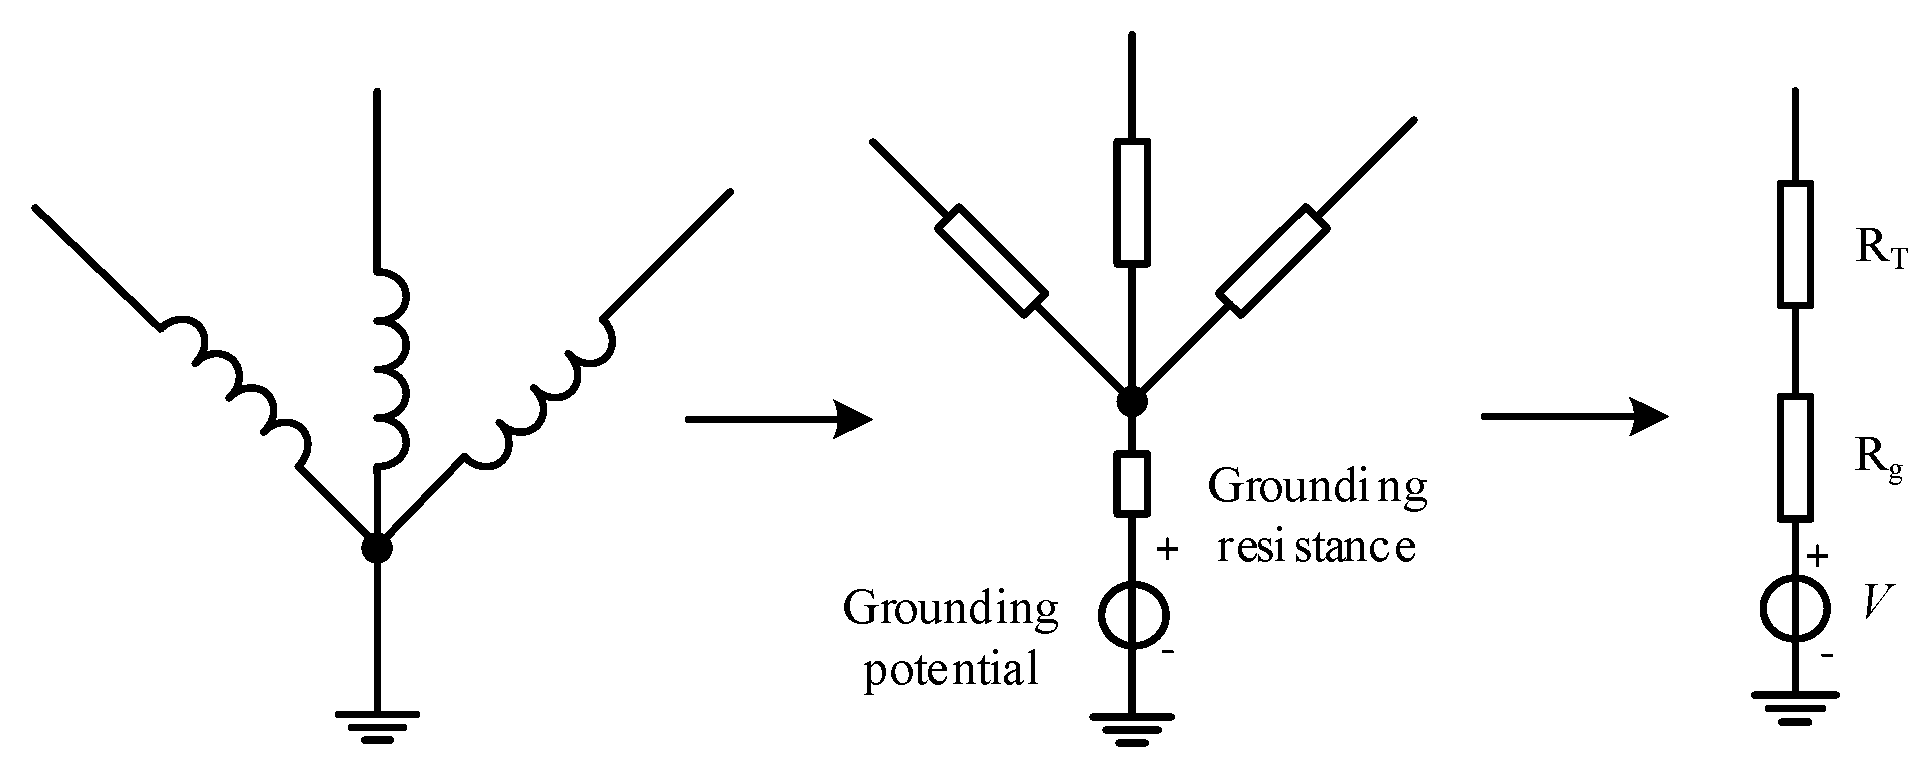
The operation of the subway affects the potential distribution of regions along the subway. A DC loop is formed in the power grid through a ground potential difference at grounding points in different positions. There are neutral grounding points in the voltage level of 110 kV and above power system. So, in our research, the DC intrusion generated by the subway operation is considered only in the AC grid of 110 kV and above. A double-column transformer is widely used in a system with 110 kV or higher and all the transformers are divided into single-phase transformers and three-phase transformers. For a double-column transformer, either a single-phase transformer or a three-phase transformer can be calculated using the transformer winding DC model in Figure 5.
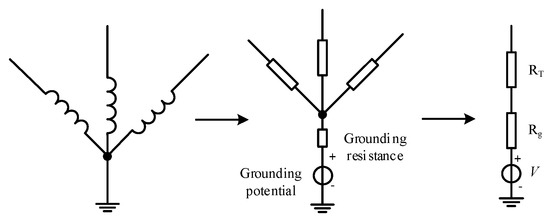
Figure 5.
DC schematic diagram of grounding circuit caused by subway.
For a single-phase situation, the resistance of transformer winding is given by formula (11), where RT is the DC resistance (Ω) of the single-phase winding, Pk is the copper loss (kW) of the single-phase transformer, UN is the rated voltage of single-phase (kV), and SN is the rated capacity of single-phase (MVA). All these parameters are available on the transformer nameplate.
In the equivalent DC loop model of the power grid, three-phase transmission lines are regarded as three resistance branches. The transmission model is shown in Figure 6.
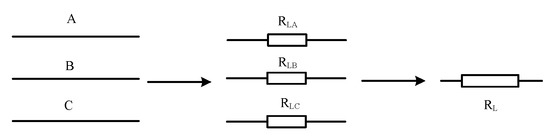
Figure 6.
Direct current model of transmission line.
The DC resistance is given by formula (12).
where RL is the single-phase resistance (Ω) of the transmission line, ρ is the resistivity of transmission line (Ω•m), S is the cross-sectional area (m2) of the single-phase line, and l is the transmission line length (m) which connects bus lines of two substations.
There is a lightning line above the transmission line in long distance transmission systems. The overhead ground wire is directly grounded through the pole tower. When there exists a tower-lightning line, the line acts as another DC intrusion loop due to ground potential difference. Figure 7 shows a DC model of the tower-lightning line system. The calculation method is consistent with the method of the transmission line.
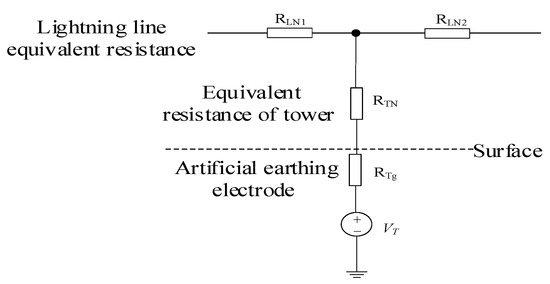
Figure 7.
DC model of grounding wire.
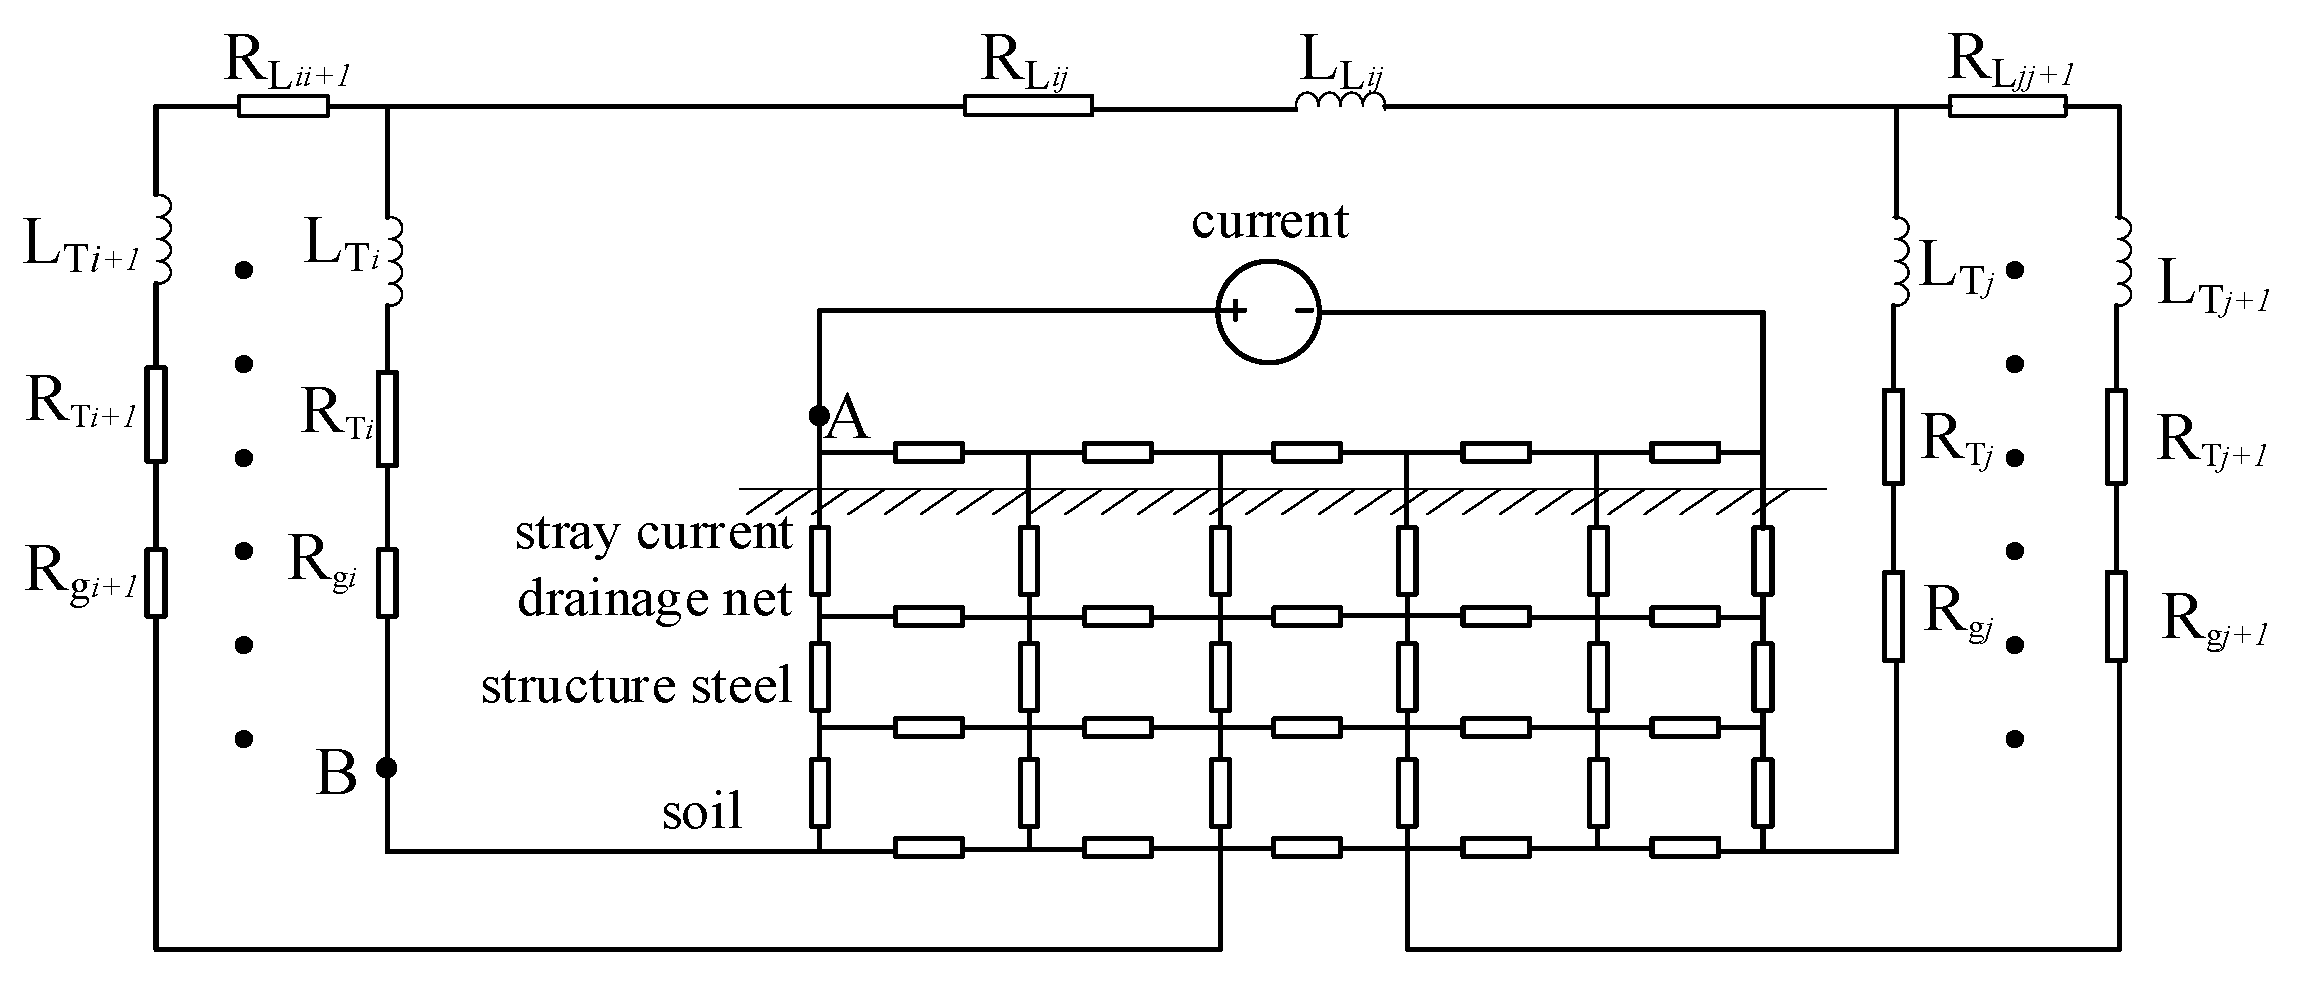
In the typical model of a railway system, the traction power supply system model of the subway can be divided into three or four layers. A four-layer model, as shown in Figure 8, was chosen in this paper, consisting of rails, an electric drainage net, structural reinforcement and grounding. The longitudinal resistance of the running rails shall be low. Where RLij is resistance of transmission line between substation i and the substation j. The equivalent resistance of neutral point of the transformer is Rg. According to the real interconnected system of the regional power grid, the DC model can be extended with grounding points. Other substations nearby are also expressed in the equivalent circuit as RTi+1 and RTj+1, as shown in the Figure 8. The minimum module of the equivalent model is double π unit to simplify the model.
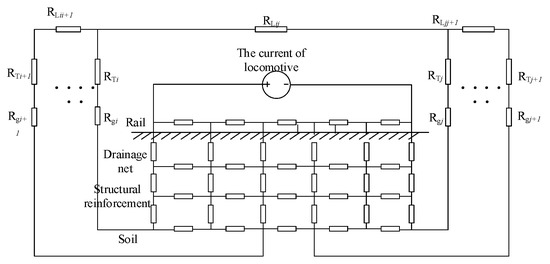
Figure 8.
DC model of two substation grounding circuit.
According to the analysis above, the DC current Iij between two substations with grounding points can be obtained by the following formula (13):
where Vi and Vj are, respectively, the potential of the grounding sites of the two substations, RTi and RTj are the equivalent resistance of the three-column winding of the two grounding transformers in parallel, Rgi and Rgj are the neutral point resistances of the two transformers, RLij is the single-column equivalent DC resistance of the transmission line between the two stations, n is the number of times that the transmission lines are returned.
The railway is usually located in the center of the city. There are interactions between multiple transformer grounding points to form a complex DC loop. The grounding resistance is not the same at every position. In this simulation, we set the grounding resistance of each grounding position as the maximum value of normal operation for the convenience of calculation. The minimum DC current in the power grid during the operation of the locomotive can be calculated by formula (14):
where V is the voltage vector of all ground nodes in the grid, Y is the node conductance matrix in the grid, and I is the current of neutral points of transformers. Y is a global quantity. In the calculation of this paper, we used a two-layer distribution model of soil to carry out the calculation of the ground potential distribution. The magnitude of the substation grounding resistance is mainly depended on the resistivity distribution at the grounding position. DC intrusion into power system can be calculated by the method we have introduced.
YV = I
3. Influence of Various Factors on DC Loop of Regional Power Grid
CDEGS has powerful simulation capabilities in the grounding aspect of power systems. In this section, CDEGS is used to simulate and analyze the actual situation of subway operation, intending to research the effects of various factors on the DC distribution in the power grid. There is insulation coating on the surface of a steel rail of a subway, and the simulation parameter settings are set as shown in Table 1, according to a real case—metro line 3 in Chongqing.

Table 1.
Simulation parameter settings.
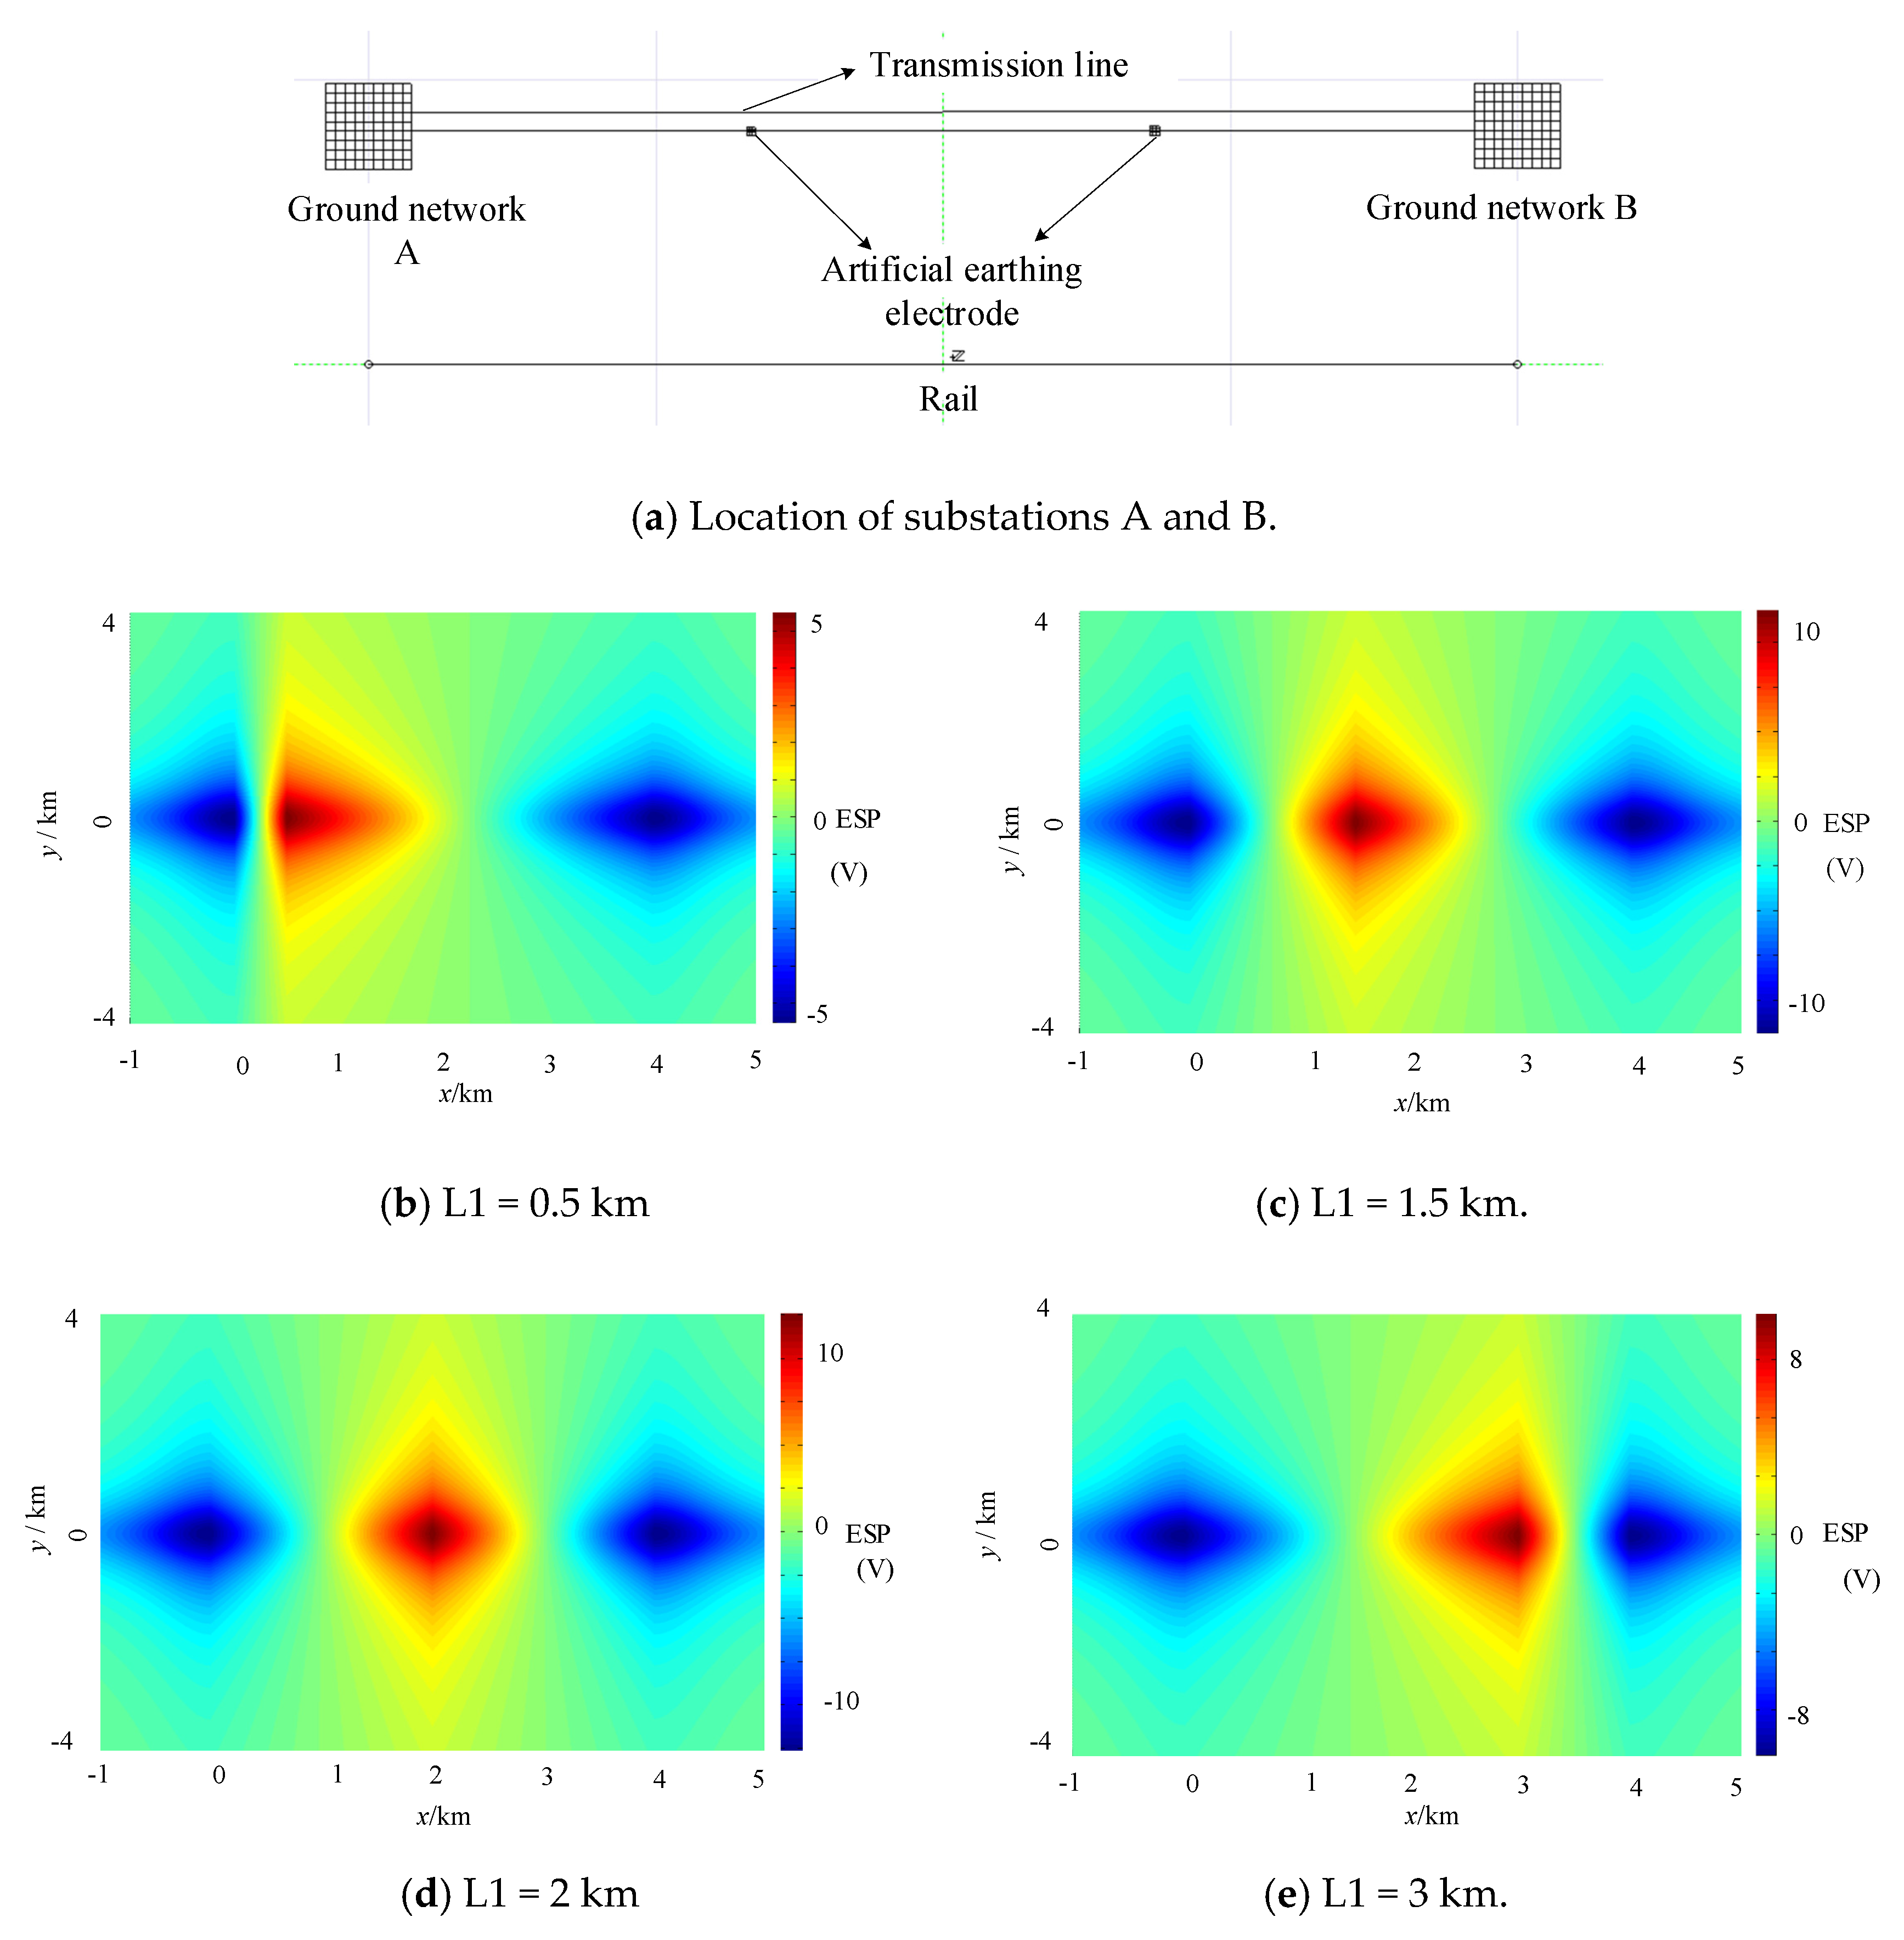
In the simulation in CDEGS, the location of the subway rail and the location of substations including A and B are shown in Figure 9a. Potential distribution on the ground surface is shown in Figure 9b–e. L1 is the distance between the locomotive and the substation A. The value of L1 changes as the subway travels. It is concluded that the farther the locomotive is from the traction station, the higher the surface potential level of the corresponding section is.
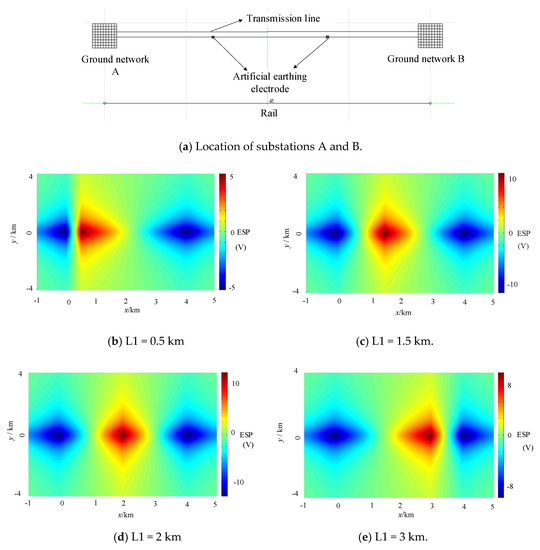
Figure 9.
The simulation model of the influence of the relative position of rail and substations.
Simulation results are compared with the calculation results of the model we have built, and the agreement between the two results indicates that the model is reasonable and effective enough. On the foundation of the stray current principle, DC intrusion is affected by many factors, such as the relative position of the running rail and the grounding site, the traction current of the subway, and so on. Different power supply modes adopted by the urban power supply system form different loops by changing the connection mode between the substations to change the DC distribution in the system. The neutral point resistance of the transformer affects the intrusion current in the power grid directly, and the resistance is related to the size of the grounding grid and the distribution density of the grounding conductor. The impact of overhead ground lines and lightning lines also needs to be considered comprehensively. In this chapter, we will analyze these factors one by one.
Table 2 shows the DC current in the transmission line when the subway is in operation, including two conditions—whether a grounding line exists or not. It turns out that the calculation method proposed in the paper is basically consistent with the simulation value. The model built in this paper is effective to calculate the current intrusion caused by the operation of the subway.
Table 2.
Current comparison of transmission lines with or without grounding lines.
According to the results in Table 2, it is concluded that when considering the ground line, the ground line has a shunting effect on the current flowing into the substation grounding loop in a low rate. The presence of the lightning line and the more grounding circuits would increase the DC current in a power grid.
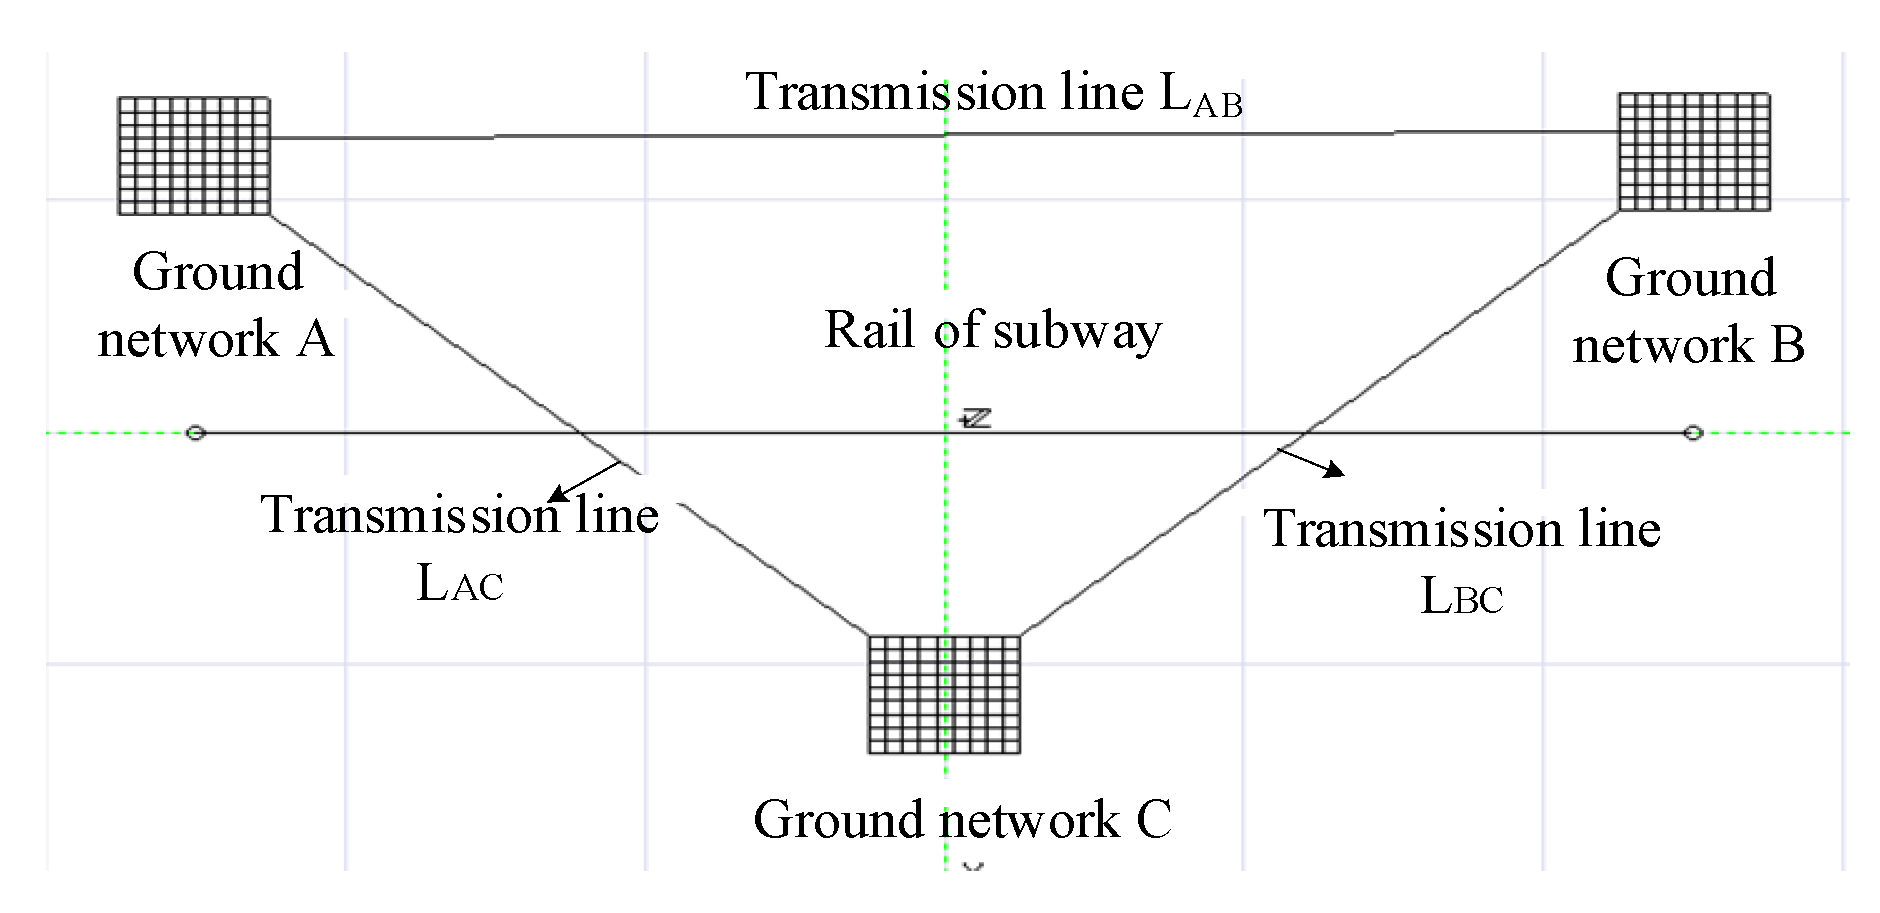
In the interconnected power system, the ground loops interact with each other. A three-substation interconnection model is shown in Figure 10. The C substation is connected on the foundation of the model in Figure 9a, which has the same parameters as the A and B substations. The lengths of transmission line LAC and transmission line LBC are 0.75 km.
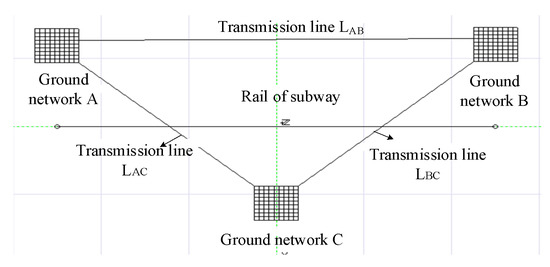
Figure 10.
Simulation structure diagram of ring grounding loop.
The parameters of the transmission lines and transformer are the same as in Table 1. The currents obtained by simulation and calculation are shown in Table 3.
Table 3.
The calculation and simulation results.
LAB, LBC, and LAC represent transmission lines. Nodes A, B, and C refer to the position of the substation. The positive direction of the current on the transmission line is A→B, B→C, C→A. The direction of the node current is positive in the direction of flowing into the grounding grid.
By comparing the results in Table 2 and Table 3, it is inferred that if the number of grounding networks near the subway line increases, the closer the distance to the subway line station, the larger the ground loop current at the corresponding ground point. This would increase the risk of DC bias of the main ground transformer.
Furthermore, the conductor density of grounding also affects the value of the direct current. Based on the simulation parameters, setting I = 2000 A and ignoring the influence of the ground line, the conductor distribution density of the grounding grid A and the grounding grid B is changed in steps of two. The current in the transmission line changes, as shown in Figure 11.
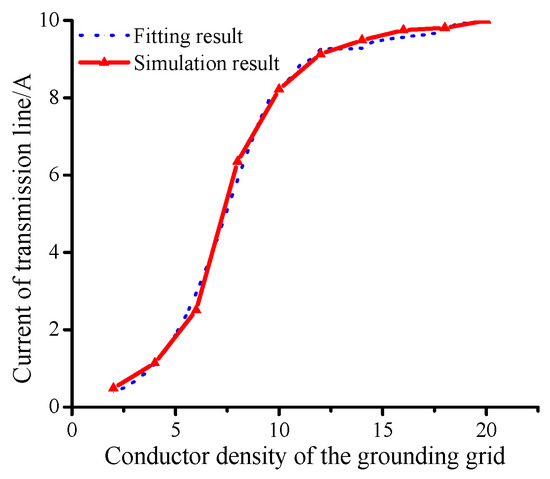
Figure 11.
Circuit current of LAB under different conductor density.
It is shown in Figure 11 that when the number of conductors is n ≤ 14, the current of the transmission line increases with the increase in n. When the number is n ≥ 16, the DC current through the transmission line does not change substantially. When the conductor distribution density increases, the neutral point grounding resistance of the transformer will become smaller, which will increase the DC in the loop. When the conductor distribution density increases to a certain value, the grounding resistance changes little, and the current in the loop will basically not change.
4. Analysis of Steady and Transient State of Grounding Loop DC Model
The analysis in Chapter 3 is on the condition that the traction current is a constant value. Although a DC traction system is selected as the power supply to the subway, the traction current is not a stable DC during the traction process, which has a strong relationship with the running state of the subway. When the driving speed of the locomotive varies, the required traction current varies, too; and when the driving state of locomotive changes, the changing trend of the required traction current also changes. The traction current is also related to the state of the motor. When the motor is in the traction condition, the contact net provides power to the locomotive; and when the motor is in the braking condition, the power is flowing from the locomotive to the contact network.
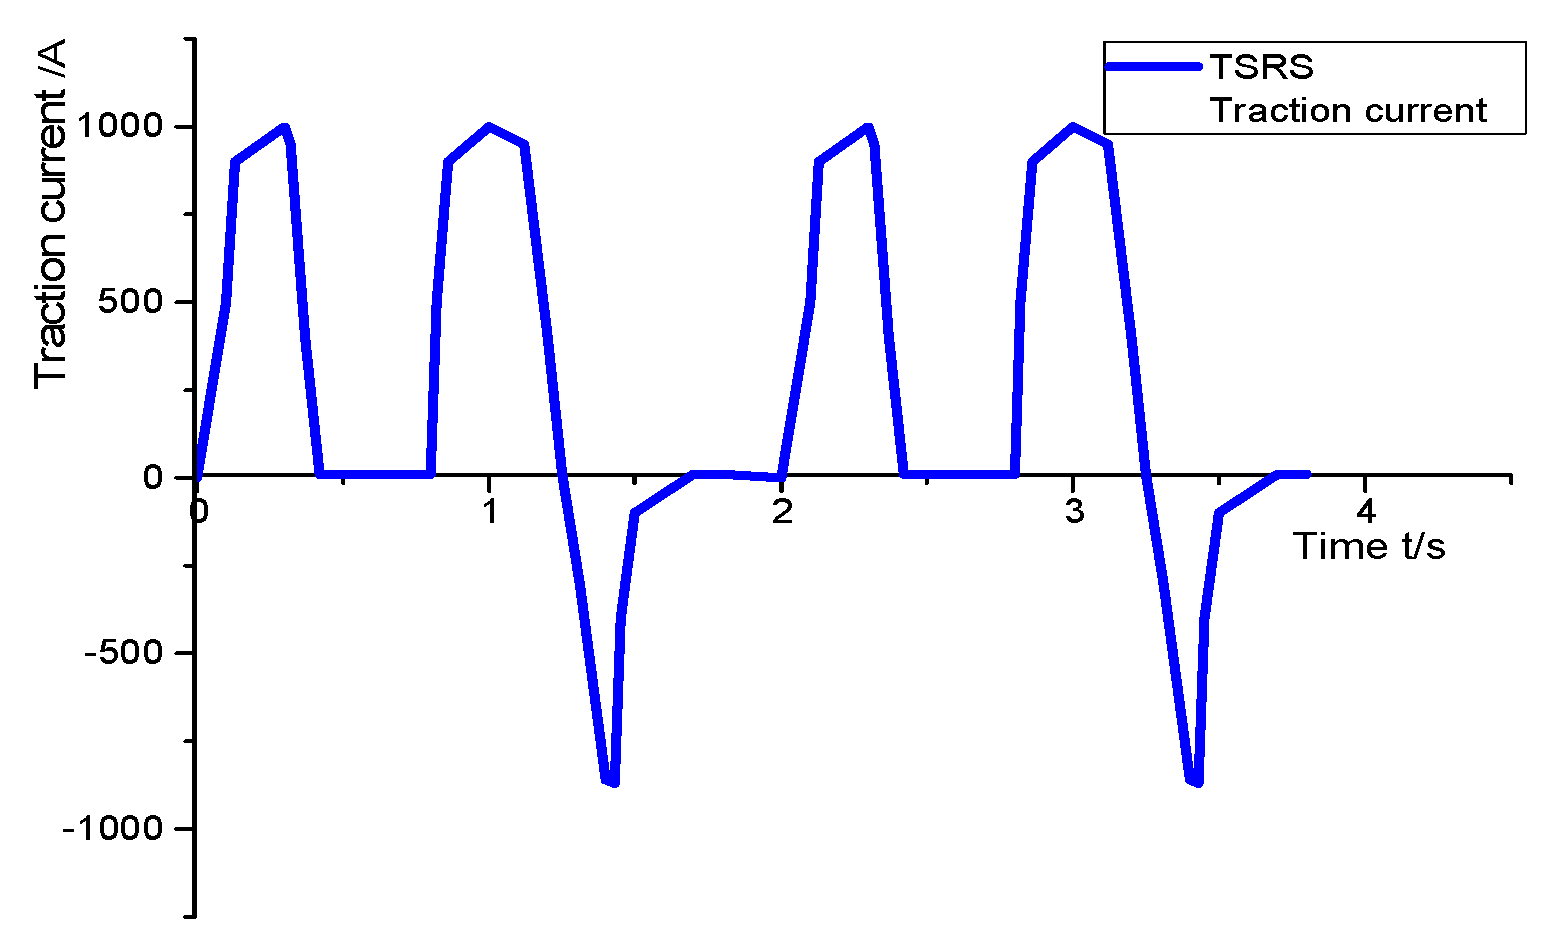
Two state of traction current of locomotive are used widely in the operation of subway, Target Speed Running Strategy (TSRS) and Fastest Speed Running Strategy (FSRS). In this paper, the change in current is used to reflect the various operating conditions of the train. The traction current of TSRS state is shown in Figure 12. Since the current changes rapidly, the transient process in the circuit model cannot be ignored. Combined with the actual parameters of a real case, equivalent transient parameters are shown in the circuit model, as shown in Figure 13.
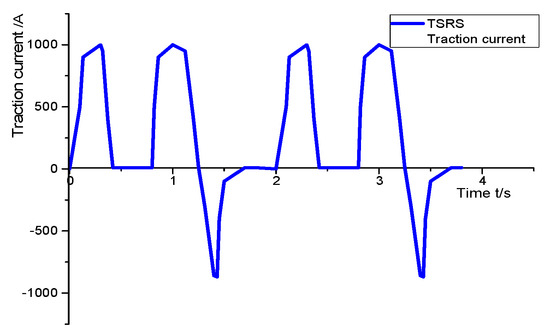
Figure 12.
Traction current of carriage in TSRS state.

Figure 13.
Transient analysis DC model of two substations with grounding points.
The circuit model is built in SIMULINK module in MATLAB to carry out simulation analysis. The current setting of the current source is shown in Figure 12. The parameters in the circuit are set as shown in Table 4. The simulation results are shown in Figure 14.
Table 4.
The settings in the model.
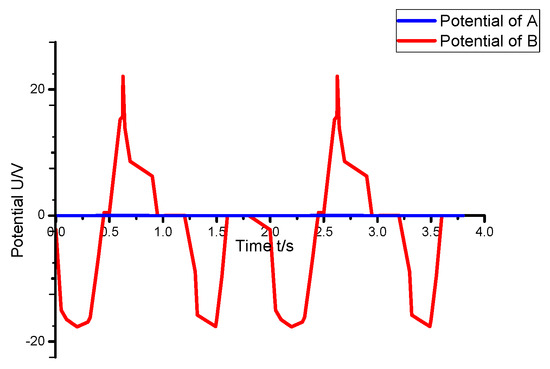
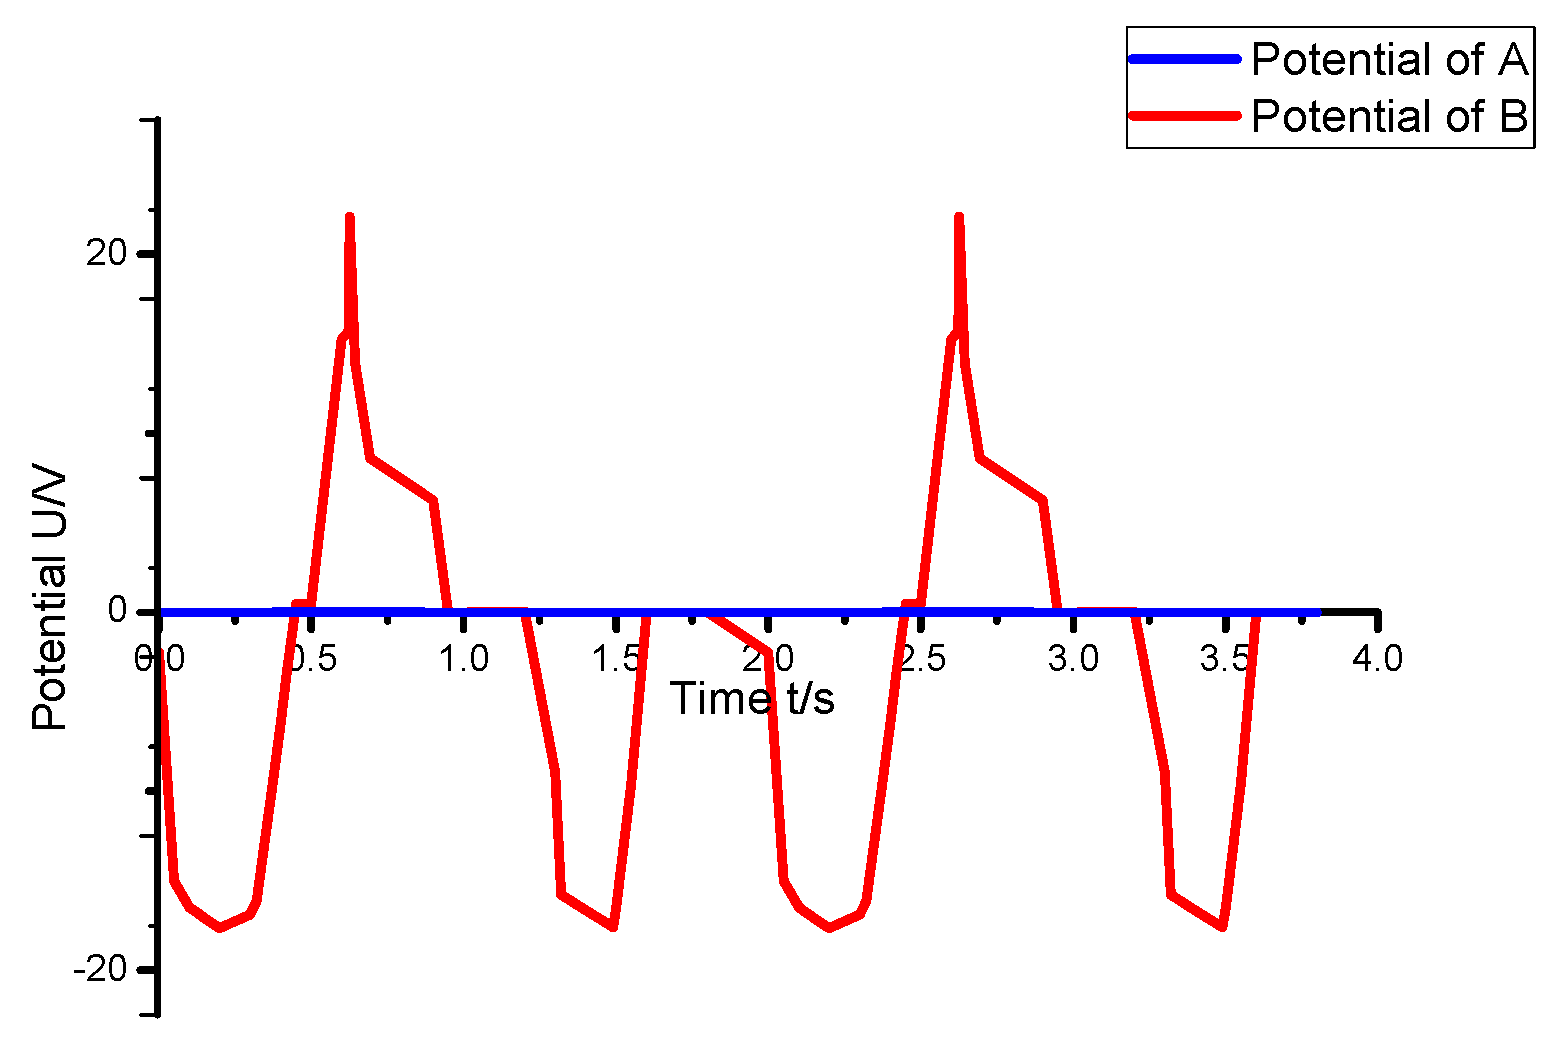
Figure 14.
The potential changes of points A and B.
The two points A and B are labeled in Figure 13, which represent the potential change of a fixed point on the rail and the potential change of the substation grounding point. It is obtained from Figure 13 that the change in the traction current affects the change in the stray current in the actual operation of the subway. Although the potential change at B is small, DC current will appear in the AC grid. In the simulation model of this paper, when the maximum traction current of the locomotive is 1000 A, the maximum value of potential at A is 22.76 V, and the maximum value of potential at point B is 1.67 V, resulting in a DC size of 0.387 mA invading the power grid.
Through the research above, it can be seen that the calculation results of DC intrusion by the DC loop model we have built agrees well with the software simulation results. Appropriate parameters can be selected according to the actual power grid and subway lines to estimate DC invasion current. The operating risk of the power system is estimated so as to provide ideas for reasonable risk aversion.
5. Experiment on Ground Potential Distribution and Ground Loop Current
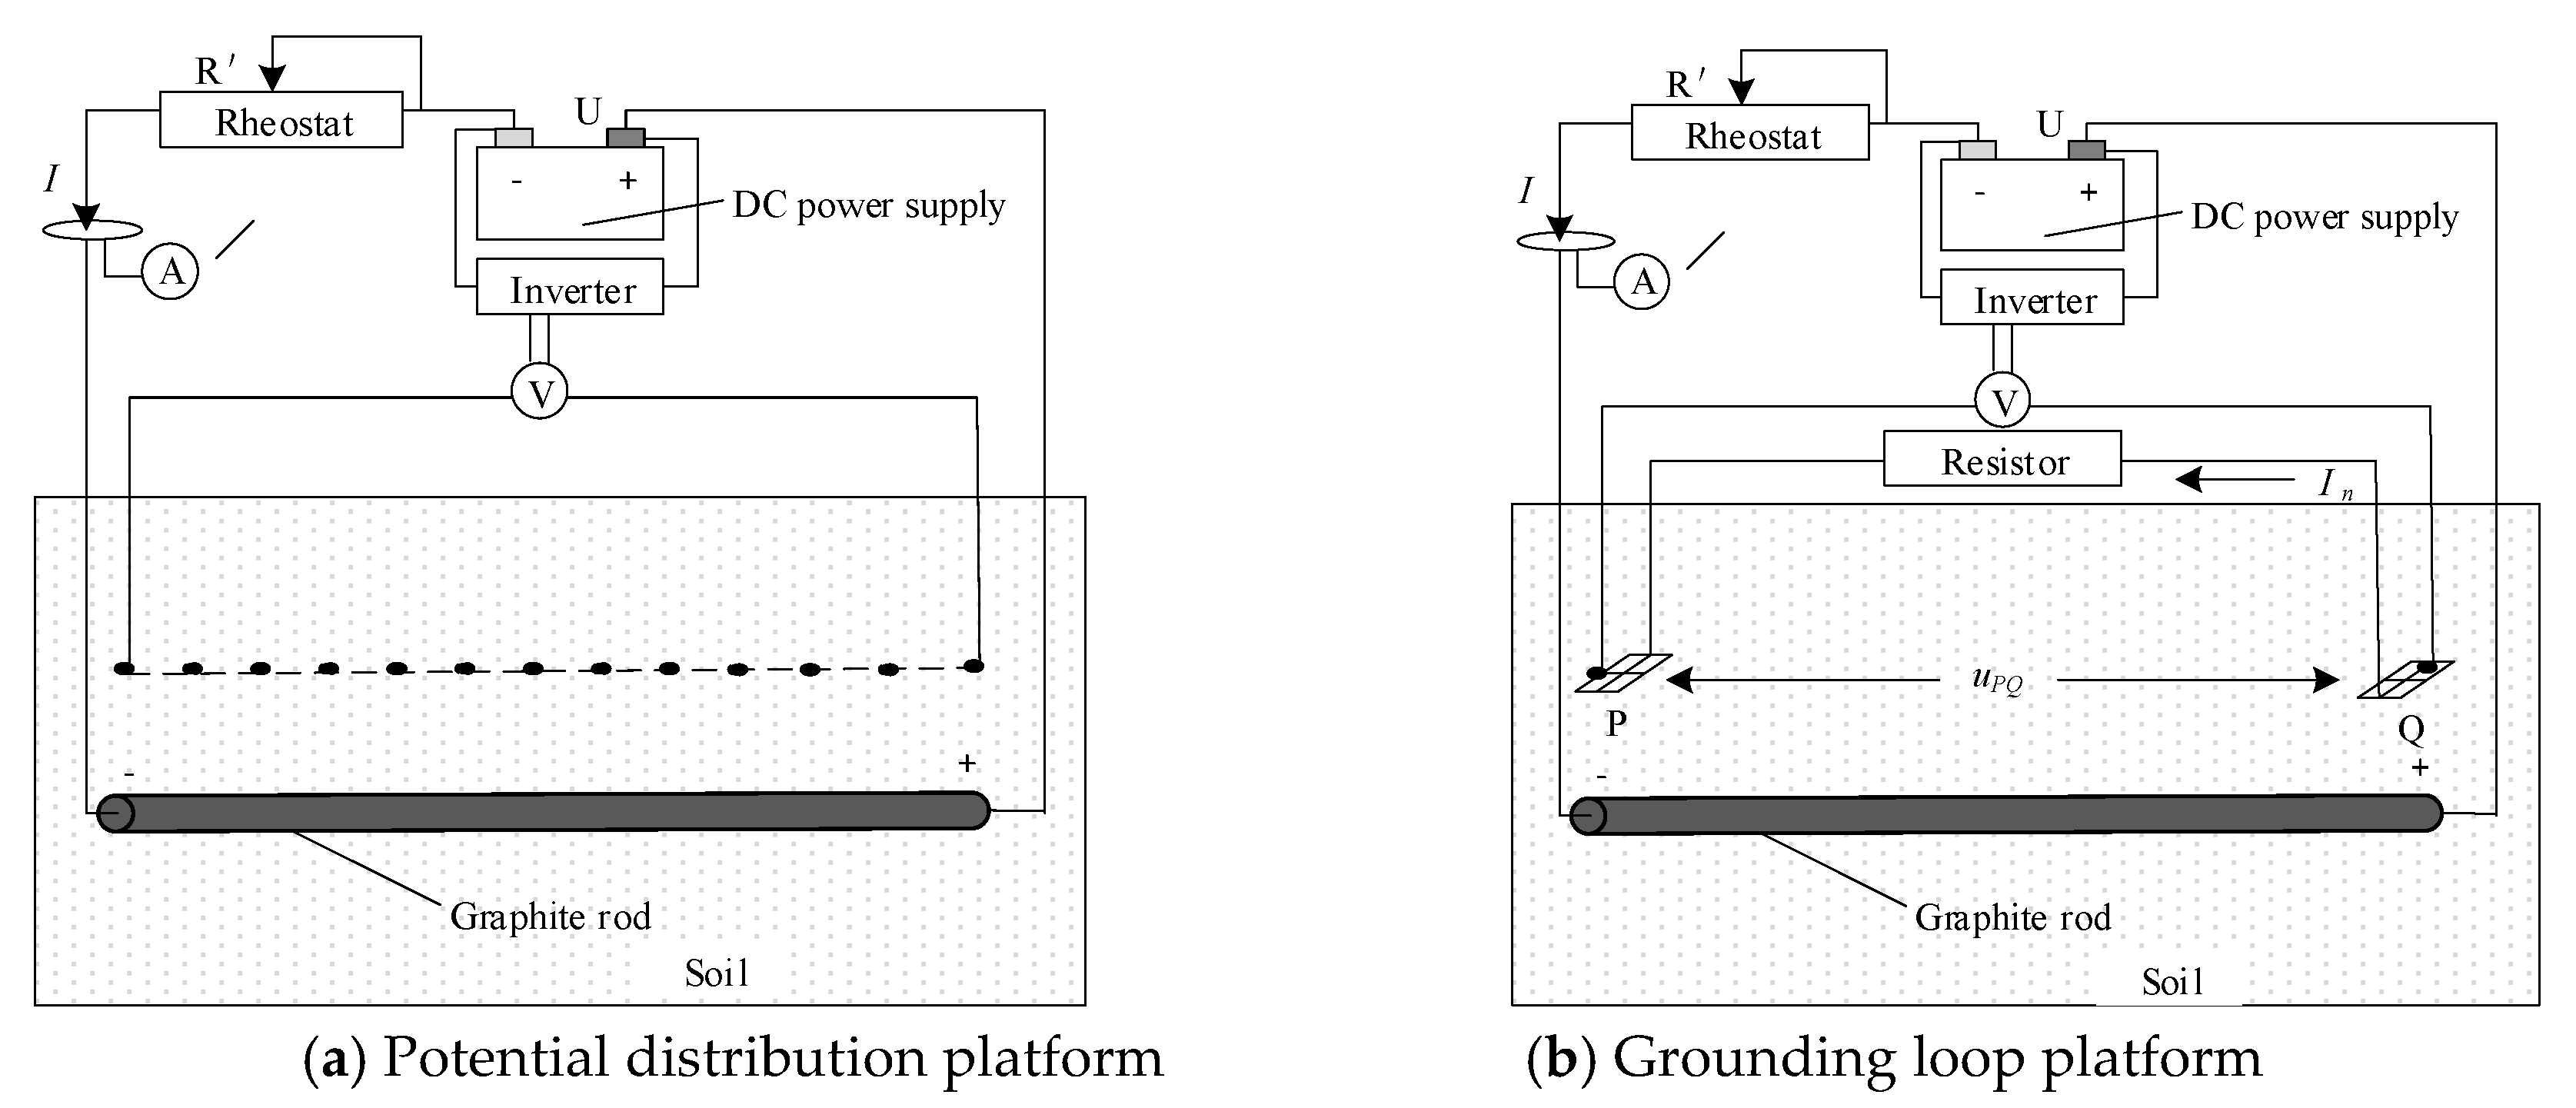
The ground potential distribution caused by the operation of the subway is an important basis for the calculation of the ground loop current. In this chapter, an experimental platform is set up to simulate the ground potential distribution near the subway and the neutral point currents of transformers. The schematic diagram of the experimental platform is shown in Figure 15. A graphite rod is selected to simulate a steel rail coated with insulating paint. Iron wire meshes are used to simulate ground grids near the subway. A fixed resistor is used to simulate the neutral point resistance. A copper interconnect with little resistance is used to connect the graphite rod with DC power supply. Rheostat is in series to protect the circuit. A large-capacity lithium polymer power supply is used as a DC power supply to power the loop. The physical map of the experimental platform is shown in Figure 16. Without high voltage and large current, the experiment platform is simple and convenient to operate.
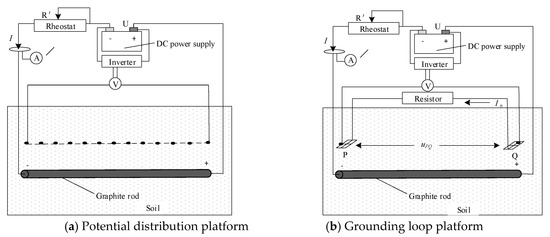
Figure 15.
Structure diagram of experimental platform.
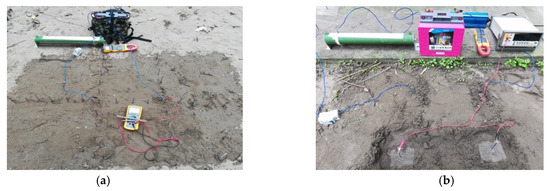
Figure 16.
Field experiment. (a) Field test of earth potential; (b) Field test of ground loop current.
There is a potential difference in the nearby soil when the current is through the graphite rod. The potential of probes in array in Figure 16a and the potential difference UPQ between the point P and Q in Figure 16b is the measurement data.
The steps required to do the experiment are as follows:
- (1)
- Connect the components accurately and adjust the sliding rheostat until it reaches the set current value;
- (2)
- Measure grooves at a set depth and bury graphite rod;
- (3)
- Use a ruler to mark the specific position line l, m, n, and arrange a series of ground potential probes every 0.05 m on l, m, n as Figure 17;
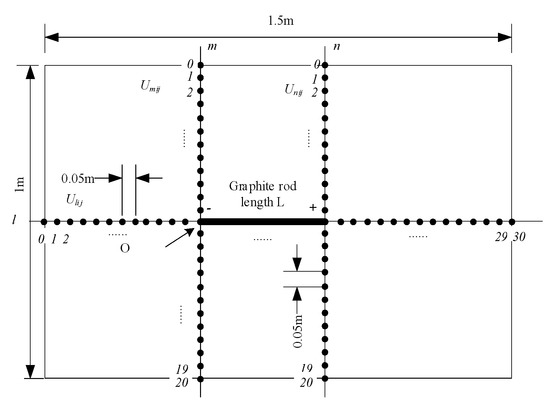 Figure 17. The overlook map of the test area of the earth potential.
 - (4)
- Measure the ground potential value of every probe.
The first part of the experiment is to investigate the effect of power supply distance of ground potential distribution. In this part, the change of the length of graphite rod was used to simulate the change of subway power supply distance in actual engineering. The current through the rod was set in 27A, and parameters of the experimental samples are given in Table 5 as follows:
Table 5.
Experimental sample parameters.
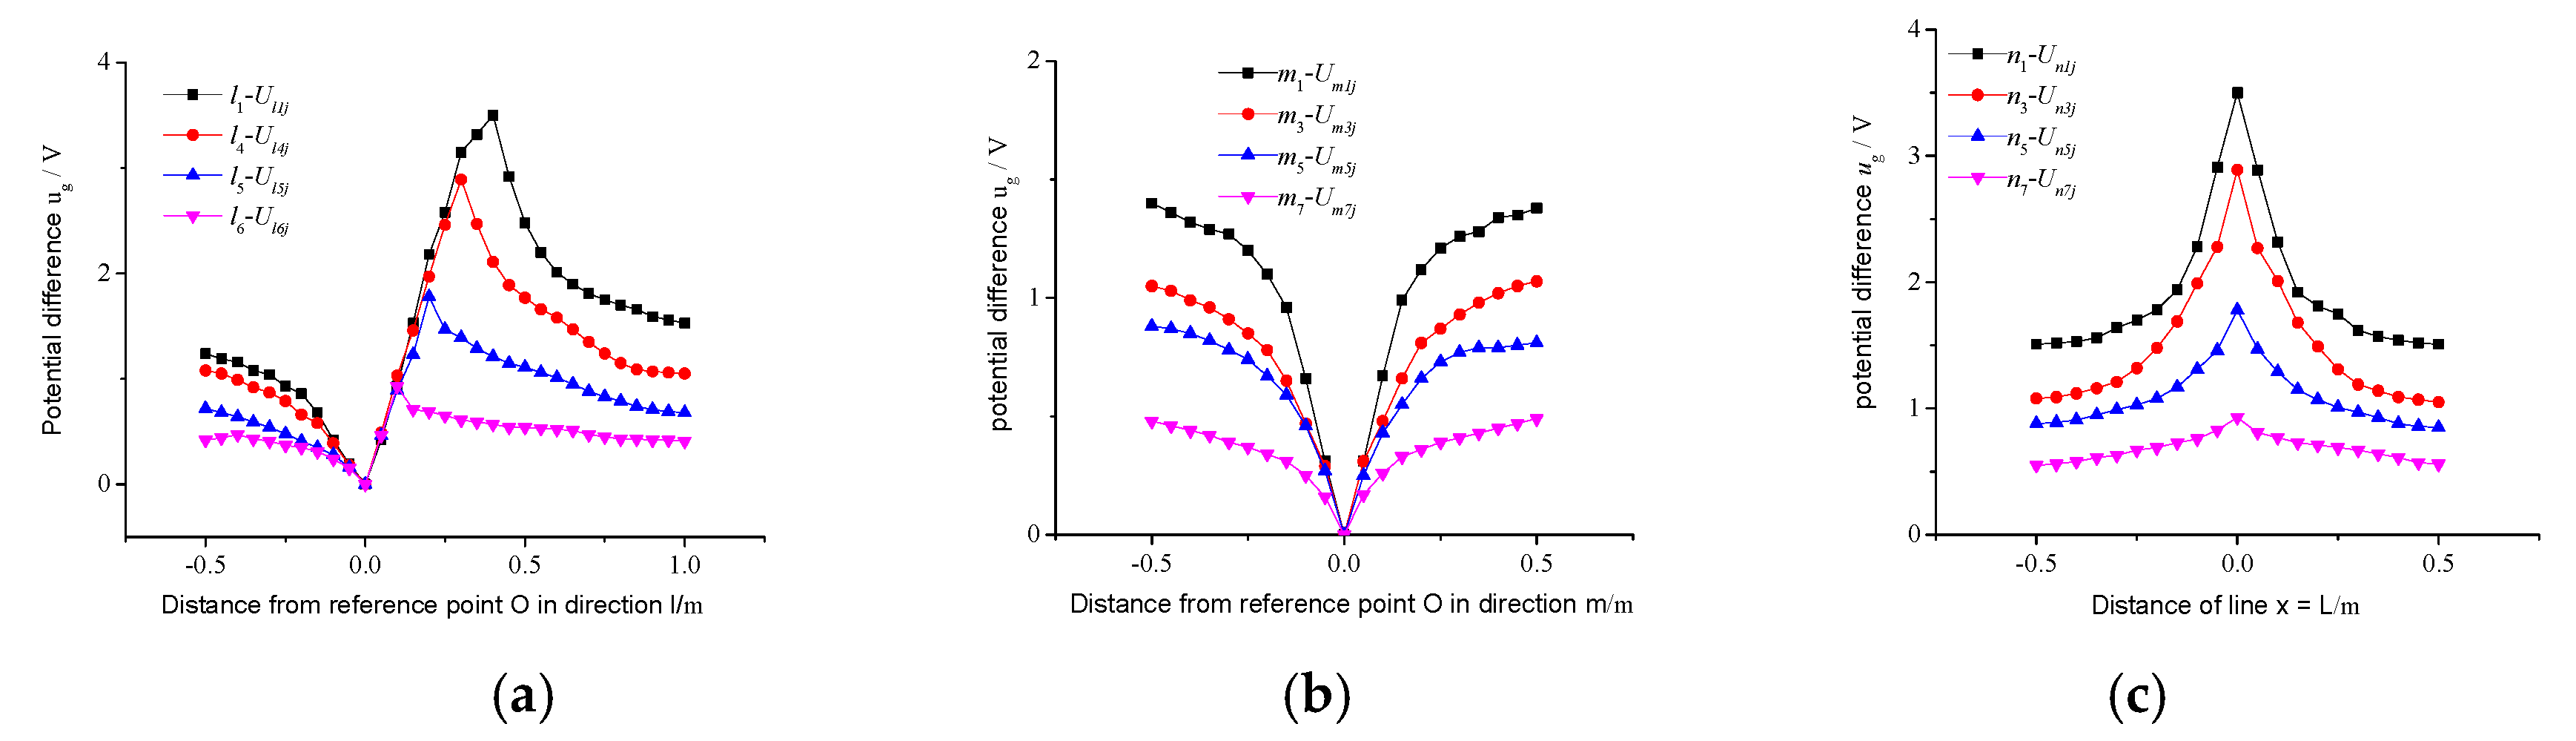
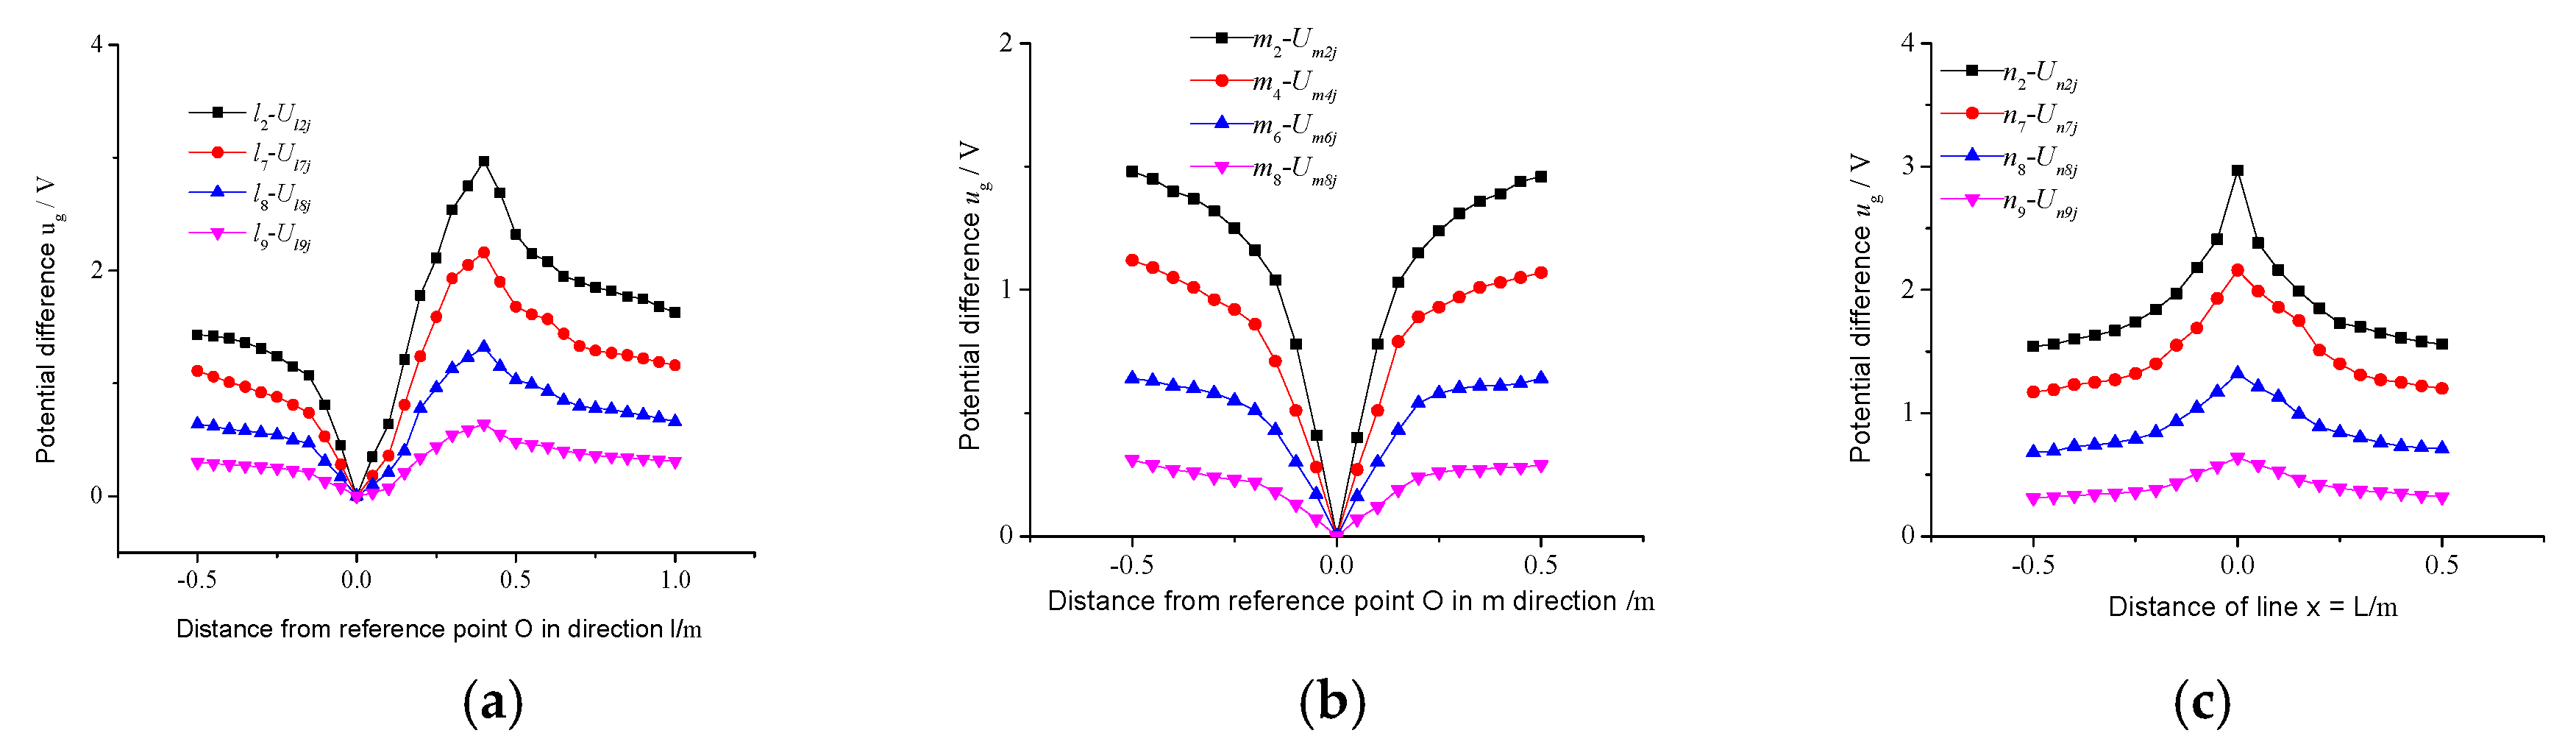
The obtained potential distribution curves in the l direction are l1, l4, l5, l6, as shown in Figure 18a. The potential distribution curves in the m direction are m1, m4, m5, m6, as shown in Figure 18b. The potential distribution curves in the n direction are n1, n4, n5, and n6, as shown in Figure 18c.
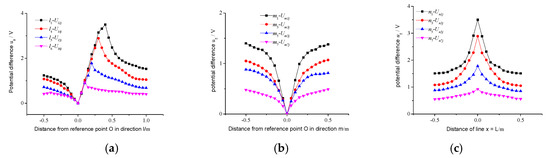
Figure 18.
Potential distribution curves. (a) Distance from reference point O in direction l; (b) Distance from reference point O in direction m; (c) Distance from the line x = L.
From the curves in the figure, it is concluded that the longer the subway line, the greater the potential difference, which is consistent with simulation results.
The second part of the experiment investigated the effect of the value of traction current on ground potential distribution. In this part, the current through the graphite rod was controlled as a single variable. The comparison of the parameters used in the experiment is shown in Table 6.
Table 6.
Experimental group parameter table for different conductor current.
It is concluded from curves in Figure 19 that as the current in the graphite rod increases, the ground potential difference increases proportionally. The essence is that the increase in the current causes the potential difference across the conductor to increase proportionally, which leads to a proportional increase in ground potential.
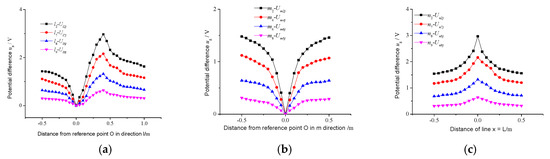
Figure 19.
Earth potential test results. (a) Distance from reference point O in direction l; (b) Distance from reference point O in direction m; (c) Distance from the line x = L.
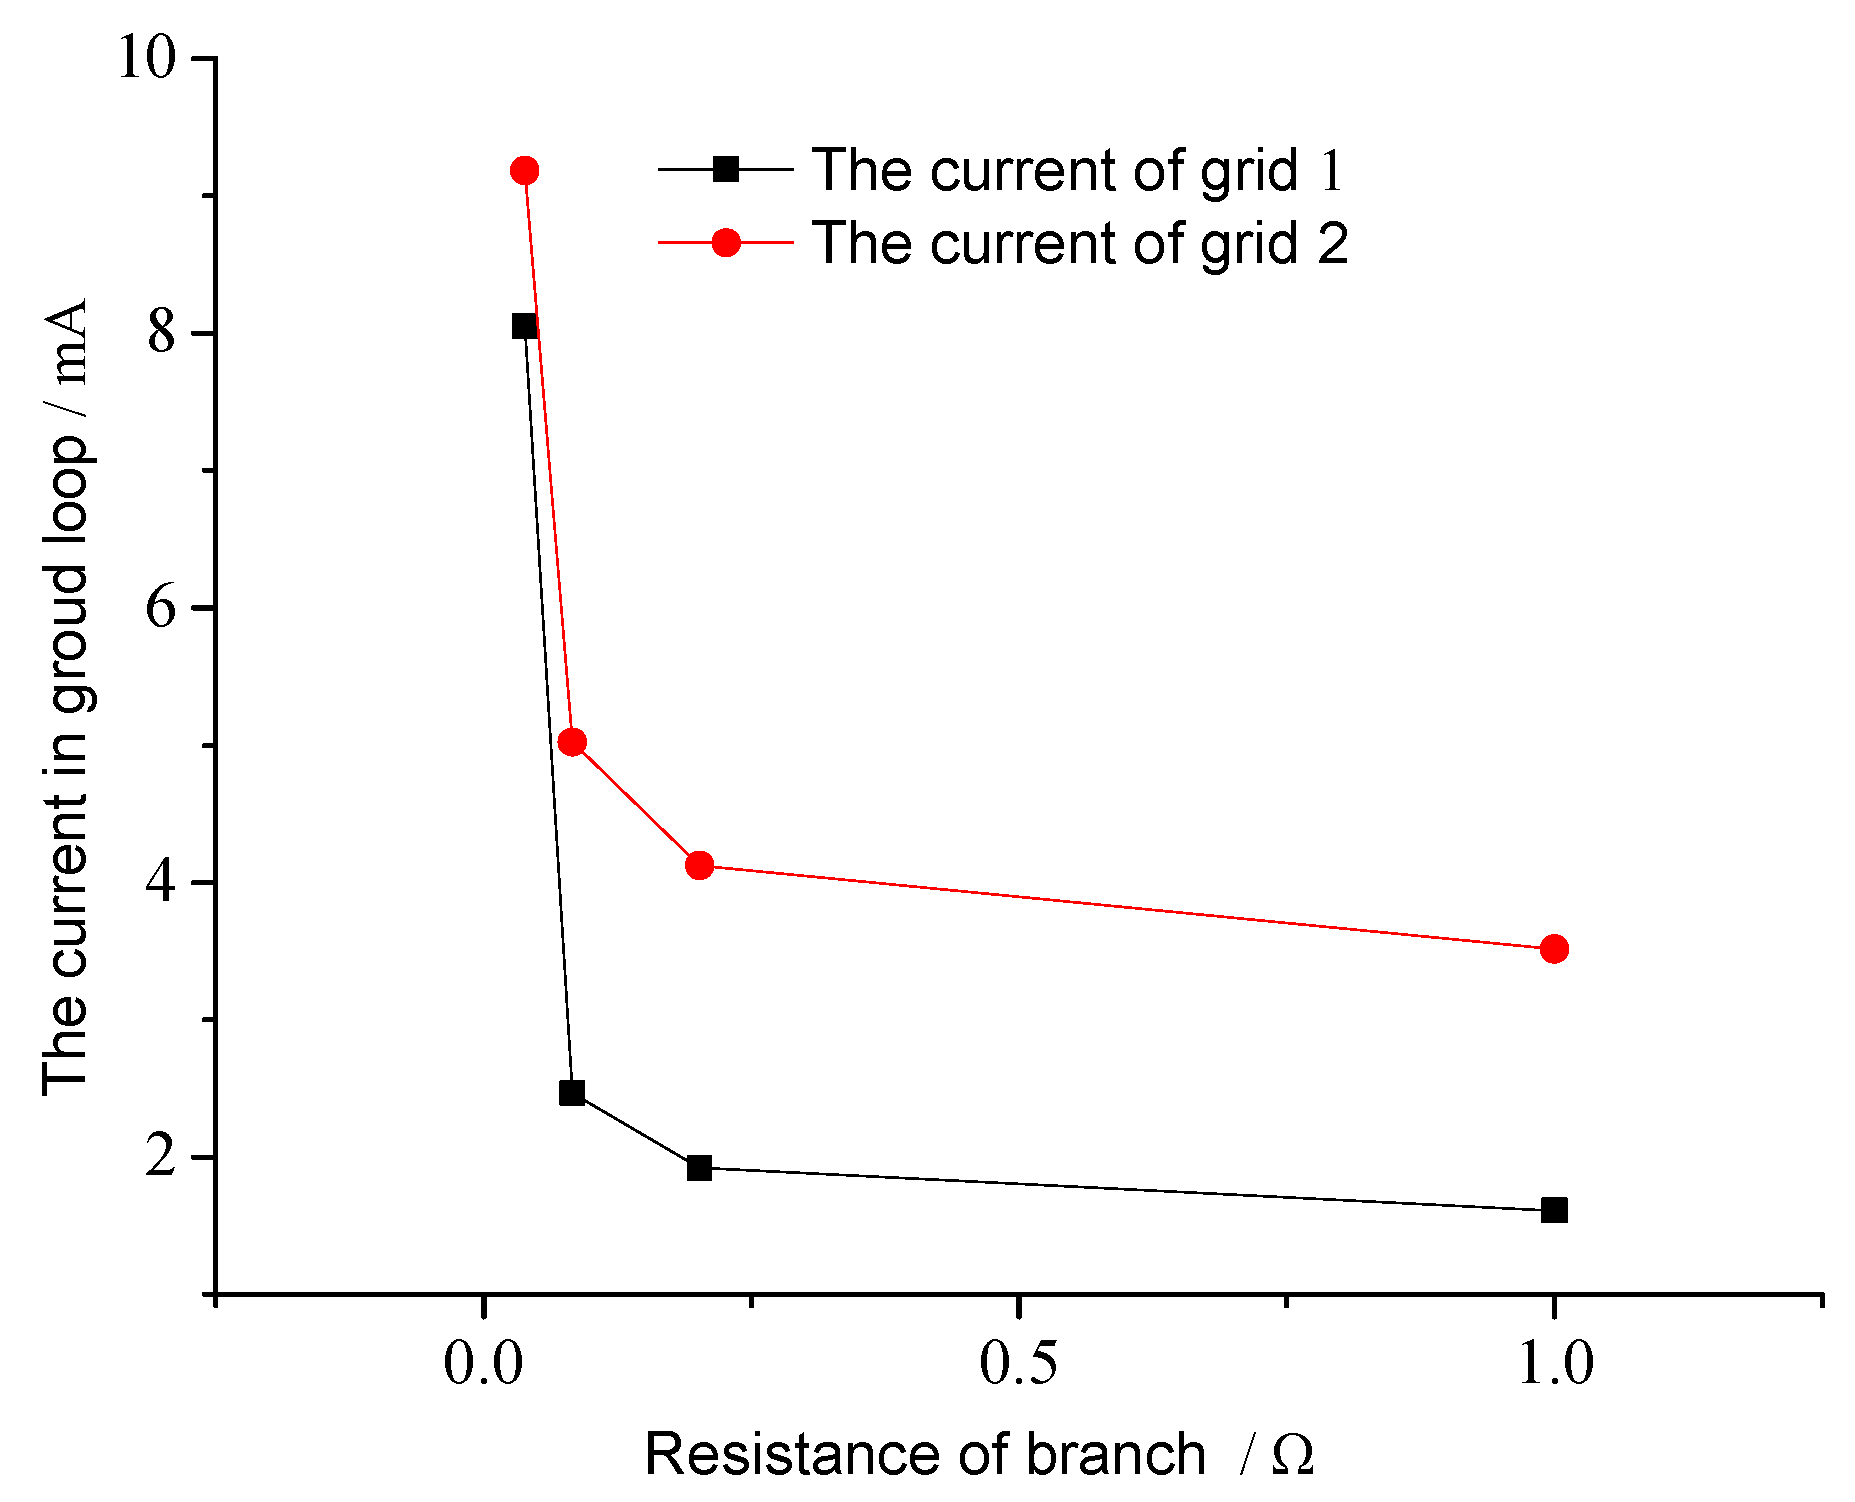
The third part of the experiment investigated the influence of the area of grounding grid of the current in the loop. In the experiment, the current was measured indirectly, because the leakage current from graphite rod to the ground was too small to measure. The current of the ground circuit was obtained using a high-precision multimeter to measure the potential difference between the two ground points and divide it by the resistance value of the ground circuit in series.
Two pieces of iron wire mesh with side lengths of 10 and 20 cm, respectively, were selected for the comparison of grounding grid parameters. The current in the graphite rod was 24 A. The results are shown in Table 7.
Table 7.
Experimental parameters of grounding circuit current.
By analyzing and calculating the data in Table 7, the loop currents in different situations were obtained, as shown in the Figure 20. It shows that the larger the area of the grounding grid, the larger the current in grounding loop is. This is in good agreement with the calculated data. This means that the model we have built is correct.

Figure 20.
Grounding circuit current test results.
6. Conclusions
This paper proposed an analytical model for the neutral point current of transformers near the subway. The impact of the operation of subway on the power grid is well illustrated. The calculation results of the model are compared with the existing stray current simulation results, and the calculation results are reliable enough to reflect the real situation. The DC intrusion caused by the operation of the subway is affected by many factors. The larger the number of grounding points, and the closer to the subway line it is, the higher the DC current of the grounding point. The traction current changes momentarily, resulting in the current component of the invading AC grid not only having DC but also containing higher harmonics. The results of confirmatory experiment in laboratory verify the rationality of the model in this paper.
Author Contributions
S.C. and S.W. contributed equally to this work; L.D. designed the experiments; S.C. preprocessed the data; S.C. analyzed the data and prepared the figures; S.C. and S.W. wrote the manuscript; L.D. contributed some ideas for this research; L.D. revised the manuscript. All authors have read and agreed to the published version of the manuscript.
Funding
This research received no external funding.
Conflicts of Interest
The authors declare no conflict of interest.
References
- Han, B.M.; Dai, W.; Zhang, H.J. Statistics and Analysis of Urban Rail Transit Operation in the World. Urban Express Rail Transit 2019. [Google Scholar]
- Xu, S.Y.; Li, W.; Wang, Y.Q. Effects of Vehicle Running Mode on Rail Potential and Stray Current in DC Mass Transit Systems. IEEE Trans. Veh. Technol. 2013, 62, 3569–3580. [Google Scholar]
- Zaboli, A.; Vahidi, B.; Yousefi, S.; Hosseini-Biyouki, M.M. Evaluation and Control of Stray Current in DC-Electrified Railway Systems. IEEE Trans. Veh. Technol. 2017, 66, 974–980. [Google Scholar] [CrossRef]
- Chen, Z.; Bai, B.; Chen, D.; Zhao, X. Research on the formation mechanism and suppression method of transformer DC bias. Trans. China Electro Tech. Soc. 2015, 30, 208–214. [Google Scholar]
- Price, P.R. Geomagnetically Induced Current Effects on Transformers. IEEE Power Eng. Rev. 2007, 17, 1002–1008. [Google Scholar] [CrossRef]
- Kitagawa, W.; Ishihara, Y.; Todaka, T.; Nakasaka, A. Analysis of structural defor-mation and vibration of a transformer core by using magnetic property of magnetostriction. Electr. Eng. Jpn. 2010, 172, 19–26. [Google Scholar] [CrossRef]
- Pan, Z.; Lu, Z.; Lin, J.; Wen, X. Influence of Horizontal Multi-layer Soil on DC Current Distribution in AC Power Grid. High Volt. Eng. 2012, 38, 855–862. [Google Scholar]
- Liu, L.; Yan, X.; Ma, C.L.; Wei, K.; Zhang, Y.B. Research of Converter Transformer Marshalling and Receiving-End Grid Structure’s Effect on Converter Transformer DC Bias. Power Syst. Technol. 2016, 40, 322–327. [Google Scholar]
- Jie, Z.; Bo, Z. Impact of Ground Wire in HVDC Transmission Line on Direct Current Flowing into Neutral Point of Power Transformer. Power Syst. Technol. 2005, 19, 211–237. [Google Scholar]
- Liu, S.; Li, C.; Shi, Y.; Qian, C.; Liu, L. Calculation of DC Current Caused by DC Ground Electrode in Traction Transformer of Electrified Railway. High Volt. Eng. 2017, 43, 2161–2166. [Google Scholar]
- Pan, Z.; Lu, Z.; Bo, T.; Mei, G.; Wen, X. Simulation and Analysis of HVDC Earth-return Current’s Distribution in AC Power Grid. Autom. Electr. Power Syst. 2011, 35, 110–115. [Google Scholar]
- Yu, Y.; Wei, C.; Zhu, L. Impact of HVDC ground electrode current on transformers with different structures. Power Syst. Prot. Control 2010, 38, 71–76. [Google Scholar]
- He, J.J.; Ye, H.S.; Lin, F.C.; Li, H.; Lu, Y.; Gui, Z. Influence of soil structure on direct current flowing into neutral point of power transformer. Proc. Csee 2007, 27, 14–18. [Google Scholar]
- Yang, Y.; Liu, X.; Chen, T.; Yang, F.; Xiang, D. Impact of soil structure adjacent to ground electrodes of UHVDC power transmission lines on DC bias of power transformers. Power Syst. Technol. 2012, 36, 26–32. [Google Scholar]
- Liu, P.; Guo, Q.; Yang, M.; Li, Z.; Lin, X.; Quan, J. Discussion about neutral point connection mode of transformer to inhibit DC bias. Gaodianya Jishu/High Volt. Eng. 2015, 41, 794–799. [Google Scholar]
- Ogunsola, A.; Mariscotti, A.; Sandrolini, L. Estimation of Stray Current from a DC-Electrified Railway and Impressed Potential on a Buried Pipe. IEEE Trans. Power Deliv. 2012, 27, 2238–2246. [Google Scholar] [CrossRef]
- Ogunsola, A.; Sandrolini, L.; Mariscotti, A. Evaluation of Stray Current from a DC-Electrified Railway with Integrated Electric–Electromechanical Modeling and Traffic Simulation. IEEE Trans. Ind. Appl. 2015, 51, 5431–5441. [Google Scholar] [CrossRef]
- Cerman, A.; Janíček, F.; Kubala, M. Resistive-type Network Model of Stray Current Distribution in Railway DC Traction System. In Proceedings of the International Scientific Conference on Electric Power Engineering, Kouty nad Desnou, Czechia, 20–22 May 2015. [Google Scholar]
- Mccollum, B.; Ahlborn, G.H. The influence of frequency of alternating or infrequently reversed current on electrolytic corrosion. Proc. Am. Inst. Electr. Eng. 2013, 35, 371–397. [Google Scholar] [CrossRef]
- Brenna, M.; Dolara, A.; Leva, S.; Zaninelli, D. Effects of the DC stray currents on metro tunnel structures evaluated by FEM analysis. Power Energy Soc. Gen. Meet. IEEE 2010, 89, 1–7. [Google Scholar]
- Bahra, K.S.; Catlow, R.B. Control of Stray Currents for DC Traction Systems. In Proceedings of the International Conference on Electric Railways in A United Europe, Amsterdam, The Netherlands, 27–30 March 1995; pp. 136–142. [Google Scholar]
- Ma, J.; Dawalibi, F.P.; Daily, W.K. Analysis of grounding systems in soils with hemispherical layering. IEEE Trans. Power Deliv. 2002, 8, 1773–1781. [Google Scholar] [CrossRef]
- Lee, C.H.; Wang, H.M. Effects of grounding schemes on rail potential and stray currents in Taipei Rail Transit Systems. IEEE Proc. Electr. Power Appl. 2001, 148, 148–154. [Google Scholar] [CrossRef]


© 2020 by the authors. Licensee MDPI, Basel, Switzerland. This article is an open access article distributed under the terms and conditions of the Creative Commons Attribution (CC BY) license (http://creativecommons.org/licenses/by/4.0/).