Article

Forecasting of Hypoallergenic Wheat Productivity Based on Unmanned Aerial Vehicles Remote Sensing Approach—Case Study

1
Department of Agroecology and Crop Production, University of Agriculture in Krakow, 31-120 Krakow, Poland
2
Department of Physiology, Plant Breeding and Seed Production, University of Agriculture in Krakow, 30-239 Krakow, Poland
3
Department of Forest Resource Management, Faculty of Forestry, University of Agriculture in Krakow, 31-425 Krakow, Poland
4
The Franciszek Górski Institute of Plant Physiology, Polish Academy of Sciences, 31-342 Krakow, Poland
5
Cereal Crop Department, Institute of Soil Science and Plant Cultivation, 24-100 Puławy, Poland
6
Department of Statistics and Social Policy, University of Agriculture in Krakow, 31-120 Krakow, Poland
*
Author to whom correspondence should be addressed.
Agriculture 2023, 13(2), 282; https://doi.org/10.3390/agriculture13020282
Submission received: 8 December 2022 / Revised: 16 January 2023 / Accepted: 20 January 2023 / Published: 24 January 2023

Abstract

:
Remote sensing methods based on UAV and hand-held devices as well have been used to assess the response to nitrogen and sulfur fertilization of hypoallergenic genotypes of winter wheat. The field experiment was conducted using the split-split-plot design with three repetitions. The first factor was the two genotypes of winter wheat specified as V1 (without allergic protein) and V2 (with allergic protein), and the second factor was three doses of sulfur fertilization: 0, 20 and 40 kg S per ha. The third factor consisted of six doses of nitrogen fertilization: 0, 40, 60, 80, 100 and 120 kg N·ha−1. Monitoring the values of the indicators depending on the level of nitrogen and sulfur fertilization allowed the results to be used in yield forecasting, assessment of plant condition, LAI value, nutritional status in the cultivation of wheat. The maximum yield should be expected at doses of 94 and 101 kg N ha−1 for genotypes V1 and V2, respectively, giving yields of 5.39 and 4.71 Mg ha−1. On the basis of the tested vegetation indices, the highest doses of N should be applied using the normalized difference RedEdge (NDRE), and the lowest ones based on the enhanced vegetation index (EVI), and, in the latter case, a reduction in yield of more than 200 kg ha−1 in the V2 genotype should be taken into account.

1. Introduction

Wheat is one of the most important crops used by humans for food production. In terms of the size of the harvested grain yield, it ranks second in the world, directly after maize. Wheat flour is the only raw material whose protein components have the potential to create gluten—a protein substance that determines its baking properties. Gluten is made up of two highly polymorphic groups of proteins—gliadins and glutenins. The differentiation of the physicochemical structure of their fractions and subunits is genetically determined [1]. Despite the significant differences, gliadin and glutenin also have a number of common traits, including the most prominent share of proline and glutamine, which account for 17 and 40% of all amino acids, respectively. They are therefore referred to as prolamins [2]. Both groups of proteins make up more than 80% of gluten by weight [3]. However, in addition to their beneficial functional properties, as food allergens, prolamin proteins may negatively affect human health. In the case of people allergic to gluten, they cause a number of diseases, such as gluten enteropathy, atopic dermatitis (Dühring’s disease), urticaria, asthma, angioedema, food allergy to gluten, gluten ataxia, non-celiac gluten sensitivity and even anaphylactic shock directly threatening life (wheat-dependent exercise-induced anaphylaxis—WDEIA) [4,5,6,7].
The work of Waga and Skoczowski [8] resulted in the creation of winter wheat hybrid lines V1 (wasko.gl−) with a significantly reduced number of highly allergenic gliadin proteins from the ω group and low molecular weight glutenins (the so-called D-type LMW glutenin). These lines were created by traditional breeding methods based on combinations of crosses and selection supported by electrophoretic studies of gliadin and glutenin proteins. Basic agronomical research [9] has already been conducted to verify the impact of N-fertilization on the protein structure of hypoallergenic wheat genotypes. However, no essential field studies have been carried out to assess the effect of N-fertilization of new hypoallergenic wheat genotypes on the vegetation indices values measured by remote sensing techniques.
Remote sensing research consists in acquiring, processing and interpreting data characterizing the tested object in terms of the amount of reflected or emitted electromagnetic radiation [10,11,12]. Different spectral responses by plants can be acquired by sensors (e.g., multispectral, thermal or hyperspectral) mounted on airborne (aircraft; UAV—unmanned aerial vehicles), satellite (e.g., SENTINEL-2 ESA) or ground-based devices (e.g., field spectrometers).
Remote sensing of crops based on different scale-level remote sensing sensors (from UAV, trough aerial and satellite) has been improved by applied research and state-of-the art technology over the last years [10,11,12]. The innovative unmanned aerial vehicles (UAVs) seems to be the most advanced tool for high resolution (spatial, spectral, radiometrical and time) data collection as a monitoring platform for smart precision agriculture, and sometimes as a tool for direct treatments (e.g., spreading herbicides) [10,11,12].
Using UAVs, digital imagery can achieve a spatial resolution (GSD—ground sample distance) of a single cm (e.g., enabling researchers to count the plant density or detect diseases) helping precision agriculture applications in the monitoring of vegetation growth. The UAV platforms (also called UAS) can be equipped with different digital cameras, such as: high-resolution RGB (e.g., 45 Mpx), multispectral (e.g., 5 bands), hyperspectral (e.g., 220 bands) or thermal. In addition to spectral information, the 3D point cloud based on LiDAR sensors can be acquired, delivering much crucial information about the biometric data (e.g., height or cover density of the canopy). Such sensors allow the monitoring of changes happening during the vegetation season due to plant growth phases and different limitation factors (diseases, drought, wind etc.). In many studies the ground-truth and UAV collected information was useful for the better tuning of spectral reflection acquired by satellite remote sensing sensors, covering wide areas [10,11,12]. Such an approach based on spectral information enables the development of many so-called vegetation indices (e.g., LAI, NDVI) used for mathematical models describing, e.g., soil moisture, health conditions or approximated yield. According to Huete and Justice [13], the vegetation index should be highly correlated with the biophysical parameters of plants, the most common of which are: biomass, leaf area index (LAI) and absorbed photosynthetically active radiation (PAR). The most commonly used vegetation index is the NDVI (normalized difference vegetation index). In measurements of the vegetation state, the NDVI values most often range from 0.0 to +0.8 [14,15,16,17].
Scientific research has shown a strong correlation between the LAI value and the vegetation indices, with differentiation in the strength of the correlation with respect to different indices. In turn, the LAI index depends on the phase of plant development and the applied agrotechnical treatments, in particular nitrogen and sulfur fertilization, which affect the efficiency of nitrogen application [18]. Many model experiments on the fertilization of wheat cultivars have been carried out [19,20,21,22,23,24]. However, due to the need to search for genotypes that are less allergenic to people, there is a return to the older type of varieties, characterized by lower requirements as to the level of nitrogen fertilization. Monitoring the values of the indicators depending on the level of nitrogen and sulfur fertilization allows the results to be used in yield forecasting, assessment of plant condition, LAI value, nutritional status and stress conditions in the cultivation of hypoallergenic wheat. The null hypothesis assumes that a genotype containing the complete set of allergenic proteins and one which is completely devoid of these proteins will show similar values of vegetation indices and a similar reaction to a specific technological path. The purpose of this study was to determine the usefulness of selected vegetation indices obtained using a remote method to assess the yield, nutritional status and fertilization needs of the two specific genotypes of winter wheat (Figure 1): V1 genotype (model line of wasko.gl (−)—devoid of the main fractions of allergenic gluten proteins) and V2 genotype (model line of wasko.gl (+)—containing the full set of allergenic proteins).

2. Materials and Methods

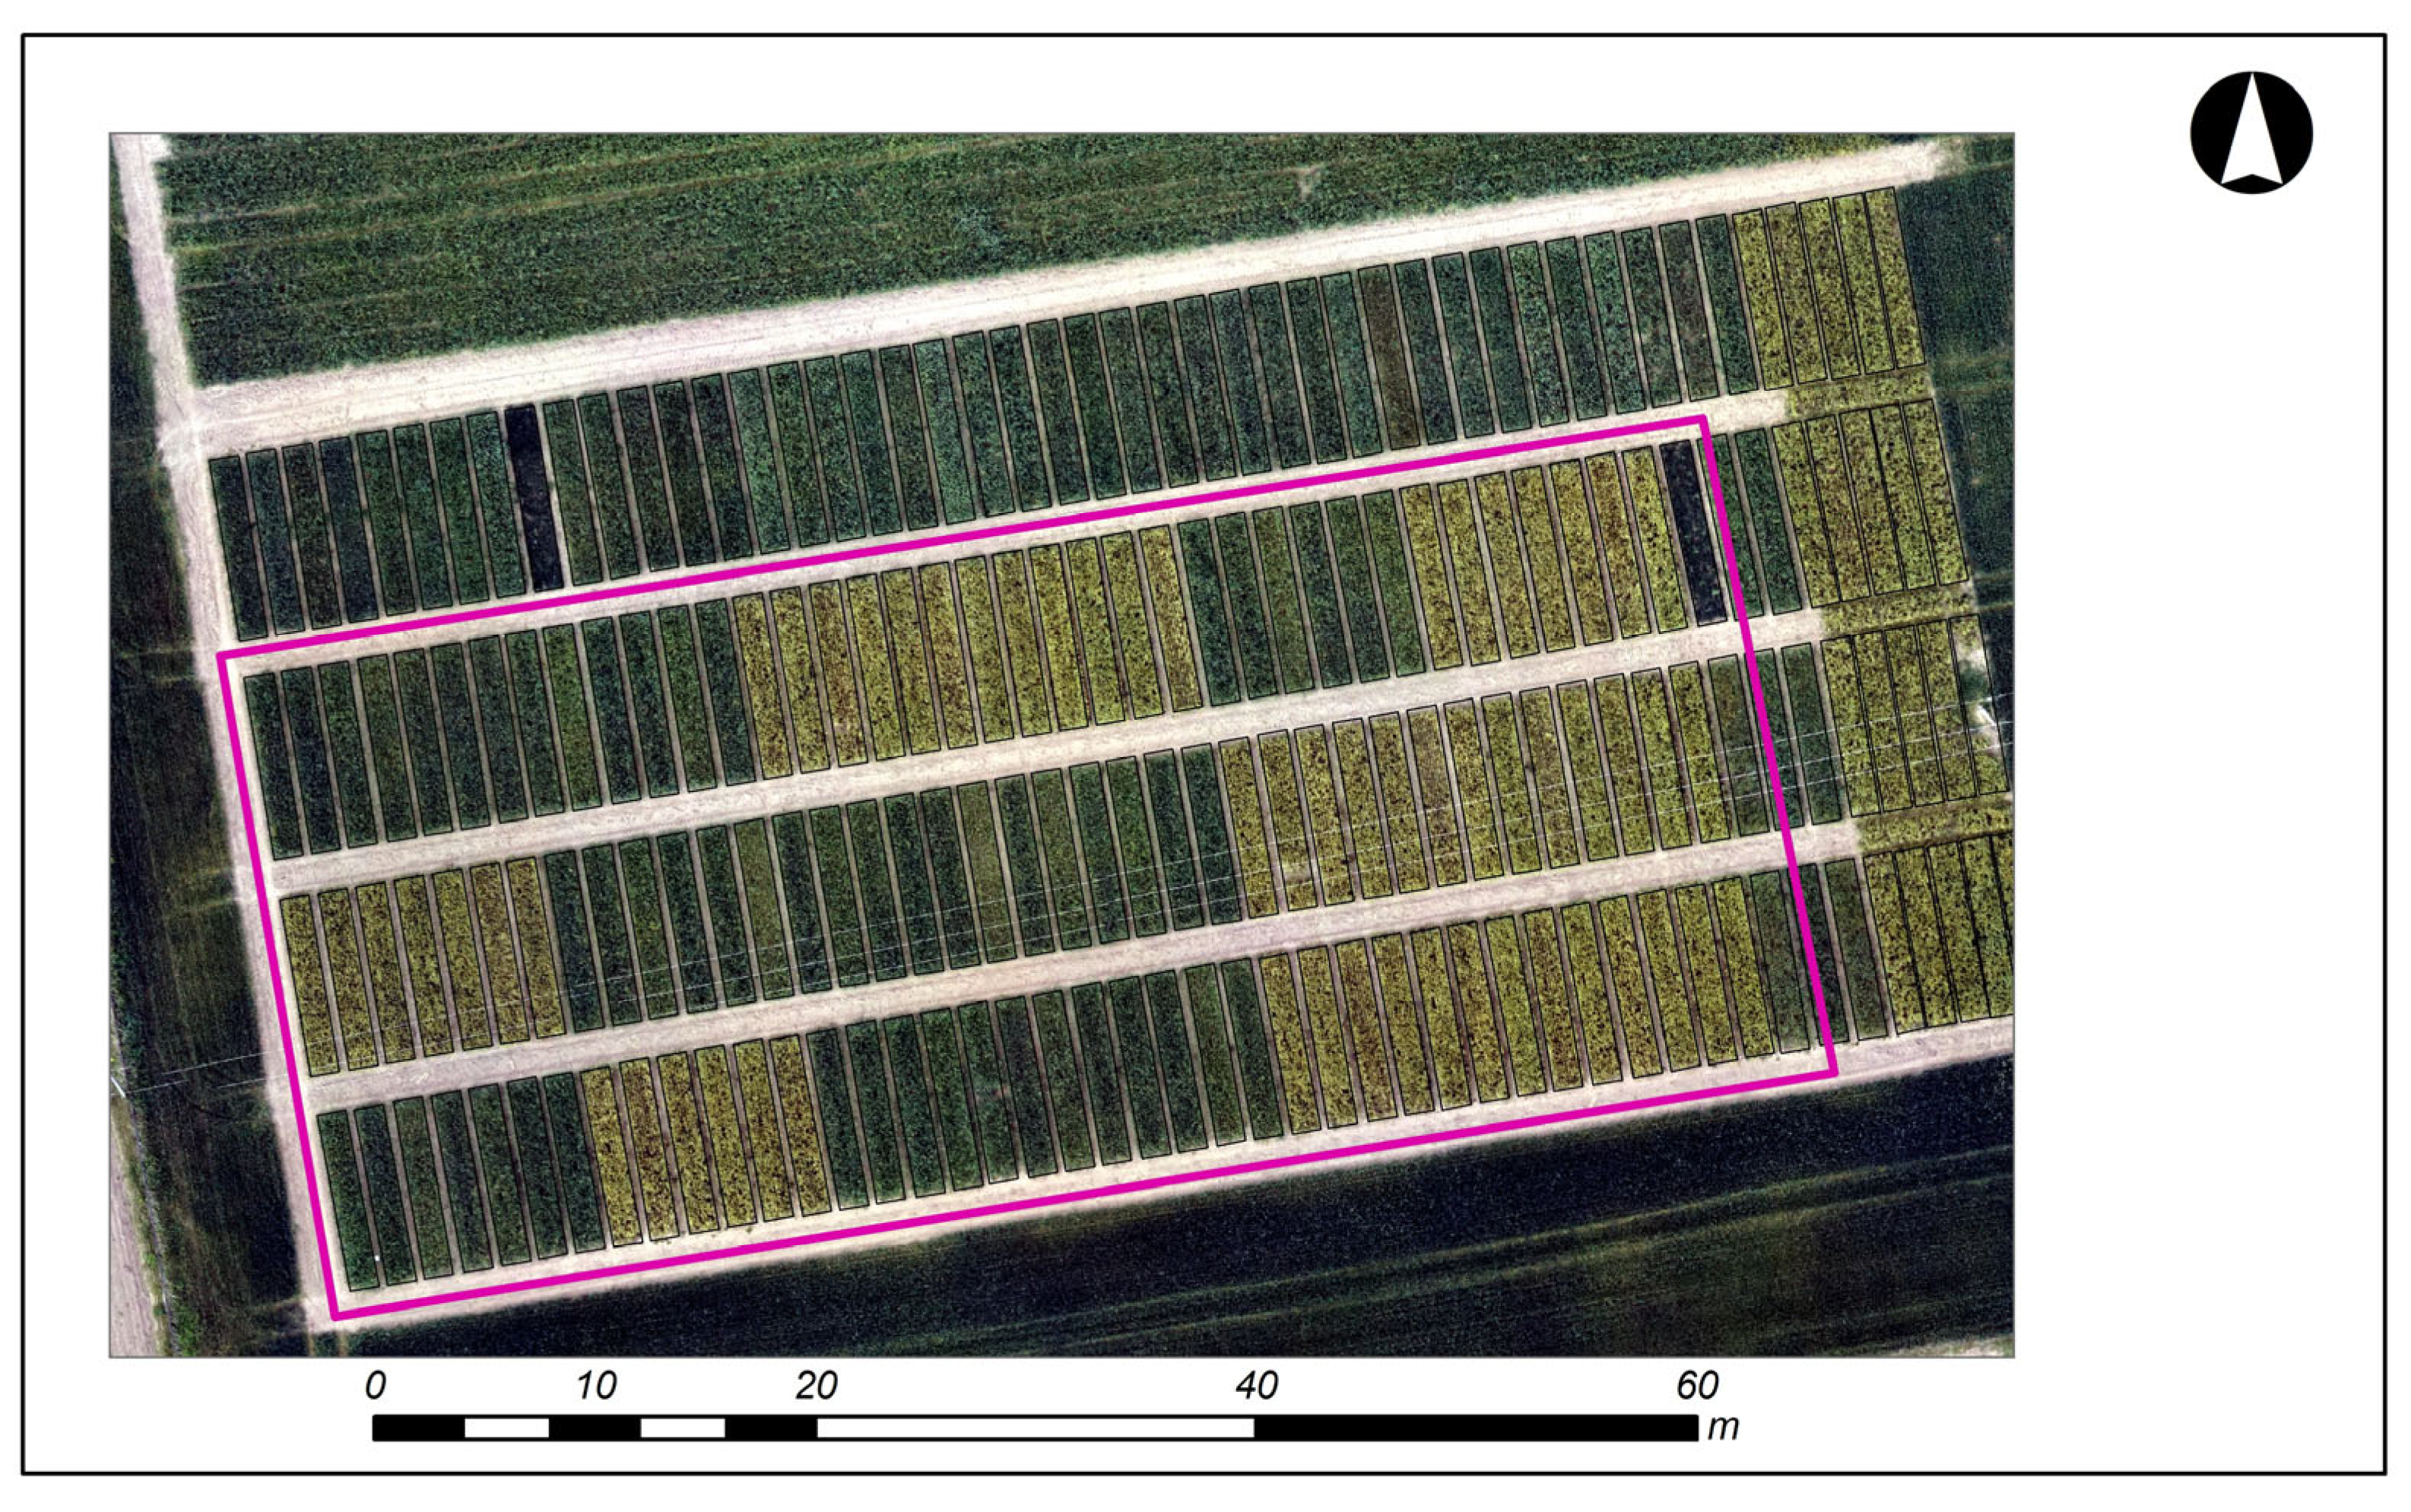
2.1. Experimental Conditions and Treatments

The study was conducted at the Prusy Experimental Station of the University of Agriculture in Krakow, located near Krakow (50°07′28′′ N, 20°05ʹ34′′ E), Poland, during the 2019/2020 vegetation season. The research was conducted using the split-split-plot design with three replications. The first factor was the two genotypes of winter wheat specified as V1 (without allergenic protein) and V2 (with allergenic protein), and the second factor was three doses of sulfur fertilization (S dose) as S1—0, S2—20 and S3—40 kg S ha−1. The third factor consisted of 6 doses of nitrogen fertilization (N dose) as N1—0, N2—40, N3—60, N4—80, N5—100 and N6—120 kg N ha−1, respectively. The size of the small plots was 11.2 m2. The experiment was established on chernozem. The soil was in the heavy category (36% fraction < 0.02 mm), with an acid reaction (pHKCl 6.2), low content of sulfur and medium content of available phosphorus (68 mg kg−1 DM), as well as of potassium (125 mg kg−1 DM).

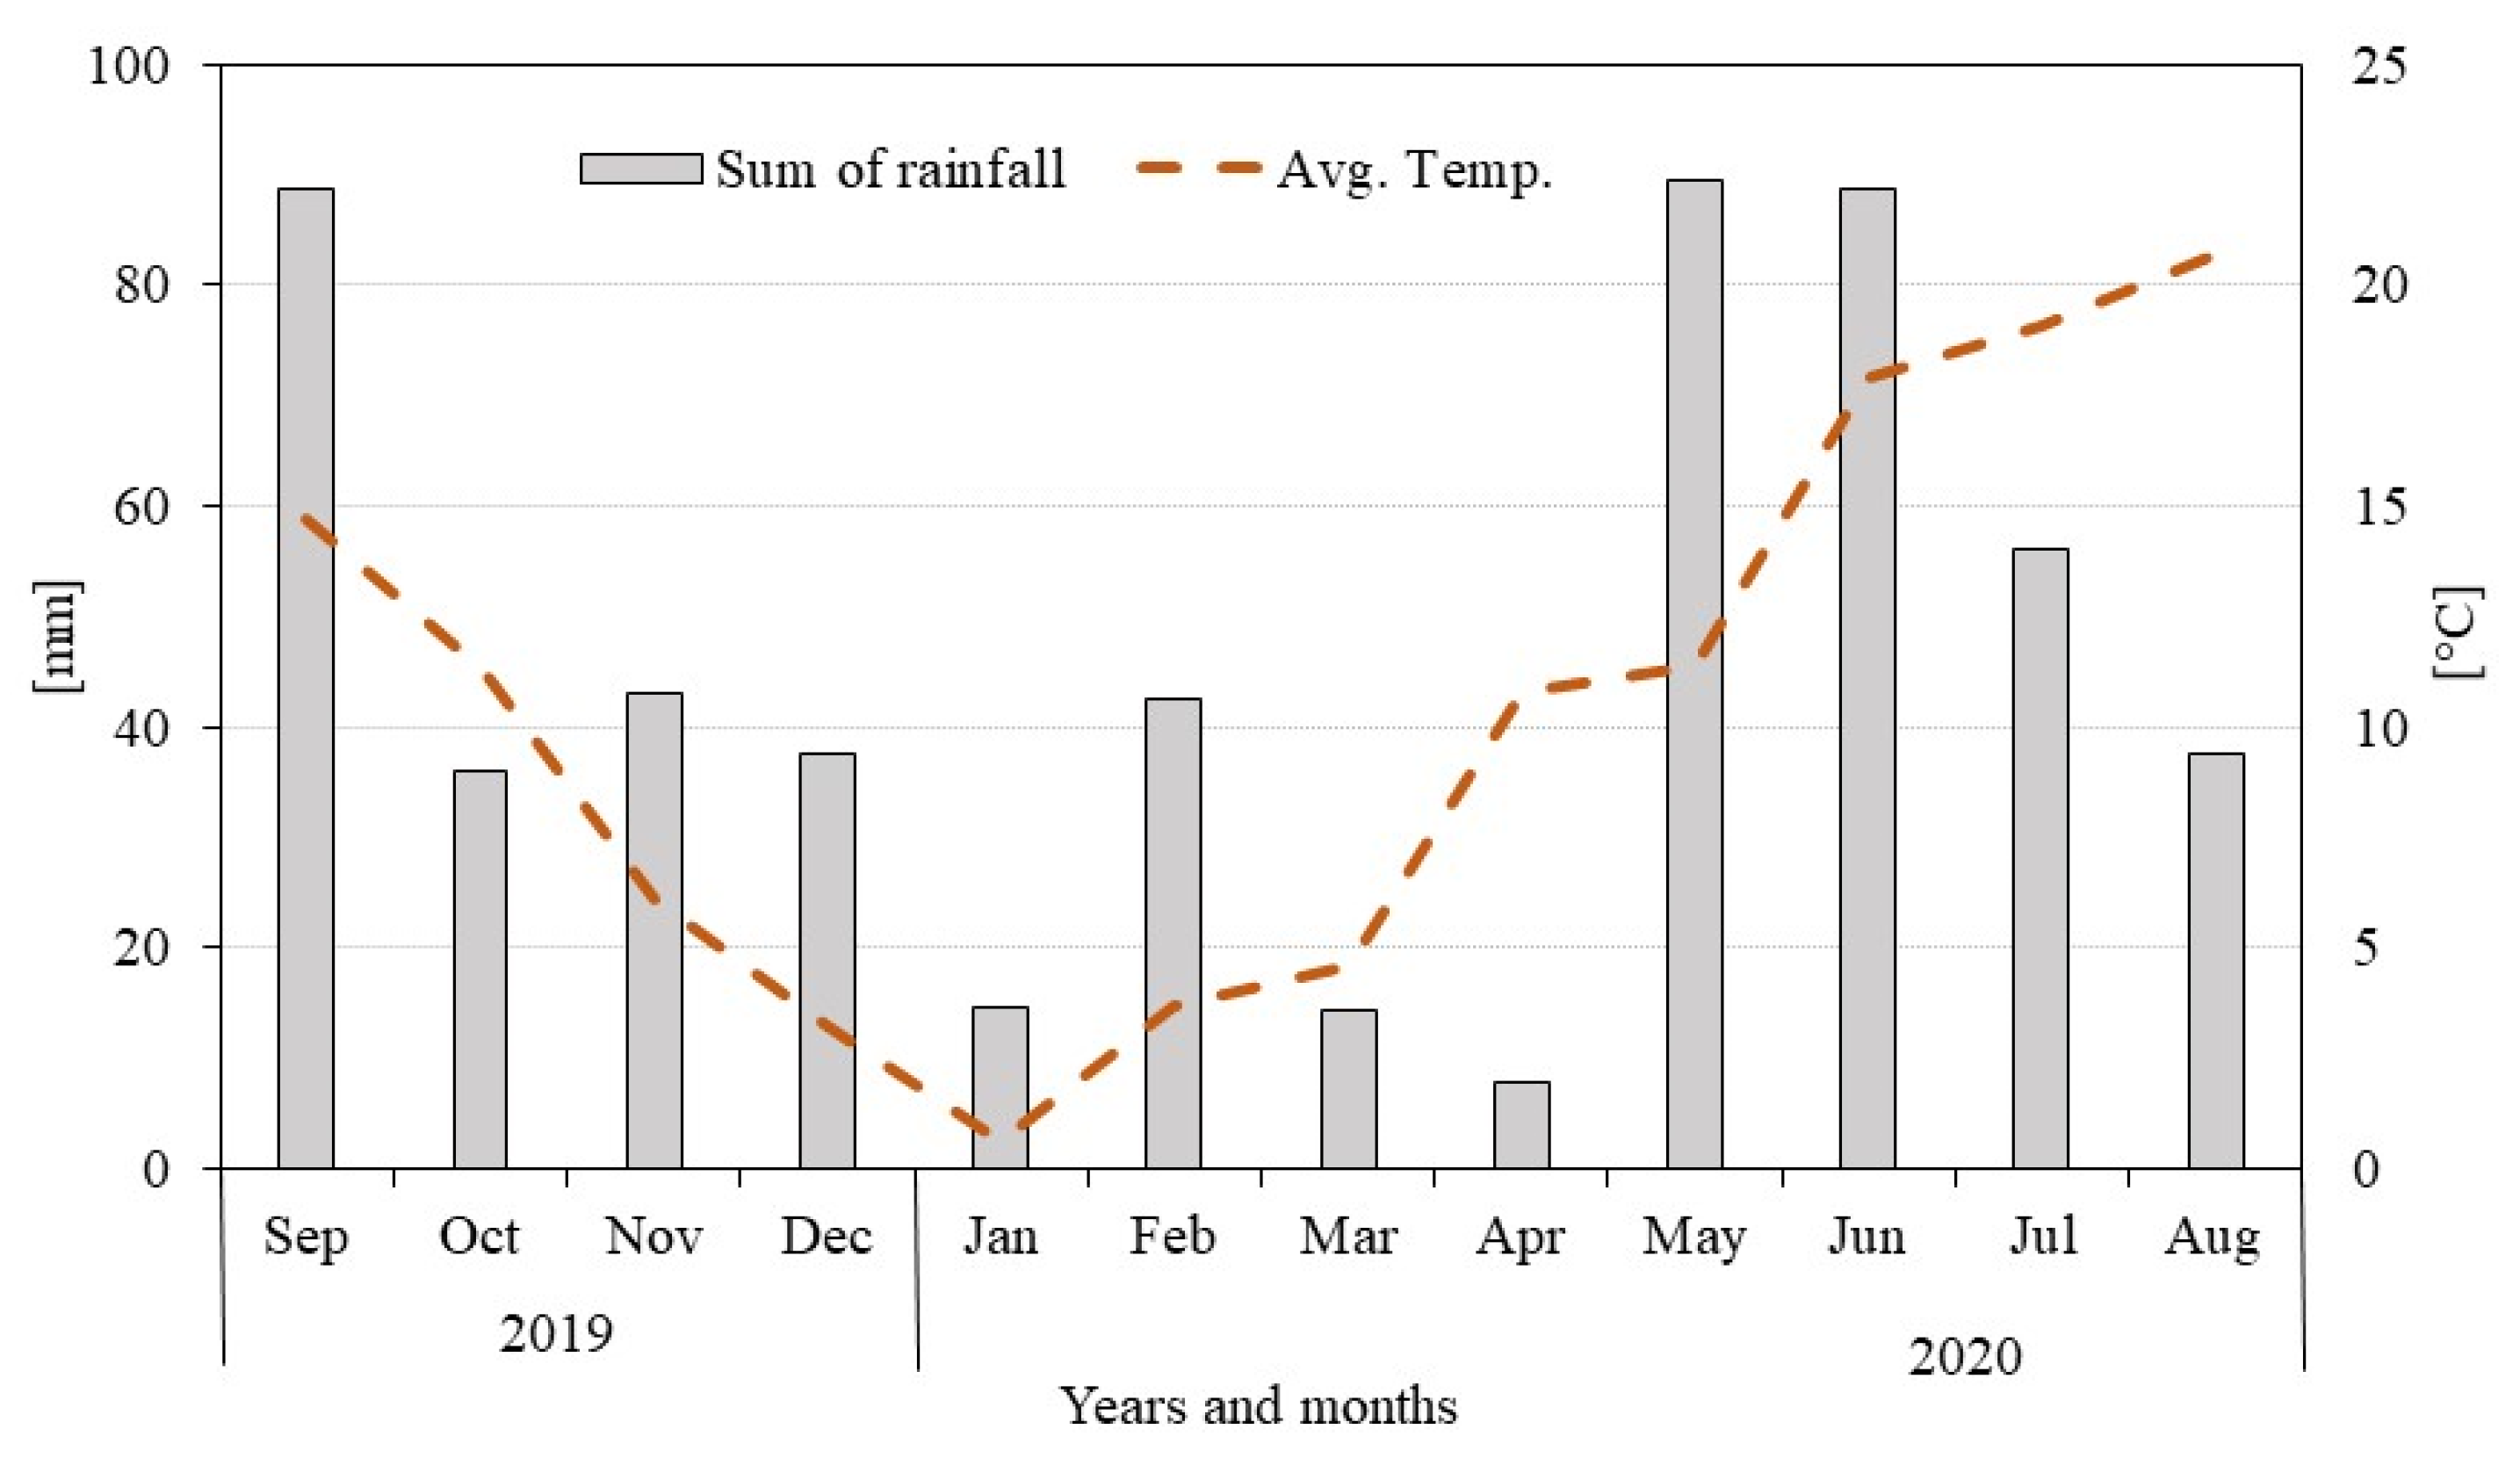
2.2. Meteorological Conditions

The total precipitation during the growing season of winter wheat was 556.7 mm, and the average temperature for this period was 10.3 °C. In early spring (April), there were shortages of rainfall, which was manifested by yellowing of leaves in the shooting phase (BBCH 32), (Figure 2). This is a critical period in wheat development in terms of water needs. Water deficiency during this period can significantly reduce the level of yield, depending on the sensitivity of the genotype, and modify the efficiency of nitrogen utilization by plants. In May and June, optimum water requirement for wheat growth was observed, which positively influenced the inflorescence phase. Water shortage was observed at the early and late ripening phases, which had limited effect on yield formation.

2.3. UAV Remote Sensing

For the purposes of the experiment, a fixed-wing UAV platform was used, i.e., e-VTOL TRINITY F90+ (Quantum-Systems GmbH, Gliching, Germany), with a photogrammetric payload of double digital cameras: (i) high resolution RGB SONY UMC R10C 20.1 Mpx and (ii) multispectral RedEdge-M (MicaSense). Photos taken simultaneously in an automatic mission with these cameras (operator: ProGea SKY, Kraków, Poland) were designed with 75% side overlap and 75% frontal overlap, at the flight altitude of 75 m AGL. This allowed a field resolution of 2.0 cm for RGB orthoimagery (SONY Corporation, Tokio, Japan) and 5.2 cm GSD for 5-band imagery (MicaSense, Seattle, WA, USA) to be obtained. The spectral resolution of the RedEdge-M (MicaSense) camera is 5 spectral bands: RGB, RedEdge and NIR. The spectral specificity of the range of individual bands is presented in Table 1. The pilot performed an automatic mission on 22 May 2020 at peak sun hours in clear weather using two additional photos of dedicated calibration panel (MicaSense, Seattle, WA, USA), one before and one after the mission. Generation of orthoimages (*.TIFF; EPSG 2180) for 3-band RGB (SONY) and 5-band (RedEdge-M using calibration images) was performed using Metashape (Agisoft LCC, Petersburg, Russia) software (Figure 3). The geometric accuracy of the pixel position on the orthophotomap, according to the Meatashape report, about 3 cm (XY; RGB), was possible thanks to the use of the PPK (post processing kinematic) process using the local GNSS base station and 6 GCPs (Ground Control Points) measured with the RTK (Real Time Kinematic) GNSS method (Real Time Network; RMS 2.0 cm XYZ).
Based on the measurements performed in 5 spectral bands, the following vegetation indices were calculated based on equations (Table 2).

2.4. Agrotechnical Details

The crop previous to the wheat was winter rape, followed by disking and plowing, harrowing and the cultivation of soil for sowing with an aggregate consisting of a cultivator and a string roller. Before establishing the experiment, phosphorus and potassium fertilizers were applied in amounts of 105 kg P2O5 and 100 kg K2O ha−1 in the form of triple superphosphate and potassium salt and potassium sulfate (source of sulfur). Fertilization was applied in following pattern—S1: 184 kg potassium salt 60% + 263 kg superphosphate 40%; S2—111 kg potassium sulfate 50% + 91 kg potassium salt 60% + 263 kg superphosphate 40%; S3—222 kg potassium sulfate 50% + 263 kg superphosphate 40%.
The winter wheat was sown on 4 October 2019 in an amount of 350 grains per 1 m2. The row spacing was 14 cm and the depth was 3 cm. The doses of nitrogen were applied in the following amounts and at the following times: N0—no nitrogen, N1—40 kg start vegetation (BBCH 25—6 March 2020), N2—60 kg (30 kg—beginning of spring vegetation (BBCH 25—6 March 2020) + 30 kg—shooting stage (BBCH 32—20 April 2020)), N3—80 kg (40 kg—(BBCH 25) + 40 kg—(BBCH 32)), N4—100 kg (50 kg—(BBCH 25) + 50 kg—(BBCH 32)), N5—120 kg (60 kg—(BBCH 25) + 60 kg—(BBCH 32)). Wheat was harvested with a plot combine machine during the full grain maturity stage (29 July 2020).

2.5. Vegetation Indices

LAI and NDVI indices were measured using the SunScan System with BF2 ground devices from Delta-T and an NTech Model 505 GreenSeeker HandHeld and calculated from the single image bands obtained by RedEdge-M (MicaSesne). Measurements were taken from the ground on 19 March 2020, 7 May, and 19 May 2020, and from UAV on 22 May 2020.
The geographic information system (GIS) raster layers representing vegetation indices selected for the study were generated and processed using ArcMap ArcGIS ver. 10.4. (Esri) software. The several GIS spatial analyses were performed to obtain the statistics (Zonal statistics) for every single investigation plot vectorized on high resolution 2 cm GSD RGB orthophoto. As the result the *.CSV file with basic statistics for every plot was exported.

2.6. Calculations and Statistical Analysis

The results for individual traits were statistically processed using the analysis of variance, simple correlation and curvilinear regression analysis (2nd-degree polynomials). The analysis of variance was performed for a 3-factor experiment in a split-split-plot design in 3 replications. The analysis was performed using Excel and Statistica software. Correlation analysis was performed for the mean values of individual indices and the grain yield. Based on the values for interaction of genotype x fertilization with N or S, the production functions for the grain yield were determined using the 2nd-degree polynomials separately for both genotypes.
Similar calculations were performed for individual vegetation indices, thus determining the level of nitrogen fertilization for the maximum value of the indices described by the square equation. The forecast of the production function and yield for both genotypes was calculated at the designated doses of nitrogen. The doses determined from the production function and from the function of the course of the trend for vegetation indices, as well as the expected yields, cancelled each other out and the dose reduction was calculated in the case of reaching the maximum value of the index and the corresponding level of yield reduction.

3. Results

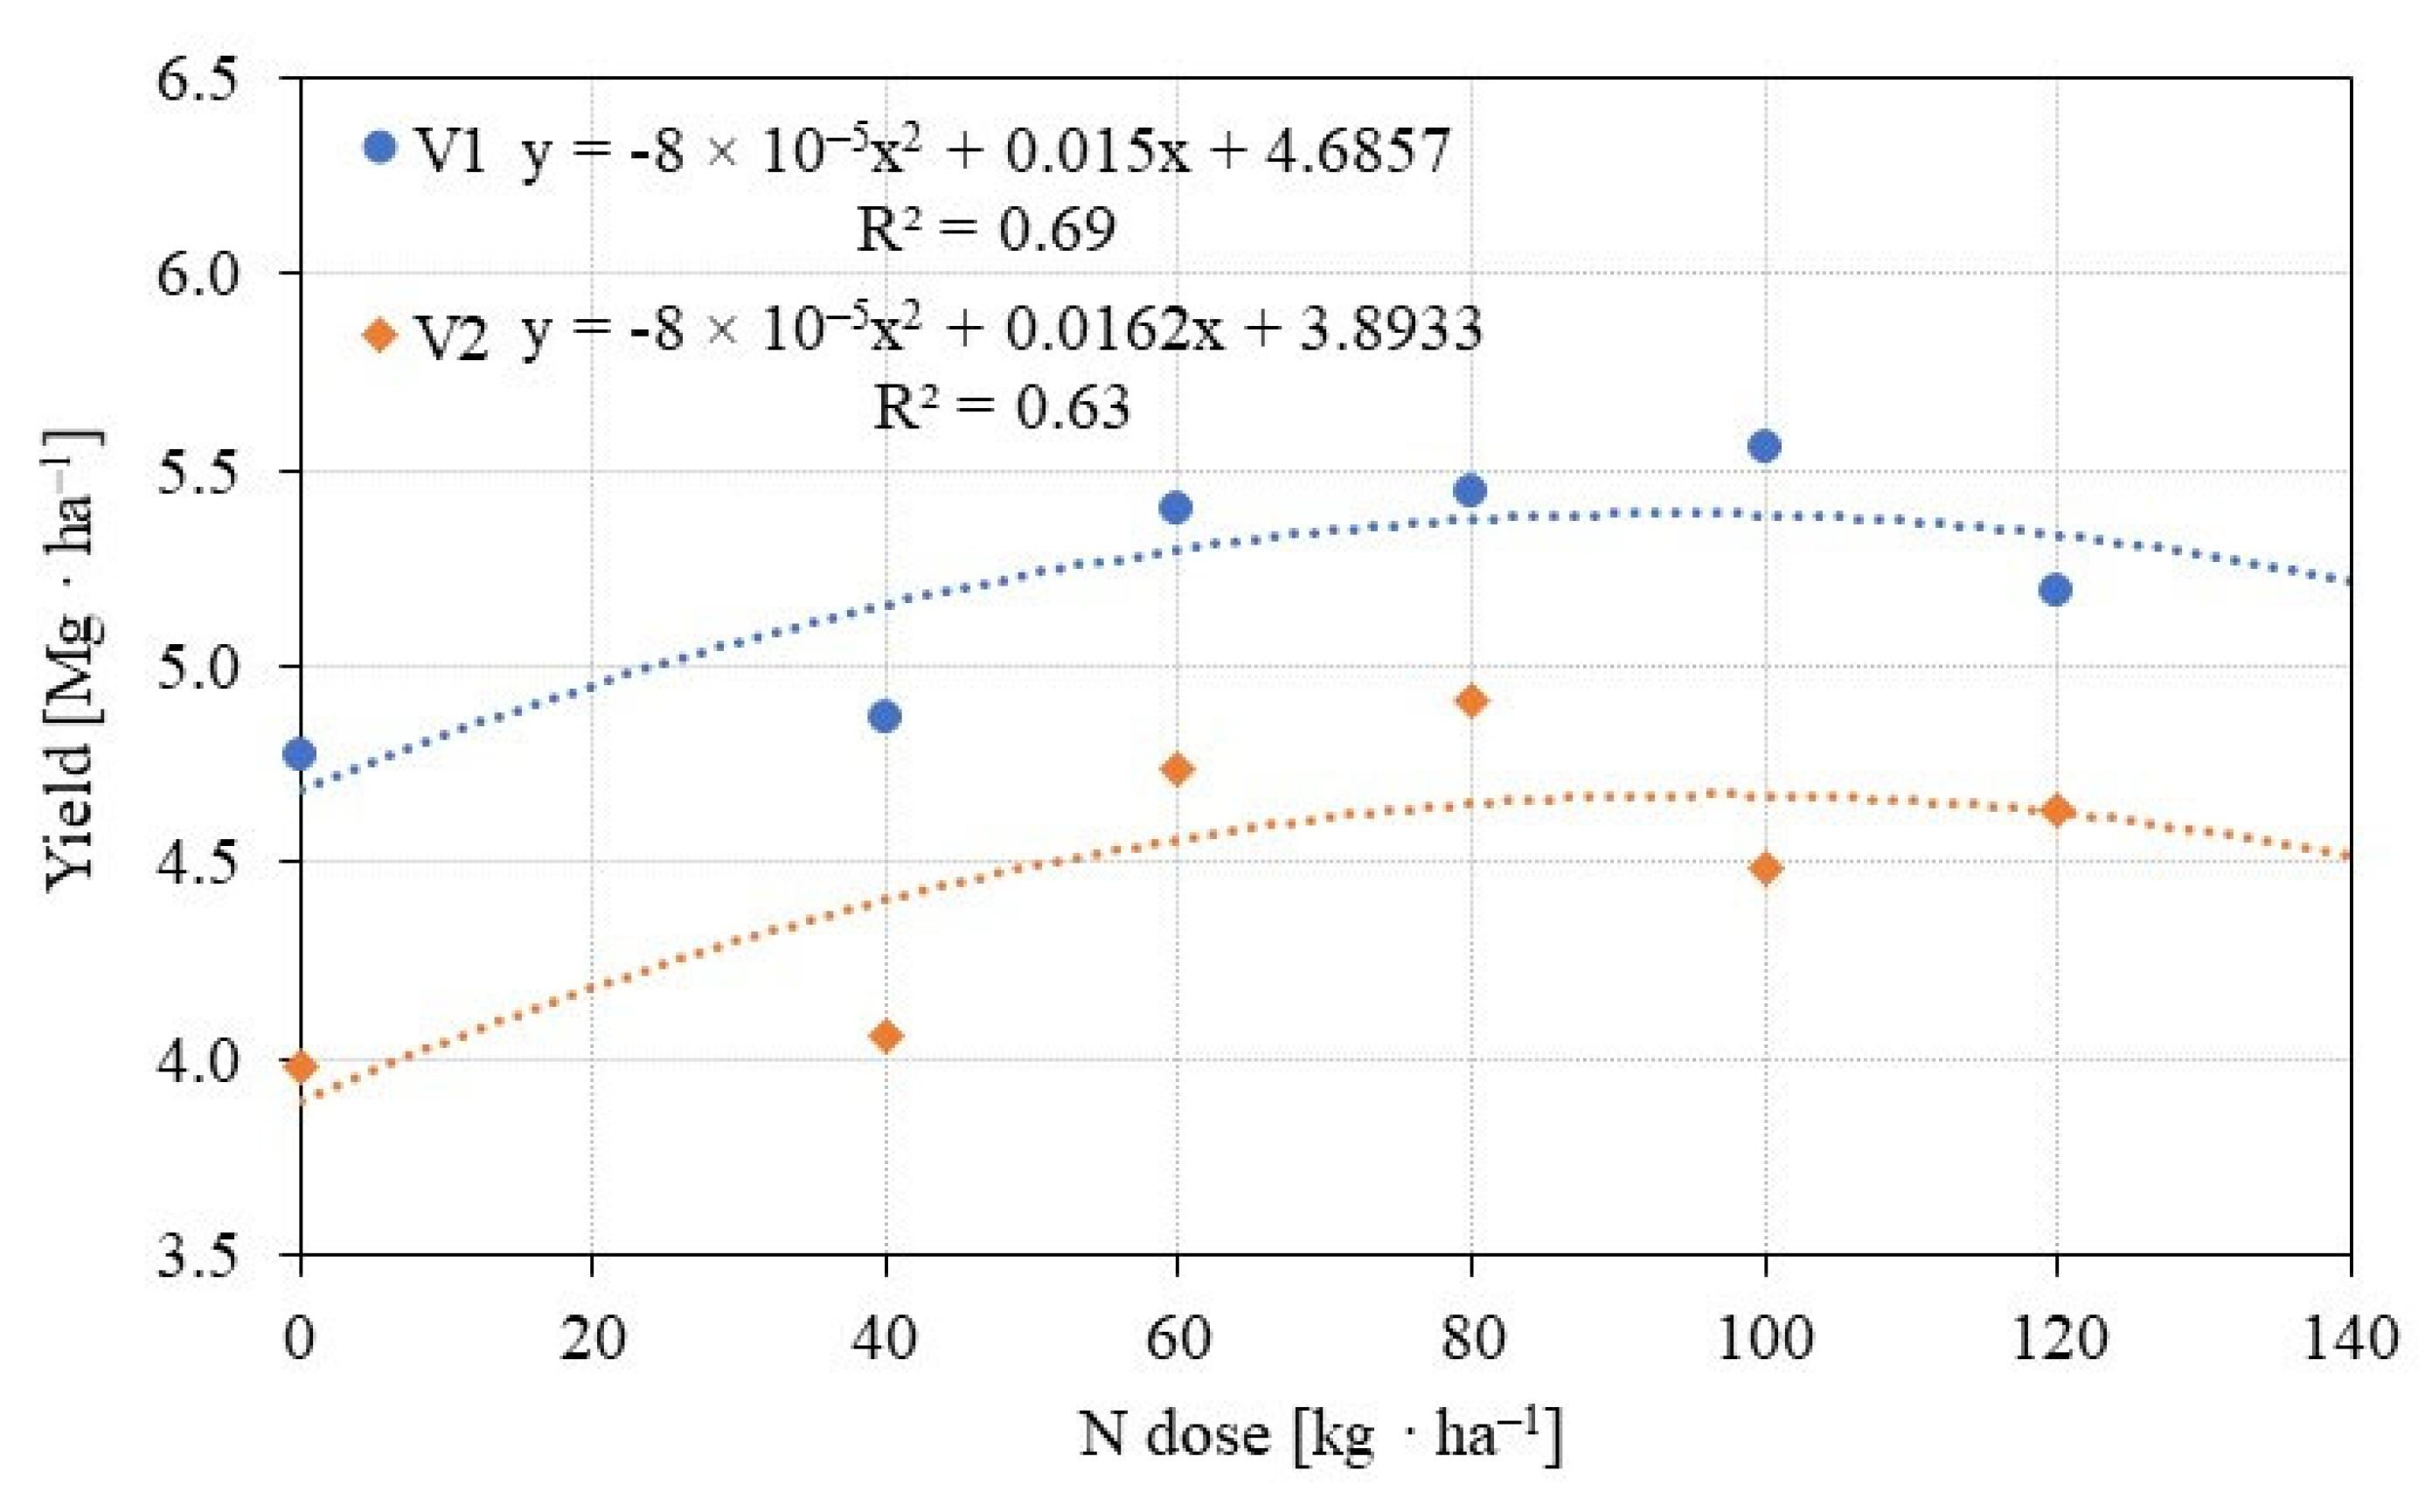
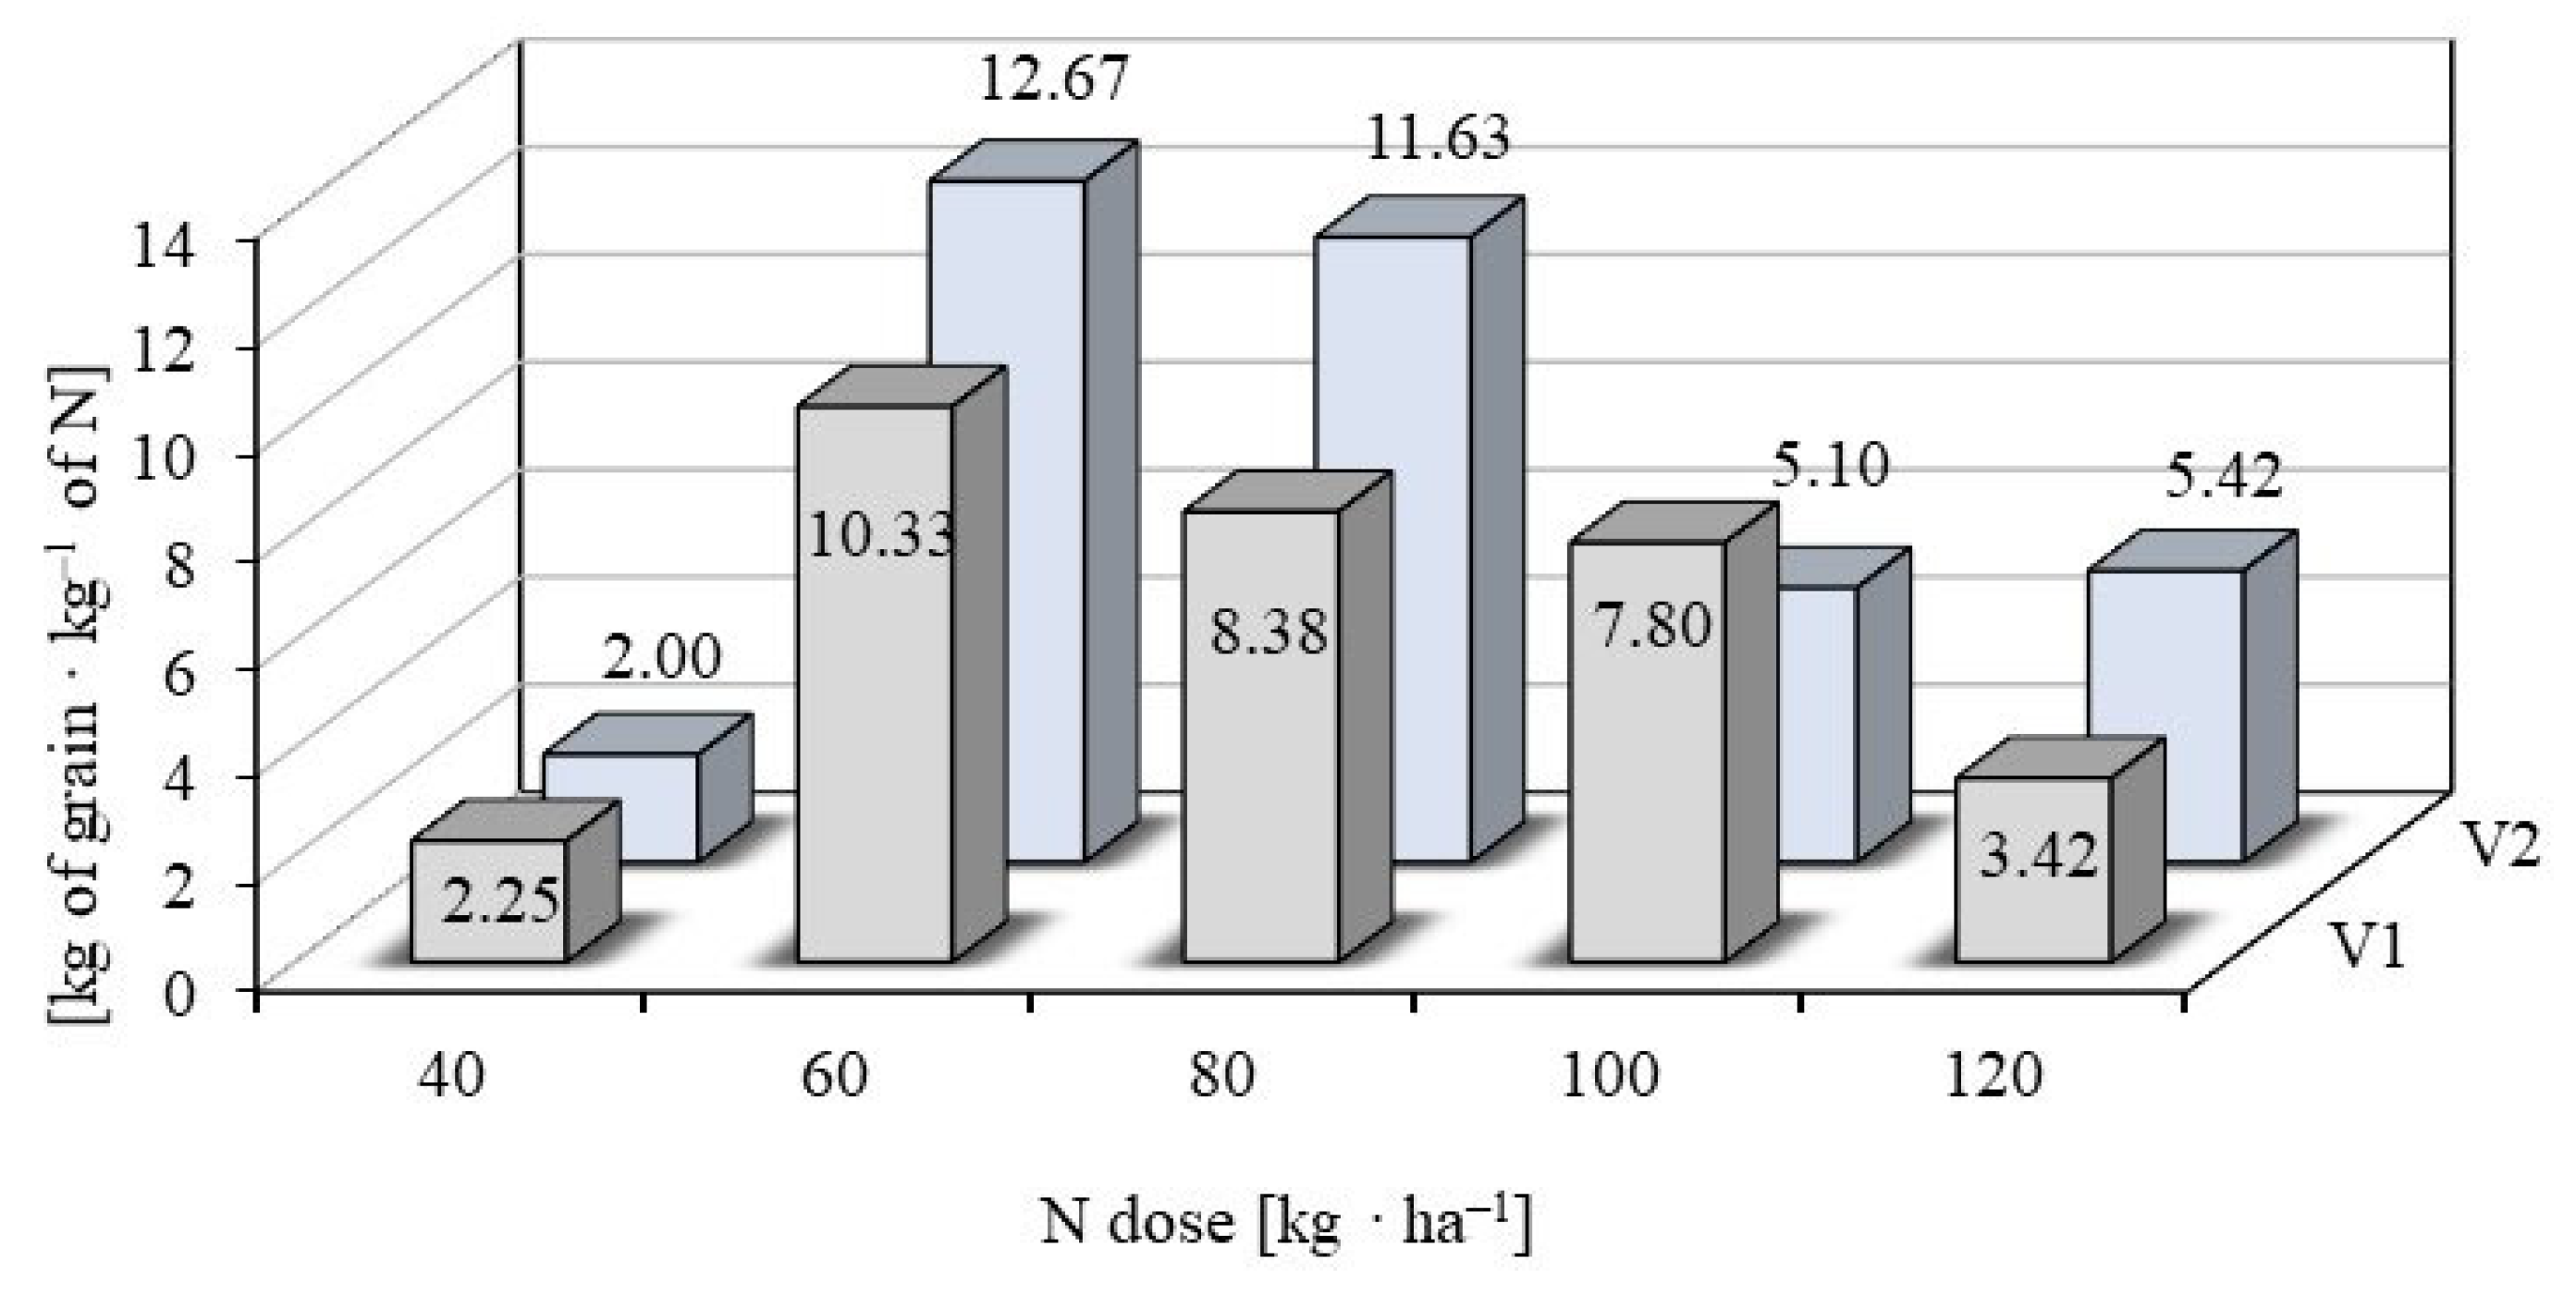
3.1. Grain Yield and Agronomic Efficiency

Of the studied wheat genotypes, the grain yield was at the level of 4.62–6.01 Mg ha−1 for the genotype marked as V1, while for the V2 genotype the yield was 3.82–5.43 Mg ha−1 (Table 3). The differences between the yields of the genotypes were statistically significant, while there was no statistical differentiation in the traits for the other two factors (nitrogen and sulfur fertilization). However, with regard to nitrogen, there was a clear tendency to increase the yield, most often in the dose range of 0–80 kg ha−1 (Figure 4), while, in the case of sulfur fertilization, such a tendency was less visible (Figure 5). The agronomic efficiency ranged between 2 and 12.67 kg of grain per 1 kg nitrogen fertilization. The biggest value of this index was obtained at a dose of nitrogen of 60 kg N ha−1 for both genotypes (Figure 6).

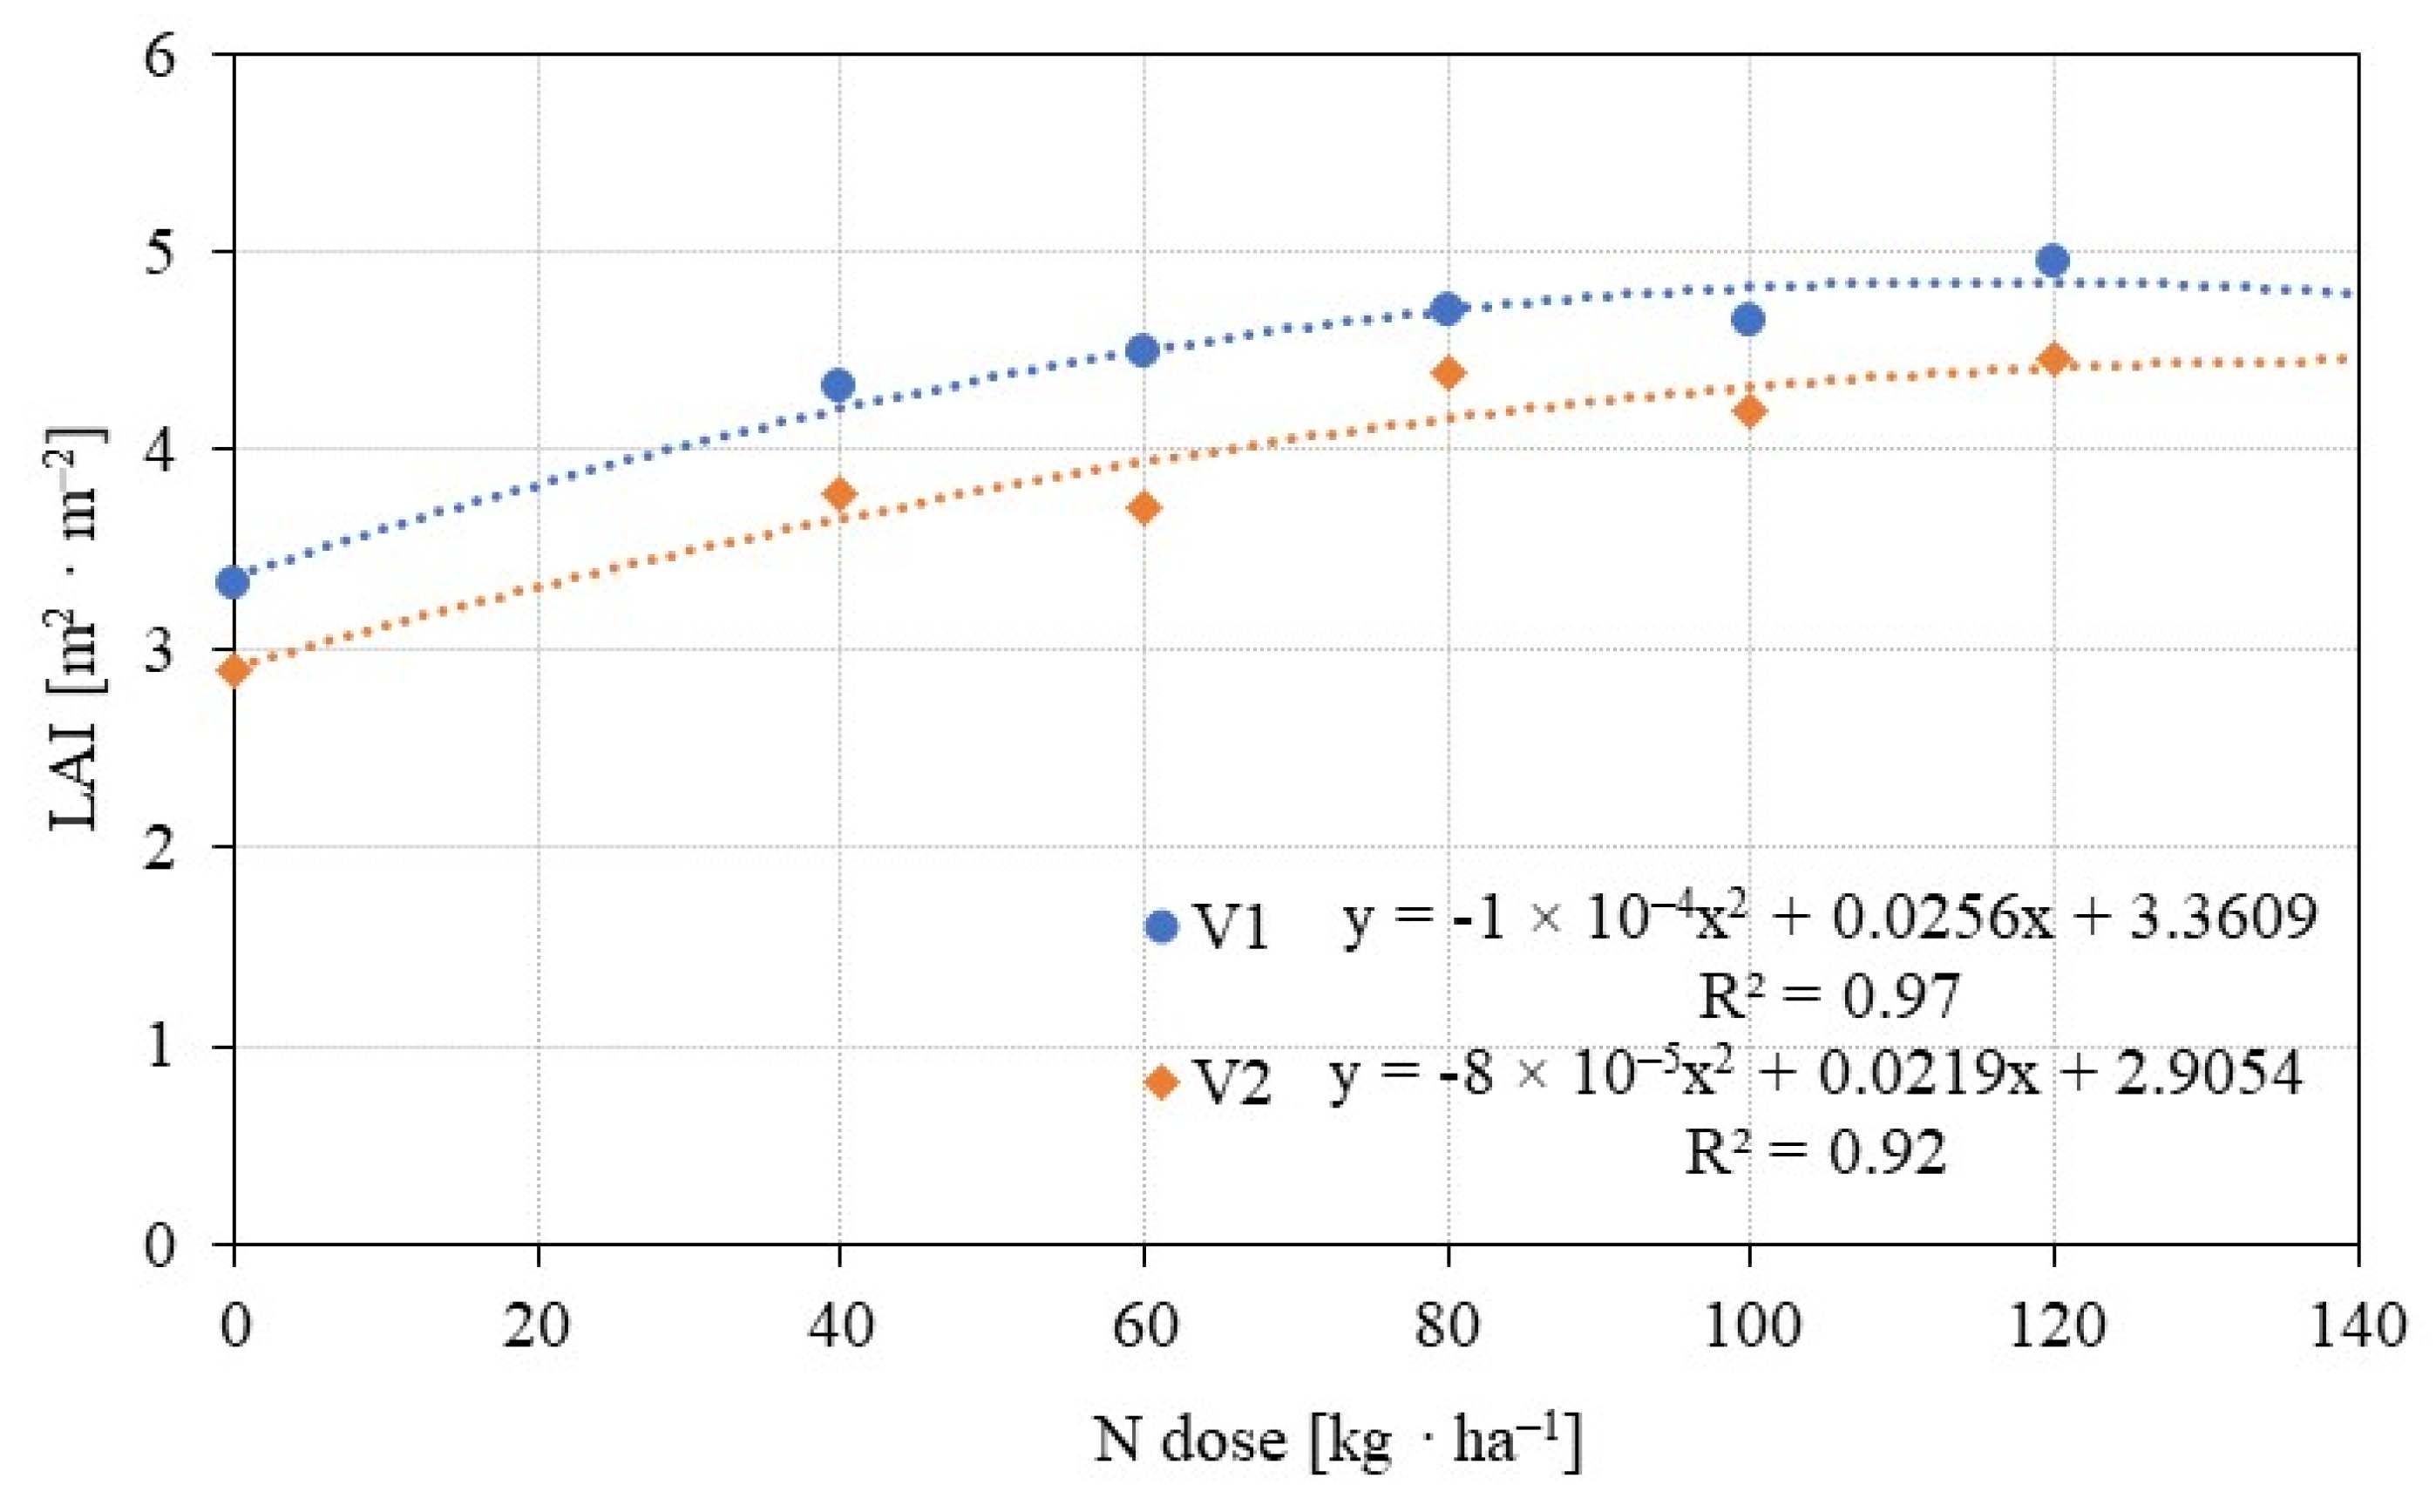
3.2. Vegetative Indices

The NDVI index before nitrogen application (BBCH 29) was on average at the level of 0.878 for the V1 genotype and 0.824 for the V2 genotype (Table 4). The significance of the differences in the dose of nitrogen fertilization was not confirmed statistically (Figure 7). The values of the NDVI index after applying a top dose of N is well presented (Figure 8). Both genotypes showed the same response to increased nitrogen doses as evidenced by the almost parallel course of lines determined by the regression function and coefficients of determination close to 1 (Figure 8). The mean value of the NDVI index during the heading period was 0.878 and 0.824 for genotypes V1 and V2, respectively. The difference between these means was statistically significant. The value of this index in the heading phase of these genotypes ranged from 0.792 to 0.870 for V2 and 0.584 to 0.902 for V1. Sulfur fertilization did not result in any significant differentiation in this trait, and neither did nitrogen fertilization; only in the latter case was there a clear tendency to increase the value. This index increased the value in the range of fertilization by 0–80 kg N ha−1 (Table 4).
The LAI index was shaped according to the studied levels of sulfur and nitrogen fertilization in the range of 3.32–4.99 for genotype V1 and 2.83–4.41 for genotype V2 (Figure 9). Only the genetic factor had a significant influence on the value of this index. There were very small insignificant differences between the levels of sulfur fertilization, while nitrogen fertilization had a positive effect on increasing the value of this index with doses of over 120 kg N ha−1 for both genotypes. On average, within the range of 0–80 kg N ha−1, the increase in the LAI index was from 4.86 to 5.25 (Figure 9). Higher doses caused lodging of plants, as shown in the photos from the experiment site (Figure 3).
The canopy chlorophyll content index (CCCI) index of the tested hypoallergenic wheat genotypes ranged from 0.572 to 0.646 for the V1 genotype and from 0.546 to 0.608 for the V2 genotype, respectively (Table 5). The differences between the cultivars were statistically insignificant but clearly marked. Sulfur fertilization did not significantly affect the value of this index. It seems that the optimal fertilization level is the dose of 20 kg S ha−1. Nevertheless, nitrogen fertilization did significantly influence the value of this index (Figure 3). Nitrogen fertilization increased the index value with a dose of 80 kg N ha−1, and then it decreased due to the lodging of plants and deterioration in growth conditions.
Among the vegetation indices analyzed, the NDRE index showed the lowest values (Figure 3; Table 6). For the V1 genotype, they ranged from 0.489 to 0.582, while, for the V2 genotype, they ranged from 0.438 to 0.531. The differences in the values of this index for genotypes were statistically proven, as was the effect of nitrogen fertilization. The increase in the index value was recorded up to the dose of 80 kg N ha−1. Sulfur fertilization caused insignificant reductions in the value of this index in relation to objects not fertilized with sulfur.
The GNDVI index was slightly lower than the NDVI. The mean value of this index for the genotype V1 was 0.787 and for V2 was 0.736 (Table 7). In the case of this index, only the proven differences occurred, while no differences were found for sulfur and nitrogen fertilization. As in the case of NDVI, the value of the GNDVI also increased with an increase in the dose to 80 kg N ha−1 (V1) and up to 60 kg N ha−1 (V2).
The last of the most important indices is the EVI index. Its values in this phase were in the range of 0.438 to 0.471, with mean values of 0.463 and 0.446 for genotypes V1 and V2, respectively. The trend in the nitrogen doses was similar to that for NDVI and GNDVI (Table 4, Table 7 and Table 8).
As shown by the correlation analysis, all indices from the low-ceiling level (using a drone) showed a high mutual correlation, which proves that they can be used as substitutes for each other. In addition, these indices (CCCI, NDRE, GNDVI, EVI and NDVI) showed a moderate correlation with wheat grain yield higher than the LAI index determined by ground measurement (Table 9). This could be due to the fact that the entire plot area was taken into account when measuring from the low-ceiling level and the LAI index was measured in four repetitions on the plot (Figure 10).
Regression analysis was performed for the mean values of the interaction of genotypes and nitrogen fertilization, and, for the grain yield, the production function and the function for the vegetation indices, depending on the level of nitrogen fertilization, were determined. The doses determined from the production function were 94 and 101 kg N ha−1, while the doses determined on the basis of the function for the vegetation indices were significantly lower, from 50 to 80 kg N ha−1 (Table 10). After substituting for the production function, the yields were lower by 10 to 150 kg of grain, which, in most cases except for the dose of 58 kg N ha−1, eliminated the losses resulting from the yield reduction by reducing fertilization costs. The production function shows that lowering the dose to about 65 kg N ha−1 slightly decreased the level of wheat yield, especially that of the V2 genotype (Table 10). It should be emphasized that there was a significant reduction in GHG gas emissions as a result of limiting fertilization with the component with the greatest impact on the greenhouse effect (Figure 11).

4. Discussion

4.1. Grain Yield and Fertilization Efficiency

The yields obtained in the experiment ranged from 3.61 to 6.01 Mg ha−1, depending on the genotype and N and S fertilization. It should be noted that these genotypes are characterized by primary traits, e.g., difficult grain profitability. On the objects without fertilization, the yield was obtained at the level of 3.5 Mg ha−1; therefore, assuming the maximum yield (approx. 6 Mg ha−1), approximately 60 kg N ha−1 is optimal. Contemporary cultivars of common wheat give much better yields in Poland, as evidenced by the results obtained in the experiments conducted by Tabak et al. [29]. They showed that the optimal nitrogen dose was 217 kg N ha−1, and the maximum yield was 8.251 Mg ha– 1. The production function depending on the nitrogen dose, calculated on the basis of yield, showed that the maximum yield should be expected at doses of 94 and 101 kg N ha−1 for genotypes V1 and V2, respectively, giving yields of 5.39 and 4.71 Mg ha−1. This result is similar to those obtained in Salus model studies conducted by Basso et al. [30], in which they considered the dose of 90 kg N ha−1 to produce an economically viable crop. Zhang et al. [31], based on the linear plateau model, found that the optimal N dose (for field trials conducted at 120 sites) varied from 84 kg to 270 kg N ha−1, with a mean value of 138 kg ha−1, under which the maximum wheat yield varied from 5213 Mg ha−1 to 8785 Mg ha−1. Nitrogen is an essential ingredient for the realization of the potential production capacity of the varieties. Doses at a level of 120 kg ha−1 should ensure a yield of 8 Mg ha−1. Excess ingredient causes higher uptake and increased washout. The agronomic efficiency of nitrogen fertilization of the studied genotypes was low, in the range of 2–12.67 kg of grain per kg of nitrogen. According to Dobermann [32], the value of this indicator is usually in the range from 10 to 30 kg of grain per 1 kg of N, and under conditions of high nitrogen deficit or under favorable conditions of vegetation, these values exceed 25 kg of grain per 1 kg of N. According to Kołodziejczyk [23] the N agronomic efficiency (NAE) was significantly influenced by the weather conditions, level of nitrogen fertilization and interactions between these factors, but also by the spring wheat cultivars. Depending on the level of N fertilization and the year of study, the NAE ranged from 4.7 to 43.4 kg kg−1. NAE was significantly higher in years with lower amounts of rainfall. The highest N agronomic efficiency, of 32.7 kg kg−1, was observed for the dose of 60 kg N ha−1. Increasing the nitrogen dose to 120 and to 150 kg N ha−1 resulted in a decrease in NAE by 39 and 54%. Lόpez-Bellido and Lόpez-Bellido [33] observed the nitrogen fertilization of winter wheat in doses from 50 to 150 kg N ha−1 to have a significant influence on NAE values, which ranged from 4.9 to 7.2 kg kg−1. NAE values which were several times lower were also confirmed in studies by Delogu et al. [22]. The N agronomic efficiency was similar in barley and wheat (8.7 and 9.2 kg kg−1 of N applied, respectively), suggesting that both species respond equally to nitrogen fertilization. Nevertheless, due to the lower nitrogen use efficiency (NUtE) value, wheat requires high nitrogen fertilization to optimize yields, while, in barley, the lower nitrogen level necessary to obtain the highest yields allows this crop to perform better under conditions of low application inputs [33].

4.2. Physiological and Vegetative Indices

The LAI index is a physiological and measurable index, as it describes the size of the assimilation area of leaves per unit area of land [18]. The remaining indicators are dimensionless values of various ranges, well correlated with the yield, aboveground biomass and the LAI index [17,34,35]. The low value of the LAI index translates into the amount of photosynthesis and, consequently, the amount of biomass, including the useful yield. The LAI index determined at the BBCH 39 phase showed varietal differentiation. The better yielding genotype V1 was characterized by an 8% larger assimilation area compared to V2. A quadratic function plotted on the basis of the LAI vs. the dose of N showed that this index would reach the maximum value at doses of 128 and 137 kg N ha−1, which, determined from the production function, corresponds to the yield level of 5.34 and 4.62 Mg ha−1. These values are slightly lower than those determined from the production function, and the nitrogen doses are almost 30 kg higher. An excessive value of the LAI index is not beneficial for yielding, as it reduces the use of PAR due to mutual shading of leaves and lodging of the canopy, and worsens the conditions for plant growth and development. An ideal canopy has an area of 3–5 m2 of leaves per 1 m2 of soil, depending on the angle of the leaves. There is an interdependence between the studied indicators, meaning that they can be substituted for each other. For example, the most common relationship between LAI and NDVI and GNDVI is exponential, while between LAI and CCCI, NDRE and RVI, the relationship is rectilinear [25]. The EVI indicator is lower: on average, when the NDVI value is 0.9, the EVI value is 0.75. Depending on the density of the canopy, its value is 50–83% of the NDVI index. NDVI is a popular vegetation index, but it does not show the best correlation with yield and biomass for all species and development stages. In the present study, the NDVI index, in the initial period of spring growth (BBCH 29), showed insignificant and undirected random variation and ranged from 0.515 to 0.550. In the second period of measurement, there was shown to be significant differentiation between genotypes and a tendency described by the square function for both genotypes, depending on the level of nitrogen fertilization. The values of this index ranged from 0.792 to 0.902. The quadratic function of the progress of this indicator allows its peak to be determined, which both genotypes reached at 64 kg N ha−1. At this dose of N, the yield was at the level of 5.32 and 4.0 Mg ha−1 for genotypes V1 and V2, respectively. According to Fu et al. [36], in late stages of development, the NDRE index is a better estimator. The flowering phase [37] was the best stage (phase) of development for prediction based on models based on this indicator. The determination coefficients between the vegetation index and yield for NDVI at the heading stage were 0.59–0.76 while, for NDRE at the flowering stage, they were 0.69–0.78.

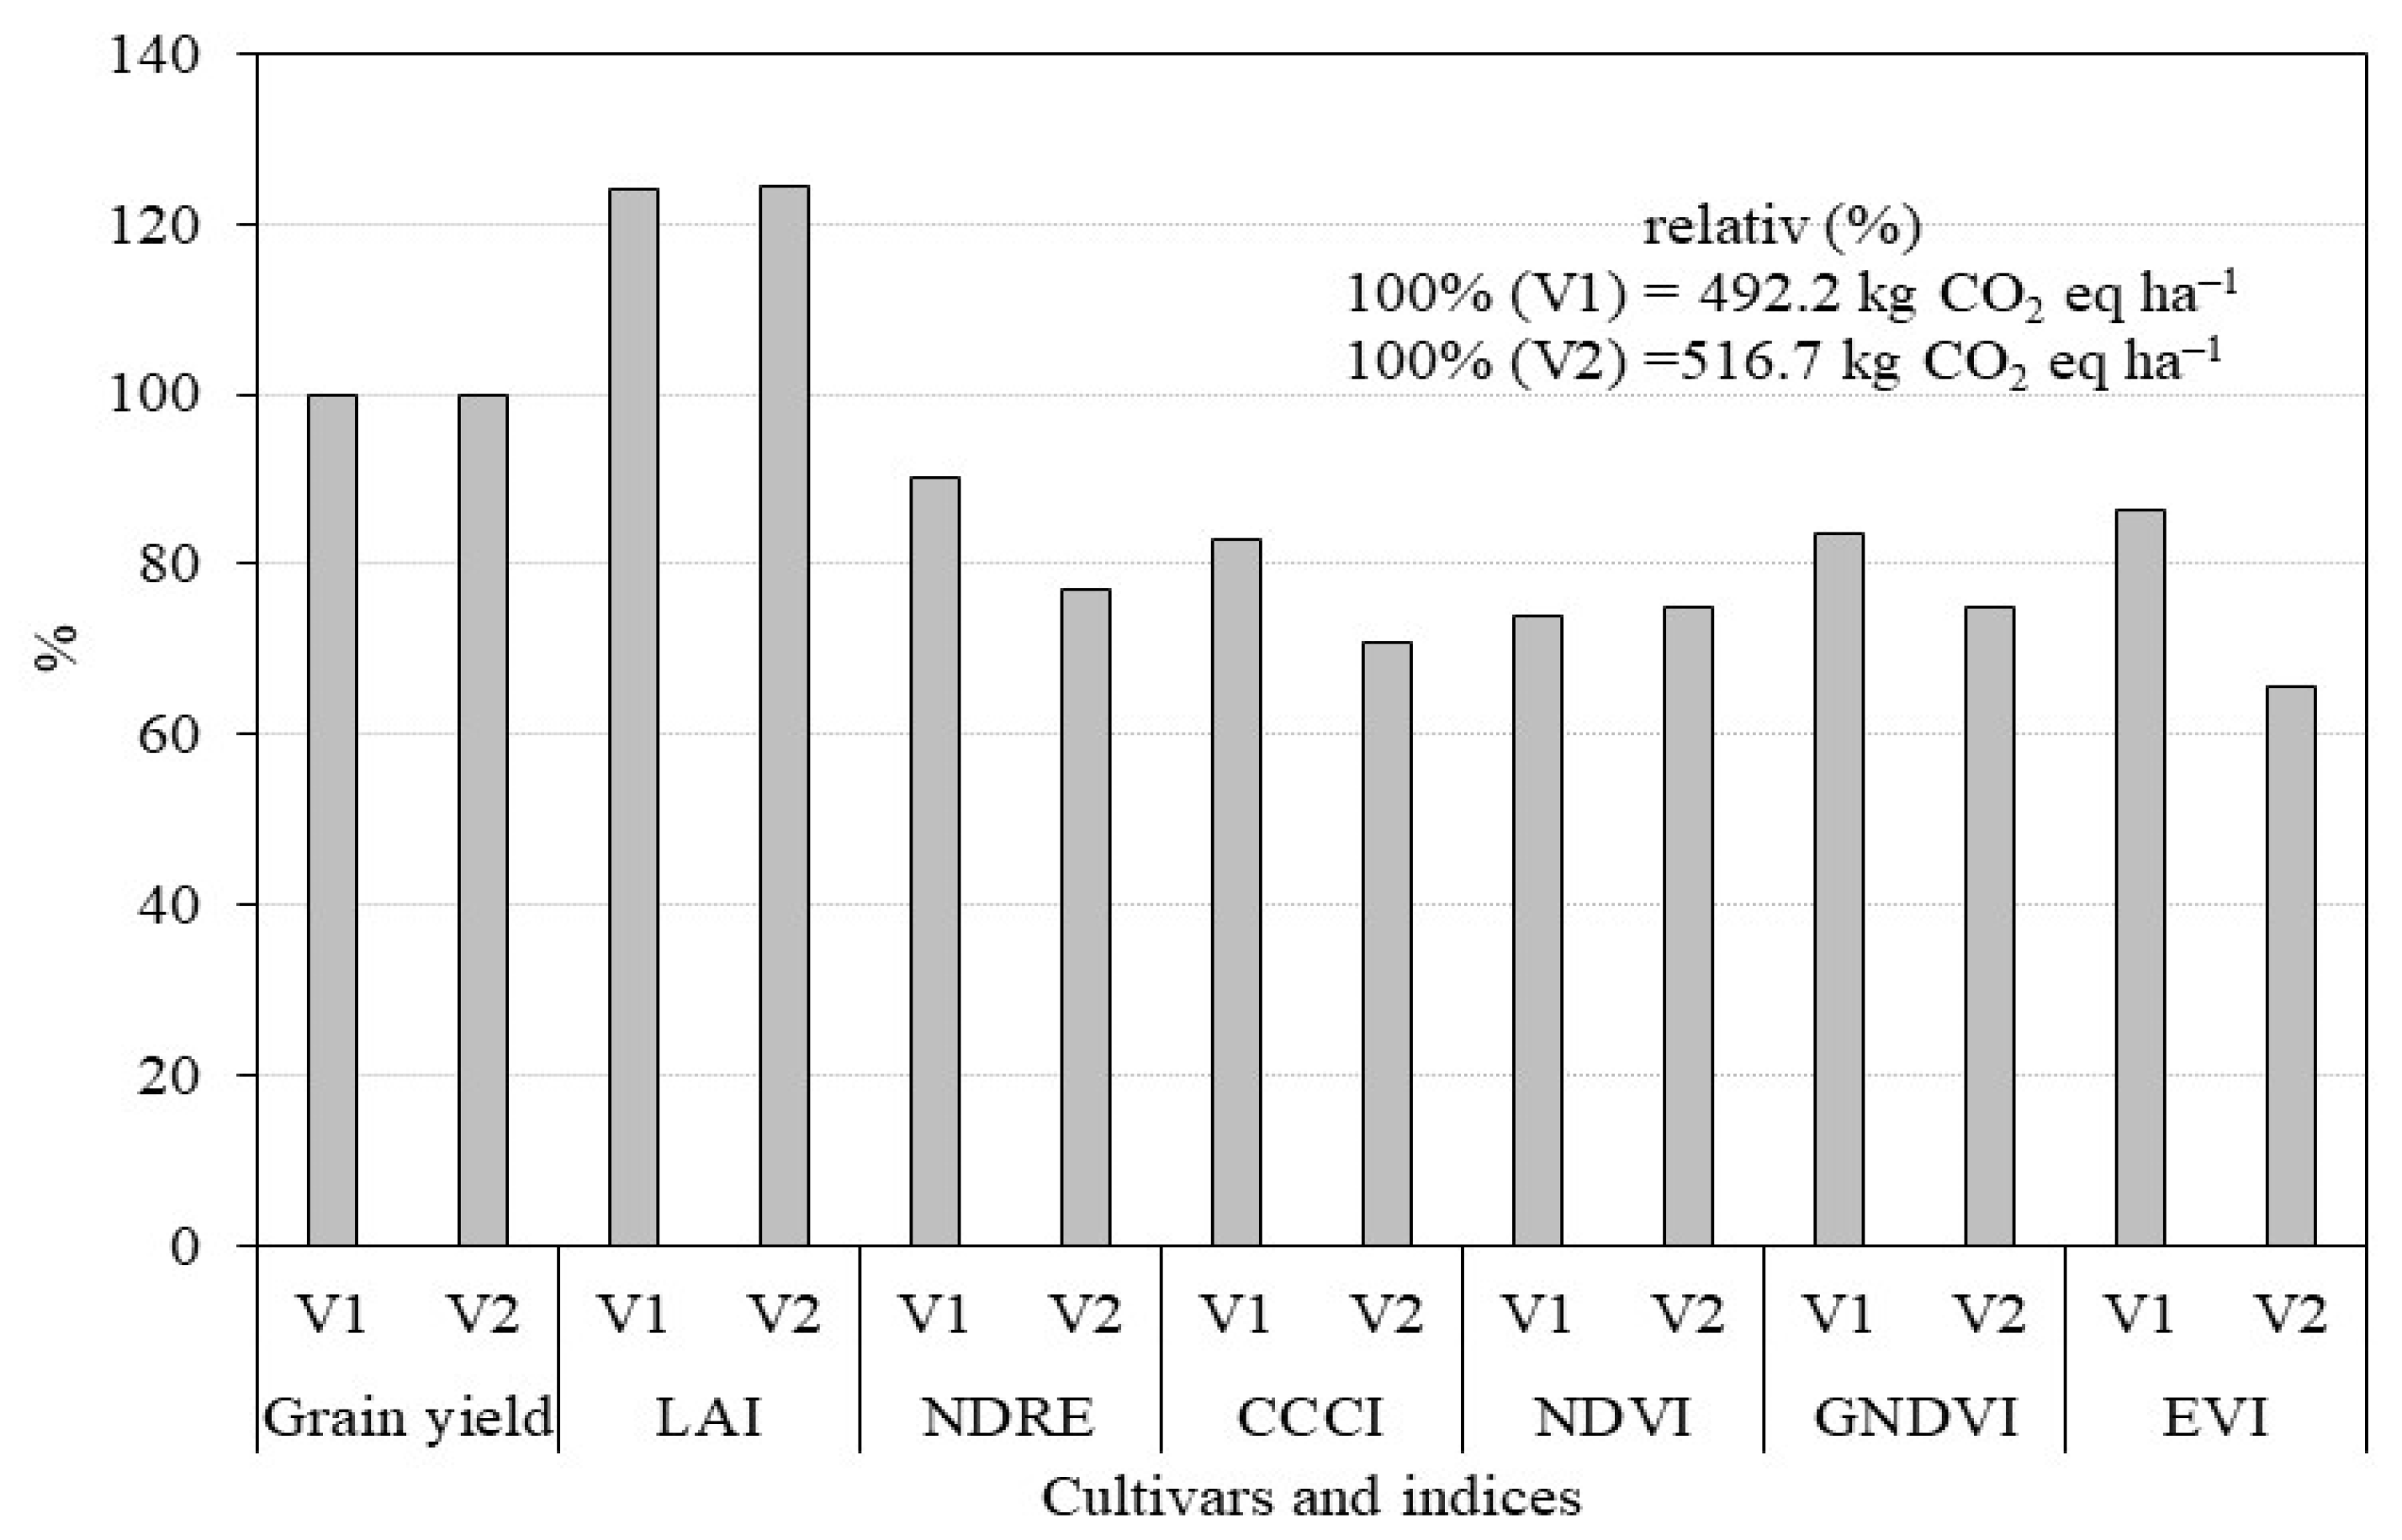
4.3. Simulated Reduction in GHG Emissions

Crop production is a significant contributor to total anthropogenic greenhouse gas emissions into the atmosphere. Management practices involving soil tillage, sowing, fertilizer application, irrigation and pest management have a significant influence on emissions of carbon dioxide (CO2) and nitrous oxide (N2O). Per 1 kg of conventionally grown wheat grain, the individual emission components are: agrotechnical operations 0.078, fertilizers 0.221, pesticides 0.001, seeds 0.023 and field emission of 0.137 CO2 eq. per 1 kg of grain field [38] According to Kumar et al. [39], CO2 emission per ha in wheat fertilized with different N-doses (0–240 kg N ha−1) ranged from 292.3 to 765.3 kg CO2. The application of nitrogen at a dose of 150 kg ha – 1 had the highest GHG emission per ha—1974.1 kg CO2, compared to the control.
All the agricultural inputs (as already mentioned) bring an environmental impact, which can be quantified by the life cycle assessment method [38]. Moreover, the impact on the environment during the cultivation of cereals is most evident in the input of fertilizers, especially nitrogen fertilizers [23]. However, for example, Bernas et al. [39] indicated that intensive cultivation practices, i.e., practices with high fertilizer inputs, do not necessarily confer the highest environmental impact. In this respect, the achieved yield level, the choice of allocation approach and the functional unit play a dominant role.

5. Conclusions

The yields obtained in the experiment varied depending on the genotype. The production function depending on the nitrogen dose showed that the maximum yield should be expected at doses of 94 and 101 kg N ha−1 for genotypes V1 (without allergenic protein) and V2 (with allergic protein), respectively, giving yields of 5.39 and 4.71 Mg ha−1. The LAI index reached its maximum values at doses of about 30 kg higher (128 and 137 kg N ha−1). On the basis of the values of the tested vegetation indices, the highest doses of N should be applied using the NDRE index, and the lowest ones based on the EVI index, and, in the latter case, a reduction in yield of more than 0.2 Mg ha−1 in the V2 genotype should be taken into account. Preliminary estimates indicate that all vegetation indices except LAI show lower nitrogen doses than those determined from the LAI function and will not differ significantly from the dose resulting from the production function. The simple correlation analysis proved that the vegetation indices based on radiometric measurements show a moderate correlation with the grain yield, but the difference in the forecasts are insignificant. The study indicates a clear need to continue field studies dedicated to the monitoring and assessment of hypoallergenic wheat productivity using UAV remote sensing techniques.

Author Contributions

Conceptualization, B.K.; M.R. and J.W.; methodology, B.K., A.S., J.W., M.R, P.W. and G.P.; software, A.O. and W.G.; validation, A.O., R.W., P.W. and B.K.; formal analysis, R.W., B.K. and W.G.; investigation, M.K., A.K.-K., B.K., A.O. and R.W.; resources, B.K., P.W. and A.O.; data curation, B.K., P.W. and M.R.; writing—original draft preparation, B.K., M.R., A.O.,M.K.,P.W.,A.K.-K., R.W.,A.S.,G.P.,W.G.; writing—review and editing, B.K., R.W., P.W., A.K.-K., A.O., W.G., G.P., A.S., J.W., M.K. and P.W.; visualization, P.W., A.O., R.W. and A.K.-K.; supervision, B.K., A.O. and M.R.; project administration, B.K., J.W. and M.R.; funding acquisition, B.K. All authors have read and agreed to the published version of the manuscript.

Funding

This research was funded by The Polish National Centre for Research and Development, Grant POIR.04.01.04-00-0051/18-00, acronym HYPFLO.

Institutional Review Board Statement

Not applicable.

Data Availability Statement

Not applicable.

Conflicts of Interest

The authors declare no conflict of interest.

References

  1. Wrigley, C.W.; Bekes, F.; Bushuk, W. Gluten: A Balance of Gliadin and Glutenin. In Gliadin and Glutenin—The Unique Balance of Wheat Quality; Wrigley, C., Bekes, F., Bushuk, W., Eds.; AACC International: St. Paul, MN, USA, 2006; pp. 3–32. [Google Scholar]
  2. Wrigley, C.W.; Bietz, J.A. Proteins and Amino Acids. In Wheat: Chemistry and Technology; Pomeranz, Y., Ed.; AACC: St. Paul, MN, USA, 1988; pp. 159–275. [Google Scholar]
  3. Seilmeier, W.; Belitz, H.D.; Wieser, H. Separation and quantitative determination of high-molecular-weight subunits of glutenin from different wheat varieties and genetic variants of the variety Sicco. Z. Lebensm. Unters. Forsch. 1991, 192, 124–129. [Google Scholar] [CrossRef]
  4. Baldacci, S.; Maio, S.; Cerrai, S.; Sarno, G.; Baiz, N.; Simoni, M.; Annesi-Maesano, I.; Viegi, G. Allergy and asthma: Effects of the exposure to particulate matter and biological allergens. Respir. Med. 2015, 109, 1089–1104. [Google Scholar] [CrossRef] [PubMed] [Green Version]
  5. Sapone, A.; Bai, J.C.; Ciacci, C.; Dolinsek, J.; Green, P.H.; Hadjivassiliou, M.; Kaukinen, K.; Rostami, K.; Sanders, D.S.; Schumann, M.; et al. Spectrum of gluten-related disorders: Consensus on new nomenclature and classification. BMC Med. 2012, 10, 13. Available online: https://www.biomedcentral.com/1741-7015/10/13/-ins6PHR (accessed on 1 January 2020). [CrossRef] [PubMed] [Green Version]
  6. Palosuo, K.; Varionen, E.; Kekki, O.M. Wheat ω-5 gliadin is a major allergen in children with immediate allergy to ingested wheat. J. Allergy Clin. Immunol. 2001, 108, 634–638. [Google Scholar] [CrossRef] [PubMed]
  7. Morita, E.; Matsuo, H.; Mihara, S. Fast ω-gliadin is a major allergen in wheat-dependent exercise-induced anaphylaxis. J. Dermatol. Sci. 2003, 33, 99–104. [Google Scholar] [CrossRef]
  8. Waga, J.; Skoczowski, A. Development and characteristics of ω-gliadin-free wheat genotypes. Euphytica 2014, 195, 105–116. [Google Scholar] [CrossRef] [Green Version]
  9. Stawoska, I.; Waga, J.; Wesełucha-Birczynska, A.; Dziurka, M.; Podolska, G.; Aleksandrowicz, E.; Skoczowski, A. Does Nitrogen Fertilization Affect the Secondary Structures of Gliadin Proteins in Hypoallergenic Wheat? Molecules 2022, 27, 5684. [Google Scholar] [CrossRef]
  10. Geipel, J.; Link, J.; Wirwahn, J.A.; Claupein, W. A Programmable Aerial Multispectral Camera System for In-Season Crop Biomass and Nitrogen Content Estimation. Agriculture 2016, 6, 4. [Google Scholar] [CrossRef] [Green Version]
  11. Li, M.; Shamshiri, R.R.; Weltzien, C.; Schirrmann, M. Crop Monitoring Using Sentinel-2 and UAV Multispectral Imagery: A Comparison Case Study in Northeastern Germany. Remote Sens. 2022, 14, 4426. [Google Scholar] [CrossRef]
  12. Walsh, O.S.; Shafian, S.; Marshall, J.M.; Jackson, C.; McClintick-Chess, J.R.; Blanscet, S.M.; Swoboda, K.; Thompson, C.; Belmont, K.M.; Walsh, W.L. Assessment of UAV Based Vegetation Indices for Nitrogen Concentration Estimation in Spring Wheat. Adv. Remote Sens. 2018, 7, 71–90. [Google Scholar] [CrossRef] [Green Version]
  13. Huete, A.; Justice, C. MODIS Vegetation Index (MOD 13) Algorithm Theoretical Basis Document, 1999. Available online: https://modis.gsfc.nasa.gov/data/atbd/atbd_mod13.pdf (accessed on 1 January 2020).
  14. Boiarskii, B.; Hasegawa, H. Comparison of NDVI and NDRE Indices to Detect Differences in Vegetation and Chlorophyll Content International Conference on Applied Science, Technology and Engineering. J. Mech. Cont. Math. Sci. 2019, 4, 20–29. [Google Scholar]
  15. Huang, S.; Tang, L.; Hupy, J.P.; Wang, Y.; Shao, G. Commentary review on the use of normalized diference vegetation index (NDVI) in the era of popular remote sensing. J. For. Res. 2021, 32, 1–6. [Google Scholar] [CrossRef]
  16. Bausch, W.C.; Duke, H.R. Remote sensing of plant nitrogen status in corn. Trans. Am. Soc. Agric. Eng. 1996, 39, 1869–1875. [Google Scholar] [CrossRef]
  17. Carlson, T.N.; Ripley, D.A. On the relation between NDVI, fractional vegetation cover, and leaf area index. Remote Sens. Environ. 1997, 62, 241–252. [Google Scholar] [CrossRef]
  18. Fang, H.; Baret, F.; Plummer, S.; Schaepman-Strub, G. An overview of global leaf area index (LAI): Methods, products, validation, and applications. Rev. Geophys. 2019, 57, 739–799. [Google Scholar] [CrossRef]
  19. Węgrzyn, A.; Klimek-Kopyra, A.; Dacewicz, E.; Skowera, B.; Grygierzec, W.; Kulig, B.; Flis-Olszewska, E. Effect of Selected Meteorological Factors on the Growth Rate and Seed Yield of Winter Wheat—A Case Study. Agronomy 2022, 12, 2924. [Google Scholar] [CrossRef]
  20. Adhikari, C.; Bronson, K.F.; Panuallah, G.M.; Regmi, A.P.; Saha, P.K.; Dobermann, A.; Olk, D.C.; Hobbs, P.R.; Pasuquin, E. On-farm soil N supply and N nutrition in the rice-wheat system of Nepal and Bangladesh. Field Crop. Res. 1999, 64, 273–286. [Google Scholar] [CrossRef]
  21. Diacono, M.; Rubino, P.; Montemurro, F. Precision nitrogen management of wheat. A review. Agron. Sustain. Develop. 2013, 33, 219–241. [Google Scholar] [CrossRef]
  22. Delogu, G.; Cattivelli, L.; Pecchioni, N.; De Falcis, D.; Maggiore, T.; Stanca, A.M. Uptake and agronomic efficiency of nitrogen in winter barley and winter wheat. Eur. J. Agron. 1998, 9, 11–20. [Google Scholar] [CrossRef]
  23. Kołodziejczyk, M.; Kulig, B.; Oleksy, A.; Szmigiel, A. The effectiveness of N-fertilization and microbial preparation on spring wheat. Plant Soil. Environ. 2013, 59, 335–341. [Google Scholar] [CrossRef] [Green Version]
  24. Grohs, D.S.; Bredemeier, C.; Mundstock, C.M.; Poletto, N. Model for yield potential estimation in wheat and barley using the Greenseeker sensor. Engenharia Agrícola. 2009, 29, 101–112. [Google Scholar] [CrossRef] [Green Version]
  25. Cammarano, D.; Fitzgerald, G.; Basso, B.; O’Leary, G.; Chen, D.; Grace, P.; Fiorentino, C. Use of the Canopy Chlorophyl Content Index (CCCI) for Remote Estimation of Wheat Nitrogen Content in Rainfed. Environ. Agron. J. 2011, 103, 1597–1603. [Google Scholar] [CrossRef]
  26. Matsushita, B.; Yang, W.; Chen, J.; Onda, Y.; Qiu, G. Sensitivity of the vegetation index (EVI) and normalized difference vegetation index (NDVI) to Topographic effects: A case study in high-density cypress forest. Sensors 2007, 7, 2636–2651. [Google Scholar] [CrossRef] [PubMed] [Green Version]
  27. Chen, A.; Orlov-Levin, V.; Meron, M. Applying high-resolution visible-channel aerial imaging of crop canopy to precision irrigation management. Agric. Water Manag. 2019, 216, 196–205. [Google Scholar] [CrossRef]
  28. Thompson, C.; Guo, W.; Sharma, B.; Ritchie, G.L. Using normalized difference red edge index to assess maturity in cotton. Crop. Sci. 2019, 59, 2167–2177. [Google Scholar] [CrossRef]
  29. Tabak, M.; Lepiarczyk, A.; Filipek-Mazur, B.; Lisowska, A. Efficiency of Nitrogen Fertilization of Winter Wheat Depending on Sulfur Fertilization. Agronomy 2020, 10, 1304. [Google Scholar] [CrossRef]
  30. Zhang, S.; Gao, P.; Tong, Y.; Norse, D.; Lu, Y.; Powlson, D. Overcoming nitrogen fertilizer over-use through technical and advisory approaches: A case study from Shaanxi Province, northwest China. Agric. Ecosyst. Environ. 2015, 209, 89–99. [Google Scholar] [CrossRef]
  31. Dobermann, A. Nutrient Use Efficiency: Measurement and Management; IFA International Workshop on Fertilizer Best Management Practices: Brussels, Belgium, 2007; pp. 1–28. [Google Scholar]
  32. Lόpez-Bellido, R.J.; Lόpez-Bellido, L. Efficiency of nitrogen in wheat under Mediterranean condition: Effect of tillage, crop rotation and N fertilization. Field Crop. Res. 2001, 71, 31–46. [Google Scholar] [CrossRef]
  33. Lopez-Bellido, L.; Lopez-Bellido, R.J.; Redondo, R. Nitrogen efficiency in wheat under rainfed Mediterranean conditions as affected by split nitrogen application. Field Crop. Res. 2005, 94, 86–97. [Google Scholar] [CrossRef]
  34. Prabhakara, K.; Hively, W.D.; McCartych, G.W. Evaluating the relationship between biomass, percent groundcover and remote sensing indices across six winter cover crop. Int. J. Appl. Earth Observ. Geoinformat. 2015, 39, 88–102, Fu, Z.; Jiang, J.; Gao, Y.; Krienke, B.; Wang, M.; Zhong, K.; Cao, Q.; Tian, Y.; Zhu, Y.; Cao, W.; Liu, X. Wheat Growth Monitoring and Yield Estimation based on Multi-Rotor Unmanned Aerial Vehicle. Remote Sens. 2020, 12, 508. [Google Scholar] [CrossRef] [Green Version]
  35. Zhao, Y.; Potgieter, A.B.; Zhang, M.; Wu, B.; Hammer, G.L. Predicting Wheat Yield at the Field Scale by Combining High-Resolution Sentinel-2 Satellite Imagery and Crop Modelling. Remote Sens. 2020, 12, 1024. [Google Scholar] [CrossRef] [Green Version]
  36. Jelínková, Z.; Moudrý, J.; Bernas, J.; Kopecký, M.; Moundry, J.; Konvalina, P. Environmental and economic aspects of Triticum aestivum L. and Avena sativa growing. Open Life Sci. 2016, 11, 533–541. [Google Scholar] [CrossRef] [Green Version]
  37. Kumar, R.; Karmakar, S.; Minz, A.; Singh, J.; Kumar, A.; Kumar, A. Assessment of Greenhouse Gases Emission in Maize-Wheat Cropping System Under Varied N Fertilizer Application Using Cool Farm Tool. Front. Environ. Sci. 2021, 9, 355. [Google Scholar] [CrossRef]
  38. Dijkman, T.J.; Basset-Mens, C.; Antón, A.; Núñez, M. LCA of Food and Agriculture. In Life Cycle Assessment; Hauschild, M.Z., Rosenbaum, R.K., Olsen, S.I., Eds.; Springer: Cham, Switzerland, 2018; pp. 723–754. ISBN 978-3-319-56474-6. [Google Scholar]
  39. Bernas, J.; Bernasová, T.; Kaul, H.P.; Wagentristl, H.; Moitzi, G.; Neugschwandtner, R.W. Sustainability Estimation of Oat: Pea Intercrops from the Agricultural Life Cycle Assessment Perspective. Agronomy 2021, 11, 2433. [Google Scholar] [CrossRef]
Figure 1. Genotype without (V1—wasko.gl−) and with (V2—wasko.pg+) ω—gliadin [9].
Agriculture 13 00282 g001
Figure 2. Meteorological conditions during vegetation of winter wheat.
Agriculture 13 00282 g002
Figure 3. RGB UAV orthophoto (GSD 2.0 cm) based on SONY UMC R10C photos captured on 22 May 2020 (experiment area—magenta line). Almost no visible traces of lodging.
Agriculture 13 00282 g003
Figure 4. Grain yield of winter wheat genotypes depending on nitrogen fertilization.
Agriculture 13 00282 g004
Figure 5. Grain yield of winter wheat genotypes depending on nitrogen and sulfur fertilization.
Agriculture 13 00282 g005
Figure 6. Agronomic efficiency of nitrogen doses.
Agriculture 13 00282 g006
Figure 7. NDVI prior to application of nitrogen fertilization (19 March 2020)—BBCH 29.
Agriculture 13 00282 g007
Figure 8. NDVI of winter wheat genotypes under N-fertilization (22 May 2020)—BBCH 39.
Agriculture 13 00282 g008
Figure 9. LAI of winter wheat genotypes under N-fertilization (22 May 2020)—BBCH 39.
Agriculture 13 00282 g009
Figure 10. Visualization of EVI index depending on genotypes, sulfur and nitrogen fertilization.
Agriculture 13 00282 g010
Figure 11. Simulation of reduction in GHG emissions from NPK fertilization depending on the index used in relation to the N dose resulting from the production function (grain yield). Genotype without (V1—wasko.gl−) and with (V2—wasko.pg+) ω—gliadin.
Agriculture 13 00282 g011
Table 1. Specification of wavelength and bandwidth of multispectral camera bands.
Band NameCenter Wavelength (nm)Bandwidth FWHM (nm)
Blue47520
Green56020
Red66810
Red Edge71710
NIR84040
Table 2. Construction of selected indices analysis of winter wheat genotypes.
Canopy Index Equation Reference
Canopy Chlorophyll Content Index (CCCI)CCCI = ((NIR − REDEDGE)/(NIR + REDEDGE))/((NIR − RED)/(NIR + RED)Cammarano et al. [25]
Enhanced Vegetation Index (EVI)EVI = 2.5 * ((NIR – RED)/(NIR + 6 × RED − 7.5 × BLUE + 1))Matsushita et al. [26]
Green Normalized Difference Vegetation Index (GNDVI)GNDVI = (NIR − GREEN)/(NIR + GREEN)Chen et al. [27]
Normalized Difference Red Edge (NDRE)NDRE = (NIR − REDEDGE)/(NIR + REDEDGE)Thompson et al. [28]
Normalized Difference Vegetation Index (NDVI)NDVI = (NIR − RED)/(NIR + RED)Chen et al. [27]
Table 3. Grain yield (Mg ha−1) of winter wheat genotypes under fertilization.
Fertilization (kg ha−1)GenotypeMean
N DoseS DoseV1V2
004.623.884.25
205.024.254.64
404.693.824.26
Mean4.783.984.38
4004.844.154.50
204.734.184.46
405.043.854.45
Mean4.874.064.47
6005.304.765.03
205.664.725.19
405.244.744.99
Mean5.404.745.07
8005.265.435.35
205.304.654.98
405.774.675.22
Mean5.454.915.18
10005.673.994.83
206.014.865.44
405.014.614.81
Mean5.564.495.03
12004.724.844.78
205.334.685.01
405.524.384.95
Mean5.194.474.83
Mean for genotype5.214.474.84
Mean for S dose05.074.514.79
205.344.564.95
405.214.344,78
LSDp=0.05 for genotype0.04
LSDp=0.05 for N dose-n.s. *
LSDp=0.05 for S dose-n.s.
*—not significant. LSD—least significant difference. Genotype without (V1—wasko.gl−) and with (V2—wasko.pg+) ω—gliadin.
Table 4. NDVI of winter wheat genotypes under fertilization.
Fertilization (kg ha−1)GenotypeMean
N DoseS DoseV1V2
000.5840.7920.688
200.8770.8230.850
400.8760.8100.843
Mean0.8690.8080.839
4000.8920.8400.866
200.8930.8000.847
400.8680.8360.852
Mean0.8840.8250.855
6000.8640.8700.867
200.8970.8470.872
400.8660.8240.845
Mean0.8760.8470.862
8000.9020.8320.867
200.9000.8000.850
400.9010.8510.876
Mean0.9010.8280.865
10000.8860.8150.851
200.8940.8060.850
400.8690.8540.862
Mean0.8830.8250.854
12000.8610.8210.841
200.8250.8140.820
400.8710.8000.836
Mean0.8530.8120.833
Mean for genotype0.8780.8240.851
Mean for S dose00.8760.8280.852
200.8810.8150.848
400.8750.8290.852
LSDp=0.05 for genotype0.043
LSDp=0.05 for N dose-n.s.*
LSDp=0.05 for S dose-n.s.
* not significant. LSD—least significant difference. Genotype without (V1—wasko.gl−) and with (V2—wasko.pg+) ω—gliadin.
Table 5. CCCI of winter wheat genotypes under fertilization.
Fertilization (kg ha−1)GenotypeMean
N DoseS DoseV1V2
000.5720.5540.563
200.5960.5510.574
400.5810.5540.568
Mean0.5830.5530.568
4000.6320.5880.610
200.6260.5460.586
400.6060.5800.593
Mean0.6210.5710.596
6000.5970.6080.603
200.6350.5760.606
400.6160.5570.587
Mean0.6160.5800.598
8000.6450.5900.618
200.6460.5510.599
400.6320.5820.607
Mean0.6410.5740.608
10000.6140.5680.591
200.6290.5460.588
400.6170.5870.602
Mean0.6200.5670.594
12000.6140.5960.605
200.5860.5560.571
400.5850.5470.566
Mean0.5950.5660.581
Mean for genotype0.6130.5690.591
Mean for S dose00.6120.5840.598
200.6200.5540.587
400.6060.5680.587
LSDp=0.05 for genotypen.s.*
LSDp=0.05 for N dose-0.032
LSDp=0.05 for S dose-n.s.
* not significant. LSD—least significant difference. Genotype without (V1—wasko.gl−) and with (V2—wasko.pg+) ω—gliadin.
Table 6. NDRE of winter wheat genotypes under fertilization.
Fertilization (kg ha−1)GenotypeMean
N DoseS DoseV1V2
000.4890.4390.464
200.5230.4540.489
400.5090.4490.479
Mean0.5070.4470.477
4000.5640.4960.530
200.5590.4380.499
400.5270.4870.507
Mean0.5500.4740.512
6000.5180.5310.525
200.5700.4900.530
400.5360.4590.498
Mean0.5410.4930.517
8000.5820.4930.538
200.5820.4410.512
400.5700.4960.533
Mean0.5780.4770.528
10000.5450.4630.504
200.5630.4410.502
400.5390.5030.521
Mean0.5490.4690.509
12000.5340.4730.504
200.4870.4530.470
400.5400.4380.489
Mean0.5200.4450.483
Mean for cv.0.5410.4690.505
Mean for S dose00.5390.4830.511
200.5470.4530.500
400.5370.4720.505
LSDp=0.05 for genotypen.s.
LSDp=0.05 for N dose-0.047
LSDp=0.05 for S dose-n.s.*
* not significant. LSD—least significant difference. Genotype without (V1—wasko.gl−) and with (V2—wasko.pg+) ω—gliadin.
Table 7. GNDVI of winter wheat genotypes under the fertilization.
Fertilization (kg ha−1)GenotypeMean
N DoseS DoseV1V2
000.7530.7140.734
200.7780.7260.752
400.7690.7220.746
Mean0.7660.7210.744
4000.8000.7540.777
200.7990.7140.757
400.7760.7480.762
Mean0.7920.7390.766
6000.7710.7800.776
200.8070.7510.779
400.7790.7300.755
Mean0.7860.7540.770
8000.8120.7530.783
200.8140.7170.766
400.8060.7560.781
Mean0.8110.7420.777
10000.7900.7310.761
200.8010.7170.759
400.7820.7590.771
Mean0.7910.7360.764
12000.7960.7280.762
200.7470.7250.736
400.7840.7160.750
Mean0.7760.7230.750
Mean for genotype0.7870.7360.762
Mean for S dose00.7870.7430.765
200.7910.7250.758
400.7830.7380.761
LSDp=0.05 for genotype0.043
LSDp=0.05 for N dose-n.s.*
LSDp=0.05 for S dose-n.s.
* not significant. LSD—least significant difference. Genotype without (V1—wasko.gl−) and with (V2—wasko.pg+) ω—gliadin.
Table 8. EVI index of winter wheat genotypes under fertilization.
Fertilization (kg ha−1)GenotypeMean
N DoseS DoseV1V2
000.4540.4360.445
200.4620.4460.454
400.4600.4410.451
Mean0.4580.4410.450
4000.4680.4510.460
200.4680.4380.453
400.4600.4490.455
Mean0.4650.4460.456
6000.4570.4590.458
200.4690.4520.461
400.4600.4450.453
Mean0.4620.4520.457
8000.4700.4480.459
200.4700.4370.454
400.4700.4520.461
Mean0.4700.4460.458
10000.4650.4430.454
200.4680.4400.454
400.4610.4550.458
Mean0.4650.4460.456
12000.4710.4530.462
200.4470.4420.445
400.4610.4380.450
Mean0.4600.4440.452
Mean for genotype0.4630.4460.455
Mean for S dose00.4640.4480.456
200.4640.4420.453
400.4620.4470.455
LSDp=0.05 for genotype0.043
LSDp=0.05 for N dose-n.s.*
LSDp=0.05 for S dose-n.s.
* not significant. LSD—least significant difference. Genotype without (V1—wasko.gl−) and with (V2—wasko.pg+) ω—gliadin.
Table 9. Simple correlation coefficients between selected vegetation indices and the yield of hypoallergenic wheat grain (22 May 2020).
CCCIEVIGNDVINDRENDVIYield
EVI0.93-
GNDVI0.930.84-
NDRE0.980.960.94-
NDVI−10.931.000.840.96-
Yield0.680.660.610.660.66-
LAI0.480.420.490.460.410.59
Table 10. Comparison of maximum of nitrogen dose, as well as value of indices calculated for grain yield and vegetation indices of hypoallergenic genotypes of winter wheat.
TraitsGenotypeEquations N kg per ha *
(1)
Estimated Grain Yield (Mg ha−1)
(2)
Maximum Value of Indices Estimated From (3) Decrease N Dose (kg ha−1) (4)In euro (5)
(5) = 0.638 * (4)
Simulated Reduction in Grain Yield in kg (6) Financial Loss after Yield Reduction (7)
(7) = 0.21 * (6)
Result (8)
(8) = (5) + (7)
Coefficients of Equations
Y = Ax2 + Bx + C
Where x = Dose of N in kg
R2
Grain yieldv1Y = −0.00008x2 + 0.015x + 4.690.69945.39 ------
v2Y = −0.00008x2 + 0.0162x + 3.890.631014.71 ------
LAIv1Y = −0.0001x2 + 0.0256x + 3.360.971285.305.56 −31.00−19.65−90−18.90−38.55
v2Y = −0.00008x2 + 0.0219x + 2.910.921374.604.91 −36.00 −22.92−110−23.10−46.02
NDREv1Y = −0.00001x2 + 0.0016x + 0.50460.75805.380.57 14.00 8.88−10−2.106.78
v2Y = −0.000009x2 + 0.0012x + 0.44660.89674.620.49 34.00 21.56−90−18.902.66
CCCIv1Y = −0.00001 x2 + 0.0014 x + 0.58140.83705.350.63 24.00 15.22−40−8.406.82
v2Y = −0.000006x2 + 0.0007x + 0.55350.89584.560.57 43.00 27.26−150−31.50−4.24
NDVIv1Y = −0.000007x2 + 0.0008x + 0.86550.58645.320.89 30.00 19.02−70−14.704.32
v2Y = −0.000007x2 + 0.0009x + 0.80750.78574.600.84 37.00 23.46−110−23.100.36
GNDVIv1Y = −0.000007x2 + 0.001x + 0.76470.71715.350.80 23.00 14.58−40−8.406.18
v2Y = −0.000007x2 + 0.0009x + 0.72080.89644.600.75 37.00 23.46−110−23.100.36
EVIv1Y = −0.000002x2 + 0.0003x + 0.45780.60755.370.469 19.00 12.1−20−4.207.9
v2Y = −0.000002x2 + 0.0002x + 0.44110.67504.500.44651.00 32.4−210−44.10−11.7
* Solution of equations (First derivative): 2Ax + B = 0, 1kg N = 0.634 Euro, 1kg grain = 0.21 Euro. Genotype without (V1—wasko.gl−) and with (V2—wasko.pg+) ω—gliadin.
Disclaimer/Publisher’s Note: The statements, opinions and data contained in all publications are solely those of the individual author(s) and contributor(s) and not of MDPI and/or the editor(s). MDPI and/or the editor(s) disclaim responsibility for any injury to people or property resulting from any ideas, methods, instructions or products referred to in the content.

