Article

Influence of Rapid Thermal Annealing on the Characteristics of Sn-Doped Ga2O3 Films Fabricated Using Plasma-Enhanced Atomic Layer Deposition

1
Institute of Wide Bandgap Semiconductors and Future Lighting, Academy for Engineering & Technology, Fudan University, Shanghai 200433, China
2
Shanghai Research Center for Silicon Carbide Power Devices Engineering & Technology, Fudan University, Shanghai 200433, China
3
Institute of Wide Bandgap Semiconductor Materials and Devices, Research Institute of Fudan University in Ningbo, Ningbo 315327, China
4
CAS Key Laboratory of Magnetic Materials and Devices, Zhejiang Province Key Laboratory of Magnetic Materials and Application Technology, Ningbo Institute of Materials Technology and Engineering, Chinese Academy of Sciences, Ningbo 315201, China
5
Key Laboratory of Marine Materials and Related Technologies, Zhejiang Key Laboratory of Marine Materials and Protective Technologies, Ningbo Institute of Materials Technology and Engineering, Chinese Academy of Sciences, Ningbo 315201, China
*
Authors to whom correspondence should be addressed.
Crystals 2023, 13(2), 301; https://doi.org/10.3390/cryst13020301
Submission received: 31 January 2023 / Revised: 7 February 2023 / Accepted: 9 February 2023 / Published: 11 February 2023
(This article belongs to the Special Issue Semiconductor Material Growth, Characterization, and Simulation)

Abstract

:
In this work, Sn-doped Ga2O3 films fabricated using plasma-enhanced atomic layer deposition were treated by rapid thermal annealing (RTA). The RTA influence on the chemical state, surface morphology, energy band alignment, and electrical properties of Sn-doped Ga2O3 films were thoroughly investigated. The results of X-ray photoelectron spectroscopy (XPS) demonstrated that Sn atoms were successfully doped into these films. Moreover, energy band alignments were obtained by the energy-loss peak of the O 1s spectrum and valence band spectra and thoroughly discussed. X-ray reflectivity (XRR) and atomic force microscope (AFM) measurements indicated that the Sn-doping level affects the interfacial microstructure and surface morphology. As the Sn content increases, the film thickness decreases while the roughness increases. Finally, the leakage current-voltage (I-V) characteristics proved that the Sn-doped Ga2O3 films have a large breakdown field. In I-V tests, all metal oxide semiconductor (MOS) capacitors exhibited a hard breakdown. This research demonstrates a method for manufacturing high-performance optoelectronic devices with desired properties.

1. Introduction

Gallium oxide (Ga2O3) is becoming popular for the next generation optoelectronic devices due to its large band gap (Eg~4.1–5.0 eV) [1,2,3]. The Ga2O3 crystals are transparent in a wide range of ultraviolet (UV) wavelengths down to 280 nm and are potentially electro-conductive [4]. This material has an excellent chemical and physical stability and still exhibits good semiconductor properties at temperatures above 600 °C. In addition, the band gap, conductivity, and optical properties of Ga2O3 materials can be changed by atomic doping and vacancy modulation, which demonstrates its excellent flexibility [5,6,7,8,9].
Nevertheless, when the Ga2O3 was deposited by different methods, Ga2O3 films can have a wide range of properties in many aspects, such as microstructure, roughness, density, chemical composition, and so on. Many researchers have recently used various methods to prepare element-doped Ga2O3 films with varying properties. For example, Tadjer et al. grew Si- and Sn-doped Ga2O3 thin films using edge-defined film-fed growth and then annealed them in N2 and O2 atmospheres [10]. Rare earth metals, such as Eu and gallium oxide, are co-sputtered to achieve Eu doping [11]. Eu doping was discovered to improve its electronic and photoluminescence properties. The Mg-doped Ga2O3 film was deposited on an n-Si wafer using the metal-organic chemical vapor deposition (MOCVD) method [12]. The decrease of oxygen vacancies induced by Mg doping is the key to fabricate a high-performance detector. The physical vapor deposition (PVD) technique is used to deposit 9.5% Al-doped amorphous Ga2O3 to improve optical and electrical properties [13]. Atomic layer deposition (ALD) is a self-limiting and ligand-exchange-based surface reaction technique. ALD can produce wafer-scale uniform films and control the sub-monolayer thickness, making it attractive for semiconductor device applications [14]. One can obtain uniform doping of semiconductor films at low temperatures by using ligand-exchange-based ALD surface reactions and sub-monolayer control [15,16]. Because of its low-temperature deposition, the resulting films are often amorphous. Heat treatment is necessary for annealing, oxidation, crystallization, activation, and other processes [8,17,18]. Li et al. introduced a post-annealing method to modulate the oxygen vacancies in ε-Ga2O3 thin films [19]. The devices with a lower oxygen vacancy concentration have been improved by 1–6 magnitude in a photo-to-dark current ratio, a responsivity, an excellent detectivity, a superior linear dynamic range, and an outstanding external quantum efficiency. The gallium oxide film grown on SiO2 substrates by the metal organic chemical vapor deposition technique is annealed in the range of 750–1050 °C [20]. The amorphous Ga2O3 are generated grains in the β-Ga2O3 phase. At higher temperature annealing, the ultraviolet band shift to the longer wavelength region and a broad green emission band has appeared, in addition to the existing blue–green emission band. Therefore, it is essential for post-annealing studies. It can express some questions, such as, how can the microstructure or chemical state be influenced after post-annealing in Sn-doped Ga2O3 thin films? Rapid thermal annealing (RTA) has been broadly employed in the research and production of semiconductors. Compared with general annealing, RTA is a warming process with fast and very short holding times that can be used to study the initial effects of annealing [21].
In this work, Sn-doped Ga2O3 films were prepared using the plasma-enhanced atomic layer deposition (PEALD) technique, followed by RTA at 800 °C in an N2 environment. The post-annealing effects were studied by X-ray photoelectron spectroscopy (XPS), which revealed that Sn doping on the films had been achieved. Furthermore, we studied the interfacial microstructure and surface morphology by using an atomic force microscope (AFM) and X-ray reflection (XRR). In addition, the energy bandgap (Eg) and energy band alignment of the annealed Sn-doped Ga2O3 films were detected and analyzed using thorough XPS measurements on the energy-loss peak of the O 1s spectrum and valence band spectra. Finally, the electrical properties of these films were investigated to assess their utility in further applications.

2. Experimental

Sn-doped Ga2O3 films with varying Sn concentrations were sequentially deposited on Si substrates at 200 °C using a BENEQ TFS200 ALD system (BENEQ, Finland). As it was previously described [6], trimethylgallium (TMG) and tetrakis(dimethylamino)tin (TDMASn) were respectively used as the gallium and tin sources during the deposition process. The Sn-doped Ga2O3 films with 0%–20% Sn contents were prepared by controlling the SnO2 and Ga2O3 ratio during one cycle. The RTA was then performed at 800 °C and holding for 10 min in a highly pure N2 atmosphere with a ramp rate of about 20 °C/s.
X-ray photoelectron spectroscopy (XPS, Thermo ScientificTM K-AlphaTM+) was used to characterize the chemical state. The step sizes in the XPS were 1 eV, 0.1 eV, and 0.02 eV for the survey spectrum, the core level spectra, and the valence band maximum (VBM), respectively. All survey and core-level spectra would be referenced to the C1s peak binding energy of 284.8 eV for adventitious carbon. The surface topography and microstructure of the films were examined using an atomic force microscope (AFM, Bruker, Dimension icon) and an X-ray reflection (XRR, Bruker, D8 Discover), respectively. A large area scan of AFM images with 25 μm × 25 μm was tested by 3100 SPM of Veeco Inc. (Plainview, NY, USA) The narrow scan analysis of 1 μm × 1 μm was performed using Dimension Icon of Bruker Inc. The XRR data were fitted using the REFLEX software [22]. REFLEX uses a slab-model approach with the Abeles matrix method taking into account the interfacial roughness of each layer together with their respective thickness and electron density. Metal oxide semiconductor (MOS) capacitors were constructed for in-depth electrical characterization. Magnetron sputtering was used to deposit aluminum electrodes with a thickness of 200 nm on the Sn-doped Ga2O3 films and the bottom of the Si substrate. The top electrodes were 200 µm wide square shaped arrays. A Keithley 4200-SCS parameter analyzer was used to perform leakage current-voltage (I-V) tests on the Sn-doped Ga2O3 devices in the air at room temperature on the Lakeshore probe station. The voltage range was 0–50 V with a step of 0.1 V.

3. Results and Discussion

3.1. Chemical Composition

Figure 1a shows a detailed study of the XPS spectra of the annealed Sn-doped Ga2O3 thin films with varying Sn contents. The XPS wide scan spectra are dominated by photoelectron peaks of Ga (2p, 3s, 3p, and 3d), the Sn (3p and 3d), the O (1s), and C (1s, as introduced) along with the respective Auger peaks from gallium (Ga LMM) and oxygen (O KL1), which is in accordance with previous literature reports about unannealed Sn-doped Ga2O3 [6]. These results indicated the excellent quality of the annealed Ga2O3 thin films. The stacked XPS narrow scans of Ga 2p peaks in Figure 1b show that the energy gap of Ga2p1/2 (~1144.71 eV) and Ga2p3/2 (~1117.81 eV) for Ga–O bonding is about 26.9 eV, which is consistent with the standard value [23]. Figure 1c shows that the peaks of Ga 3d are located in 20.1 eV. With the change of the doping amount, the peak position is basically unchanged, indicating that the chemical environment around Ga atoms has not changed significantly. At the higher binding energy of about 26.1 eV, a weak signal of Sn 4d was detected. The photoelectron peaks of Sn 3p and 3d were also not visible in the broad spectra. In addition, the XPS peak for the Sn 3d is difficult to discern from the Auger peaks of the Ga LM due to their close binding energy. In order to confirm the Sn 3d peak, so we performed narrow scans of the Sn 3d peak, as shown in Figure 1d. With increasing Sn content, the intensity of the Sn 3d peaks increases, but the binding energy difference between Sn 3d3/2 (~495.0 eV) and 3d5/2 (~486.6 eV) remains constant at 8.4 eV. The signals of peaks located at 491.1 eV were observed in the Sn 3d spectra, which is the Ga LM4 peak. The XPS analysis indicates that the Sn remained after RTA.

3.2. Surface Topography and Microstructure

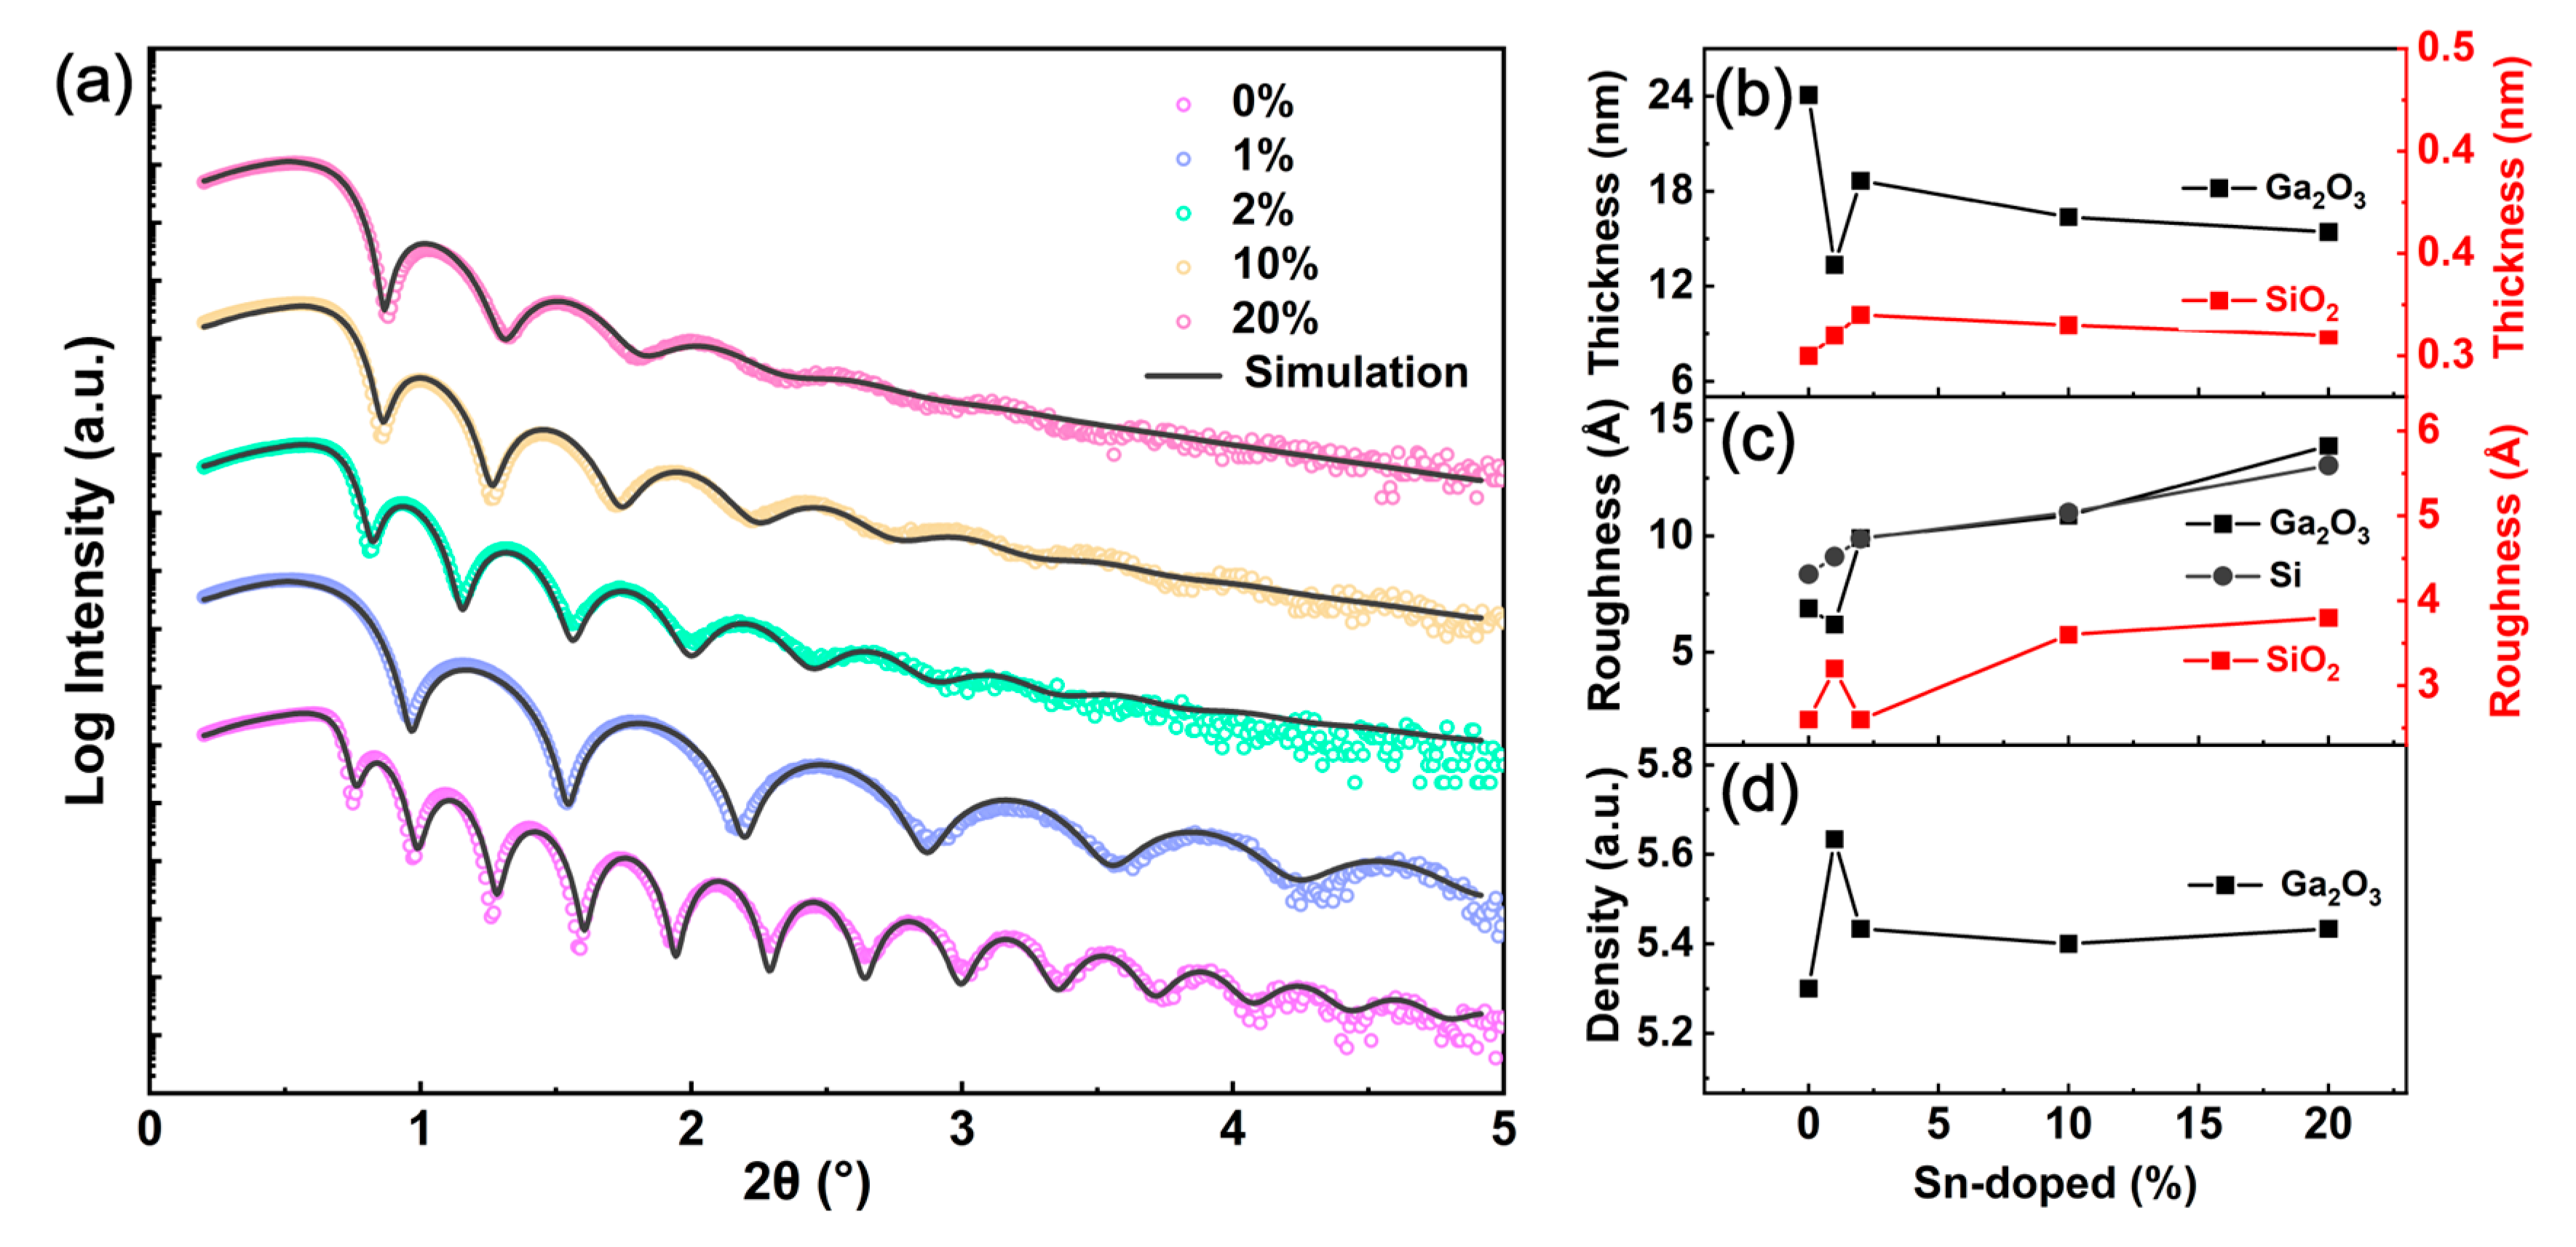
To study the influence of annealing on the surface topography, XRR and AFM measurements were carried out to analyze the physical properties and microstructure of the Ga2O3 film. Figure 2 presents the reflectance spectra of annealed Ga2O3 films having different Sn concentrations. The simulated XRR spectra (curves) were obtained via a bilayer model composed of a Ga2O3 layer and a thin SiO2 buffer layer. It is demonstrated that the films have smooth interfaces by the well-developed oscillations [24], especially, in undoped films. The Kiessig fringes [25] period of the undoped film is around 0.32º, indicating that the thickest film thickness is 24.07 nm. Sn doping reduces the film thickness, which increases the period of fringes. One percent Sn-doped film has the longest Kiessig fringe period, 0.59º, and the least film thickness reduction of 12.64 nm. Furthermore, the periods of the Kiessig fringes of another sample are around 0.33º for the Ga2O3 films with 2% Sn compositions, about 0.4º for Sn composition at 10%, and roughly 0.45º for Sn compositions at 20%. The thicknesses of Ga2O3 and SiO2 layers obtained from the XRR data as a function of the Sn composition are plotted in Figure 2b. Sn doping results in a slightly thicker buffer layer when compared to an undoped film. Furthermore, the 20% Sn-doped film has the fastest decay of amplitude, which means that the roughness of the film has a lower interfacial quality than other films [24]. In the 20% Sn-doped film, the roughness of the Ga2O3 layer, SiO2 sublayer, and Si substrate are 13.89 Å, 3.8 Å, and 13.05 Å, respectively. On the contrary, the undoped film exhibited clear Kiessig fringes even at 2θ = 5°, indicating that the annealed film has a smooth surface. The corresponding roughness of the Ga2O3 layer, SiO2 sublayer, and Si substrate are 6.89 Å, 2.6 Å and 8.36 Å, respectively. The roughness data of each layer of all films obtained from Figure 2a were plotted in Figure 2c. It is clear that increasing Sn doping causes the surface roughness of Ga2O3 film, buffer layer SiO2, and substrate Si wafer to increase and a significant improvement in surface roughness compared to unannealed films [6]. This could be attributed to the roughening of the interface by Sn atoms during the annealing process. Moreover, burning of the film surface and oxidation of the Si substrate during post-annealing could cause the increase of the roughness of Ga2O3 surface. Meanwhile, the thicknesses of unannealed films are slightly less than the annealed films. As shown in Figure 2d, the densities were measured from the XRR for the Ga2O3 films with different Sn contents. Sn atoms with a higher atomic mass replace some of the Ga atoms during the doping, resulting in a denser Sn-doped film than an undoped film. Since the samples were annealed under an oxygen-deficient environment, the O atoms escaped the Ga2O3 films and the oxygen vacancy concentration was increased, which may lead to the density of the unannealed film becoming greater than that of the annealed film.
In contrast to the XRR measurements, which obtain surface roughness indirectly, AFM technology can directly observe surface features and morphology. In order to obtain the holistic roughness information of the films, the large area scan of 25 μm × 25 μm was examined, as shown in Figure 3(a1–e1). It is determined that the surfaces of the samples after RTA are still smooth. The related root-mean-square (RMS) roughness values are less than 8 Å for all films, and the RMS roughness is plotted versus Sn-doped content in Figure 3(f1). The RMS roughness linearly increases with the Sn content of the film. This shows a roughness variation trend similar to the XRR measurement results. The corresponding high distribution images derived from the 25 μm × 25 μm area are shown in the inset of Figure 3(a1–f1). For the undoped film, the absolute value of height is mostly less than 5 Å. As the Sn content increases, the ratio of the height greater than 10 Å rises and the normal distribution curve spreads out. This means that the surface of the film becomes rougher. To further observe the morphology feature of the annealed films, we performed a narrow scan of 1 μm × 1 μm for a locally enlarged area. Typical 3D AFM images of annealed Sn-doped Ga2O3 thin films are displayed in Figure 3(a2–e2) The formation of island-like and larger-sized grains in the annealed sample distinguishes it from the unannealed acicular structure observed in the films prepared using PEALD [6,22]. In addition, Sn-doping can have a significant impact on the distribution of surface morphology. As it is shown in Figure 3(a2–e2), the grain size and surface roughness increase with increasing Sn content. This could be related to the fact that Sn atoms promote the migration of atoms and nucleation of absorbed atoms. For instance, significant island-like grains and increased roughness were observed for 20% Sn-doping. The RMS roughness derived from the narrow scan is plotted versus the Sn-doped content in Figure 3(f2), which displays a roughness variation trend similar to the data from the large area scan.

3.3. Energy Band Structure

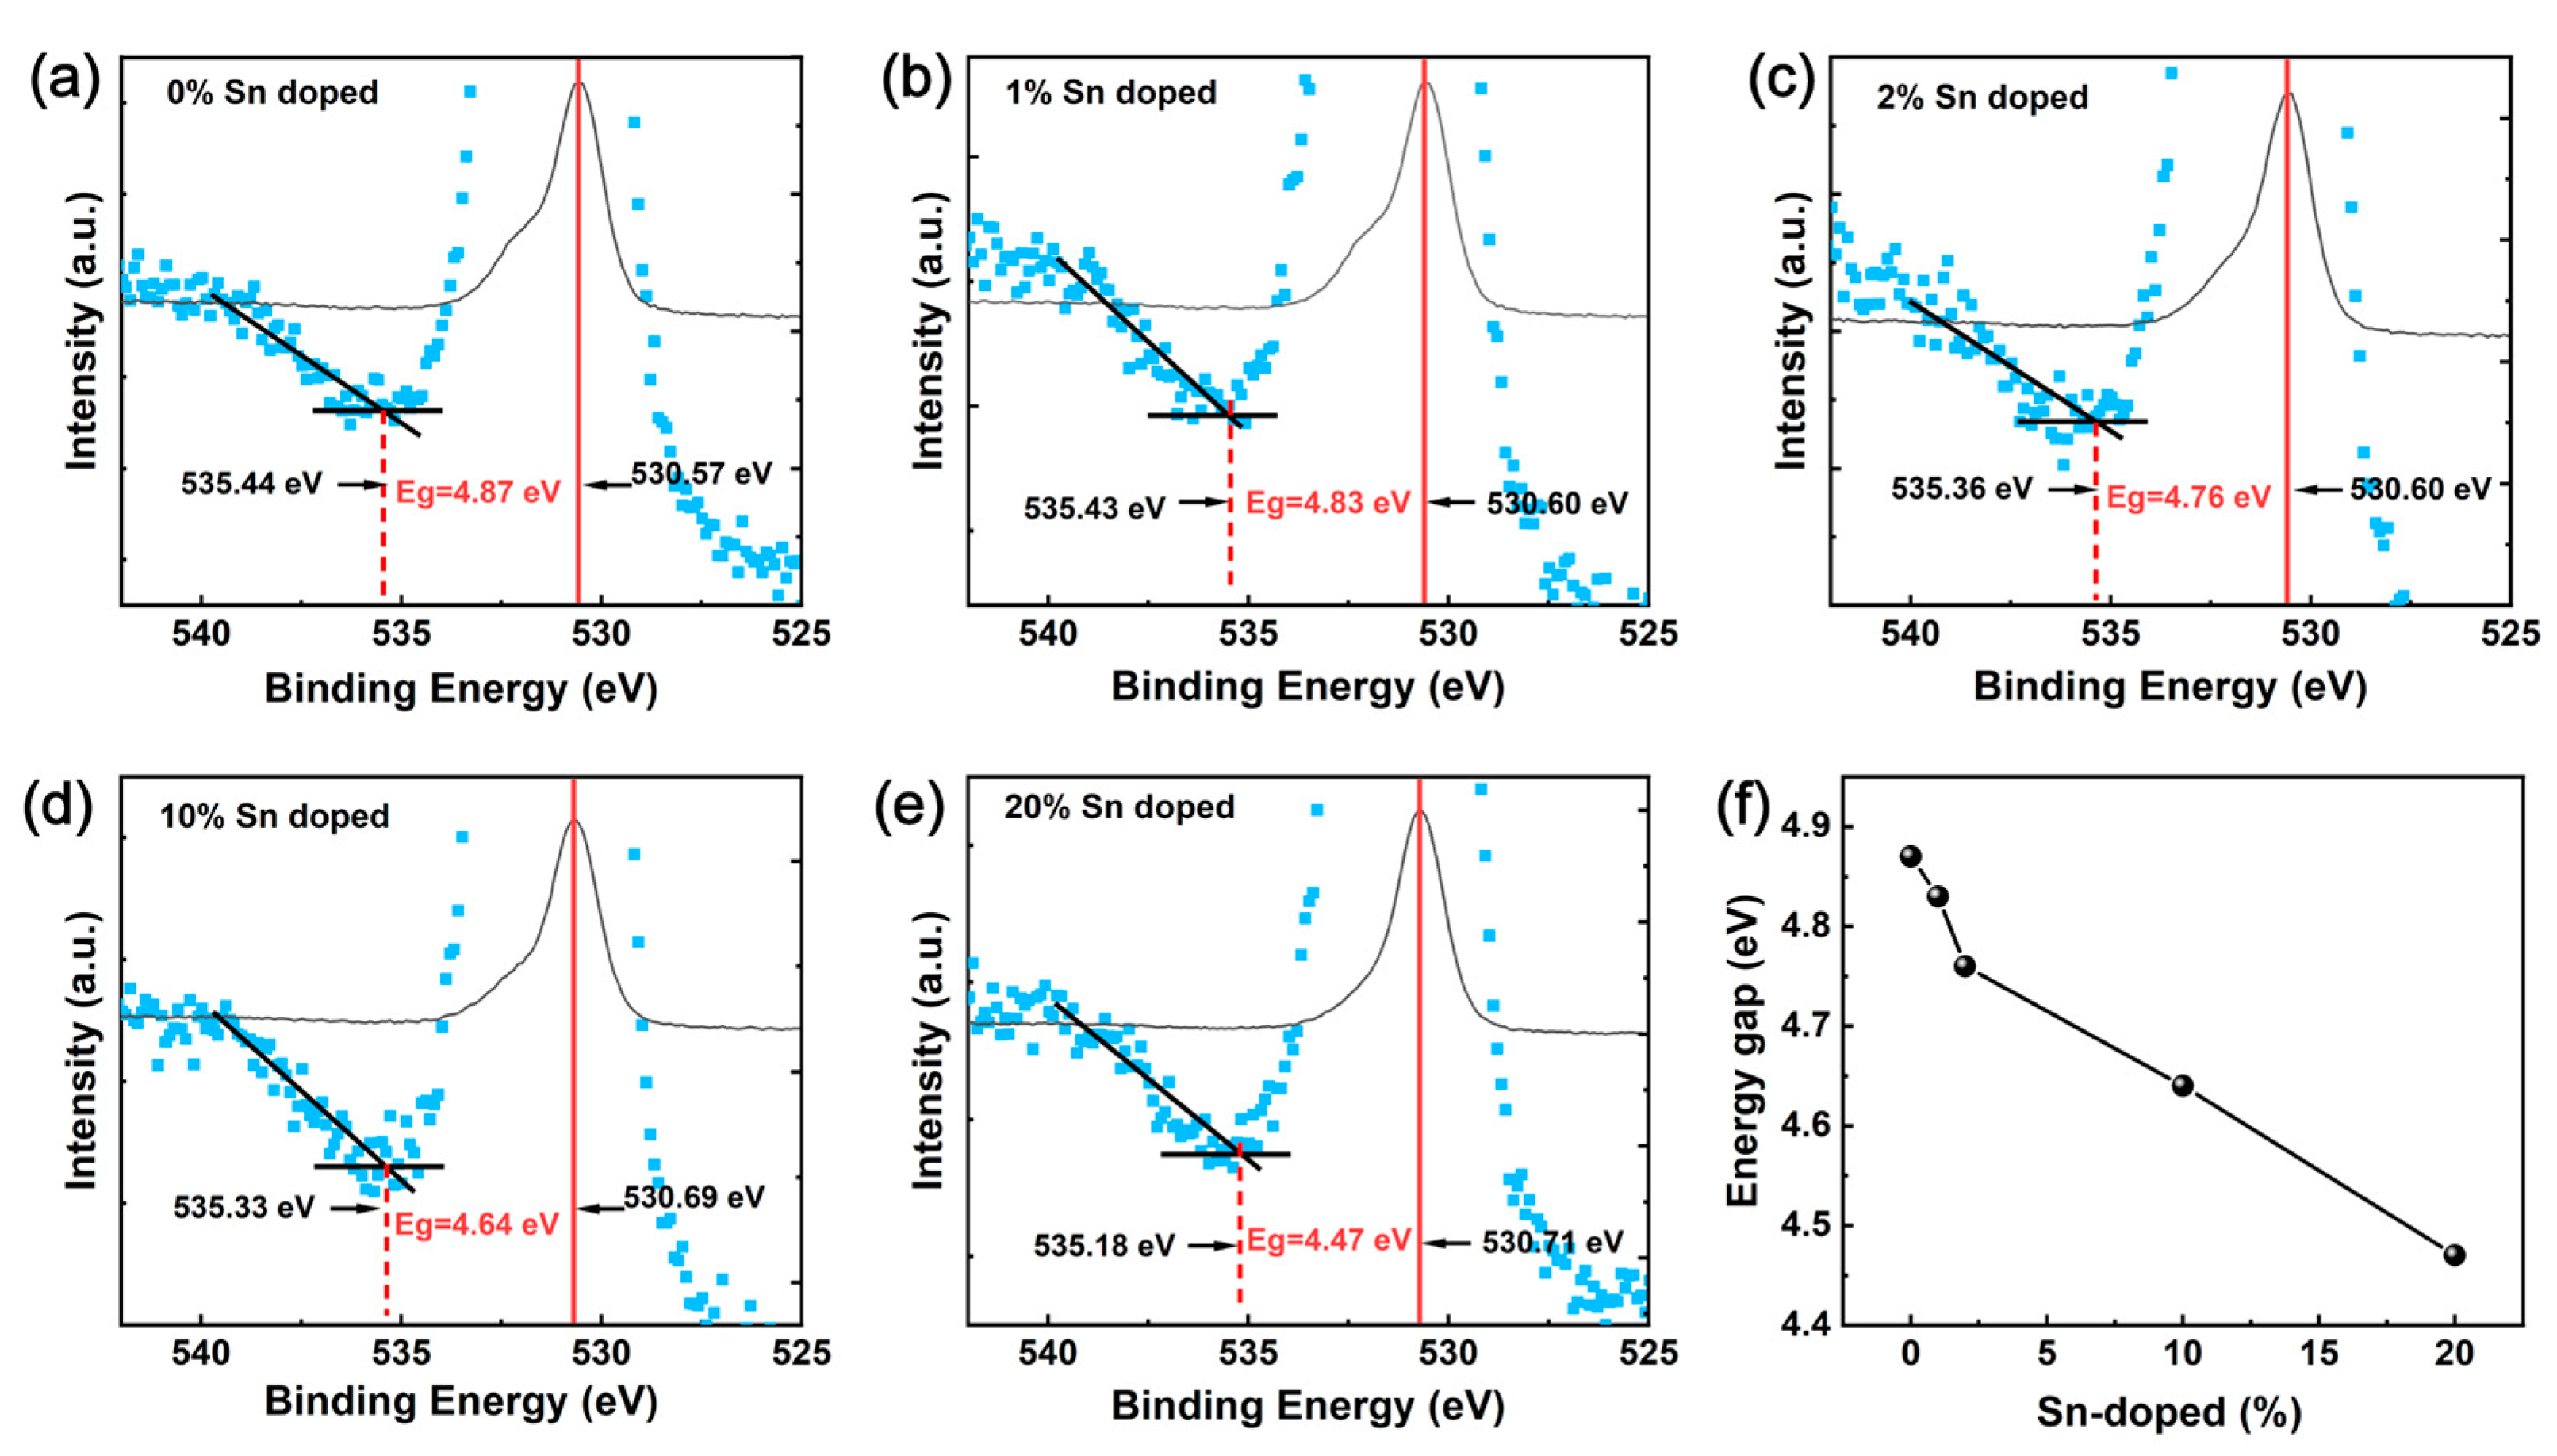
It is essential to determine the energy band gap (Eg) of the semiconductor materials because it is a crucial parameter for designing high-powered optoelectronic devices. Therefore, we investigated the doping effect of the Sn atom on the Eg of annealed Ga2O3 thin films. Figure 4 shows the fitting Eg estimation procedure of the annealed Ga2O3 thin films using the energy-loss peak of the O 1s spectrum. This method has been previously used for several oxide semiconductors [26,27,28]. The energy loss structure is close to the approximate location of the onset of inelastic losses. The difference between the core level peak energy of O 1s and the onset of inelastic losses was utilized to obtain the Eg. As shown in Figure 4a, the energy gap of pure Ga2O3 measured using this method is 4.87 eV, which is in agreement with the literature [29]. When the Sn contents rise, the position of O 1s peak moves to high bonding energy from 530.57 eV of 0% to 530.71 eV of 20%. As shown in Figure 4b to Figure 4e, the energy gaps of Sn-doped Ga2O3 films with Sn content of 1%, 2%, 10%, and 20% are 4.83 eV, 4.76 eV, 4.64 eV, and 4.47 eV, respectively. Figure 4f shows that the bandgap of Sn-doped Ga2O3 films decreases continuously as the Sn content increases. The Eg value is 3.60 eV in pure SnO2 materials [30], which is lower than that of the Ga2O3 materials. This result leads to a reduction in the Eg value of Sn-doped Ga2O3 films. In contrast, the Eg value of annealed films is larger than that of the unannealed films. This reason may be attributed from the Sn4+ ions were activated into the films after annealing. These findings demonstrate that the Eg still can be controlled by the Sn doping ratio after RTA, paving the way for the development of optoelectronic and photonic devices based on Sn-doped Ga2O3 films.
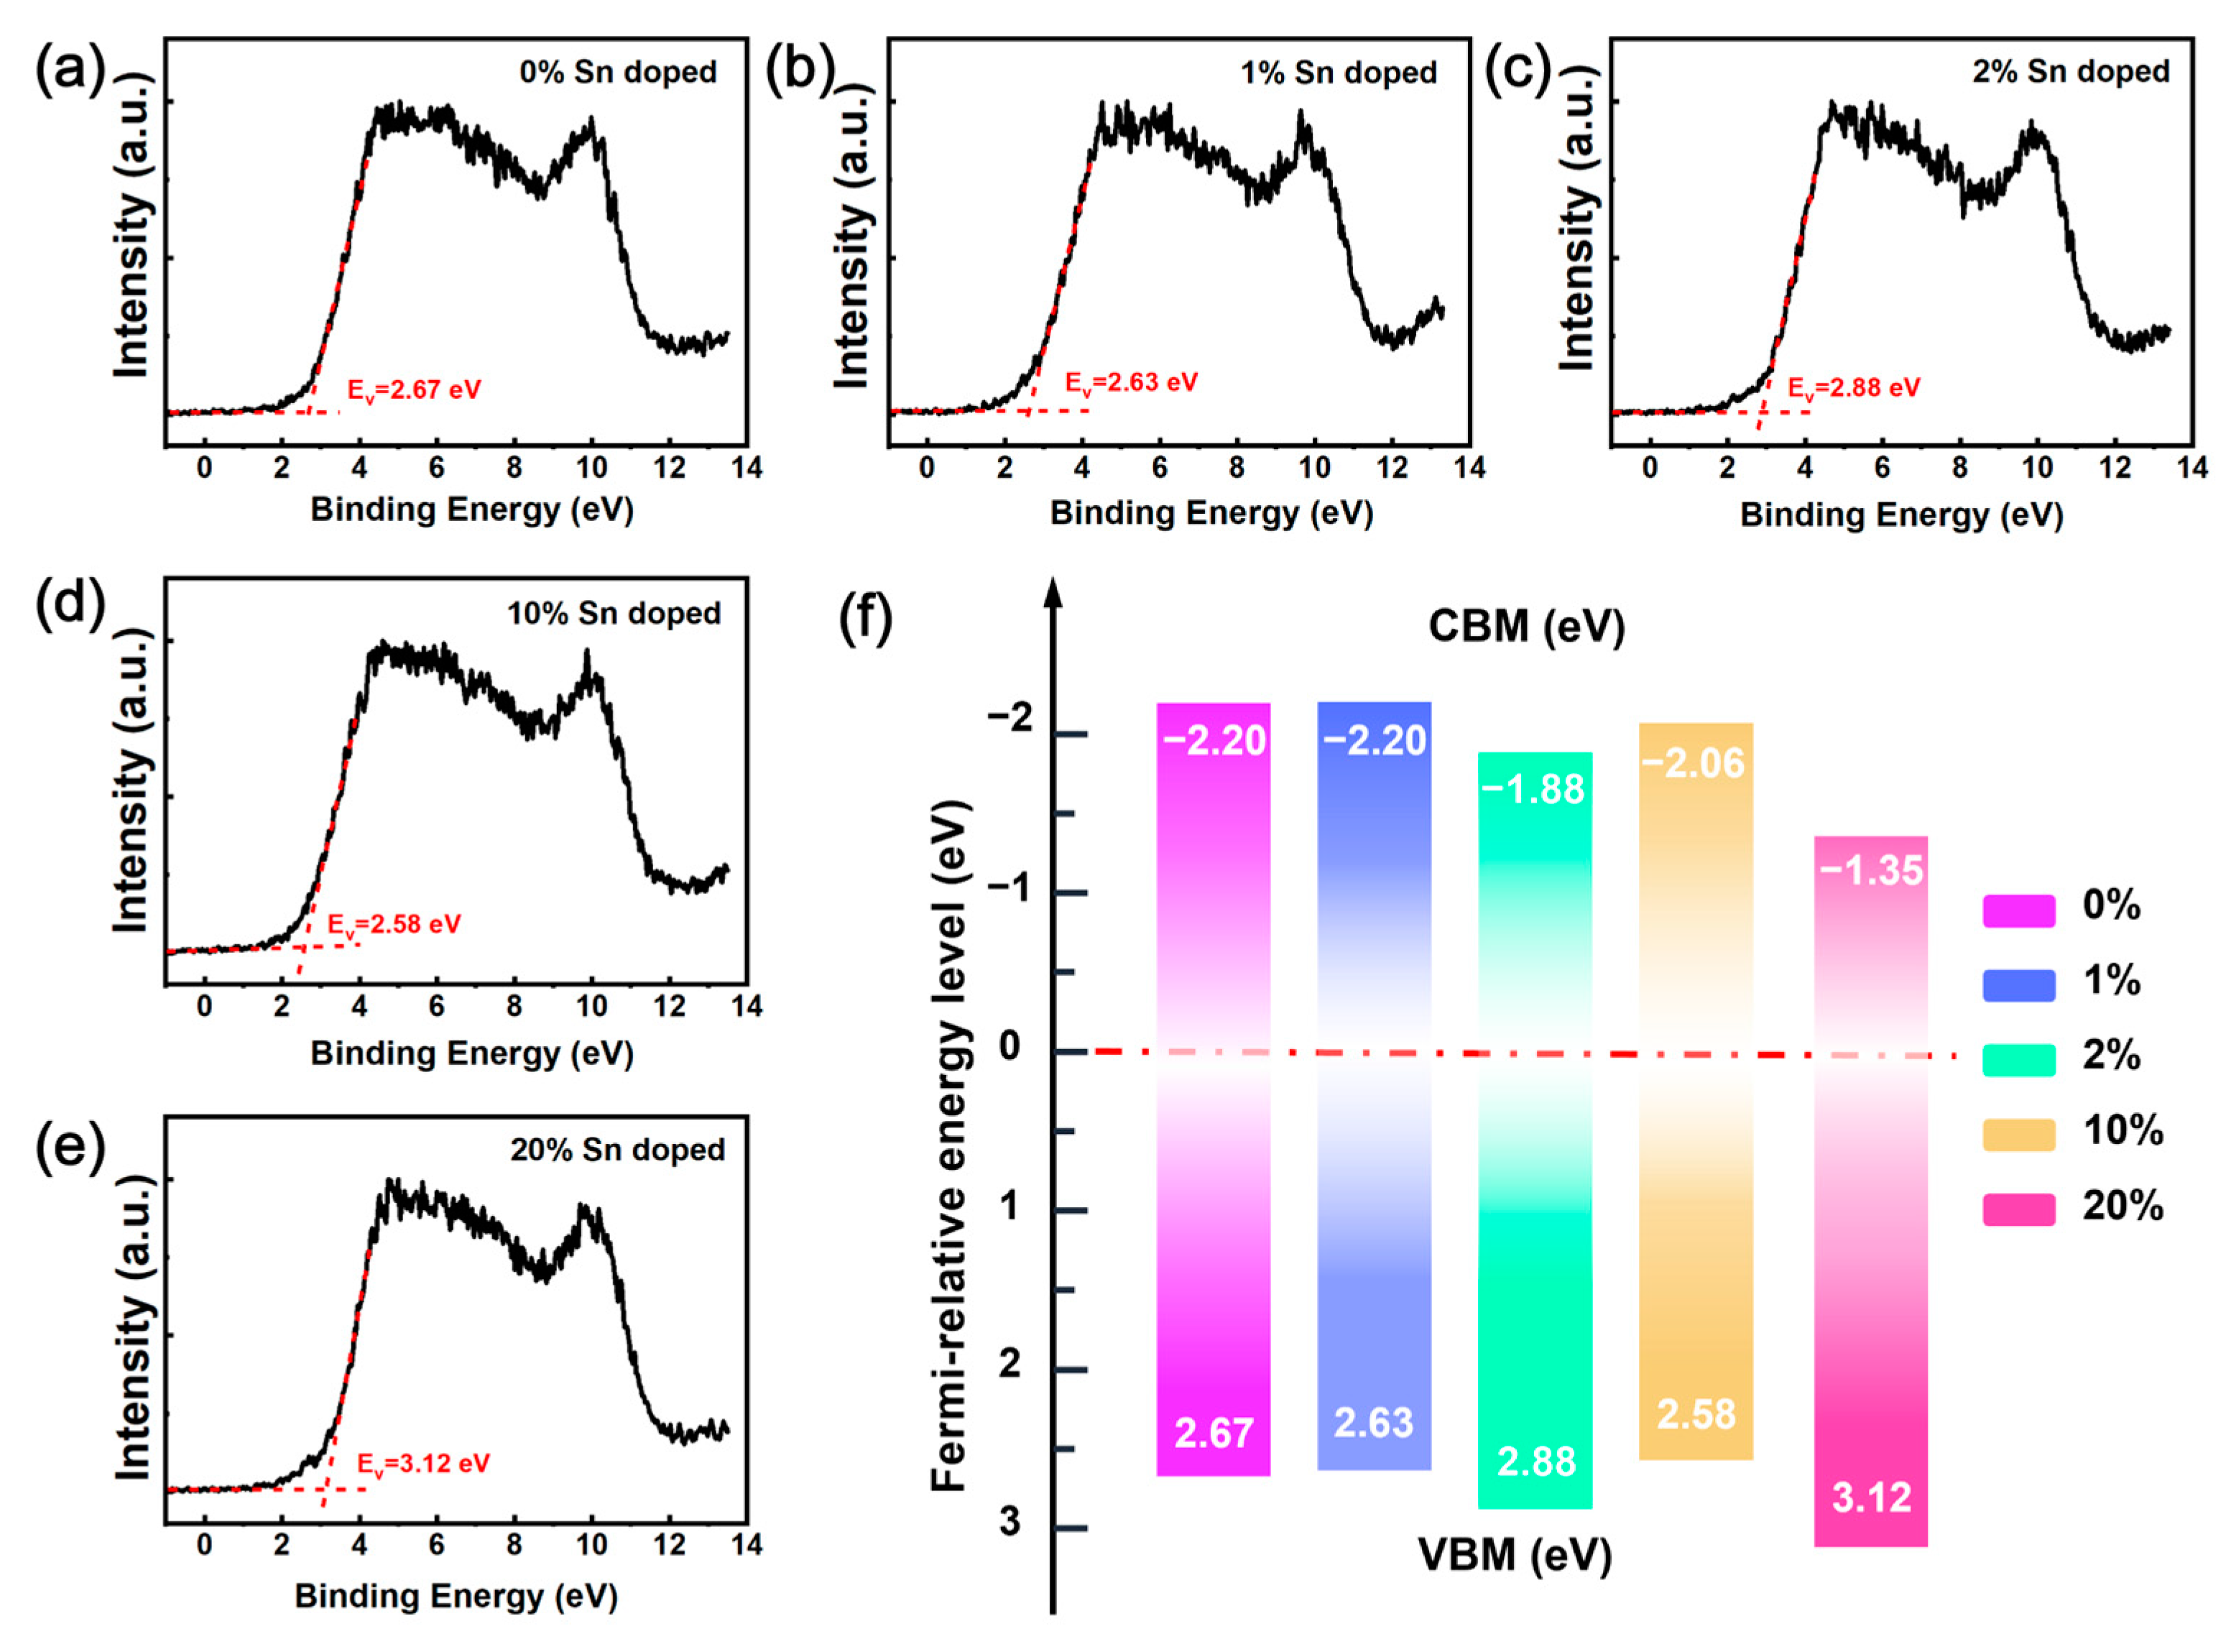
For the optoelectronic application of Ga2O3 thin materials, one needs to understand the nature of the band edges, namely, the valence band maximum (VBM) and conduction band minimum (CBM) [31]. The characteristics of VBM and CBM will have a direct impact on the application of a device, for example, in optical transitions, charge transfer, and so on. The valence band spectra were depicted in Figure 5a–e and the VBM is determined by the tangent method. The VBM varies slightly when the Sn content is changed. The maximum value of VBM, Ev, is 3.12 eV for the 20% Sn-doped Ga2O3 film, while the Ev of other films is less than 2.9 eV. The calculated VBMs are 2.67 eV, 2.63 eV, 2.88 eV, and 2.58 eV for the annealed Ga2O3 having 0%, 1%, 2%, and 10% Sn contents, respectively. The increase in VBM could be related to an increase in oxygen vacancies and defects. The value of CBM is calculated using Ec = EvEg. Fermi level of Ga2O3 film was 2.20 eV below the CBM. The Ga2O3 film doping Sn atoms showed a similar result. The calculated maximum CBMs is −1.35 eV in 20% Sn contents of the Ga2O3 film, and the minimum value was in 1% Sn-doped films. The other calculated CBMs are −1.88 eV and −2.06 eV for the annealed Ga2O3 having 2% and 10%, Sn contents, respectively. The VBMs and CBMs of all samples were summarized, and their energy levels with respect to the vacuum are plotted in Figure 5f. The CBM shifted significantly toward higher energies as the Sn content increased. Thus, the Fermi level shifts toward the conduction band in the annealed films as the Sn content increases. As compared to the previously reported unannealed film [6], the Fermi level of the annealed films shifts further away from the conduction band, and its Ec is smaller. This may be related to the presence of Sn in the form of amorphous SnO2 before annealing, and the contribution of Ec is made up of SnO2 with a low CBM value of 0.8 eV [32] and pure Ga2O3. Following annealing, the Sn atoms were activated and appeared mainly in the form of Sn ions in the Ga2O3 film instead of in the form of amorphous SnO2.

3.4. Electrical Properties

The electrical properties of annealed Sn-doped Ga2O3 films were investigated using the MOS capacitors. Figure 6a shows room temperature I-V characteristic curves of the annealed Ga2O3 thin films with different Sn-doped contents. The leakage current of all films was less than 1 × 10⁻⁹ A at 0.1 V, indicating good insulating properties. As the voltage rises, the leakage current remains stable at ~1 × 10⁻⁷ A in the pre-breakdown region, which means the MOS capacitors are still intact. When the loading voltage reaches the critical breakdown voltage, the leakage current sharply increases. There is no visible “soft” breakdown point in any of the five samples until the final “hard” breakdown point is reached. This indicates that there are no pinholes or cracks inside the dielectric film, and the breakdown mode of all samples is the intrinsic breakdown. In addition, the as-deposited Ga2O3 films by the ALD method have a very smooth surface. These observations are closely related to its outstanding electrical properties. However, for the unannealed films, at the critical breakdown voltage, there is no sharp change in the leakage current of the MOS capacitor made by 10% Sn-doped Ga2O3 film [6]. When the doping concentration reaches 20%, the MOS capacitor exhibits visible soft breakdown, which is different from the MOS capacitor made by the annealed films. This may be because tiny and non-dense voids of the unannealed films were healed by self-growth in the post-annealing process. This caused that all annealed samples showed a significant “hard breakdown” mode. The breakdown voltages are ~32.1 V of V1, ~17 V of V2, ~23.8 V of V3, ~18.1 V of V4, and ~11.9 V of V5 for 0%, 1%, 2%, 10%, and 20% Sn contents in the doped film, respectively. This indicates that the breakdown voltage of various Sn-doped samples differs significantly. As the Sn doping concentration increases, the Eg value decreases which is the main intrinsic reason causing the reduction in the breakdown voltage. Of course, the other reason may be attributed to the extrinsic factor. The thickness of the film reduced, leading to a decrease in the breakdown voltage. In order to better analyze the effect of Sn doping on the breakdown resistance characteristics of the films, their breakdown electric field was calculated by taking into account the thickness. The thickness of these films was estimated by using the XRR analysis shown in Figure 2b. The calculated breakdown electric field is plotted in Figure 6b. Similar to the Eg variation shown in Figure 4f, the breakdown electric field decreases with the increasing Sn content. Moreover, the breakdown field in this work is slightly larger than the bulk Ga2O3 [33] and amorphous Ga2O3 [6]. This could be due to the introduction of a thin SiO2 buffer layer in the RTA process. The insulated SiO2 material has wide a band gap [28] and a high electric field [34], which improves the breakdown electric field in Ga2O3 MOS capacitors.

4. Conclusions

Various Sn-doped Ga2O3 films were prepared using PEALD and were then subjected to the RTA process at 800 °C in an N2 environment. According to the XPS results, all annealed films were still of excellent quality similar to the standard Ga2O3 films. The bonding energy gap of Ga2p1/2 and Ga2p3/2 for Ga–O bonding was approximately 26.9 eV, which is consistent with the standard value. The intensity of the Sn 3d peaks increases as the doped Sn content increases, indicating that Sn atoms were successfully doped in Ga2O3 films after RTA. The XRR and AFM analyses confirmed that the surfaces of these films were smooth and of high quality. The microstructure changes as the amount of Sn doping changes. Furthermore, as the Sn concentration in the film increases, the energy bandgap of the Ga2O3 film decreases from ~4.87 eV to ~4.47 eV. The Fermi level shifts toward the conduction band in the annealed films at a higher Sn content. In comparison to unannealed Sn-doped Ga2O3 films, Sn ions were activated after RTA, causing Ec to decrease. The I-V tests were carried out using Ga2O3 MOS capacitors. The presence of the SiO2 layer after annealing increases the breakdown electric field. Meanwhile, the tiny and non-dense voids of the unannealed films maybe be healed by self-growth in the post-annealing process which improves the reliability of the MOS capacitors. According to these findings, Ga2O3 films with the required properties can be fabricated for high-performance electrical devices by varying the Sn concentration.

Author Contributions

Conceptualization, H.-P.M.; Data curation, Y.S. and A.L.; Formal analysis, Y.S., Z.-Y.W. and A.L.; Funding acquisition, H.-P.M.; Investigation, Y.S., L.G., J.Z., M.-Y.Y. and Q.-C.Z.; Methodology, Y.S.; Project administration, H.-P.M. and Q.-C.Z.; Supervision, H.-P.M. and Q.-C.Z.; Validation, L.G. and M.-Y.Y.; Writing—original draft, Y.S. and H.-P.M.; Writing—review and editing, H.-P.M. and Q.-C.Z. All authors have read and agreed to the published version of the manuscript.

Funding

This work was funded by Shanghai Science and Technology Development Foundation (No. 21DZ1100800, 20501110700, and 20501110702).

Data Availability Statement

The data presented in this study are available upon request from the corresponding author.

Conflicts of Interest

The authors declare no conflict of interest.

References

  1. Higashiwaki, M.; Sasaki, K.; Kuramata, A.; Masui, T.; Yamakoshi, S. Gallium oxide (Ga2O3) metal-semiconductor field-effect transistors on single-crystal β-Ga2O3 (010) substrates. Appl. Phys. Lett. 2012, 100, 013504. [Google Scholar] [CrossRef]
  2. Fan, M.-M.; Lu, Y.-J.; Xu, K.-L.; Cui, Y.-X.; Cao, L.; Li, X.-Y. Growth and characterization of Sn-doped β-Ga2O3 thin films by chemical vapor deposition using solid powder precursors toward solar-blind ultraviolet photodetection. Appl. Surf. Sci. 2020, 509, 144867. [Google Scholar] [CrossRef]
  3. Ogita, M.; Higo, K.; Nakanishi, Y.; Hatanaka, Y. Ga2O3 thin film for oxygen sensor at high temperature. Appl. Surf. Sci. 2001, 175, 721–725. [Google Scholar] [CrossRef]
  4. Stepanov, S.I.; Nikolaev, V.I.; Bougrov, V.E.; Romanov, A.E. Gallium oxide: Properties and applications-a review. Rev. Adv. Mater. Sci. 2016, 44, 63–86. [Google Scholar]
  5. Gu, L.; Ma, H.-P.; Shen, Y.; Zhang, J.; Chen, W.-J.; Yang, R.-Y.; Wu, F.; Yang, L.; Zeng, Y.-X.; Wang, X.-R.; et al. Temperature-dependent oxygen annealing effect on the properties of Ga2O3 thin film deposited by atomic layer deposition. J. Alloys Compd. 2022, 925, 166727. [Google Scholar] [CrossRef]
  6. Shen, Y.; Ma, H.-P.; Gu, L.; Zhang, J.; Huang, W.; Zhu, J.-T.; Zhang, Q.-C. Atomic-Level Sn Doping Effect in Ga2O3 Films Using Plasma-Enhanced Atomic Layer Deposition. Nanomaterials 2022, 12, 4256. [Google Scholar] [CrossRef] [PubMed]
  7. Rogers, D.J.; Look, D.C.; Teherani, F.H.; Magill, B.A.; Park, J.-H.; Rogers, D.J.; McClintock, R.; Razeghi, M.; Pavlidis, D.; Dravid, V.P.; et al. A review of the growth, doping, and applications of Beta-Ga2O3 thin films. Oxide-Based Mater. Devices IX 2018, 10533, R1–R24. [Google Scholar]
  8. Baji, Z.; Cora, I.; Horváth, Z.; Agócs, E.; Szabó, Z. Atomic layer deposition and characterization of Zn-doped Ga2O3 films. J. Vac. Sci. Technol. A 2021, 39, 032411. [Google Scholar] [CrossRef]
  9. Wang, F.H.; Chen, K.N.; Hsu, C.M.; Liu, M.C.; Yang, C.F. Investigation of the Structural, Electrical, and Optical Properties of the Nano-Scale GZO Thin Films on Glass and Flexible Polyimide Substrates. Nanomaterials 2016, 6, 88. [Google Scholar] [CrossRef]
  10. Tadjer, M.J.; Freitas, J.A.; Culbertson, J.C.; Weber, M.H.; Glaser, E.R.; Mock, A.L.; Mahadik, N.A.; Schmieder, K.; Jackson, E.; Gallagher, J.C.; et al. Structural and electronic properties of Si- and Sn-doped (−201) β-Ga2O3 annealed in nitrogen and oxygen atmospheres. J. Phys. D: Appl. Phys. 2020, 53, 88. [Google Scholar] [CrossRef]
  11. Mandal, P.; Singh, U.P.; Roy, S. Optical performance of europium-doped β gallium oxide PVD thin films. J. Mater. Sci. Mater. Electron. 2021, 32, 3958–3965. [Google Scholar] [CrossRef]
  12. Zhang, D.; Du, Z.; Ma, M.; Zheng, W.; Liu, S.; Huang, F. Enhanced performance of solar-blind ultraviolet photodetector based on Mg-doped amorphous gallium oxide film. Vacuum 2019, 159, 204–208. [Google Scholar] [CrossRef]
  13. Mandal, P.; Roy, S.; Singh, U.P. Investigation on the optical and electrical performance of aluminium doped gallium oxide thin films. Opt. Quantum Electron. 2022, 54, 476. [Google Scholar] [CrossRef]
  14. Biyikli, N.; Haider, A. Atomic layer deposition: An enabling technology for the growth of functional nanoscale semiconductors. Semicond. Sci. Technol. 2017, 32, 093002. [Google Scholar] [CrossRef]
  15. Ma, H.-P.; Yang, J.-H.; Tao, J.-J.; Yuan, K.-P.; Cheng, P.-H.; Huang, W.; Wang, J.-C.; Guo, Q.-X.; Lu, H.-L.; Zhang, D.W. Low-temperature epitaxial growth of high-quality GaON films on ZnO nanowires for superior photoelectrochemical water splitting. Nano Energy 2019, 66, 104089. [Google Scholar] [CrossRef]
  16. Ma, H.-P.; Gu, L.; Shen, Y.; Huang, W.; Liu, Y.-H.; Zhu, J.-T.; Zhang, Q.-C. Annealing effect on SiNx/SiO2 superlattice with ultrathin sublayer fabricated using plasma-enhanced atomic layer deposition. Ceram. Int. 2022, 48, 22164–22171. [Google Scholar] [CrossRef]
  17. Kim, H.W.; Kim, N.H. Annealing effects on the properties of Ga2O3 thin films grown on sapphire by the metal organic chemical vapor deposition. Appl. Surf. Sci. 2004, 230, 301–306. [Google Scholar] [CrossRef]
  18. Wu, J.; Mi, W.; Yang, Z.; Chen, Y.; Li, P.; Zhao, J.; Zhang, K.; Zhang, X.; Luan, C. Influence of annealing on the structural and optical properties of gallium oxide films deposited on c-sapphire substrate. Vacuum 2019, 167, 6–9. [Google Scholar] [CrossRef]
  19. Li, S.; Yue, J.; Ji, X.; Lu, C.; Yan, Z.; Li, P.; Guo, D.; Wu, Z.; Tang, W. Oxygen vacancies modulating the photodetector performances in ε-Ga2O3 thin films. J. Mater. Chem. C 2021, 9, 5437–5444. [Google Scholar] [CrossRef]
  20. Kim, H.W.; Kim, N.H. Influence of postdeposition annealing on the properties of Ga2O3 films on SiO2 substrates. J. Alloys Compd. 2005, 389, 177–181. [Google Scholar] [CrossRef]
  21. Hill, C.; Jones, S.K.; Boys, D.R. Rapid thermal annealing-theory and practice. In Reduced Thermal Processing for ULSI; Springer: Berlin/Heidelberg, Germany, 1989; pp. 143–180. [Google Scholar]
  22. Vignaud, G.; Gibaud, A. REFLEX: A program for the analysis of specular X-ray and neutron reflectivity data. J. Appl. Crystallogr. 2019, 52, 201–213. [Google Scholar] [CrossRef]
  23. Mi, W.; Li, Z.; Luan, C.; Xiao, H.; Zhao, C.; Ma, J. Transparent conducting tin-doped Ga2O3 films deposited on MgAl2O4, substrates by MOCVD. Ceram. Int. 2015, 41, 2572–2575. [Google Scholar] [CrossRef]
  24. Tidswell, I.M.; Ocko, B.M.; Pershan, P.S.; Wasserman, S.R.; Whitesides, G.M.; Axe, J.D. X-ray specular reflection studies of silicon coated by organic monolayers (alkylsiloxanes). Phys. Rev. B 1990, 41, 1111–1128. [Google Scholar] [CrossRef]
  25. Kiessig, H. Interferenz von Röntgenstrahlen an dünnen Schichten. Ann. Der Phys. 1931, 402, 769–788. [Google Scholar] [CrossRef]
  26. Chen, Z.; Nishihagi, K.; Wang, X.; Saito, K.; Tanaka, T.; Nishio, M.; Arita, M.; Guo, Q. Band alignment of Ga2O3/Si heterojunction interface measured by X-ray photoelectron spectroscopy. Appl. Phys. Lett. 2016, 109, 102106. [Google Scholar] [CrossRef]
  27. Zhang, F.; Saito, K.; Tanaka, T.; Nishio, M.; Arita, M.; Guo, Q. Wide bandgap engineering of (AlGa)2O3 films. Appl. Phys. Lett. 2014, 105, 162107. [Google Scholar] [CrossRef]
  28. Nichols, M.T.; Li, W.; Pei, D.; Antonelli, G.A.; Lin, Q.; Banna, S.; Nishi, Y.; Shohet, J.L. Measurement of bandgap energies in low-k organosilicates. J. Appl. Phys. 2014, 115, 094105. [Google Scholar] [CrossRef]
  29. Mohamed, M.; Janowitz, C.; Unger, I.; Manzke, R.; Galazka, Z.; Uecker, R.; Fornari, R.; Weber, J.; Varley, J.; Van de Walle, C. The electronic structure of β-Ga2O3. Appl. Phys. Lett. 2010, 97, 211903. [Google Scholar] [CrossRef]
  30. Kavan, L. Conduction band engineering in semiconducting oxides (TiO2, SnO2): Applications in perovskite photovoltaics and beyond. Catal. Today 2019, 328, 50–56. [Google Scholar] [CrossRef]
  31. Ravi, V.K.; Markad, G.B.; Nag, A. Band Edge Energies and Excitonic Transition Probabilities of Colloidal CsPbX3 (X = Cl, Br, I) Perovskite Nanocrystals. ACS Energy Lett. 2016, 1, 665–671. [Google Scholar] [CrossRef]
  32. Vequizo, J.J.M.; Ichimura, M. Fabrication of Electrodeposited SnS/SnO2 Heterojunction Solar Cells. Jpn. J. Appl. Phys. 2012, 51, 10NC38. [Google Scholar] [CrossRef]
  33. Mohamed, H.F.; Xia, C.; Sai, Q.; Cui, H.; Pan, M.; Qi, H. Growth and fundamentals of bulk β-Ga2O3 single crystals. J. Semicond. 2019, 40, 011801. [Google Scholar] [CrossRef]
  34. Hughes, R. High field electronic properties of SiO2. Solid-State Electron. 1978, 21, 251–258. [Google Scholar] [CrossRef]
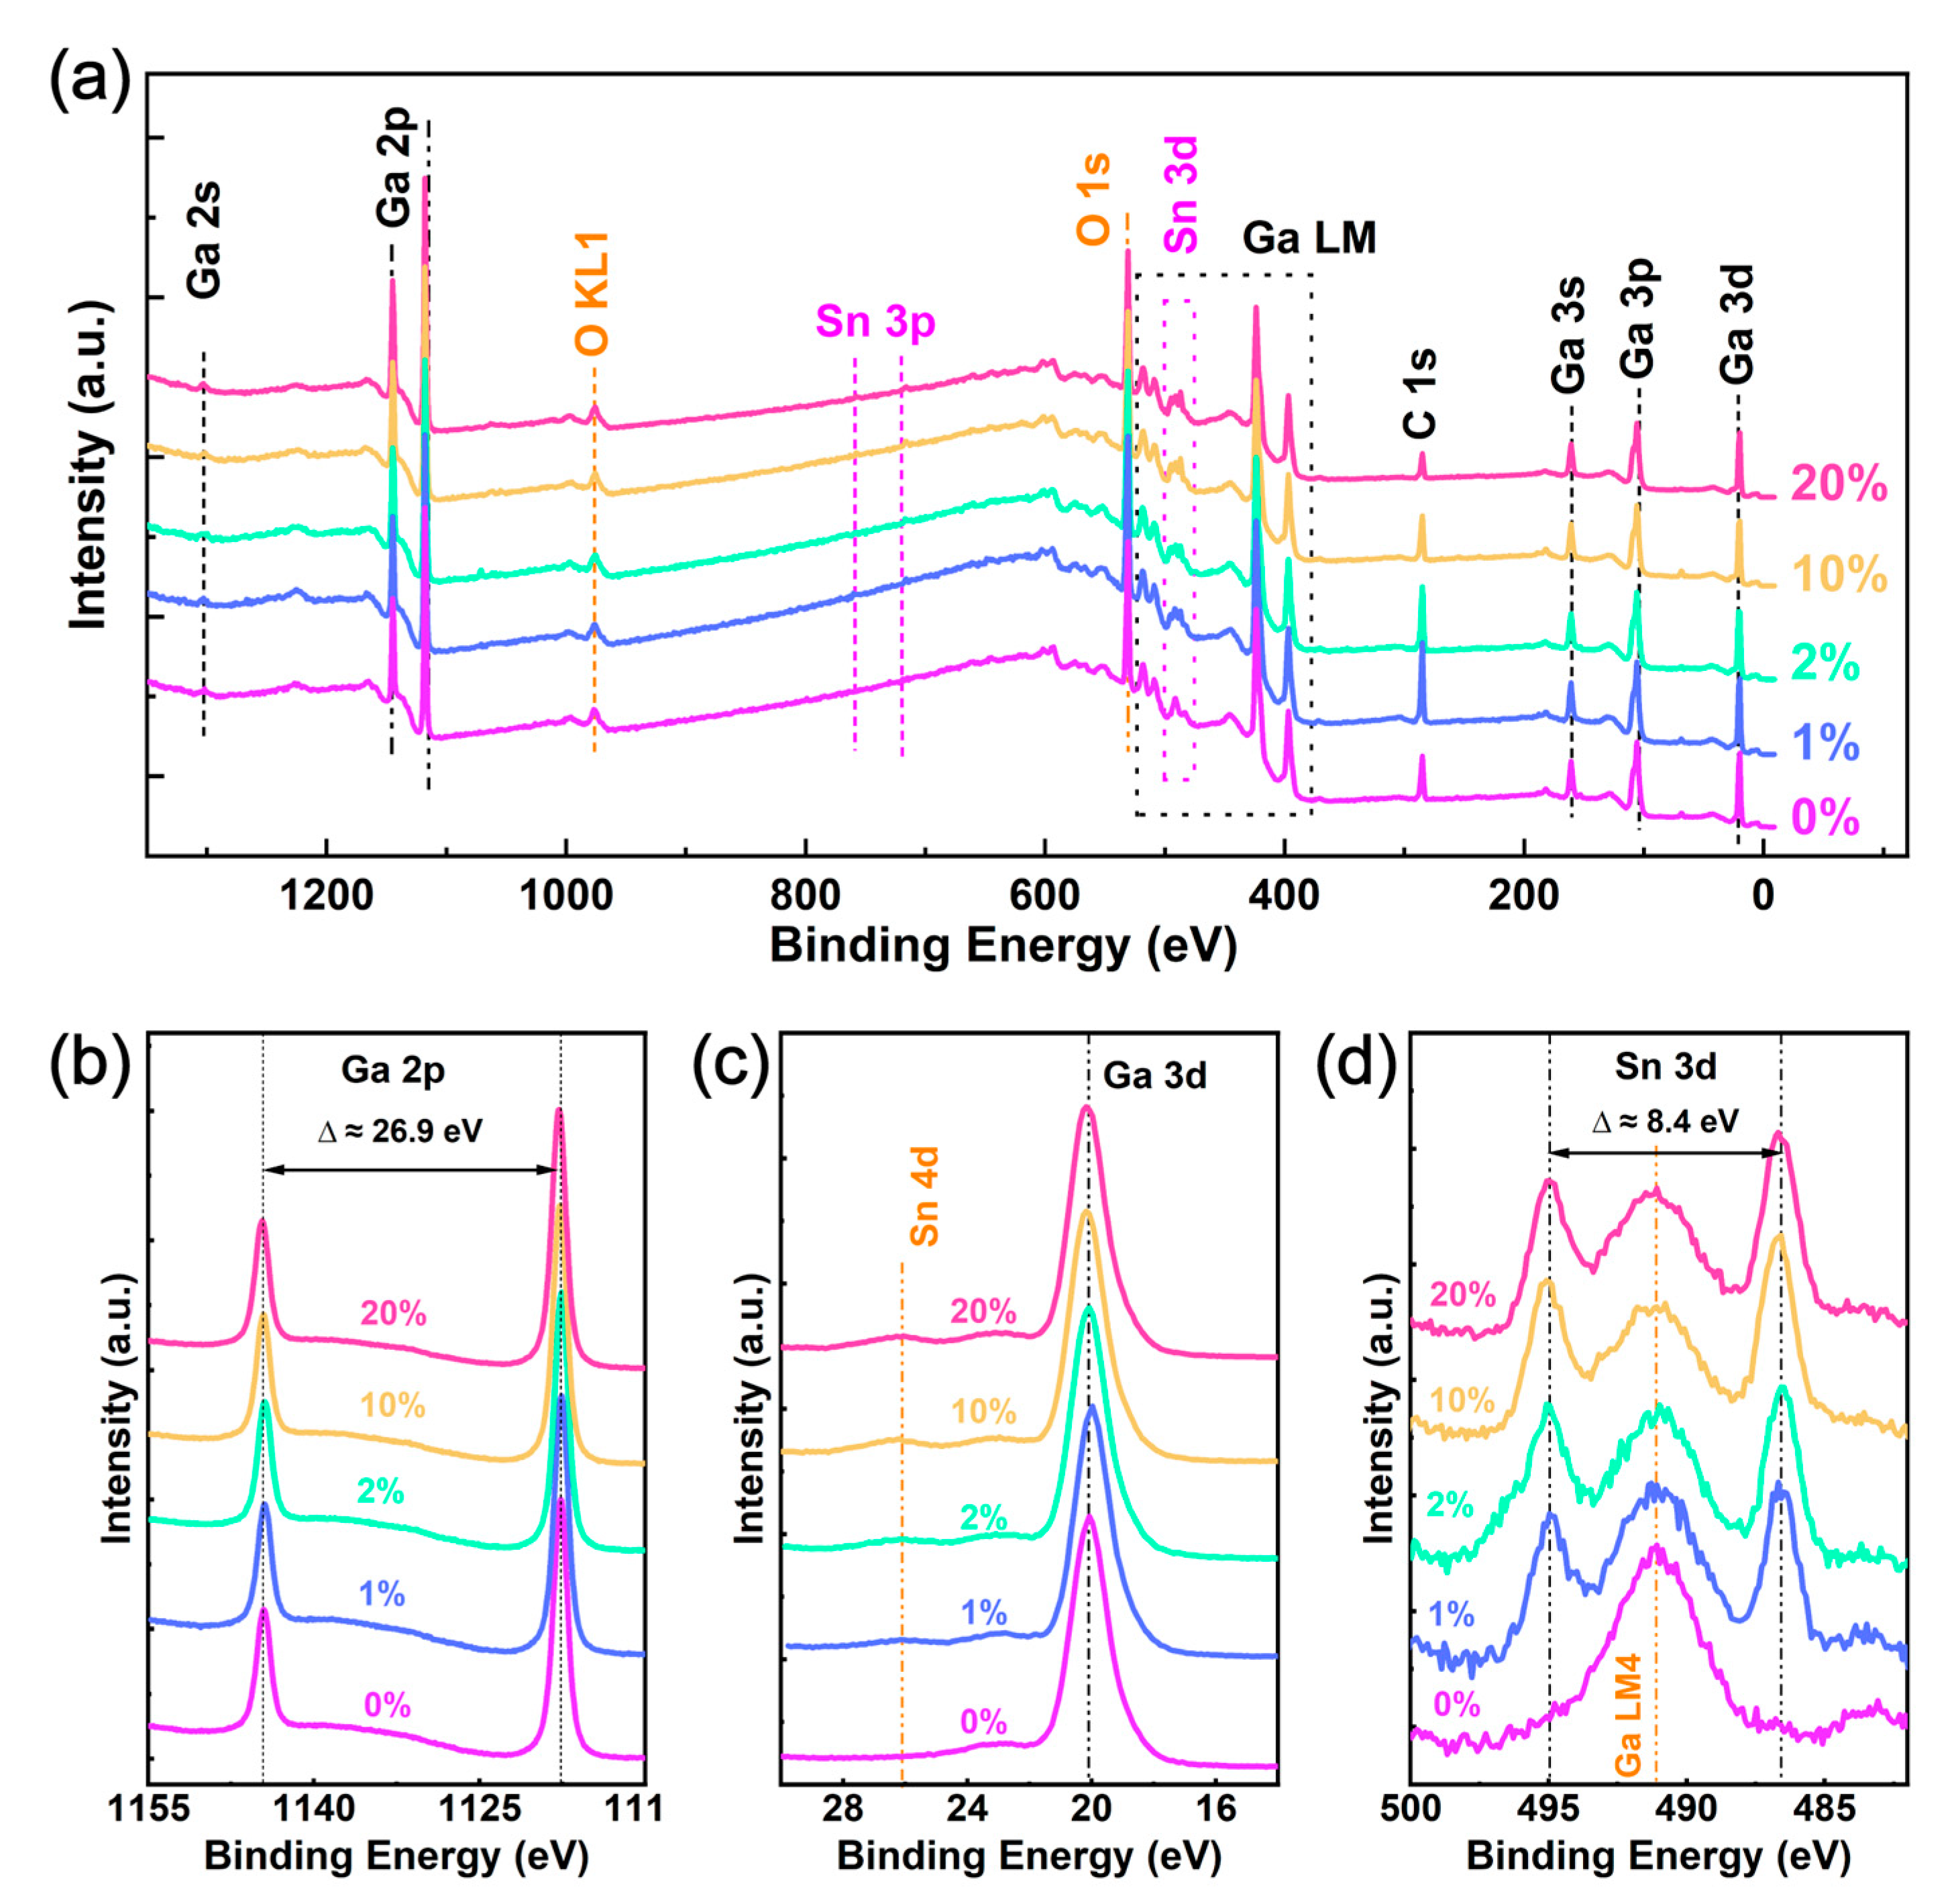
Figure 1. Graphs depicting the results of the XPS analysis of the annealed Ga2O3 thin films with 0%, 1%, 2%, 10%, and 20% Sn composition: (a) survey peaks, (b) Ga 2p spectra, (c) Ga 3d spectra, and (d) Sn 3d spectra.
Crystals 13 00301 g001
Figure 2. (a) Measured XRR (hollow circles) of the Ga2O3 film with different Sn concentrations compared to the simulated data (black curves). Thickness (b), RMS roughness (c), and density (d) of the films as a function of the Sn concentration.
Crystals 13 00301 g002
Figure 3. AFM images of the 2D morphology of annealed Ga2O3 thin films with (a1) 0%, (b1) 1%, (c1) 2%, (d1) 10%, and (e1) 20% Sn content. The corresponding height distribution images are shown in the inset of (a1f1). (a2e2) The AFM representations of the 3D morphology by narrow scans with different Sn content. (f1,f2) The corresponding average RMS roughness of the films.
Crystals 13 00301 g003
Figure 4. (ae) The estimation of Eg values for annealed Ga2O3 thin films doped with different Sn concentrations using the O 1s peak analysis. (f) The corresponding Eg values versus Sn contents of the films.
Crystals 13 00301 g004
Figure 5. (ae) XPS valence-band spectra and VBM of the annealed Ga2O3 thin films with varying Sn content. (f) VBM and CBM energy alignments for the Ga2O3 thin films as a function of Sn concentration.
Crystals 13 00301 g005
Figure 6. (a) I-V curves of the annealed Ga2O3 thin films with different Sn compositions. (b) Breakdown field as a function of Sn composition.
Crystals 13 00301 g006
Disclaimer/Publisher’s Note: The statements, opinions and data contained in all publications are solely those of the individual author(s) and contributor(s) and not of MDPI and/or the editor(s). MDPI and/or the editor(s) disclaim responsibility for any injury to people or property resulting from any ideas, methods, instructions or products referred to in the content.