Article

Profiling of Chlorogenic Acids from Bidens pilosa and Differentiation of Closely Related Positional Isomers with the Aid of UHPLC-QTOF-MS/MS-Based In-Source Collision-Induced Dissociation

by
Anza-Tshilidzi Ramabulana
1,
Paul Steenkamp
1,
Ntakadzeni Madala
1,2,* and
Ian A. Dubery
1,*
1
Research Centre for Plant Metabolomics, Department of Biochemistry, University of Johannesburg, Auckland Park 2006, South Africa
2
Department of Biochemistry, University of Venda, Thohoyandou 0950, South Africa
*
Authors to whom correspondence should be addressed.
Metabolites 2020, 10(5), 178; https://doi.org/10.3390/metabo10050178
Submission received: 11 March 2020 / Revised: 20 April 2020 / Accepted: 21 April 2020 / Published: 29 April 2020
(This article belongs to the Special Issue Metabolomics Tools to Accelerate Natural Product Discovery)

Abstract

:
Bidens pilosa is an edible herb from the Asteraceae family which is traditionally consumed as a leafy vegetable. B. pilosa has many bioactivities owing to its diverse phytochemicals, which include aliphatics, terpenoids, tannins, alkaloids, hydroxycinnamic acid (HCA) derivatives and other phenylpropanoids. The later include compounds such as chlorogenic acids (CGAs), which are produced as either regio- or geometrical isomers. To profile the CGA composition of B. pilosa, methanol extracts from tissues, callus and cell suspensions were utilized for liquid chromatography coupled to mass spectrometric detection (UHPLC-QTOF-MS/MS). An optimized in-source collision-induced dissociation (ISCID) method capable of discriminating between closely related HCA derivatives of quinic acids, based on MS-based fragmentation patterns, was applied. Careful control of collision energies resulted in fragment patterns similar to MS2 and MS3 fragmentation, obtainable by a typical ion trap MSn approach. For the first time, an ISCID approach was shown to efficiently discriminate between positional isomers of chlorogenic acids containing two different cinnamoyl moieties, such as a mixed di-ester of feruloyl-caffeoylquinic acid (m/z 529) and coumaroyl-caffeoylquinic acid (m/z 499). The results indicate that tissues and cell cultures of B. pilosa contained a combined total of 30 mono-, di-, and tri-substituted chlorogenic acids with positional isomers dominating the composition thereof. In addition, the tartaric acid esters, caftaric- and chicoric acids were also identified. Profiling revealed that these HCA derivatives were differentially distributed across tissues types and cell culture lines derived from leaf and stem explants.

Graphical Abstract

1. Introduction

Bidens pilosa L. (B. pilosa) is a flowering edible herb from the family Asteraceae, commonly known as “Blackjack” and as “Beggar’s tick” or “Needle grass” and has been reported to be a nutritious food and medicine source [1,2,3]. This plant is thought to have originated from South America but has spread to most tropical hot areas including African countries [4]. B. pilosa has been shown to treat over 41 diseases and conditions [2], such as malaria [5], diabetes [6], hypertension [4], obesity [7] and syphilis [8]. B. pilosa has various bioactivities owing to its diverse phytochemical constituents, of which an estimated >300 have been identified [2,3]. These include a variety of aliphatics, terpenoids, phenylpropanoids, tannins, alkaloids, cardiac glycosides, and porphyrins [9,10].
Plant secondary metabolites are important in the production of flavors, fragrances, pharmaceuticals, food additives, and many other applications [11,12]. Therefore, ways to produce important secondary metabolites effectively at a large scale are needed. However, plants as a source of these metabolites may have slow growth or produce metabolites at low concentrations [13,14]. Extracts from whole plants may also pose environmental threats such as reduction of local plant populations and loss of plant genetic diversity [11,12]. A variety of environmental factors (soil fertility, salinity, temperature, light, and soil water) can result in fluctuations in plant secondary metabolites which can lead to significant changes in the plant’s phytochemical composition [15]. Plant cell culture has become an attractive approach as it permits synthesis of secondary metabolites produced in parent plants independent of geographical and seasonal factors [13,16]. Callus culture is initiated on semi-solid media from explant material and this is then used to subsequently initiate cell suspensions with high rates of cell multiplication [17]. Cell suspension cultures permit superior homogeneity of treatments compared to plant tissues and shorter condensed biosynthetic cycles and also permits scaling up of secondary metabolite production in appropriate bioreactors [18,19]. Moreover, a range of chemicals produced by parent plants can also be reproduced in cell cultures as a result of plant cells being totipotent and their retention of the plant’s genetic information [11,17].
Chlorogenic acids (CGAs) are a group of esters between hydroxycinnamic acids (HCAs), such as caffeic acid (CFA), ferulic acid (FA), p-coumaric acid (p-CoA), and sinapic acid (SA) to quinic acid (QA or 1L-1(OH),3,4/5-tetrahydroxycyclohexane carboxylic acid) [20,21,22]. CGAs are complex molecules exhibiting different physiochemical properties due to positional esterification on the quinic acid moiety, leading to regio-isomers. Major groups of CGAs are the mono- and di-caffeoylquinic acids (CQAs) [23]. Furthermore, the basic CGAs can be divided into several groups, based on the number and position of the acyl groups attached to the QA, as mono-, di-, tri-, and tetra-esters [20]. The complexity of these acids is vast as mixed di-esters such as caffeoylsinapoylquinic acid [22] and caffeoylferuloylquinic acid are found [24]. In addition, a fraction of the naturally occurring trans-isomers can occur as cis-isomers [25]. Naturally, plants produce these derivatives in response to abiotic stress to aid in the protection of the plant [26,27]. They can also be produced in response to biotic stress, as CGAs have been shown as effective defense phytochemicals against several insect herbivores [28].
Identification and quantification of structurally related compounds is challenging and may require the use of reliable advanced analytical techniques. In previous studies, geometrical isomers of CGAs have been differentiated using elution order, but this has been shown to be unreliable [23], mainly due to differences in column chemistries [29]. Discrimination between geometrical isomers has been achieved by liquid chromatography-mass spectrometry (LC-MS) through the use of in-source collision induced dissociation (ISCID), where cis-isomers of di-CQAs were shown to preferentially bind to alkali metals (sodium, lithium, and potassium adduct-MS), differentiating them from trans-isomers [30].
Development of LC-ion trap (IT)-MS-based hierarchical keys for the differentiation of acyl-quinic acids using mild fragmentation conditions has allowed for the confident assaying of most CGA regio-isomers using their MSn fragmentation patterns [31,32]. Other advanced technologies such as ion mobility mass spectrometry-MS (IM-MS) allow for the differentiation of positional isomers of CGAs and drift tube ion mobility spectrometry-mass spectrometry (DTIMS-MS) for the elucidation of cis/trans-isomers of di-CQAs [23].
Quadrupole time-of-flight mass spectrometry (QTOF-MS) has also been applied for the differentiation of regio-isomers of CGAs [33]. However, more innovations are required for the full characterisation of these metabolites and their isomeric forms. Recently, a QTOF-MS-based ISCID approach has been used successfully to distinguish between CGA regio-isomers of both mono- and di-acylated quinic acids [34,35]. ISCID is proposed as an alternative to multistage MS, whereby precursor ions are initially isolated in the mass analyzer where fragmentation of multiple precursors are acquired simultaneously, similarly to MSE [36,37]. Fragmentation occurs under an intermediate pressure (between high pressure and high vacuum) and applied voltages accelerate ions, promoting collision with the surrounding gas. This permits multiple activation–fragmentation episodes before ions reach the mass analyzer, allowing for efficient structural elucidation [36,37]. ISCID proves to be superior to MSE, as in this method in-source dissociation is performed prior to regular MS/MS. This then emulates pseudo-MS3, acquiring fragmentation patterns typical for IT mass spectrometers [38].
In the present study, an optimized ISCID method was used, in combination with metabolomic tools and approaches, to differentiate between CGAs regio-isomers (including di-esters) in tissues, callus and suspension-cultured cells of B. pilosa. The results of the current study also contribute to the profiling of CGAs in differentiated tissues vs. undifferentiated cells and contribute to possible identification of any underlying biochemical mechanisms with regard to CGA biosynthesis within tissues and cell cultures of B. pilosa.

2. Results

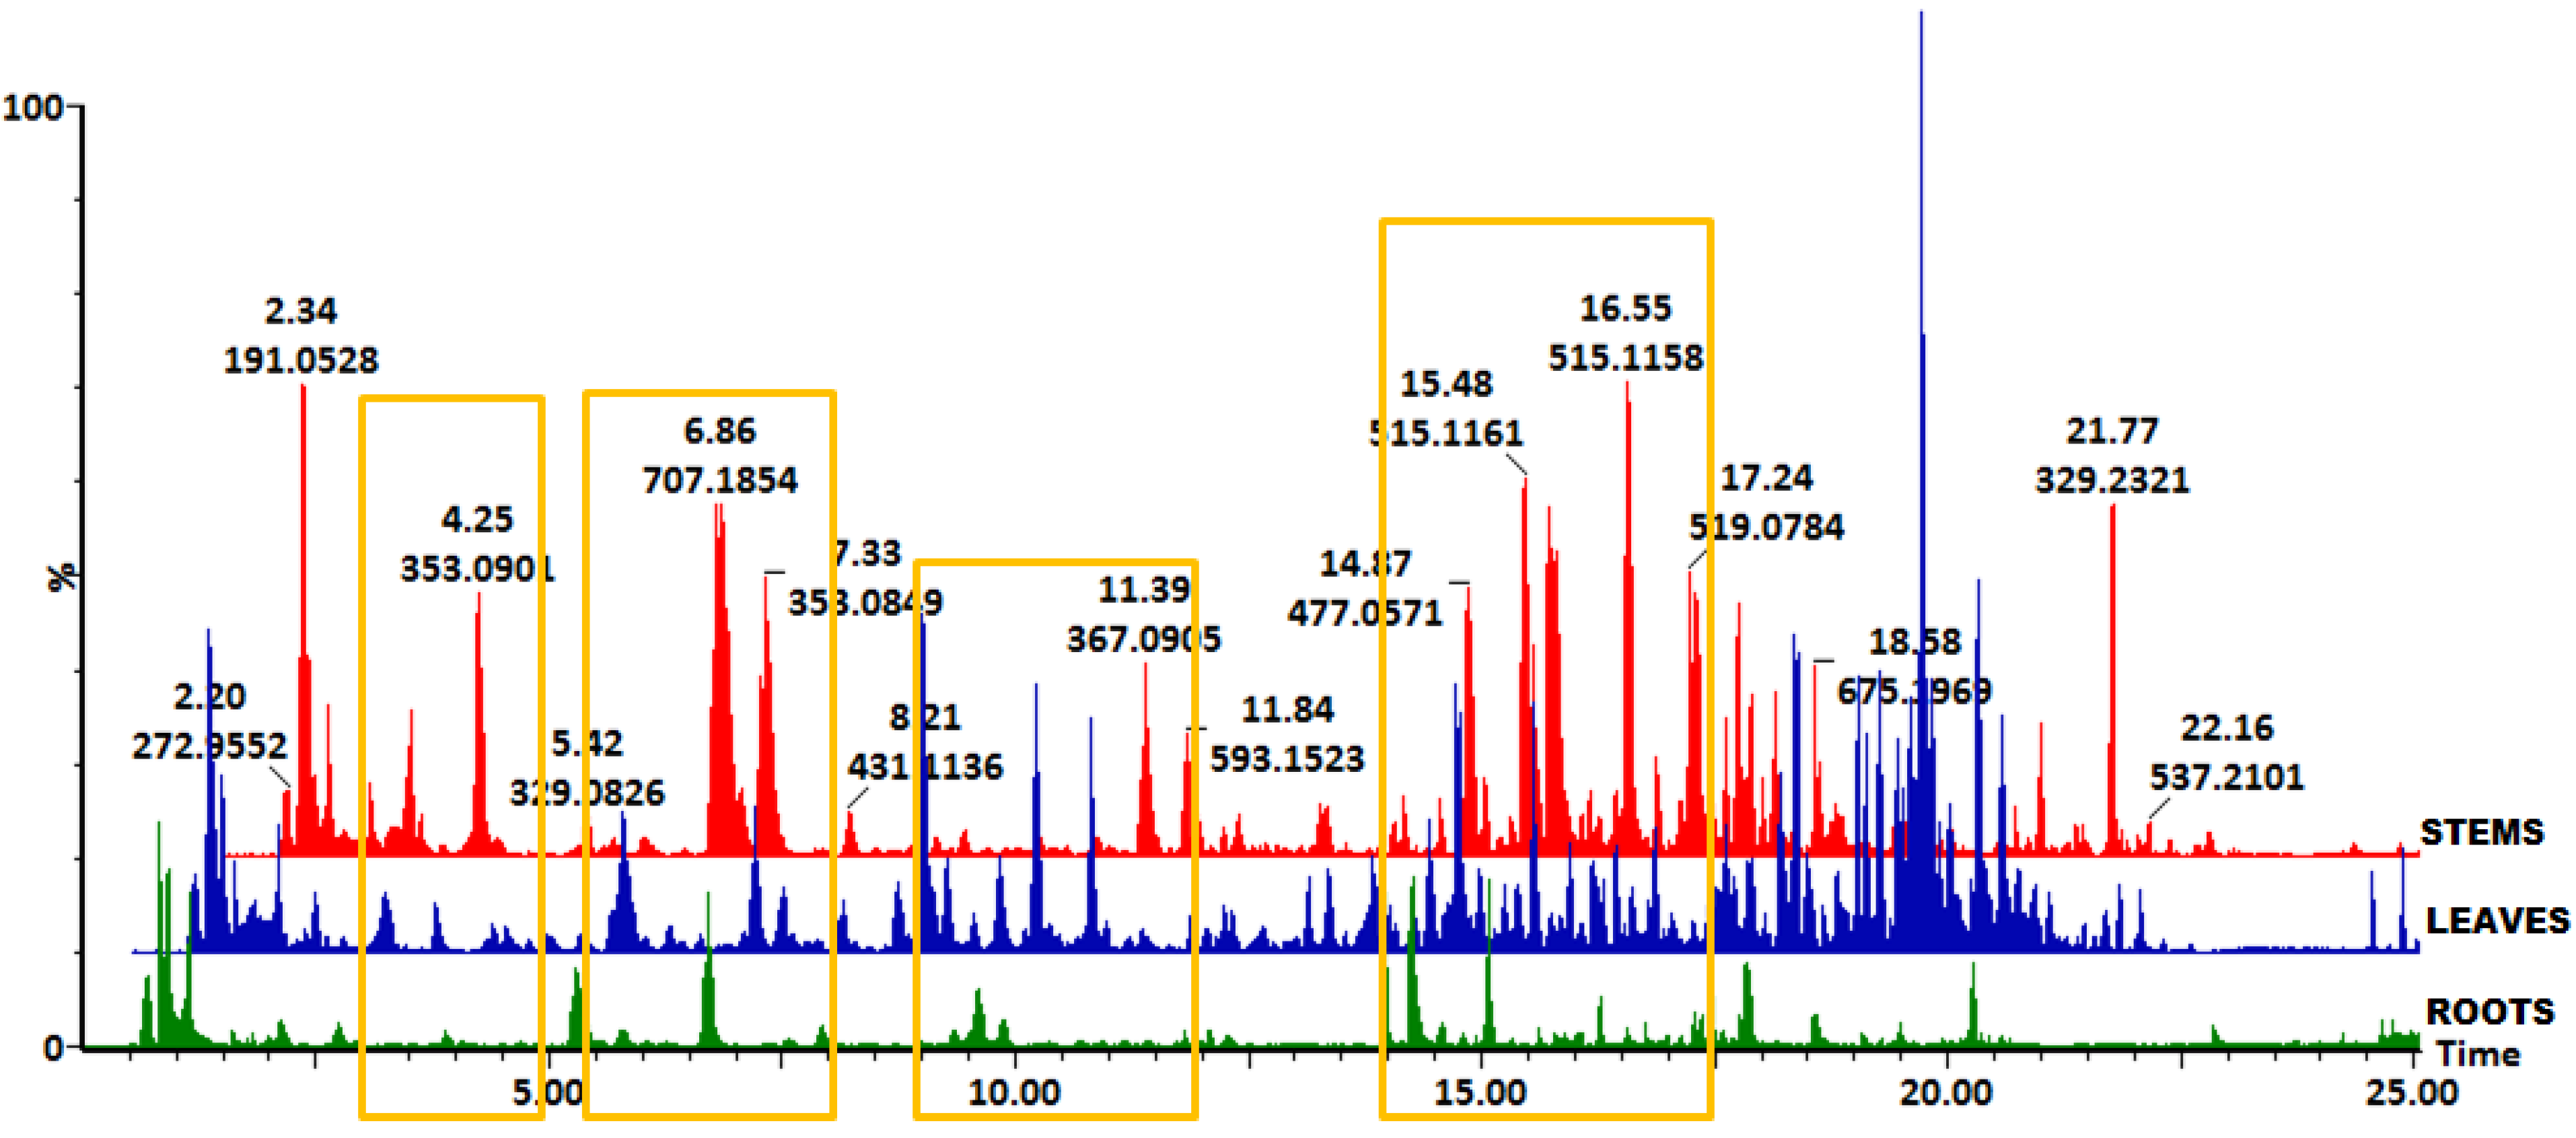
2.1. Profiling of Chlorogenic Acid Derivatives in Tissues and Cell Cultures of B. pilosa

In this study, the distribution profile of HCA derivatives in tissues (leaves, stems, and roots), callus and cell suspensions derived from stems and leaf tissues were studied with the aid of a high-throughput analytical method, UHPLC-QTOF-MS (Figure 1 and Figure S1A,B respectively). Structural elucidation and putative annotations were achieved through an ISCID method [34,35]. The HCA derivatives were shown to be a prominent group of metabolites in methanol extracts of B. pilosa tissues (Figure 1) and extracts from stem- and leaf-derived callus and cell suspensions (Figure S1A,B), shown in base peak intensity (BPI) chromatograms and indicated with yellow rectangles. Furthermore, the BPI chromatograms indicated differences in intensities of the HCA derivatives as shown in Figure 1. Within a specific plant species, the distribution of secondary metabolites is expected to vary not only as a function of developmental stage, but also among plant tissues, hence some tissue-specific metabolite variations are observed [39].

2.2. Multivariate Data Analysis to Reveal Tissue-Specific and Cell Line-Specific Differences Within Tissues and Cell Cultures of B. pilosa

To analyze the variability within and between the tissue extracts (Figure 2A), cell callus (Figure S2A) and cell suspensions (Figure S2B), principal component analysis (PCA) was performed for all metabolites within each sample group. PCA is an unsupervised, explorative chemometric tool for the reduction of dimensionality of complex datasets to provide insights into variations and systematic trends among sample groups [40,41]. The computed model (score plot) of the PCA for tissues indicate that 41.1% and 24.3% of the variation were explained by PC1 and PC2, respectively (Figure 2A). Statistical validation was described using R2 and Q2 which explains the goodness-of-fit of the model and model predictability, respectively. The model computed was acceptable for metabolomic analysis of the phytochemical data as the R2 > 0.7 and the Q2 > 0.4 [42]. For the computed model, R2 = 0.890 and Q2 = 0.874 respectively were found to be statistically adequate to make relevant biological interpretations. The PCA model revealed an obvious separation among the three tissue types, as shown in Figure 2A. This indicates that the metabolic constituents and their distribution in leaf, stem and root tissues of B. pilosa varied significantly. This observation is also reflected in the variation of intensities of separated metabolites observed in the BPI chromatograms shown in Figure 1. Similarly, PCA scores plots were computed and validated for stem- and leaf-derived callus and cell suspensions as indicated in Figure S2A and Figure S2B respectively.
To determine correlations/similarities among the different tissues, agglomerative hierarchical cluster (HC) analysis models were computed. Each observation is initially treated as an individual cluster; then after processing, groups are merged to indicate group similarities [43]. These were represented by means of a dendrogram shown in Figure 2B which indicates differences in metabolomic profiles respective to the different tissues of B. pilosa. The dendrogram indicates that the metabolomic profiles of stems and roots are closely related, contrasting with that of leaf tissues [44]. Dendrograms were also constructed to indicate similarities within different cell cultures of B. pilosa as shown in Figure S2C,D.

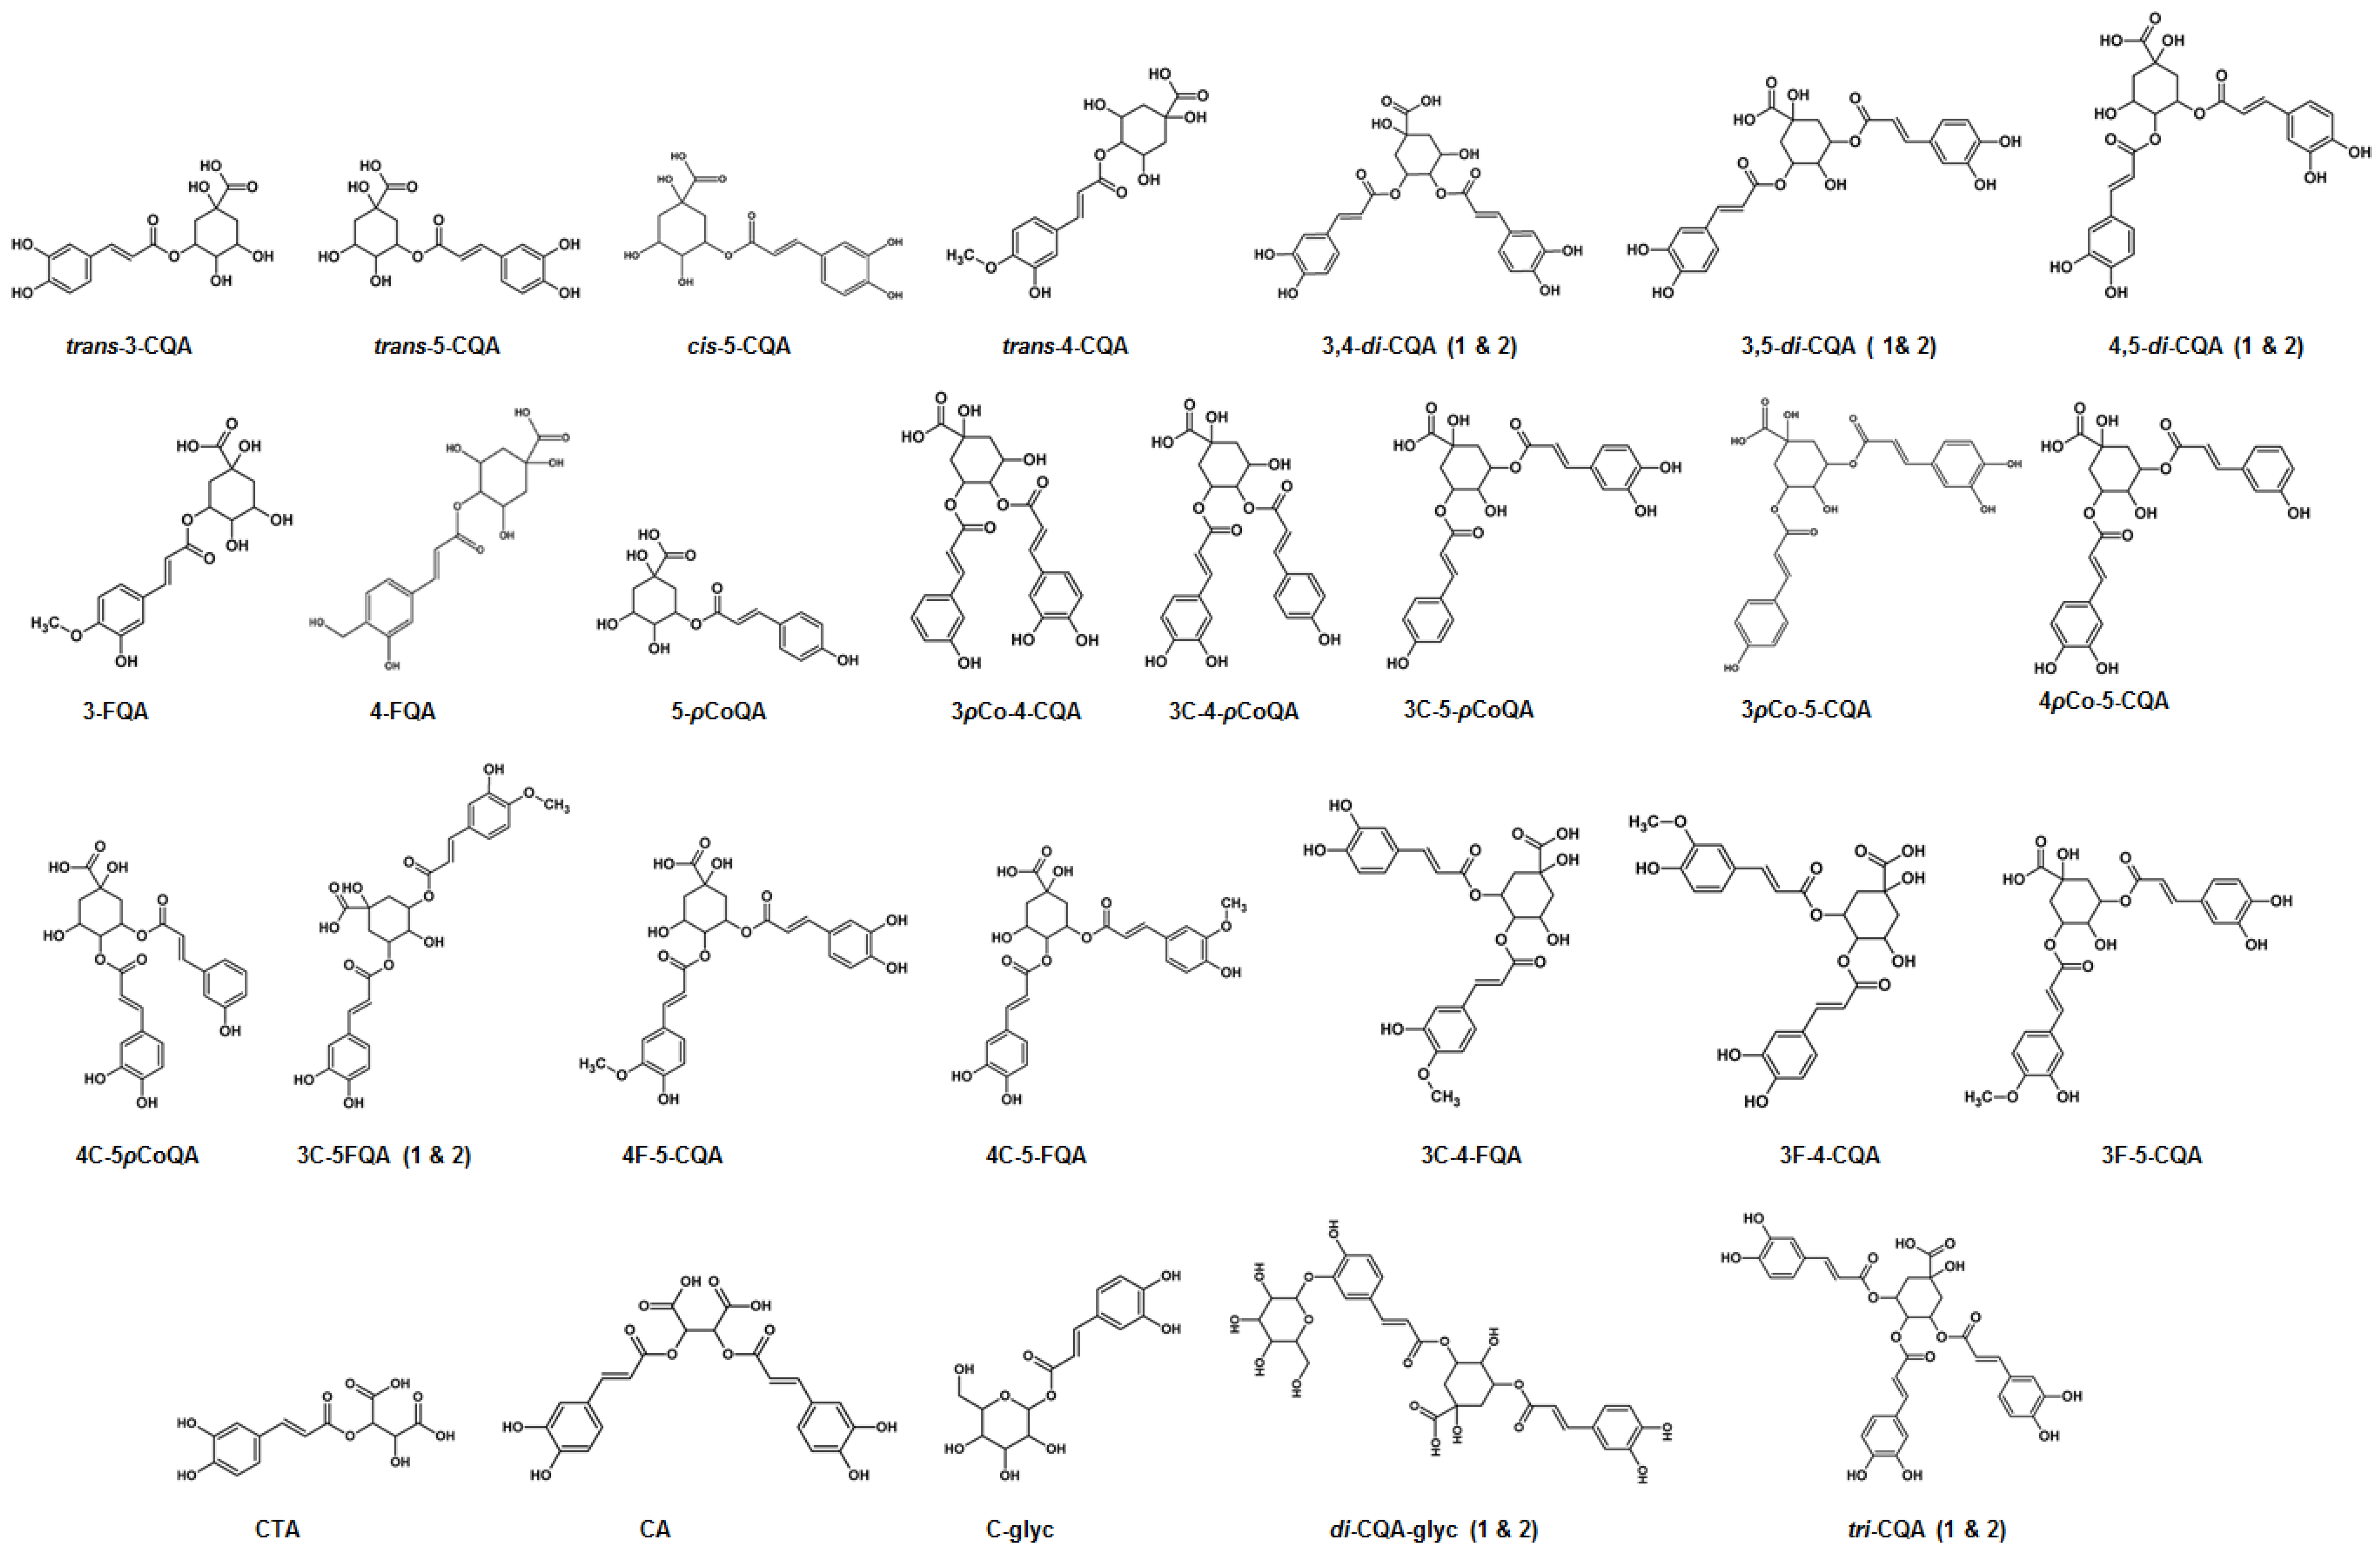
2.3. Metabolite Annotations

Mass spectral data were obtained in both ESI (+/-) modes, but negative ionization was preferred as the majority of metabolites were found to ionize better in the negative MS mode [31,32] and since the hierarchical scheme proposed by Clifford et al. [31] was also generated using negative ionization. In this study a combined total of 33 CGA derivatives (both regio- and geometric isomers) were identified in B. pilosa tissues, callus and cell suspensions as listed in Table 1 with corresponding MS data in Figure 3, Figure 4 and Figure 5 and structures presented in Figure 6. CGAs are classically described as a subclass of phenylpropanoids formed when HCAs are esterified to QA, while a wider scope of the definition describes the CGAs as conjugates of many other compounds such as malic acid, succinic acid, fumaric acid, tartaric acid and sugars [27,32,45]. QA has axial hydroxyl groups attached to carbon positions 1 and 3 and equatorial hydroxyl groups attached to carbons 4 and 5 where the HCAs attach to form CGAs [32]. HCAs are naturally synthesized with trans configurations but it has been shown that the cis configuration can occur as a result of UV radiation [46,47] and under stress conditions [25]. CGAs are chemically diverse and the various regio- and geometrical isomers can make discrimination challenging. UHPLC coupled to CID during tandem MS/MS procedures (such as UHPLC-Q-TOF-MS) can partially solve this problem and identify CGAs through the use of fragmentation patterns as outlined in the discussion [34,45,48]. Metabolites were putatively identified to level 2 of the Metabolomics Standards Initiative (MSI) [49].

3. Discussion

The number system used below refers to the sequence of presentation in Table 1 where metabolites are listed according to increasing m/z values.

3.1. Characterization of Mono-Acyl Chlorogenic Acids (CGAs)

The hierarchical scheme keys for LC-MSn identification of CGAs [31] was used to assist in the identification of metabolite (2) with a molecular ion [M-H]- at m/z 337, identified as 5-coumaroylquinic acid as it produced a fragment ion at m/z 191 [QA-H]- showing loss of a coumaroyl moiety (Figure S3). Metabolites (4-7) with a precursor ion [M-H]- at m/z 353, were annotated as caffeoylquinic acids (CQAs). Previous work [34,35,47] was also used as references in putatively identifying these metabolites listed in Table 1. Mass spectrometric data and chromatographic elution order were also considered while determining the regio- and geometric isomers of the annotated metabolites. Notably, cis-isomers of 4- and 3-CQAs elute before their trans-isomers, while the cis-isomer of 5-CQA elute after its trans-isomer and after the 4-CQA [46]. 4-CQAs (Figure S4B) can be identified by the presence of an intense m/z 173 [QA-H-H2O]- base peak, while 3-CQAs (Figure S4A) are known to produce a base peak ion at m/z 191 [QA-H]- and a secondary ion at m/z 179 [CA-H-H2O]- at about 50% intensity of the m/z 191 base peak [31]. Fragmentation of 5-CQAs (Figure 4C) result in the formation of a single base peak product ion at m/z 191. Hence, based on the elution order and fragmentation patterns, (4-7) were identified as trans-3-CQA (4), trans-5-CQA (5), trans-4-CQA (6), and cis-5-CQA (7) respectively. In tissues, all the trans-CQAs were present with the exception of trans-3-CQA which was absent in roots. In callus cultures only trans-5-CQA was found to be absent. The mono-CQAs were observed in cell suspensions derived from both stems and leaves of B. pilosa; however, the cis-5-CQA was only present in cell suspensions derived from leaf tissue.
A similar approach was followed in the identification two feruloylquinic acid (FQA) isomers (8 and 9) which were identified by their precursor ion [M-H]- at m/z 367 and based on their fragmentation patterns and Rt shown in Table 1. Although differing in intensities, the two FQA regio-isomers were identified in all tissues and cell culture systems. As described in the hierarchical scheme keys for LC-MSn identification of CGAs [31], base peaks at m/z 193 [FA-H]- and m/z 173 [QA-H-H2O]- were used as diagnostic peaks for 3-FQA (Figure S5A) and 4-FQA (Figure S5B) respectively. FQA also produces m/z 134 [FA-H-CO2-CH3]-. Hence molecules (6) and (7) were annotated as 3-FQA acid (6) and 4-FQA (7) respectively.

3.2. Characterization of Caffeoylglycoside

HCAs in nature may occur as soluble forms conjugated to organic acids and/sugars [50]. In this study, one caffeoylglycoside (3) was identified which had a precursor ion, [M-H]-, at m/z 341 as shown in Table 1. The molecular ion fragmented to give ions at m/z 179 [CFA-H]- due to loss of a glycosyl residue and an ion at m/z 135[CFA-CO2]- shown in Figure S6 [35]. The caffeoylglycoside was found to be present in all the tissues of B. pilosa.

3.3. Characterization of Hydroxycinnamoyl-Tartaric Acid Esters

Hydroxycinnamoyl-tartaric acid esters such as the di-ester of two caffeic acids to tartaric acid (chicoric acid, CA) and the mono-ester of caffeic acid to tartaric acid (caftaric acid, CTA), are biologically active compounds which are shown to have various health benefits and antioxidant properties [51,52]. These HCA derivatives are the main caffeic acid derivatives in Echinacea purpurea but have been also identified in leaves of B. pilosa and in more than 60 plant genera [53,54]. Caftaric acid (Figure S7A) (1) was identified by its parent ion, [M-H]-, at m/z 311 which fragmented to produce ions at m/z 179 [CFA-H]- due to the loss of a tartaric acid (TA) residue, m/z 149 [TA-H]- and m/z 135 [FA-CO2]- which resulted from decarboxylation of the caffeic acid residue. Therefore, (1) was identified as a hydroxycinnamoyl-tartaric acid ester, CTA (Table 1). Metabolite (10) was identified as CA (Figure S7B) by its molecular ion [M-H]-, at m/z 473 which fragmented to give product ions at m/z 311 [CTA-H]- due to the loss of a second caffeic acid residue. Other daughter ions at m/z 149 [TA-H]- and m/z 135 [CFA-CO2]- were also observed [29]. Profiling of the tartaric esters revealed that they are only present in the aerial parts of the plants and absent in the roots. This could suggest exclusivity in the biosynthesis of tartaric acid esters, suggesting localized biosynthesis of these esters in the aerial parts of the plant. These esters were also absent in cell cultures of B. pilosa.

3.4. Characterization of Di-Caffeoylquinic Acids (Di-CQAs)

In this study, six di-CQAs shown in Table 1 which produced a molecular ion, [M-H]-, at m/z 515 were identified (17–22). As shown in the hierarchical scheme for LC-MSn identification of CGAs, 3,5-di-CQA (19 and 20), Figure S8B, can be differentiated from the other present regio-isomers as no base peak of m/z 173 [QA-H2O-H]- was observed which represents the absence of a 4-acyl substitution. To differentiate between 3,4-di-CQA (17 and 18), Figure S8A and 4,5-di-CQA (21 and 22), Figure S8C, an intense ion at m/z of 335 [CQA-H2O-H]- is noteworthy as it represents 3,4-di-CQA in an MS2 acquisition. Although it may be present in the fragmentation pattern of 4,5-di-CQA, the intensity is comparatively lower. Differences observed in the intensities of fragment ions can be ascribed to variances in energy distribution which cause the structurally similar isomers to behave differently under the described MS conditions. On a reverse-phase column the elution order of di-CQA regio-isomers is expected to be as follows: 3,4-di-CQA, 3,5-di-CQA, followed by 4,5-di-CQA eluting the latest, validating the annotation of di-CQAs shown in Table 1 [21,29]. These di-CQA were differentially present throughout tissues and cell cultures of B. pilosa.

3.5. Characterization of Tri-Caffeoylquinic Acids (Tri-CQAs) and Di-Caffeoylquinic Acid Glycosides

Four isobaric peaks with parent ions, [M-H]- at m/z 677 were observed. Metabolites (30) and (31) were annotated as di-caffeoylquinic acid glycosides (Figure S9B) as these metabolites fragmented to produce ions at m/z 515 [diCQA-H]- resulting from the loss of a glucosyl residue, m/z 353 [CQA-H]- resulting from loss of a caffeic acid and glucosyl residue, m/z 341 [CQA glycoside-H]- which indicated subsequent loss of the quinic acid residue. Other secondary ions observed were at m/z 179 [Caffeic acid-H]-, and at m/z 173 [Quinic acid-H2O-H]- as shown in Table 1 [55].
Metabolites (32) and (33) were annotated as tri-CQAs (Figure S9A) as these produced fragment ions at m/z 515 [diCQA-H]-, m/z 353 [CQA-H]-, m/z 335 [caffeoylquinic acid-H2O-H]-, m/z 191 [QA-H]-, m/z 179 [CFA-H]-, and at m/z 173 [QA-H-H2O]-. The Rt was also considered as tri-CQAs are expected to elute later than 4,5-di-CQA as these are more hydrophobic [56]. However, positions of acylation on tri-caffeoylquinic acids/tri-acylated glycosides were not fully characterized as description of tri- and tetra-acylation would require MS4 and/or MS5 spectra [32]. These tri-acylated HCA derivatives were observed to be only present in the leaves of B. pilosa.

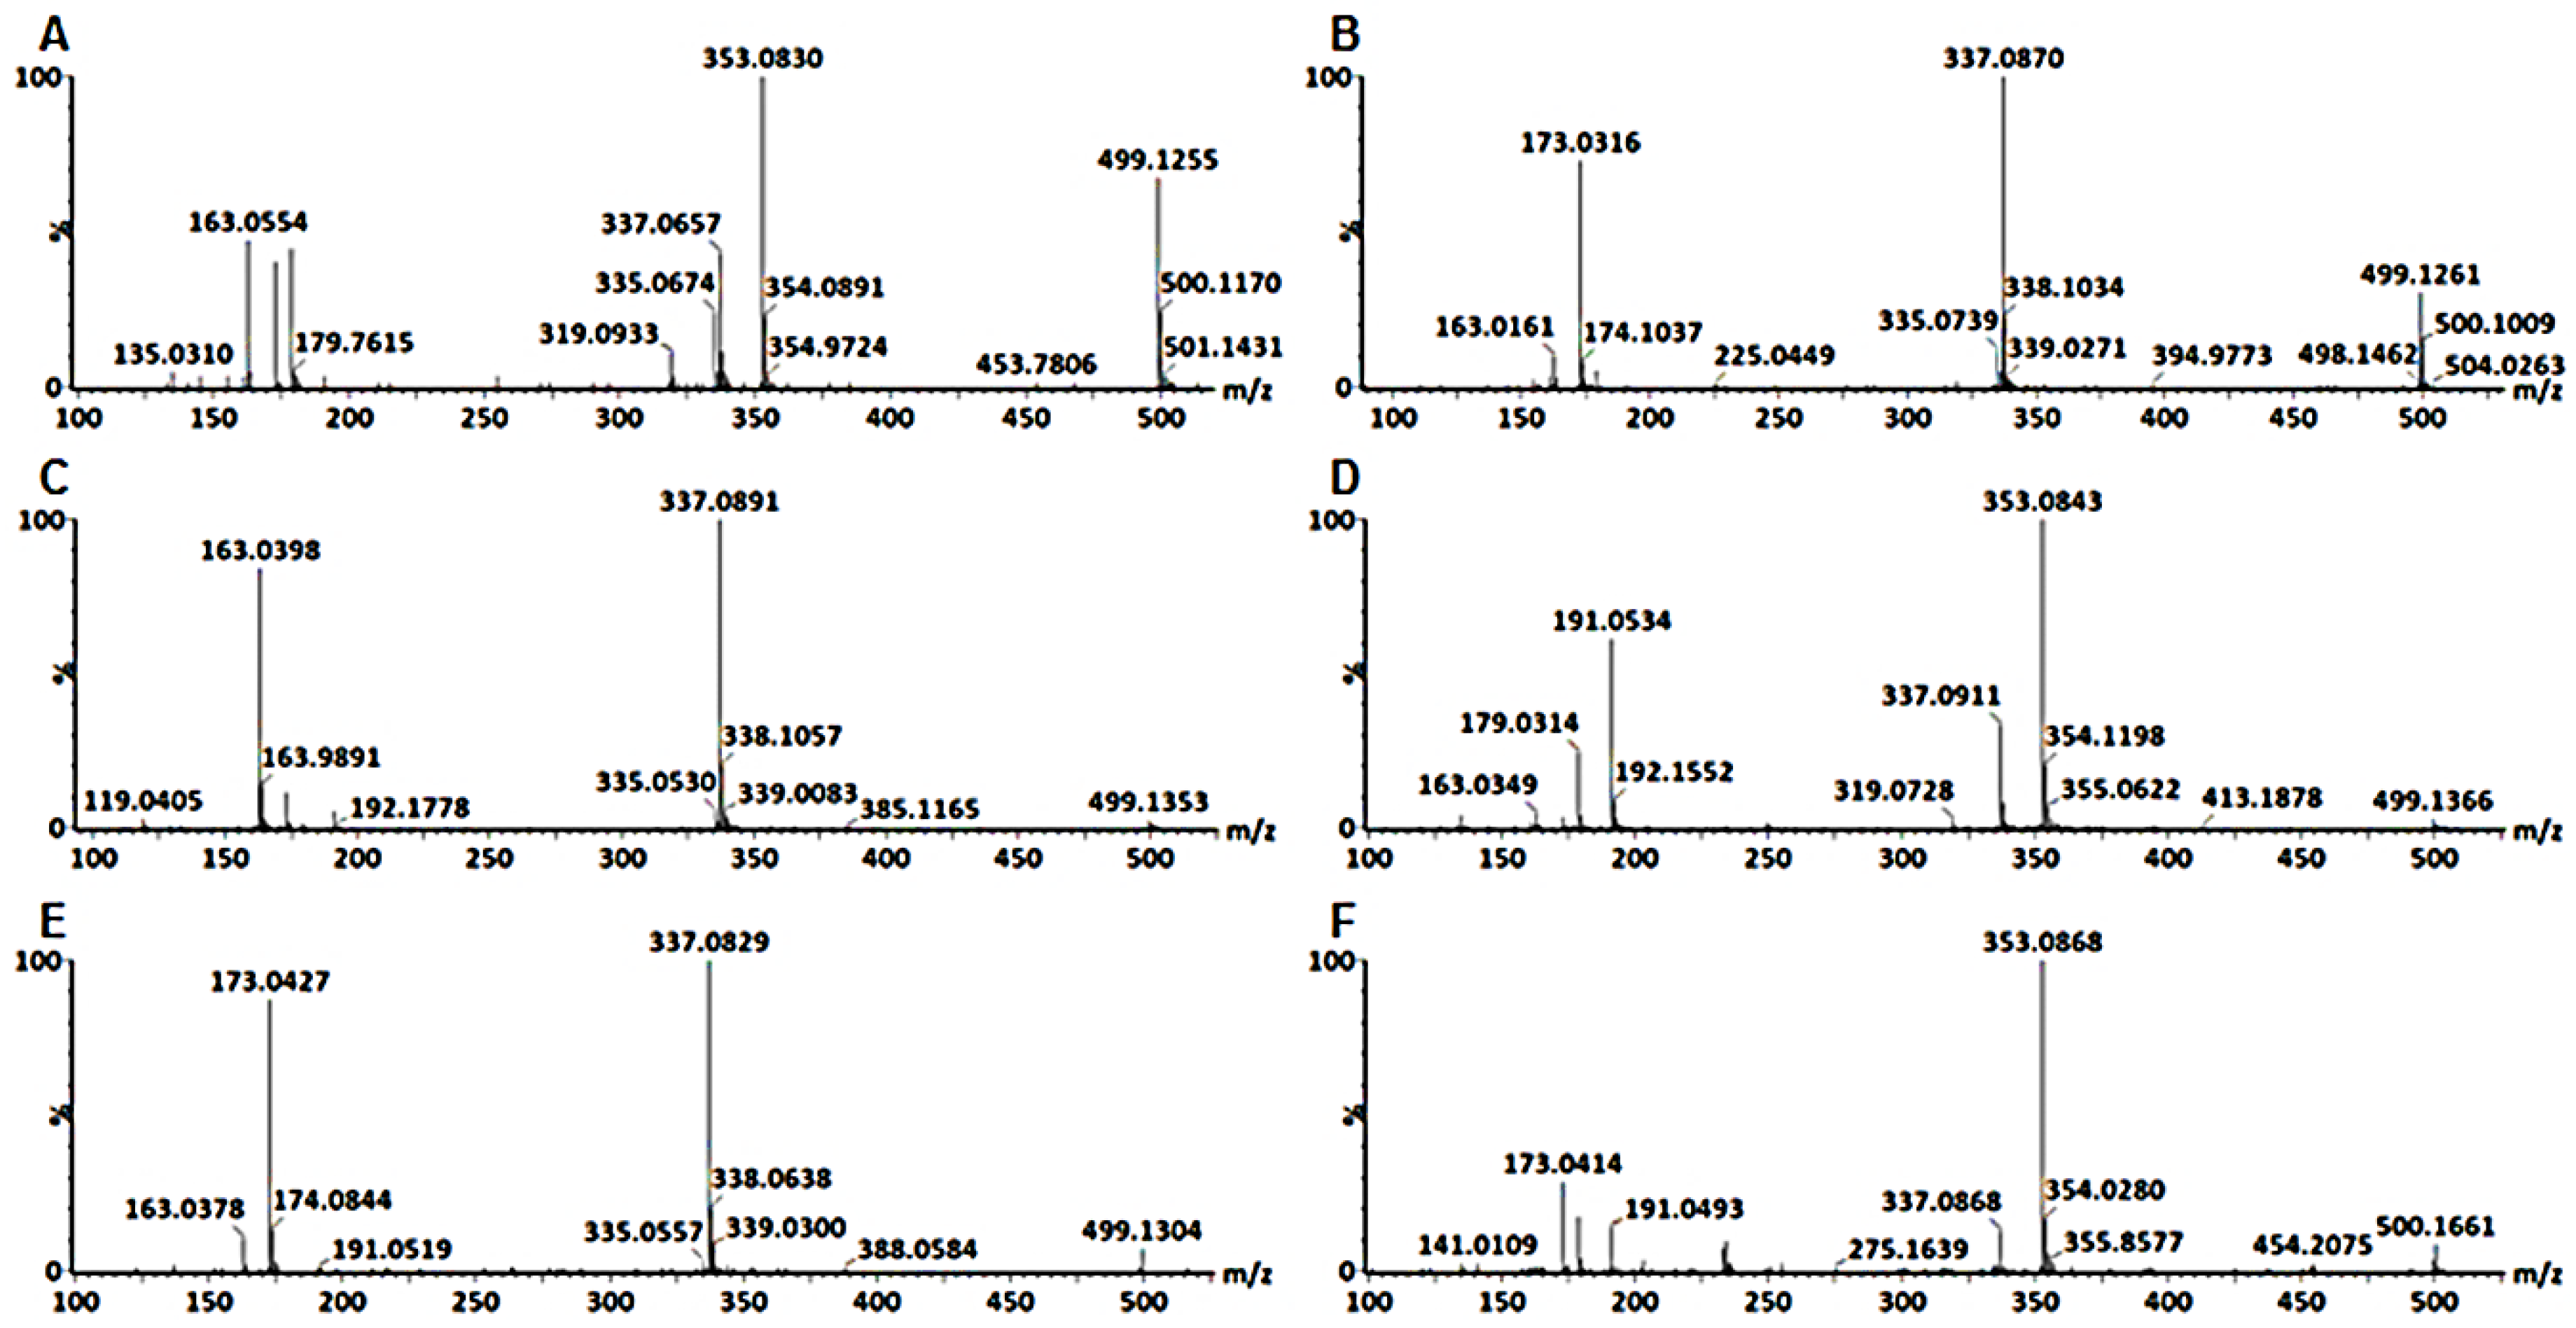
3.6. Characterization of p-Coumaroyl-Caffeoylquinic Acids (pCo-CQAs)

As mentioned earlier, CGAs are a complex group of compounds that may also comprise of mixed di-esters. Characterization of p-coumaric acid-containing di-acyl-CGAs has been previously done for green coffee beans [53]. To the authors’ knowledge, these have never been identified in B. pilosa. pCo-CQAs were identified by a parent ion [M-H]- at m/z 499 [22,57]. The elution order of these metabolites was considered to assist in their annotation. Six of these isomers were observed (11–16) and they occurred in pairs as shown in Figure 3A and Table 1. These isomers were found to follow an elution order similar to that of di-CQAs where 3,4-di-esters elute first, followed by the 3,5-di-esters and with the 4,5-di-esters eluting last. The 20 eV collision energy level (MSE) was considered when annotating these metabolites.
The first pair was annotated as 3-pCo-4-CQA (11) and 3-C-4-pCoQA (12) shown in Figure 4A,B respectively. 3-ρCo-4-CQA (11) fragments produced a base peak ion at m/z 353 [CQA-H]- and secondary ions at m/z 337 [pCQA-H]-, 335 [CQA-H2O-H]-, m/z [QA-H]-, m/z 173 [QA-H-H2O]-, 163 [pCoA-H]-. The presence of a peak at m/z 173 was indicative of acylation at C4 of the QA, the peak at m/z 335 indicated a dehydrated caffeoylquinic acid and its ratio of approximately 30% to the base peak was characteristic of a 3,4-di-chlorogenic acid. An intense product ion at m/z 163 is characteristic of a coumaric residue at C3 of the QA. The 3-C-4-pCoQA (12) fragmented to give a base peak m/z 337, which is indicative of a loss of a caffeoyl residue and secondary peak at m/z 173 which indicated that the coumaroyl residue was acylated at C4 of the QA.
The next pair of isomers were identified as 3,5-di-esters due to their lack of a product ion at m/z 173. Figure 4C indicates the fragmentation pattern of a metabolite annotated as 3-pCo-5-CQA (13) with a base peak at m/z 337 indicating that the caffeoyl residue was extensively lost and which suggests that the caffeoyl residue is attached at position C5 of QA. According to [31] the acylation at position C5 is the easiest to remove followed by that at position C3, whilst the one at C4 is the hardest to remove. A product ion at m/z 163 was also observed which indicated that the coumaroyl residue was attached at position C3, hence this metabolite was annotated as 3-pCo-5-CQAs (13). The other isomer of this pair was annotated as 3-C-5-pCoQA (14). Its fragmentation pattern is indicated in Figure 4D, showing a base peak at m/z 353 and secondary ions of m/z 337, 191 and 179. The caffeoyl residue was assigned position C3 as the secondary ions m/z 191 and 179 showed behavior analogous to that of 3-CQA were a base peak at m/z 191 is observed and an ion at m/z 179 is present at 50% intensity compared to the m/z 191.
The last two pairs were annotated as 4,5-di-esters and are indicated in Figure 4E and Table 1. The isomer that eluted first in this pair was annotated as 4-coumaroyl-5-caffeoylquinic acid (15) and the fragments observed were a base peak at m/z 337 and secondary ions at m/z 173 and m/z 163, also shown in Figure 4E. Absence of the m/z 353 suggested that the caffeoyl residue was more extensively lost and most likely attached at position C5 of QA. The base peak at m/z 337 gave a fragment at m/z 173, suggesting that the coumaroyl residue was attached to position C4 of QA. The last isomer was annotated as 4-C-5-pCoQA (16). The fragmentation pattern of this metabolite is shown in Figure 4F, with a base peak at m/z 353 and secondary ions at m/z 337, 191, 179 and 173. All these isomers were present in both stem and leaf cell suspensions but absent in callus cultures. Five of these isomers were observed in leaf tissue of B. pilosa but were undetected in the stem and root tissues.

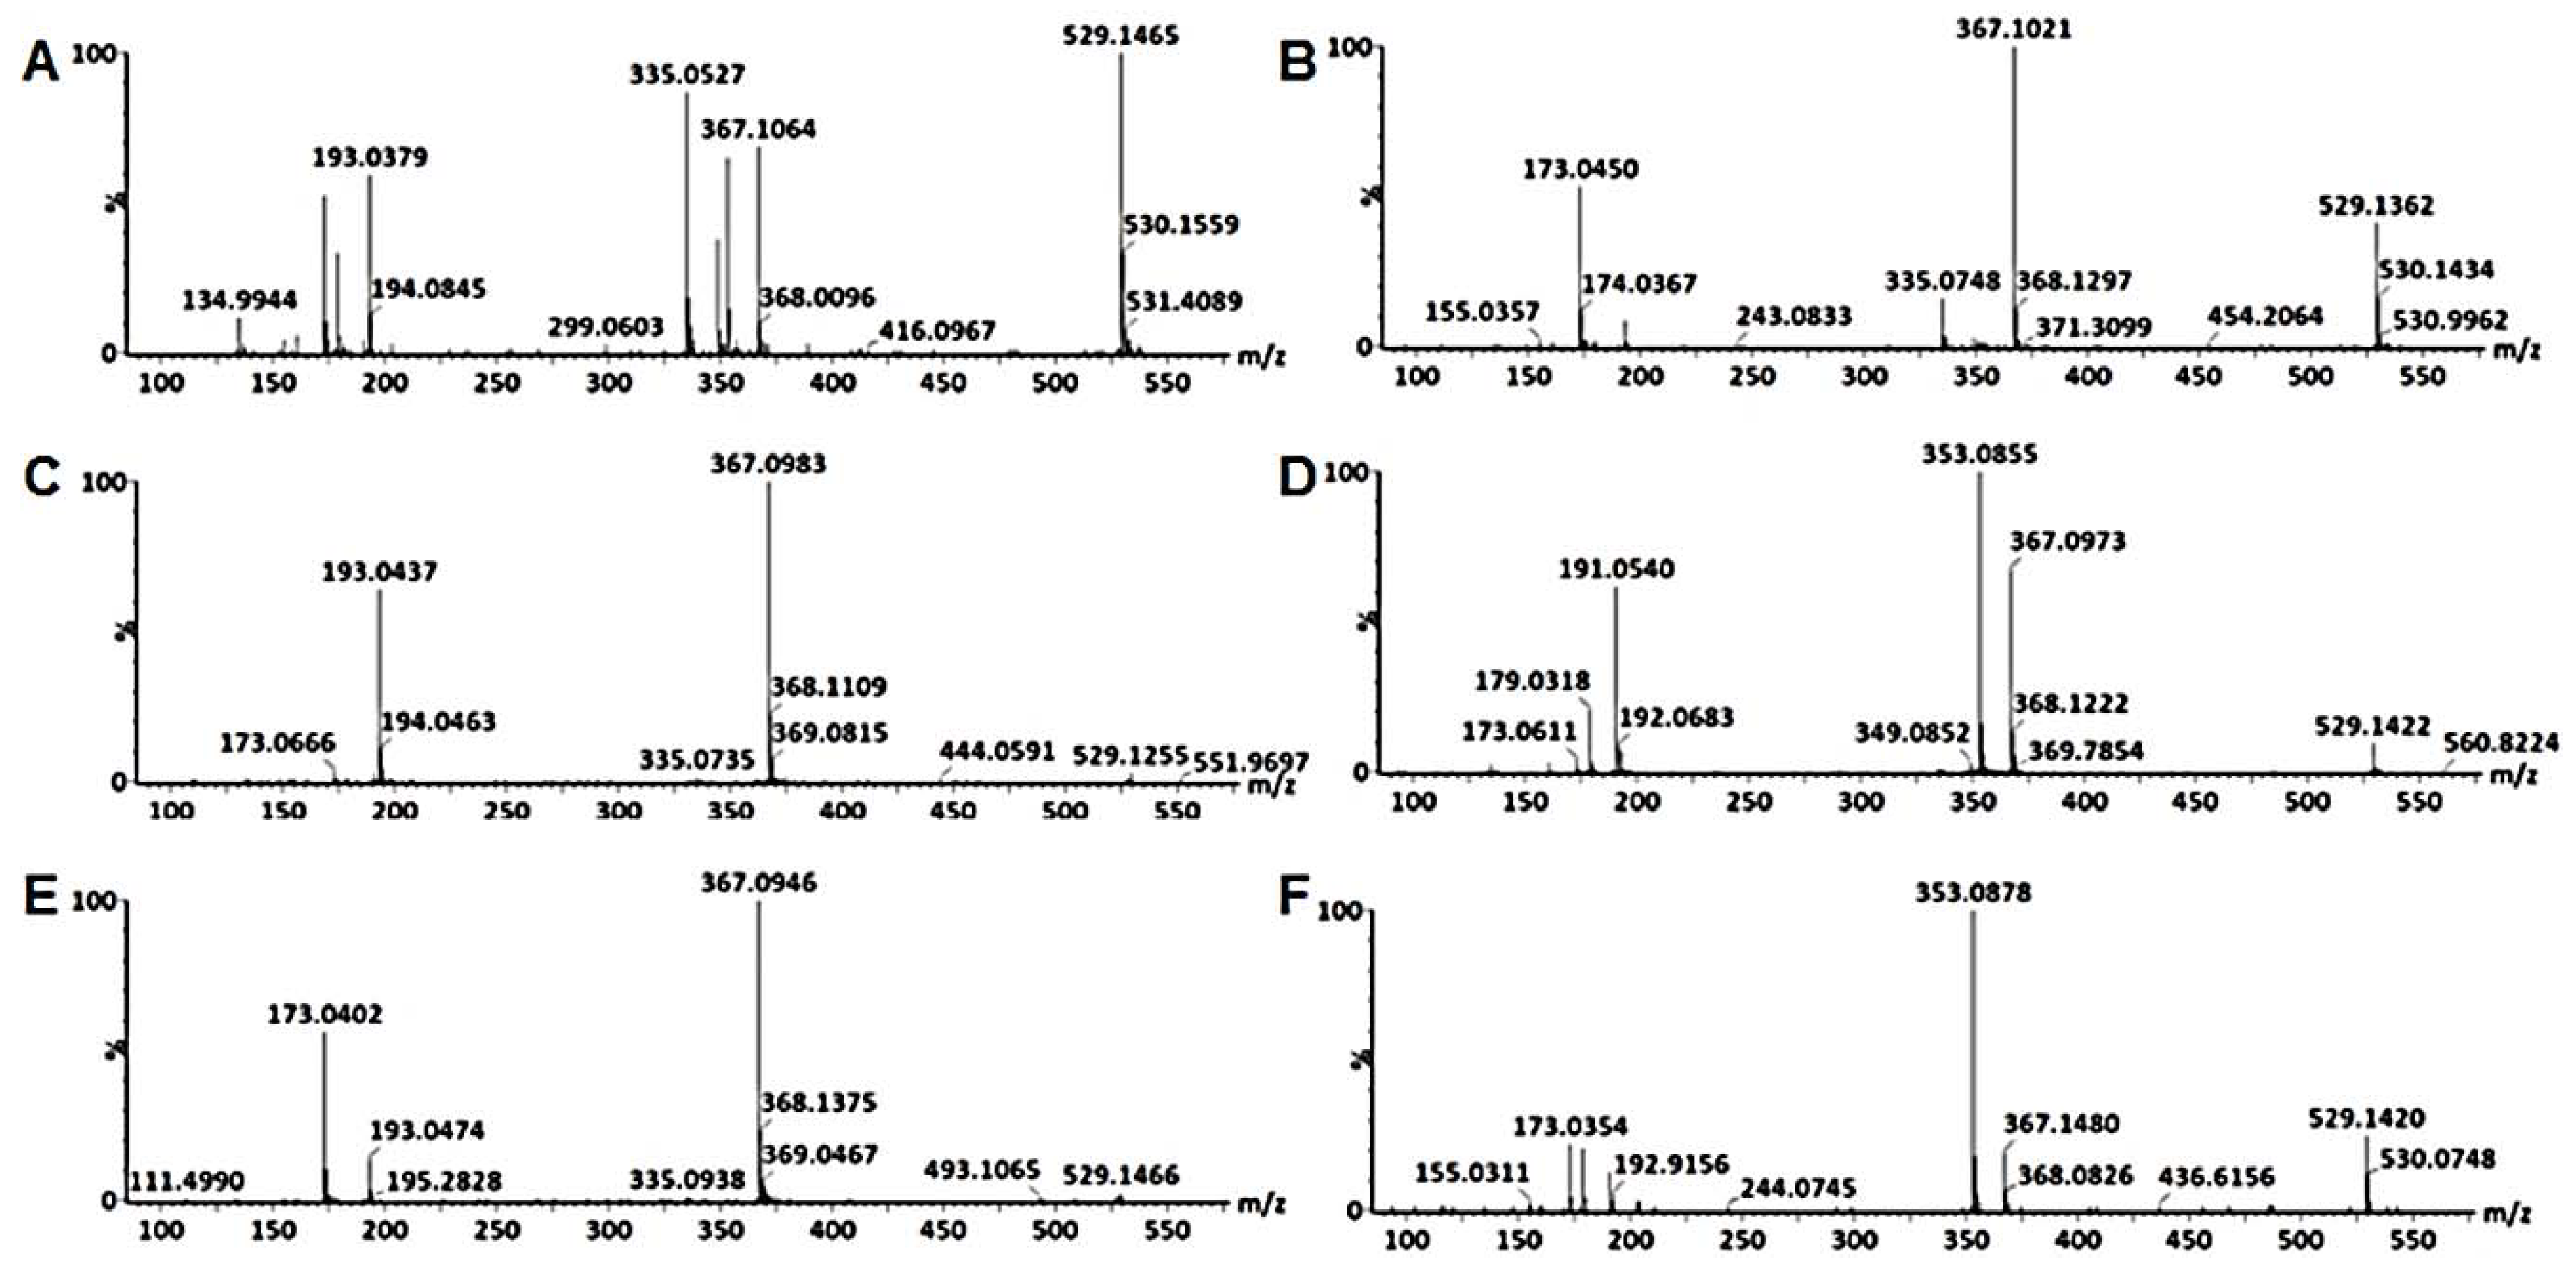
3.7. Characterization of Feruloyl-Caffeoylquinic Acids (F-CQAs)

The F-CQAs (23–29) were identified by their parent ion at m/z of 529 and the chemical structures are illustrated in Figure 6 [22,31,57]. Chromatographically, six isomers were observed which eluted in pairs shown in Figure 3B. The first two isomers were identified as 3-F-4-CQA (23) and 3-C-4-FQA (24). A typical fragmentation pattern of 3-F-4-CQA (23) shown in Figure 5A indicated fragment ions at m/z 367 [FQA-H]-, m/z 353 [CQA-H]-, m/z 335 [CQA-H2O-H]-, m/z 193 [FA-H]-, m/z 179 [CA-H-H2O]-, m/z 173 [QA-H-H2O]- and at m/z 134 [FA-H-CO2-CH3]. An intense product ion at m/z 335 indicated that this isomer was a CGA with the caffeoyl residue attached to position C4 of QA. The presence of an intense m/z 193 ion indicated that the feruloyl residue was attached at position C3 of QA. Figure 5B shows the fragmentation of 3-C-4-FQA (24) which gave a base peak of m/z 367 and secondary ion at m/z 173, indicating that the feruloyl residue is attached at position C4 of QA.
The next two isomers were annotated as 3,5-di-esters as they lacked a fragment ion of m/z 173 which indicated no acylation at position C4 of QA. These were annotated as 3-F-5-CQA (25) and 3-C-5-FQA-1 (26). The fragmentation pattern of 3-F-5-CQA (25Figure 5C) shows a base peak at m/z 367 which indicates extensive loss of the caffeoyl residue. This suggests acylation with a caffeoyl residue at position C5, while the intense secondary ion at m/z 193 indicates that the feruloyl residue was attached to position 3. Figure 5D shows the fragmentation pattern of 3-C-5-FQA (26) and fragments observed were m/z 353, 337, 191 and 179. The caffeoyl residue was assigned to position C3 as ions m/z 191 and 179 showed behavior similar to that of 3-CQA where a base peak at m/z 191 is observed and an m/z at 179 is present at 50% intensity compared to the m/z 191 ions. The feruloyl moiety was thus assigned to position C5 of QA.
The last two isomers were annotated as 4-F-5-CQA (27) and 4-C-5-FQA (28). The first eluting isomer showed a base peak m/z 367 and secondary ions m/z 193 and an intense m/z 173 shown in Figure 5E, hence the feruloyl residue was attached at position C4. Absence of m/z 353 indicated acylation of the caffeoyl residues at position C5 of QA. The fragmentation pattern of 4-C-5-FQA (22) is shown in Figure 5F. A later eluting F-CQA was also identified in stems and leaf tissues. This metabolite was identified as 3-C-5-FQA-2 (29) as it had similar fragmentation ions to (26).

3.8. Distribution of HCA Derivatives in Tissues and Cell Cultures of B. pilosa

Differential distribution of HCA derivatives were observed amongst the various tissue types of B. pilosa as indicated in Table 1. Most annotated HCA-derivatives (specifically quinic acid esters) were found to be mostly distributed in stem and leaf tissues as opposed to the roots. As described in [58], CGAs were found to be distributed mainly in chlorenchyma cells and appeared to be associated with chloroplast and were implicated to confer protection to chloroplasts against light. These metabolites were also found to be localized in the vascular bundles and this could suggest that they are transported throughout plant organs. From the observations of the distribution of CGAs in B. pilosa tissues, this suggests that the synthesis of these metabolites could be localized in the aerial parts of the plant and possibly translocated to other plant organs. Furthermore, this suggests that in B. pilosa, the hydroxycinnamoyl-CoA/quinate hydroxycinnamoyl transferase (HQT), an enzyme responsible for the biosynthesis of quinic acid esters [59] could be localized in or near the chloroplast, hence accumulation of HCA-derivatives was higher in the aerial parts of the plant.
In contrast, the tartaric acid esters were only to be distributed in the aerial parts of the plant and mostly in leaves whilst absent in root tissues. This corresponded to the analysis of different tissues of E. purpurea where CA was found to be present more in the apical parts of that plant [60]. Absence of the tartaric acid esters (CA and CTA) in the root tissues of B. pilosa could suggest a few possibilities that would require further investigations. Metabolite distribution patterns may differ, due to differences in expression of genes and localization of enzymes responsible for their biosynthesis [61]. The hydroxycinnamoyl-CoA/tartaric acid hydroxycinnamoyl transferase (HTT), an enzyme responsible for the biosynthesis of the tartaric esters [62] could be localized in the aerial parts of the plant considering the apparent complete absence of these esters in roots, therefore suggesting its localization in the chloroplast. However, further proteomics studies are required to validate the localization of HTT in the chloroplast and measurements of posttranscriptional regulation would need to be conducted to connect the distribution of these esters to localization of HTT. Deducing from the observations, HCA derivatives were generally abundant in the aerial parts of the plant; this could provide a chemical basis for the distinct usage of different tissues of B. pilosa, to maximally harness its bioactivities.
Plant cell cultures have been shown to be an attractive approach for the controlled production of bioactive natural products like phenylpropanoids, compared to the use of wild plants [11]. In cell suspensions of B. pilosa, 23 HCA-derivatives were identified while only 14 of these were identified in the callus cultures as presented in Table 1. Although plant cell culture is a promising alternative for metabolite production and provides numerous advantages, a significant limitation of using cell culture is that undifferentiated cells may accumulate secondary metabolites to a lesser extent compared to the parent plant [63,64]. As observed in this study, fewer HCA-derivatives were accumulated in cell cultures compared to plant tissues where 30 HCA-derivatives were identified. However, various strategies can be employed to improve yield of secondary metabolites in plant cell cultures such as optimizing cultural conditions (medium modifications) [65], precursor feeding [66], immobilization techniques [11], elicitation [67], and screening for high-producing cell lines [14]. As mentioned above, fewer HCA-derivatives were identified in cultured callus cells compared to cell suspensions. This could be because callus is maintained on semi-solid media while cell suspensions are maintained in liquid medium which is agitated to enhance oxygenation, promote better growth and transfer of nutrients [68,69].
Cell suspensions of B. pilosa were shown to be better starting material for in vitro cultivation for production of HCA-derivatives such as CGAs. Cultured cells of B. pilosa were noted to possess some form of a genetic memory and totipotency for the biosynthesis of some CGAs, similar to that of the parent plant. This observation may in future provide possibilities for bioreactor-based large-scale production of these biologically important secondary metabolites. Cultured cells are comparable to undifferentiated meristematic cells and lack chloroplasts. This could explain the apparent lack of tartaric acid esters in B. pilosa cultures [70]. These esters were hypothesized to be exclusively biosynthesized by the enzyme HTT as mentioned above which possibly could be localized in the chloroplasts of B. pilosa. Although making photosynthetic cell cultures with functional chloroplasts has been deemed difficult and time-consuming, recent advances have been made where medium modification in Arabidopsis thaliana cultures resulted in chloroplast formation [71].

4. Materials and Methods

4.1. Plant Cultivation Tissues and Undifferentiated Cells

B. pilosa seeds were collected from matured plants in the wild (Venda area of South Africa) and air-dried at room temperature. The seeds were cold shocked at 4 °C for 48 h; this was performed as a way of cold-wet stratification to break seed dormancy in summer perennials [72]. The seeds were then sown in Culterra germination mix (Culterra, Muldersdrift, South Africa, http://culterra.co.za). Germinated plants were then grown under greenhouse conditions at 28 °C for a period of two months. The plants were watered twice a week and fertilized once every two weeks with a fertilizer containing 90 mg/L mono-potassium phosphate, 150 mg/L Soluptase, 20 mg/L Microples, 40 µL/L Kelp-P-Max, 650 mg/L CaNO3, 400 mg/L KNO3, 300 mg/L MgSO4, and 90 mg/L mono-ammonium phosphate. Plants stems, roots and leaves were harvested and immediately shock-frozen in liquid nitrogen to quench all metabolic reactions [73,74,75]. The frozen plant tissues were stored at −80 °C, pending metabolite extractions.

4.2. Callus Initiation and Cell Suspension Cultures

B. pilosa callus cultures were established from leaf and stem explants on Murashige and Skoog medium with Murashige and Skoog vitamins containing 100 mg/L myo-inositol, 1 g/L hydrolyzed casein and 30 g/L sucrose with agar. The medium contained growth regulators, 0.45 mg/L 2,4-dichlorophenoxyacetic acid (2,4-D) and 1 mg/L 6-benzylaminopurine (BAP) at pH 5.8. Friable callus was sub-cultured into the medium with 0.45 mg/L 2,4-D and 1.0 mg/L BAP and grown in Erlenmeyer flasks on an orbital shaker at 120 rpm at room temperature with a light/dark cycle of 12 h/12 h and maintained at a low light intensity of 30 µmol/m2/s.

4.3. Metabolite Extraction

Two grams (2 g) of the samples; cell suspensions (harvested using filter paper (70 mm) on a vacuum filtration system), callus and plant tissues (crushed frozen with liquid nitrogen using a mortar and pestle) were homogenized at 5100 rpm in 20 mL (1:10 m/v) of 80% methanol (Romil SpS, Cambridge, UK). Samples were sonicated for 30 min at 30 °C and 100% intensity in a sonicator bath (Branson CPX, Fischer Scientific, Waltham, MA, USA). The crude extracts were centrifuged at 5100 rpm in a benchtop centrifuge (Beckman Coulter, Midrand, South Africa), for 15 min and supernatants were evaporated under vacuum using a rotary evaporator (Heidolph Instruments, Schwabach, Germany), at 55 °C to ~1 mL of samples. Samples were transferred to 2 mL Eppendorf tubes and dried to completion overnight in a dry bath at 55 °C, reconstituted with 500 µL of 50% methanol and sonicated for 30 min at 30 °C followed by filtration using 0.22 µm nylon filters into HPLC glass vials with 500 µL inserts. Samples were stored at 4 °C until future analysis. To ensure experimental reproducibility, eight independent biological replicates were prepared, and three instrumental technical replicates were analyzed.

4.4. Ultra High-Performance Liquid Chromatography-Quadrupole Time-of-Flight Mass Spectrometry (UHPLC-QTOF-MS/MS)

Extracts were analyzed on an ultrahigh-performance liquid chromatography-quadrupole time-of-flight MS instrument (UHPLC-QTOF SYNAPT G1 system, Waters Corporation, Manchester, UK) fitted with an Acquity HSS T3 C18 column (150 mm × 2.1 mm with particle size of 1.7 μm) (Waters, Milford, MA, USA). An injection volume of three µL was used and a binary solvent system was used consisting of solvent A: 0.1% formic acid in Milli-Q water (both HPLC grade, Merck, Darmstadt, Germany) and solvent B: acetonitrile (UHPLC grade, Romil SpS, Cambridge, UK) with 0.1% formic acid. A binary solvent gradient (with solvent A and B) with a flow rate of 0.4 mL/min was used to separate analytes over 30 min. The separation conditions were: 2% B over 0.0–1.0 min, 2%–60% B over 2.0–24 min, 60%–95% B over 24–25 min, from 25–27 min the conditions were maintained at 95% B and the column was washed with 95%–2% B over 27–28 min. The column was allowed to re-equilibrate with 5% B over a 2 min isocratic wash. The chromatographic effluents were further analyzed utilizing the SYNAPT G1 Q-TOF high definition mass spectrometer (Waters Corporation, Manchester, UK). Separate injections (using the same chromatographic settings and conditions) were performed for positive and negative electrospray ionization (ESI) modes. The MS conditions were set as follows: capillary voltage of 2.5 kV, sampling cone voltage of 30 V, extraction cone of 4.0 V, source temperature of 120 °C, cone gas flow of 50.0 (L/h), desolvation gas flow of 550 (L/h), m/z range of 100–1000, scan time of 0.2 sec, interscan delay of 0.02 sec, mode: centroid. Leucine encephalin was used as a reference calibrant (50 pg mL−1, [M + H]+ = 556.2766 and [M – H] = 554.2615), continuously sampled every 15 sec, producing an average intensity of 350 counts scan−1 in centroid mode, with typical mass accuracies between 3–5 mDa. For downstream structural elucidation, the MS analysis was set to result in both unfragmented and fragmentation experiments (MSE) by ramping the collision energy from 15 to 60 eV in a series of for fragmentation experiments. For untargeted analysis these conditions were kept constant throughout.
For the targeted approach, linked to ISCID, conditions were varied. Fragmentation patterns of pre-selected HCA derivatives with parent ions [M-H]- at m/z 677 (tricaffeoylquinic acids), m/z 529 (feruloycaffeoylquinic acids), m/z 499 (coumaroylquinic acids), m/z 515 (dicaffeoylquinic acid), m/z 367 (feruloylquinic acid), m/z 353 (caffeoylquinic acids), m/z 337 (coumaroylquinic acid) were chosen for MS2 analysis. Fragmentation was achieved by the ISCID method as explained [34,35,36,37,38] where the collision energy (10–40 eV) and the cone voltage (10–100 V) were optimized to produce fragment ions of chlorogenic acids at m/z 191 [quinic acid-H], m/z 179 [caffeic acid-H-H2O] , m/z 173 [quinic acid-H-H2O]- and m/z 135 [caffeic acid-H-CO2]- [34,35].

4.5. Data Processing, Multivariate Data Analysis (MVDA), and Metabolite Annotations

Prior to MVDA, UHPLC-QTOF-MS raw data was processed using MassLynx XS™ software’s MarkerLynx application (Waters, Manchester, UK). The MarkerLynx application performs accurate peak detection and alignment using the patented ApexTrack algorithm [41]. The following parameters were used: Retention time (Rt) range of 0.50–22 min with a Rt window of 0.2 min, mass range of 100–1000 Da and the mass tolerance as 0.05 Da. After the peaks were detected the corresponding ions (consisting mostly of the pseudomolecular ion peaks before fragmentation) were analyzed (maximum intensity, Rt and m/z) and recorded for all the samples. Data normalization was done by using total ion intensities of each defined peak. Prior to calculating intensities, the software performs a patented modified Savitzky-Golay smoothing and integration. The data matrix obtained from MassLynx was exported into SIMCA-15.0 software (Umetrics Corporation, Umea, Sweden) for statistical modeling. Statistical models computed were principal component analysis (PCA) and hierarchical cluster (HC) analysis which are both unsupervised models that show trends, clusters and similarities between samples. Agglomerative HC models were computed using Ward’s linkage method (incremental sum of squares method) that considers between- and within-cluster distances when forming clusters, and the tree was sorted based on size [37]. Unless stated otherwise, Pareto scaling was applied for all computed models to reduce the relative importance (masking effects) of large values from abundant metabolites, but partially preserve data structure [44,76,77]. Metabolite annotation was executed based on mass spectral information from MSE and/or MS2 experiments, accurate mass information, elemental composition calculations and searches in various databases such as ChemSpider and Dictionary of Natural Products (DNP, dnp.chemnetbase.com). Fragmentation patterns were also compared to available literature such as the hierarchical scheme keys for LC-MSn identification of CGAs [31]. Metabolites were putatively identified to level 2 of the Metabolomics Standards Initiative (MSI) [49]. The surrogate standard approach, through comparison with already analyzed plant extracts, was also followed to validate the identity of metabolites of which authentic standard are not available [78].

5. Conclusions

In this study tissues, callus and cell suspensions of B. pilosa were shown to contain diverse HCA derivatives of quinic acid which substantiates the reported health benefits of the plant as an alternative food source and, moreover, the use of cell culture for production of biologically important secondary metabolites. These HCA derivatives were shown to have differential distribution across tissues and cell cultures. Given this point, undifferentiated cells of B. pilosa indicated cell line-specific differences in distribution of HCA derivatives as a result of their inherent metabolite memory. The protocol outlined in this study offers possibilities for sustainable production of biochemically important phenolic compounds in cell suspension cultures of B. pilosa as reported for the first time in this study. Although the CGAs identified in this study are structurally diverse in terms of their geometric and regio-isomerism, the applied UHPLC-QTOF-MS/MS in-source collision-induced dissociation method assisted in annotating and differentiating between the CGA isomers found the cellular extracts. Minor differences in the fragmentation patterns gave characteristic diagnostic peaks that can be used to efficiently elucidate the regio-isomers of the HCA derivatives. Fragmentation patterns similar to those described in the hierarchical scheme keys for LC-MSn identification of CGAs [31] were obtained by use of in-source collision-induced dissociation. This method (ISCID) provides an analytical avenue that allows for efficient discrimination of CGA regio-isomers unaccompanied by the use of advanced MS technologies. In addition to the CGAs, HCAs esterified to tartaric acid and sugars are also reported in tissues of B. pilosa which indicates diversity in metabolite composition of this plant.

Supplementary Materials

The following are available online at https://www.mdpi.com/2218-1989/10/5/178/s1. Figure S1: Representative UHPLC-QTOF-MS base peak intensity (BPI) chromatograms showing the separation of secondary metabolite in methanol extracts of callus cultures (A) and cell suspension cultures (B) of B. pilosa initiated from leaves (blue) and stems (red) explant materials. Figure S2: (A and C)—Principal component analysis (PCA) score scatterplots indicating tissue-specific differences within callus cultures (A) and cell suspension cultures (C) of B. pilosa tissue initiated from leaves (blue) and stems (red) explant material. (B and D)—Hierarchical cluster analysis dendrograms indicating tissue-specific grouping of callus cultures (B) and cell suspension cultures (D) initiated from leaves (blue) and stems (red) explant material. Figure S3: A typical mass spectrum of the fragmentation pattern of 5-coumaroylquinic acid. Figure S4: Typical mass spectra of the fragmentation patterns of 3-caffeoylquinic acid (A), 4-caffeoyquinic acid (B) and 5-caffeoylquinic acid (C). Figure S5: Typical mass spectra of the fragmentation patterns of 3-feruloylquinic acid (A) and 4-feruloylquinic acid (B). Figure S6: A typical mass spectrum of the fragmentation patterns of caffeoylglycoside. Figure S7: Typical mass spectra of the fragmentation patterns of caftaric acid (A) and chicoric acid (B). Figure S8: Typical mass spectra of the fragmentation patterns of 3,4-di-caffeoylquinic acid (A), 3,5-di-caffeoylquinic acid (B) and 4,5-di-caffeoylquinic acid (C). Figure S9: Typical mass spectra of the fragmentation patterns of tri-caffeoylquinic acid (A) and di-caffeoylquinic acid glycoside (B).

Author Contributions

Conceptualization, N.M. and I.A.D.; Formal analysis, A.-T.R.; Investigation, A.-T.R.; N.M. and P.S.; Methodology, N.M. and P.S; Resources, P.S. and I.A.D.; Supervision, N.M. and I.A.D.; Writing—original draft, A.-T.R.; Writing—review and editing, N.M. and I.A.D. All authors have read and approved the final version of the manuscript.

Funding

The research was partially funded by the South African National Research Foundation (NRF) through grant support (number: 95818) to I.A.D.

Conflicts of Interest

The authors declare no conflicts of interests.

Data Availability

The study design information, LC-MS data, data processing and analyses are reported on and incorporated into the main text.

References

  1. Arthur, G.D. Bidens pilosa L.: Agricultural and pharmaceutical importance. J. Med. Plants Res. 2012, 6, 3282–3287. [Google Scholar] [CrossRef]
  2. Bartolome, A.P.; Villaseñor, I.M.; Yang, W.-C. Bidens pilosa L. (Asteraceae): Botanical Properties, Traditional Uses, Phytochemistry, and Pharmacology. Evidence-Based Complement. Altern. Med. 2013, 2013, 1–51. [Google Scholar] [CrossRef] [PubMed] [Green Version]
  3. Xuan, T.D.; Khanh, T.D. Chemistry and pharmacology of Bidens pilosa: An overview. J. Pharm. Investig. 2016, 46, 91–132. [Google Scholar] [CrossRef] [PubMed]
  4. Bilanda, D.C.; Djomeni, P.D.D.; Kouakep, L.; Aboubakar, B.F.O.; Tedong, L.; Kamtchouing, P.; Dimo, T. Bidens pilosa Ethylene acetate extract can protect against L-NAME-induced hypertension on rats. BMC Complement. Altern. Med. 2017, 17, 479. [Google Scholar] [CrossRef] [PubMed] [Green Version]
  5. Rojas, D.F.C.; Chagas-Paula, D.; Da Costa, F.B.; Souza, C.R.F.; Oliveira, W. Bioactive compounds in Bidens pilosa L. populations: A key step in the standardization of phytopharmaceutical preparations. Rev. Bras. Farm. 2013, 23, 28–35. [Google Scholar] [CrossRef]
  6. Chien, S.C.; Young, P.H.; Hsu, Y.; Chen, C.H.; Tien, Y.J.; Shiu, S.Y.; Li, T.H.; Yang, C.W.; Marimuthu, P.; Tsai, L.F.; et al. Anti-diabetic properties of three common Bidens pilosa variants in Taiwan. Phytochemistry 2009, 70, 1246–1254. [Google Scholar] [CrossRef]
  7. Liang, Y.-C.; Yang, M.-T.; Lin, C.-J.; Chang, C.L.-T.; Yang, W.-C. Bidens pilosa and its active compound inhibit adipogenesis and lipid accumulation via down-modulation of the C/EBP and PPARγ pathways. Sci. Rep. 2016, 6, 24285. [Google Scholar] [CrossRef] [Green Version]
  8. De Wet, H.; Nzama, V.; Van Vuuren, S. Medicinal plants used for the treatment of sexually transmitted infections by lay people in northern Maputaland, KwaZulu–Natal Province, South Africa. South Afr. J. Bot. 2012, 78, 12–20. [Google Scholar] [CrossRef] [Green Version]
  9. Chang, S.-L.; Chiang, Y.-M.; Chang, C.L.-T.; Yeh, H.-H.; Shyur, L.-F.; Kuo, Y.-H.; Wu, T.-K.; Yang, W.-C. Flavonoids, centaurein and centaureidin, from Bidens pilosa, stimulate IFN-γ expression. J. Ethnopharmacol. 2007, 112, 232–236. [Google Scholar] [CrossRef]
  10. Owoyemi, O.O.; Oladunmoye, M.K. Phytochemical Screening and Antibacterial Activities of Bidens pilosa L. and Tridax procumbens L. on Skin Pathogens. Int. J. Mod. Biol. Med. 2017, 8, 24–46. [Google Scholar]
  11. Rao, S.R.; A Ravishankar, G. Plant cell cultures: Chemical factories of secondary metabolites. Biotechnol. Adv. 2002, 20, 101–153. [Google Scholar] [CrossRef] [PubMed]
  12. Tiwari, R.; Rana, C.S. Plant secondary metabolites: A review. Int. J. Eng. Res. Gen. Sci. 2015, 3, 661–670. [Google Scholar]
  13. Ling, A.P.K.; Ong, S.L.; Sobri, H. Strategies in enhancing secondary metabolites production in plant cell cultures. Med. Aromat. Plant Sci. Biotechnol. 2011, 5, 94–101. [Google Scholar]
  14. Ochoa-Villarreal, M.; Howat, S.; Hong, S.; Jang, M.O.; Jin, Y.-W.; Lee, E.-K.; Loake, G.J. Plant cell culture strategies for the production of natural products. BMB Rep. 2016, 49, 149–158. [Google Scholar] [CrossRef]
  15. Chen, S.; Lin, J.; Liu, H.; Gong, Z.; Wang, X.; Li, M.; Aharoni, A.; Yang, Z.; Yu, X. Insights into Tissue-specific Specialized Metabolism in Tieguanyin Tea Cultivar by Untargeted Metabolomics. Molecules 2018, 23, 1817. [Google Scholar] [CrossRef] [Green Version]
  16. Hellwig, S.; Drossard, J.; Twyman, R.; Fischer, R. Plant cell cultures for the production of recombinant proteins. Nat. Biotechnol. 2004, 22, 1415–1422. [Google Scholar] [CrossRef]
  17. James, J.T.; Tugizimana, F.; Steenkamp, P.A.; Dubery, I.A. Metabolomic Analysis of Methyl Jasmonate-Induced Triterpenoid Production in the Medicinal Herb Centella asiatica (L.) Urban. Molecules 2013, 18, 4267–4281. [Google Scholar] [CrossRef] [Green Version]
  18. Dorenenburg, H.; Knorr, D. Strategies to improve secondary metabolites in plant cultures. Enzyme Microb. Technol. 1995, 17, 674–684. [Google Scholar] [CrossRef]
  19. Laura, C.R.; Mauricio, R.L.; Aura, U.; Lucia, A.G. Effect of nutrients starvation in the cell cycle synchronization of cell suspension cultures of Jatropha curcas L. Curr. Plant Boil. 2018, 13, 23–31. [Google Scholar] [CrossRef]
  20. Clifford, M.N. Review Chlorogenic acids and other cinnamates–nature, occurrence and dietary burden. J. Sci. Food Agric. 1999, 79, 362–372. [Google Scholar] [CrossRef]
  21. Clifford, M.; Knight, S.; Kuhnert, N. Discriminating between the Six Isomers of Dicaffeoylquinic Acid by LC-MSn. J. Agric. Food Chem. 2005, 53, 3821–3832. [Google Scholar] [CrossRef] [PubMed]
  22. Jaiswal, R.; Sovdat, T.; Vivan, F.; Kuhnert, N. Profiling and characterization by LC-MSn of the chlorogenic acids and hydroxycinnamoylshikimate esters in maté (Ilex paraguariensis). J. Agric. Food Chem. 2010, 58, 5471–5484. [Google Scholar] [CrossRef] [PubMed]
  23. Zheng, X.; Renslow, R.S.; Makola, M.M.; Webb, I.K.; Deng, L.; Thomas, D.G.; Govind, N.; Ibrahim, Y.M.; Kabanda, M.M.; Dubery, I.A.; et al. Structural Elucidation of cis/trans Dicaffeoylquinic Acid Photoisomerization Using Ion Mobility Spectrometry-Mass Spectrometry. J. Phys. Chem. Lett. 2017, 8, 1381–1388. [Google Scholar] [CrossRef] [PubMed] [Green Version]
  24. Wianowska, D.; Gil, M. Recent advances in extraction and analysis procedures of natural chlorogenic acids. Phytochem. Rev. 2018, 18, 273–302. [Google Scholar] [CrossRef] [Green Version]
  25. Mhlongo, M.I.; Piater, L.; Steenkamp, P.A.; Madala, N.E.; Dubery, I.A. Metabolomic fingerprinting of primed tobacco cells provide the first evidence for the biological origin of cis-chlorogenic acid. Biotechnol. Lett. 2014, 37, 205–209. [Google Scholar] [CrossRef]
  26. Lallemand, L.A.; Zubieta, C.; Lee, S.G.; Wang, Y.; Acajjaoui, S.; Timmins, J.; McSweeney, S.; Jez, J.M.; McCarthy, J.G.; McCarthy, A.A. A structural basis for the biosynthesis of the major chlorogenic acids found in coffee. Plant Physiol. 2012, 160, 249–260. [Google Scholar] [CrossRef] [Green Version]
  27. Taofiq, O.; González-Paramás, A.M.; Barreiro, M.F.; Ferreira, I.C.F.R. Hydroxycinnamic Acids and Their Derivatives: Cosmeceutical Significance, Challenges and Future Perspectives, a Review. Molecules 2017, 22, 281. [Google Scholar] [CrossRef]
  28. Kundu, A.; Vadassery, J. Chlorogenic acid-mediated chemical defence of plants against insect herbivores. Plant Boil. 2019, 21, 185–189. [Google Scholar] [CrossRef]
  29. Masike, K.; Dubery, I.; Steenkamp, P.; Smit, E.; Madala, N.E. Revising Reverse-Phase Chromatographic Behavior for Efficient Differentiation of Both Positional and Geometrical Isomers of Dicaffeoylquinic Acids. J. Anal. Methods Chem. 2018, 2018, 1–11. [Google Scholar] [CrossRef] [Green Version]
  30. Makola, M.M.; Steenkamp, P.; Dubery, I.A.; Kabanda, M.M.; Madala, N.E. Preferential alkali metal adduct formation by cis geometrical isomers of dicaffeoylquinic acids allows for efficient discrimination from their trans isomers during ultra-high-performance liquid chromatography/quadrupole time-of-flight mass spectrometry. Rapid Commun. Mass Spectrom. 2016, 30, 1011–1018. [Google Scholar] [CrossRef]
  31. Clifford, M.; Johnston, K.L.; Knight, S.; Kuhnert, N. Hierarchical Scheme for LC-MSn Identification of Chlorogenic Acids. J. Agric. Food Chem. 2003, 51, 2900–2911. [Google Scholar] [CrossRef]
  32. Clifford, M.; Jaganath, I.B.; Ludwig, I.A.; Crozier, A. Chlorogenic acids and the acyl-quinic acids: Discovery, biosynthesis, bioavailability and bioactivity. Nat. Prod. Rep. 2017, 34, 1391–1421. [Google Scholar] [CrossRef] [PubMed] [Green Version]
  33. Asamenew, G.; Kim, H.-W.; Lee, M.-K.; Lee, S.-H.; Lee, S.; Cha, Y.-S.; Lee, S.H.; Yoo, S.M.; Kim, J.B. Comprehensive characterization of hydroxycinnamoyl derivatives in green and roasted coffee beans: A new group of methyl hydroxycinnamoyl quinate. Food Chem. X 2019, 2, 100033. [Google Scholar] [CrossRef] [PubMed]
  34. Madala, N.E.; Tugizimana, F.; Steenkamp, P.A. Development and Optimization of an UPLC-QTOF-MS/MS Method Based on an In-Source Collision Induced Dissociation Approach for Comprehensive Discrimination of Chlorogenic Acids Isomers from Momordica Plant Species. J. Anal. Methods Chem. 2014, 2014, 1–7. [Google Scholar] [CrossRef] [PubMed]
  35. Ncube, E.; I Mhlongo, M.; Piater, L.; Steenkamp, P.; Dubery, I.A.; Madala, N.E. Analyses of chlorogenic acids and related cinnamic acid derivatives from Nicotiana tabacum tissues with the aid of UPLC-QTOF-MS/MS based on the in-source collision-induced dissociation method. Chem. Central J. 2014, 8, 66. [Google Scholar] [CrossRef] [PubMed] [Green Version]
  36. Nagy, Á.; Abrankó, L. Profiling of hydroxycinnamoylquinic acids in plant extracts using in-source CID fragmentation. J. Mass Spectrom. 2016, 51, 1130–1145. [Google Scholar] [CrossRef]
  37. Viacava, G.E.; Roura, S.I.; Berrueta, L.A.; Iriondo, C.; Gallo, B.; Alonso-Salces, R.M. Characterization of phenolic compounds in green and red oak-leaf lettuce cultivars by UHPLC-DAD-ESI-QTOF/MS using MSE scan mode. J. Mass Spectrom. 2017, 52, 873–902. [Google Scholar] [CrossRef]
  38. Chen, J.; Shiyanov, P.; Schlager, J.J.; Green, K.B. A Pseudo MS3 Approach for Identification of Disulfide-Bonded Proteins: Uncommon Product Ions and Database Search. J. Am. Soc. Mass Spectrom. 2011, 23, 225–243. [Google Scholar] [CrossRef]
  39. Achakzai, A.K.K.; Achakzai, P.; Masood, A.; Kayani, S.A.; Tareen, R.B. Response of plant parts and age on the distribution of secondary metabolites on plants found in Quetta. Pakistan J. Bot. 2009, 41, 2129–2135. [Google Scholar]
  40. Wiklund, S.; Johansson, E.; Sjöström, L.; Mellerowicz, E.J.; Edlund, U.; Shockcor, J.P.; Gottfries, J.; Moritz, T.; Trygg, J. Visualization of GC/TOF-MS-Based Metabolomics Data for Identification of Biochemically Interesting Compounds Using OPLS Class Models. Anal. Chem. 2008, 80, 115–122. [Google Scholar] [CrossRef]
  41. Tugizimana, F.; Steenkamp, P.; Piater, L.; Dubery, I.A. A Conversation on Data Mining Strategies in LC-MS Untargeted Metabolomics: Pre-Processing and Pre-Treatment Steps. Metabolites 2016, 6, 40. [Google Scholar] [CrossRef] [PubMed] [Green Version]
  42. Godzien, J.; Ciborowski, M.; Parreño, S.A.-D.; Barbas, C. From numbers to a biological sense: How the strategy chosen for metabolomics data treatment may affect final results. A practical example based on urine fingerprints obtained by LC-MS. Electrophoresis 2013, 34, 2812–2826. [Google Scholar] [CrossRef]
  43. Rodriguez, M.Z.; Comin, C.H.; Casanova, D.; Bruno, O.M.; Amancio, D.R.; Costa, L.D.F.; Rodrigues, F.A. Clustering algorithms: A comparative approach. PLOS ONE 2019, 14, e0210236. [Google Scholar] [CrossRef]
  44. Granato, D.; Santos, J.S.; Escher, G.B.; Ferreira, B.L.; Maggio, R.M. Use of principal component analysis (PCA) and hierarchical cluster analysis (HCA) for multivariate association between bioactive compounds and functional properties in foods: A critical perspective. Trends Food Sci. Technol. 2018, 72, 83–90. [Google Scholar] [CrossRef]
  45. Xie, C.; Yu, K.; Zhong, D.; Yuan, T.; Ye, F.; Jarrell, J.A.; Millar, A.; Chen, X. Investigation of Isomeric Transformations of Chlorogenic Acid in Buffers and Biological Matrixes by Ultra-performance Liquid Chromatography Coupled with Hybrid Quadrupole/Ion Mobility/Orthogonal Acceleration Time-of-Flight Mass Spectrometry. J. Agric. Food Chem. 2011, 59, 11078–11087. [Google Scholar] [CrossRef] [PubMed]
  46. Clifford, M.; Kirkpatrick, J.; Kuhnert, N.; Roozendaal, H.; Salgado, P.R. LC–MSn analysis of the cis isomers of chlorogenic acids. Food Chem. 2008, 106, 379–385. [Google Scholar] [CrossRef]
  47. Masike, K.; Mhlongo, M.I.; Mudau, S.P.; Nobela, O.; Ncube, E.; Tugizimana, F.; George, M.J.; Madala, N.E. Highlighting mass spectrometric fragmentation differences and similarities between hydroxycinnamoyl-quinic acids and hydroxycinnamoyl-isocitric acids. Chem. Central J. 2017, 11, 29. [Google Scholar] [CrossRef]
  48. Liu, L.; Zhang, J.; Zheng, B.; Guan, Y.; Wang, L.; Chen, L.; Cai, W. Rapid characterization of chlorogenic acids in Duhaldea nervosa based on ultra-high-performance liquid chromatography-linear trap quadropole-Orbitrap-mass spectrometry and mass spectral trees similarity filter technique. J. Sep. Sci. 2018, 41, 1764–1774. [Google Scholar] [CrossRef]
  49. Sumner, L.W.; Amberg, A.; A Barrett, D.; Beale, M.H.; Beger, R.D.; Daykin, C.A.; Fan, T.W.-M.; Fiehn, O.; Goodacre, R.; Griffin, J.; et al. Proposed minimum reporting standards for chemical analysis Chemical Analysis Working Group (CAWG) Metabolomics Standards Initiative (MSI). Metabolomics 2007, 3, 211–221. [Google Scholar] [CrossRef] [Green Version]
  50. Linić, I.; Šamec, D.; Gruz, J.; Bok, V.V.; Strnad, M.; Sondi, B.S. Involvement of Phenolic Acids in Short-Term Adaptation to Salinity Stress is Species-Specific among Brassicaceae. Plants 2019, 8, 155. [Google Scholar] [CrossRef] [Green Version]
  51. Healy, E.F.; Sanders, J.; King, P.J.; Robinson, W.E. A docking study of l-chicoric acid with HIV-1 integrase. J. Mol. Graph. Model. 2009, 27, 584–589. [Google Scholar] [CrossRef] [PubMed]
  52. Kuban-Jankowska, A.; Sahu, K.K.; Gorska, M.; Tuszynski, J.A.; Woźniak, M. Chicoric acid binds to two sites and decreases the activity of the YopH bacterial virulence factor. Oncotarget 2016, 7, 2229–2238. [Google Scholar] [CrossRef] [PubMed] [Green Version]
  53. Lee, J.; Scagel, C. Chicoric acid levels in commercial basil (Ocimum basilicum) and Echinacea purpurea products. J. Funct. Foods 2010, 2, 77–84. [Google Scholar] [CrossRef]
  54. Khoza, B.; Gbashi, S.; Steenkamp, P.; Njobeh, P.B.; Madala, N. Identification of hydroxylcinnamoyl tartaric acid esters in Bidens pilosa by UPLC-tandem mass spectrometry. South Afr. J. Bot. 2016, 103, 95–100. [Google Scholar] [CrossRef]
  55. Jaiswal, R.; Müller, H.; Müller, A.; Gamaleldin, M.; Karar, E.; Kuhnert, N. Identification and characterization of chlorogenic acids, chlorogenic acid glycosides and flavonoids from Lonicera henryi L. (Caprifoliaceae) leaves by LC – MSn. Phytochemistry 2014, 108, 252–263. [Google Scholar] [CrossRef]
  56. Clifford, M.; Wu, W.; Kirkpatrick, J.; Kuhnert, N. Profiling the Chlorogenic Acids and Other Caffeic Acid Derivatives of Herbal Chrysanthemum by LC−MSn. J. Agric. Food Chem. 2007, 55, 929–936. [Google Scholar] [CrossRef]
  57. Clifford, M.N.; Marks, S.; Knight, S.; Kuhnert, N. Characterization by LC-MSn of four new classes of p-coumaric acid-containing diacyl chlorogenic acids in green coffee beans. J. Agric. Food Chem. 2006, 54, 4095–4101. [Google Scholar] [CrossRef]
  58. Mondolot, L.; La Fisca, P.; Buatois, B.; Talansier, E.; De Kochko, A.; Campa, C. Evolution in Caffeoylquinic Acid Content and Histolocalization During Coffea canephora Leaf Development. Ann. Bot. 2006, 98, 33–40. [Google Scholar] [CrossRef]
  59. Chen, Z.; Tang, N.; You, Y.; Lan, J.; Liu, Y.; Li, Z. Transcriptome Analysis Reveals the Mechanism Underlying the Production of a High Quantity of Chlorogenic Acid in Young Leaves of Lonicera macranthoides Hand.-Mazz. PLOS ONE 2015, 10, e0137212. [Google Scholar] [CrossRef] [Green Version]
  60. Lin, S.-D.; Sung, J.-M.; Chen, C.-L. Effect of drying and storage conditions on caffeic acid derivatives and total phenolics of Echinacea Ppurpurea grown in Taiwan. Food Chem. 2011, 125, 226–231. [Google Scholar] [CrossRef]
  61. Zhang, X.; Ding, X.; Ji, Y.; Wang, S.; Chen, Y.; Luo, J.; Shen, Y.; Peng, L. Measurement of metabolite variations and analysis of related gene expression in Chinese liquorice (Glycyrrhiza uralensis) plants under UV-B irradiation. Sci. Rep. 2018, 8, 6144. [Google Scholar] [CrossRef] [PubMed] [Green Version]
  62. Sullivan, M. Perennial peanut (Arachis glabrata Benth.) leaves contain hydroxycinnamoyl-CoA:tartaric acid hydroxycinnamoyl transferase activity and accumulate hydroxycinnamoyl-tartaric acid esters. Planta 2014, 239, 1091–1100. [Google Scholar] [CrossRef] [PubMed]
  63. Qu, J.; Zhang, W.; Yu, X. A combination of elicitation and precursor feeding leads to increased anthocyanin synthesis in cell suspension cultures of Vitis vinifera. Plant Cell Tissue Organ Cult. (PCTOC) 2011, 107, 261–269. [Google Scholar] [CrossRef]
  64. Nomura, T.; Ogita, S.; Kato, Y. Rational metabolic-flow switching for the production of exogenous secondary metabolites in bamboo suspension cells. Sci. Rep. 2018, 8, 13203. [Google Scholar] [CrossRef] [PubMed]
  65. Abouzid, S.F. Yield improvement strategies for the production of secondary metabolites in plant tissue culture: Silymarin from Silybum marianumtissue culture. Nat. Prod. Res. 2014, 28, 2102–2110. [Google Scholar] [CrossRef]
  66. Hussain, S.; Fareed, S.; Ansari, S.; Rahman, A.; Ahmad, I.Z.; Saeed, M. Current approaches toward production of secondary plant metabolites. J. Pharm. Bioallied Sci. 2012, 4, 10–20. [Google Scholar] [CrossRef] [PubMed]
  67. Wang, J.; Qian, J.; Yao, L.; Lu, Y. Enhanced production of flavonoids by methyl jasmonate elicitation in cell suspension culture of Hypericum perforatum. Bioresour. Bioprocess. 2015, 2, 975. [Google Scholar] [CrossRef] [Green Version]
  68. Murthy, H.N.; Lee, E.-J.; Paek, K.Y. Production of secondary metabolites from cell and organ cultures: Strategies and approaches for biomass improvement and metabolite accumulation. Plant Cell Tissue Organ Cult. (PCTOC) 2014, 118, 1–16. [Google Scholar] [CrossRef]
  69. Jamil, S.Z.M.R.; Rohani, E.R.; Baharum, S.N.; Noor, N.M. Metabolite profiles of callus and cell suspension cultures of mangosteen. 3 Biotech 2018, 8, 322. [Google Scholar] [CrossRef]
  70. Efferth, T. Biotechnology Applications of Plant Callus Cultures. Engineering 2019, 5, 50–59. [Google Scholar] [CrossRef]
  71. Sello, S.; Moscatiello, R.; La Rocca, N.; Baldan, B.; Navazio, L. A Rapid and Efficient Method to Obtain Photosynthetic Cell Suspension Cultures of Arabidopsis thaliana. Front. Plant Sci. 2017, 8, 1–8. [Google Scholar] [CrossRef] [PubMed] [Green Version]
  72. Schütz, W.; Rave, G. The effect of cold stratification and light on the seed germination of temperate sedges (Carex) from various habitats and implications for regenerative strategies. Plant Ecol. 1999, 144, 215–230. [Google Scholar] [CrossRef]
  73. Maier, T.S.; Kuhn, J.; Müller, C. Proposal for field sampling of plants and processing in the lab for environmental metabolic fingerprinting. Plant Methods 2010, 6, 6. [Google Scholar] [CrossRef] [Green Version]
  74. Santos, R.B.; Abranches, R.; Fischer, R.; Sack, M.; Holland, T. Putting the Spotlight Back on Plant Suspension Cultures. Front. Plant Sci. 2016, 7, 121. [Google Scholar] [CrossRef] [Green Version]
  75. Gong, Z.-G.; Hu, J.; Wu, X.; Xu, Y.-J. The Recent Developments in Sample Preparation for Mass Spectrometry-Based Metabolomics. Crit. Rev. Anal. Chem. 2017, 47, 325–331. [Google Scholar] [CrossRef]
  76. Bartel, J.; Krumsiek, J.; Theis, F.J. Statistical methods for the analysis of high-throughput metabolomics data. Comput. Struct. Biotechnol. J. 2013, 4, e201301009. [Google Scholar] [CrossRef] [PubMed] [Green Version]
  77. Tugizimana, F.; Piater, L.; Dubery, I.A. Plant metabolomics: A new frontier in phytochemical analysis. South Afr. J. Sci. 2013, 109, 1–11. [Google Scholar] [CrossRef]
  78. Clifford, M.; Madala, N.E. Surrogate Standards: A Cost-Effective Strategy for Identification of Phytochemicals. J. Agric. Food Chem. 2017, 65, 3589–3590. [Google Scholar] [CrossRef] [PubMed]
Figure 1. Representative UHPLC-QTOF-MS base peak intensity (BPI) chromatograms showing the separation of secondary metabolites in extracts of B. pilosa roots (green), leaves (blue), and stems (red). The yellow rectangles indicate the chromatographic regions where hydroxycinnamic acid derivatives are present across the three tissue types with some visible differences in intensities.
Metabolites 10 00178 g001
Figure 2. Multivariate data analysis of compositional differences in hydromethanolic extracts of Bidens pilosa tissues types. (A) A PCA scores scatterplot of the Pareto-scaled data set obtained from LC-MS experiments. The six-component model (with PC 1 and PC 2 explaining 65.3% of the variation) indicate the general clustering within the datasets of B. pilosa tissues (leaves (blue), stems (red) and roots (green) samples). The quality parameters of the model are: explained variation/goodness-of-fit R2 = 0.890 and the predictive variance Q2 = 0.874. The ellipse in the PCA score scatterplot indicates the Hotelling’s T2 at 95% confidence interval. (B) Hierarchical cluster analysis of the hierarchical structure of the data in dendrogram format. The model computed (using Euclidean distance and Ward’s minimum variance as a dissimilarity and linkage rule, respectively) shows tissue-specific clustering into two major groups, grouping roots and stems tissues together.
Metabolites 10 00178 g002
Figure 3. Representative UHPLC-QTOF-MS/MS single ion chromatograms showing the separation of coumaroyl-caffeoylquinic acids (A) and feruloyl-caffeoylquinic acids (B).
Metabolites 10 00178 g003
Figure 4. Typical mass spectra of the fragmentation patterns of 3-coumaroyl-4-caffeoylquinic acid (A), 3-caffeoyl-4-coumaroylquinic acid (B), 3-coumaroyl-5-caffeoylquinic acid (C), 3-caffeoyl-5-coumaroylquinic acid (D), 4-coumaroyl-5-caffeoylquinic acid (E) and 4-caffeoyl-5-coumaroylquinic acid (F).
Metabolites 10 00178 g004
Figure 5. Typical mass spectra of the fragmentation patterns of 3-feruloyl-4-caffeoylquinic acid (A), 3-caffeoyl-4-feruloylquinic acid (B), 3-feruloyl-5-cafffeoylquinic acid (C), 3-caffeoyl-5-feruloylquinic acid (D), 4-feruloyl-5-caffeoylquinic acid (E), and 4-caffeoyl-5-feruloylquinic acid (F).
Metabolites 10 00178 g005
Figure 6. Chemical structures of mono-, di- and tri-substituted hydroxycinnamic acid (HCA) derivatives of quinic acid (QA) and tartaric acid (TA) identified in tissues and two suspension-cultured cell lines of Bidens pilosa.
Metabolites 10 00178 g006
Table 1. Characterization of chlorogenic acids (CGAs) consisting of hydroxycinnamic acid (HCA) derivatives of quinic acid (QA) and tartaric acid from tissues (L-leaves, S-Stems and R-Roots) and from two callus cell lines (C-L and C-S) and two cell suspension lines (S-L and S-S) of Bidens pilosa.
Nom/zMass Error (mDa)Rt (min)Fragment ionsMolecular FormulaMetaboliteAbbreviationLSRC-lC-sS-lS-s
1311.03928.84.51179, 149, 135C13H12O9Caftaric acidCTA
2337.08225.49.45191C16H18O85-Coumaroylquinic acid5-ρCoQA
3341.08292.47.33179, 135C15H18O9CaffeoylglycosideCFA-glyc
4353.0844.93.31191, 179, 135C16H18O9trans-3-Caffeoylquinic acidtrans-3-CQA
5353.08215.46.39191C16H18O9trans-5-Caffeoylquinic acidtrans-5-CQA
6353.08355.77.12191, 179, 173, 135C16H18O9trans-4-Caffeoylquinic acidtrans-4-CQA
7353.08842.69.16191C16H18O9cis-5-Caffeoylquinic acidcis-5-CQA
8367.10035.56.52193C17H20O93-Feruloylqunic acid3-FQA
9367.09863.710.91191, 173C17H20O94-Feruloylquinic acid4-FQA
10473.06732.714.89311, 179, 149, 135C22H18O9Chicoric acidCA
11499.12111.315.68353, 337, 335, 191, 173, 163C25H24O113-Coumaroyl-4-caffeoylquinic acid3ρCo-4-CQA
12499.11834.515.84337, 335, 173, 164C25H24O113-Caffeoyl-4-coumaroylquinic acid3C-4-ρCoQA
13499.12170.615.99337, 163C25H24O113-Coumaroyl-5-caffeoylquinic acid3ρCo-5-CQA
14499.123121.016.09353, 337,191, 179C25H24O113-Caffeoyl-5-coumaroylquinic acid3C-5-ρCoQA
15499.13524.216.65337, 173, 163C25H24O114-Coumaroyl-5-caffeoylquinic acid4ρCo-5-CQA
16499.12271.216.75353, 337,191, 179, 173C25H24O114-Caffeoyl-5-coumaroylquinic acid4C-5-ρCoQA
17515.11821.014.65353, 335, 191, 179, 135C25H24O123,4-di-Caffeoylquinic acid3,4-di-CQA-1
18515.11631.714.69353, 335, 191, 179, 173, 135C25H24O123,4-di-Caffeoylquinic acid3,4-di-CQA-2
19515.12106.214.93353, 191, 179, 135C25H24O123,5-di-Caffeoylquinic acid3,5-di-CQA-1
20515.11702.115.03353, 191, 179, 135C25H24O123,5-di-Caffeoylqiunic acid3,5-di-CQA-2
21515.12922.215.67353, 335, 191, 179, 173, 135C25H24O124,5-di-Caffeoylquinic acid4,5-di-CQA-1
22515.11222.016.89353, 191, 179, 173C25H24O124,5-di-Caffeoylquinic acid4,5-di-CQA-2
23529.13151.215.92367, 353, 335, 193, 179, 173, 134C26H26O123-Feruloyl-4-caffeoylquinic acid3F-4-CQA
24529.13811.916.11367, 335, 193, 173C26H26O123-Caffeoyl-4-feruloylquinic acid3C-4-FQA
25529.12963.516.37367, 193, 134C26H26O123-Feruloyl-5-cafffeoylquinic acid3F-5-CQA
26529.14220.816.49367, 353, 191, 179C26H26O123-Caffeoyl-5-feruloylquinic acid3C-5-FQA-1
27529.14631.216.86367, 193, 173C26H26O124-Feruloyl-5-caffeoylquinic acid4F-5-CQA
28529.1424.616.97367, 353, 191, 179, 173, 135C26H26O124-Caffeoyl-5-feruloylquinic acid4C-5-FQA
29529.13957.517.09353, 191, 179 C26H26O123-Caffeoyl-5-feruloylquinic acid3C-5FQA-2
30677.142.312.99515, 353, 341, 353, 179, 173C31H33O17di-Caffeoylquinic acid glycosidedi-CQA-glc-1
31677.160.814.07515, 353, 341C31H33O17di-Caffeoylquinic acid glycosidedi-CQA-glc-2
32677.14360.317.76515, 353, 335, 191, 179, 173C34H30O15tri-Caffeoylquinic acidtri-CQA-1
33677.153.318.21515, 353,179, 173C34H30O15tri-Caffeoylquinic acidtri-CQA-2
* Shaded squares indicates presence of metabolites.

