Article

Exploring Metabolic Signature of Protein Energy Wasting in Hemodialysis Patients

by
Fatin Athirah Pauzi
1,
Sharmela Sahathevan
2,
Ban-Hock Khor
3,
Sreelakshmi Sankara Narayanan
4,
Nor Fadhlina Zakaria
5,
Faridah Abas
6,
Tilakavati Karupaiah
4 and
Zulfitri Azuan Mat Daud
1,*
1
Department of Dietetics, Faculty of Medicine and Health Sciences, Universiti Putra Malaysia, Serdang 43400, Malaysia
2
Dietetics Program, School of Healthcare Sciences, Faculty of Health Sciences, Universiti Kebangsaan Malaysia, Kuala Lumpur 50300, Malaysia
3
Department of Medicine, Faculty of Medicine, Universiti Kebangsaan Malaysia, Cheras 56000, Wilayah Persekutuan Kuala Lumpur, Malaysia
4
School of BioScience, Taylor’s University, Subang Jaya 47500, Malaysia
5
Department of Medicine, Faculty of Medicine and Health Sciences, Universiti Putra Malaysia, Serdang 43400, Malaysia
6
Department of Food Science, Faculty of Food Science and Technology, Universiti Putra Malaysia, Serdang 43400, Malaysia
*
Author to whom correspondence should be addressed.
Metabolites 2020, 10(7), 291; https://doi.org/10.3390/metabo10070291
Submission received: 21 June 2020 / Revised: 7 July 2020 / Accepted: 14 July 2020 / Published: 16 July 2020

Abstract

:
End-stage renal disease patients undergoing maintenance hemodialysis (HD) are vulnerable to the protein energy wasting (PEW) syndrome. Identification and diagnosis of PEW relies on clinical processes of judgment dependent on fulfilling multiple criteria drawn from serum biochemistry, weight status, predictive muscle mass, dietary energy and protein intakes. Therefore, we sought to explore the biomarkers’ signature with plasma metabolites of PEW by using 1H-nuclear magnetic resonance for an untargeted metabolomics approach in the HD population, to understand metabolic alteration of PEW. In this case-controlled study, a total of 53 patients undergoing chronic HD were identified having PEW based on established diagnostic criteria and were age- and sex-matched with non-PEW (n = 53) HD patients. Fasting predialysis plasma samples were analyzed. Partial least square discriminant analysis demonstrated a significant separation between groups for specific metabolic pattern alterations. Further quantitative analysis showed that the level of 3-hydroxybutyrate, acetate, arabinose, maltose, ribose, sucrose and tartrate were significantly increased whilst creatinine was significantly decreased (all p < 0.05) in PEW subjects. Pathway analysis indicated that PEW-related metabolites reflected perturbations in fatty acid mechanism and induction of glyoxylate and dicarboxylate pathway attributed to gluconeogenesis. These results provide preliminary data in understanding metabolic alteration of PEW and corresponding abnormal metabolites that could potentially serve as biomarkers of PEW.

Graphical Abstract

1. Introduction

Protein energy wasting (PEW) syndrome is characterized by a persistent depletion of protein stores and energy fuels in the body, caused by multiple nutritional and metabolic alterations [1] arising from the accumulation of uremic solutes. The syndrome is common to patients with advanced chronic kidney disease (CKD) undergoing dialysis treatment [2]. This state of nutritional and metabolic perturbations among dialysis patients progressively degrades their quality of life and reduces the survival [3] attributed to increased risks for cardiovascular pathogenesis, infection, inflammation and hospitalization [4,5,6].
The term PEW as a uniform nomenclature was proposed by the International Society of Renal Nutrition and Metabolism (ISRNM 2008), after increasing research reported on pathophysiological mechanisms leading to the syndromes of muscle wasting, malnutrition and inflammation in CKD patients [3,7]. Accordingly, ISRNM proposed that PEW diagnosis concurs with three out of four proposed categories; low levels of biochemical indicators (i.e., albumin, transthyretin or cholesterol), decreased body mass (i.e., body mass index, unintentional weight loss and body fat percentage), reduced muscle mass (i.e., muscle wasting or sarcopenia and reduced mid-arm muscle circumference) and unintentional low dietary intake (i.e., energy and protein intake) [7]. The unifying concept of these diagnostic domains is an indirect assessment for body protein and energy depletion.
Identification of PEW thus far has relied on clinical judgment processes based on an extensive patient assessment. However, the application of the ISRNM diagnostic criteria to diverse hemodialysis (HD) populations is challenging [3], due to reliance on the indirect measurement of muscle mass using skinfold measurements and norms developed for Caucasian populations [8,9], as well as high prevalence of underreporting of dietary energy and protein intakes [10,11]. It is also noted that ‘serum chemistry’ biomarkers proposed within ISRNM diagnosis criteria are not sufficient or specific enough [12,13,14,15,16] to reflect and detect the PEW syndrome. Basically, the fundamental understanding of PEW in this uremic patient population remains unresolved as studies explaining the mechanistic pathways are scarce. Therefore, to counteract these issues relating to PEW diagnosis, a potential and comprehensive clinical approach that complements the ISRNM recommended criteria needs to be developed and established, particularly in elucidating mechanisms relating to net body protein losses [17].
In line with this need, we propose to use the cutting edge 1H-nuclear magnetic resonance (1H-NMR)-based metabolomics approach to facilitate identification of plasma metabolites related to the catabolism of muscle and fat tissues associated with facets of PEW development in HD patients. The metabolomics approach would facilitate the identification of a consistent, precise and reliable marker to improve the diagnosis of PEW. This unbiased quantitative method would detect abnormal metabolites related to PEW potential biomarkers, as well as clarify the underlying pathophysiological mechanism. The fact is, the metabolome represents the ultimate downstream products of cellular metabolism [18,19] and thus changes in metabolites should be the closest reflection of the phenotype [20] to elucidate the PEW mechanism [21].
Metabolomics via the NMR platform offers a simple sample preparation for a convenient but comprehensive analysis for the identification of metabolite biomarkers for the diagnosis of PEW. Importantly, no study pertaining to identification of PEW metabolites using the metabolomics approach has been published to date. Therefore, this study sought to identify biomarker signatures of PEW using the 1H-NMR based metabolomics approach to understand the metabolic alteration associated with PEW in maintenance HD patients.

2. Results

The demographic characteristics, clinical and biochemistry data of the study population are presented in Table 1. Patients are equally distributed between PEW and non-PEW (NPEW) groups based on the age, gender and ethnicity (all p > 0.05). On the other hand, the PEW group exhibited a significantly higher trend towards a longer time on dialysis (p = 0.041), but lower trends of creatinine (p < 0.001) and blood urea (p = 0.036) levels compared to the NPEW group. The PEW group also demonstrated heightened inflammatory responses with higher IL-6 values (p = 0.006), although high sensitivity C-reactive protein (hsCRP) levels between groups was not significant (p > 0.05). Insulinemic status as per plasma insulin levels and homeostasis model assessment index of insulin resistance (HOMA-IR) scores were both significantly lower (p < 0.001) for the PEW compared to the NPEW group.
In comparing the two groups based on the ISRNM-PEW criteria, the PEW group had significantly lower values for all nutritional indices (p < 0.05) except for total cholesterol (TC) and dietary protein intake (DPI) (Table 2).

2.1. Metabolic Profiles Separation between Groups Using Multivariate Data Analysis

1H-NMR spectra were obtained for all 106 samples and spectra profiles of plasma samples from hemodialysis patients with PEW and non-PEW (NPEW) are presented in Supplementary Materials Figure S1. An unsupervised principal component analysis (PCA) was performed to determine the possibility of discriminating HD patients presenting with and without PEW. The primary PCA-X score plot (Supplementary Materials Figure S2a) indicated that metabolomics profiles between the two groups were similar as evident by the scattered and random scores from both groups within the same without pattern discrimination. After excluding nine significant outliers from the analysis a new PCA-X model was developed (Supplementary Materials Figure S2b). A similar approach in excluding outliers has also been documented elsewhere [22]. Interestingly, from the overview, the score plot indicated some pattern of scores between the two groups despite perceptible overlaps.
Further analysis using supervised partial least square-discriminant analysis (PLS-DA) was performed to maximize the group separation and facilitate the detection of discriminating metabolites in PEW and NPEW patient samples. Figure 1 demonstrated that the PLS-DA score plot clearly showing distinct discrimination in plasma metabolites between PEW and NPEW groups along the principal component 2 (PC2) direction with the goodness of fit R2X(cum) = 0.342, R2Y(cum) = 0.426 and Q2(cum) = 0.222. This model was acceptable as the difference between R2Y(cum) and Q2(cum) was <0.3, indicating each sample was equally and uniformly contributing to the observed group separation [23]. The application of the PLS-DA model was validated with the use of permutation tests with 100 iterations. The resulting R2Y-intercept value that was less than 0.3–0.4 and the Q2Y-intercept value of <0.05 supported the PLS-DA model validity, as values larger than 0.05 indicated overfitting [24] in the original PLS-DA model (Supplementary Materials Figure S3a,b). Moreover, cross-validated analysis of variance (CV ANOVA) based on cross-validated predictive residuals indicated the level of significance of group separation in the model (Supplementary Table S1) resulted in a p value of <0.05 denoting a statistically significant model of PLS-DA [25]. The PLS-DA score plot provided a stronger clustering for the PEW group on the negative side of PC2, suggesting that the metabolic profiles had changed. Therefore, it can be inferred that the PEW syndrome induced specific metabolic pattern changes resulting in different profiles between groups. In addition to further identifying the metabolites responsible for the differences in metabolic profiles between PEW and non-PEW groups, the corresponding loading plot and variable importance in projection (VIP) statistics with a VIP score >1 were used.
Figure 2 shows that the most important NMR spectral regions (ppm) driving the observed group separation identified by the VIP plot (VIP > 1) were similar to those delineated by the PLS-DA loading plot, validating the consistency of the data. Hence, potential discriminating markers were acquired from the confluence of corresponding loading and VIP plots from PLS-DA, and markers were selected based on their contribution to the variation.

2.2. Metabolites Identification and Quantification

With the completion of the PLS-DA analysis, discriminating metabolites responsible for the differences in the metabolic profiles between the two groups were extracted. By comparing to the database provided in Chenomx NMR Suite software, a total of 32 metabolites causing the distinct separation were identified and quantified, with 18 metabolites belonging to the PEW group and 14 metabolites representing the NPEW group (Supplementary Materials Table S2). After quantification of each metabolite, values were subjected to the Mann–Whitney U analysis. We identified a few metabolites that were significantly increased (p < 0.05) in PEW patients as compared to NPEW patients including 3-hydroxybutyrate (p < 0.001), acetate (p = 0.027), arabinose (p = 0.029), maltose (p = 0.021), ribose (p = 0.041), sucrose (p = 0.008) and tartrate (p = 0.018). In contrast, creatinine (p < 0.001) was the only metabolite that showed a significantly lower plasma concentration in PEW patients compared to NPEW patients (Table 3). Hence, it can be concluded that the group differentiation between the PEW and NPEW groups was highly affected by these metabolites.

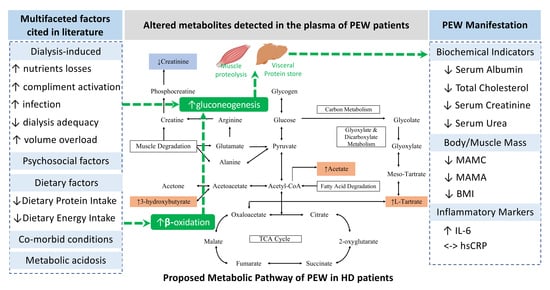
2.3. Metabolic Pathway Analysis

In order to gain insight on the metabolic mechanism of PEW, the Kyoto Encyclopedia of Genes and Genomes (KEGG) database were referenced to identify metabolic network(s) and biological relevance of the significant metabolite changes in PEW patients. The significant pathways identified by KEGG were fatty acid β-oxidation and gluconeogenesis. However, other metabolic pathways such as glyoxylate and dicarboxylate metabolism and carbon metabolism were also implicated (Figure 3). It may be postulated that these target pathways showed either marked perturbations or activation in response to the PEW syndromes in Malaysian HD patients.

2.4. Analysis of Covariance (ANCOVA)

Additionally, a one-way analysis of covariance (ANCOVA) was also performed to identify significant discriminating metabolites between the two groups after adjustment for covariates of age and dialysis vintage. Results indicated that specific metabolites 3-hydroxybutyrate, acetate and creatinine were significantly different (p < 0.05) between the groups, even after adjustment for these covariates (Supplementary Materials Table S3). Interestingly, arabinose, maltose, ribose, sucrose and tartrate were not significantly different between groups after controlling for the covariates although unadjusted means denoted otherwise. This indicated that these covariates had no contribution on the separation of the groups. Subsequent two-way ANCOVA whilst controlling the age and dialysis vintage indicated there was no statistically significant two-way interaction effect (p > 0.05) between the group and gender, implying that the effect of group differentiation was not driven by this factor.

3. Discussion

The present study, to the best of our knowledge, is the first to report on key differences in metabolic profiles between PEW and NPEW subjects. To begin with, HD patients in both PEW and NPEW groups had comparable demographics and clinical parameters distribution suggesting minimal confounders. The PEW group exhibited the expected derangement in nutritional outcomes based on the ISRNM diagnostic criteria that include lower serum albumin, BMI, mid-arm muscle circumference (MAMC), mid-arm muscle area (MAMA) and dietary energy intake (DEI). Some other parameters including serum creatinine and urea are also lower when compared to their counterpart suggesting more progressive muscle wasting [26], and in fact are associated with poor survival in several studies [26,27]. The PEW group had relatively longer duration on dialysis treatment (dialysis vintage) while exhibiting a higher inflammatory marker (IL-6), in line with other studies, that reported progressive decline in nutritional parameters following the commencement of dialysis treatment [28] and progressive increase in proinflammatory cytokines [29].
In this study, metabolomic analysis showed a significant separation of the metabolites profile in PLS-DA with a stronger clustering for the PEW group on the negative side of PC2 but on the positive side for the NPEW group. This suggests that the PEW syndrome induced that a specific metabolite pattern alteration resulted in different profiles between the groups. As metabolomics identifies and quantifies various groups of endogenous metabolites [30], metabolic profiling of these two patient groups provides an instant view of altered metabolism present in the PEW group and variables responsible for the group differentiation. Quantitative analysis on discriminating metabolites revealed a statistically significant elevation of 3-hydroxybutyrate, acetate, arabinose, maltose, ribose, sucrose and tartrate with a concurrent decrease in creatinine concentration of PEW patients. There is no comparable study that utilized the metabolomics platform to elucidate the PEW mechanism in the HD population, however, prior studies have been able to identify potential early biomarkers of CKD such as trimethylamine N-oxide, kynurenine and citrulline [31,32], indicating abrupt amino acids metabolism in CKD.
Metabolic pathway identification revealed that the PEW condition indicated systemic perturbations of fatty acid metabolism as well as inducing the glyoxylate and dicarboxylate metabolism attributed to gluconeogenesis. This is based on the following postulation: chronic suboptimal intake of the dietary protein and energy as evidenced in PEW patients will promote gluconeogenesis, which mobilizes fatty acids and amino acids from adipose tissue and muscle respectively [33,34]. On top of this, as a direct consequence of the kidneys’ role in regulating the endocrine function, kidney disease per se is implicated in causing abnormalities in the excretion, synthesis and action of many hormones. These include resistance to insulin, growth hormone and insulin-like growth factor, which ultimately lead to a loss of muscle mass in adult CKD patients [1]. In fact, a targeted metabolomic profiling among CKD patients subjected to hyperinsulinemic-euglycemic insulin clamp revealed that CKD was associated with disruption in amino acid metabolism and mitochondrial function that impaired anabolic effects on insulin contributing to PEW and muscle atrophy [35].
It is interesting however to observe that the PEW group in our study had lower insulinemic status (plasma insulin levels and HOMA-IR scores) when compared to the NPEW group. We postulated that this could be due to suboptimal food intake leading to overall reduction in insulin secretion [34]. In order to maintain a continuous source of energy in the patients’ body with hepatic glycogen depletion, gluconeogenesis and fatty acid oxidation becomes increasingly important to supply sufficient essential water-soluble substrates to the brain and other tissues [33,36,37].
In the current study, the level of serum creatinine (SCr) was significantly lower (p < 0.001) in PEW patients. About 95% of the creatinine is found in the muscle [38] as a product of muscle metabolism through the breakdown of creatine and phosphocreatine. It appears the loss of muscle mass is the most valid criterion for the presence of PEW [39,40]. Park et al. [26] suggests low SCr level could be considered as a proxy of protein-energy wasting in some clinical situations. Therefore, low creatinine levels in the PEW group may result from the persistent activation of the gluconeogenesis pathway fueled by amino acids released from the muscle tissue degradations [41].
We also found significant elevation of the metabolites β-hydroxybutyrate (p < 0.001) and acetate (p < 0.05), which are implicated in the fatty acid β-oxidation pathway in patients with PEW. Gluconeogenesis is also fuelled by rapid lipolysis and release of fatty acids from adipose tissue [36]. Fatty acids are converted to CoA thioesters through the β-oxidation process that occurred in the mitochondria. These reactions upregulate acetyl CoA production, but much of the acetyl CoA cannot enter the citric acid cycle as gluconeogenesis reduces the availability of oxaloacetate to generate glucose. As a result, excess acetyl CoA is converted to ketone bodies through the ketogenesis pathway in order to generate energy. With formation of acetoacetyl-CoA from acetyl-CoA, accumulations of both compounds generate HMG-CoA, which cleaves to yield acetoacetate, which is then reduced to β-hydroxybutyrate. Eventually the liver produces ketone bodies copiously as the citric acid cycle fails to oxidize acetyl units generated from fatty acids degradation [36,37]. A significant increase of β-hydroxybutyrate in this study thus suggests PEW triggered perturbations in fatty acid β-oxidation pathway leads to ketogenesis. Excessive ketone bodies formation indicated a switch to severe starvation [1,34,42] leading to hypoalbuminemia and muscle wasting that are apparent in the PEW group. The presence of acid and ketone bodies are paramount in making protein loss from muscle greater than from other organs [1], interfering in normal cellular functioning [43] and inducing oxidative stress [44]. Altogether, this partly explained the accelerated muscle loss, hypoalbuminemia and heightened inflammation present in the PEW group.
Additionally, the accumulation of acetyl-CoA leads to elevated levels of plasma acetate, which is observed in PEW patients. High acetate levels may also indicate a disturbance in the fatty acid β-oxidation pathway, particularly from the action of heart mitochondria. Unlike liver mitochondria, heart mitochondria do not form acetoacetate [45]. Hence, an increase in acetyl-CoA formation from pyruvate leads to the release of acetate especially under conditions where the citric acid cycle is inhibited [46,47]. Acetyl-CoA hydrolase in heart mitochondria are induced to form acetate and thus relieve ‘acetyl pressure’ [48,49]. Circulating acetate serves to redistribute oxidizable substrate similar to ketone bodies. Moreover, another in vivo study has shown that acetate utilization relies on the availability of glucose [50]. Hence, the substantial rise in the concentration of blood acetate may relate to impaired glucose entry into the muscle of the diabetic animal, which eventually limits acetate utilization [50].
An important observation from our study is that the level of tartrate was significantly increased (p < 0.05) in PEW patients, although after adjustment with covariates this significance disappeared. Tartrate accumulation in PEW subjects may be ascribed to the endogenous production from either bacterial degradation in the gut or via tissue metabolism or from exogenous substrates such as medicine and food [51,52]. Interestingly, the endogenous increase in tartrate suggests activation of glyoxylate and dicarboxylate metabolism that occur with gluconeogenesis in PEW patients. Butch et al. [53] have shown that meso- and DL-tartrates can be produced from glyoxylate with a reduction of dihydroxyfumarate as a putative intermediate. Our metabolomics analysis also revealed a significant increase (p < 0.05) in the arabinose, maltose, ribose and sucrose concentrations in patients with PEW compared to NPEW patients, although after an adjustment with covariates this significance disappeared. The implication of this finding is unknown although it has been shown that longer dialysis vintage is related with unfavorable changes in the nutritional status of HD patients [54], which may alter the generation of metabolites.
In response to suboptimal intakes of dietary protein and energy associated with the PEW condition, the body will promote gluconeogenesis and fatty acid oxidation to supply energy. This would affect the level of specific metabolites involved in the mechanisms. We found significant differences (p < 0.05) in the levels of 3-hydroxybutyrate, acetate, tartrate and creatinine to discriminate PEW from NPEW patients, clearly indicating there were aberrations in fatty acid metabolism and evidence for the presence of the gluconeogenesis pathway. Whereas NPEW patients who did not experience a persistent loss of protein and energy stores in their body demonstrated significantly opposite trends (all p < 0.05) for these metabolites indicating that utilization of fatty acids and amino acids as the primary energy-yielding fuel was non-essential. As this is a hypothesis generating study with no baseline data on the PEW syndrome, these discriminating metabolites between PEW and NPEW patients could potentially serve as biomarkers of PEW in HD patients.
Altogether, we demonstrated that metabolomics is a powerful tool not only for identifying biomarkers related to the metabolic signature of PEW, but further elucidates the metabolic abnormalities related to PEW. As this is the first study to adopt the metabolomics approach to examine differences in PEW and non-PEW patients on HD, future studies using a targeted approach would be critical in identifying therapeutic approaches that would change the metabolites linked to gluconeogenesis prevalent in PEW patients.
The design of this study is susceptible to selection bias because this is a case-controlled study. Hence, a larger cross-sectional population sampling is required as an important step forward from this current study. Moreover, despite rapid and simple sample preparation for a convenient but comprehensive analysis, NMR spectrometry has a weak point of lower sensitivity [18] compared to mass spectrometry. Hence, study using another metabolomics platform such as the mass spectrometry-based metabolomics technique is required to validate the discriminating metabolites involved in PEW.

4. Materials and Methods

This study received ethical approval from the Medical Research Ethical Committee of the Ministry of Health (NMRR-15-865-2560). All patients provided written informed consent.

4.1. Subject Selection and Grouping

This was a case-control study based on a subset of data collected for the multicenter Hemodialysis Nutrition Study (HDiNS). The inclusion criteria of the HDiNS study were HD patients above 18 years old, dialyzed for at least 3 months and willing to provide fasting blood samples. Patients with poor adherence to the HD regime, cognitive impairment or terminal illness were excluded. The ISRNM criteria [7] were used for the diagnosis of PEW. Briefly, patients were assessed for low serum levels of albumin, reduced body weight, decreased muscle mass and unintentional low energy and protein intakes and were diagnosed as PEW when three out of four proposed categories are present. A total of 53 HD patients were identified as PEW. A non-PEW patient (control) was individually matched to each PEW patient (case) by age and sex. Therefore, plasma samples for a total of 106 patients were used to statistically discriminate metabolite profiles between PEW (n = 53) and non-PEW (n = 53) HD patients.

4.2. Plasma Samples Collection and Biochemical Analysis

Typically, pre-dialysis blood samples were collected from patients after 8–10 h fasting through their dialysis access site during a mid-week dialysis session. Then plasma was isolated by centrifugation and divided into aliquots. For this case-control study, a total volume of 0.5 mL of plasma aliquot collected in heparin tubes was reserved for metabolomics analysis, as other anti-coagulants such as EDTA and citrate or other added stabilizers give additional signals in the NMR spectra [55]. Samples were snapped frozen with liquid nitrogen before storage at −80 °C until further analysis.
Serum urea and creatinine data was obtained from patients’ medical records. Additionally, the serum high-sensitivity C-reactive protein (hsCRP) was measured by an immunoturbidimetric assay and serum insulin by the electrochemiluminescence assay method by an independent laboratory using automated clinical chemistry (Roche/Hitachi 912 System, Roche Diagnostics, Tokyo, Japan). IL-6 concentrations were measured in-house by the sandwich enzyme-linked immunosorbent assay (ELISA) method using a commercial kit, IL-6 High Sensitivity Human Elisa Kit (Abcam, Cambridge, MA, USA). HOMA-IR was calculated using both serum glucose and serum insulin levels using the following equation [56]:
HOMA-IR = [Serum glucose (mmol/L) × fasting insulin (mU/L)]/22.5,

4.3. Sample Preparation for Metabolite Profiling

Upon thawing of frozen samples, a total of 500 μL plasma were vortexed for a minute followed by a centrifugation at 10,000 rpm for 2 min in order to remove solid debris. Plasma supernatant (400 μL) was then transferred into a 0.5 mL 3 kDa centrifugal filter (Merck, Darmstadt, Germany) to remove macromolecules such as proteins, lipids, lipoproteins and the protein-bound form of molecules [57] and spun for 30 min at room temperature for 13,800 rpm. The filters were initially prewashed three times with deionized water to remove glycerol preservative [58]. The filters were inverted and centrifuged at 13,800 rpm for 5 min to remove any remaining water. The ‘filtrates’ were subsequently transferred into fresh 1.5 mL Eppendorf tubes and diluted with phosphate buffer (KH2PO4) prepared in deuterium oxide (D2O) containing 0.2% trimethylsilyl propanoic acid (TSP, Merck, Darmstadt, Germany) and 0.1% imidazole (Sigma-Aldrich, St. Louis, MO, USA) in 1:2 ratio (200 μL filtrate + 400 μL D2O). A total of 600 μL of prepared samples were then transferred to 5 mm NMR tubes.

4.4. 1H-NMR Analysis

NMR analysis method was adapted and optimized from Maulidiani et al. [59]. Briefly, one dimensional 1H-NMR spectra were acquired at 499.887 MHz on a 500 MHz Varian INOVA NMR (Varian Inc., Palo Alto, CA, USA) at a temperature of 26 °C. Water signals and broad protein resonances were suppressed by the combination of PRESAT and the Carr–Purcell–Meiboom–Gill (CPMG) pulse sequence. NMR spectra of 10 ppm spectral width were obtained from a total of 128 scans and an acquisition time of 536 s. NMR spectra were then processed with Chenomx NMR suite version 8.3 software (Chenomx Inc. Edmonton, AB, Canada) by applying a consistent setting for all sample spectra; 0.50 Hz of line broadening, autophasing, baseline-corrected (Whittaker spline), referenced to TSP as an internal standard and referenced to imidazole as a pH indicator. Intelligent binning was used to divide the spectral region from 0.50 to 10.00 ppm into equal bins (0.04 ppm). The peak ppm values were calibrated with reference to the TSP signal at 0 ppm. Prior to the analysis, the region of spectra associated with residual water (4.77–4.86 ppm) and imidazole (7.29–7.33 ppm and 8.24–8.32 ppm) were removed. Subsequently, the respective spectra data were converted into a table of common integrals containing a non-negative value for multivariate data analysis.

4.5. Multivariate Data Analysis

Multivariate data analysis of the processed spectra was performed using SIMCA-P software version 14.1 (MKS Umetrics, Umea, Sweden). Firstly, data were mean-centered, and Pareto scaled by dividing each variable by the square root of its standard deviation. Principal component analysis (PCA) and partial least square-discriminant analysis (PLS-DA) were used to analyze the spectra data. PCA is an unsupervised statistical analysis used to display the dominating trends of clustering inherent in the data set as well as the outliers [23]. A regression extension of PCA, a PLS analysis, with a focus on maximum separation (PLS-DA) instead of maximum variation was also used [24,25]. Supervised analysis statistics PLS-DA maximized the class discrimination based on X and Y variables with the group identity defined. Hotelling’s T2, which represent multivariate generalization of the 95% confidence interval, was used to identify the outliers defined as any data point falling outside of the eclipse [24]. To test for validity, a permutation test (100 cycle) and ANOVA of cross-validated residuals (CVANOVA) [60,61] were conducted with the PLS-DA model. Loading plots combined with variable importance in the projection (VIP) values of >1 [60] were used to determine the potential biomarkers in PLS-DA.

4.6. Metabolites Identification, Quantification and Pathway Analysis

Chenomx NMR suite version 8.3 software (Chemomx Inc, Edmonton, AB, Canada) was used to identify and quantify metabolites. Based on multivariate data analysis, parts of the spectra (ppm) responsible for the difference between groups were identified using Chenomx software by matching the corresponding peak based on the position, intensity and line-width with the 500 MHz metabolites library available from the software. The area under the peak corresponded to the relative concentration of the metabolites. Once the changes in metabolite concentrations had been determined, the metabolic pathway identification was then performed based on the Kyoto Encyclopedia of Genes and Genomes database [62].

4.7. Statistical Analyses

Normality of the data was checked prior to data analysis. Data that was not normally distributed was log transformed. The SPSS statistical software (IBM, Chicago, IL, USA) was used for statistical analysis with a p value of <0.05 considered to be significant. Data for categorical variables were reported as number and percentage values, while continuous data were reported as mean ± SD. An independent t-test was performed to analyze continuous data whilst Chi-square (χ2) statistics was used to evaluate differences between categorical variables. A one-way ANCOVA with the Bonferroni post-hoc test was performed to determine any significance between the groups for the identified metabolites when adjusted for covariates.

5. Conclusions

In summary, the metabolomics analysis revealed that the plasma metabolic profiles of PEW subjects were altered in response to the syndrome that distinguished PEW from the NPEW group. Significant differences in the levels of 3-hydroxybutyrate, acetate, tartrate and creatinine were clearly ascribed to the presence of PEW, indicating there were aberrations in fatty acid metabolism and the presence of the gluconeogenesis pathway. Overall, these metabolites can be considered as the potential biomarker signature of PEW in HD patients. Although the results need further validation, this study demonstrated the metabolomics approach has the potential to develop a diagnostic tool for PEW syndrome.

Supplementary Materials

The following are available online at https://www.mdpi.com/2218-1989/10/7/291/s1, Figure S1: Representative of 1H-NMR CPMG spectra of plasma samples obtained from PEW subjects (a) and NPEW subjects (b), Figure S2: (a) PCA-X score plot for NMR spectra acquired from plasma samples of PEW and non-PEW HD patients, (b) PCA-X score plot with 9 outliers removed for NMR spectra acquired from plasma samples of PEW and non-PEW HD patients, Figure S3: Permutation test for validation of PLS-DA model for (a) PEW groups R2Y (0.0, 0.25), Q2Y (0.0, −0.11) and (b) NPEW groups R2Y (0.0, 0.24), Q2Y (0.0, −0.12), Table S1: ANOVA for cross validated residuals (CV ANOVA) of PLS-DA model discriminating PEW and NPEW groups, Table S2: Comparison on the mean concentration of discriminating metabolites identified from plasma samples of PEW and non-PEW HD patients, Table S3: Analysis of Covariance (ANCOVA) between selected independent variables on significant metabolites with controlled covariates.

Author Contributions

Conceptualization, Z.A.M.D., T.K. and S.S.; methodology, F.A.P., Z.A.M.D., N.F.Z., F.A.; data collection, S.S., B.-H.K.; sample preparation for NMR, F.A., S.S.N., S.S.; sample analysis, F.A.P., F.A.; resources, Z.A.M.D.; data curation, F.A.P., F.A.; writing—original draft preparation, F.A.P.; writing—review and editing, Z.A.M.D., T.K., S.S., B.-H.K., S.S.N., N.F.Z., F.A.; project administration and funding acquisition, Z.A.M.D. All authors have read and agreed to the published version of the manuscript.

Funding

This research was supported by the Ministry of Education Malaysia through Fundamental Research Grant Scheme (FRGS/1/2016/SKK06/UPM/02/4:5524914), and partly supported by National Kidney Foundation Malaysia (NKF 1001/ADM/753) (for HOMA-IR and Insulin analysis). F.A.P., B.-H.K. and S.S. were graduate students supported by the graduate research fellowship of the Universiti Putra Malaysia, scholarship from Universiti Kebangsaan Malaysia (Zamalah Yayasan Cancelor) and scholarship from Ministry of Higher Education Malaysia (MyBrain15), respectively.

Acknowledgments

The authors acknowledged the Institute of Bioscience, UPM for the access to 1HNMR and acknowledged all the staff and HD clinics involved in this project. We also thank Arvind Goja and Lim Jun-Hao for the technical assistance.

Conflicts of Interest

The authors declare no conflict of interest. The funders had no role in the design of the study; in the collection, analyses or interpretation of data; in the writing of the manuscript, or in the decision to publish the results.

References

  1. Carrero, J.J.; Stenvinkel, P.; Cuppari, L.; Ikizler, T.A.; Kalantar-Zadeh, K.; Kaysen, G.; Mitch, W.E.; Price, S.R.; Wanner, C.; Wang, A.Y.M.; et al. Etiology of the Protein-Energy Wasting Syndrome in Chronic Kidney Disease: A Consensus Statement From the International Society of Renal Nutrition and Metabolism (ISRNM). J. Ren. Nutr. 2013, 23, 77–90. [Google Scholar] [CrossRef] [PubMed] [Green Version]
  2. Obi, Y.; Qader, H.; Kovesdy, C.P.; Kalantar-Zadeh, K. Latest Consensus and Update on Protein Energy-Wasting in Chronic Kidney Disease. Curr. Opin. Clin. Nutr. Metab. Care 2015, 18, 254–262. [Google Scholar] [CrossRef] [PubMed]
  3. Gracia-Iguacel, C.; González-Parra, E.; Barril-Cuadrado, G.; Sánchez, R.; Egido, J.; Ortiz-Arduán, A.; Carrero, J.J. Defining protein-energy wasting syndrome in chronic kidney disease: Prevalence and clinical implications. Nefrologia 2014, 34, 507–519. [Google Scholar] [CrossRef] [PubMed]
  4. Lopes, A.A.; Bragg-Gresham, J.L.; Elder, S.J.; Ginsberg, N.; Goodkin, D.A.; Pifer, T.; Lameire, N.; Marshall, M.R.; Asano, Y.; Akizawa, T. Independent and joint associations of nutritional status indicators with mortality risk among chronic hemodialysis patients in the Dialysis Outcomes and Practice Patterns Study (DOPPS). J. Ren. Nutr. 2010, 20, 224–234. [Google Scholar] [CrossRef]
  5. Dong, J.; Li, Y.; Xu, Y.; Xu, R. Daily protein intake and survival in patients on peritoneal dialysis. Nephrol. Dial. Transplant. 2011, 26, 3715–3721. [Google Scholar] [CrossRef] [Green Version]
  6. Chmielewski, M.; Carrero, J.J.; Qureshi, A.R.; Axelsson, J.; Heimbürger, O.; Berglund, L.; Barany, P.; Rutkowski, B.; Lindholm, B.; Stenvinkel, P. Temporal discrepancies in the association between the apoB/apoA-I ratio and mortality in incident dialysis patients. J. Intern. Med. 2009, 265, 708–716. [Google Scholar] [CrossRef]
  7. Fouque, D.; Kalantar-Zadeh, K.; Kopple, J.; Cano, N.; Chauveau, P.; Cuppari, L.; Franch, H.; Guarnieri, G.; Ikizler, T.A.; Kaysen, G.; et al. A proposed nomenclature and diagnostic criteria for protein–energy wasting in acute and chronic kidney disease. Kidney Int. 2008, 73, 391–398. [Google Scholar] [CrossRef] [Green Version]
  8. Frisancho, A.R. New norms of upper limb fat and muscle areas for assessment of nutritional status. Am. J. Clin. Nutr. 1981, 34, 2540–2545. [Google Scholar] [CrossRef]
  9. Imboden, M.T.; Swartz, A.M.; Finch, H.W.; Harber, M.P.; Kaminsky, L.A. Reference standards for lean mass measures using GE dual energy x-ray absorptiometry in Caucasian adults. PLoS ONE 2017, 12, e0176161. [Google Scholar] [CrossRef]
  10. Shapiro, B.B.; Bross, R.; Morrison, G.; Kalantar-Zadeh, K.; Kopple, J.D. Self-Reported Interview-Assisted Diet Records Underreport Energy Intake in Maintenance Hemodialysis Patients. J. Ren. Nutr. 2015, 25, 357–363. [Google Scholar] [CrossRef] [Green Version]
  11. Vaz, I.M.F.; Freitas, A.T.V.d.S.; Peixoto, M.d.R.G.; Ferraz, S.F.; Campos, M.I.V.A.M. Is energy intake underreported in hemodialysis patients? Braz. J. Nephrol. 2015, 37, 359–366. [Google Scholar] [CrossRef] [PubMed]
  12. Chung, S.; Koh, E.S.; Shin, S.J.; Park, C.W. Malnutrition in patients with chronic kidney disease. Open J. Intern. Med. 2012, 2, 89–99. [Google Scholar] [CrossRef] [Green Version]
  13. Bharadwaj, S.; Ginoya, S.; Tandon, P.; Gohel, T.D.; Guirguis, J.; Vallabh, H.; Jevenn, A.; Hanouneh, I. Malnutrition: Laboratory markers vs nutritional assessment. Gastroenterol. Rep. 2016, 4, 272–280. [Google Scholar] [CrossRef] [PubMed] [Green Version]
  14. Stenvinkel, P.; Barany, P.; Chung, S.H.; Lindholm, B.; Heimbürger, O. A comparative analysis of nutritional parameters as predictors of outcome in male and female ESRD patients. Nephrol. Dial. Transplant. 2002, 17, 1266–1274. [Google Scholar] [CrossRef]
  15. Struijk, D.G.; Krediet, R.T.; Koomen, G.C.; Boeschoten, E.W.; Arisz, L. The effect of serum albumin at the start of continuous ambulatory peritoneal dialysis treatment on patient survival. Perit. Dial. Int. 1994, 14, 121–126. [Google Scholar] [CrossRef]
  16. Gama-Axelsson, T.; Heimbürger, O.; Stenvinkel, P.; Bárány, P.; Lindholm, B.; Qureshi, A.R. Serum albumin as predictor of nutritional status in patients with ESRD. Clin. J. Am. Soc. Nephrol. 2012, 7, 1446–1453. [Google Scholar] [CrossRef]
  17. Zha, Y.; Qian, Q. Protein Nutrition and Malnutrition in CKD and ESRD. Nutrients 2017, 9, 208. [Google Scholar] [CrossRef]
  18. Lajis, N.; Maulidiani, M.; Abas, F.; Ismail, I.S. Metabolomics Approach in Pharmacognosy. Pharmacognosy 2017, 597–616. [Google Scholar] [CrossRef]
  19. Urbanczyk-Wochniak, E.; Luedemann, A.; Kopka, J.; Selbig, J.; Roessner-Tunali, U.; Willmitzer, L.; Fernie, A.R. Parallel analysis of transcript and metabolic profiles: A new approach in systems biology. EMBO Rep. 2003, 4, 989–993. [Google Scholar] [CrossRef] [Green Version]
  20. Horgan, R.P.; Kenny, L.C. Omic technologies: Proteomics and metabolomics. Obstet. Gynaecol. 2011, 13, 189–195. [Google Scholar] [CrossRef]
  21. Wang, H.; Liu, A.; Zhao, W.; Zhao, H.; Gong, L.; Chen, E.; Cui, N.; Ji, X.; Wang, S.; Jiang, H. Metabolomics Research Reveals the Mechanism of Action of Astragalus Polysaccharide in Rats with Digestive System Disorders. Molecules 2018, 23, 3333. [Google Scholar] [CrossRef] [PubMed] [Green Version]
  22. Shommu, N.S.; Jenne, C.N.; Blackwood, J.; Joffe, A.R.; Martin, D.A.; Thompson, G.C.; Vogel, H.J. Metabolomic and inflammatory mediator based biomarker profiling as a potential novel method to aid pediatric appendicitis identification. PLoS ONE 2018, 13, 1–13. [Google Scholar] [CrossRef] [PubMed]
  23. Wheelock, Å.M.; Wheelock, C.E. Trials and tribulations of ’omics data analysis: Assessing quality of SIMCA-based multivariate models using examples from pulmonary medicine. Mol. Biosyst. 2013, 9, 2589–2596. [Google Scholar] [CrossRef] [PubMed] [Green Version]
  24. Eriksson, L.; Johansson, E.; Kettaneh-Wold, N.; Trygg, J.; Wikstrom, C.; Wold, S. Multi- and Megavariate Data Analysis. Part I Basic Principles and Applications, 2nd ed.; MKS Umetrics AB: Umea, Sweden, 2006. [Google Scholar]
  25. Eriksson, L.; Trygg, J.; Wold, S. CV-ANOVA for significance testing of PLS and OPLS® models. J. Chemom. 2008, 22, 594–600. [Google Scholar] [CrossRef]
  26. Park, J.; Mehrotra, R.; Rhee, C.M.; Molnar, M.Z.; Lukowsky, L.R.; Patel, S.S.; Nissenson, A.R.; Kopple, J.D.; Kovesdy, C.P.; Kalantar-Zadeh, K. Serum creatinine level, a surrogate of muscle mass, predicts mortality in peritoneal dialysis patients. Nephrol. Dial. Transplant. 2013, 28, 2146–2155. [Google Scholar] [CrossRef] [PubMed] [Green Version]
  27. Kalantar-Zadeh, K.; Streja, E.; Molnar, M.Z.; Lukowsky, L.R.; Krishnan, M.; Kovesdy, C.P.; Greenland, S. Mortality prediction by surrogates of body composition: An examination of the obesity paradox in hemodialysis patients using composite ranking score analysis. Am. J. Epidemiol. 2012, 175, 793–803. [Google Scholar] [CrossRef] [Green Version]
  28. Su, C.-T.; Yabes, J.; Pike, F.; Weiner, D.E.; Beddhu, S.; Burrowes, J.D.; Rocco, M.V.; Unruh, M.L. Changes in Anthropometry and Mortality in Maintenance Hemodialysis Patients in the HEMO Study. Am. J. Kidney Dis. 2013, 62, 1141–1150. [Google Scholar] [CrossRef]
  29. den Hoedt, C.H.; Bots, M.L.; Grooteman, M.P.C.; van der Weerd, N.C.; Penne, E.L.; Mazairac, A.H.A.; Levesque, R.; Blankestijn, P.J.; Nubé, M.J.; ter Wee, P.M.; et al. Clinical predictors of decline in nutritional parameters over time in ESRD. Clin. J. Am. Soc. Nephrol. 2014, 9, 318–325. [Google Scholar] [CrossRef] [Green Version]
  30. Lee, K.M.; Jeon, J.Y.; Lee, B.J.; Lee, H.; Choi, H.K. Application of metabolomics to quality control of natural product derived medicines. Biomol. Ther. 2017, 25, 559–568. [Google Scholar] [CrossRef] [Green Version]
  31. Cañadas-Garre, M.; Anderson, K.; McGoldrick, J.; Maxwell, A.P.; McKnight, A.J. Proteomic and metabolomic approaches in the search for biomarkers in chronic kidney disease. J. Proteomics 2019, 193, 93–122. [Google Scholar] [CrossRef] [Green Version]
  32. Jia, L.; Chen, J.; Yin, P.; Lu, X.; Xu, G. Serum metabonomics study of chronic renal failure by ultra performance liquid chromatography coupled with Q-TOF mass spectrometry. Metabolomics 2008, 4, 183–189. [Google Scholar] [CrossRef]
  33. Emery, P.W. Metabolic changes in malnutrition. Eye 2005, 19, 1029. [Google Scholar] [CrossRef] [PubMed]
  34. Shetty, P.S. Adaptation to low energy intakes: The responses and limits to low intakes in infants, children and adults. Eur. J. Clin. Nutr. 1999, 53, s14–s33. [Google Scholar] [CrossRef] [Green Version]
  35. Roshanravan, B.; Zelnick, L.R.; Djucovic, D.; Gu, H.; Alvarez, J.A.; Ziegler, T.R.; Gamboa, J.L.; Utzschneider, K.; Kestenbaum, B.; Himmelfarb, J.; et al. Chronic kidney disease attenuates the plasma metabolome response to insulin. JCI Insight 2018, 3, e122219. [Google Scholar] [CrossRef] [PubMed]
  36. Bhagavan, N.V. Medical Biochemistry, 4th ed.; Academic Press: San Diego, CA, USA, 2002; pp. 485–519. [Google Scholar]
  37. Berg, J.M.; Tymoczko, J.L.; Stryer, L. (Eds.) Food intake and starvation induce metabolic changes. In Biochemistry; W.H. Freeman: New York, NY, USA, 2002. [Google Scholar]
  38. Andrews, R.; Greenhaff, P.; Curtis, S.; Perry, A.; Cowley, A.J. The effect of dietary creatine supplementation on skeletal muscle metabolism in congestive heart failure. Eur. Heart J. 1998, 19, 617–622. [Google Scholar] [CrossRef] [PubMed] [Green Version]
  39. Kaysen, G.A. Diabetes, a cause of progressive sarcopenia in dialysis patients? Kidney Int. 2005, 68, 2396–2397. [Google Scholar] [CrossRef] [PubMed] [Green Version]
  40. Axelsson, J.; Qureshi, A.R.; Divino-Filho, J.C.; Bárány, P.; Heimbürger, O.; Lindholm, B.; Stenvinkel, P. Are insulin-like growth factor and its binding proteins 1 and 3 clinically useful as markers of malnutrition, sarcopenia and inflammation in end-stage renal disease? Eur. J. Clin. Nutr. 2006, 60, 718. [Google Scholar] [CrossRef] [Green Version]
  41. Gordon, A. Biochemistry of Hypoglycin and Toxic Hypoglycemic Syndrome. In Food Safety and Quality Systems in Developing Countries; Gordon, A., Ed.; Academic Press: San Diego, CA, USA, 2015; pp. 47–61. [Google Scholar]
  42. Finn, P.F.; Dice, J.F. Proteolytic and lipolytic responses to starvation. Nutrition 2006, 22, 830–844. [Google Scholar] [CrossRef] [PubMed]
  43. Kanikarla-Marie, P.; Jain, S.K. Hyperketonemia and ketosis increase the risk of complications in type 1 diabetes. Free Radic. Biol. Med. 2016, 95, 268–277. [Google Scholar] [CrossRef] [Green Version]
  44. Rhyu, H.-S.; Cho, S.-Y.; Roh, H.-T. The effects of ketogenic diet on oxidative stress and antioxidative capacity markers of Taekwondo athletes. J. Exerc. Rehabil. 2014, 10, 362–366. [Google Scholar] [CrossRef]
  45. Knowles, S.; Jarrett, I.; Filsell, O.; Ballard, F. Production and utilization of acetate in mammals. Biochem. J. 1974, 142, 401–411. [Google Scholar] [CrossRef] [PubMed]
  46. Davis, E.J. On the nature of malonate-insensitive oxidation of pyruvate and glutamate by heart sarcosomes. Biochim. Biophys. Acta Bioenerg. 1968, 162, 1–10. [Google Scholar] [CrossRef]
  47. Von Korff, R.W. Substrate Transformations dependent on Respiratory States of Mitochondria: Changes in Metabolic Control Sites of Rabbit Heart Mitochondria. Nature 1967, 214, 20–23. [Google Scholar] [CrossRef] [PubMed]
  48. Pearson, D.J.; Tubbs, P.K. Carnitine and derivatives in rat tissues. Biochem. J. 1967, 105, 953–963. [Google Scholar] [CrossRef] [Green Version]
  49. Snoswell, A.M.; Koundakjian, P.P. Relationships between carnitine and coenzyme A esters in tissues of normal and alloxan-diabetic sheep. Biochem. J. 1972, 127, 133–141. [Google Scholar] [CrossRef] [PubMed] [Green Version]
  50. Jarrett, I.G.; Filsell, O.H.; Ballard, F.J. Metabolic and endocrine interrelationships in normal and diabetic sheep. Horm. Metab. Res. 1974, (Suppl. 4), 111–116. [Google Scholar]
  51. Fituri, N.; Allawi, N.; Bentley, M.; Costello, J. The effect of a high intake of tartaric acid on urinary and plasma oxalate. In Urolithiasis and Related Clinical Research; Schwille, P.O., Smith, L.H., Robertson, W.G., Vahlensieck, W., Eds.; Springer: Boston, MA, USA, 1985; pp. 379–382. [Google Scholar]
  52. Arnold, M.H.M. Acidulants for Foods and Beverages; Food Trade Press: London, UK, 1975. [Google Scholar]
  53. Butch, C.; Cope, E.D.; Pollet, P.; Gelbaum, L.; Krishnamurthy, R.; Liotta, C.L. Production of tartrates by cyanide-mediated dimerization of glyoxylate: A potential abiotic pathway to the citric acid cycle. J. Am. Chem. Soc. 2013, 135, 13440–13445. [Google Scholar] [CrossRef]
  54. Chertow, G.M.; Johansen, K.L.; Lew, N.; Lazarus, J.M.; Lowrie, E.G. Vintage, nutritional status, and survival in hemodialysis patients. Kidney Int. 2000, 57, 1176–1181. [Google Scholar] [CrossRef] [Green Version]
  55. Beckonert, O.P.; Keun, H.C.; Ebbels, T.M.D.; Bundy, J.G.; Holmes, E.; Lindon, J.C.; Nicholson, J.K. Metabolic profiling, metabolomic and metabonomic procedures for NMR spectroscopy of urine, plasma, serum and tissue extracts. Nat. Protoc. 2007, 2, 2692–2703. [Google Scholar] [CrossRef]
  56. Matthews, D.R.; Hosker, J.P.; Rudenski, A.S.; Naylor, B.A.; Treacher, D.F.; Turner, R.C. Homeostasis model assessment: Insulin resistance and β-cell function from fasting plasma glucose and insulin concentrations in man. Diabetologia 1985, 28, 412–419. [Google Scholar] [CrossRef] [Green Version]
  57. Geamanu, A.; Gupta, S.V.; Bauerfeld, C.; Samavati, L. Metabolomics connects aberrant bioenergetic, transmethylation, and gut microbiota in sarcoidosis. Metabolomics 2016, 12, 35. [Google Scholar] [CrossRef] [Green Version]
  58. Gregory, J.F.; Park, Y.; Lamers, Y.; Bandyopadhyay, N.; Chi, Y.Y.; Lee, K.; Kim, S.; da Silva, V.; Hove, N.; Ranka, S.; et al. Metabolomic Analysis Reveals Extended Metabolic Consequences of Marginal Vitamin B-6 Deficiency in Healthy Human Subjects. PLoS ONE 2013, 8. [Google Scholar] [CrossRef] [PubMed] [Green Version]
  59. Maulidiani; Abas, F.; Khatib, A.; Perumal, V.; Suppaiah, V.; Ismail, A.; Hamid, M.; Shaari, K.; Lajis, N.H. Metabolic alteration in obese diabetes rats upon treatment with Centella asiatica extract. J. Ethnopharmacol. 2016, 180, 60–69. [Google Scholar] [CrossRef]
  60. An, L.; Shi, Q.; Feng, F. Metabolomics approach to identify therapeutically potential biomarkers of the Zhi-Zi-Da-Huang decoction effect on the hepatoprotective mechanism. RSC Adv. 2015, 5, 84048–84055. [Google Scholar] [CrossRef]
  61. Song, X.; Wang, J.; Wang, P.; Tian, N.; Yang, M.; Kong, L. 1H NMR-based metabolomics approach to evaluate the effect of Xue-Fu-Zhu-Yu decoction on hyperlipidemia rats induced by high-fat diet. J. Pharm. Biomed. Anal. 2013, 78, 202–210. [Google Scholar] [CrossRef]
  62. Altermann, E.; Klaenhammer, T.R. PathwayVoyager: Pathway mapping using the Kyoto Encyclopedia of Genes and Genomes (KEGG) database. BMC Genom. 2005, 6, 60. [Google Scholar] [CrossRef] [PubMed] [Green Version]
Figure 1. Characterization of the plasma metabolic changes in PEW and non-PEW hemodialysis (HD) patients. Partial least square-discriminant analysis (PLS-DA) score plot indicating metabolomics profile between the two groups (green = PEW; blue = NPEW) with each score representing one subject. The eclipse represents the 95th percentile of confidence interval, while any score outside of the eclipse is considered an outlier. Nine outlier scores were excluded from the analysis. Metabolomics profile of the two groups was clearly discriminated as indicated by a clear separation trend.
Metabolites 10 00291 g001
Figure 2. Corresponding loading plot of PLS-DA with a confluence of variable importance in the projection (VIP) results (highlighted as red). The loading plot reveals the important regions in the spectra (metabolites) are responsible for the group clustering shown by the score plot. These regions matched those identified by the VIP plot (VIP > 1) and lead to the separation of the groups.
Metabolites 10 00291 g002
Figure 3. Proposed metabolic pathways of the PEW condition. The figure shows the correlation network of significantly altered metabolites detected in plasma of PEW group patients. The disordered metabolic pathways are fatty acid β-oxidation and gluconeogenesis. The changes of metabolites in PEW subjects are shown in orange (significantly increased) and blue (significantly decreased) as compared to NPEW groups. * Tartrate significance is diminished after adjustment for covariates.
Metabolites 10 00291 g003
Table 1. Demographic, clinical and biochemical characteristics of the study population.
CharacteristicsPEW Subjects (n = 53)NPEW Subjects (n = 53)p-Value
Demographics
Age (years)55 ± 1456 ± 14ns
Gender (males, %)29 (54.7)29 (54.7)ns
Ethnicity ns
Malay (n, %)8 (15.1)11 (20.8)
Chinese (n, %)36 (67.9)32 (60.4)
Indian (n, %)9 (17)10 (18.9)
Clinical and Biochemistry
Dialysis vintage (months)89.96 ± 85.5258.74 ± 56.300.041
Kt/V1.28 ± 0.971.17 ± 0.69ns
Serum creatinine (μmol/L)712 ± 160891 ± 214<0.001
Serum urea (mmol/L)18.88 ± 4.4320.88 ± 5.140.036
Insulin (mU/L)6.75 ± 5.2913.83 ± 5.85<0.001
HOMA-IR1.84 ± 1.804.23 ± 2.82<0.001
hsCRP (mg/L)3.71 ± 3.285.73 ± 5.87ns
IL-6 (pg/mL)7.15 ± 5.664.27 ± 3.580.006
Abbreviations: PEW—Protein Energy Wasting group; NPEW—Non-PEW group, Kt/V—index of dialysis adequacy; HOMA-IR—homeostasis model assessment index of insulin resistance, hsCRP—high sensitivity C-reactive protein, IL-6—interleukin 6, ns—not significant. Notes: Patients were stratified into PEW and NPEW based on the International Society of Renal Nutrition and Metabolism (ISRNM) criteria [7]. Data are reported as mean ± SD for continuous variables and number (percentage) for categorical variables. Differences in age, dialysis vintage, Kt/V, serum creatinine, serum urea, insulin, HOMA-IR, hsCRP and IL-6 were tested using an independent t-test while differences in gender and ethnicity were tested using a chi-squared test. Statistically p < 0.05 is considered significant.
Table 2. Characteristics of patients based on ISRNM PEW criteria.
ParametersCutoff for PEW CriterionPEW Subjects (n = 53)NPEW Subjects (n = 53)p-Value
Biochemical
Serum albumin (g/L)<3.8 g/dl36.45 ± 4.8539.77 ± 3.62<0.001
TC (mmol/L)<2.59 mmol/L4.21 ± 1.164.07 ± 0.93ns
Body Mass
BMI (kg/m2)<23 kg/m220.34 ± 2.6826.76 ± 3.74<0.001
Muscle Mass
MAMC (cm)Decreased mid-arm muscle circumference area (reduction >10% in relation to 50th percentile of reference population)20.31 ± 2.6324.63 ± 2.68<0.001
MAMA (cm2)Muscle mass loss >5% over 3 months or >10% over 6 months24.95 ± 7.6840.48 ± 10.75<0.001
Dietary Intake
DEI (kcal/kg IBW/day)<0.80 g/kg/day for at least 2 months22.63 ± 4.4924.67 ± 7.550.040
DPI (g/kg IBW/day)<25 kcal/kg/day for at least 2 months0.90 ± 0.290.94 ± 0.37ns
Abbreviations: PEW—Protein Energy Wasting group; NPEW—Non-PEW group, BMI—body mass index, MAMA—mid-arm muscle area, MAMC—mid-arm muscle circumference, LTM—lean tissue mass, TC—total cholesterol, DEI—dietary energy intake, DPI—dietary protein intake, ns—not significant. Notes: Data are reported as mean ± SD and differences in serum albumin, TC, BMI, MAMC, MAMA, DEI and DPI were tested using an independent t-test. Statistically p < 0.05 is considered significant.
Table 3. Comparison on the relative concentrations of discriminant metabolites between PEW and NPEW identified by 1H NMR.
MetabolitesPEWNPEWDifferencesp-ValueAdjusted pa
3-Hydroxybutyrate0.051 ± 0.0080.024 ± 0.0020.027<0.0010.002
Acetate0.188 ± 0.0060.172 ± 0.0050.0170.0270.039
Arabinose0.228 ± 0.0200.222 ± 0.0340.0060.029ns
Maltose0.174 ± 0.0140.157 ± 0.0220.01640.021ns
Ribose0.523 ± 0.0350.459 ± 0.0380.06450.041ns
Sucrose0.144 ± 0.1170.111 ± 0.0100.03330.008ns
Tartrate0.202 ± 0.0270.182 ± 0.0320.02020.018ns
Creatinine0.270 ± 0.0080.331 ± 0.010−0.0609<0.001<0.001
Abbreviations: ns—not significant. Notes: Values are expressed as mean ± SD and p < 0.05 is considered significant. p-values are derived from the Mann–Whitney U analysis, to compare mean ranks of metabolites between PEW and NPEW groups. pa values are adjusted for age and dialysis vintage using a one-way covariance analysis (ANCOVA).

