Article

Metabolomics Comparison of Hanwoo (Bos taurus coreanae) Biofluids Using Proton Nuclear Magnetic Resonance Spectroscopy

1
Division of Applied Life Science (BK21Plus), Gyeongsang National University, Gyeongsangnam-do, Jinju-si 52828, Korea
2
Institute of Agriculture and Life Science & University-Centered Labs, Gyeongsang National University, Gyeongsangnam-do, Jinju-si 52828, Korea
3
Animal Nutrition and Physiology Team, National Institute of Animal Science, RDA, Jeonrabuk-do, Jeonju-si 55365, Korea
*
Author to whom correspondence should be addressed.
These authors contributed equally to this work.
Metabolites 2020, 10(8), 333; https://doi.org/10.3390/metabo10080333
Submission received: 8 July 2020 / Revised: 12 August 2020 / Accepted: 12 August 2020 / Published: 14 August 2020

Abstract

:
The aim of this study was to identify the metabolomic profiles of rumen fluid, serum, and urine from Hanwoo (Bos taurus coreanae), using proton nuclear magnetic resonance (1H-NMR) spectroscopy. In all, 189, 110, and 188 metabolites were identified in rumen fluid, serum, and urine, and 107, 49, and 99 were quantified, respectively. Organic acids, carbohydrates, and aliphatic acyclic compound metabolites were present at the highest concentrations in rumen fluid, serum, and urine, respectively. In addition, acetate, glucose, and urea were the most highly concentrated individual metabolites in rumen fluid, serum, and urine, respectively. In all, 77 metabolites were commonly identified, and 19 were quantified across three biofluids. Metabolic pathway analysis showed that the common quantified metabolites could provide relevant information about three main metabolic pathways, phenylalanine, tyrosine, and tryptophan biosynthesis; caffeine metabolism; and histidine metabolism. These results can be useful as reference values for future metabolomic research on Hanwoo biofluids in Korea.

1. Introduction

Metabolomics is a comprehensive approach that allows for the identification and quantification of all the metabolites in an organism which are affected by both genetic and environmental factors [1]. Since the first signal detection in 1945 by Bloch, Purcell, and their colleagues [2], nuclear magnetic resonance (NMR) spectroscopy has developed into the second most extensively used technique for metabolomic studies, after liquid chromatography mass spectrometry, and has been frequently applied in untargeted metabolic investigations. The concentration of each metabolite can also be identified and quantified from an NMR spectrum [1,2]. Metabolomic studies using NMR spectroscopy have been conducted to investigate human metabolic diseases [3], drug toxicity [4], and food quality discrimination [5]. Such studies using NMR-based have also been conducted in animals and plants [6].
Ruminants are mammals, such as cattle, goat, sheep, and deer, which are characterized by having complex stomachs designed to digest plant-based foods that are mainly made of cellulose and hemicellulose. These cellulosic components are decomposed into monosaccharides by several microorganisms present in the rumen (the first stomach), which occupies the largest volume to obtain energy amounts of approximately 70% to 80% [7]. Ruminants represent one of the most populous and economically important groups of animals in the world, as they are the source of meat, milk, leather, and other resources for humans [8]. The first metabolomics study using NMR spectroscopy was conducted in 1972 by Chandan et al. [9] and evaluated the components of milk, one of the biofluids of ruminants. Since then, similar studies of ruminant biofluids have been conducted [10]. Representative metabolomics data on various ruminant biofluids (rumen fluid, serum, plasma, milk, urine, and feces) have been applied to increase global productivity [11,12], identify metabolic changes due to heat stress [13,14], reduce methane emissions to prevent global warming [15,16], and explore biomarkers to aid on metabolic disease prevention [17,18,19].
Hanwoo (Bos taurus coreanae) is a native, taurine-type, small-sized cattle breed in Korea. In the past, Hanwoo were used extensively for farming, transportation, and religious sacrifice; however, over time, the breed has become a commercial source of meat [20]. Studies on Hanwoo reported that it provides meat of higher quality and improved taste [20]. Other studies have analyzed the volatile fatty acid (VFA) composition [21], growth performance, and blood characteristics of the breed [22]. In recent year, metabolomics research has been conducted by comparing the composition of Hanwoo steers rumen fluid with the VFA and monosaccharides metabolites, using proton NMR (1H-NMR) spectroscopy, high-performance liquid chromatography, and high-performance anion-exchange chromatography [23]. However, very few studies have been conducted on the metabolites that constitute Hanwoo biofluids, using 1H-NMR spectroscopy. In Korea, most existing metabolomics studies using NMR have focused on food [24], human biofluids [25], and monogastric animals [26].
The objective of the present study was to characterize the metabolomes of Hanwoo steers rumen fluid, serum, and urine using 1H-NMR spectroscopy. The collected data aim to serve as a reference guide for researchers who seek to apply a metabolomics approach in future Hanwoo research.

2. Results

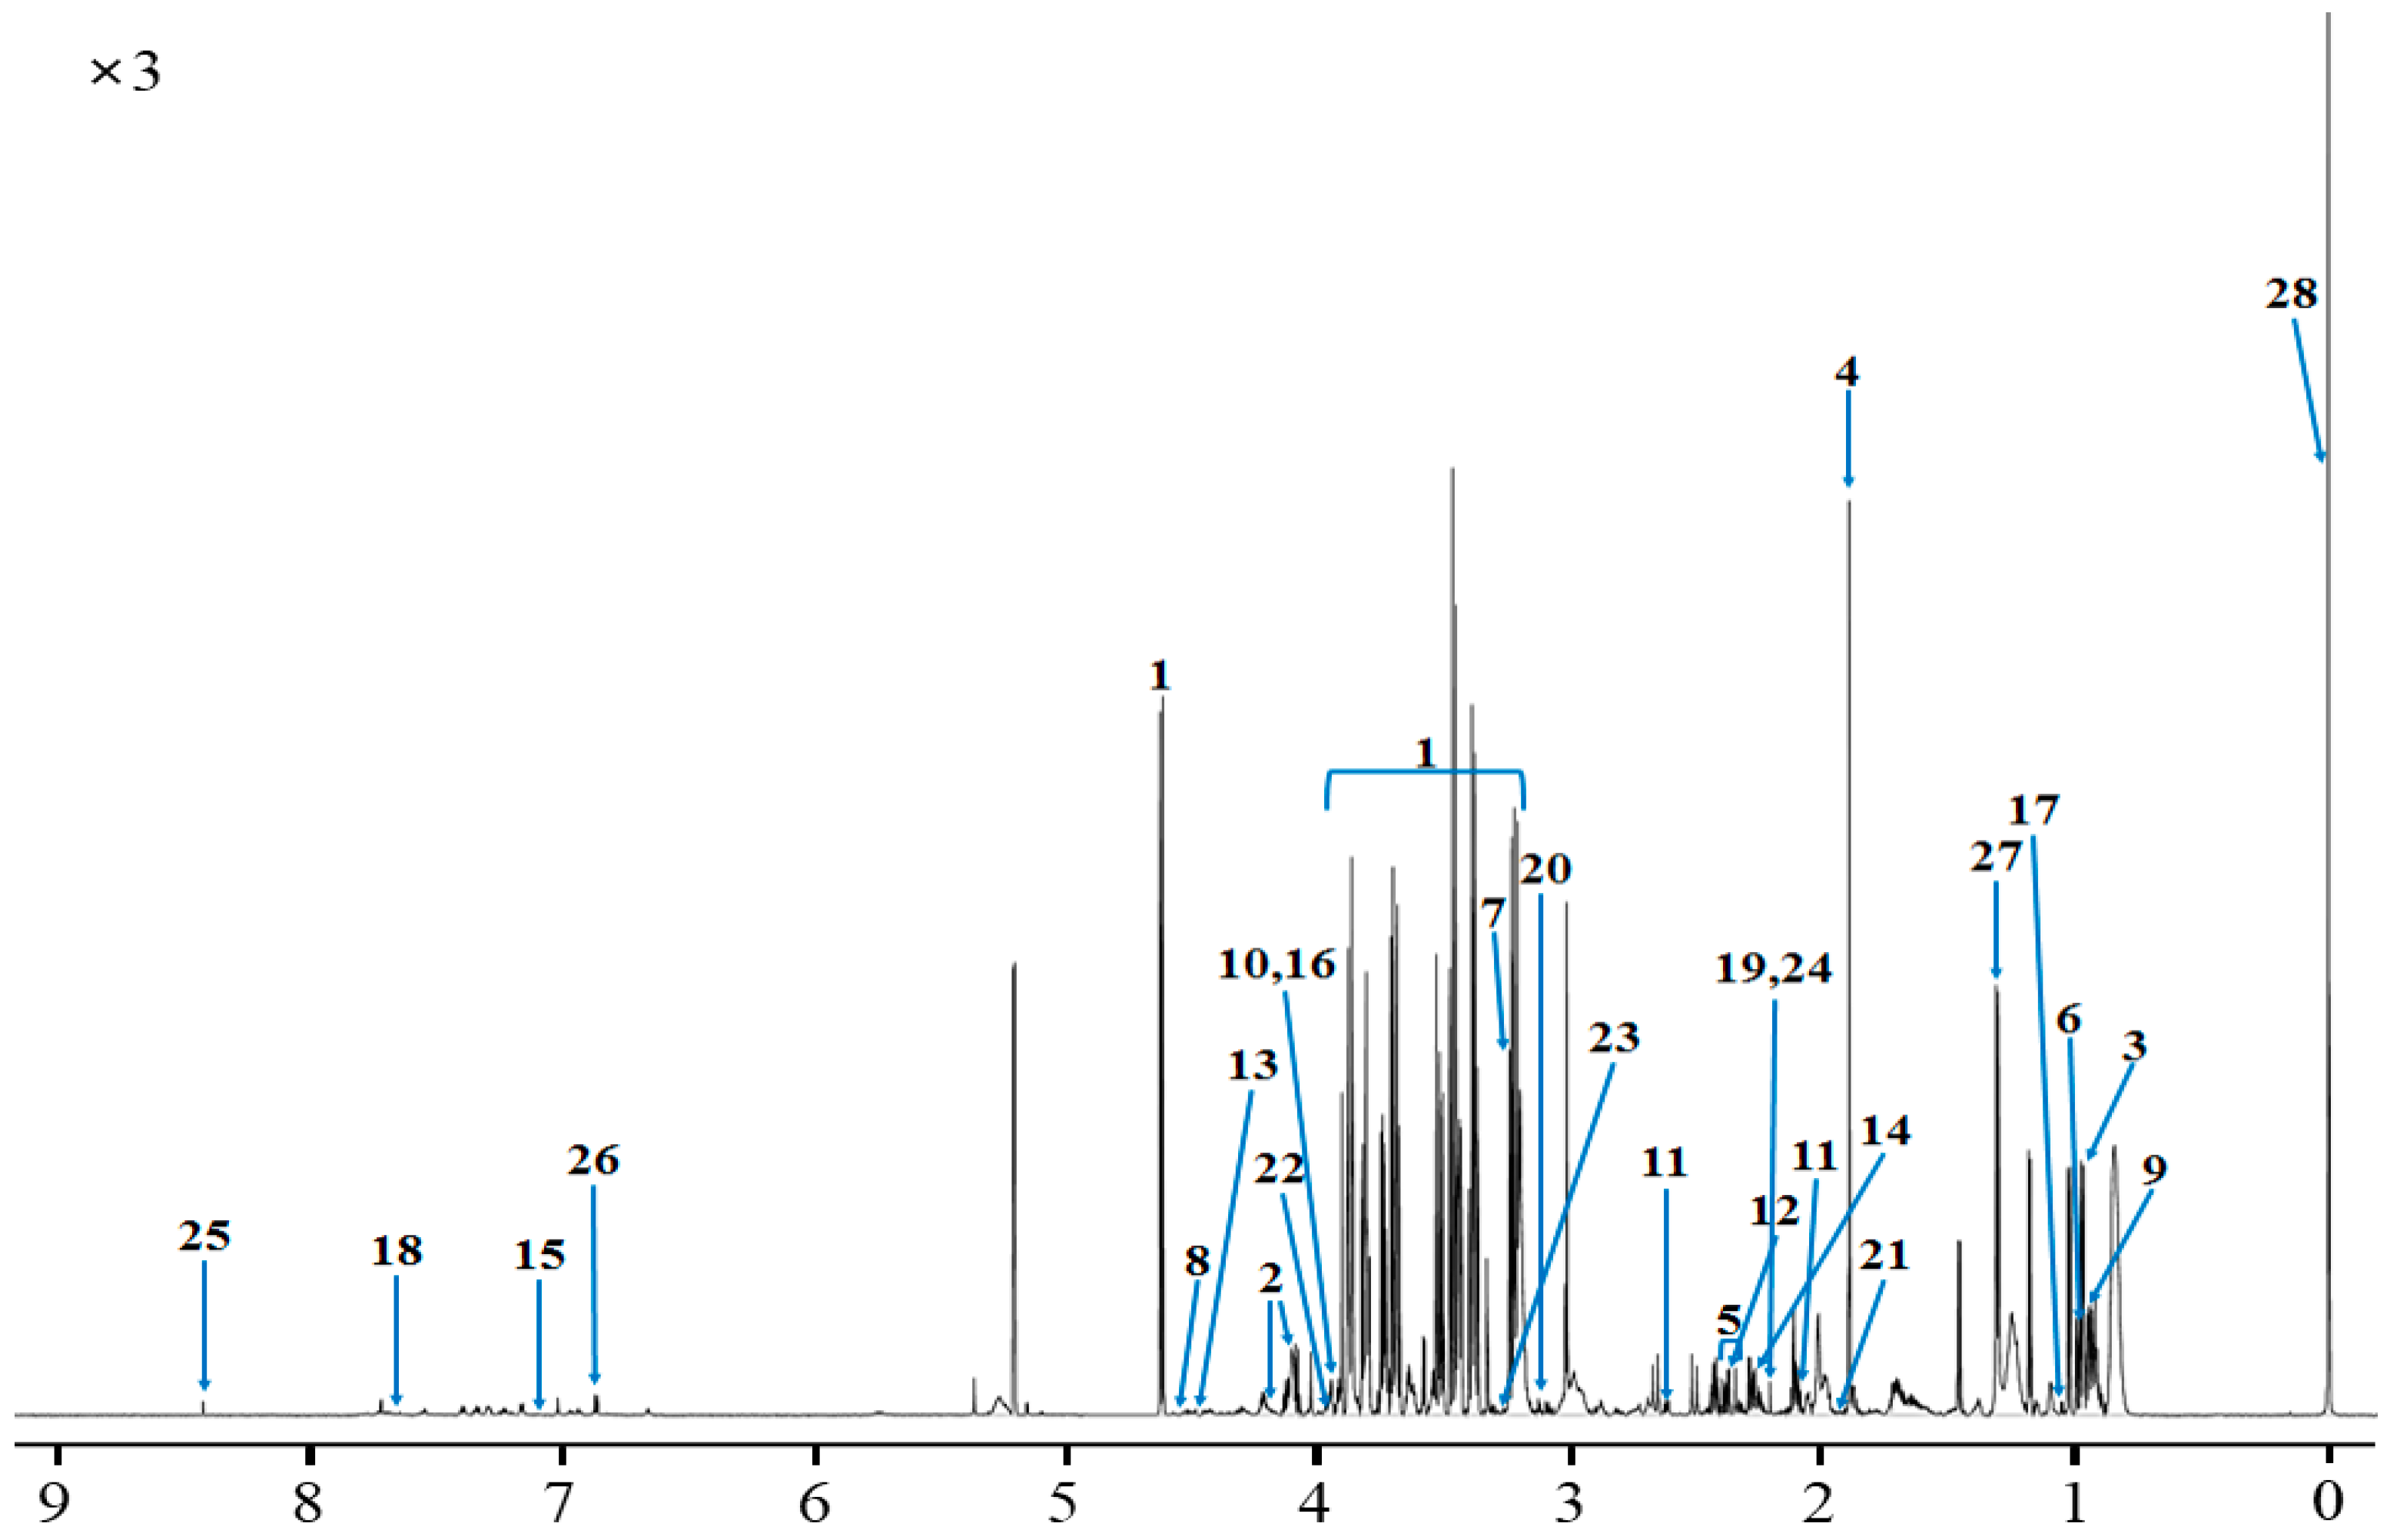
2.1. Rumen Fluid Metabolites

The metabolites identified and quantified in the rumen fluid by using 1H-NMR spectroscopy are described in Figure 1, Supplementary Materials Figure S1a, and Supplementary Materials Tables S1–S4. In total, 189 metabolites were identified and categorized into 14 chemical classes. The classes with the most metabolites were others (31), carboxylic acids (28), and amino acids (22), while those with the highest concentrations were organic acids (44.88 mM), carbohydrates (1.605 mM), and amino acids (1.207 mM). In addition, 107 metabolites were quantified in the rumen fluid. The results in Figure 1 illustrate the identified and quantified compounds in rumen fluid. The top 30 concentrations of these metabolites quantified by 1H-NMR spectroscopy are described in Table 1. Among the metabolites quantified, acetate, propionate, and butyrate had the highest concentrations. In contrast, N-alpha-acetyllysine, 3-hydroxy-3-methylglutarate, and pyruvate had the lowest concentrations.

2.2. Serum Metabolites

The metabolite identified and quantified in serum using 1H-NMR spectroscopy are described in Figure 2, Supplementary Materials Figure S1b, and Supplementary Materials Tables S1–S4. In total, 110 metabolites were identified and categorized into 12 chemical classes. The classes with the most metabolites were others (22), carboxylic acids (19), and carbohydrates (15) while with highest concentrations were carbohydrates (0.815 mM), organic acids (0.340 mM), and lipids (0.207 mM). In addition, 49 metabolites were quantified in the serum. The results in Figure 2 illustrate the identified and quantified compounds in serum. The top 30 concentrations of metabolites quantified by 1H-NMR spectroscopy are described in Table 2. Among the metabolites quantified, glucose, lactate, and 2-hydroxyisovalerate had the highest concentrations, whereas N-nitrosodimethylamine, N-acetylglucosamine, and 5-aminolevulinate had the lowest concentrations.

2.3. Urine Metabolites and Commonly Quantified Metabolites from the Three Biofluids

The metabolite identified and quantified metabolites in urine by 1H-NMR spectroscopy are described in Figure 3, Supplementary Materials Figure S1c, and Supplementary Materials Tables S1–S4. In total, 188 metabolites were identified and categorized into 13 chemical classes. The classes with the most metabolites were others (39), carboxylic acids (27), and lipids (22) while those with the highest concentrations were aliphatic acylic compounds (52.20 mM), lipids (3.910 mM), and carbohydrates (1.953 mM). In addition, 99 metabolites were quantified in urine. The results in Figure 3 illustrate the identified and quantified compounds in urine. The top 30 concentrations of metabolites quantified using 1H-NMR spectroscopy are described in Table 3. Among the metabolites quantified, urea, hippurate, and N-phenylacetylglycine had the highest concentrations, whereas 3-pheylpropionate, salicylurate, and phenylacetate had the lowest concentrations. The results are summarized in Table 4, which reveals common metabolites across the three biofluids, including 19 quantified metabolites. Overall, carboxylic acid metabolites were the most quantified.

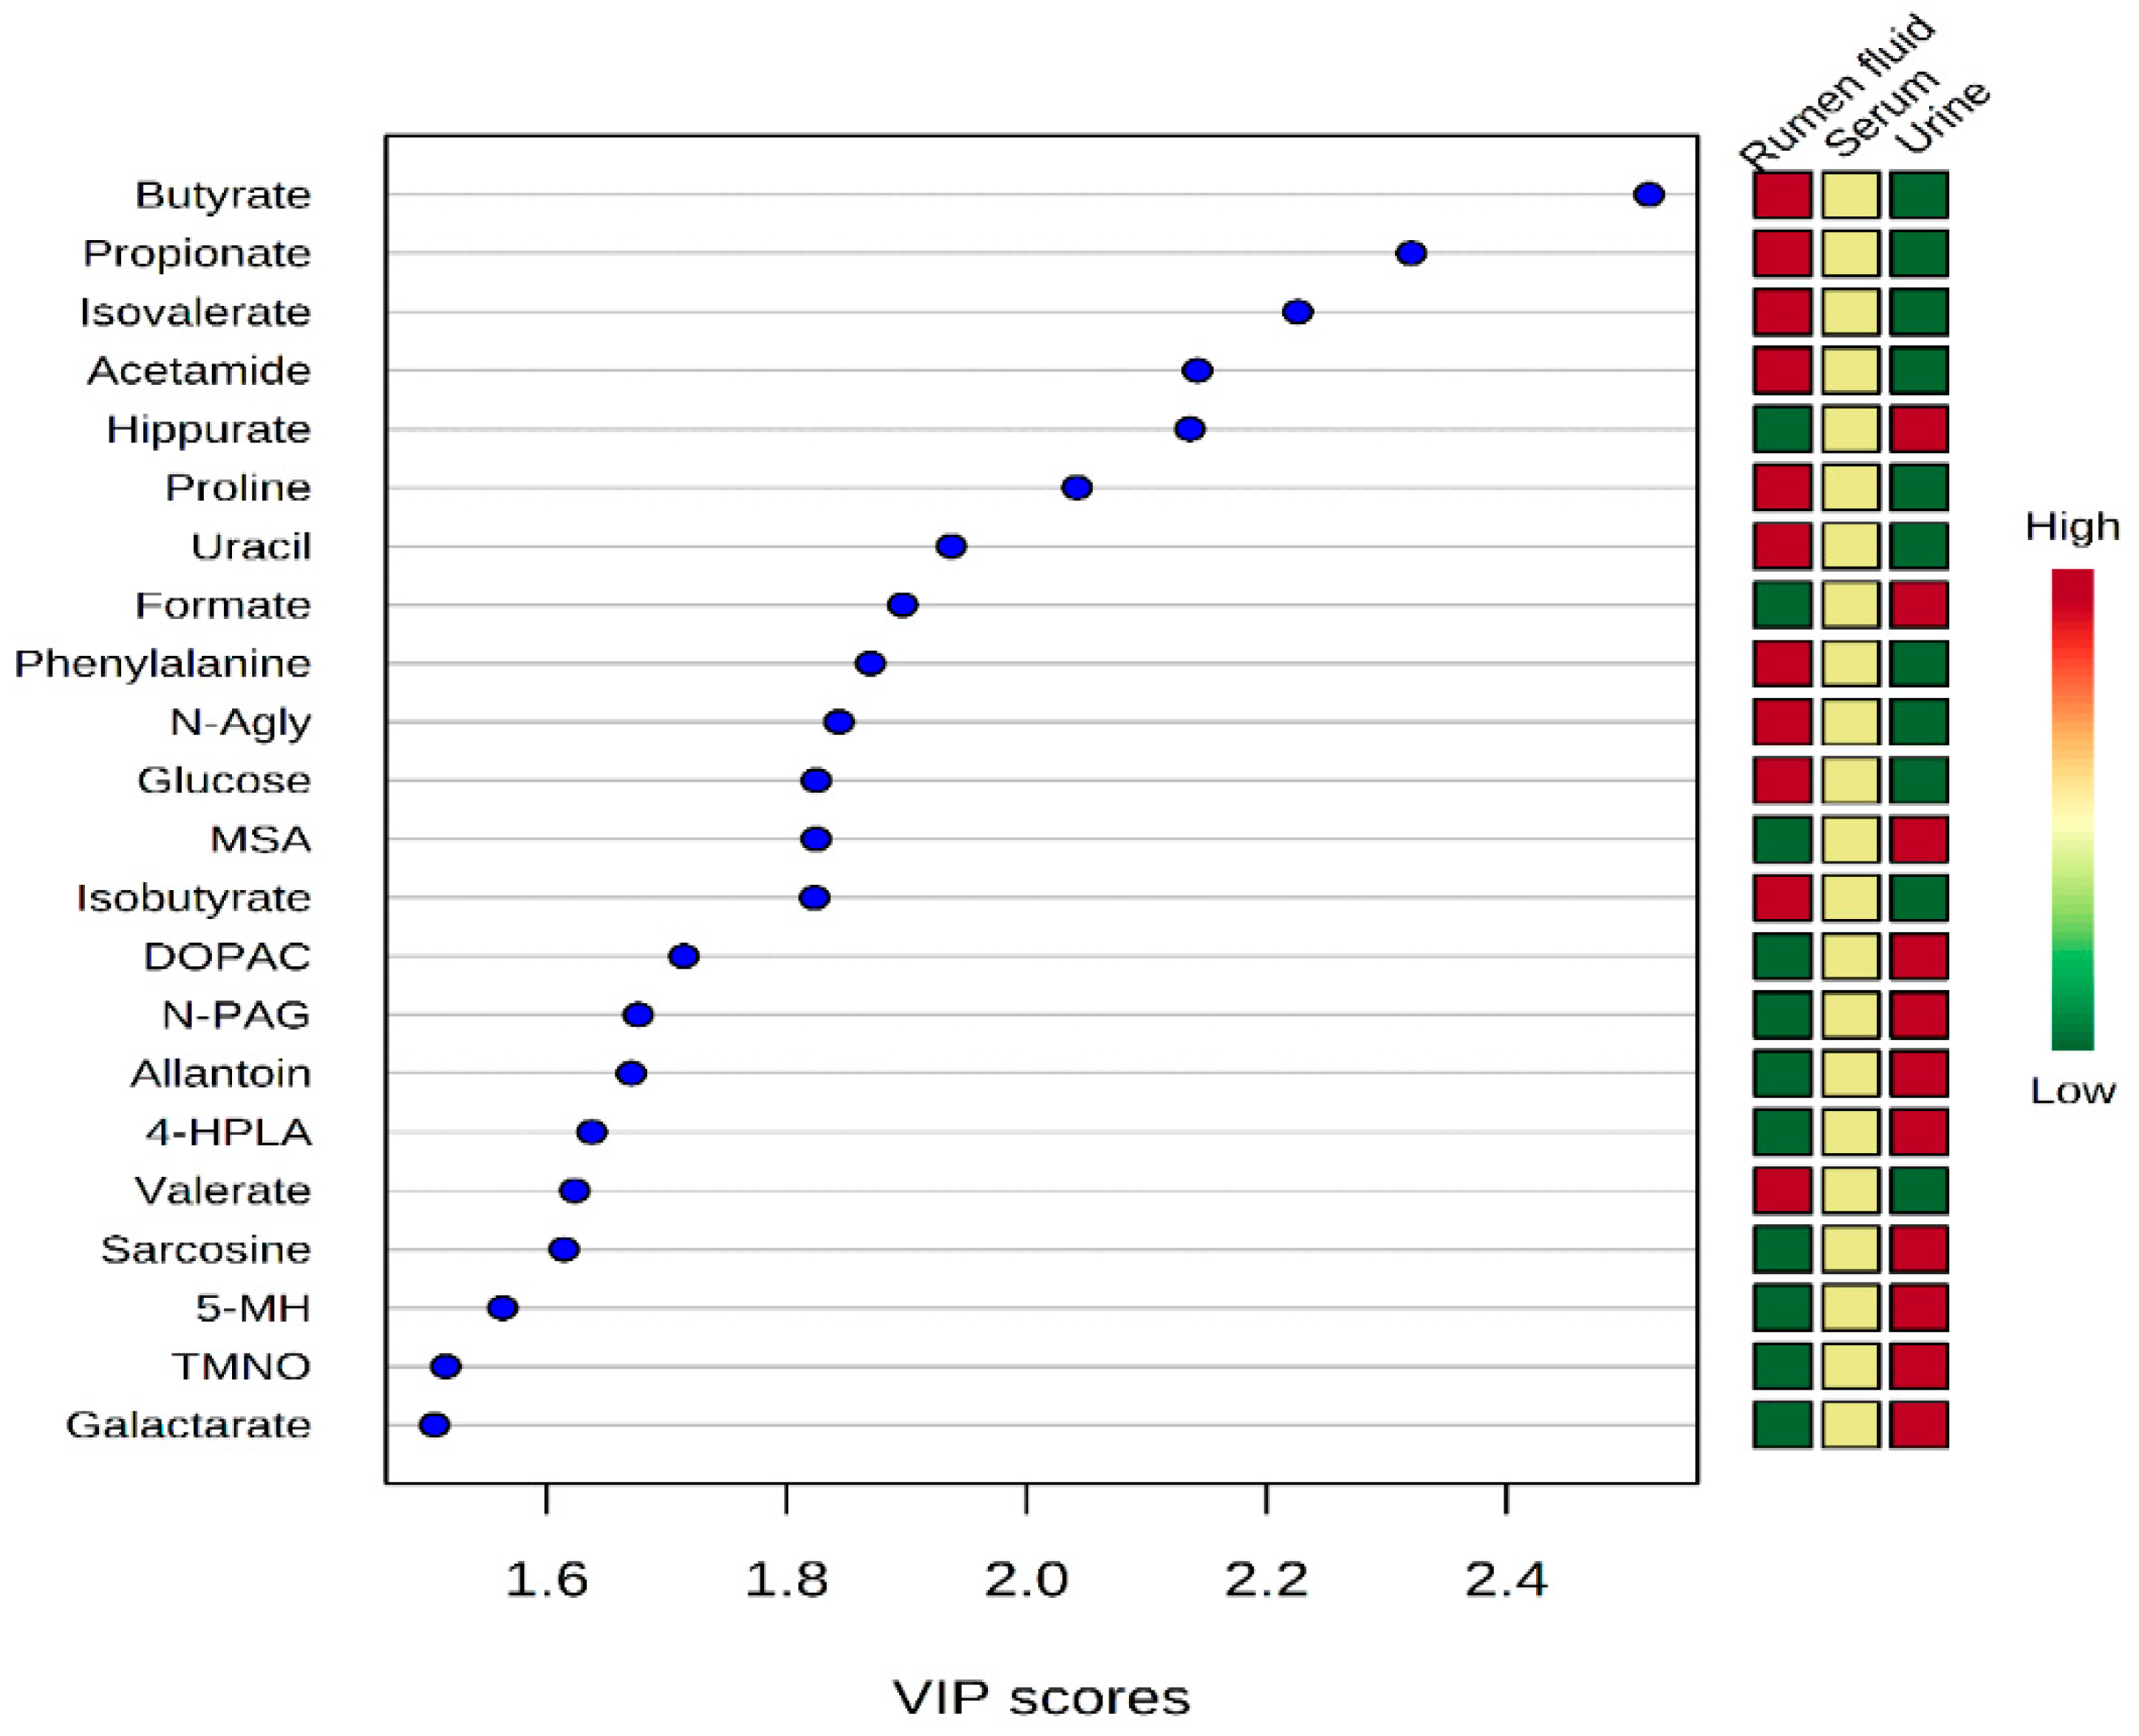
2.4. Statistical Analysis from Three Biofluids

To visualize the differences among the metabolites of the different three biofluids, we performed principal component analysis (PCA) and partial least square discriminant analysis (PLS-DA) (Supplementary Materials Figures S2 and S3). Both score plots revealed differences corresponding to rumen fluid, serum, and urine, which were well separated in PC1 (31.8%) and PC2 (21.8%) for PCA, and Component 1 (30%) and Component 2 (22.8%) for PLS-DA. These results highlight the differences in the classes and concentrations of the metabolites measured in rumen fluid, serum, and urine.
As shown in Figure 4, rumen fluid, serum, and urine presented completely different metabolomic profiles. Variable importance in projection (VIP) scores were used to identify which metabolites were responsible for the differentiation pattern in the PLS-DA plot. This analysis revealed that 22 metabolites were significantly different (VIP score > 1.5) between rumen fluid, serum, and urine (Figure 4). Moreover, in rumen fluid, 11 metabolites (butyrate, propionate, isovalerate, acetamide, proline, uracil, phenylacetate, N-acetylglycine, glucose, isobutyrate, and valerate) were significantly more concentrated than in serum and urine. In urine, 11 metabolites (hippurate, formate, methylsuccinate, 3,4-dihydroxybenzeneacetate, N-phenylacetylglycine, allantoin, 4-hydroxyphenyllactate, sarcosine, 5-methylhistidine, trimethylamine N-oxide, and galactarate) were also found at significantly higher concentrations than in rumen fluid and serum.

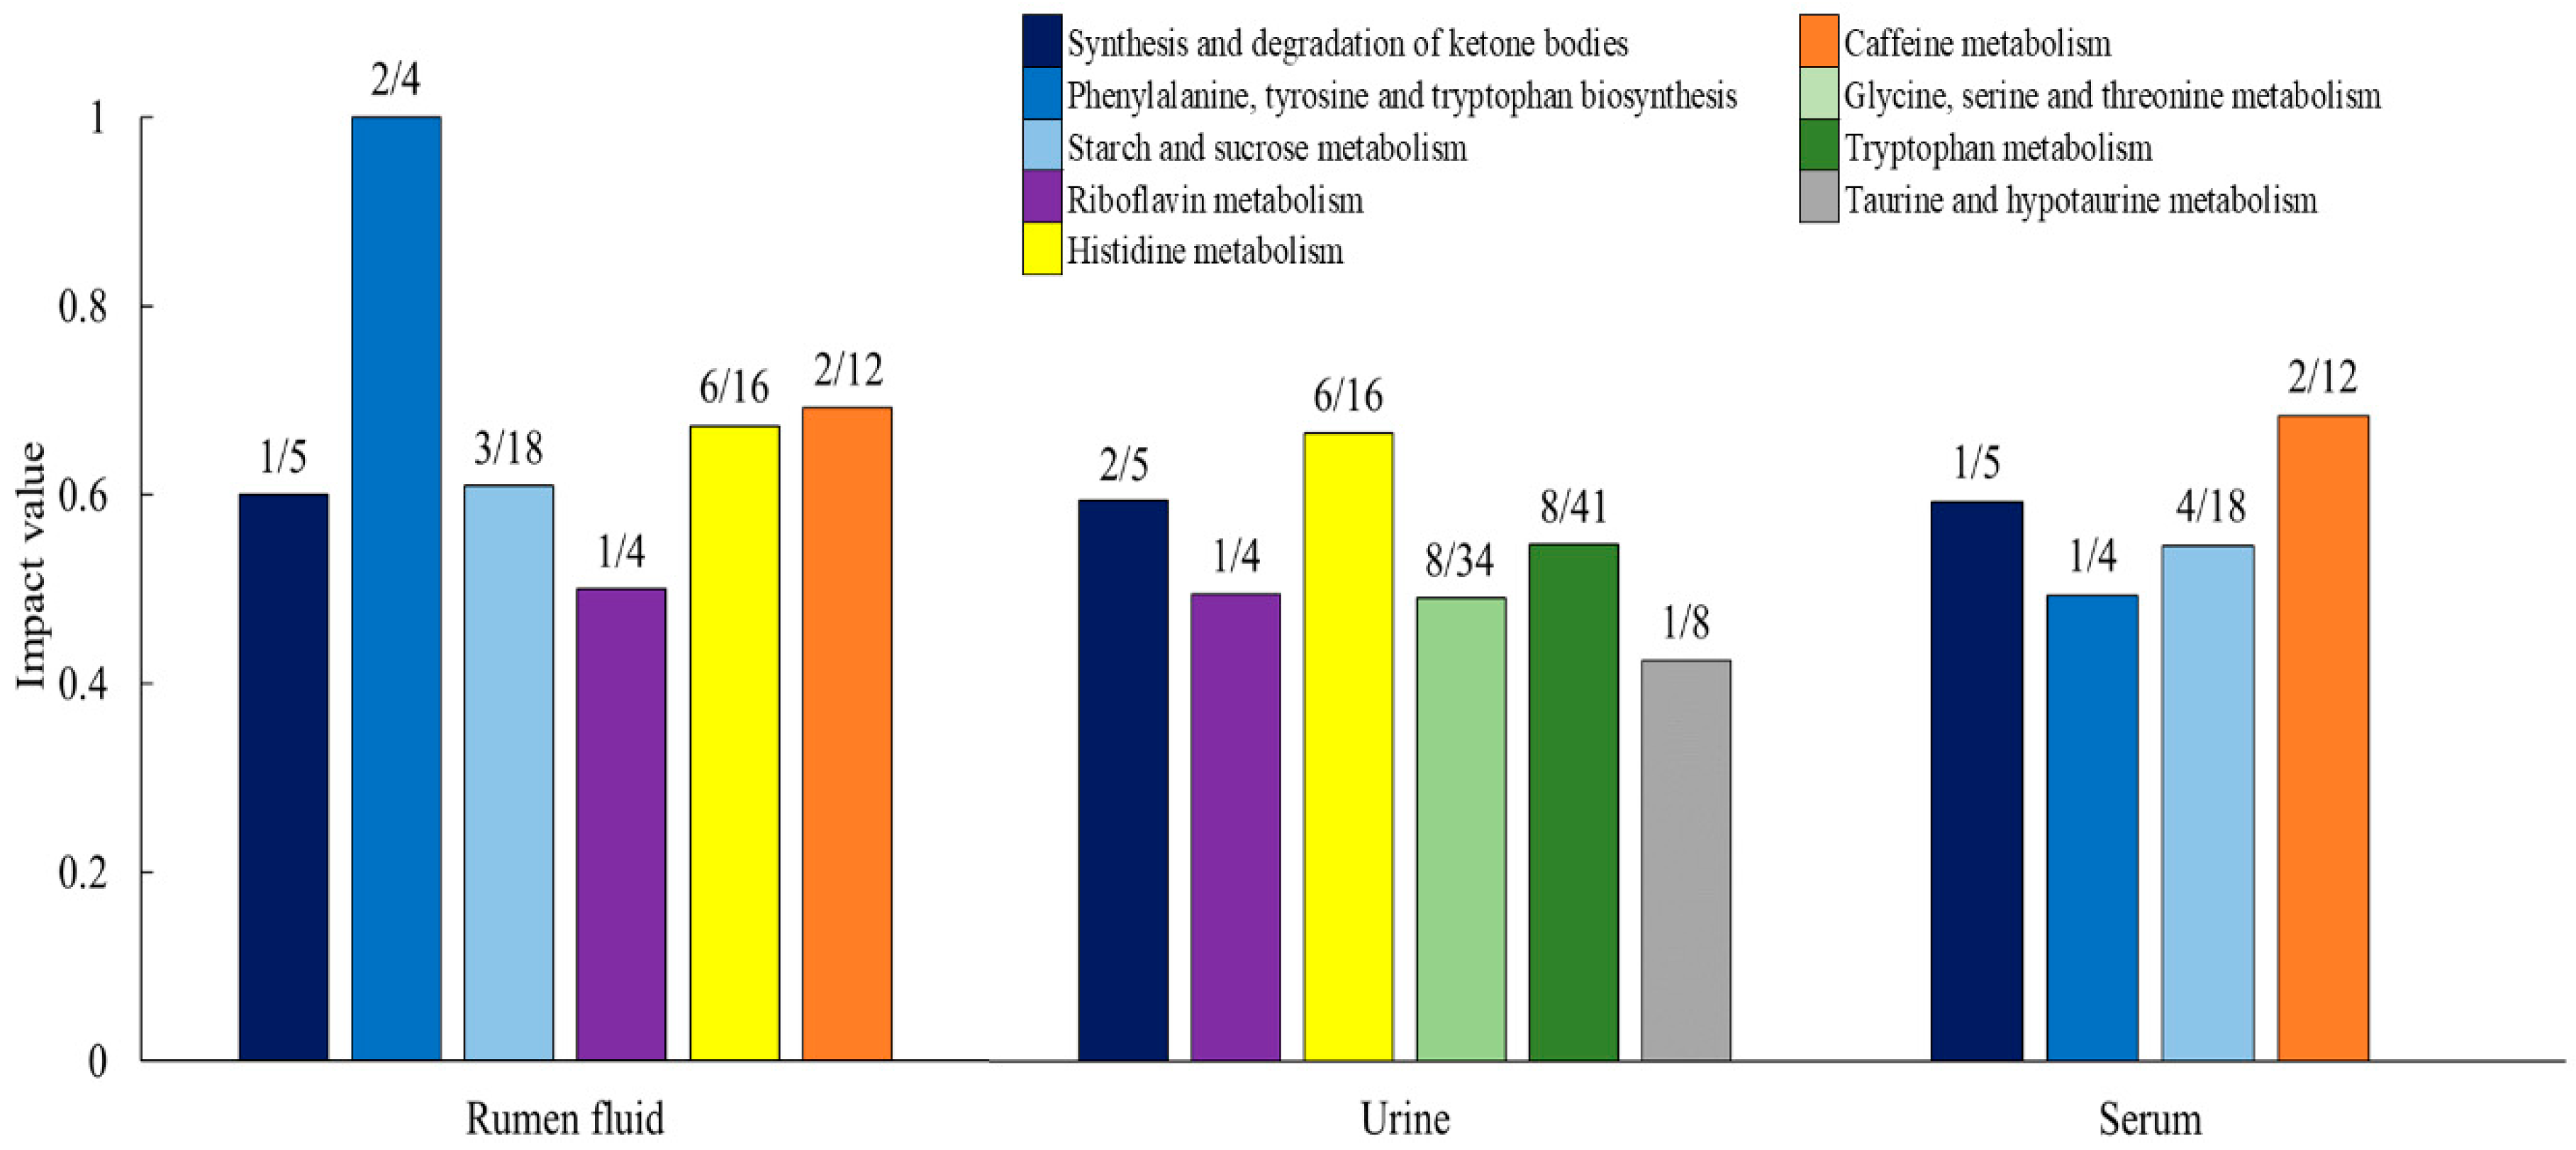
2.5. Metabolic Pathway Analysis

Metabolic pathway analysis for common quantified three biofluids was performed by using the MetaboAnalyst platform, as detailed in Figure 5. Overall, the phenylalanine, tyrosine, and tryptophan biosynthesis pathway showed the highest impact score, and six other pathways were described with an impact score higher than 0.5. These pathways included tryptophan metabolism, caffeine metabolism, histidine metabolism, riboflavin metabolism, starch and sucrose metabolism, and synthesis and degradation of ketone bodies.

3. Discussion

VFAs that can be found in the rumen, such as acetate, propionate, butyrate, valerate, isobutyrate, and isovalerate are the main sources of energy for ruminants [27]. Diets containing a high density of concentrates result in the absorption of more VFAs in the rumen [28], thereby in increased productivity by the ruminants. In contrast, as the rumen pH decreases, the risk of acidosis increases [29]. Previous studies by Ametaj et al. [17], Saleem et al. [30], and Wang et al. [31] reported that feed diets containing a high density of concentrates increased ethanol, ethanolamine, 3-hydroxybutyrate, dimethylamine, N-nitrosodimethylamine, glucose, propionate, butyrate, alanine, maltose, uracil, xanthine, phenylacetylglycine, phenylacetate, and biogenic amine (tyramine, putrescine, histamine, methylamine, and tryptamine) concentrations, whereas it reduced 1,3-dihydroxyacetone and 3-phenylpropionate concentrations. Our results include all metabolites associated with acidosis that were identified in previous studies, except for ethanolamine, phenylacetylglycine, tyramine, and putrescine. Hanwoo are fed a high density of concentrates until they are nearly 30 months of age. The primary reason for this type of diet is that it improves meat quality with high marbling, which is one of the main factors contributing for the high-quality grade of Hanwoo meat [32]. Therefore, the study of metabolites using Hanwoo rumen fluid could be used as an index to predict and prevent acidosis.
Ruminants produce approximately 80 million tons of methane (CH4), which accounts for about 33% greenhouse gas (GHG) emissions [33]. CH4 is a powerful GHG, with a global warming potential 28-fold higher than carbon dioxide (CO2) [34]. Given that CH4 is also associated with a 2% to 15% loss of dietary potential energy, productivity in ruminants is reduced while the rumen production of CH4 continues [33,35]. Ruminant CH4 is generated via two main methanogenesis routes in the rumen, both of which are carried out by archaea [36]. The hydrogenotrophic pathway converts hydrogen (H2) and CO2 produced by the bacteria, protozoa, and fungi to CH4 [37]. H2 and CO2 production is greatly influenced by numerous metabolites in the rumen. Saleem et al. [30] classified dimethylamine, methylamine, N-nitrosodimethylamine, formate, uracil, and threonine as metabolites related to CH4 emission in the rumen; among these, methylamine class metabolites are rapidly converted to CH4 through the methylotrophic CH4 emission pathway in the rumen [11]. Methanosarcina barkeri and Methanosarcina mazeii produce CH4 by using acetate, methylamine, and methanol, as well as H2 and CO2, which are present in the rumen [38]. The metabolites produced by the decomposition of choline by microorganisms in the rumen are known as acetate, ethanol, and ethylene glycol [39,40]. The methyl groups from choline are likely reduced to CH4 via a carrier, such as cobalamin or tetrahydrofolate, which are both abundant in methanogenic bacteria [41]. According to Asanuma et al. [42], in order to reduce CH4 emissions from the rumen, H2 used both in methanogenesis and (the formate must be reduced) as formate is converted into H2 or CO2 by formate dehydrogenase. Propionate and butyrate in the rumen are generated by using H2 [43,44,45] and dicarboxylic acid class metabolites like aspartate, malate, and fumarate are also generated using H2 [46,47]. According to Newbold et al. [48], fumarate, succinate, and acrylate must produce propionate, using H2 to reduce CH4 emissions due to the “4H2 + CO2 → CH4 + 2H2O” pathway in the rumen. Among them, the probability of using fumarate for H2 is 70%, and the probability of using acrylate for H2 is close to 100% [48]. When 2-oxoglutarate is converted to succinate, H2 is released and fumarate reuses these H2 molecules through succinate to produce propionate [48]. In addition, methionine in the rumen is produced by the methylmercapto group, using a methyl group as a CH4 emission substrate [41]. Therefore, high concentrations of acetate, methylamine, N-nitrosodimethylamine, dimethylamine, trimethylamine, trimethylamine N-oxide, choline, ethylene glycol, threonine, and uracil in the rumen are thought to increase CH4 emissions, whereas propionate, butyrate, malate, methionine, succinate, carnitine, and fumarate concentrations are thought to reduce CH4 emissions. Our results showed that CH4-related metabolites, except for malate, carnitine, and fumarate, were present in Hanwoo steers rumen fluid. Therefore, this work is expected to aid future research on CH4 reduction in Hanwoo.
Ruminants balance negative energy with relatively low-energy intake. Negative energy balance is associated with a higher risk of metabolic disorders [49], poor health, and infertility [50,51]. To compensate for the energy deficit, ruminants mobilize body reserves [51], such as body fat and muscle protein [52]. Weikard et al. [53] reported significant positive correlations between plasma carnitine and body weight. Carnitine plays a key role in cellular energy metabolism, mainly by transferring acyl groups from the cytoplasm to mitochondrial, thereby rendering the utilization of energy in feed and body stores more efficiently [53]. Glycine in plasma could be used as an indicator of energy balance and metabolic status in dairy cattle [54]. Glucose is not only used as an energy source but also as a precursor for synthesizing lactose in milk and is regulated by insulin [55]. Xu et al. [56] reported correlations between energy balance metabolites in the plasma and milk production, such as acetone, acetylcarnitine, aspartate, 3-hydroxyacetone, carnitine, creatinine, glycine, hydroxyproline, and thymidine. Our results also revealed that several metabolites associated with energy balance, including acetone, 3-hydroxyacetone, and creatinine, were present in the Hanwoo steers serum. As Hanwoo are not used for milk production, these results could be useful, as they are also directly related to body weight gain.
Bovine respiratory disease (BRD) is a multifactorial disease of notable welfare and economic significance to the global feedlot industry [57]. BRD is caused by association of physiological and environmental stressors prior to and upon feedlot admittance, for example, transportation, mixing of strange animals, and exposure to viral and microbial population agents [58]. According to Basoglu et al. [59], BRD increases 2-methylglutarate, phenylalanine, and phosphatidylcholine concentrations, while decreasing ethanol, dimethyl sulfone, propionate, acetate, allantoin, free cholesterol, and cholesterol concentrations. Blakebrough-Hall et al. [57] also found that phenylalanine, lactate, hydroxybutyrate, tyrosine, citrate, and leucine metabolites were of importance for distinguishing BRD-affected animals from healthy bovine. Our results showed that acetate, lactate, hydroxybutyrate, and leucine could be identified in the Hanwoo steers serum. BRD-related metabolites in Hanwoo were not the primary focus of our research; however, given that Hanwoo metabolites studies in serum are actively conducted, such work could be used as a reference.
Metritis is a uterine pathology that affects all uterine layers and causes decreased breeding rates, increased culling rates, increased veterinary costs, and decreased milk yield in dairy cows. Dervishi et al. [60] reported that cows with metritis harbor abnormal concentrations of metabolites associated with carbohydrate metabolism, acute phase proteins, and proinflammatory cytokines, which are first noticeable at an early phase (four and eight weeks) before parturition and the manifestation of clinical signs of metritis. Dervishi et al. [61] also reported in the urine of pre-metritic and metritic dairy cows can be detected excretion of monosaccharides and tricarboxylic acid cycle related metabolites, as well as amino acids and carbohydrates catabolites. Moreover, they suggested that, galactose, leucine, lysine, and pantothenate levels at eight weeks and a combination of histidine, isocitrate, lysine, O-phosphocholine, threonine, trans-aconitate, xylose, and 3-aminoisobutyrate at four weeks prior have predictive value and may function as potential risk biomarkers for cow susceptibility to metritis. Our results showed that the metabolites that were suggested by Dervishi et al. [61] as metritis biomarkers, including pantothenate, histidine, xylose, O-phosphocholine, and trans-aconitate, as well as amino acids, tricarboxylic acid cycle metabolites, monosaccharides, and carbohydrate catabolites, were all identified and quantified in Hanwoo steers urine. Therefore, this work may act as reference for future research on metritis in Hanwoo.
Lameness is a leg and hoof inflammatory condition that is associated with pain, resulting in impaired posture and gait of the animal [62]. The major negative effects of lameness are related to the postponed resumption of ovarian activity [63]. These symptoms could negatively affect ruminant productivity. Zhang et al. [64] reported that uracil, formate, N-N-dimethylglycine, and tyrosine were consistently lower, while lysine, pantothenate, hypoxanthine, and xylose were greater in the urine of pre-lame cows at eight and four weeks prepartum. Furthermore, during the week of lameness diagnosis, 2-hydroxyisobutyrate, 3-hydroxy-3-methylglutarte, 4-hydroxyphenylacetate, adipate, glycerate, tyrosine, and valine were less concentrated in the urine of lame-confirmed cows. Our results showed that the metabolites suggested by Zhang et al. [64], as associated with lameness, including formate, pantothenate, xylose, 2-hydroxyisobutyrate, 3-hydroxy-3-methylglutarte, 4-hydroxyphenylacetate, and glycerate metabolites, were identified in Hanwoo steers urine. Therefore, this work may also provide reference values for future research on lameness in Hanwoo.

4. Materials and Methods

All experimental protocols used in this study were approved by National Institute of Animal Science of Animal Nutrition and Physiology Team (Jeonju, Jeollabuk-do, Korea, NIAS20171082).

4.1. Animals and Collected Samples

Six Hanwoo steers (430 ± 21 kg) were included in this study. They were fed 1.2 kg of roughage and 3.0 kg of concentrate twice a day (09:00 and 18:00), with ad libitum access to mineral blocks and water. The dry matter (DM; #934.01) contents of the commercial roughage were 68.5 g/kg of crude protein (CP; #976.05), 10.5 g/kg of ether extract (#920.29), 91.2 g/kg of crude ash (CA; #942.05) [65], 590.7 g/kg of neutral detergent fiber (NDF), and 384.2 g/kg of acid detergent fiber (ADF) [66]. The contents for the commercial concentrates were 183.7 g/kg of CP, 27.8 g/kg of ether extract, 82.5 g/kg of CA, 216.5 g/kg of NDF, and 94.9 g/kg of ADF.
Rumen fluid, serum, and urine samples were collected before the morning feeding (09:00). Rumen fluid was collected from rumen calculated Hanwoo steers. The samples were centrifuged at 806× g and 4 °C for 15 min, to remove feed particles, and the supernatant was stored at −80 °C for later 1H-NMR spectroscopy analysis. Blood from the jugular neck vein was collected of each steer. The serum samples were centrifuged at 15,142× g and 4 °C for 5 min, and aliquots of the upper layer (serum) were stored at −80 °C for later 1H-NMR spectroscopy analysis. Urine samples were collected by hand-sweeping the perineum, thus stimulating each steer to urinate, and stored at −80 °C for later 1H-NMR spectroscopy analysis.

4.2. Sample Preparation for 1H-NMR Spectroscopy

Rumen fluid samples were centrifuged at 12,902× g and 4 °C for 15 min and collected at 300 μL of supernatant. Standard buffer solution (TSP; 2,2,3,3-d4-3-(Trimethylsilyl) propionic acid sodium salt) was added to 300 μL in deuterium oxide (D2O) solvent. The mixture solution (600 μL) was transferred to 5 mm NMR tube for 1H-NMR spectroscopy spectral analysis [8].
Saline buffer was prepared in NaCl concentration of 0.9% weight/volume in 100% D2O. The stored serum samples were centrifuged at 14,000× g and 4 °C for 10 min. The supernatant 200 and 400 μL of saline buffer was added to the 5 mm NMR tube for 1H-NMR spectral spectroscopy analysis [67].
Urine sample was utilized to 0.2 M sodium phosphate buffer (pH 7.0). The samples were centrifuged at 14,000× g at 4 °C for 10 min, and we collected 400 μL supernatant. Supernatant was added to 230 μL of buffer and was measured at pH 7.0 ± 0.1. The mixture solution (630 μL) was added to 2 mM TSP 60 μL, and the TSP concentration in the total solution was adjusted to 0.2 mM [68]. The prepared sample was transferred to a 5 mm NMR tube, for 1H-NMR spectroscopy spectral analysis.
The spectra of rumen fluid, serum, and urine samples were obtained on a SPE-800 MHz NMR–MS Spectrometer (Brunker BioSpin AG, Fällanden, Switzerland) at 298 K, using a 5 mm triple-resonance inverse cryoprobe with Z-gradients (Bruker BioSpin CO., Billerica, MA, USA). The pulse sequence used for the rumen fluid, serum, and urine were a Carr-Purcell-Meiboom-Gill pulse sequence collecting 64,000 data points with 128 transients, a spectral width of 16,025.641 Hz, a relaxion delay of 4.0 s, and an acquisition time of 2.0 s [69].

4.3. 1H-NMR Spectroscopy Data and Statistical Analysis

The processed spectra were imported the Chenomx NMR suite 8.4 software (Chenomx Inc., Edmonton, AB, Canada) for identification and quantification. The baseline and phase were matched for comparison between samples, using the NMR software. The following procedure was employed for qualitative and quantitative analysis of the metabolites in samples. The spectral width was 10 ppm and was referenced to the TSP signal at 0 ppm. The resources used were the Livestock Metabolite Database, Bovine Metabolite Database, and Chenomx library. Metabolite classification and quantitation were performed by using the Chenomx profiler program.
Statistical analyses of the metabolite data were conducted by using MetaboAnalyst version 4.0 [70], an open-source R-based program for metabolomics. The resulting metabolites were subjected to sample normalization by “sum”, data transformation by “log”, and data scaling by “pareto” during statistical analysis. Univariate Student’s t-tests were used to identify difference between metabolite profiles of the biofluid samples. Principal component analysis (PCA) and partial least square discriminant analysis (PLS-DA) were used as multivariate data analysis techniques, to generate a classification model and provide quantitative information for discriminating the metabolites. The different biofluid metabolites were determined on the basis of a statistically significant threshold of variable importance in projection (VIP) scores. Metabolites with VIP scores higher than 1.5 were obtained through PLS-DA.
Metabolic pathways analysis was performed using a Bos taurus pathway library. Metabolic pathways were common quantified, and different metabolites in biofluid metabolites of the other studied animals were statistically analyzed by MetaboAnalyst 4.0 for metabolic pathways analysis, which is based on database source by Kyoto Encyclopedia of Genes and Genomes [71].

5. Conclusions

1H-NMR spectroscopy and statistical analyses were employed to analyze the metabolites in Hanwoo steers rumen fluid, serum, and urine. The resulting metabolite measurements were mostly consistent with those reported in studies conducted outside Korea. This report will contribute for future Hanwoo metabolomic studies in Korea by serving as a reference guide.

Supplementary Materials

The following are available online at https://www.mdpi.com/2218-1989/10/8/333/s1, Figure S1: The classification of identified metabolites according to chemical class rumen fluid (a), serum (b), and urine (c). Each square box color indicates the classification of metabolites; the numbers and concentration in parentheses indicated measured metabolites and sum of the total concentrations of the measured metabolites, Table S1–S4: Identified metabolites concentrations of Hanwoo steers in rumen fluid, serum, and urine samples by 1H-NMR spectroscopy analysis (means ± standard deviation, n ≥ 2), Figure S2: Principal components analysis (PCA) scores plot based on metabolites data in rumen fluid, serum, and urine by 1H-NMR spectroscopy analysis. On the score plot, each point represents an individual sample, with the red dot representing the rumen fluid group (n = 6), green dot representing the serum group (n = 6), and blue dot representing urine group (n = 4). The abscissa and ordinate represent the variance associated with PC1 and 2, respectively, Figure S3: Partial least square discriminant analysis (PLS-DA) score plot of rumen fluid, serum, and urine by 1H-NMR spectroscopy analysis. The shaded ellipses represent the 95% confidence interval estimated from the score. On the score plot, each point represents an individual sample, with the red dot representing the rumen fluid group (n = 6), green dot representing the serum group (n = 6), and blue dot representing urine group (n = 4). The abscissa and ordinate represent the variance associated with component 1 and 2, respectively.

Author Contributions

Conceptualization, J.S.E., S.J.L. and S.S.L.; data curation, J.S.E., H.S.K. and Y.Y.C.; funding acquisition, S.H.K.; investigation, J.S.E., H.S.K., Y.Y.C. and Y.G.L.; methodology, S.J.L., S.H.K., and S.S.L.; project administration, S.J.L. and Y.G.L.; software, J.S.E., H.S.K. and Y.Y.C.; supervision, S.J.L. and S.S.L.; visualization, J.S.E. and H.S.K.; writing—original draft, J.S.E. and S.J.L.; writing—review and editing, J.S.E., S.J.L. and S.S.L. All authors have read and agreed to the published version of the manuscript.

Funding

This work was carried out with the support of “Cooperative Research Program for Agriculture Science and Technology Development (Project No. PJ01266401)” Rural Development Administration, Korea.

Conflicts of Interest

The authors declare no conflict of interest.

References

  1. Foroutan, A.; Goldansaz, S.A.; Lipfert, M.; Wishart, D.S. Protocols for NMR analysis in livestock metabolomics. In Metabolomics; Humana Press: New York, NY, USA, 2019; pp. 311–324. [Google Scholar]
  2. Belloque, J.; Ramos, M. Application of NMR spectroscopy to milk and dairy products. Trends Food Sci. Technol. 1999, 10, 313–320. [Google Scholar] [CrossRef]
  3. Song, Z.; Wang, H.; Yin, X.; Deng, P.; Jiang, W. Application of NMR metabolomics to search for human disease biomarkers in blood. Clin. Chem. Lab. Med. 2019, 57, 417–441. [Google Scholar] [CrossRef] [PubMed]
  4. De Castro, F.; Benedetti, M.; Del Coco, L.; Fanizzi, F.P. NMR-based metabolomics in metal-based drug research. Molecules 2019, 24, 2240. [Google Scholar] [CrossRef] [Green Version]
  5. Bo, Y.; Feng, J.; Xu, J.J.; Huang, Y.; Cai, H.; Cui, X.; Dong, J.; Ding, S.; Chen, Z. High-resolution pure shift NMR spectroscopy offers better metabolite discrimination in food quality analysis. Food Res. Int. 2019, 125, 108574. [Google Scholar] [CrossRef] [PubMed]
  6. Pontes, J.G.M.; Brasil, A.J.M.; Cruz, G.C.F.; De Souza, R.N.; Tasic, L. NMR-based metabolomics strategies: Plants, animals and humans. Anal. Methods 2017, 9, 1078–1096. [Google Scholar] [CrossRef]
  7. Van Soest, P.J. Nutritional Ecology of the Ruminant, 2nd ed.; Cornell University Press: Ithaca, NY, USA, 2019. [Google Scholar]
  8. Saleem, F.; Bouatra, S.; Guo, A.C.; Psychogios, N.; Mandal, R.; Dunn, S.M.; Ametaj, B.N.; Wishart, D.S. The bovine ruminal fluid metabolome. Metabolomics 2013, 9, 360–378. [Google Scholar] [CrossRef]
  9. Chandan, R.C.; Cullen, J.; Chapman, D. Physicochemical analyses of the bovine milk fat globule membrane. III. Proton magnetic resonance spectroscopy. J. Dairy Sci. 1972, 55, 1232–1236. [Google Scholar] [CrossRef]
  10. Foroutan, A.; Fitzsimmons, C.; Mandal, R.; Piri-Moghadam, H.; Zheng, J.; Guo, A.; Li, C.; Guan, L.L.; Wishart, D.S. The bovine metabolome. Metabolites 2020, 10, 233. [Google Scholar] [CrossRef]
  11. Zhao, S.; Zhao, J.; Bu, D.; Sun, P.; Wang, J.; Dong, Z. Metabolomics analysis reveals large effect of roughage types on rumen microbial metabolic profile in dairy cows. Lett. Appl. Microbiol. 2014, 59, 79–85. [Google Scholar] [CrossRef]
  12. O’Callaghan, T.F.; Vázquez-Fresno, R.; Serra-Cayuela, A.; Dong, E.; Mandal, R.; Hennessy, D.; McAuliffe, S.; Dillon, P.; Wishart, D.S.; Stanton, C.; et al. Pasture feeding changes the bovine rumen and milk metabolome. Metabolites 2018, 8, 27. [Google Scholar] [CrossRef] [Green Version]
  13. Min, L.; Zhao, S.; Tian, H.; Zhou, X.; Zhang, Y.; Li, S.; Yang, H.; Zheng, N.; Wang, J. Metabolic responses and “omics” technologies for elucidating the effects of heat stress in dairy cows. Int. J. Biometeorol. 2017, 61, 1149–1158. [Google Scholar] [CrossRef] [PubMed] [Green Version]
  14. Tian, H.; Zheng, N.; Wang, W.; Cheng, J.; Li, S.; Zhang, Y.; Wang, J. Integrated metabolomics study of the milk of heat-stressed lactating dairy cows. Sci. Rep. 2016, 6, 24208. [Google Scholar] [CrossRef] [PubMed]
  15. Van Gastelen, S.; Antunes-Fernandes, E.C.; Hettinga, K.A.; Dijkstra, J. Relationships between methane emission of Holstein Friesian dairy cows and fatty acids, volatile metabolites and non-volatile metabolites in milk. Animal 2017, 11, 1539–1548. [Google Scholar] [CrossRef] [PubMed]
  16. Bica, R.; Kew, W.; Uhrin, D.; Pacheco, D.; Macrae, A. Nuclear magnetic resonance to detect rumen metabolites associated with enteric methane emissions from beef cattle. Sci. Rep. 2020, 10, 5578. [Google Scholar] [CrossRef] [Green Version]
  17. Ametaj, B.N.; Zebeli, Q.; Saleem, F.; Psychogios, N.; Lewis, M.J.; Dunn, S.M.; Xia, J.; Wishart, D.S. Metabolomics reveals unhealthy alterations in rumen metabolism with increased proportion of cereal grain in the diet of dairy cows. Metabolomics 2010, 6, 583–594. [Google Scholar] [CrossRef]
  18. Maher, A.D.; Hayes, B.; Cocks, B.; Marett, L.; Wales, W.J.; Rochfort, S.J. Latent biochemical relationships in the blood-milk metabolic axis of dairy cows revealed by statistical integration of 1H NMR spectroscopic data. J. Proteome Res. 2013, 12, 1428–1435. [Google Scholar] [CrossRef]
  19. Nyberg, N.T.; Nielsen, M.O.; Jaroszewski, J.W. Metabolic trajectories based on 1H NMR spectra of urines from sheep exposed to nutritional challenges during prenatal and early postnatal life. Metabolomics 2010, 6, 489–496. [Google Scholar] [CrossRef]
  20. Lee, S.-H.; Park, B.-H.; Sharma, A.; Dang, C.-G.; Lee, S.-S.; Choi, T.-J.; Choy, Y.-H.; Kim, H.-C.; Jeon, K.-J.; Kim, S.-D.; et al. Hanwoo cattle: Origin, domestication, breeding strategies and genomic selection. J. Anim. Sci. Technol. 2014, 56, 2. [Google Scholar] [CrossRef] [Green Version]
  21. Kim, D.H.; Lee, S.J.; Oh, D.S.; Lee, I.D.; Eom, J.S.; Park, H.Y.; Choi, S.H.; Lee, S.S. In vitro evaluation of Rhus succedanea extracts for ruminants. Asian-Austral. J. Anim. Sci. 2018, 31, 1635–1642. [Google Scholar] [CrossRef] [Green Version]
  22. Lee, S.S.; Lee, S.J.; Lee, S.S.; Kim, E.T.; Jeong, J.S.; Lee, J.H.; Jeong, J.; Park, J.K.; Park, B.Y.; Jeong, H.Y.; et al. Effect of optimal sodium stearoyl-2-lactylate supplementation on growth performance and blood and carcass characteristics in Hanwoo steers during the early fattening period. Asian-Austral. J. Anim. Sci. 2018, 31, 1442–1448. [Google Scholar] [CrossRef]
  23. Eom, J.S.; Lee, S.J.; Lee, Y.G.; Lee, S.S. Comparison of volatile fatty acids, monosaccharide analysis and metabolic profiling in rumen fluid according to feeding methods. J. Korea Acad. Ind. Coop. Soc. 2018, 19, 814–824. [Google Scholar]
  24. Lee, J.; Choi, M.; Kang, J.; Chung, Y.; Jin, Y.; Kim, M.; Lee, Y.; Chang, Y.H. Physicochemical structural, pasting, and rheological properties of potato starch isolated from different cultivars. Korean J. Food. Sci. Technol. 2017, 49, 360–368. [Google Scholar]
  25. Jeong, J.-Y.; Hwang, G.-S.; Park, J.-C.; Kim, D.-H.; Ha, M. 1H NMR-based urinary metabolic profiling of gender and diurnal variation in healthy Korean subjects. Env. Heal. Toxicol. 2010, 25, 295–306. [Google Scholar]
  26. Jeong, J.Y.; Kim, M.S.; Jung, H.J.; Kim, M.J.; Lee, H.J.; Lee, S.D. Screening of the liver, serum, and urine of piglets fed zearalenone using a NMR-based metabolomic approach. Korean J. Environ. Agric. 2018, 45, 447–454. [Google Scholar]
  27. MacLeod, N.A.; Ørskov, E.R. Absorption and utilization of volatile fatty acids in ruminants. Can. J. Anim. Sci. 1984, 64, 354–355. [Google Scholar] [CrossRef]
  28. Gäbel, P.G.; Bestmann, M.; Martens, H. Influences of diet, short-chain fatty acids, lactate and chloride on bicarbonate movement across the reticulo-rumen wall of sheep. J. Vet. Med. Ser. A 1991, 38, 523–529. [Google Scholar] [CrossRef] [PubMed]
  29. Owens, F.N.; Secrist, D.S.; Hill, W.J.; Gill, D.R. Acidosis in cattle: A review. J. Anim. Sci. 1998, 76, 275–286. [Google Scholar] [CrossRef]
  30. Saleem, F.; Ametaj, B.N.; Bouatra, S.; Mandal, R.; Zebeli, Q.; Dunn, S.M.; Wishart, D.S. A metabolomics approach to uncover the effects of grain diets on rumen health in dairy cows. J. Dairy Sci. 2012, 95, 6606–6623. [Google Scholar] [CrossRef] [Green Version]
  31. Wang, D.S.; Zhang, R.Y.; Zhu, W.Y.; Mao, S.Y. Effects of subacute ruminal acidosis challenges on fermentation and biogenic amines in the rumen of dairy cows. Livest. Sci. 2013, 155, 262–272. [Google Scholar] [CrossRef]
  32. Lee, D.H. Methods for genetic parameter estimations of carcass weight, longissimus muscle area and marbling score in Korean cattle. J. Anim. Sci. Technol. 2004, 46, 509–516. [Google Scholar]
  33. Beauchemin, K.A.; Kreuzer, M.; O’Mara, F.; McAllister, T.A. Nutritional management for enteric methane abatement: A review. Aust. J. Exp. Agric. 2008, 48, 21–27. [Google Scholar] [CrossRef]
  34. IPCC. Climate Change 2014. Synthesis Report. Contribution of Working Groups I, II and III to the Fifth Assessment Report of the Intergovernmental Panel on Climate Change; IPCC: Geneva, Switzerland, 2014; ISBN 9789291691432. [Google Scholar]
  35. Johnson, K.A.; Johnson, D.E. Methane emissions from cattle. J. Anim. Sci. 1995, 73, 2483–2492. [Google Scholar] [CrossRef] [PubMed]
  36. Tapio, I.; Snelling, T.J.; Strozzi, F.; Wallace, R.J. The ruminal microbiome associated with methane emissions from ruminant livestock. J. Anim. Sci. Biotechnol. 2017, 8, 1–11. [Google Scholar] [CrossRef] [PubMed]
  37. Martin, C.; Morgavi, D.P.; Doreau, M. Methane mitigation in ruminants: From microbe to the farm scale. Animal 2010, 4, 351–365. [Google Scholar] [CrossRef] [Green Version]
  38. Balch, W.E.; Fox, G.E.; Magrum, L.J.; Woese, C.R.; Wolfe, R.S. Methanogens: Reevaluation of a unique biological group. Microbiol. Rev. 1979, 43, 260–296. [Google Scholar] [CrossRef] [Green Version]
  39. Hayward, H.R.; Stadtman, T.C. Anaerobic degradation of choline I., Vibrio cholinicusn. sp: Fermentation of choline by an anaerobic, cytochrome-producing bacterium1. J. Bacteriol. 1959, 78, 557–561. [Google Scholar] [CrossRef] [Green Version]
  40. Baker, F.D.; Papiska, H.R.; Campbell, L.L. Choline fermentation by Desulfovibrio desulfuricans. J. Bacteriol. 1962, 84, 973–978. [Google Scholar] [CrossRef] [Green Version]
  41. Neill, A.R.; Grime, D.W.; Dawson, R.M.C. Conversion of choline methyl groups through trimethylamine into methane in the rumen. Biochem. J. 1978, 170, 529–535. [Google Scholar] [CrossRef] [Green Version]
  42. Asanuma, N.; Iwamoto, M.; Hino, T. Formate metabolism by ruminal microorganisms in relation to methanogenesis. Nihon Chikusan Gakkaiho 1998, 69, 576–584. [Google Scholar] [CrossRef]
  43. Asanuma, N.; Iwamoto, M.; Hino, T. Effect of the addition of fumarate on methane production by ruminal microorganisms in vitro. J. Dairy Sci. 1999, 82, 780–787. [Google Scholar] [CrossRef]
  44. Lopez, S.; McIntosh, F.M.; Wallace, R.J.; Newbold, C.J. Effect of adding acetogenic bacteria on methane production by mixed rumen microorganisms. Anim. Feed Sci. Technol. 1999, 78, 1–9. [Google Scholar] [CrossRef]
  45. Ungerfeld, E.M.; Rust, S.R.; Burnett, R. Attempts to inhibit ruminai methanogenesis by blocking pyruvate oxidative decarboxylation. Can. J. Microbiol. 2003, 49, 650–654. [Google Scholar] [CrossRef] [PubMed]
  46. Callaway, T.R.; Martin, S.A. Effects of cellobiose and monensin on in vitro fermentation of organic acids by mixed ruminal bacteria. J. Dairy Sci. 1997, 80, 1126–1135. [Google Scholar] [CrossRef]
  47. Martin, S.A.; Park, C.M. Effect of extracellular hydrogen on organic acid utilization by the ruminai bacterium Selenomonas ruminantium. Curr. Microbiol. 1996, 32, 327–331. [Google Scholar] [CrossRef]
  48. Newbold, C.J.; López, S.; Nelson, N.; Ouda, J.O.; Wallace, R.J.; Moss, A.R. Propionate precursors and other metabolic intermediates as possible alternative electron acceptors to methanogenesis in ruminal fermentation in vitro. Br. J. Nutr. 2005, 94, 27–35. [Google Scholar] [CrossRef] [Green Version]
  49. Grummer, R.R. Etiology of lipid-related metabolic disorders in periparturient dairy cows. J. Dairy Sci. 1993, 76, 3882–3896. [Google Scholar] [CrossRef]
  50. Butler, W.R.; Smith, R.D. Interrelationships between energy balance and postpartum reproductive function in dairy cattle. J. Dairy Sci. 1989, 72, 767–783. [Google Scholar] [CrossRef]
  51. Collard, B.L.; Boettcher, P.J.; Dekkers, J.C.M.; Petitclerc, D.; Schaeffer, L.R. Relationships between energy balance and health traits of dairy cattle in early lactation. J. Dairy Sci. 2000, 83, 2683–2690. [Google Scholar] [CrossRef]
  52. Van der Drift, S.G.A.; Houweling, M.; Schonewille, J.T.; Tielens, A.G.M.; Jorritsma, R. Protein and fat mobilization and associations with serum β-hydroxybutyrate concentrations in dairy cows. J. Dairy Sci. 2012, 95, 4911–4920. [Google Scholar] [CrossRef]
  53. Weikard, R.; Altmaier, E.; Suhre, K.; Weinberger, K.M.; Hammon, H.M.; Albrecht, E.; Setoguchi, K.; Takasuga, A.; Kühn, C. Metabolomic profiles indicate distinct physiological pathways affected by two loci with major divergent effect on Bos taurus growth and lipid deposition. Physiol. Genom. 2010, 42A, 79–88. [Google Scholar] [CrossRef] [Green Version]
  54. Xu, W.; Vervoort, J.; Saccenti, E.; van Hoeij, R.; Kemp, B.; van Knegsel, A. Milk metabolomics data reveal the energy balance of individual dairy cows in early lactation. Sci. Rep. 2018, 8, 1–11. [Google Scholar] [CrossRef] [PubMed] [Green Version]
  55. Van Hoeij, R.J.; Dijkstra, J.; Bruckmaier, R.M.; Gross, J.J.; Lam, T.J.G.M.; Remmelink, G.J.; Kemp, B.; van Knegsel, A.T.M. The effect of dry period length and postpartum level of concentrate on milk production, energy balance, and plasma metabolites of dairy cows across the dry period and in early lactation. J. Dairy Sci. 2017, 100, 5863–5879. [Google Scholar] [CrossRef] [PubMed] [Green Version]
  56. Xu, W.; Vervoort, J.; Saccenti, E.; Kemp, B.; van Hoeij, R.J.; van Knegsel, A.T.M. Relationship between energy balance and metabolic profiles in plasma and milk of dairy cows in early lactation. J. Dairy Sci. 2020, 103, 4795–4805. [Google Scholar] [CrossRef] [PubMed]
  57. Blakebrough-Hall, C.; Dona, A.; D’occhio, M.J.; McMeniman, J.; González, L.A. Diagnosis of bovine respiratory disease in feedlot cattle using blood 1H NMR metabolomics. Sci. Rep. 2020, 10, 1–12. [Google Scholar] [CrossRef]
  58. Cusack, P.M.V.; McMeniman, N.; Lean, I.J. The medicine and epidemiology of bovine respiratory disease in feedlots. Aust. Vet. J. 2003, 81, 480–487. [Google Scholar] [CrossRef]
  59. Basoglu, A.; Baspinar, N.; Tenori, L.; Vignoli, A.; Yildiz, R. Plasma metabolomics in calves with acute bronchopneumonia. Metabolomics 2016, 12, 128. [Google Scholar] [CrossRef]
  60. Dervishi, E.; Zhang, G.; Hailemariam, D.; Goldansaz, S.A.; Deng, Q.; Dunn, S.M.; Ametaj, B.N. Alterations in innate immunity reactants and carbohydrate and lipid metabolism precede occurrence of metritis in transition dairy cows. Res. Vet. Sci. 2016, 104, 30–39. [Google Scholar] [CrossRef]
  61. Dervishi, E.; Zhang, G.; Hailemariam, D.; Mandal, R.; Wishart, D.S.; Ametaj, B.N. Urine metabolic fingerprinting can be used to predict the risk of metritis and highlight the pathobiology of the disease in dairy cows. Metabolomics 2018, 14, 83. [Google Scholar] [CrossRef]
  62. Van Nuffel, A.; Zwertvaegher, I.; Pluym, L.; Van Weyenberg, S.; Thorup, V.M.; Pastell, M.; Sonck, B.; Saeys, W. Lameness detection in dairy cows: Part 1. How to distinguish between non-lame and lame cows based on differences in locomotion or behavior. Animals 2015, 5, 838–860. [Google Scholar] [CrossRef] [Green Version]
  63. Garbarino, E.J.; Hernandez, J.A.; Shearer, J.K.; Risco, C.A.; Thatcher, W.W. Effect of lameness on ovarian activity in postpartum Holstein cows. J. Dairy Sci. 2004, 87, 4123–4131. [Google Scholar] [CrossRef] [Green Version]
  64. Zhang, G.; Dervishi, E.; Zwierzchowski, G.; Mandal, R.; Wishart, D.S.; Ametaj, B.N. Urinary metabolomics around parturition identifies metabolite alterations in dairy cows affected postpartum by pameness: Preliminary study. Dairy 2020, 1, 2. [Google Scholar] [CrossRef] [Green Version]
  65. AOAC International. Association of the Official Analytical Chemists (AOAC): Official Methods of Analysis, 20th ed.; AOAC: Washington, DC, USA, 2016. [Google Scholar]
  66. Van Soest, P.J.; Robertson, J.B.; Lewis, B.A. Methods for dietary fiber, neutral detergent fiber, and nonstarch polysaccharides in relation to animal nutrition. J. Dairy Sci. 1991, 74, 3583–3597. [Google Scholar] [CrossRef]
  67. Sun, Y.; Xu, C.; Li, C.; Xia, C.; Xu, C.; Wu, L.; Zhang, H. Characterization of the serum metabolic profile of dairy cows with milk fever using 1H-NMR spectroscopy. Vet. Q. 2014, 34, 159–163. [Google Scholar] [CrossRef] [PubMed]
  68. Bertram, H.C.; Yde, C.C.; Zhang, X.; Kristensen, N.B. Effect of dietary nitrogen content on the urine metabolite profile of dairy cows assessed by nuclear magnetic resonance (NMR)-based metabolomics. J. Agric. Food Chem. 2011, 59, 12499–12505. [Google Scholar] [CrossRef]
  69. Kim, M.S.; Kim, I.Y.; Sung, H.R.; Nam, M.; Kim, Y.J.; Kyung, D.S.; Seong, J.K.; Hwang, G.S. Metabolic dysfunction following weight regain compared to initial weight gain in a high-fat diet-induced obese mouse model. J. Nutr. Biochem. 2019, 69, 44–52. [Google Scholar] [CrossRef]
  70. Chong, J.; Soufan, O.; Li, C.; Caraus, I.; Li, S.; Bourque, G.; Wishart, D.S.; Xia, J. MetaboAnalyst 4.0: Towards more transparent and integrative metabolomics analysis. Nucleic Acids Res. 2018, 46, W486–W494. [Google Scholar] [CrossRef] [Green Version]
  71. Zhu, C.; Li, C.; Wang, Y.; Laghi, L. Characterization of yak common biofluids metabolome by means of proton nuclear magnetic resonance spectroscopy. Metabolites 2019, 9, 41. [Google Scholar] [CrossRef] [Green Version]
Figure 1. The representative spectrum 1H-NMR spectroscopy obtained from Hanwoo steers rumen fluid. Metabolite spectra numbers: (1) acetate, (2) propionate, (3) butyrate, (4) valerate, (5) isobutyrate, (6) isovalerate, (7) phenylacetate, (8) 3-phenylpropionate, (9) N-acetylglycine, (10) trimethylamine, (11) alanine, (12) 3-hydroxyphenylacetate, (13) cadaverine, (14) methylamine, (15) choline, (16) dimethylamine, (17) ethanol, (18) adenine, (19) anserine, (20) isoleucine, (21) phenylalanine, (22) uridine, (23) tyrosine, (24) galacarate, (25) threonine, (26) leucine, (27) methionine, (28) xanthine, (29) uracil, (30) ô-methylhistidine, (31) sucrose, (32) p-Cresol, (33) mannose, (34) O-acetylcholine, (35) creatine phosphate, (36) choline, (37) hypoxanthine, (38) gentisate, (39) thymidine, (40) malonate, (41) benzoate, (42) acetoacetate, (43) isopropanol, (44) 1,7-dimethylxanthine, (45) glycine, (46) thymol, (47) N,N-dimethylglycine, (48) N-nitrosodimethylamine, (49) creatine, (50) 4-pyridoxate, (51) O-phosphocholine, (52) 2-hydroxyisobutyrate, (53) histamine, (54) N-methylhydantoin, (55) tartrate, (56) betaine, (57) methanol, (58) dimethyl sulfone, (59) sarcosine, and (60) TSP. Detailed list of identified signals in this spectrum and corresponding metabolites in provided as Livestock Metabolites Database and Bovine Metabolites Database website.
Metabolites 10 00333 g001
Figure 2. The representative spectrum 1H-NMR spectroscopy obtained from Hanwoo steers serum. Metabolite spectra numbers: (1) glucose, (2) ribose, (3) 2-hydroxyisovalerate, (4) acetate, (5) 3-hydroxybutyrate, (6) isoleucine, (7) betaine, (8) lactulose, (9) leucine, (10) creatine phosphate, (11) methionine (12) 3-hydroxyisovalerate, (13) ascorbate, (14) acetoacetate, (15) anserine, (16) creatine, (17) valine, (18) methylhistidine, (19) levulinate, (20) malonate, (21) N-acetyltyrosine, (22) clycolate, (23) trimethylamine N-oxide, (24) acetone, (25) formate, (26) tyrosine, (27) lactate, and (28) TSP. A detailed list of identified signals in this spectrum and corresponding metabolites is provided by the Livestock Metabolites Database and Bovine Metabolites Database website.
Metabolites 10 00333 g002
Figure 3. The representative spectrum 1H-NMR spectroscopy obtained from Hanwoo steers urine. Metabolite spectra numbers: (1) urea, (2) hippurate, (3) N-phenylacetylglycine, (4) creatine, (5) trimethylamine N-oxide, (6) glycolate, (7) 3-indoxylsulfate, (8) taurine, (9) 2-hydroxyvalerate, (10) acetate, (11) benzoate, (12) valerate, (13) 4-hydorxy-3-methoxymandelate, (14) 2-methylglutarate, (15) pantothenate, (16) dimethylamine, (17) malonate, (18) formate, (19) dimethyl sulfone, (20) 2-hydroxy-3-methylvalerate, (21) gluconate, (22) kynurenine, (23) mandelate, (24) salicylurate, (25) arabinose, (26) xanthine, (27) allantoin, (28) citrate, (29) galactarate, (30) xanthurenate, (31) cis-aconitate, (32) 3-phenylpropionate, (33) gentisate, (34) 4-hydroxyphenylacetate, (35) histamine, (36) 3-hydroxy-3-methylglutarate, (37) fucose, (38) guanidoacetate, (39) glucose-6-phosphate, (40) methylsuccinate, (41) 3-hydroxyphenylacetate, (42) xylose, (43) carnosine, (44) levulinate, (45) alanine, (46) succinylacetone, (47) creatinine, (48) urocanate, (49) vanillate, (50) N-acetyltyrosine, (51) carnitine, (52) N-methylhydantoin, (53) p-Cresol, (54) betaine, (55) 2,3,4-trihydroxybenzoate, (56) niacinamide, (57) theophylline, (58) sarcosine, (59) 1-3-dimethylurate, (60) methylamine, (61) oxypurinol, (62) hydroxyacetone, and (63) TSP. Detailed list of identified signals in this spectrum and corresponding metabolites in provided as Livestock Metabolites Database and Bovine Metabolites Database website.
Metabolites 10 00333 g003
Figure 4. Variable importance in projection (VIP) scores of metabolites in rumen fluid, serum, and urine by 1H-NMR spectroscopy analysis. The selected metabolites were those with VIP > 1.5. Heat map with red, yellow, and green boxes on the right indicates high, medium, and low abundance ratio, respectively, of the corresponding metabolites in rumen fluid, serum, and urine. VIP score was based on the PLS-DA model. VIP score value: butyrate, 2.519; propionate, 2.3206; isovalerate, 2.2261; acetamide, 2.1425; hippurate, 2.1361; proline, 2.042; uracil, 1.9373; formate, 1.8968; phenylalanine, 1.8699; N-agly, 1.8437; glucose, 1.8247; MSA, 1.8246; isobutyrate, 1.8232; DOPAC, 1.7143; N-PAG, 1.6764; allantoin, 1.6705; 4-HPLA, 1.6377; valerate, 1.6234; sarcosine, 1.6145; 5-MH, 1.5633; TMNO, 1.5159; galactarate, 1.5065. Metabolites abbreviation: N-agly, N-acetylglycine; MSA, methylsuccinate; DOPAC, 3,4-dihydroxybenzeneacetate; N-PAG, N-phenylacetylglycine; 4-HPLA, 4-hydroxyphenyllactate; 5-MH, 5-methylhisidine; TMNO, trimethylamine N-oxide.
Metabolites 10 00333 g004
Figure 5. Metabolic pathways evidenced by enrichment analysis based on the metabolites common quantified in rumen fluid, serum, and urine (impact value ≥ 0.5). The x-axis represents the biofluid samples, and y-axis represents the impact value. The number on each bar graph is match status. Match status is hit/total. The total is the total number of compounds in the pathway; the hits is the actually matched number.
Metabolites 10 00333 g005
Table 1. Top 30 concentration (mean ± standard deviation) of metabolites quantified (n ≥ 4) in rumen fluid by 1H-NMR spectroscopy of Hanwoo steers.
MetabolitesClassConcentration (μM/L)
AcetateOrganic acids28,172.77 ± 4924.54
PropionateOrganic acids8126.70 ± 1341.28
ButyrateOrganic acids6021.97 ± 1140.22
ValerateOrganic acids940.82 ± 187.60
GlucoseCarbohydrates632.42 ± 387.16
IsobutyrateOrganic acids495.55 ± 168.30
IsovalerateOrganic acids470.08 ± 144.26
AcetamideOrganic acids237.18 ± 47.79
RiboseCarbohydrates231.48 ± 50.74
3-phenylpropionateOthers223.40 ± 55.69
PhenylacetateOrganic acids220.22 ± 49.20
3-methylglutarateLipids214.75 ± 67.05
AlanineAmino acids195.65 ± 51.88
MaltoseCarbohydrates178.13 ± 278.73
CaprateLipids160.80 ± 58.72
ProlineAmino acids119.20 ± 40.69
N-acetylglucosamineCarbohydrates112.55 ± 16.91
UreaAliphatic acylic compounds86.56 ± 55.54
N-carbamoylaspartateCarboxylic acids86.07 ± 33.83
XanthineNucleosides, nucleotides70.03 ± 12.87
N-acetylglycineCarboxylic acids61.42 ± 64.75
GlycineAmino acids61.26 ± 41.85
UracilNucleosides, nucleotides58.87 ± 17.19
ThreonineAmino acids57.50 ± 12.14
IsoleucineAmino acids57.47 ± 22.42
GlycerateAmino acids52.57 ± 42.20
LactuloseCarbohydrates52.36 ± 40.70
PyruvateCarbohydrates51.98 ± 27.61
3-hydroxy-3-methylglutarateLipids51.50 ± 33.29
N-alpha-acetyllysineCarboxylic acids51.08 ± 53.04
Table 2. Top 30 concentration (mean ± standard deviation) of metabolites quantified (n ≥ 4) in serum by 1H-NMR spectroscopy of Hanwoo steers.
MetabolitesClassConcentration (μM/L)
GlucoseCarbohydrates603.60 ± 143.82
LactateOrganic acids223.53 ± 40.57
2-hydroxyisovalerateLipids96.33 ± 23.44
AcetateOrganic acids73.38 ± 25.19
3-hydroxybutyrateLipids63.00 ± 20.58
IsoleucineAmino acids36.62 ± 7.19
CreatinineImidazolinones30.23 ± 10.07
LeucineAmino acids25.63 ± 5.77
GluconateOrganic acids21.63 ± 11.66
sn-glycero-3-phosphocholineOthers21.22 ± 5.58
trans-4-hydroxy-L-prolineCarboxylic acids15.98 ± 4.73
CarnitineLipids13.20 ± 10.06
3-hydroxyisovalerateCarboxylic acids8.63 ± 8.41
Creatine phosphateCarboxylic acids8.03 ± 5.17
GlycylprolineCarboxylic acids7.96 ± 3.84
AcetoacetateCarbohydrates7.58 ± 4.70
LactuloseCarbohydrates7.03 ± 4.81
AscorbateOthers5.98 ± 1.58
MalonateCarboxylic acids5.85 ± 1.56
CreatineAmino acids5.70 ± 1.17
ValineAmino acids5.17 ± 0.21
3-methylhistidineOthers4.30 ± 1.71
GlycolateLipids4.32 ± 2.91
LevulinateOthers3.90 ± 0.59
AcetoinOthers3.72 ± 2.17
SuccinylacetoneOrganic acids3.58 ± 1.31
2-hydroxyphenylacetateOthers3.30 ± 1.71
5-aminolevulinateCarboxylic acids2.70 ± 1.50
N-acetylglucosamineCarbohydrates2.47 ± 0.06
N-nitrosodimethylamineOrganic acids2.20 ± 1.67
Table 3. Top 30 concentration (mean ± standard deviation) of metabolites quantified (n ≥ 3) in urine by 1H-NMR spectroscopy of Hanwoo steers.
MetabolitesClassConcentration (μM/L)
UreaAliphatic acylic compounds51,262.08 ± 28,840.87
HippurateAmino acids8332.20 ± 7592.61
N-phenylacetylglycineAmino acids5273.43 ± 2722.36
GlycolateLipids1721.83 ± 2935.46
Trimethylamine N-oxideAliphatic acylic compounds938.30 ± 811.19
AllantoinImidazolinones769.23 ± 1019.92
2-hydroxyvalerateLipids509.77 ± 354.91
RiboseCarbohydrates442.70 ± 312.08
BenzoateOrganic acids427.80 ± 86.02
GlycineAmino acids402.90 ± 153.29
AcetateOrganic acids310.50 ± 161.75
GuanidoacetateCarboxylic acids258.45 ± 239.55
CreatineAmino acids257.65 ± 374.33
GlucuronateCarbohydrates255.87 ± 178.89
GalactarateOthers178.25 ± 119.45
XanthineNucleosides, nucleotides175.48 ± 101.52
DimethylamineAmines169.97 ± 151.11
FormateOrganic acids153.53 ± 64.46
3-indoxylsulfateIndoles133.60 ± 76.22
XylitolCarbohydrates121.90 ± 71.35
2-methylglutarateLipids105.37 ± 49.52
cis-aconitateCarboxylic acids102.73 ± 85.26
GlycylprolineCarboxylic acids97.35 ± 58.11
2-hydroxyisocaproateLipids94.97 ± 41.50
MandelateBenzoic acids93.70 ± 31.86
KynurenineAmines82.60 ± 57.39
GentisateBenzoic acids78.60 ± 18.26
PhenylacetateOrganic acids76.63 ± 30.07
SalicylurateBenzoic acids74.90 ± 81.77
3-phenylpropionateOthers70.97 ± 46.43
Table 4. Concentration (mean ± standard deviation) of common metabolites quantified (n ≥ 4) in three biofluids by 1H-NMR spectroscopy of Hanwoo steers.
Metabolites aClass bRumen Fluid (μM/L)Serum (μM/L)Urine (μM/L)
2-HPAOthers17.55 ± 10.113.30 ± 1.7131.08 ± 16.22
3-HIVCOOH26.68 ± 22.458.63 ± 8.4122.15 ± 17.84
VMABZA1.37 ± 0.121.06 ± 0.2219.75 ± 12.83
4-PyridoxateOthers6.56 ± 5.520.85 ± 0.1911.98 ± 9.00
5-HIAAIndoles11.10 ± 6.372.37 ± 0.9036.27 ± 21.16
AcetateOA28,172.77 ± 4924.5473.38 ± 25.19310.50 ± 161.75
AcetoacetateCHO10.85 ± 7.037.58 ± 4.7060.75 ± 56.84
AnserineAA24.65 ± 10.432.18 ± 1.5220.50 ± 5.64
BetaineOthers1.37 ± 0.750.52 ± 0.3060.43 ± 33.89
CarnitineLipids14.40 ± 14.2013.20 ± 10.0621.13 ± 20.32
GlycylprolineCOOH45.17 ± 23.347.96 ± 3.8497.35 ± 58.11
GuanidoacetateCOOH25.90 ± 12.472.15 ± 2.14258.45 ± 239.55
IsoleucineAA57.47 ± 22.4236.62 ± 7.1914.07 ± 2.72
MalonateCOOH15.78 ± 7.155.85 ± 1.5646.70 ± 44.64
NDMAOA12.17 ± 5.402.20 ± 1.6718.95 ± 4.27
PantothenateCOOH7.93 ± 3.071.20 ± 0.2629.35 ± 9.43
SuccinylacetoneOA8.30 ± 5.413.58 ± 1.3142.15 ± 26.69
SyringateBZA2.63 ± 0.290.38 ± 0.0811.15 ± 19.38
ThymolLipids14.33 ± 4.861.97 ± 0.3227.63 ± 13.40
a Metabolites abbreviations: 2-HPA, 2-hydroxyphenylacetate; 3-HIV, 3-hydroxyisovalerate; VMA, 4-hydroxy-3-methoxymandelate; 5-HIAA, 5-hydroxyindole-3-acetate; NDMA, N-nitrosodimethylamine. b Class abbreviations: COOH, carboxylic acids; BZA, benzoic acids; OA, organic acids; CHO, carbohydrates; AA, amino acids.

