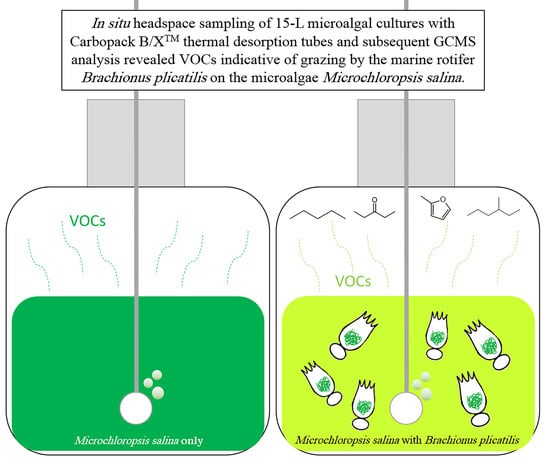
Low Molecular Weight Volatile Organic Compounds Indicate Grazing by the Marine Rotifer Brachionus plicatilis on the Microalgae Microchloropsis salina


Abstract
:
1. Introduction
2. Results and Discussion
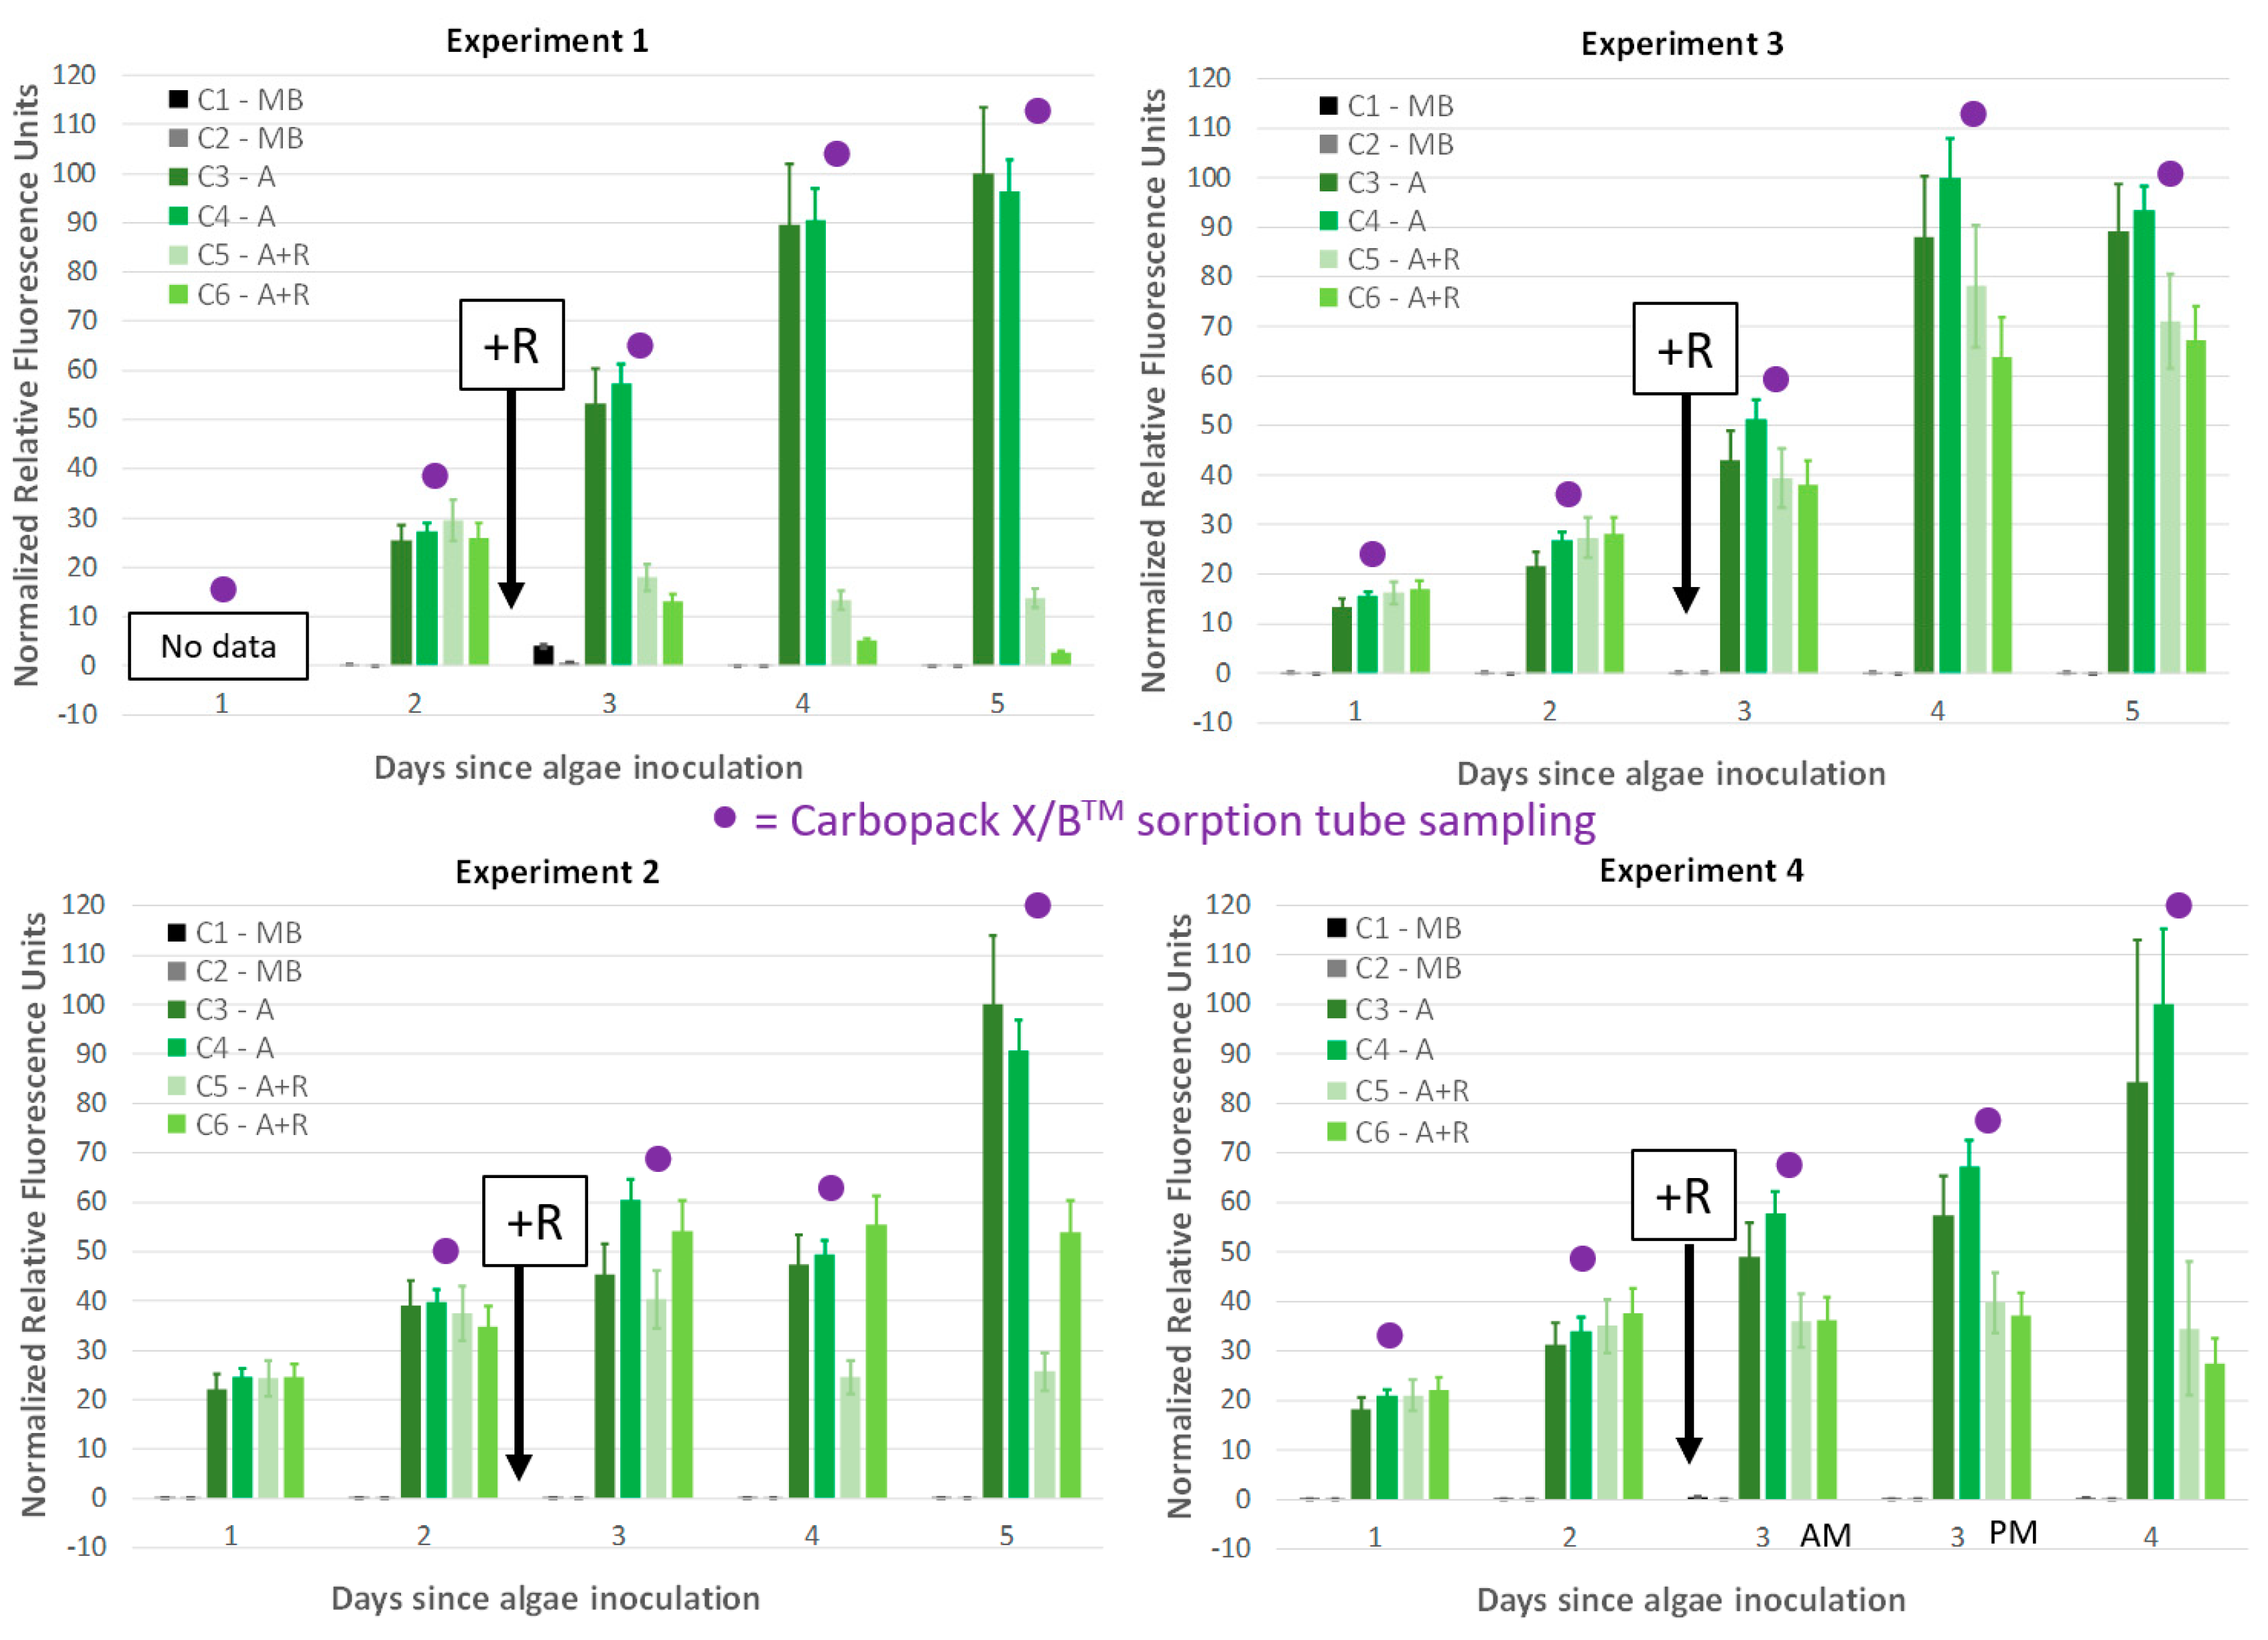
2.1. Headspace Sampling with Carbopack B/X™ Sorption Tubes
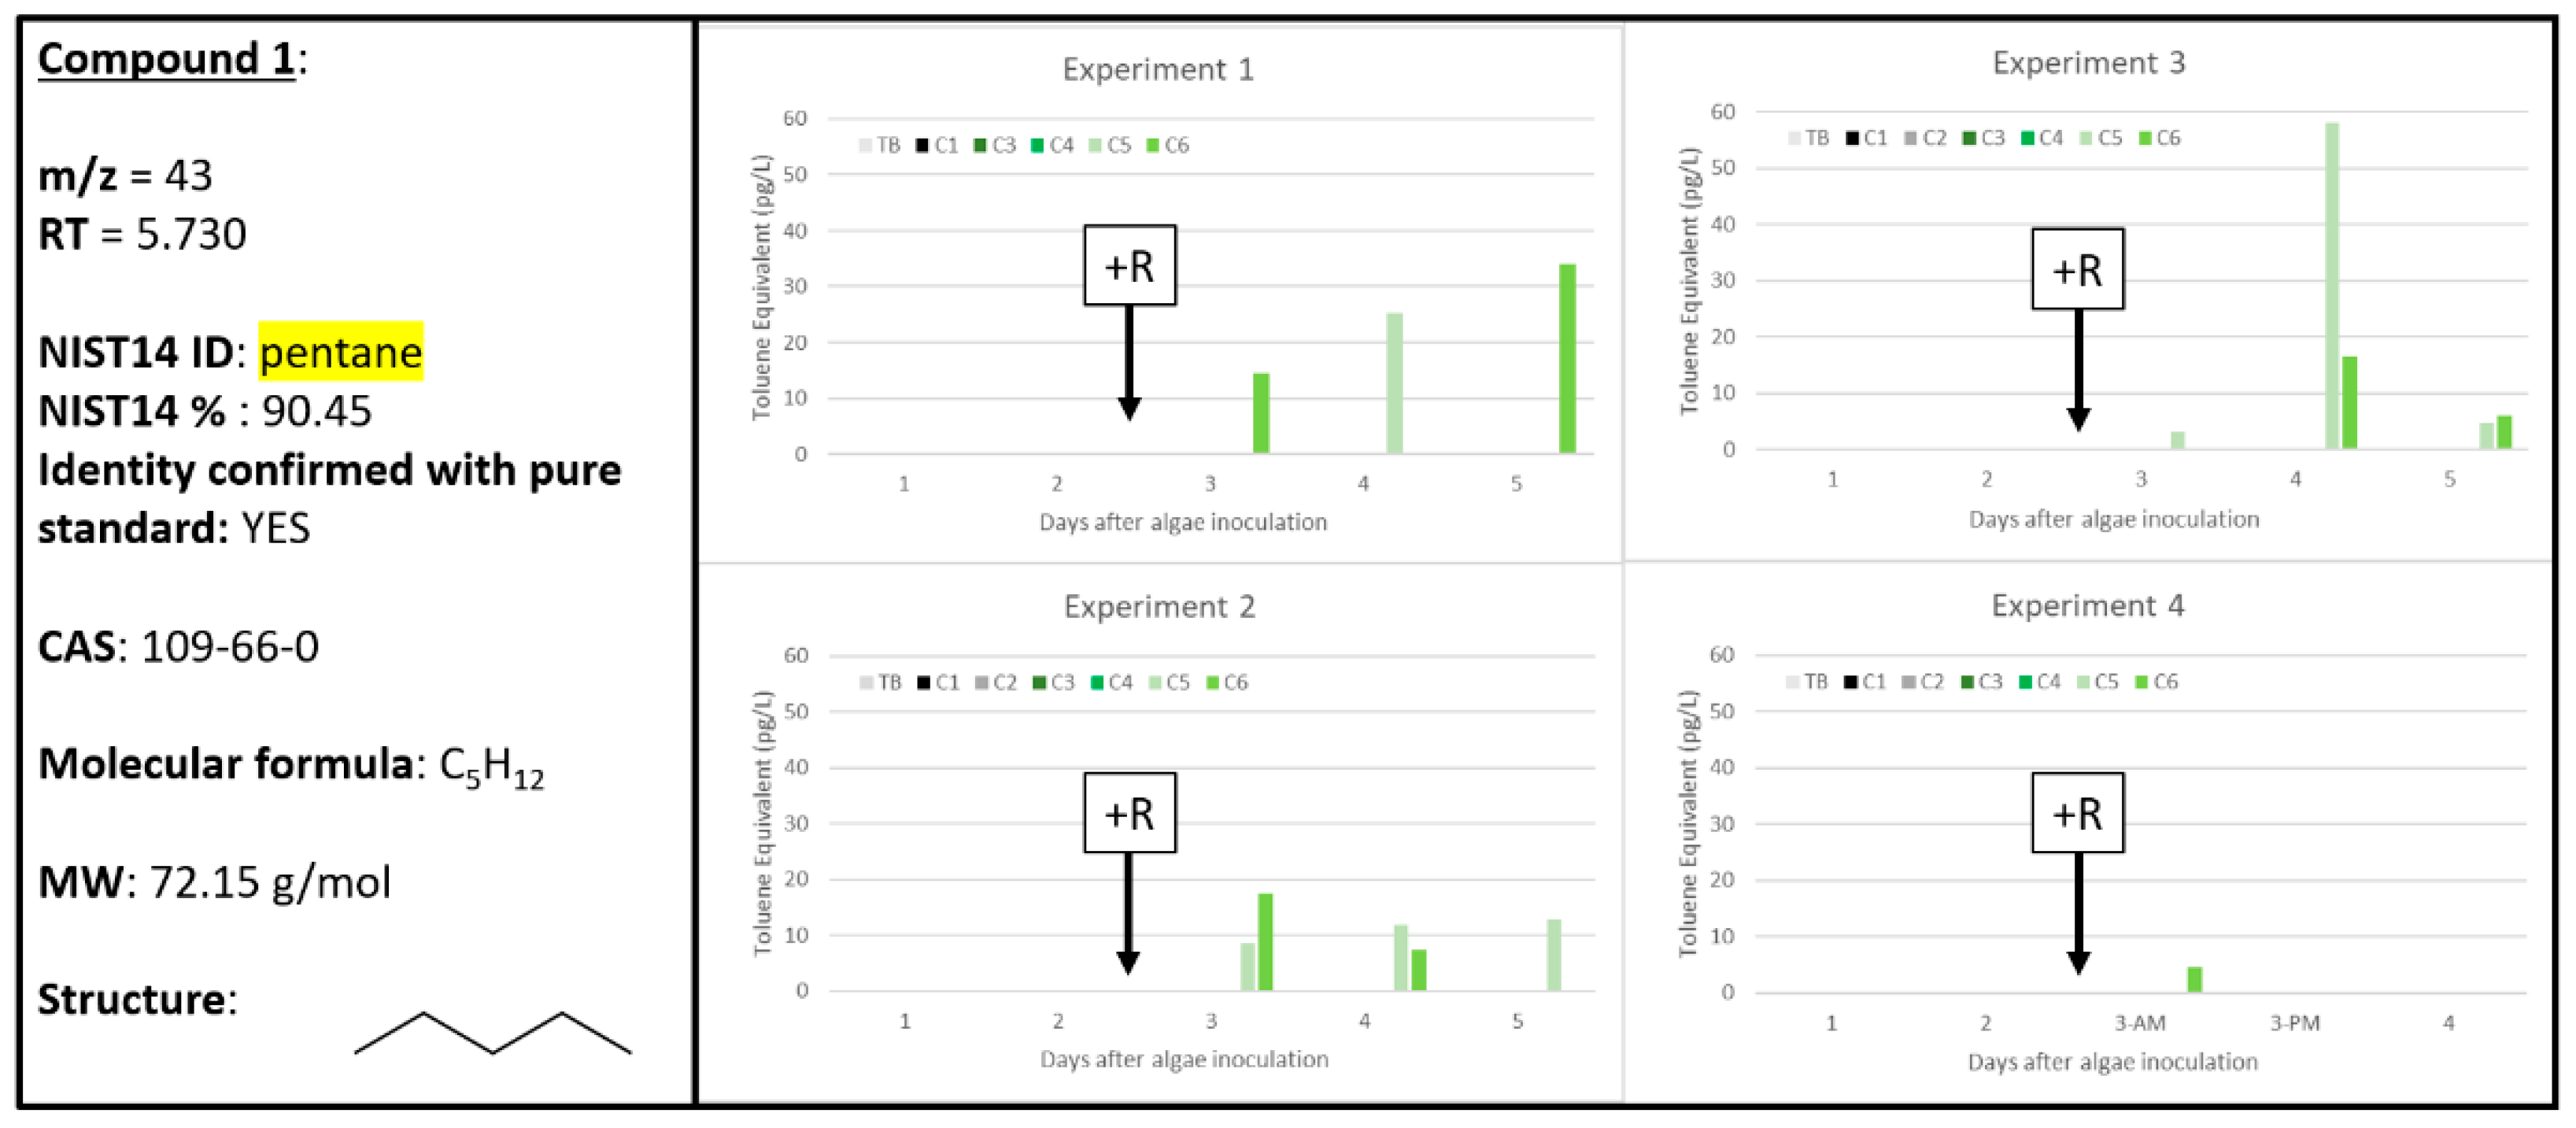
2.2. Compound 1
2.3. Compound 2
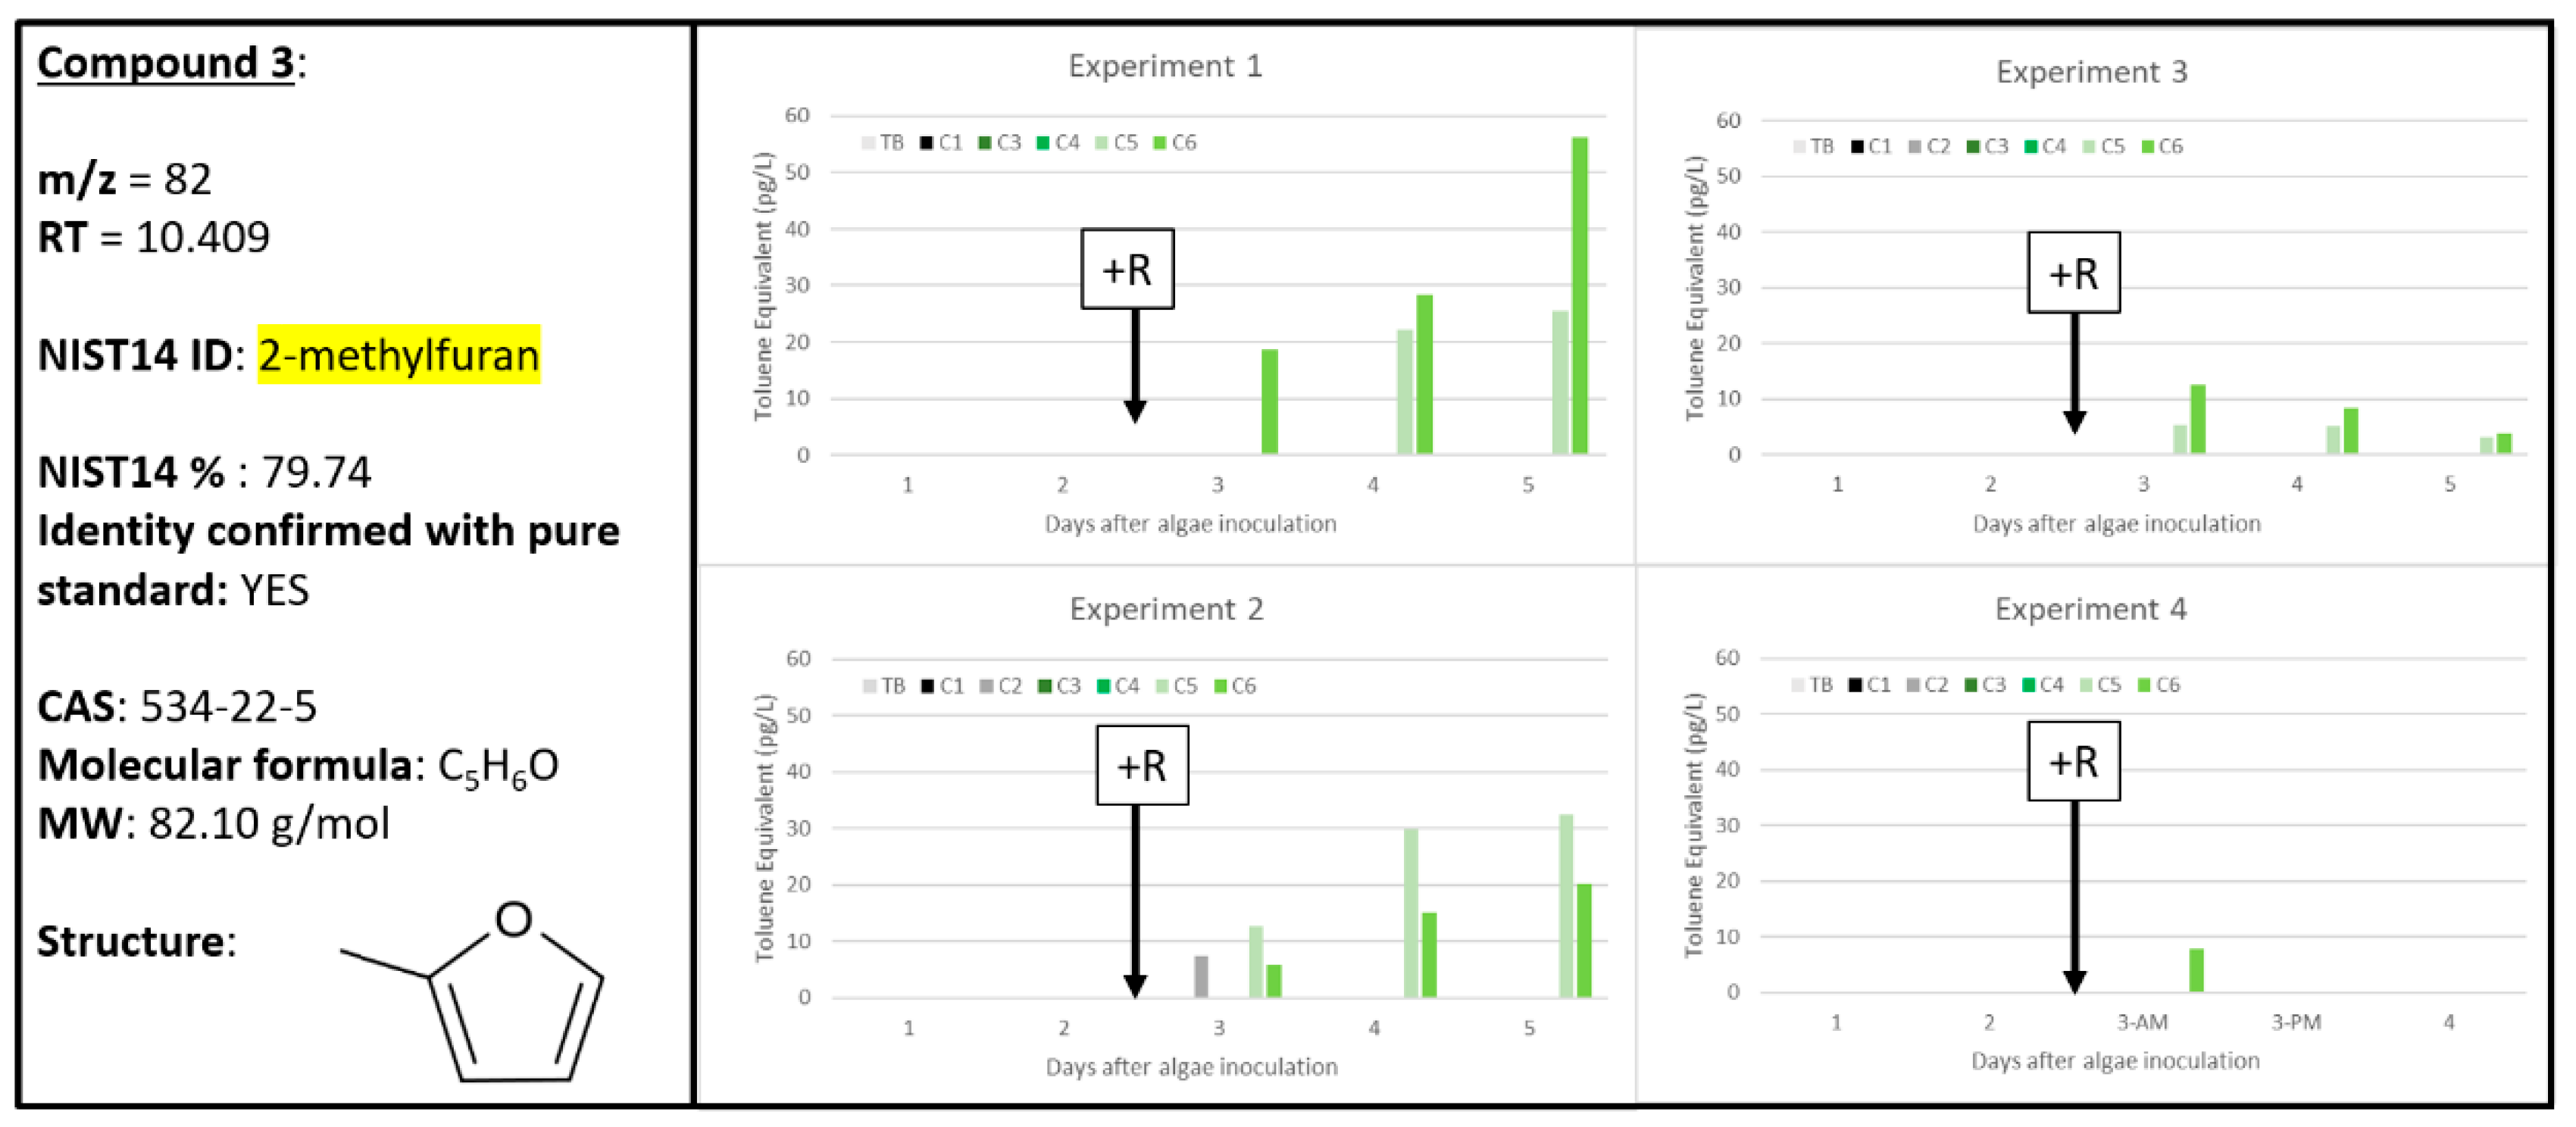
2.4. Compounds 3 and 4
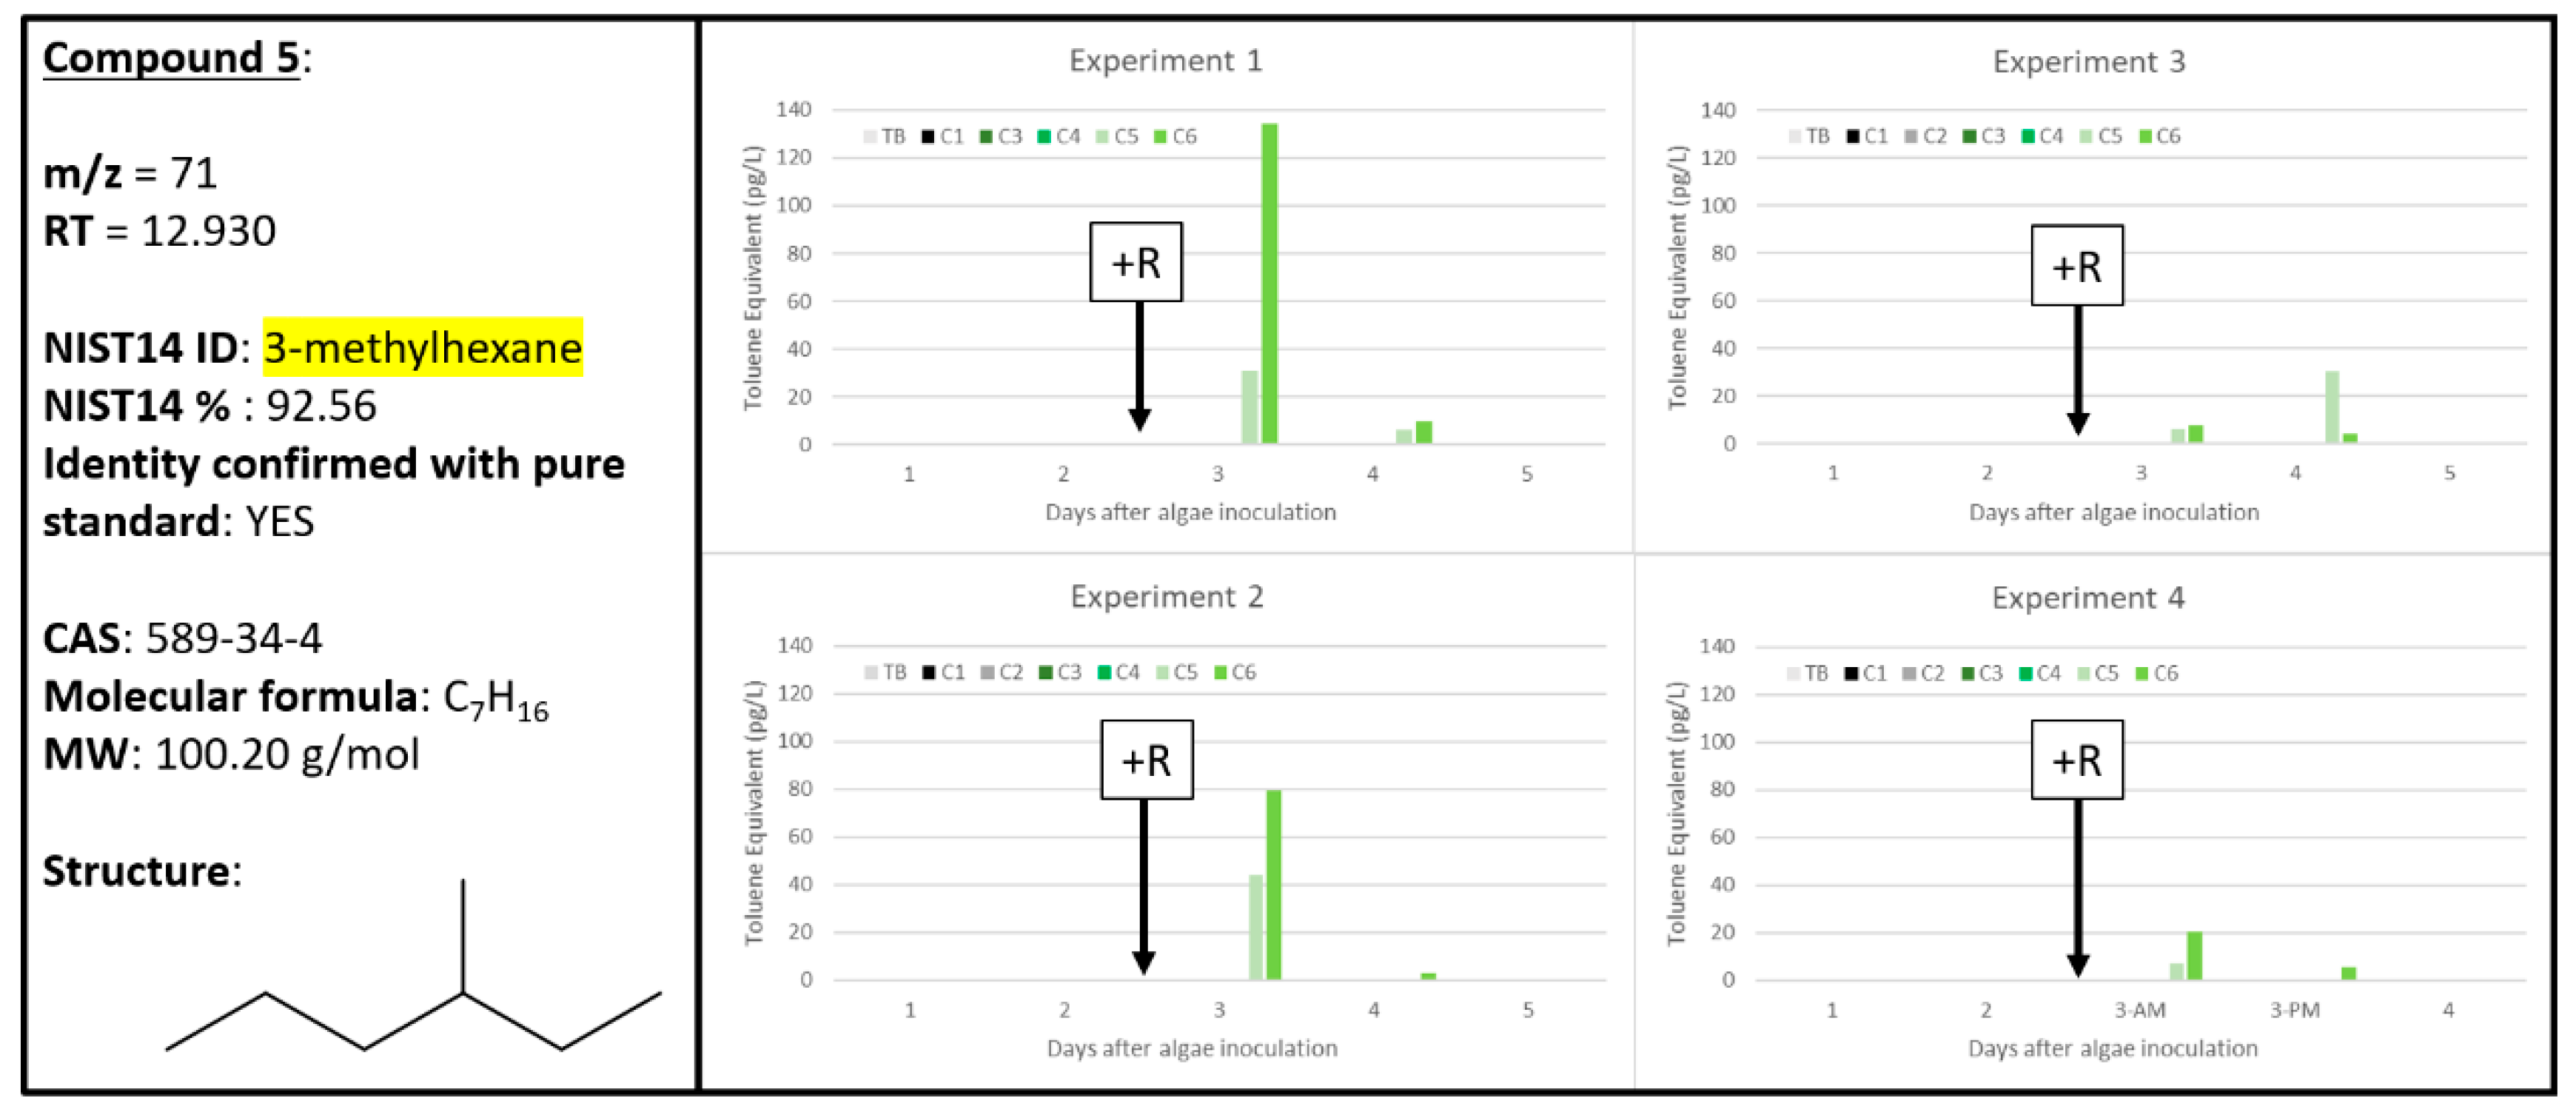
2.5. Compound 5
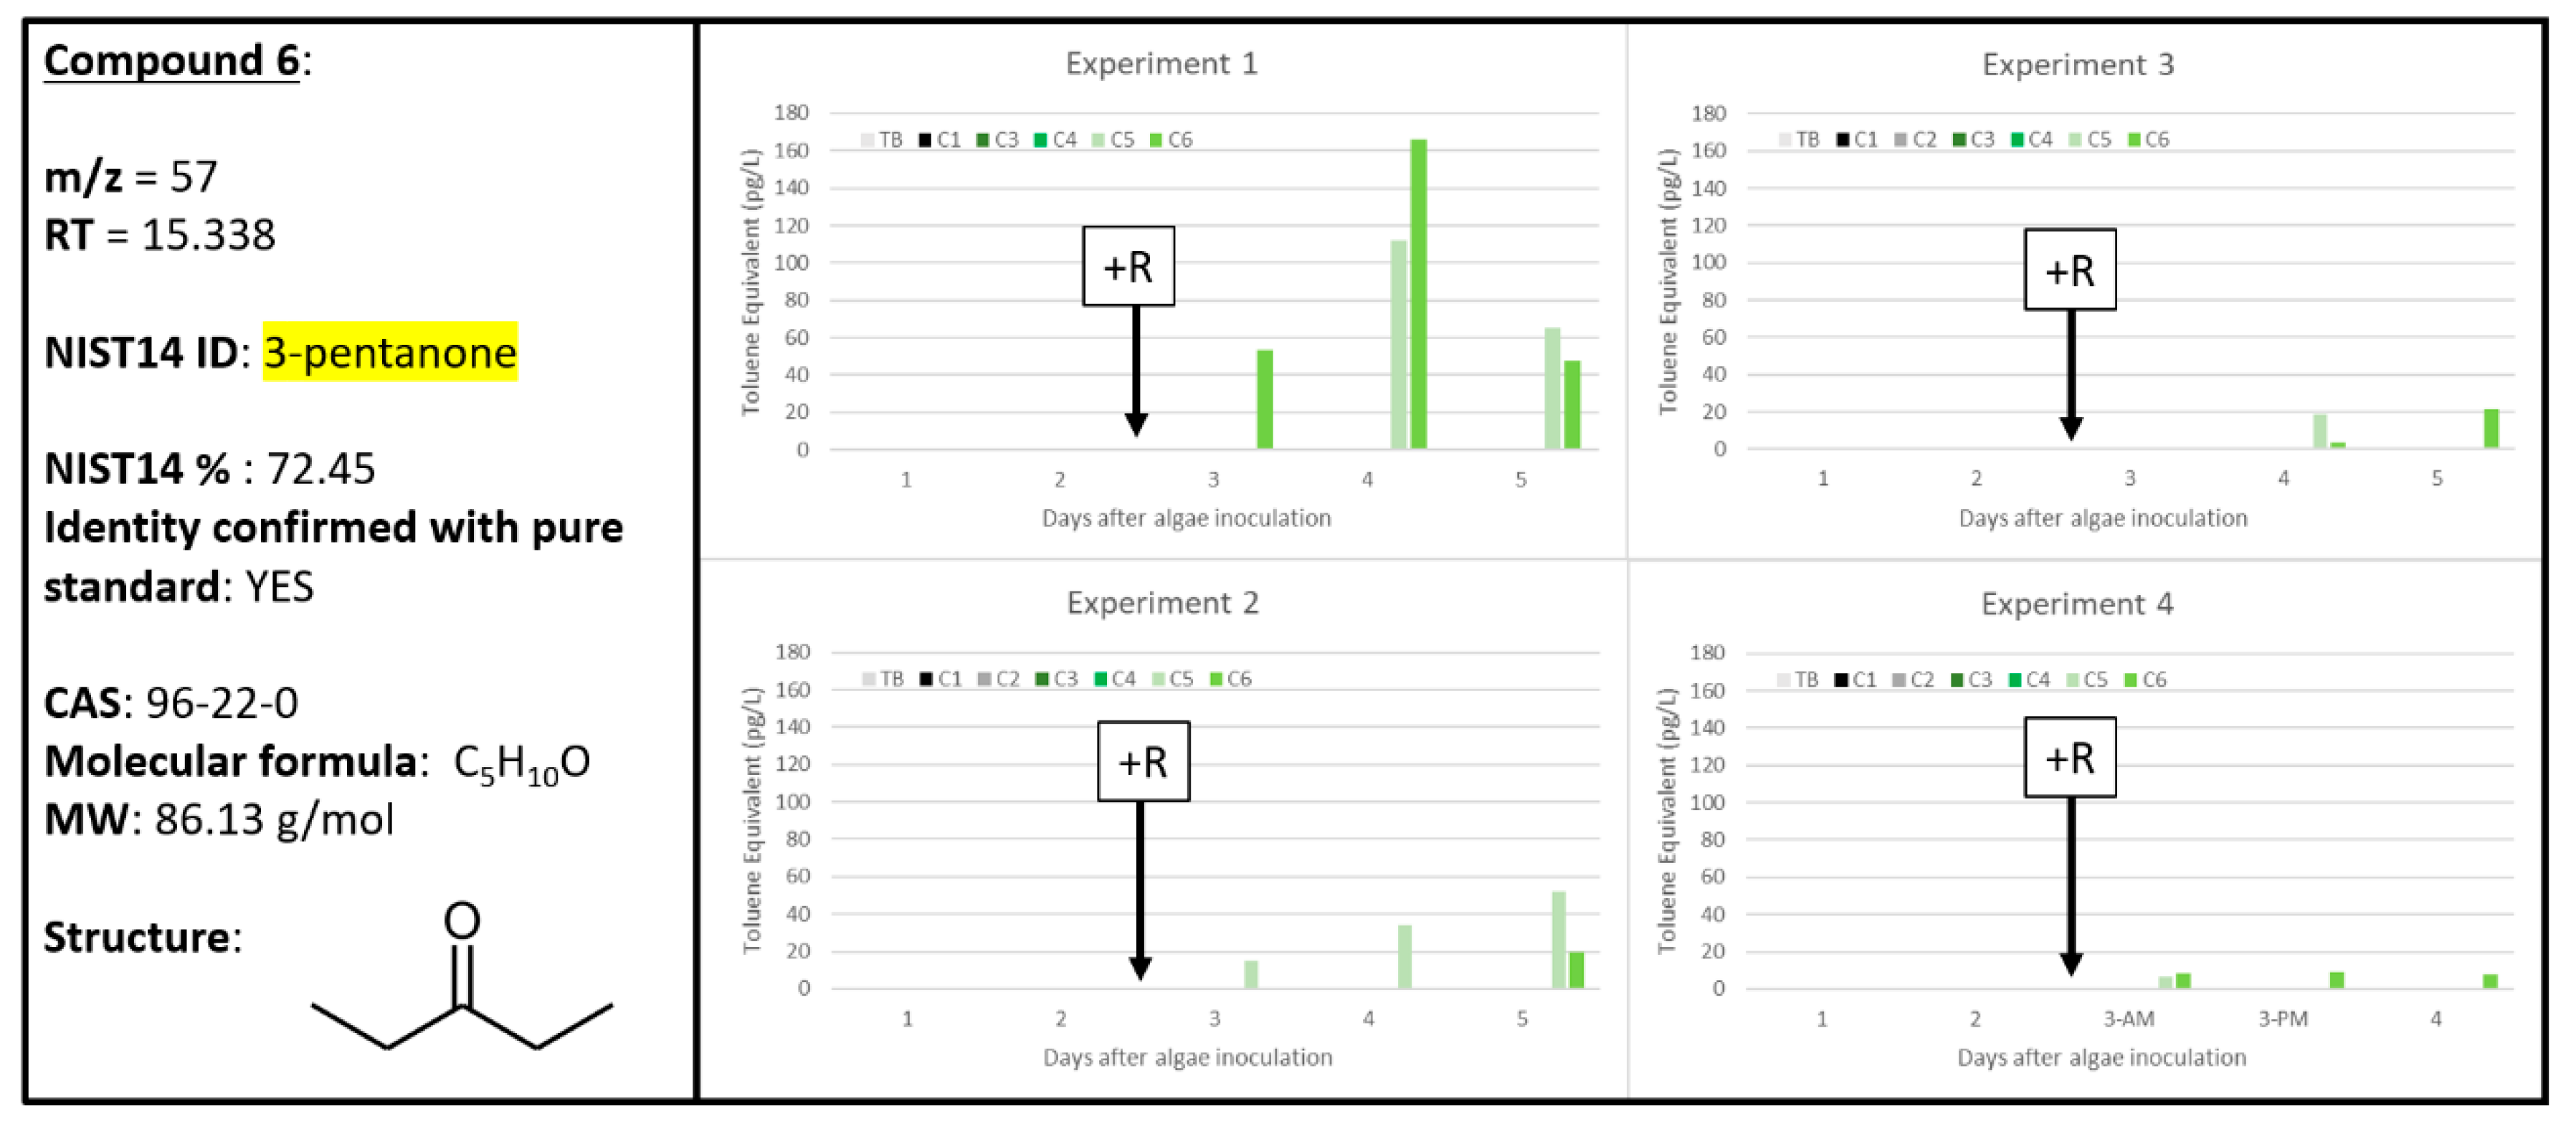
2.6. Compound 6
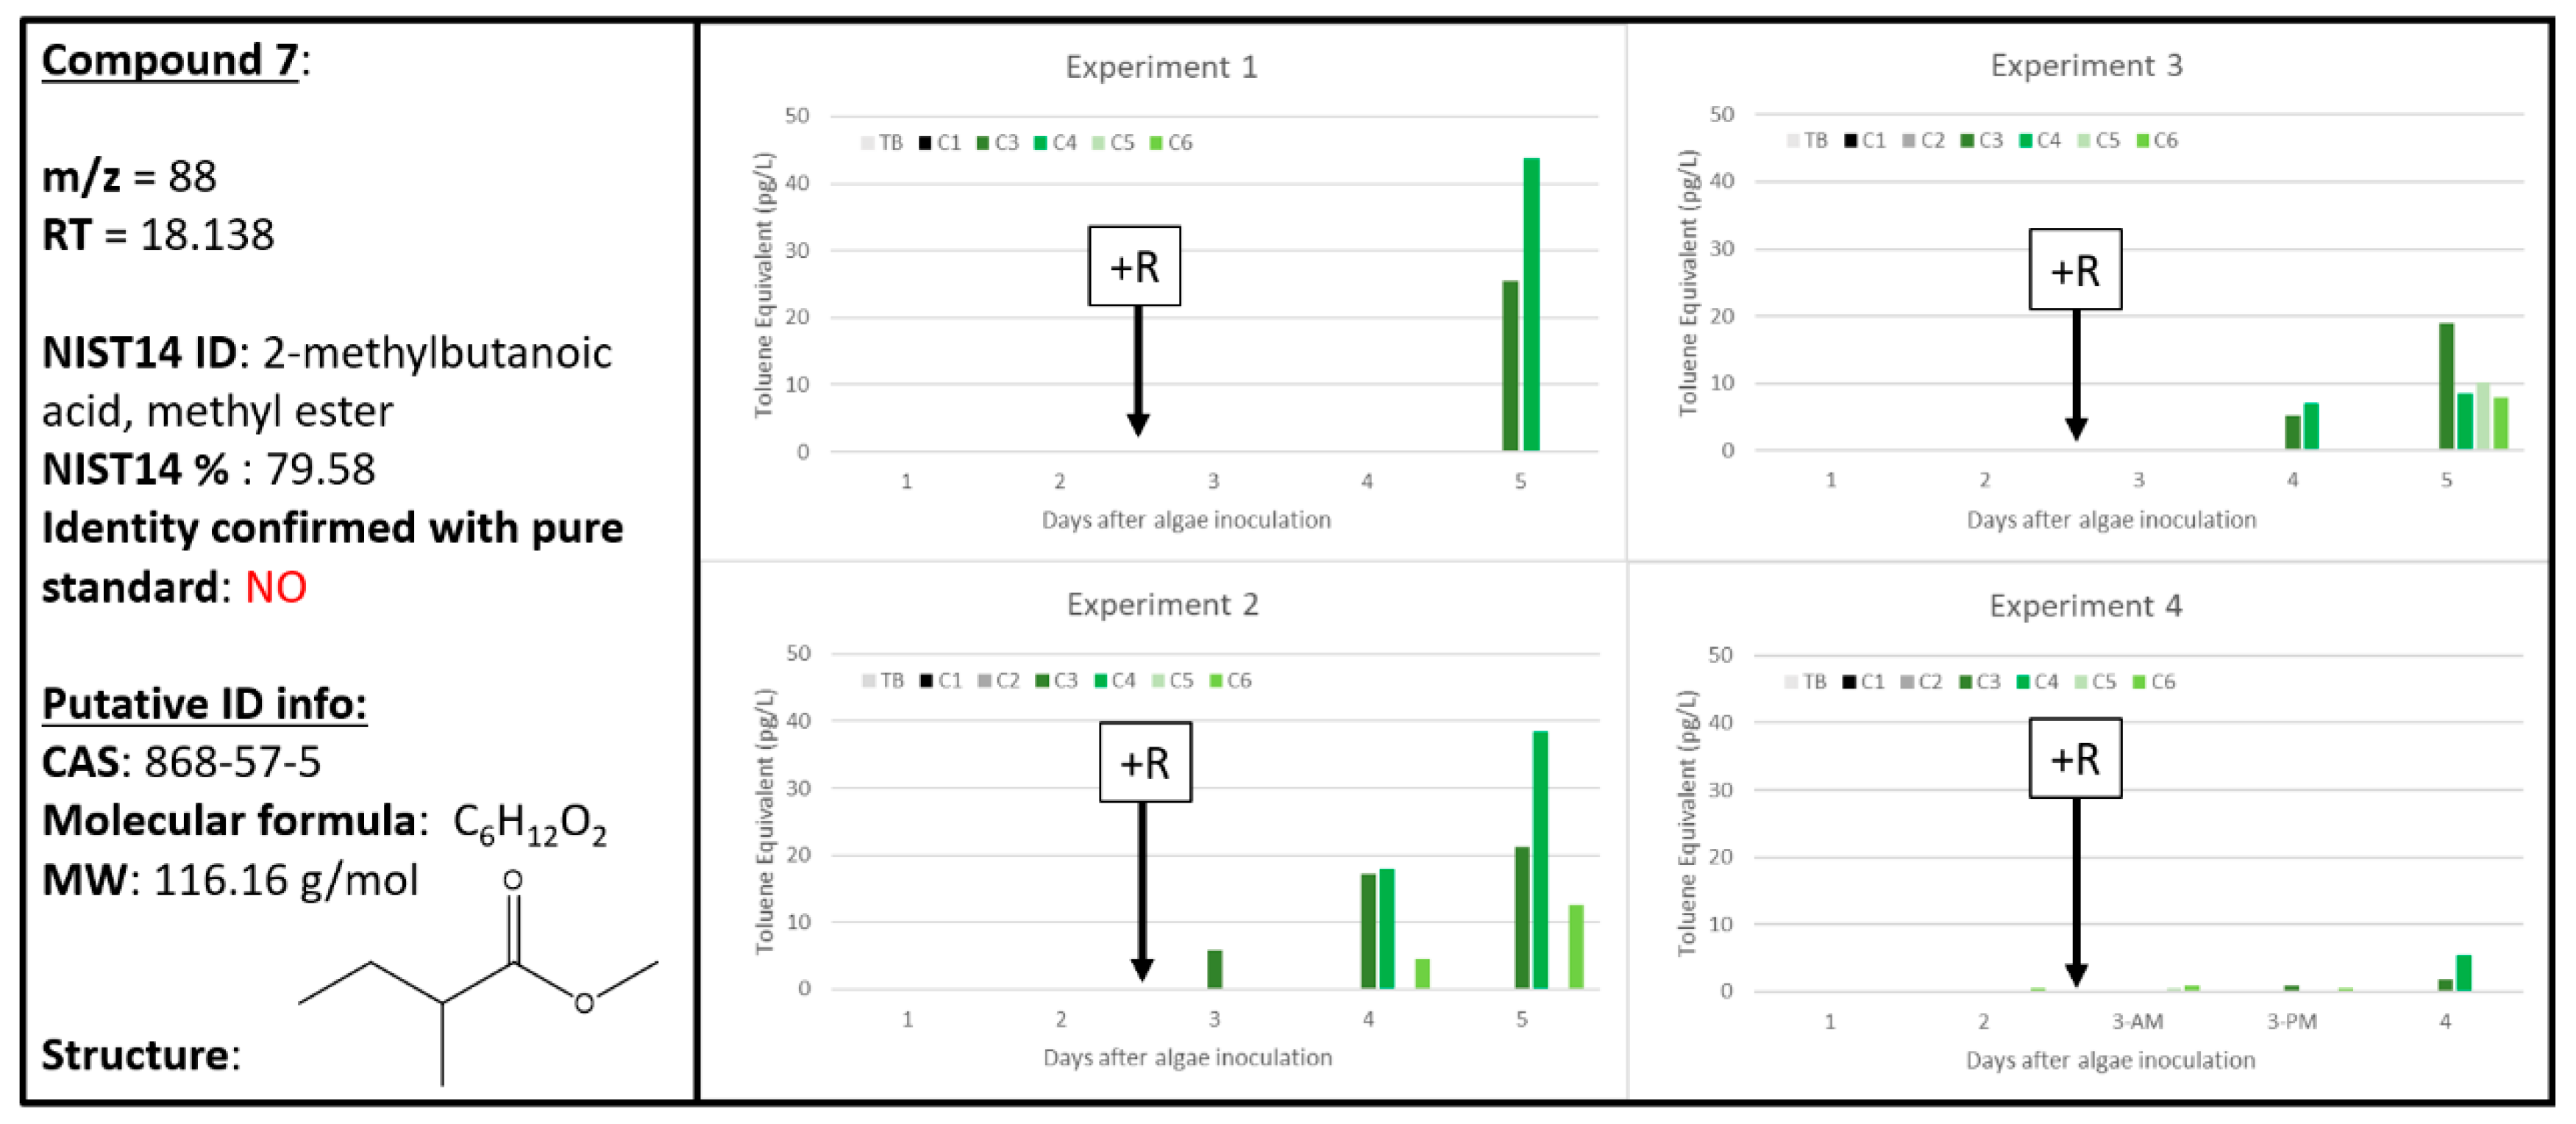
2.7. Compound 7
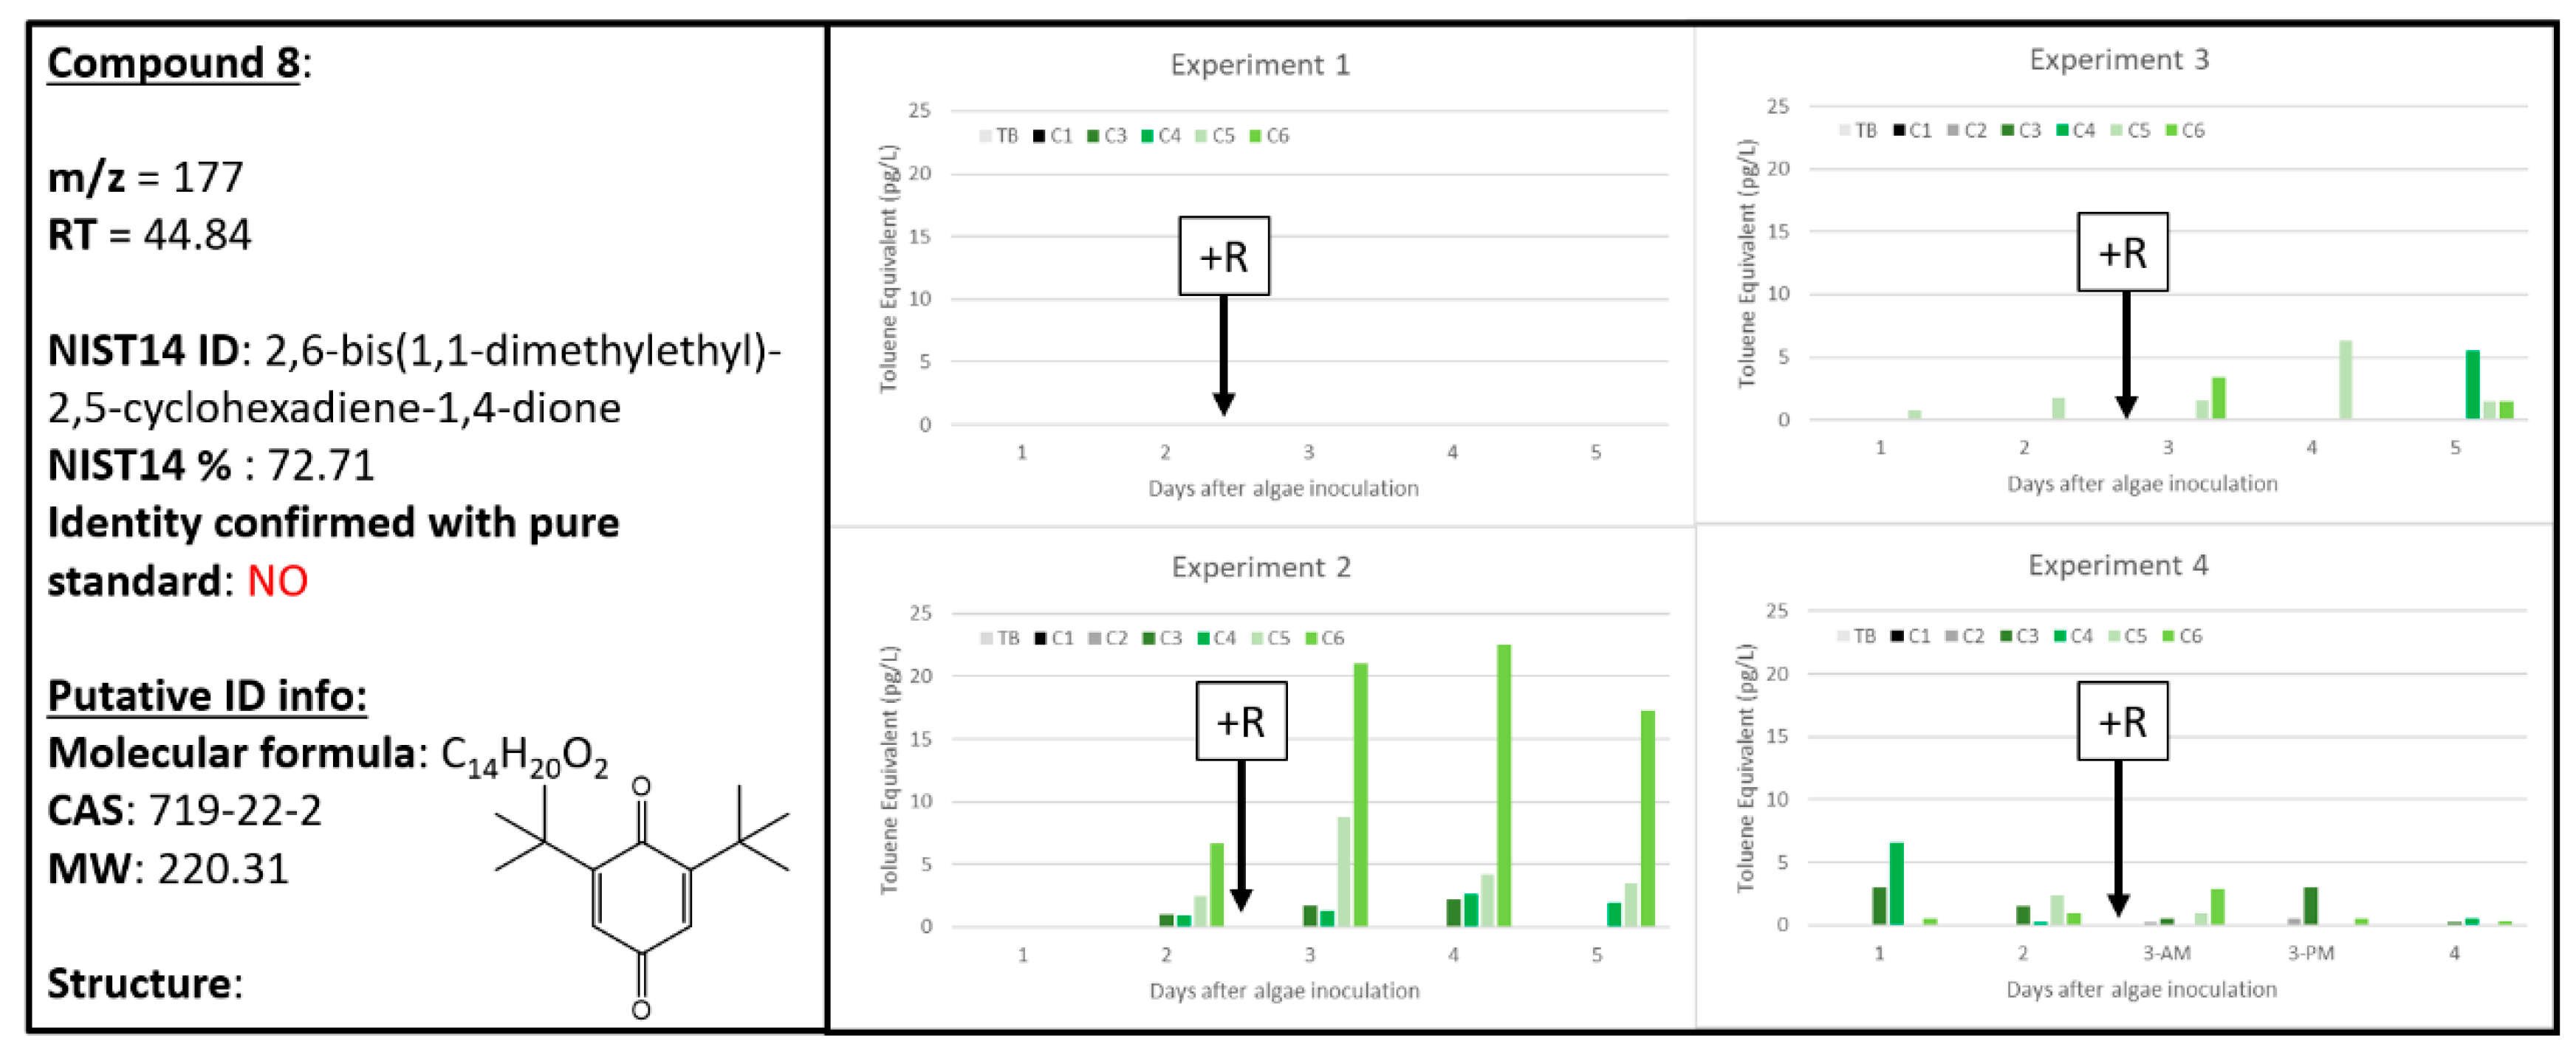
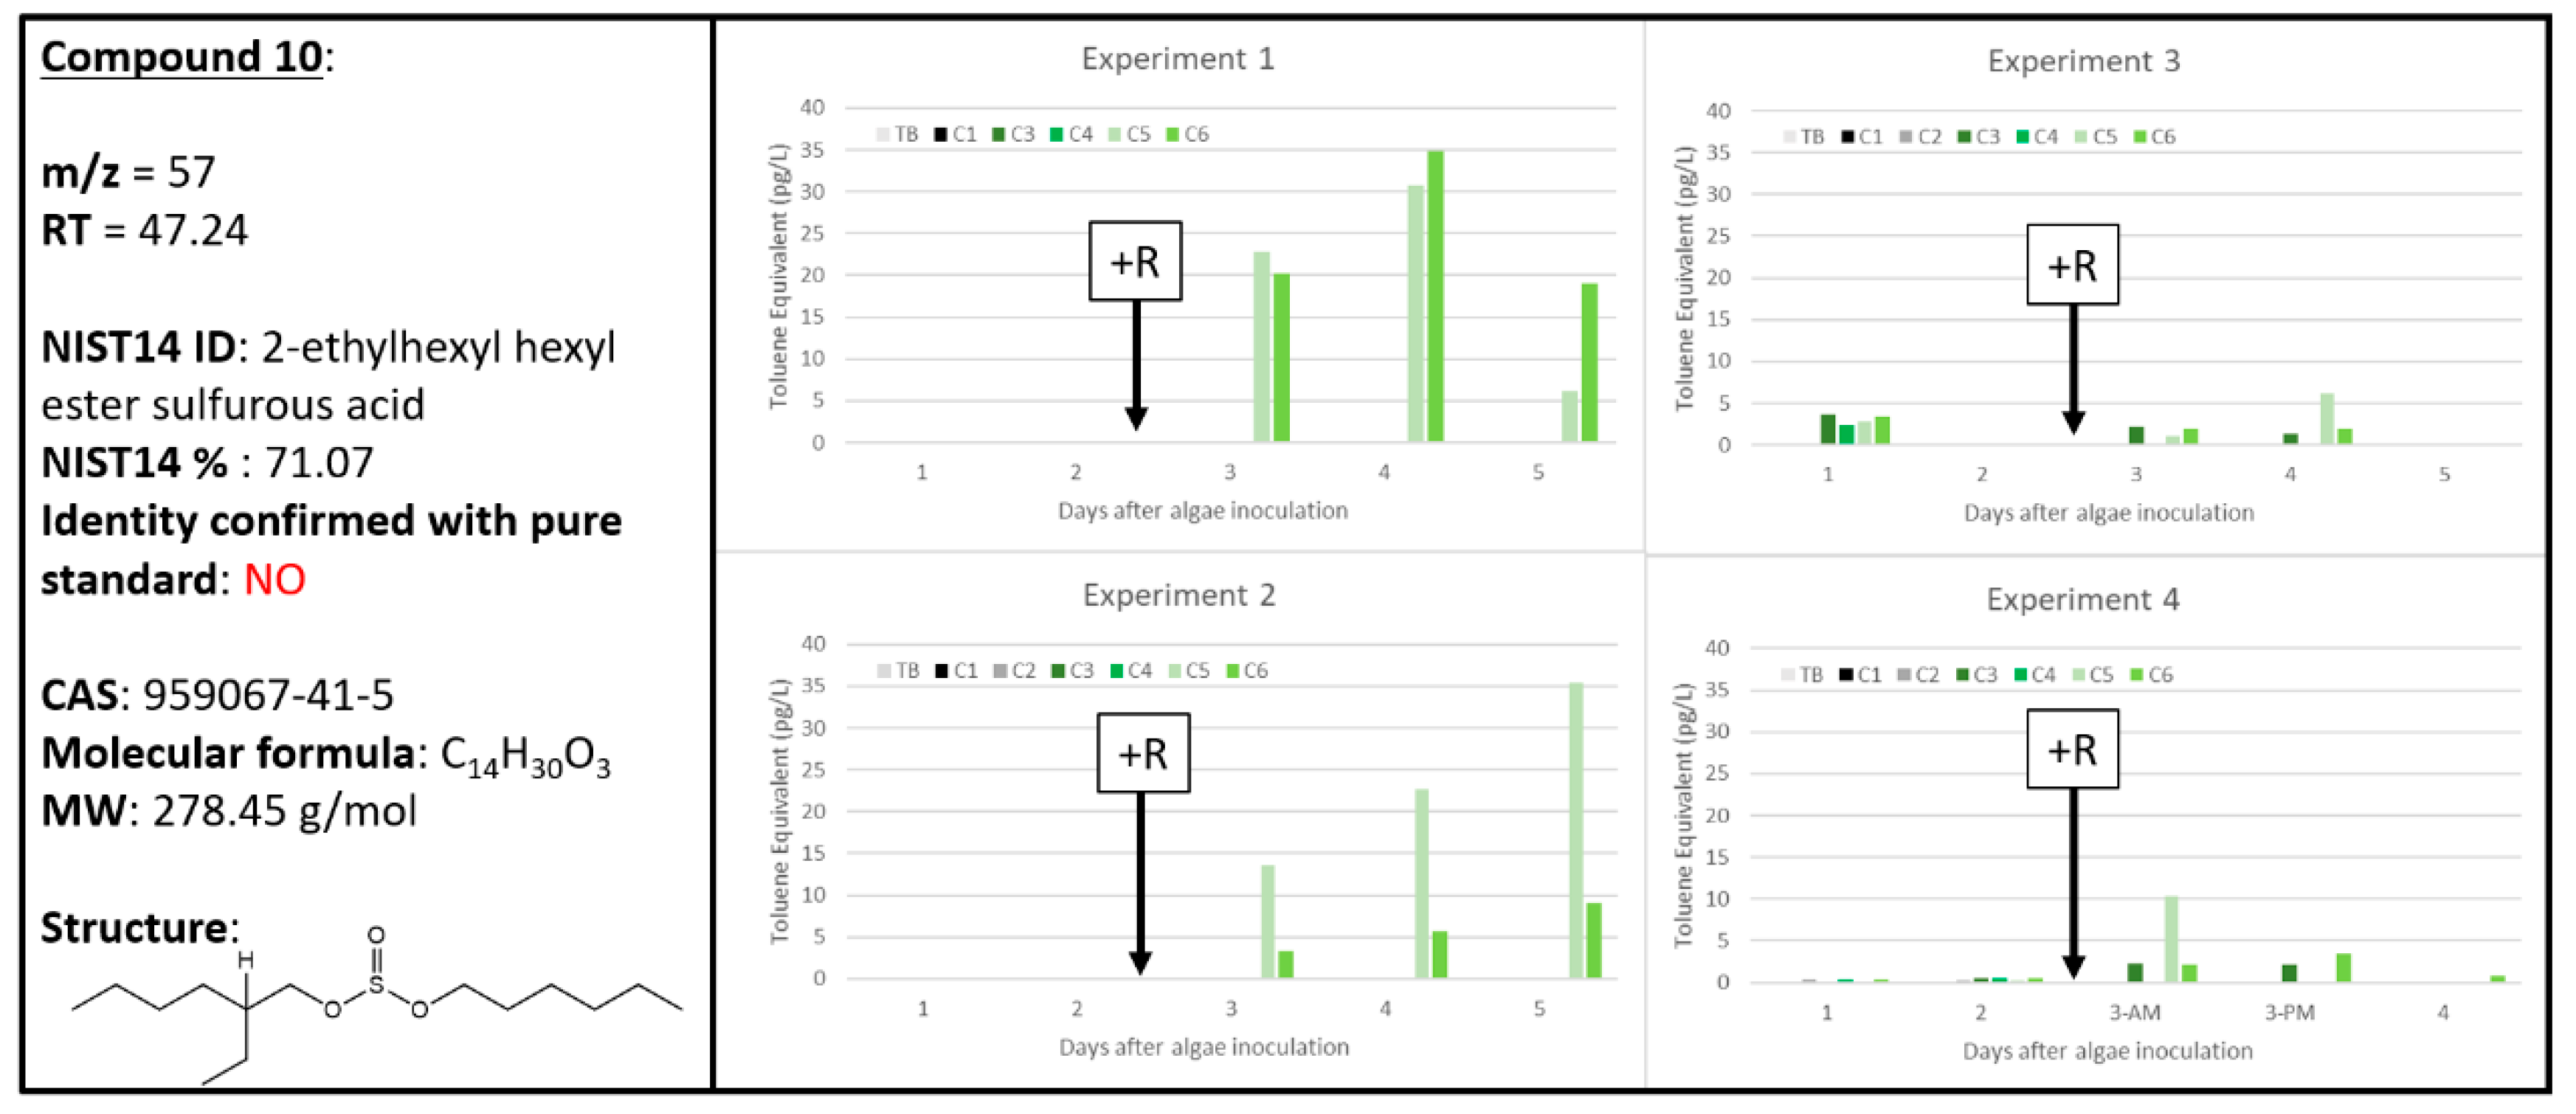
2.8. Ambiguous Chemical Signals, Compounds 8, 9, 10
2.9. Less Robust Compounds S1–S50 of Note
3. Materials and Methods
3.1. Microalgae Culture, Rotifer Culture, and Experimental Setup
3.2. Active Sampling Procedure of Algal Culture Headspace
3.3. GCMS Data Acquisition
3.4. Metabolomics Analysis of GCMS Data
3.5. Quantitative Analysis of Chemical Data
4. Conclusions
Supplementary Materials
Author Contributions
Funding
Acknowledgments
Conflicts of Interest
Copyright Notice
Abbreviations
| A | algae cultures (Microchloropsis salina) |
| A+R | algae cultures (Microchloropsis salina) in the presence of marine rotifers (Brachionus plicatilis) |
| AMDIS | Automated Mass Spectral Deconvolution and Identification System |
| C1, C2 | Carboy 1 and Carboy 2, containing medium only |
| C3, C4 | Carboy 3 and Carboy 4, containing algae only |
| C5, C6 | Carboy 5 and Carboy 6, containing algae cultures that had rotifers added after 48 h of cultivation |
| CEF | compound exchange format |
| GCMS | gas chromatography–mass spectrometry |
| MPP | Mass Profiler Professional |
| NIST14 | National Institutes of Standards and Technology 2014 |
| PUFAs | polyunsaturated fatty acids |
| ROS | reactive oxygen species |
| RT | retention time |
| VOC | volatile organic compound |
References
- Bailly, A.; Weisskopf, L. Mining the Volatilomes of Plant-Associated Microbiota for New Biocontrol Solutions. Front. Microbiol. 2017, 8, 1638. [Google Scholar] [CrossRef] [PubMed]
- Loreto, F.; Dicke, M.; Schnitzler, J.P.; Turlings, T.C.J. Plant volatiles and the environment. Plant Cell Environ. 2014, 37, 1905–1908. [Google Scholar] [CrossRef] [PubMed]
- Majchrzak, T.; Wojnowski, W.; Rutkowska, M.; Wasik, A. Real-Time Volatilomics: A Novel Approach for Analyzing Biological Samples. Trends Plant Sci. 2020, 25, 302–312. [Google Scholar] [CrossRef] [PubMed]
- Achyuthan, K.E.; Harper, J.C.; Mangiell, R.P.; Moorman, M.W. Volatile metabolites emission by in vivo microalgae—An overlooked opportunity? Metabolites 2017, 7, 39. [Google Scholar] [CrossRef] [PubMed]
- Vassilev, S.V.; Vassilev, C.G. Composition, properties and challenges of algae biomass for biofuel application: An overview. Fuel 2016, 181, 1–33. [Google Scholar] [CrossRef]
- Hannon, M.; Gimpel, J.; Tran, M.; Rasla, B.; Mayfield, S. Biofuels from algae: Challenges and potential. Biofuels 2010, 1, 763–784. [Google Scholar] [CrossRef] [PubMed]
- McBride, R.C.; Lopez, S.; Meenach, C.; Burnett, M.; Lee, P.A.; Nohilly, F.; Behnke, C. Contamination in the low cost open algae ponds for biofuels production. Indust. Biotech. 2014, 10, 221–227. [Google Scholar] [CrossRef]
- Richardson, J.W.; Johnson, M.D.; Zhang, X.Z.; Zemke, P.; Chen, W.; Hu, Q. A financial assessment of two alternative cultivation systems and their contributions to algae biofuel economic viability. Algal Res. 2014, 4, 96–104. [Google Scholar] [CrossRef] [Green Version]
- Zmora, O.; Grosse, D.J.; Zou, N.; Samocha, T.M. Microalga for Aquaculture: Practical Implications. In Handbook of Microalgal Culture—Applied Phycology and Biotechnology; John Wiley & Sons: Hoboken, NJ, USA, 2013; pp. 628–652. ISBN 978/0/470/67389/8. [Google Scholar]
- Day, J.G.; Slocombe, S.P.; Stanley, M.S. Overcoming biological constraints to enable the exploitation of microalgae for biofuels. Bioresour. Technol. 2012, 109, 245–251. [Google Scholar] [CrossRef]
- Fisher, C.L.; Lane, T.W. Operational, Prophylactic, and Interdictive Technologies in Algal Crop Protection. In Grand Challenges in Algae Biotechnology; Rampoletto, P.H., Armin, H., Eds.; Springer: Berlin, Germany, 2019; ISBN 978/3/030/25233/5. [Google Scholar]
- Borowitzka, M.A. Culturing Microalgae in Outdoor Ponds; Elsevier Academic Press: Amsterdam, The Netherlands, 2005; pp. 205–218. [Google Scholar]
- Zuo, Z. Why Algae Release Volatile Organic Compounds—The Emission and Roles. Front. Microbiol. 2019, 10, 491. [Google Scholar] [CrossRef] [Green Version]
- Van Durme, J.; Goiris, K.; De Winne, A.; De Cooman, L.; Muylaert, K. Evaluation of the volatile composition and sensory properties of five species of microalgae. J. Agric. Food Chem. 2013, 61, 10881–10890. [Google Scholar] [CrossRef] [PubMed]
- Zhou, L.; Chen, J.; Xu, J.; Li, Y.; Zhou, C.; Yan, X. Change of volatile components in six microalgae with different growth phases. J. Sci. Food Agric. 2016, 97, 761–769. [Google Scholar] [CrossRef] [PubMed]
- Meskhidze, N.; Sabolis, A.; Reed, R.; Kamykowski, D. Quantifying environmental stress-induced emissions of algal isoprene and monoterpenes using laboratory measurements. Biogeosciences 2015, 12, 637–651. [Google Scholar] [CrossRef] [Green Version]
- Reese, K.L.; Fisher, C.L.; Lane, P.D.; Jaryenneh, J.D.; Moorman, M.W.; Jones, A.D.; Frank, M.; Lane, T.W. Chemical profiling of volatile organic compounds in the headspace of algal cultures as early biomarkers of algal pond crashes. Sci. Rep. 2019, 9, 13866. [Google Scholar] [CrossRef] [PubMed] [Green Version]
- Trabue, S.L.; Scoggin, K.D.; Li, H.; Burns, R.; Xin, H. Field Sampling for Quantifying Odorants in Humid Environments. Environ. Sci. Technol. 2008, 42, 3745–3750. [Google Scholar] [CrossRef] [Green Version]
- Feijo Barreira, L.M.; Duporte, G.; Ronkko, T.; Parshintsev, J.; Hartonen, K.; Schulman, L.; Heikkinen, E.; Jussila, M.; Kulmala, M.; Riekkola, M.L. Field measurements of biogenic volatile organic compounds in the atmosphere using solid-phase microextraction Arrow. Atmos. Meas. Tech. 2018, 11, 881–893. [Google Scholar] [CrossRef] [Green Version]
- Woolfenden, E.A.; McClenny, W.A. Compendium Method TO-17: Determination of Volatile Organic Compounds in Ambient Air Using Active Sampling on Sorbent Tubes. In Compendium of Methods for the Determination of Toxic Organic Compounds in Ambient Air, 2nd ed.; Battelle Columbus Labs: Columbus, OH, USA, 1984. Available online: https://www3.epa.gov/ttnamti1/files/ambient/airtox/to-17r.pdf (accessed on 1 August 2020).
- Maddalena, R.L.; Russell, M.L.; Sullivan, D.P.; Apte, M.G. Formaldehyde and other volatile organic chemical emissions in four FEMA temporary housing units. Environ. Sci. Technol. 2009, 43, 5626–5632. [Google Scholar] [CrossRef]
- Vick, B.A.; Zimmerman, D.C. Metabolism of fatty acid hydroperoxides by Chlorella pyrenoidosa. Plant Physiol. 1989, 90, 125–132. [Google Scholar] [CrossRef] [Green Version]
- Andrianarison, R.H.; Beneytoute, J.L.; Tixier, M. An enzymatic conversion of lipoxygenase products by a hydroperoxide lyase in blue-green algae (Oscillatoria sp.). Plant Physiol. 1989, 91, 1280–1287. [Google Scholar] [CrossRef] [Green Version]
- Zimmerer, J.; Pingen, D.; Hess, S.K.; Koengeter, T.; Mecking, S. Integrated extraction and catalytic upgrading of microalgae lipids in supercritical carbon dioxide. Green Chem. 2019, 21, 2428–2435. [Google Scholar] [CrossRef]
- Steinke, M.; Hodapp, B.; Subhan, R.; Bell, T.G.; Martin-Creuzburg, D. Flux of the biogenic volatiles isoprene and dimethyl sulfide from an oligotrophic lake. Sci. Rep. 2018, 8, 1–10. [Google Scholar] [CrossRef] [PubMed]
- Sharkey, T.D.; Wiberley, A.E.; Donohue, A.R. Isoprene Emission from Plants: Why and How. Annals Bot. 2007, 101, 5–18. [Google Scholar] [CrossRef] [PubMed] [Green Version]
- Connick, W.J.; Bradow, J.M.; Legendre, M.G. Identification and Bioactivity of Volatile Allelochemicals from Amaranth Residues. J. Agric. Food Chem. 1989, 37, 792–796. [Google Scholar] [CrossRef]
- Sun, S.M.; Chung, G.H.; Shin, T.S. Volatile compounds of the green alga, Capsosiphon fulvescens. J. Appl. Phycol. 2012, 24, 1003–1013. [Google Scholar] [CrossRef]
- Sunesson, A.L.; Vaes, W.H.J.; Nilsson, C.A.; Blomquist, G.; Andersson, B.; Carlson, R. Identification of Volatile Metabolites from Five Fungal Species Cultivated on Two Media. Appl. Environ. Microb. 1995, 61, 2911–2918. [Google Scholar] [CrossRef] [PubMed] [Green Version]
- Kettlitz, B.; Scholz, G.; Theurillat, V.; Cselovszky, J.; Buck, N.R.; O’Hagan, S.; Mavromichali, E.; Ahrens, K.; Kraehenbuehl, K.; Scozzi, G.; et al. Furan and Methylfurans in Foods: An Update on Occurrence, Mitigation, and Risk Assessment. Compr. Rev. Food Sci. Food Saf. 2019, 18, 738–752. [Google Scholar] [CrossRef] [Green Version]
- Francisco-Marquez, M.; Alvarez-Idaboy, J.R.; Galano, A.; Vivier-Bunge, A. A Possible Mechanism for Furan Formation in the Tropospheric Oxidation of Dienes Environ. Sci. Technol. 2005, 39, 8797–8802. [Google Scholar] [CrossRef]
- Barbosa, J.M.G.; Pereira, N.Z.; David, L.C.; de Oliveira, C.G.; Soares, M.G.F.; Avelino, M.A.G.; de Oliveira, A.E.; Shokry, E.; Filho, N.R.A. Cerumenogram: A new frontier in cancer diagnosis in humans. Sci. Rep. 2019, 9, 11722. [Google Scholar] [CrossRef] [Green Version]
- Phillips, M.; Cataneo, R.N.; Greenberg, J.; Gunawardena, R.; Naidu, A.; Rahbari-Oskoui, F. Effect of age on the breath methylated alkane contour, a display of apparent new markers of oxidative stress. J. Lab. Clin. Med. 2000, 136, 243–249. [Google Scholar] [CrossRef] [Green Version]
- Yamauchi, Y.; Hasegawa, A.; Taninaka, A.; Mizutani, M.; Sugimoto, Y. NADPH-dependent reductases involved in the detoxification of reactive carbonyls in plants. J. Biol. Chem. 2011, 286, 6999–7009. [Google Scholar] [CrossRef] [Green Version]
- Flath, R.A.; Forrey, R.R. Volatile components of smooth Cayenne pineapple. J. Agric. Food Chem. 1970, 18, 306–309. [Google Scholar] [CrossRef]
- Qadri, M.; Deshidi, R.; Shah, B.A.; Bindu, K.; Vishwakarma, R.A.; Riyaz-Ul-Hassan, S. An endophyte of Picrorhiza kurroa Royle ex. Benth, producing menthol, phenylethyl alcohol, and 3-hydroxypropionic acid, and other volatile organic compounds. World J. Microbiol. Biotechnol. 2015, 31, 1647–1654. [Google Scholar] [CrossRef] [PubMed]
- Collins, R.P.; Kalnins, K. Volatile constituents of Synura petersenii I. The carbonyl fraction. Lloydia 1965, 28, 48–52. [Google Scholar]
- Clarke, S. Families of compounds that occur in essential oils. In Essential Chemistry for Aromatherapy, 2nd ed.; Elsevier Limited: Amsterdam, The Netherlands, 2008; pp. 41–77. ISBN 978/0/4431/0403/9. [Google Scholar]
- Larsen, M.; Poll, L.; Olsen, C.E. Evaluation of the aroma composition of some strawberry (Fragaria ananassa Duch) cultivars by use of odour threshold values. Z. Lebensm. Unters. Forch. 1992, 195, 536–539. [Google Scholar] [CrossRef]
- Awad, N.E.; Motawe, H.M.; Selim, M.A.; Matloub, A.A. Volatile constituents of the brown algae Padina (L.) Gaill. and Hydroclathrus clathratus (C. Agardh) Howe and their Antimicrobial Activity. Med. Aromat. Plant Sci. Biotechnol. 2009, 3, 12–15. [Google Scholar]
- Akakabe, Y.; Iwamoto, S.; Miyamura, S.; Kajiwara, T. Induction of (Z)-8-heptadecene in marine green alga Bryopsis maxima by mechanical wounding. Fish. Sci. 2007, 73, 1057–1060. [Google Scholar] [CrossRef]
- Cui, H.; Zhang, B.; Li, G.; Li, L.; Chen, H.; Qi, J.; Chen, J.; Wang, P.; Lei, H. Identification of a quality marker of vinegar-Processed Curcuma zedoaria on oxidative liver injury. Molecules 2019, 24, 2073. [Google Scholar] [CrossRef] [Green Version]
- Kupper, F.C.; Miller, E.P.; Andrews, S.J.; Hughes, C.; Carpenter, L.J.; Meyer-Klaucke, W.; Toyama, C.; Muramatsu, Y.; Feiters, M.C.; Carrano, C.J. Emission of volatile halogenated compounds, speciation and localization of bromine and iodine in the brown algal genome model Ectocarpus siliculosus. J. Biol. Inorg. Chem. 2018, 23, 1119–1128. [Google Scholar] [CrossRef] [Green Version]
- Human Metabolome Database (HMDB): 2-Acetyl-5-Methylfuran (HMDB0035226). Available online: https://hmdb.ca/metabolites/HMDB0035226#references (accessed on 27 July 2020).
- Alcolombri, U.; Ben-Dor, S.; Feldmesser, E.; Levin, Y.; Tawfik, D.S.; Vardi, A. Identification of the algal dimethyl-sulfide releasing enzyme: A missing link in the marine sulfur cycle. Science 2015, 348, 1466–1469. [Google Scholar] [CrossRef]


| Experiment 1 | Experiment 2 | Experiment 3 | Experiment 4 | |||||||||||||||
|---|---|---|---|---|---|---|---|---|---|---|---|---|---|---|---|---|---|---|
| Sampling Time: | 30 min | 60 min | 60 min | 120 min | Tentative Compound ID, CAS, and NIST14 % | Confirmed ID CAS | ||||||||||||
| Compound # | B | A | AR | B | A | AR | B | A | AR | B | A | AR | m/z | RT | Compound ID | CAS | NIST14 % | |
| 1 | 0 | 0 | 3 | 0 | 0 | 5 | 0 | 0 | 5 | 0 | 0 | 1 | 43 | 5.730 | pentane | 109-66-0 | 90.45 | Pentane 109-66-0 |
| 2 | 0 | 13 | 2 | 0 | 10 | 5 | 1 | 13 | 6 | 0 | 8 | 1 | 67 | 6.330 | 1,4-pentadiene | 591-93-5 | 84.80 | 2-methyl-1,3-butadiene 78-79-5 |
| 3 | 0 | 0 | 5 | 1 | 0 | 6 | 0 | 0 | 6 | 0 | 0 | 1 | 82 | 10.409 | 2-methylfuran | 534-22-5 | 79.74 | 2-methylfuran 534-22-5 |
| 4 | 0 | 6 | 5 | 0 | 10 | 6 | 1 | 10 | 6 | 0 | 10 | 4 | 82 | 10.920 | 2-methylfuran | 534-22-5 | 79.56 | 3-methylfuran 930-27-8 |
| 5 | 0 | 0 | 4 | 0 | 0 | 3 | 0 | 0 | 4 | 0 | 0 | 3 | 71 | 12.930 | 3-methylhexane | 589-34-4 | 92.56 | 3-methylhexane 589-34-4 |
| 6 | 0 | 0 | 5 | 0 | 0 | 4 | 0 | 0 | 3 | 0 | 0 | 4 | 57 | 15.338 | 3-pentanone | 96-22-0 | 72.45 | 3-pentanone 96-22-0 |
| 7 | 0 | 2 | 0 | 0 | 5 | 2 | 0 | 4 | 2 | 0 | 4 | 3 | 88 | 18.138 | 2-methylbutanoic acid methyl ester | 868-57-5 | 79.58 | unconfirmed |
| 8 | 0 | 0 | 0 | 0 | 9 | 6 | 0 | 3 | 5 | 2 | 11 | 4 | 177 | 44.841 | 2,6-bis(1,1-dimethylethyl)-2,5-cyclohexadiene-1,4-dione | 719-22-2 | 72.71 | unconfirmed |
| 9 | 0 | 0 | 5 | 0 | 0 | 5 | 0 | 4 | 1 | 0 | 2 | 3 | 83 | 47.058 | 8-heptadecene | 2579-04-6 | 86.59 | unconfirmed |
| 10 | 0 | 0 | 6 | 0 | 0 | 6 | 0 | 6 | 4 | 2 | 8 | 4 | 57 | 47.239 | 2-ethylhexyl hexyl ester sulfurous acid | 959067-41-5 | 71.07 | unconfirmed |
| sample size (n) | 6 | 14 | 6 | 9 | 10 | 6 | 11 | 13 | 6 | 10 | 12 | 5 | ||||||
© 2020 by the authors. Licensee MDPI, Basel, Switzerland. This article is an open access article distributed under the terms and conditions of the Creative Commons Attribution (CC BY) license (http://creativecommons.org/licenses/by/4.0/).
Share and Cite
Fisher, C.L.; Lane, P.D.; Russell, M.; Maddalena, R.; Lane, T.W. Low Molecular Weight Volatile Organic Compounds Indicate Grazing by the Marine Rotifer Brachionus plicatilis on the Microalgae Microchloropsis salina. Metabolites 2020, 10, 361. https://doi.org/10.3390/metabo10090361
Fisher CL, Lane PD, Russell M, Maddalena R, Lane TW. Low Molecular Weight Volatile Organic Compounds Indicate Grazing by the Marine Rotifer Brachionus plicatilis on the Microalgae Microchloropsis salina. Metabolites. 2020; 10(9):361. https://doi.org/10.3390/metabo10090361
Chicago/Turabian StyleFisher, Carolyn L., Pamela D. Lane, Marion Russell, Randy Maddalena, and Todd W. Lane. 2020. "Low Molecular Weight Volatile Organic Compounds Indicate Grazing by the Marine Rotifer Brachionus plicatilis on the Microalgae Microchloropsis salina" Metabolites 10, no. 9: 361. https://doi.org/10.3390/metabo10090361