
Grapevine and Wine Metabolomics-Based Guidelines for FAIR Data and Metadata Management

 ,
,  , , , , , , , , ,
Abstract
: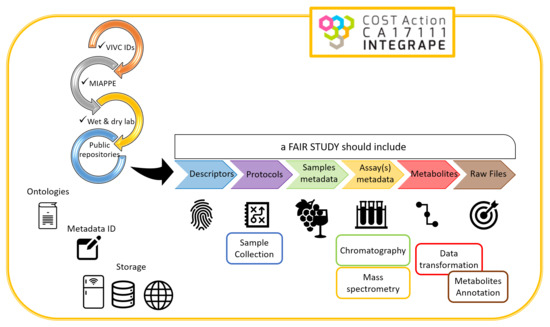
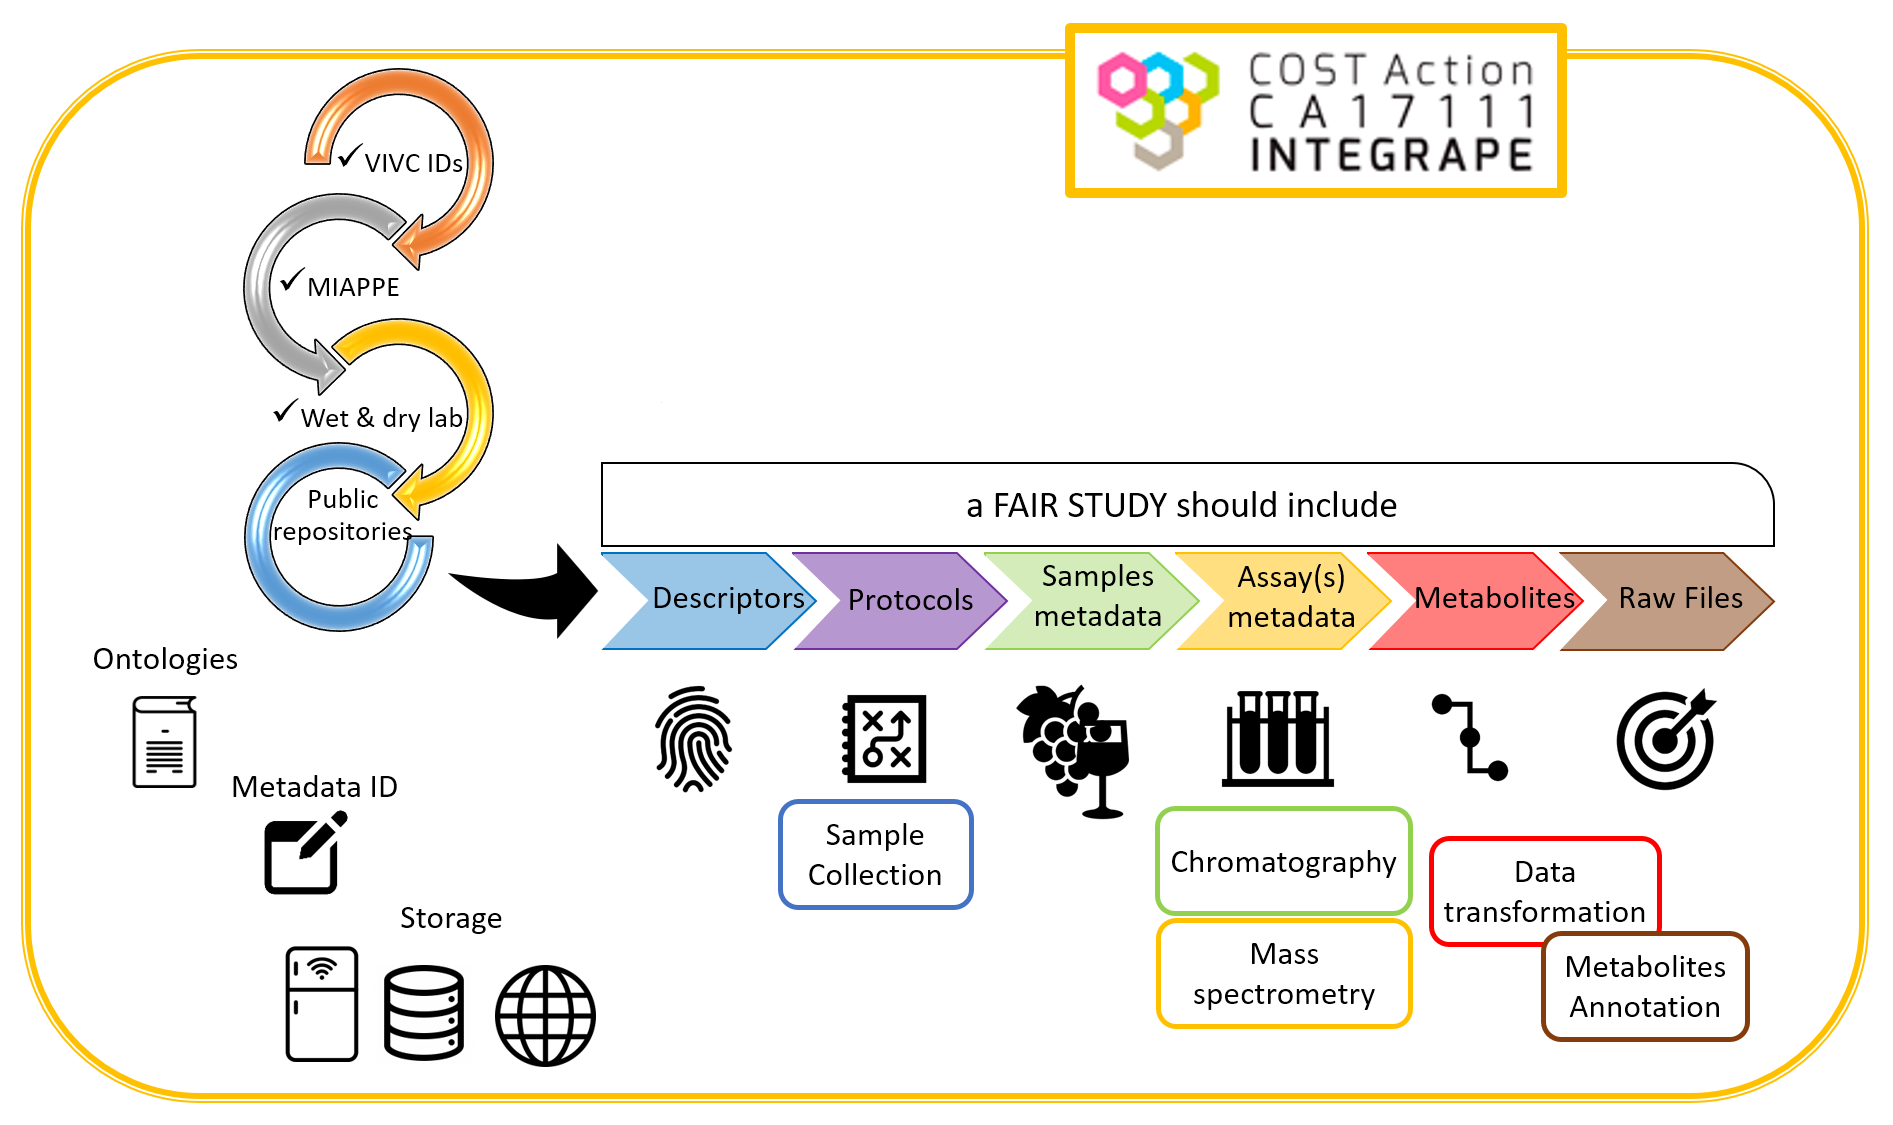
1. Introduction
2. Methods
2.1. Sample Collection
2.2. Extraction (Sample Preparation)
2.3. Chromatography and Mass Spectrometry
2.4. Data Transformation and Metabolite Identification
3. Results
4. Discussion
5. Concluding Remarks
Supplementary Materials
Author Contributions
Funding
Institutional Review Board Statement
Informed Consent Statement
Data Availability Statement
Acknowledgments
Conflicts of Interest
References
- Chen, F.; Song, Y.; Li, X.; Chen, J.; Mo, L.; Zhang, X.; Lin, Z.; Zhang, L. Genome Sequences of Horticultural Plants: Past, Present, and Future. Hortic. Res. 2019, 6, 112. [Google Scholar] [CrossRef] [PubMed] [Green Version]
- Wang, Z.; Gerstein, M.; Snyder, M. RNA-Seq: A Revolutionary Tool for Transcriptomics. Nat. Rev. Genet. 2009, 10, 57–63. [Google Scholar] [CrossRef] [PubMed]
- Massonnet, M.; Fasoli, M.; Vondras, A.M.; Zenoni, S.; Santo, S.D.; Vannozzi, A.; Castellarin, S.D.; Pezzotti, M.; Cantu, D. Grape transcriptomics and viticulture. In The Grape Genome; Cantu, D., Walker, M.A., Eds.; Compendium of Plant Genomes; Springer International Publishing: Cham, Switzerland, 2019; pp. 275–299. ISBN 978-3-030-18601-2. [Google Scholar]
- Fiehn, O.; Kopka, J.; Dörmann, P.; Altmann, T.; Trethewey, R.N.; Willmitzer, L. Metabolite Profiling for Plant Functional Genomics. Nat. Biotechnol. 2000, 18, 1157–1161. [Google Scholar] [CrossRef] [PubMed]
- Fiehn, O. Metabolomics—The Link between Genotypes and Phenotypes. Plant Mol. Biol. 2002, 48, 155–171. [Google Scholar] [CrossRef]
- Alseekh, S.; Fernie, A.R. Metabolomics 20 Years on: What Have We Learned and What Hurdles Remain? Plant J. 2018, 94, 933–942. [Google Scholar] [CrossRef] [PubMed]
- De Vos, R.C.; Moco, S.; Lommen, A.; Keurentjes, J.J.; Bino, R.J.; Hall, R.D. Untargeted Large-Scale Plant Metabolomics Using Liquid Chromatography Coupled to Mass Spectrometry. Nat. Protoc. 2007, 2, 778–791. [Google Scholar] [CrossRef] [PubMed]
- Pereira, G.E.; Gaudillere, J.-P.; van Leeuwen, C.; Hilbert, G.; Maucourt, M.; Deborde, C.; Moing, A.; Rolin, D. 1H NMR Metabolite Fingerprints of Grape Berry: Comparison of Vintage and Soil Effects in Bordeaux Grapevine Growing Areas. Anal. Chim. Acta 2006, 563, 346–352. [Google Scholar] [CrossRef]
- Gougeon, L.; da Costa, G.; Guyon, F.; Richard, T. 1H NMR Metabolomics Applied to Bordeaux Red Wines. Food Chem. 2019, 301, 125257. [Google Scholar] [CrossRef]
- Vrhovsek, U.; Lotti, C.; Masuero, D.; Carlin, S.; Weingart, G.; Mattivi, F. Quantitative Metabolic Profiling of Grape, Apple and Raspberry Volatile Compounds (VOCs) Using a GC/MS/MS Method. J. Chromatogr. B 2014, 966, 132–139. [Google Scholar] [CrossRef] [PubMed]
- Vrhovsek, U.; Masuero, D.; Gasperotti, M.; Franceschi, P.; Caputi, L.; Viola, R.; Mattivi, F. A Versatile Targeted Metabolomics Method for the Rapid Quantification of Multiple Classes of Phenolics in Fruits and Beverages. J. Agric. Food Chem. 2012, 60, 8831–8840. [Google Scholar] [CrossRef] [PubMed]
- Maia, M.; Monteiro, F.; Sebastiana, M.; Marques, A.P.; Ferreira, A.E.N.; Freire, A.P.; Cordeiro, C.; Figueiredo, A.; Sousa Silva, M. Metabolite Extraction for High-Throughput FTICR-MS-Based Metabolomics of Grapevine Leaves. EuPA Open Proteom. 2016, 12, 4–9. [Google Scholar] [CrossRef] [PubMed] [Green Version]
- Romanet, R.; Sarhane, Z.; Bahut, F.; Uhl, J.; Schmitt-Kopplin, P.; Nikolantonaki, M.; Gougeon, R.D. Exploring the Chemical Space of White Wine Antioxidant Capacity: A Combined DPPH, EPR and FT-ICR-MS Study. Food Chem. 2021, 355, 129566. [Google Scholar] [CrossRef]
- Figueiredo, J.; Cavaco, A.R.; Guerra-Guimarães, L.; Leclercq, C.; Renaut, J.; Cunha, J.; Eiras-Dias, J.; Cordeiro, C.; Matos, A.R.; Silva, M.S.; et al. An Apoplastic Fluid Extraction Method for the Characterization of Grapevine Leaves Proteome and Metabolome from a Single Sample. Physiol. Plant 2021, 171, 343–357. [Google Scholar] [CrossRef]
- Savoi, S.; Wong, D.C.J.; Arapitsas, P.; Miculan, M.; Bucchetti, B.; Peterlunger, E.; Fait, A.; Mattivi, F.; Castellarin, S.D. Transcriptome and Metabolite Profiling Reveals That Prolonged Drought Modulates the Phenylpropanoid and Terpenoid Pathway in White Grapes (Vitis vinifera L.). BMC Plant Biol. 2016, 16, 67. [Google Scholar] [CrossRef] [Green Version]
- Savoi, S.; Wong, D.C.J.; Degu, A.; Herrera, J.C.; Bucchetti, B.; Peterlunger, E.; Fait, A.; Mattivi, F.; Castellarin, S.D. Multi-Omics and Integrated Network Analyses Reveal New Insights into the Systems Relationships between Metabolites, Structural Genes, and Transcriptional Regulators in Developing Grape Berries (Vitis vinifera L.) Exposed to Water Deficit. Front. Plant Sci. 2017, 8. [Google Scholar] [CrossRef] [PubMed] [Green Version]
- Spicer, R.A.; Steinbeck, C. A Lost Opportunity for Science: Journals Promote Data Sharing in Metabolomics but Do Not Enforce It. Metabolomics 2017, 14, 16. [Google Scholar] [CrossRef] [PubMed] [Green Version]
- Sumner, L.W.; Amberg, A.; Barrett, D.; Beale, M.H.; Beger, R.; Daykin, C.A.; Fan, T.W.-M.; Fiehn, O.; Goodacre, R.; Griffin, J.L.; et al. Proposed Minimum Reporting Standards for Chemical Analysis. Metabolomics 2007, 3, 211–221. [Google Scholar] [CrossRef] [Green Version]
- Ulaszewska, M.M.; Weinert, C.H.; Trimigno, A.; Portmann, R.; Lacueva, C.A.; Badertscher, R.; Brennan, L.; Brunius, C.; Bub, A.; Capozzi, F.; et al. Nutrimetabolomics: An Integrative Action for Metabolomic Analyses in Human Nutritional Studies. Mol. Nutr. Food Res. 2019, 63, 1800384. [Google Scholar] [CrossRef]
- Alseekh, S.; Aharoni, A.; Brotman, Y.; Contrepois, K.; D’Auria, J.; Ewald, J.; Ewald, J.C.; Fraser, P.D.; Giavalisco, P.; Hall, R.D.; et al. Mass Spectrometry-Based Metabolomics: A Guide for Annotation, Quantification and Best Reporting Practices. Nat. Methods 2021, 18, 747–756. [Google Scholar] [CrossRef]
- Haug, K.; Salek, R.M.; Conesa, P.; Hastings, J.; de Matos, P.; Rijnbeek, M.; Mahendraker, T.; Williams, M.; Neumann, S.; Rocca-Serra, P.; et al. MetaboLights—An Open-Access General-Purpose Repository for Metabolomics Studies and Associated Meta-Data. Nucleic Acids Res. 2013, 41, D781–D786. [Google Scholar] [CrossRef]
- Haug, K.; Cochrane, K.; Nainala, V.C.; Williams, M.; Chang, J.; Jayaseelan, K.V.; O’Donovan, C. MetaboLights: A Resource Evolving in Response to the Needs of Its Scientific Community. Nucleic Acids Res. 2020, 48, D440–D444. [Google Scholar] [CrossRef] [PubMed] [Green Version]
- Harrow, J.; Drysdale, R.; Smith, A.; Repo, S.; Lanfear, J.; Blomberg, N. ELIXIR: Providing a Sustainable Infrastructure for Life Science Data at European Scale. Bioinformatics 2021, 37, 2506–2511. [Google Scholar] [CrossRef] [PubMed]
- Sud, M.; Fahy, E.; Cotter, D.; Azam, K.; Vadivelu, I.; Burant, C.; Edison, A.; Fiehn, O.; Higashi, R.; Nair, K.S.; et al. Metabolomics Workbench: An International Repository for Metabolomics Data and Metadata, Metabolite Standards, Protocols, Tutorials and Training, and Analysis Tools. Nucleic Acids Res. 2016, 44, D463–D470. [Google Scholar] [CrossRef] [PubMed] [Green Version]
- Wilkinson, M.D.; Dumontier, M.; Aalbersberg, I.J.; Appleton, G.; Axton, M.; Baak, A.; Blomberg, N.; Boiten, J.-W.; da Silva Santos, L.B.; Bourne, P.E.; et al. The FAIR Guiding Principles for Scientific Data Management and Stewardship. Sci. Data 2016, 3, 160018. [Google Scholar] [CrossRef] [PubMed] [Green Version]
- Papoutsoglou, E.A.; Faria, D.; Arend, D.; Arnaud, E.; Athanasiadis, I.N.; Chaves, I.; Coppens, F.; Cornut, G.; Costa, B.V.; Ćwiek-Kupczyńska, H.; et al. Enabling Reusability of Plant Phenomic Datasets with MIAPPE 1.1. New Phytol. 2020, 227, 260–273. [Google Scholar] [CrossRef] [PubMed] [Green Version]
- Baggiolini, M. Les Stades Repères Dans Le Développement Annuel de La Vigne et Leur Utilisation Pratique. Rev. Romande D’agriculture Et D’arboriculture 1952, 8, 4–6. [Google Scholar]
- Coombe, B.G. Growth Stages of the Grapevine: Adoption of a System for Identifying Grapevine Growth Stages. Aust. J. Grape Wine Res. 1995, 1, 104–110. [Google Scholar] [CrossRef]
- Lorenz, D.H.; Eichhorn, K.W.; Bleiholder, H.; Klose, R.; Meier, U.; Weber, E. Growth Stages of the Grapevine: Phenological Growth Stages of the Grapevine (Vitis vinifera L. Ssp. Vinifera)—Codes and Descriptions According to the Extended BBCH Scale†. Aust. J. Grape Wine Res. 1995, 1, 100–103. [Google Scholar] [CrossRef]
- Destrac-Irvine, A.; Barbeau, G.; de Resseguier, L.; Dufourcq, T.; Dumas, V.; de Cortazar-Atauri, I.G.; Ojeda, H.; Saurin, N.; van Leeuwen, C.; Duchêne, É. Measuring the Phenology to More Effectively Manage the Vineyard. IVES Tech. Rev. Vine Wine 2019. [Google Scholar] [CrossRef]
- Schymanski, E.L.; Jeon, J.; Gulde, R.; Fenner, K.; Ruff, M.; Singer, H.P.; Hollender, J. Identifying Small Molecules via High Resolution Mass Spectrometry: Communicating Confidence. Environ. Sci. Technol. 2014, 48, 2097–2098. [Google Scholar] [CrossRef] [PubMed]
- Ciubotaru, R.M.; Franceschi, P.; Zulini, L.; Stefanini, M.; Škrab, D.; Rossarolla, M.D.; Robatscher, P.; Oberhuber, M.; Vrhovsek, U.; Chitarrini, G. Mono-Locus and Pyramided Resistant Grapevine Cultivars Reveal Early Putative Biomarkers Upon Artificial Inoculation With Plasmopara Viticola. Front. Plant Sci. 2021, 12, 1297. [Google Scholar] [CrossRef]
- Moro, L.; Da Ros, A.; da Mota, R.V.; Purgatto, E.; Mattivi, F.; Arapitsas, P. LC–MS Untargeted Approach Showed That Methyl Jasmonate Application on Vitis labrusca L. Grapes Increases Phenolics at Subtropical Brazilian Regions. Metabolomics 2020, 16, 18. [Google Scholar] [CrossRef]
- Sun, L.; Zhu, B.; Zhang, X.; Wang, H.; Yan, A.; Zhang, G.; Wang, X.; Xu, H. The Accumulation Profiles of Terpene Metabolites in Three Muscat Table Grape Cultivars through HS-SPME-GCMS. Sci. Data 2020, 7, 5. [Google Scholar] [CrossRef] [PubMed]
- Stefanini, I.; Carlin, S.; Tocci, N.; Albanese, D.; Donati, C.; Franceschi, P.; Paris, M.; Zenato, A.; Tempesta, S.; Bronzato, A.; et al. Core Microbiota and Metabolome of Vitis vinifera L. Cv. Corvina Grapes and Musts. Front. Microbiol. 2017, 8, 457. [Google Scholar] [CrossRef]
- Picone, G.; Savorani, F.; Trimigno, A.; Mezzetti, B.; Capozzi, F.; Engelsen, S.B. Metabolic Changes of Genetically Engineered Grapes (Vitis vinifera L.) Studied by 1H-NMR, Metabolite Heatmaps and IPLS. Metabolomics 2016, 12, 150. [Google Scholar] [CrossRef]
- Narduzzi, L.; Stanstrup, J.; Mattivi, F. Comparing Wild American Grapes with Vitis Vinifera: A Metabolomics Study of Grape Composition. J. Agric. Food Chem. 2015, 63, 6823–6834. [Google Scholar] [CrossRef] [PubMed]
- Wehrens, R.; Carvalho, E.; Masuero, D.; Juan, A.D.; Martens, S. High-Throughput Carotenoid Profiling Using Multivariate Curve Resolution. Anal. Bioanal. Chem. 2013, 405, 5075–5086. [Google Scholar] [CrossRef]
- Dal Santo, S.; Tornielli, G.B.; Zenoni, S.; Fasoli, M.; Farina, L.; Anesi, A.; Guzzo, F.; Delledonne, M.; Pezzotti, M. The Plasticity of the Grapevine Berry Transcriptome. Genome Biol. 2013, 14, r54. [Google Scholar] [CrossRef] [PubMed] [Green Version]
- Mascellani, A.; Hoca, G.; Babisz, M.; Krska, P.; Kloucek, P.; Havlik, J. 1H NMR Chemometric Models for Classification of Czech Wine Type and Variety. Food Chem. 2021, 339, 127852. [Google Scholar] [CrossRef] [PubMed]
- Arapitsas, P.; Ugliano, M.; Marangon, M.; Piombino, P.; Rolle, L.; Gerbi, V.; Versari, A.; Mattivi, F. Use of Untargeted Liquid Chromatography—Mass Spectrometry Metabolome To Discriminate Italian Monovarietal Red Wines, Produced in Their Different Terroirs. J. Agric. Food Chem. 2020, 68, 13353–13366. [Google Scholar] [CrossRef]
- Savoi, S.; Herrera, J.C.; Carlin, S.; Lotti, C.; Bucchetti, B.; Peterlunger, E.; Castellarin, S.D.; Mattivi, F. From Grape Berries to Wines: Drought Impacts on Key Secondary Metabolites. OENO One 2020, 54, 569–582. [Google Scholar] [CrossRef]
- Beckner Whitener, M.E.; Stanstrup, J.; Panzeri, V.; Carlin, S.; Divol, B.; Du Toit, M.; Vrhovsek, U. Untangling the Wine Metabolome by Combining Untargeted SPME–GCxGC-TOF-MS and Sensory Analysis to Profile Sauvignon Blanc Co-Fermented with Seven Different Yeasts. Metabolomics 2016, 12, 53. [Google Scholar] [CrossRef]
- Franceschi, P.; Mylonas, R.; Shahaf, N.; Scholz, M.; Arapitsas, P.; Masuero, D.; Weingart, G.; Carlin, S.; Vrhovsek, U.; Mattivi, F.; et al. MetaDB a Data Processing Workflow in Untargeted MS-Based Metabolomics Experiments. Front. Bioeng. Biotechnol. 2014, 2, 72. [Google Scholar] [CrossRef] [PubMed] [Green Version]
- Arapitsas, P.; Speri, G.; Angeli, A.; Perenzoni, D.; Mattivi, F. The Influence of Storage on the “Chemical Age” of Red Wines. Metabolomics 2014, 10, 816–832. [Google Scholar] [CrossRef]
- Skogerson, K.; Runnebaum, R.; Wohlgemuth, G.; de Ropp, J.; Heymann, H.; Fiehn, O. Comparison of Gas Chromatography-Coupled Time-of-Flight Mass Spectrometry and 1H Nuclear Magnetic Resonance Spectroscopy Metabolite Identification in White Wines from a Sensory Study Investigating Wine Body. J. Agric. Food Chem. 2009, 57, 6899–6907. [Google Scholar] [CrossRef]
- Ciubotaru, R.M.; Franceschi, P.; Zulini, L.; Stefanini, M.; Škrab, D.; Rossarolla, M.D.; Robatscher, P.; Oberhuber, M.; Vrhovsek, U.; Chitarrini, G. Mono-Locus and Pyramided Resistant Grapevine Cultivars Reveal Early Putative Biomarkers upon Artificial Inoculation with Plasmopara Viticola. 2021. MetaboLights. Available online: https://www.ebi.ac.uk/metabolights/MTBLS2876 (accessed on 30 October 2021).
- Moro, L.; Da Ros, A.; da Mota, R.V.; Purgatto, E.; Mattivi, F.; Arapitsas, P. LC-MS Untargeted Approach Showed that Methyl Jasmonate Application on Vitis labrusca L. Grapes Increases Phenolics at Subtropical Brazilian Regions. 2020. MetaboLights. Available online: https://www.ebi.ac.uk/metabolights/MTBLS784 (accessed on 30 October 2021).
- Sun, L.; Zhu, B.; Zhang, X.; Wang, H.; Yan, A.; Zhang, G.; Wang, X.; Xu, H. The Accumulation Profiles of Terpene Metabolites in Three Muscat Table Grape Cultivars through HS-SPME-GCMS. 2019. MetaboLights. Available online: https://www.ebi.ac.uk/metabolights/MTBLS968 (accessed on 30 October 2021).
- Savoi, S.; Wong, D.C.J.; Degu, A.; Herrera, J.C.; Bucchetti, B.; Peterlunger, E.; Fait, A.; Mattivi, F.; Castellarin, S.D. Multi-Omics and Integrated Network Analyses Reveal New Insights into the Systems Relationships between Metabolites, Structural Genes, and Transcriptional Regulators in Developing Grape Berries (Vitis vinifera L.) Exposed to Water Deficit (Phenolics; UPLC-MS/MS assay). 2019. MetaboLights. Available online: https://www.ebi.ac.uk/metabolights/MTBLS898 (accessed on 30 October 2021).
- Savoi, S.; Wong, D.C.J.; Degu, A.; Herrera, J.C.; Bucchetti, B.; Peterlunger, E.; Fait, A.; Mattivi, F.; Castellarin, S.D. Multi-Omics and Integrated Network Analyses Reveal New Insights into the Systems Relationships between Metabolites, Structural Genes, and Transcriptional Regulators in Developing Grape Berries (Vitis vinifera L.) Exposed to Water Deficit (Volatile organic compounds; SPME-GC-MS assay). 2021. MetaboLights. Available online: https://www.ebi.ac.uk/metabolights/MTBLS982 (accessed on 30 October 2021).
- Savoi, S.; Wong, D.C.J.; Degu, A.; Herrera, J.C.; Bucchetti, B.; Peterlunger, E.; Fait, A.; Mattivi, F.; Castellarin, S.D. Multi-Omics and Integrated Network Analyses Reveal New Insights into the Systems Relationships between Metabolites, Structural Genes, and Transcriptional Regulators in Developing Grape Berries (Vitis vinifera L.) Exposed to Water Deficit (Carotenoids; UPLC-DAD assay). 2021. MetaboLights. Available online: https://www.ebi.ac.uk/metabolights/MTBLS984 (accessed on 30 October 2021).
- Stefanini, I.; Carlin, S.; Tocci, N.; Albanese, D.; Donati, C.; Franceschi, P.; Paris, M.; Zenato, A.; Tempesta, S.; Bronzato, A.; et al. Core Microbiota and Metabolome of Vitis vinifera L. Cv. Corvina Grapes and Musts. 2017. MetaboLights. Available online: https://www.ebi.ac.uk/metabolights/MTBLS392 (accessed on 30 October 2021).
- Savoi, S.; Wong, D.C.J.; Arapitsas, P.; Miculan, M.; Bucchetti, B.; Peterlunger, E.; Fait, A.; Mattivi, F.; Castellarin, S.D. Transcriptome and Metabolite Profiling Reveals that Prolonged Drought Modulates the Phenylpropanoid and Terpenoid Pathway in White Grapes (Vitis vinifera L.) (Phenolics; UPLC-MS/MS Assay). 2019. MetaboLights. Available online: https://www.ebi.ac.uk/metabolights/MTBLS897 (accessed on 30 October 2021).
- Savoi, S.; Wong, D.C.J.; Arapitsas, P.; Miculan, M.; Bucchetti, B.; Peterlunger, E.; Fait, A.; Mattivi, F.; Castellarin, S.D. Transcriptome and Metabolite Profiling Reveals that Prolonged Drought Modulates the Phenylpropanoid and Terpenoid Pathway in White Grapes (Vitis vinifera L.) (Volatile Organic Compounds; SPME-GC-MS Assay). 2021. MetaboLights. Available online: https://www.ebi.ac.uk/metabolights/MTBLS892 (accessed on 30 October 2021).
- Savoi, S.; Wong, D.C.J.; Arapitsas, P.; Miculan, M.; Bucchetti, B.; Peterlunger, E.; Fait, A.; Mattivi, F.; Castellarin, S.D. Transcriptome and Metabolite Profiling Reveals that Prolonged Drought Modulates the Phenylpropanoid and Terpenoid Pathway in White Grapes (Vitis vinifera L.) (Carotenoids; UPLC-DAD Assay). 2021. MetaboLights. Available online: https://www.ebi.ac.uk/metabolights/MTBLS889 (accessed on 30 October 2021).
- Picone, G.; Savorani, F.; Trimigno, A.; Mezzetti, B.; Capozzi, F.; Engelsen, S.B. Metabolic Changes of Genetically Engineered Grapes (Vitis vinifera L.) Studied by 1H-NMR, Metabolite Heatmaps and IPLS. 2016. MetaboLights. Available online: https://www.ebi.ac.uk/metabolights/MTBLS346 (accessed on 30 October 2021).
- Narduzzi, L.; Stanstrup, J.; Mattivi, F. The Measurement of Spatial Distribution of Grape Metabolites in Berry Tissues Using LC-MS. 2015. MetaboLights. Available online: https://www.ebi.ac.uk/metabolights/MTBLS209 (accessed on 30 October 2021).
- Wehrens, R.; Carvalho, E.; Masuero, D.; de Juan, A.; Martens, S. High-Throughput Carotenoid Profiling Using Multivariate Curve Resolution (Stability of Isoprenoids in Grape Extract). 2014. MetaboLights. Available online: https://www.ebi.ac.uk/metabolights/MTBLS85 (accessed on 30 October 2021).
- Dal Santo, S.; Tornielli, G.B.; Zenoni, S.; Fasoli, M.; Farina, L.; Anesi, A.; Guzzo, F.; Delledonne, M.; Pezzotti, M. The Plasticity of the Grapevine Berry Transcriptome. 2013. MetaboLights. Available online: https://www.ebi.ac.uk/metabolights/MTBLS39 (accessed on 30 October 2021).
- Mascellani, A.; Hoca, G.; Babisz, M.; Krska, P.; Kloucek, P.; Havlik, J. 1H NMR Chemometric Models for Classification of Czech Wine Type and Variety. 2020. MetaboLights. Available online: https://www.ebi.ac.uk/metabolights/MTBLS1677 (accessed on 30 October 2021).
- Arapitsas, P.; Ugliano, M.; Marangon, M.; Piombino, P.; Rolle, L.; Gerbi, V.; Versari, A.; Mattivi, F. Use of Untargeted Liquid Chromatography–Mass Spectrometry Metabolome To Discriminate Italian Monovarietal Red Wines, Produced in Their Different Terroirs. 2020. MetaboLights. Available online: https://www.ebi.ac.uk/metabolights/MTBLS1443 (accessed on 30 October 2021).
- Savoi, S.; Herrera, J.C.; Carlin, S.; Lotti, C.; Bucchetti, B.; Peterlunger, E.; Castellarin, S.D.; Mattivi, F. From Grape Berries to Wines: Drought Impacts on Key Secondary Metabolites. 2021. MetaboLights. Available online: https://www.ebi.ac.uk/metabolights/MTBLS2330 (accessed on 30 October 2021).
- Beckner Whitener, M.E.; Stanstrup, J.; Panzeri, V.; Carlin, S.; Divol, B.; Du Toit, M.; Vrhovsek, U. Untangling the Wine Metabolome by Combining Untargeted SPME–GCxGC-TOF-MS and Sensory Analysis to Profile Sauvignon Blanc Co-Fermented with Seven Different Yeasts. 2015. MetaboLights. Available online: https://www.ebi.ac.uk/metabolights/MTBLS212 (accessed on 30 October 2021).
- Franceschi, P.; Mylonas, R.; Shahaf, N.; Scholz, M.; Arapitsas, P.; Masuero, D.; Weingart, G.; Carlin, S.; Vrhovsek, U.; Mattivi, F.; et al. MetaDB a Data Processing Workflow in Untargeted MS-Based Metabolomics Experiments. 2014. MetaboLights. Available online: https://www.ebi.ac.uk/metabolights/MTBLS137 (accessed on 30 October 2021).
- Arapitsas, P.; Speri, G.; Angeli, A.; Perenzoni, D.; Mattivi, F. The Influence of Storage on the “Chemical Age” of Red Wines. 2014. MetaboLights. Available online: https://www.ebi.ac.uk/metabolights/MTBLS55 (accessed on 30 October 2021).
- Skogerson, K.; Runnebaum, R.; Wohlgemuth, G.; de Ropp, J.; Heymann, H.; Fiehn, O. White Wine Study. 2013. MetaboLights. Available online: https://www.metabolomicsworkbench.org/data/DRCCMetadata.php?Mode=Project&ProjectID=PR000005 (accessed on 30 October 2021).
- Powers, S.M.; Hampton, S.E. Open Science, Reproducibility, and Transparency in Ecology. Ecol. Appl. 2019, 29, e01822. [Google Scholar] [CrossRef] [PubMed] [Green Version]


| Field | Description |
|---|---|
| Source | Where the samples were collected. The use of an ID is recommended (https://ror.org/, accessed on 30 October 2021). Example: Fondazione Edmund Mach collection (ID 0381bab64), or experimental winery, winery, supermarket, etc. |
| Organism | An identifier for the organism at the species level. The use of the NCBI taxon ID is recommended. For Vitis vinifera the ID is 29760. (https://www.ncbi.nlm.nih.gov/taxonomy/, accessed on 30 October 2021). |
| Specie(s) | According to the standard scientific nomenclature, species name (formally: specific epithet) for the organism under study (e.g., Vitis vinifera L.). |
| Intraspecific name(s) | Three field codes might be necessary to identify the exact plant material used in an experiment. Field 1: code for the institution. Please refer to WIEWS codes from the FAO (http://www.fao.org/wiews/en/, accessed on 30 October 2021) or ROR codes (https://ror.org, accessed on 30 October 2021) for research organizations. Field 2: type of plant material. The most commonly used denomination for grapevine material is the variety name. We recommend using a standard name, such as the “prime name” extracted from the VIVC database (http://www.vivc.de, accessed on 30 October 2021). The type of plant material can be classified with (i) the five-digit VIVC code for identified varieties, (ii) “PRO” for genotypes from bi-parental crosses, (iii) “TL” for transgenic lines, (iv) “ESL” for lines regenerated from anthers or somatic tissues, or (v) nothing when the type of plant material is not characterized. Field 3: code used to identify the accession available in the institute. For plants from genetic resources, the unique accession number of the EU-Vitis Database (http://www.eu-vitis.de/, accessed on 30 October 2021) is recommended. Examples: FRA038_VIVC10077_274Col49 for Riesling clone number 49 available at INRAE Colmar. FRA038_PRO_41207Col0011E for a genotype in the progeny from a cross between Riesling and Gewürztraminer. DEU098-1980-315 for a specific Riesling accession in the Vitis collection of JKI Geilweilerhof. |
| Organism part | A reliable description of biological samples requires a shared vocabulary for the organ collected. The grapevine ontology anatomy is available at http://agroportal.lirmm.fr/ontologies/GAO (accessed on 30 October 2021) or https://data.inrae.fr/dataset.xhtml?persistentId=doi:10.15454/SBXYSV (accessed on 30 October 2021). |
| Developmental stages | Several scales to describe the grapevine developmental stages are available [27,28,29] and can be used in a grapevine experiment. Here we propose to add some accuracy to the descriptions of these stages [30]. Dates for the main development stages. A bud is counted as “broken” if a green (or red) tip is visible (BBCH 07, Baggiolini C). The budbreak date is determined by interpolation between several successive records, as the day when 50% of the buds left after pruning have reached this stage. For flowering (BBCH 65, Baggiolini I), the flowering date is determined as the day when 50% of the flower caps detach or fall. For véraison (BBCH 85, Baggiolini M), the most relevant definition is “softening” and not “color change”, in order to record values that can be compared between white and colored genotypes. The date of véraison is determined as the day when 50% of the berries are soft. A reliable estimation of the percentage of soft berries should be based on touching at least 100 berries (20 on five plants, for example). Phenological descriptors for the berries. Four types of berry samples can be distinguished: (i) green berries, (ii) ripening berries, (iii) mix of green and ripening berries, (iv) harvested berries. In order to allow comparisons between experiments, we propose to provide the following data to best characterize a sample, ranked by decreasing relevance. For green berries: (i) number of days after flowering (DAF) or before véraison (as defined above), (ii) heat sums calculated with the degree days (usually above 10 °C, otherwise to be specified), starting at flowering, (iii) single berry weight or volume. For ripening berries: (i) number of days after véraison (DAV) (as defined above), (ii) heat sums (usually base 10 °C, otherwise to be specified) after véraison, (iii) single berry weight or volume, (iv) sugar concentration, (v) acidity parameters (pH, titratable acidity, malic acid concentration, tartaric acid concentration, potassium concentration). For harvested berries (post ripening berries, BBCH 99): (i) number of days after harvest. Phenological descriptors for the leaves: (i) age (number of leaves above, when the apex is active), (ii) position (from the base of the shoot). Deviations due to the needs of experimental settings are to be explained in detail. |
| Tissue harvesting method | Register the details about how the sampling occurred in the field/vineyard. For example, report if the samples were directly frozen and how (e.g., liquid N2, dry ice, freeze clamping, etc.), the date and time of collection, the place of collection, if samples were washed to remove unwanted external components (e.g., soil), shipping time and temperature, and sample storage before further preparation (e.g., −80 °C for two weeks). |
| Harvest protocol | Include information about the harvest date and period, if it was made manually or mechanically, the time of the day (morning, afternoon, night), grape sanitary status, crop yields, crushing and pressing devices and settings, yield of must or wine, pre-fermentative processing (e.g., grape cooling, sulfitation, etc.), information related to the experiment, etc. |
| Sample Type (Wine) | Describe at which point in the production line the samples were collected (must, day of fermentation, end of alcoholic fermentation, end of malolactic fermentation, after barrel aging, etc.). |
| Winemaking protocol | Include information about additions (additives and processing aids, amount, timing, method of mixing), microorganism (source, genus, species, commercial name), must volumes, container type and volume, maceration technique, temperature, length of fermentation, use of oak/wood barrels (or wood staves or chips), micro-oxygenation, first or second fermentation, disciplinary if PDO, and other information related to the experiment. The following two documents from OIV can help: https://www.oiv.int/public/medias/4954/oiv-oeno-567a-2016-en.pdf (accessed on 30 October 2021). https://www.oiv.int/public/medias/7713/en-oiv-code-2021.pdf (accessed on 30 October 2021). |
| Basic oenological analysis | Include all available measurements (e.g., soluble solids, pH, titratable acidity, fermentable nitrogen, sugars, ethanol, residual sugar, free and total sulfites, malic and lactic acid, total phenols, absorbance at 420 and 520 nm, volatile acidity, Cu, Fe) and other information relevant for the experiment. The next three documents from OIV can help: https://www.oiv.int/en/technical-standards-and-documents/methods-of-analysis/compendium-of-international-methods-of-analysis-of-wines-and-musts (accessed on 30 October 2021). https://www.oiv.int/en/technical-standards-and-documents/methods-of-analysis/the-guidelines-in-oenology (accessed on 30 October 2021). https://www.oiv.int/en/technical-standards-and-documents (accessed on 30 October 2021). |
| Commercial wine | If the study is based on commercial wines sourced from the market, provide information about source (supermarket, wine shop, winery, etc.), date of sampling, price, PDO data, cultivar(s), winery, region, country, vintage, color, basic oenological analysis, lot number, bottling date, and other information related to the experiment. |
| Packaging | Include information about packaging material (glass bottle, tetra-pak, metallic, plastic, etc.), packaging transparency (flint, green, amber, dark), volume, stopper (corks–natural, colmated, agglomerated, 1 + 1, micro-agglomerated-, synthetic, screw caps, glass, etc.), and other information related to the experiment. |
| Replicate sampling and analyses | The number of samples represents the “sample size”, and all the samples together represent the “sample set”. A part of the “sample set”, thus a “sample subset”, can be used for the analysis. A minimum of triplicate (n = 3) biological sampling is proposed, with n = 5 preferred. It is more critical to measure biological replicates than technical ones. |
| Storage conditions and aliquoting prior to extraction | Report information about temperature, duration, possible additives, volumes, container, and atmosphere. Samples can be divided into small aliquots. Report method, volume or weight, and number of aliquots. |
| Relocation or shipping info | Provide information about the shipping conditions (if relevant). |
| Sample IDs list | Sample ID list connected to the above information. |
| Field | Description |
|---|---|
| Randomization | Report if the sample preparation order was randomized and how (https://www.random.org/sequences/, accessed on 30 October 2021). |
| Extraction parameters | Solvent(s), pH and ionic strength of the buffer, solvent temperature and volume(s) per quantity of tissue, internal standard(s), number of replicate extracts (technical and biological replicates), sequential extraction, and extraction time. |
| Concentration/Dilution | Extract concentration, dilution, and resolubilization processes (e.g., dried under nitrogen, solubilized in methanol). |
| Enrichment | Extract enrichment (e.g., solid-phase extraction, desalting, molecular cut-off, ion exchanges, rotary vapor). |
| Extract treatments | Extract cleanup and/or use of additives (e.g., ultrafiltration, centrifugation, the addition of antioxidants, pH change). |
| Derivatization | Report the protocol of derivatization (the chemical used, temperature, time, etc.). |
| Quality Control Sample(s) | Report if a QC pooled sample was prepared using extracts of the entire “sample set” or a “sample subset”. In addition, report the method (volume or weight from each sample and total amount of the QC pooled sample). |
| Reference Material | Report if any biological reference material and/or a standard mixture was used and how it was purchased or prepared. This material can also be used as QC samples. |
| Blanks | Report how the blank sample was prepared. |
| Aliquoting | Aliquots prepared during or after the sample preparation (code, volume, number). This includes the QC samples. |
| Storage–Relocation | Extract storage (e.g., temperature, duration, atmosphere, volumes, containers, etc.) and/or relocation (e.g., temperature, duration, atmosphere, places). |
| Internal standard(s) addition | Internal standard(s) at any stage(s). |
| Samples ID list | Update the Sample ID list, including the names or the IDs of the extracts. Often more than one extraction protocol is applied to the same samples. |
| Field | Description |
|---|---|
| Instrument | Manufacturer, model number, software package and version. The majority of the instruments can be found in the EMBL/EBI ontology (https://www.ebi.ac.uk/ols/ontologies/ms, accessed on 30 October 2021). If this is the case, we recommend the use of the ontologies; if not, use free text. |
| Injection | Auto-injector (manufacturer, model, type, software, injector/loop volume, wash cycles, solvents, volume, SPME parameters, automatic derivatization, injector temperature, split or splitless mode, and ratio, etc.). |
| Stationary phase | Separation column(s) and pre/guard column (manufacturer, model/name, stationary phase composition, particles, internal diameter, physical parameters, length, parameters of 2D chromatography, etc.). |
| Mobile phase | Mobile phase (e.g., gases, solvents, buffers, pH) including their preparation protocol (information of the type of flasks, pipette, degasser, etc.) and post-column modifiers (if applied). |
| Separation | Separation parameters (sample temperature, mobile phases composition(s), gradient profile, column temperature, flow rate(s), pressure, etc.). |
| Sequence | Sequence duration and length of stay of the sample in the sampler before analysis. Report if the “sample set” or “sample subset” order was randomized and the frequency of the QC analysis (all types of QC samples used). |
| Sample introduction and delivery | Direct infusion (continuous or not) after GC, CE, or LC separation. |
| Ionization source | Ionization mode (EI, APCI, ESI, etc.), polarity (positive or negative), vacuum pressure, skimmer/focusing lens voltages (e.g., capillary voltage, etc.), gas flows (e.g., nebulization gas, cone gas, source temperature, etc.). |
| Mass analyzer | Type of analyzer (e.g., quadrupole, ion-trap, time-of-flight, FT-ICR, including combinations of these for hybrid instruments). The majority of the analyzers can be found in EMBL/EBI ontology (https://www.ebi.ac.uk/ols/ontologies/ms, accessed on 30 October 2021). |
| Acquisition mode and parameters | For a single quadrupole instrument, the scan modes are full scan and sim; for a triple quadrupole instrument, common modes are full scan, product scan, precursor scan, neutral loss scan and MRM. In high-resolution MS (QTof and Orbitrap), common scan modes are: (a) full scan; (b) data-dependent acquisition, such as MS/MS; and c) data-independent acquisition, such as Swath, Sonar, MSall, MSn, MSe, MSc2, AIF-MS2, vDIA, bbCID. All the parameters of the acquisition mode should be reported, such as the m/z scan range, polarity(ies), scan speed, collision energy(ies), cycle time, resolution, mass accuracy, and spectral acquisition rate, vacuum pressure, various voltages, etc. |
| Ion Mobility | Type (DTIMS, TIMS, DMS, etc.), place (e.g., before or after the quadrupole), buffer gas, separation parameters. |
| Technique-specific sample preparation | Re-suspension of sample (e.g., in MeOH:water 1:1 with 0.2% formic acid), derivatization, volume injected, and internal calibrant(s) added (if relevant). |
| Calibration | Calibration compound(s) and mode. |
| Lock spray | Concentration, lock mass, flow rate, and frequency. |
| Analysis or Assay ID | Update the Sample ID list, including the names or the IDs of the raw assay files. This name could include the date of the analysis, the order of the analysis, and information about the protocol. The sample with the ID: SAN12 could have as Assay ID: 20201214_055_SAN12_RP_NEG, where the first part gives information about the date of analysis, the second the order of the analysis, the third the sample ID, and the fourth about the chromatography protocol. |
| Field | Description |
|---|---|
| Raw data format | Report the format of the original raw data, as registered by the instrument and its software. |
| Data conversion | Often the raw data are converted to “open” (or not) formats, such as net.CDF, XML, MZml, etc., for their further analysis. Report the software and its version used for the data conversion and the parameters used. |
| Data pre-processing | The original or the converted data are often processed before the statistical analysis. For the MS data, the process might include peak picking, background subtraction, noise reduction, time or m/z filtration, alignment, spectral deconvolution, smoothing, binning, data reduction, filling missing peaks, etc. Report the software and its version used together with the parameters. The most popular software are MZmine, XCMS, MSdial, metaMS, Progenesis QI, and MetAlign. |
| Data treatment | The obtained peak table from the data pre-treatment can be further treated with normalization and scaling tools. First, report the software, its version, and the parameters used. Then, inspecting the data for drift correction or outliers’ detection is envisaged. |
| Annotation confidence | The correct peak or metabolite annotation is crucial for the interpretation of the results, and it is important to provide information as far as the confidence of each annotation will allow by applying one of the below-listed annotation level protocols. |
| Four levels annotation [18] | This is the most common method used to report the annotation confidence in metabolomics. It includes the following levels of annotation: 1. Identified compounds. A minimum of two independent and orthogonal data relative to an authentic compound analyzed under identical experimental conditions is proposed as necessary to validate non-novel metabolite identifications (e.g., retention time/index and mass spectrum, retention time and NMR spectrum, accurate mass and tandem MS, accurate mass and isotope pattern, full 1H and/or 13C NMR, 2-D NMR spectra). 2. Putatively annotated compounds. This level is applied when the annotation is made without chemical reference standards, based upon physicochemical properties and/or spectral similarity with public/commercial spectral libraries or literature. If spectral matching is utilized in the identification process, then the authentic spectra used for the spectral matching should be described appropriately or libraries made publicly available. 3. Putatively characterized compound classes. The annotation is based upon characteristic physicochemical properties of a chemical class of compounds or by spectral similarity to known compounds of a chemical class (e.g., hexose, carotenoid, lipid, anthocyanin, etc.). 4. Unknown compounds. Although unidentified or unclassified, these metabolites can still be differentiated and quantified based upon spectral data. |
| Five levels annotation [31] | This is the second most used method to report the annotation confidence in metabolomics. It includes the following levels of annotation: Level 1: Confirmed structure represents the ideal situation, where the proposed structure has been confirmed via appropriate measurement of a reference standard with MS, MS/MS and retention time matching. If possible, an orthogonal method should also be used. Level 2: Probable structure indicates that it was possible to propose an exact structure using different evidence. For Level 2a: a library that involves matching literature or library spectrum data where the spectrum–structure match is unambiguous. Care is needed when comparing spectra recorded with different acquisition parameters (e.g., resolution, collision energy, ionization, MS level, retention behavior) to ensure the validity of the match; decision criteria should be clearly presented. For Level 2b: diagnostic represents the case where no other structure fits the experimental information, but no standard or literature information is available for confirmation. Evidence can include diagnostic MS/MS fragments and/or ionization behavior, parent compound information, and the experimental context. Level 3: Tentative candidate(s) describes/e a “grey zone”, where evidence exists for possible structure(s), but the information for one exact structure only is insufficient (e.g., positional isomers). Level 4: Unequivocal molecular formula is possible when a formula can be unambiguously assigned using the spectral information (e.g., adduct, isotope, and/or fragment information), but insufficient evidence exists to propose possible structures. The MS/MS could be uninformative, contain interferences, or not even exist. Level 5: Exact mass (m/z) can be measured in a sample and be of specific interest for the investigation but lack information to assign even a formula. Screening and nontarget methods allow the tracing of these masses in other investigations, but level 5 indicates that no unequivocal information about the structure or formula exists. It is even possible to record the MS/MS of a level 5 mass and save it as an “unknown” spectrum in a database. This level should only apply to a few masses of specific interest since it would be counterproductive to label all masses in a sample as level 5. Blank measurements should be used to ensure the substance does not arise from sample preparation or measurement. |
| Metabolomics Society’s Metabolite Identification Task Group | The metabolomics community recently released a new method by introducing subclasses (A-F) for unambiguous metabolite annotation. https://drive.google.com/file/d/1PJLdPCkz8ymX8SgZ4Wl5Sw4ZG-dlyWWU/view, accessed on 30 October 2021. The proposed levels are: A: Known enantiomer. A single defined enantiomer or a single defined achiral metabolite. Molecular formula, structure, and stereochemistry, including chirality, are known. Usually requires isolation of metabolite and complete structure determination or chiral chromatography on metabolite in a mixture to prove chirality and matching of two orthogonal pieces of data with an authentic chemical standard. For achiral metabolites, it requires the matching of two orthogonal pieces of data with authentic chemical standards (e.g., RT and MS/MS mass spectrum). B: Known diastereomer. One of two enantiomers. Known molecular formula, structure, and stereochemistry but unknown chirality. Requires matching of two orthogonal pieces of data with authentic chemical standards (e.g., RT and MS/MS mass spectrum). C: Known structure/DB position. One of a number of stereoisomers, e.g., E/Z geometric or cis-/trans-ring isomers. Known molecular formula and structure but unknown stereochemistry. Requires matching of two orthogonal pieces of data with authentic chemical standards (e.g., RT and MS/MS mass spectrum). D: Known functional group. One of a number of positional isomers. Known molecular formula and metabolite class but unknown structure, e.g., high-resolution mass spectrometry provides unique and unambiguous single molecular formula, and additional data proves metabolite class membership. E: Known formula. One of a number of possible compounds of known molecular formula. Known molecular formula but unknown structure, e.g., high-resolution mass spectrometry provides the unique and unambiguous single molecular formula. F: Known structural class. Specific spectral features defining a structural class. Unknown molecular formula but a known class of metabolite; characteristic signals of metabolite class in the sample. G: Known formula. Specific spectral futures. Unknown molecular formula; characteristic signals of unknown metabolite in the sample. |
| Metabolite ID | Identify the annotated metabolites with a unique identifier (ID) corresponding to one of the following databases: Chemical entities of biological interest (ChEBI), HMDB, FoodDB, KEGG, Chemspider, PubChem, COlleCtion of Open Natural ProdUcTs ID, or CAS. |
Publisher’s Note: MDPI stays neutral with regard to jurisdictional claims in published maps and institutional affiliations. |
© 2021 by the authors. Licensee MDPI, Basel, Switzerland. This article is an open access article distributed under the terms and conditions of the Creative Commons Attribution (CC BY) license (https://creativecommons.org/licenses/by/4.0/).
Share and Cite
Savoi, S.; Arapitsas, P.; Duchêne, É.; Nikolantonaki, M.; Ontañón, I.; Carlin, S.; Schwander, F.; Gougeon, R.D.; Ferreira, A.C.S.; Theodoridis, G.; et al. Grapevine and Wine Metabolomics-Based Guidelines for FAIR Data and Metadata Management. Metabolites 2021, 11, 757. https://doi.org/10.3390/metabo11110757
Savoi S, Arapitsas P, Duchêne É, Nikolantonaki M, Ontañón I, Carlin S, Schwander F, Gougeon RD, Ferreira ACS, Theodoridis G, et al. Grapevine and Wine Metabolomics-Based Guidelines for FAIR Data and Metadata Management. Metabolites. 2021; 11(11):757. https://doi.org/10.3390/metabo11110757
Chicago/Turabian StyleSavoi, Stefania, Panagiotis Arapitsas, Éric Duchêne, Maria Nikolantonaki, Ignacio Ontañón, Silvia Carlin, Florian Schwander, Régis D. Gougeon, António César Silva Ferreira, Georgios Theodoridis, and et al. 2021. "Grapevine and Wine Metabolomics-Based Guidelines for FAIR Data and Metadata Management" Metabolites 11, no. 11: 757. https://doi.org/10.3390/metabo11110757