
Detection of Lung Cancer via Blood Plasma and 1H-NMR Metabolomics: Validation by a Semi-Targeted and Quantitative Approach Using a Protein-Binding Competitor

 ,
,  , ,
, ,
Abstract
:1. Introduction
2. Results
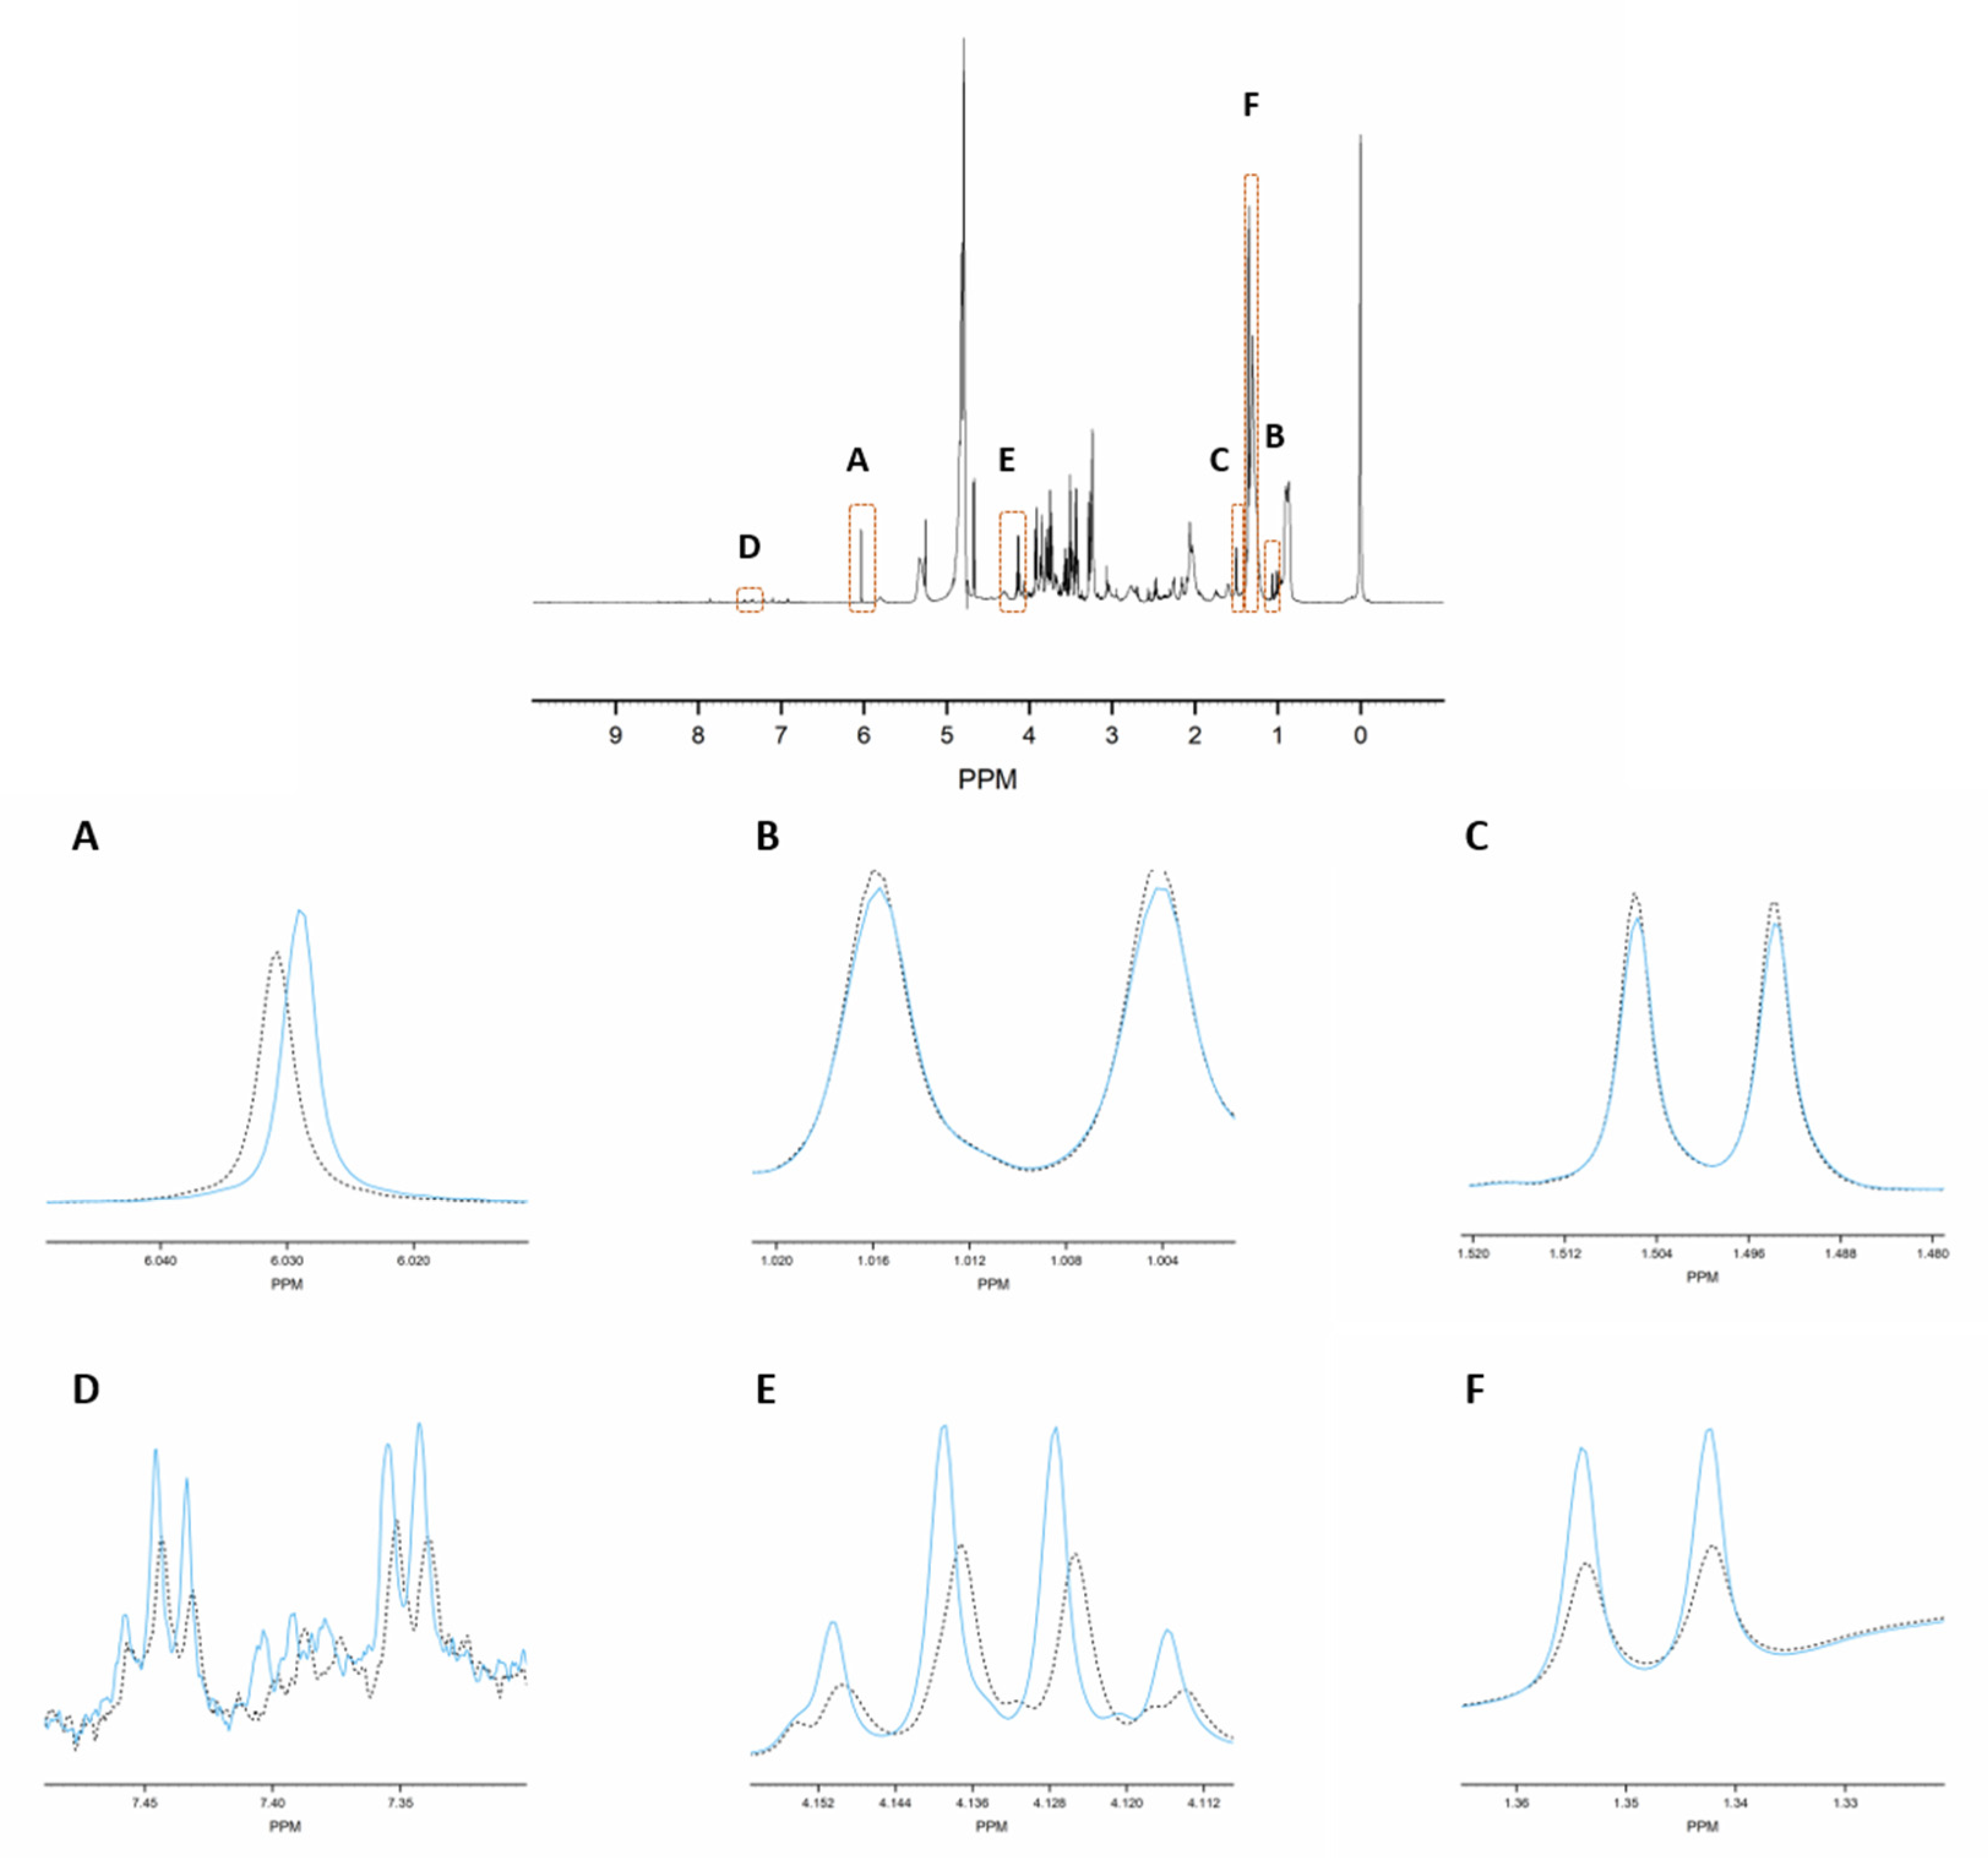
2.1. TSP Has a High Affinity for HSA and Ensures Dissociation of Protein-Bound Metabolites
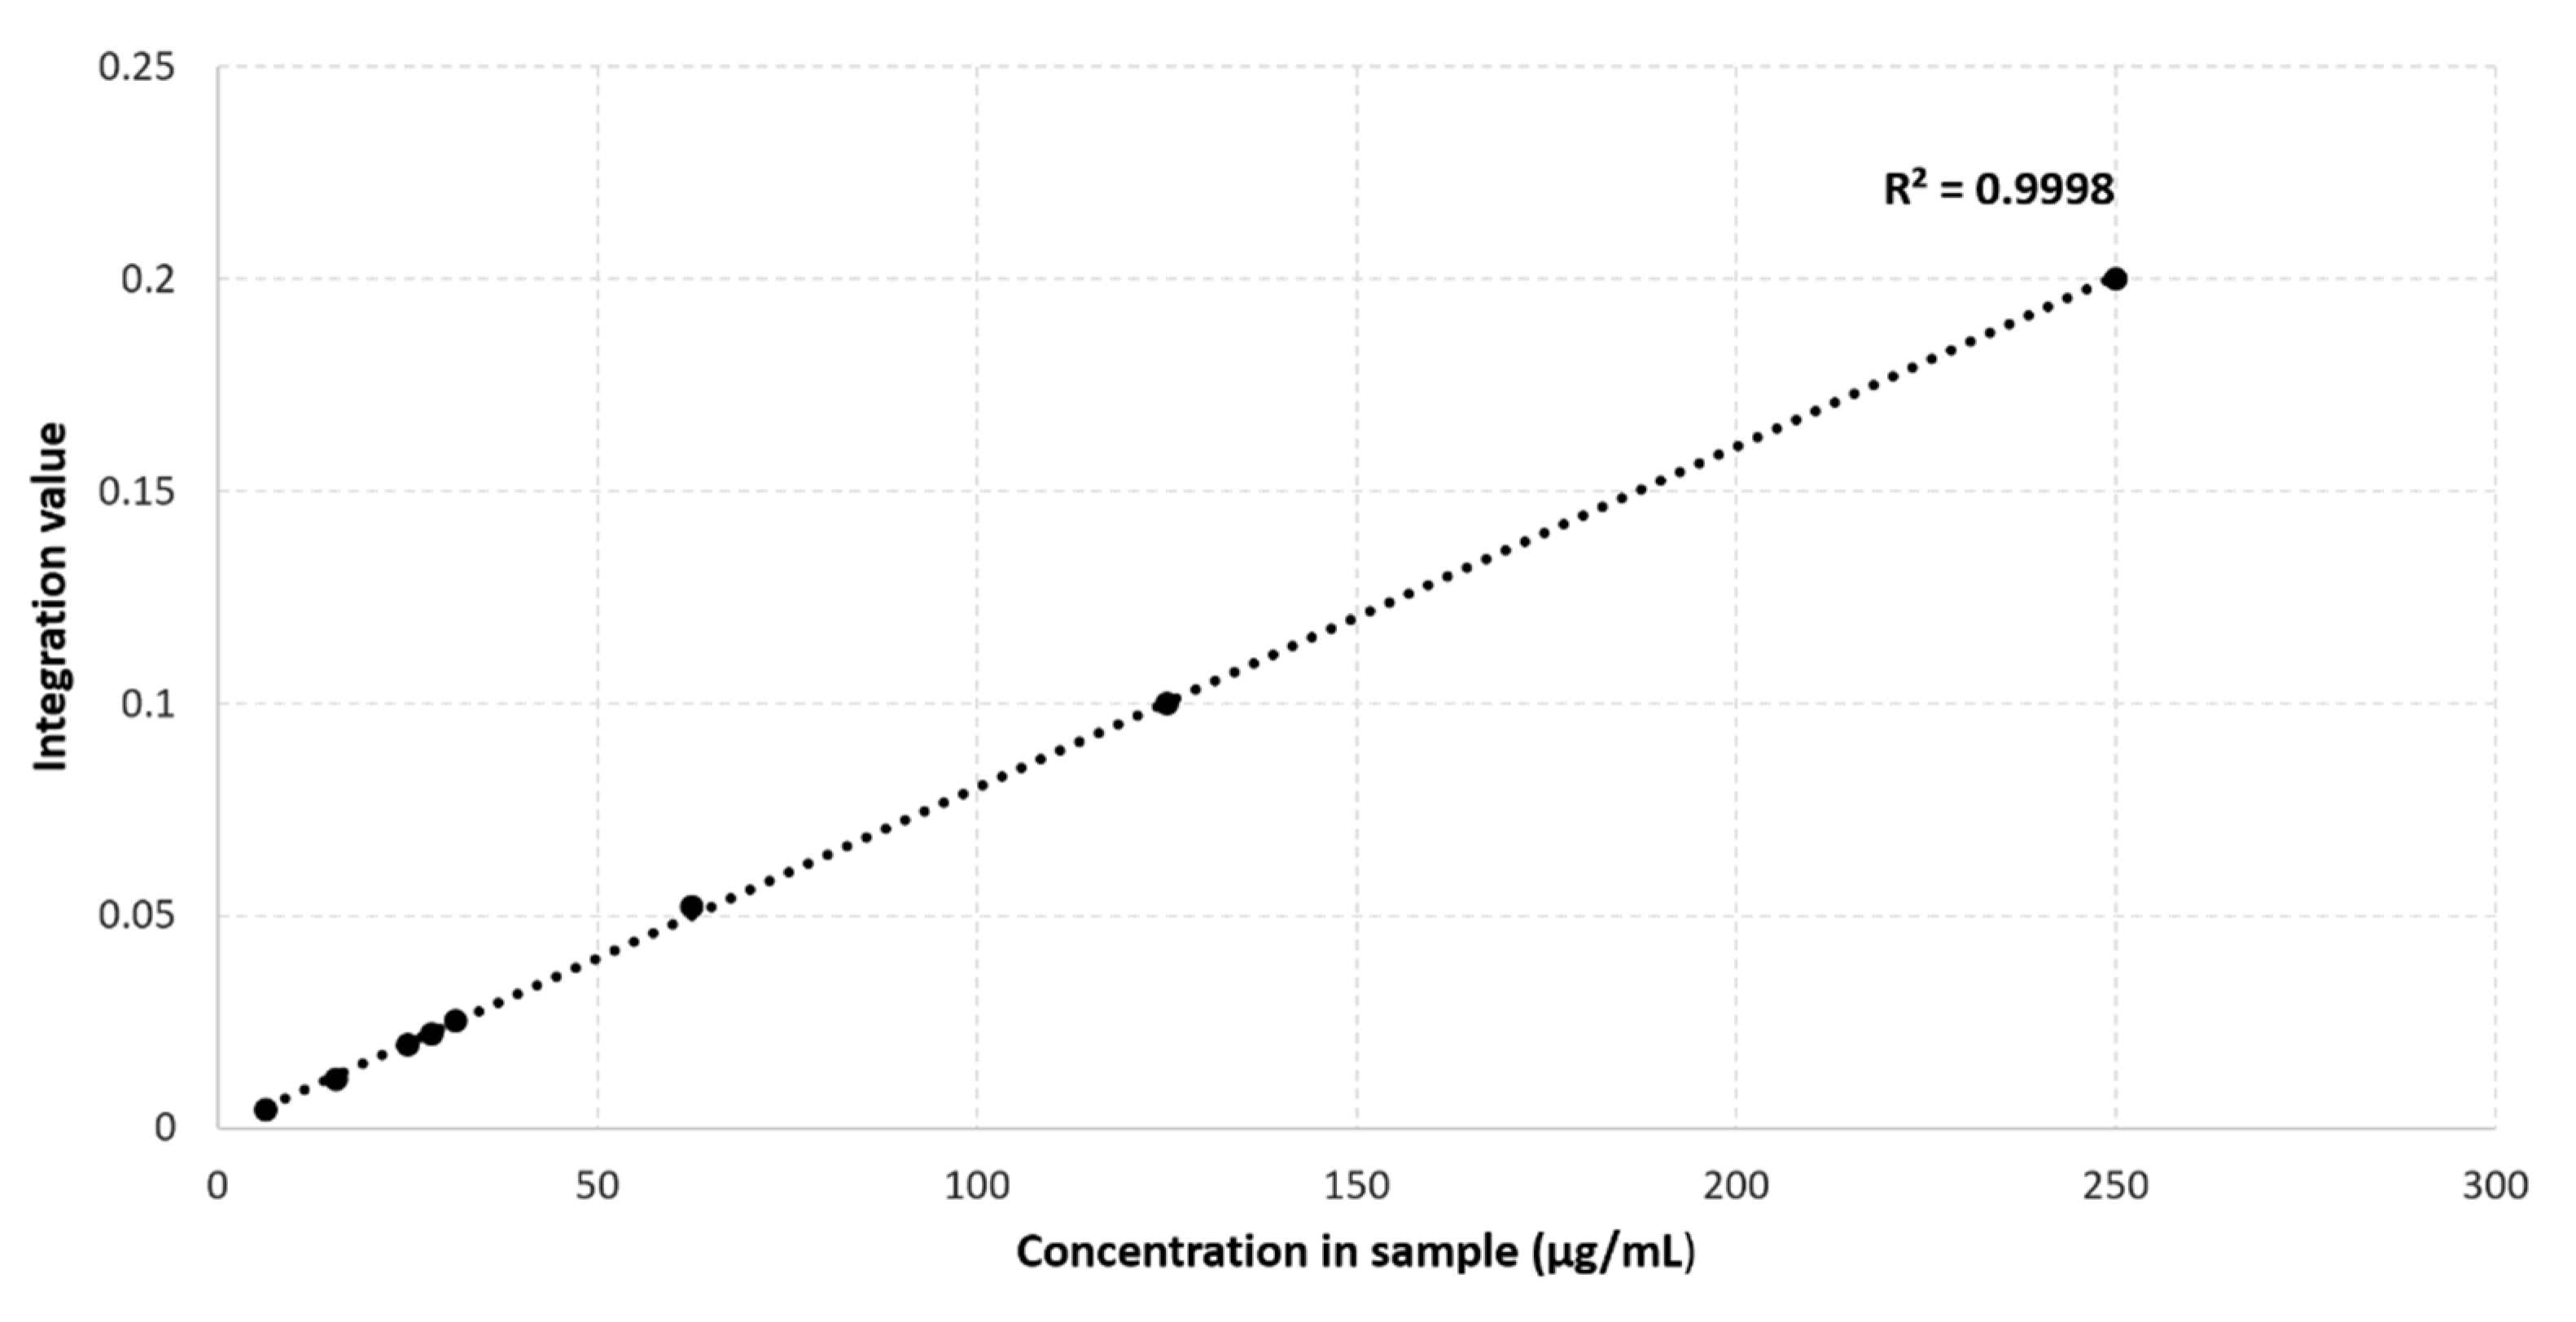
2.2. Maleic Acid as an Internal Standard for Quantification in NMR Metabolomics of Plasma Containing 4 mM TSP
2.3. Spiking with 62 Known Metabolites Results in 237 Well-Defined Integration Regions
2.4. The Proposed Methodology Shows a High Robustness Level
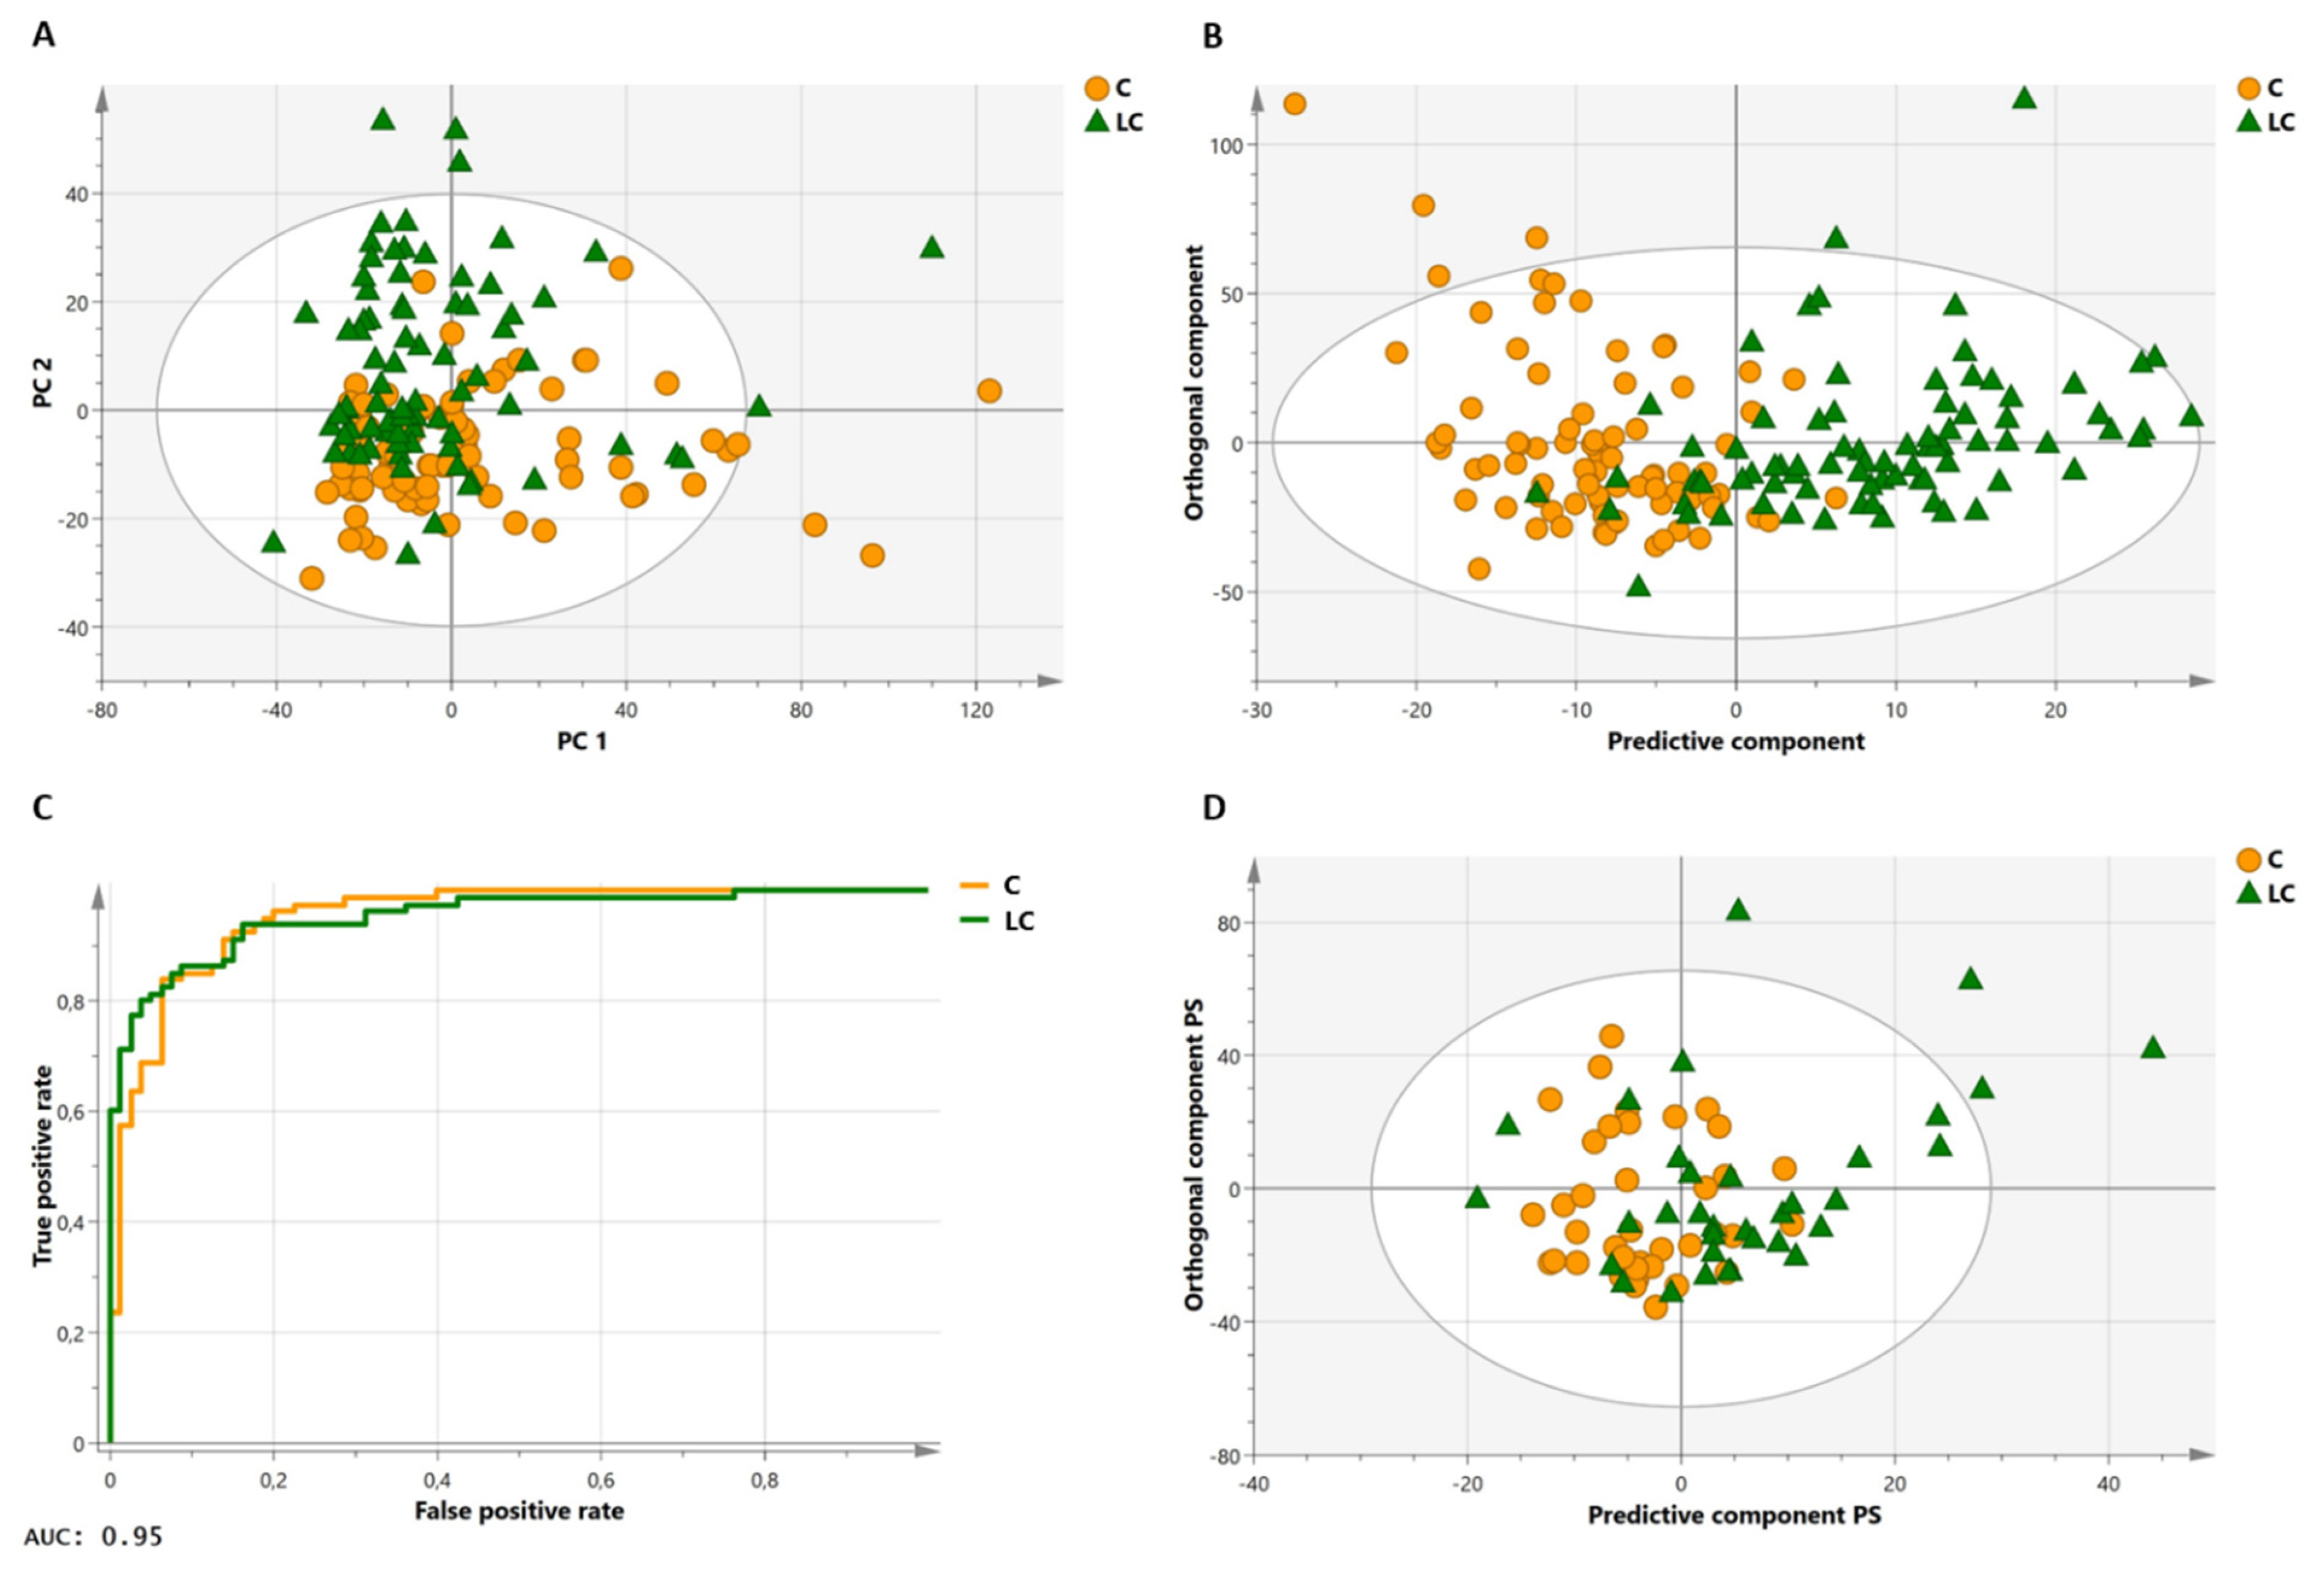
2.5. Method Validation: The Proposed Method Allows Differentiation between Lung Cancer Patients and Healthy Controls in a Large Study Cohort
2.6. Identification of Metabolites Contributing Strongest to the Model Reveals Reprogrammed Biochemical Pathways in Lung Cancer
3. Discussion
4. Materials and Methods
4.1. Materials
4.2. Ethics Statement
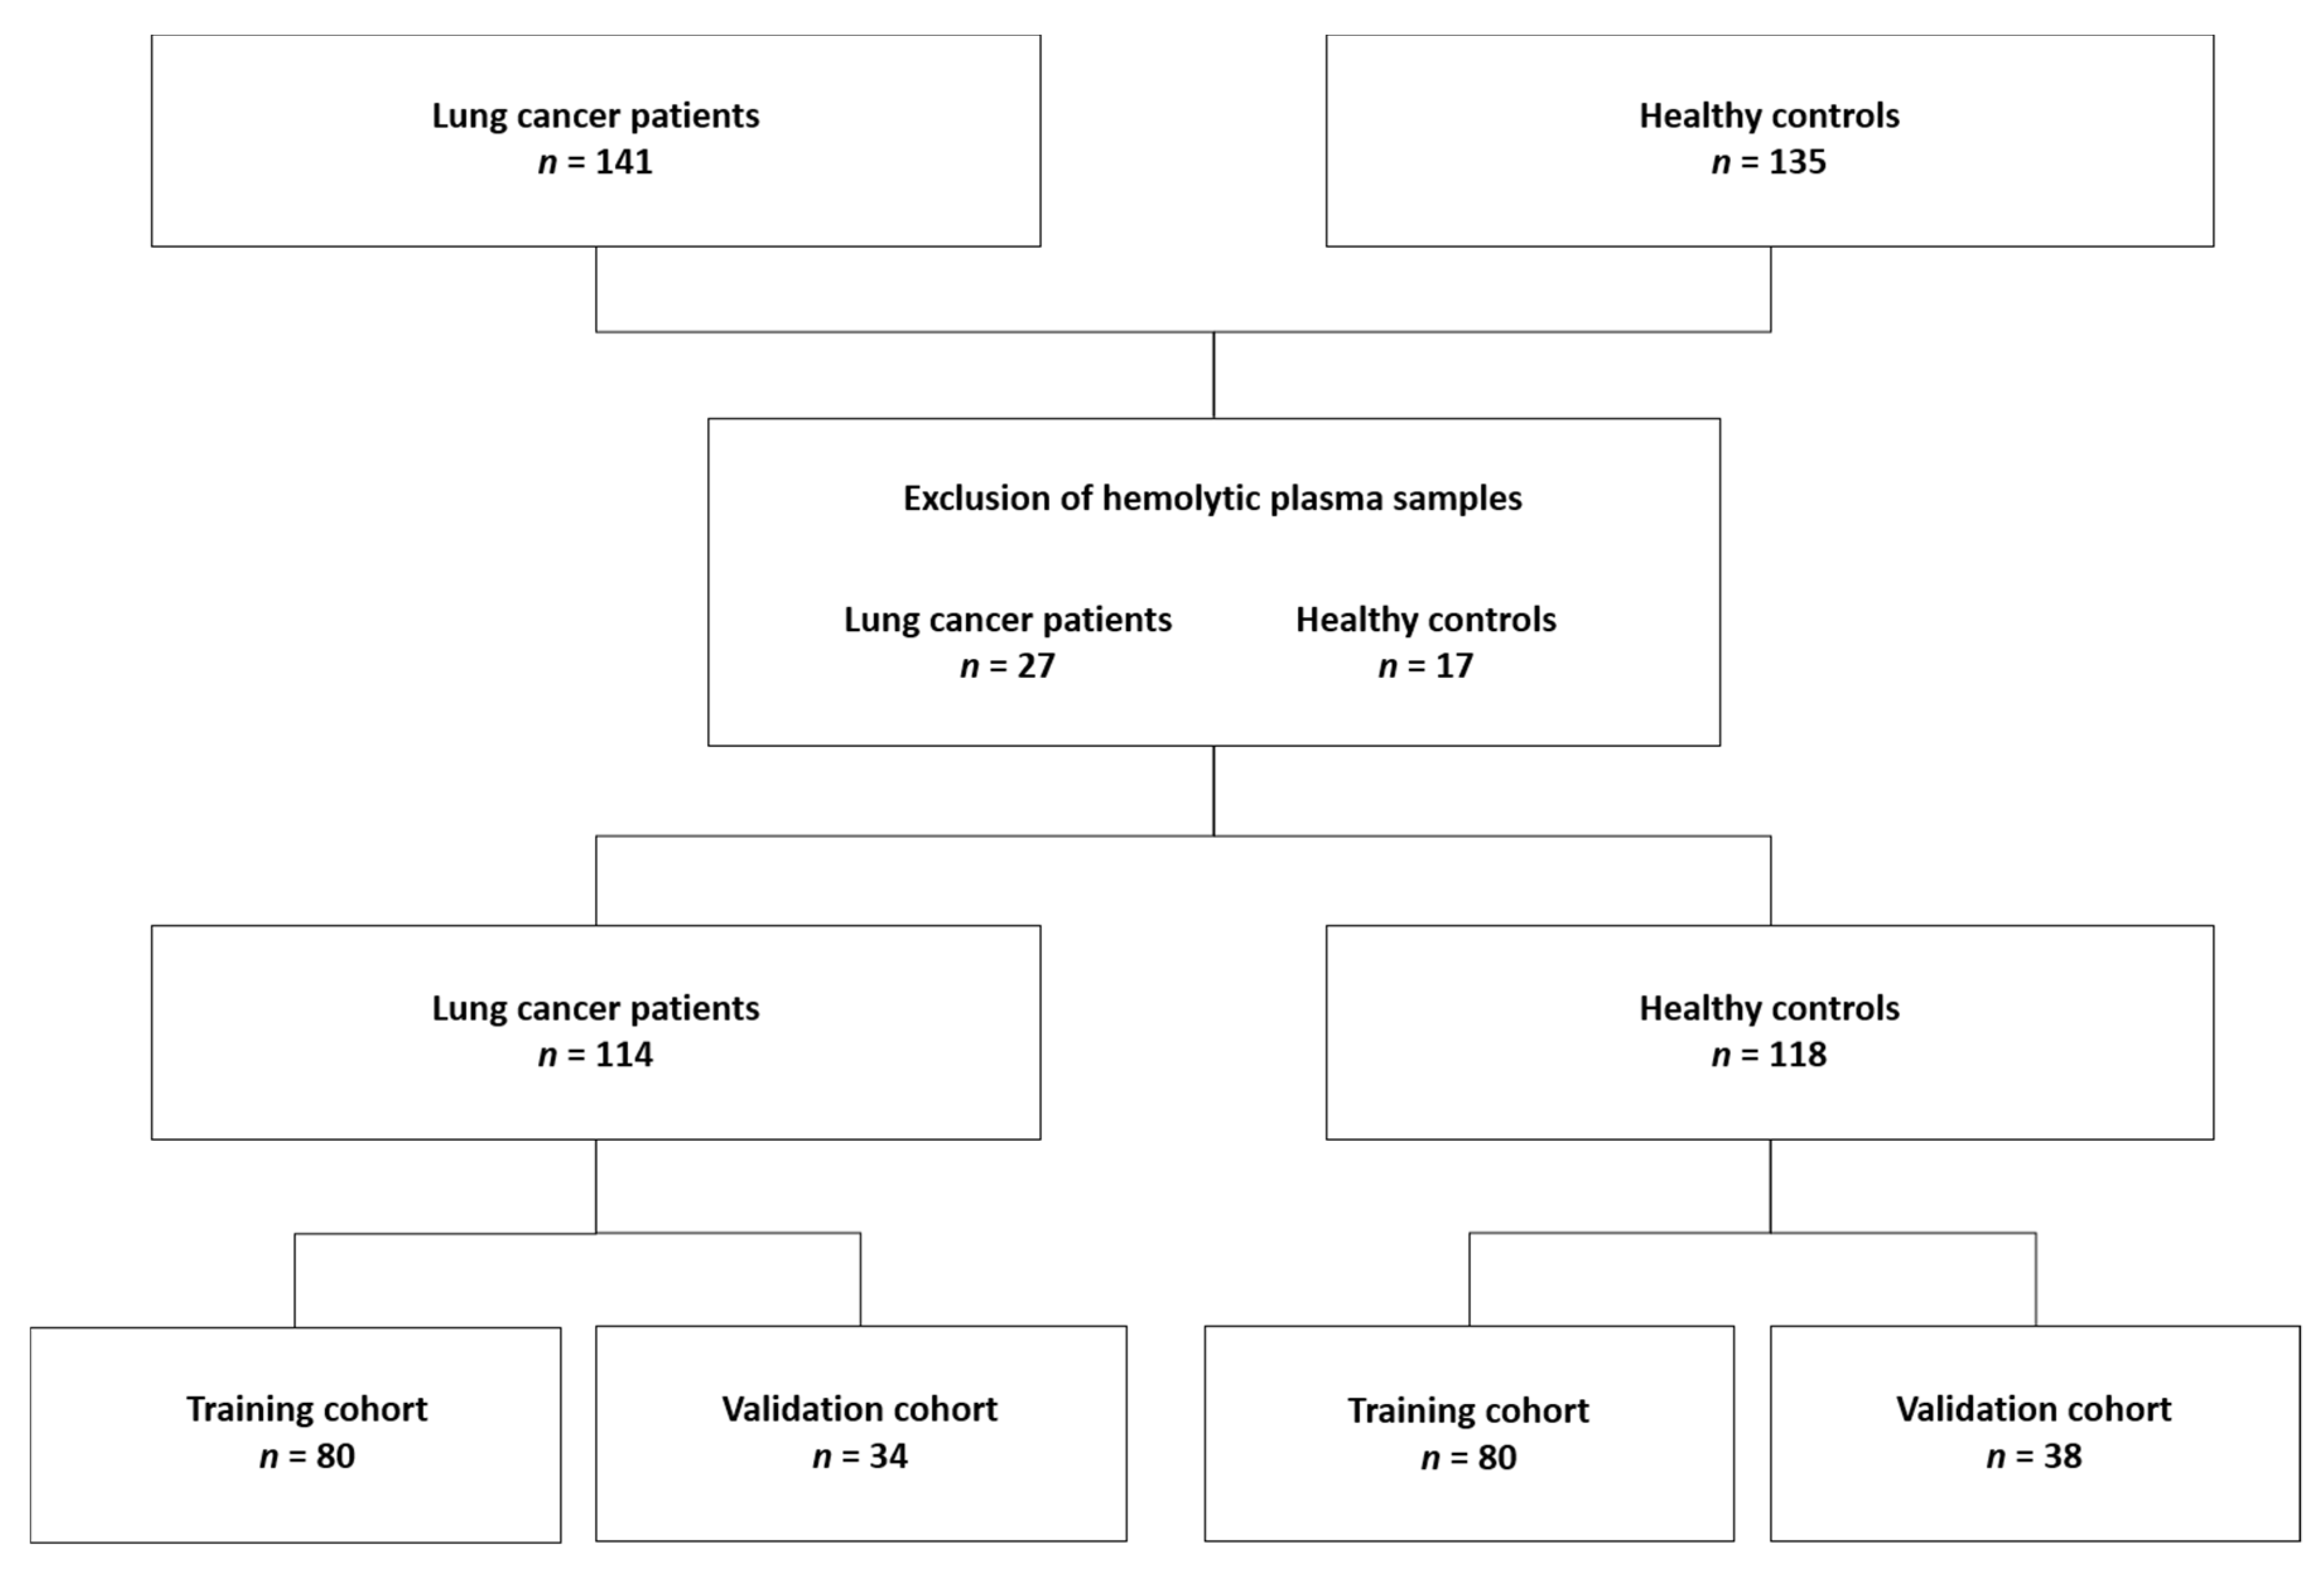
4.3. Subjects
4.4. Preanalytical Sample Preparation
4.5. Metabolite Spiking
4.6. 1H-NMR Analysis
4.7. Statistical Analysis for Model Training and Valorization
4.8. Metabolite Identification
5. Conclusions
Supplementary Materials
Author Contributions
Funding
Institutional Review Board Statement
Informed Consent Statement
Data Availability Statement
Acknowledgments
Conflicts of Interest
References
- Deja, S.; Porebska, I.; Kowal, A.; Zabek, A.; Barg, W.; Pawelczyk, K.; Stanimirova-Daszykowska, I.; Daszykowski, M.; Korzeniewska, A.; Jankowska, R.; et al. Metabolomics provide new insights on lung cancer staging and discrimination from chronic obstructive pulmonary disease. J. Pharm. Biomed. Anal. 2014, 100, 369–380. [Google Scholar] [CrossRef]
- Louis, E.; Adriaensens, P.; Guedens, W.; Vanhove, K.; Vandeurzen, K.; Darquennes, K.; Vansteenkiste, J.; Dooms, C.; de Jonge, E.; Thomeer, M.; et al. Metabolic phenotyping of human blood plasma: A powerful tool to discriminate between cancer types? Ann. Oncol. 2016, 27, 178–184. [Google Scholar] [CrossRef]
- Puchades-Carrasco, L.; Lewintre, E.J.; Pérez-Rambla, C.; Garcia-Garcia, F.; Lucas-Dominguez, R.; Calabuig, S.; Blasco, A.; Dopazo, J.; Camps, C.; Pineda-Lucena, A. Serum metabolomic profiling facilitates the non-invasive identification of metabolic biomarkers associated with the onset and progression of non-small cell lung cancer. Oncotarget 2016, 7, 12904–12916. [Google Scholar] [CrossRef] [PubMed] [Green Version]
- Zhang, X.; Zhu, X.; Wang, C.; Zhang, H.; Cai, Z. Non-targeted and targeted metabolomics approaches to diagnosing lung cancer and predicting patient prognosis. Oncotarget 2016, 7, 63437–63448. [Google Scholar] [CrossRef] [PubMed] [Green Version]
- Hart, C.D.; Vignoli, A.; Tenori, L.; Uy, G.L.; Van To, T.; Adebamowo, C.; Hossain, S.M.; Biganzoli, L.; Risi, E.; Love, R.R.; et al. Serum Metabolomic Profiles Identify ER-Positive Early Breast Cancer Patients at Increased Risk of Disease Recurrence in a Multicenter Population. Clin. Cancer Res. 2017, 23, 1422–1431. [Google Scholar] [CrossRef] [PubMed] [Green Version]
- Hori, S.; Nishiumi, S.; Kobayashi, K.; Shinohara, M.; Hatakeyama, Y.; Kotani, Y.; Hatano, N.; Maniwa, Y.; Nishio, W.; Bamba, T.; et al. A metabolomic approach to lung cancer. Lung Cancer 2011, 74, 284–292. [Google Scholar] [CrossRef]
- Weljie, A.M.; Dowlatabadi, R.; Miller, B.J.; Vogel, A.H.J.; Jirik, F.R. An Inflammatory Arthritis-Associated Metabolite Biomarker Pattern Revealed by1H NMR Spectroscopy. J. Proteome Res. 2007, 6, 3456–3464. [Google Scholar] [CrossRef]
- Wang, L.; Tang, Y.; Liu, S.; Mao, S.; Ling, Y.; Liu, D.; He, X.; Wang, X. Metabonomic Profiling of Serum and Urine by 1H NMR-Based Spectroscopy Discriminates Patients with Chronic Obstructive Pulmonary Disease and Healthy Individuals. PLoS ONE 2013, 8, e65675. [Google Scholar] [CrossRef] [Green Version]
- Richard, V.; Conotte, R.; Mayne, D.; Colet, J.-M. Does the 1H-NMR plasma metabolome reflect the host-tumor interactions in human breast cancer? Oncotarget 2017, 8, 49915–49930. [Google Scholar] [CrossRef]
- Beckonert, O.; Keun, H.C.; Ebbels, T.; Bundy, J.; Holmes, E.; Lindon, J.; Nicholson, J. Metabolic profiling, metabolomic and metabonomic procedures for NMR spectroscopy of urine, plasma, serum and tissue extracts. Nat. Protoc. 2007, 2, 2692–2703. [Google Scholar] [CrossRef]
- Vignoli, A.; Ghini, V.; Meoni, G.; Licari, C.; Takis, P.G.; Tenori, L.; Turano, P.; Luchinat, C. High-Throughput Metabolomics by 1D NMR. Angew. Chem. Int. Ed. 2019, 58, 968–994. [Google Scholar] [CrossRef] [PubMed]
- Nagana Gowda, G.A.; Raftery, D. Can NMR solve some significant challenges in metabolomics? J. Magn. Reson. 2015, 260, 144–160. [Google Scholar] [CrossRef] [Green Version]
- Markley, J.L.; Brüschweiler, R.; Edison, A.; Eghbalnia, H.R.; Powers, R.; Raftery, D.; Wishart, D.S. The future of NMR-based metabolomics. Curr. Opin. Biotechnol. 2017, 43, 34–40. [Google Scholar] [CrossRef] [Green Version]
- Emwas, A.-H.; Roy, R.; McKay, R.T.; Ryan, D.; Brennan, L.; Tenori, L.; Luchinat, C.; Gao, X.; Zeri, A.C.; Gowda, G.A.N.; et al. Recommendations and Standardization of Biomarker Quantification Using NMR-Based Metabolomics with Particular Focus on Urinary Analysis. J. Proteome Res. 2016, 15, 360–373. [Google Scholar] [CrossRef] [Green Version]
- Sengupta, A.; Weljie, A.M. NMR Spectroscopy–Based Metabolic Profiling of Biospecimens. Curr. Protoc. Protein Sci. 2019, 98, e98. [Google Scholar] [CrossRef] [PubMed]
- Ghini, V.; Quaglio, D.; Luchinat, C.; Turano, P. NMR for sample quality assessment in metabolomics. New Biotechnol. 2019, 52, 25–34. [Google Scholar] [CrossRef]
- Jobard, E.; Trédan, O.; Postoly, D.; André, F.; Martin, A.-L.; Elena-Herrmann, B.; Boyault, S. A Systematic Evaluation of Blood Serum and Plasma Pre-Analytics for Metabolomics Cohort Studies. Int. J. Mol. Sci. 2016, 17, 2035. [Google Scholar] [CrossRef] [PubMed] [Green Version]
- Dona, A.; Jiménez, B.; Schäfer, H.; Humpfer, E.; Spraul, M.; Lewis, M.R.; Pearce, J.; Holmes, E.; Lindon, J.; Nicholson, J.K. Precision High-Throughput Proton NMR Spectroscopy of Human Urine, Serum, and Plasma for Large-Scale Metabolic Phenotyping. Anal. Chem. 2014, 86, 9887–9894. [Google Scholar] [CrossRef]
- Louis, E.; Adriaensens, P.; Guedens, W.; Bigirumurame, T.; Baeten, K.; Vanhove, K.; Vandeurzen, K.; Darquennes, K.; Vansteenkiste, J.; Dooms, C.; et al. Detection of Lung Cancer through Metabolic Changes Measured in Blood Plasma. J. Thorac. Oncol. 2016, 11, 516–523. [Google Scholar] [CrossRef] [Green Version]
- Rocha, C.; Carrola, J.; Barros, A.; Gil, A.; Goodfellow, B.; Carreira, I.M.; Bernardo, J.; Gomes, A.; de Sousa, V.M.L.; Carvalho, L.; et al. Metabolic Signatures of Lung Cancer in Biofluids: NMR-Based Metabonomics of Blood Plasma. J. Proteome Res. 2011, 10, 4314–4324. [Google Scholar] [CrossRef] [Green Version]
- Kostidis, S.; Addie, R.D.; Morreau, H.; Mayboroda, O.; Giera, M. Quantitative NMR analysis of intra- and extracellular metabolism of mammalian cells: A tutorial. Anal. Chim. Acta 2017, 980, 1–24. [Google Scholar] [CrossRef]
- Nicholson, J.K.; Foxall, P.J.D. 750 MHz IH and IH-l3C NMR Spectroscopy of Human Blood Plasma. Anal. Chem. 1995, 67, 793–811. [Google Scholar] [CrossRef] [PubMed]
- Tang, H.; Wang, Y.; Nicholson, J.; Lindon, J. Use of relaxation-edited one-dimensional and two dimensional nuclear magnetic resonance spectroscopy to improve detection of small metabolites in blood plasma. Anal. Biochem. 2004, 325, 260–272. [Google Scholar] [CrossRef]
- Jupin, M.; Michiels, P.J.; Girard, F.C.; Spraul, M.; Wijmenga, S.S. NMR identification of endogenous metabolites interacting with fatted and non-fatted human serum albumin in blood plasma: Fatty acids influence the HSA–metabolite interaction. J. Magn. Reson. 2013, 228, 81–94. [Google Scholar] [CrossRef] [PubMed]
- Wevers, R.; Engelke, U.; Heerschap, A. High-resolution 1H-NMR spectroscopy of blood plasma for metabolic studies. Clin. Chem. 1994, 40, 1245–1250. [Google Scholar] [CrossRef]
- Daykin, C.A.; Foxall, P.J.; Connor, S.C.; Lindon, J.; Nicholson, J. The Comparison of Plasma Deproteinization Methods for the Detection of Low-Molecular-Weight Metabolites by 1H Nuclear Magnetic Resonance Spectroscopy. Anal. Biochem. 2002, 304, 220–230. [Google Scholar] [CrossRef]
- Tiziani, S.; Emwas, A.-H.; Lodi, A.; Ludwig, C.; Bunce, C.; Viant, M.; Günther, U.L. Optimized metabolite extraction from blood serum for 1H nuclear magnetic resonance spectroscopy. Anal. Biochem. 2008, 377, 16–23. [Google Scholar] [CrossRef] [PubMed]
- Nagana Gowda, G.A.; Raftery, D. Quantitating metabolites in protein precipitated serum using NMR spectroscopy. Anal. Chem. 2014, 86, 5433–5440. [Google Scholar] [CrossRef]
- Ala-Korpela, M. 1H NMR spectroscopy of human blood plasma. Prog. Nucl. Magn. Reson. Spectrosc. 1995, 27, 475–554. [Google Scholar] [CrossRef]
- Bervoets, L.; Massa, G.; Guedens, W.; Louis, E.; Noben, J.-P.; Adriaensens, P. Metabolic profiling of type 1 diabetes mellitus in children and adolescents: A case–control study. Diabetol. Metab. Syndr. 2017, 9, 1–8. [Google Scholar] [CrossRef] [PubMed]
- Bernini, P.; Bertini, I.; Luchinat, C.; Tenori, L.; Tognaccini, A. The Cardiovascular Risk of Healthy Individuals Studied by NMR Metabonomics of Plasma Samples. J. Proteome Res. 2011, 10, 4983–4992. [Google Scholar] [CrossRef]
- Vignoli, A.; Tenori, L.; Giusti, B.; Takis, P.G.; Valente, S.; Carrabba, N.; Balzi, D.; Barchielli, A.; Marchionni, N.; Gensini, G.F.; et al. NMR-based metabolomics identifies patients at high risk of death within two years after acute myocardial infarction in the AMI-Florence II cohort. BMC Med. 2019, 17, 3. [Google Scholar] [CrossRef] [PubMed] [Green Version]
- Hu, J.-M.; Sun, H.-T. Serum proton NMR metabolomics analysis of human lung cancer following microwave ablation. Radiat. Oncol. 2018, 13, 1–10. [Google Scholar] [CrossRef] [PubMed]
- Pearce, J.; Athersuch, T.J.; Ebbels, T.; Lindon, J.; Nicholson, J.; Keun, H.C. Robust Algorithms for Automated Chemical Shift Calibration of 1D 1H NMR Spectra of Blood Serum. Anal. Chem. 2008, 80, 7158–7162. [Google Scholar] [CrossRef]
- Dona, A.; Kyriakides, M.; Scott, F.; Shephard, E.; Varshavi, D.; Veselkov, K.; Everett, J.R. A guide to the identification of metabolites in NMR-based metabonomics/metabolomics experiments. Comput. Struct. Biotechnol. J. 2016, 14, 135–153. [Google Scholar] [CrossRef] [PubMed] [Green Version]
- Crook, A.; Powers, R. Quantitative NMR-Based Biomedical Metabolomics: Current Status and Applications. Molecules 2020, 25, 5128. [Google Scholar] [CrossRef]
- Anderson Deirdre, P.E.; Mahle, D.A.; Doom, T.E.; Reo, N.V.; Delraso, N.J.; Raymer, M.L. Dynamic adaptive binning: An improved quantification technique for NMR spectroscopic data. Metabolomics 2011, 7, 179–190. [Google Scholar] [CrossRef]
- De Meyer, T.; Sinnaeve, D.; Van Gasse, B.; Tsiporkova, E.; Rietzschel, E.R.; De Buyzere, M.L. NMR-Based Characterization of Metabolic Alterations in Hypertension Using an Adaptive, Intelligent Binning Algorithm. Anal. Chem. 2008, 80, 3783–3790. [Google Scholar] [CrossRef]
- Vu, T.N.; Valkenborg, D.; Smets, K.; Verwaest, K.A.; Dommisse, R.; Lemière, F.; Verschoren, A.; Goethals, B.; Laukens, K. An integrated workflow for robust alignment and simplified quantitative analysis of NMR spectrometry data. BMC Bioinform. 2011, 12, 405. [Google Scholar] [CrossRef] [PubMed] [Green Version]
- Alm, E.; Torgrip, R.J.O.; Åberg, K.M.; Schuppe-Koistinen, I.; Lindberg, J. A solution to the 1D NMR alignment problem using an extended generalized fuzzy Hough transform and mode support. Anal. Bioanal. Chem. 2009, 395, 213–223. [Google Scholar] [CrossRef] [PubMed] [Green Version]
- Röhnisch, H.E.; Eriksson, J.; Müllner, E.; Agback, P.; Sandström, C.; Moazzami, A.A. AQuA: An Automated Quantification Algorithm for High-Throughput NMR-Based Metabolomics and Its Application in Human Plasma. Anal. Chem. 2018, 90, 2095–2102. [Google Scholar] [CrossRef] [PubMed]
- Louis, E.; Bervoets, L.; Reekmans, G.; De Jonge, E.; Mesotten, L.; Thomeer, M.; Adriaensens, P. Phenotyping human blood plasma by 1H-NMR: A robust protocol based on metabolite spiking and its evaluation in breast cancer. Metabolomics 2014, 11, 225–236. [Google Scholar] [CrossRef]
- Barrilero, R.; Ramírez, N.; Vallve, J.-C.; Taverner, D.; Fuertes, R.; Amigó, N.; Correig, X. Unravelling and Quantifying the “NMR-Invisible” Metabolites Interacting with Human Serum Albumin by Binding Competition and T2 Relaxation-Based Decomposition Analysis. J. Proteome Res. 2017, 16, 1847–1856. [Google Scholar] [CrossRef]
- Rundlöf, T.; Mathiasson, M.; Bekiroglu, S.; Hakkarainen, B.; Bowden, T.M.; Arvidsson, T. Survey and qualification of internal standards for quantification by 1H NMR spectroscopy. J. Pharm. Biomed. Anal. 2010, 52, 645–651. [Google Scholar] [CrossRef] [PubMed]
- Wishart, D.S.; Feunang, Y.D.; Marcu, A.; Guo, A.C.; Liang, K.; Vázquez-Fresno, R.; Sajed, T.; Johnson, D.; Allison, P.; Karu, N.; et al. HMDB 4.0: The human metabolome database for 2018. Nucleic Acids Res. 2018, 46, D608–D617. [Google Scholar] [CrossRef]
- Ulrich, E.L.; Akutsu, H.; Doreleijers, J.F.; Harano, Y.; Ioannidis, Y.E.; Lin, J.; Livny, M.; Mading, S.; Maziuk, D.; Miller, Z.; et al. BioMagResBank. Nucleic Acids Res. 2007, 36, D402–D408. [Google Scholar] [CrossRef] [PubMed] [Green Version]
- Cloarec, O.; Dumas, M.-E.; Trygg, J.; Craig, A.; Barton, R.H.; Lindon, J.; Nicholson, J.; Holmes, E. Evaluation of the Orthogonal Projection on Latent Structure Model Limitations Caused by Chemical Shift Variability and Improved Visualization of Biomarker Changes in1H NMR Spectroscopic Metabonomic Studies. Anal. Chem. 2005, 77, 517–526. [Google Scholar] [CrossRef] [PubMed]
- Emwas, A.-H.; Saccenti, E.; Gao, X.; McKay, R.T.; Dos Santos, V.A.P.M.; Roy, R.; Wishart, D.S. Recommended strategies for spectral processing and post-processing of 1D 1H-NMR data of biofluids with a particular focus on urine. Metabolomics 2018, 14, 1–23. [Google Scholar] [CrossRef] [PubMed] [Green Version]
- Fan, T.W.-M.; Lane, A.N. Structure-based profiling of metabolites and isotopomers by NMR. Prog. Nucl. Magn. Reson. Spectrosc. 2008, 52, 69–117. [Google Scholar] [CrossRef]
- Bervoets, L.; Louis, E.; Reekmans, G.; Mesotten, L.; Thomeer, M.; Adriaensens, P.; Linsen, L. Influence of preanalytical sampling conditions on the 1H NMR metabolic profile of human blood plasma and introduction of the Standard PREanalytical Code used in biobanking. Metabolomics 2015, 11, 1197–1207. [Google Scholar] [CrossRef]
- Kriat, M.; Confort-Gouny, S.; Vion-Dury, J.; Sciaky, M.; Viout, P.; Cozzone, P.J. Quantitation of metabolites in human blood serum by proton magnetic resonance spectroscopy. A comparative study of the use of formate and TSP as concentration standards. NMR Biomed. 1992, 5, 179–184. [Google Scholar] [CrossRef] [PubMed]
- Wallmeier, J.; Samol, C.; Ellmann, L.; Zacharias, H.U.; Vogl, F.C.; Garcia, M.; Dettmer, K.; Oefner, P.J.; Gronwald, W. GCKD Study Investigators Quantification of Metabolites by NMR Spectroscopy in the Presence of Protein. J. Proteome Res. 2017, 16, 1784–1796. [Google Scholar] [CrossRef] [PubMed]
- Alum, M.F.; Shaw, P.A.; Sweatman, B.C.; Ubhi, B.K.; Haselden, J.N.; Connor, S.C. 4,4-Dimethyl-4-silapentane-1-ammonium trifluoroacetate (DSA), a promising universal internal standard for NMR-based metabolic profiling studies of biofluids, including blood plasma and serum. Metabolomics 2008, 4, 122–127. [Google Scholar] [CrossRef] [Green Version]
- Simard, J.R.; Zunszain, P.A.; Hamilton, J.A.; Curry, S. Location of high and low affinity fatty acid binding sites on human serum albumin revealed by NMR drug-competition analysis. J. Mol. Biol. 2006, 361, 336–351. [Google Scholar] [CrossRef]
- Bliziotis, N.G.; Engelke, U.F.H.; Aspers, R.L.E.G.; Engel, J.; Deinum, J.; Timmers, H.J.L.M.; Wevers, R.A.; Kluijtmans, L.A.J. A comparison of high-throughput plasma NMR protocols for comparative untargeted metabolomics. Metabolomics 2020, 16, 1–12. [Google Scholar] [CrossRef]
- Nagana Gowda, G.A.; Hong, N.N.; Raftery, D. Evaluation of Fumaric Acid and Maleic Acid as Internal Standards for NMR Analysis of Protein Precipitated Plasma, Serum, and Whole Blood. Anal. Chem. 2021, 93, 3233–3240. [Google Scholar] [CrossRef] [PubMed]
- Bell, J.D.; Brown, J.C.; Kubal, G.; Sadler, P.J. NMR-invisible lactate in blood plasma. FEBS Lett. 1988, 235, 81–86. [Google Scholar] [CrossRef] [Green Version]
- Vanhove, K.; Graulus, G.-J.; Mesotten, L.; Thomeer, M.; Derveaux, E.; Noben, J.-P.; Guedens, W.; Adriaensens, P. The Metabolic Landscape of Lung Cancer: New Insights in a Disturbed Glucose Metabolism. Front. Oncol. 2019, 9, 1215. [Google Scholar] [CrossRef] [PubMed] [Green Version]
- Porporato, P.E. Understanding cachexia as a cancer metabolism syndrome. Oncogenesis 2016, 5, e200. [Google Scholar] [CrossRef] [Green Version]
- Kim, D.H. Nutritional issues in patients with cancer. Intest. Res. 2019, 17, 455–462. [Google Scholar] [CrossRef]
- Holroyde, C.P.; Skutches, C.L.; Boden, G.; Reichard, G.A. Glucose metabolism in cachectic patients with colorectal cancer. Cancer Res. 1984, 44, 5910–5913. [Google Scholar]
- Vander Heiden, M.G.; Cantley, L.C.; Thompson, C.B. Understanding the Warburg effect: The metabolic requirements of cell proliferation. Science 2009, 324, 1029–1033. [Google Scholar] [CrossRef] [Green Version]
- Grasmann, G.; Smolle, E.; Olschewski, H.; Leithner, K. Gluconeogenesis in cancer cells – Repurposing of a starvation-induced metabolic pathway? Biochim. Biophys. Acta Mol. Cell Res. 2019, 1872, 24–36. [Google Scholar] [CrossRef]
- Leithner, K.; Hrzenjak, A.; Trötzmüller, M.; Moustafa, T.; Köfeler, H.; Wohlkoenig, C.; Stacher, E.; Lindenmann, J.; Harris, A.; Olschewski, H. PCK2 activation mediates an adaptive response to glucose depletion in lung cancer. Oncogene 2015, 34, 1044–1050. [Google Scholar] [CrossRef]
- Grasmann, G.; Mondal, A.; Leithner, K. Flexibility and Adaptation of Cancer Cells in a Heterogenous Metabolic Microenvironment. Int. J. Mol. Sci. 2021, 22, 1476. [Google Scholar] [CrossRef]
- Molle, E.; Leko, P.; Stacher-Priehse, E.; Brcic, L.; El-Heliebi, A.; Hofmann, L. Distribution and prognostic significance of gluconeogenesis and glycolysis in lung cancer. Mol. Oncol. 2020, 14, 2853–2867. [Google Scholar]
- Green, C.R.; Wallace, M.; Divakaruni, A.S.; Phillips, S.A.; Murphy, A.N.; Ciaraldi, T.P.; Metallo, C.M. Branched-chain amino acid catabolism fuels adipocyte differentiation and lipogenesis. Nat. Chem. Biol. 2016, 12, 15–21. [Google Scholar] [CrossRef] [Green Version]
- Lieu, E.L.; Nguyen, T.; Rhyne, S.; Kim, J. Amino acids in cancer. Exp. Mol. Med. 2020, 52, 15–30. [Google Scholar] [CrossRef] [PubMed]
- Pietrocola, F.; Galluzzi, L.; Pedro, J.M.B.-S.; Madeo, F.; Kroemer, G. Acetyl Coenzyme A: A Central Metabolite and Second Messenger. Cell Metab. 2015, 21, 805–821. [Google Scholar] [CrossRef] [Green Version]
- Wang, W.; Bai, L.; Li, W.; Cui, J. The Lipid Metabolic Landscape of Cancers and New Therapeutic Perspectives. Front. Oncol. 2020, 10, 605154. [Google Scholar] [CrossRef] [PubMed]
- Kuemmerle, N.B.; Rysman, E.; Lombardo, P.S.; Flanagan, A.J.; Lipe, B.C.; Wells, W.A.; Pettus, J.R.; Froehlich, H.M.; Memoli, V.A.; Morganelli, P.M.; et al. Lipoprotein Lipase Links Dietary Fat to Solid Tumor Cell Proliferation. Mol. Cancer Ther. 2011, 10, 427–436. [Google Scholar] [CrossRef] [Green Version]
- Das, S.K.; Hoefler, G. The role of triglyceride lipases in cancer associated cachexia. Trends Mol. Med. 2013, 19, 292–301. [Google Scholar] [CrossRef] [PubMed] [Green Version]
- Li, W.; Liu, Y.; Liu, Y.; Cheng, S.; Duan, Y. Exhaled isopropanol: New potential biomarker in diabetic breathomics and its metabolic correlations with acetone. RSC Adv. 2017, 7, 17480–17488. [Google Scholar] [CrossRef] [Green Version]
- Maurer, G.D.; Brucker, D.P.; Bähr, O.; Harter, P.N.; Hattingen, E.; Walenta, S.; Mueller-Klieser, W.; Steinbach, J.P.; Rieger, J. Differential utilization of ketone bodies by neurons and glioma cell lines: A rationale for ketogenic diet as experimental glioma therapy. BMC Cancer 2011, 11, 315. [Google Scholar] [CrossRef] [Green Version]
- Abdelwahab, M.G.; Fenton, K.E.; Preul, M.C.; Rho, J.M.; Lynch, A.; Stafford, P.; Scheck, A.C. The Ketogenic Diet Is an Effective Adjuvant to Radiation Therapy for the Treatment of Malignant Glioma. PLoS ONE 2012, 7, e36197. [Google Scholar] [CrossRef] [PubMed]
- Martens, H.; Martens, M. Modified Jack-knife estimation of parameter uncertainty in bilinear modelling by partial least squares regression (PLSR). Food Qual. Prefer. 2000, 11, 5–16. [Google Scholar] [CrossRef]
- Efron, B. The Jack-Knife, the Bootstrap and Other Resampling Plans; Society for Industrial and Applied Mathematics: Philadelphia, PA, USA, 1982. [Google Scholar]
- Blasco, H.; Błaszczyński, J.; Billaut, J.; Nadal-Desbarats, L.; Pradat, P.; Devos, D.; Moreau, C.; Andres, C.; Emond, P.; Corcia, P.; et al. Comparative analysis of targeted metabolomics: Dominance-based rough set approach versus orthogonal partial least square-discriminant analysis. J. Biomed. Inform. 2015, 53, 291–299. [Google Scholar] [CrossRef]
- Kjellqvist, S.; Maleki, S.; Olsson, T.; Chwastyniak, M.; Branca, R.; Lehtiö, J.; Pinet, F.; Franco-Cereceda, A.; Eriksson, P. A Combined Proteomic and Transcriptomic Approach Shows Diverging Molecular Mechanisms in Thoracic Aortic Aneurysm Development in Patients with Tricuspid- and Bicuspid Aortic Valve. Mol. Cell. Proteom. 2013, 12, 407–425. [Google Scholar] [CrossRef] [PubMed] [Green Version]
- Lindholm, M.; Giacomello, S.; Solnestam, B.W.; Fischer, H.; Huss, M.; Kjellqvist, S.; Sundberg, C.J. The Impact of Endurance Training on Human Skeletal Muscle Memory, Global Isoform Expression and Novel Transcripts. PLoS Genet. 2016, 12, e1006294. [Google Scholar] [CrossRef] [PubMed] [Green Version]
- Kouassi Nzoughet, J.; Bocca, C.; Simard, G.; Prunier-Mirebeau, D.; Chao de la Barca, J.M.; Bonneau, D. A Nontargeted UHPLC-HRMS Metabolomics Pipeline for Metabolite Identification: Application to Cardiac Remote Ischemic Preconditioning. Anal. Chem. 2017, 89, 2138–2146. [Google Scholar] [CrossRef]


| Metabolite | Proton | Chemical Shift (ppm) | Multiplicity and J-Coupling (Hz) | Connectivity | Assigned Integration Number (VAR) |
|---|---|---|---|---|---|
1-methylhistidine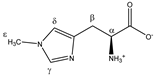 | αCH | 3.959 | dd (7.8; 5.6) | α–β; α–β’ | 051–054 |
| βCH2 | 3.226 | dd(1) (16.1; 7.8) | β–β’; β–α | 123, 125, 128, 130 | |
| 3.315 | dd(2) (16.1; 5.6) | β’–β; β’–α | 113–115, 117 | ||
| γCH | 7.917 | s | / | 004 | |
| δCH | 7.064 | s | / | 017 | |
| εCH3 | 3.723 | s | / | 076 | |
2-aminobutyrate | αCH | 3.736 | t (5.9) | α–β; α–β’ | 074–076 |
| βCH2 | 1.920 | m | / | 197–200 | |
| γCH3 | 0.999 | t (7.5) | γ–β; γ–β’ | 228, 230, 231 | |
2-hydroxybutyrate | αCH | 4.017 | dd (6.0; 4.5) | α–β; α–β’ | 045, 046 |
| βCH2 | 1.762 | m | / | 202, 203 | |
| 1.670 | p | / | 204, 205, 207 | ||
| γCH3 | 0.920 | t (7.5) | γ–β; γ–β’ | 235, 236 | |
| 2-hydroxy- 3-methylbutyrate  | αCH | 3.866 | d | α–β | 063 |
| βCH2 | 2.034 | m | / | 194–195 | |
| γCH3 | 0.986 | d(1) | γ–β | 231–232 | |
| 0.853 | d(2) | γ’–β | 237 | ||
| 3-hydroxy- 3-methylbutyrate  | αCH2 | 2.383 | s | / | 177 |
| βCH3 | 1.287 | s | / | 218 | |
| 3-methyl- 2-oxobutyrate 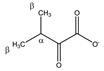 | αCH | 3.049 | m | / | 138–143, 145 |
| βCH3 | 1.139 | d (6.8) | β–α | 223 | |
| 3-methyl- 2-oxovalerate 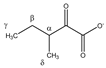 | αCH | 2.947 | m | / | 149, 150, 152 |
| βCH2 | 1.721 | m(1) | / | 202–204 | |
| 1.463 | m(2) | / | 212, 213 | ||
| γCH3 | 0.907 | t (7.0) | γ–β; γ–β’ | 236 | |
| δCH3 | 1.113 | d (6.8) | δ–α | 224 | |
3-methylhistidine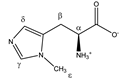 | αCH | 3.986 | dd (7.9; 4.8) | α–β; α–β’ | 048–051 |
| βCH2 | 3.091 | dd(1) (15.5; 7.9) | β–β’; β–α | 136–139 | |
| 3.189 | dd(2) (15.5; 4.8) | β’–β; β’–α | 130, 132, 133 | ||
| γCH | 7.679 | s | / | 009 | |
| δCH | 7.025 | s | / | 017 | |
| εCH3 | 3.711 | s | / | 077 | |
4-aminobutyrate | αCH2 | 2.316 | t (7.4) | α–β | 180, 181, 183 |
| βCH2 | 1.922 | p | / | 199, 200 | |
| γCH2 | 3.033 | t (7.4) | γ–β | 142, 144, 146 | |
| 4-methyl- 2-oxovalerate  | αCH2 | 2.625 | d (6.5) | α–β | 166 |
| βCH | 2.112 | m | / | 190–192 | |
| γCH3 | 0.948 | d (6.5) | γ–β | 234 | |
α-ketoglutarate | αCH2 | 3.030 | t (6.9) | α–β | 143, 145, 147 |
| βCH2 | 2.461 | t (6.9) | β–α | 172, 173 | |
Acetate | αCH3 | 1.938 | s | / | 199 |
Acetoacetate | αCH2 | 3.464 | s | / | 101 |
| βCH3 | 2.298 | s | / | 183 | |
Alanine | αCH | 3.805 | q (7.2) | α–β | 067–070 |
| βCH3 | 1.500 | d (7.2) | β–α | 211 | |
Allantoin | αCH | 5.410 | s | / | 024 |
Arginine | αCH | 3.791 | t (6.1) | α–β; α–β’ | 069–071 |
| βCH2 | 1.938 | m | / | 197–200 | |
| γCH2 | 1.751 | m(1) | / | 202–204 | |
| 1.672 | m(2) | / | 204–207 | ||
| δCH2 | 3.265 | t (6.9) | δ–γ; δ–γ’ | 120–122 | |
Asparagine | αCH | 4.020 | dd (7.7; 4.4) | α–β; α–β’ | 045, 046 |
| βCH2 | 2.877 | dd(1) (16.8; 7.7) | β–β’; β–α | 153, 154 | |
| 2.970 | dd(2) (16.8; 4.4) | β’–β; β’–α | 148, 150, 151 | ||
Aspartate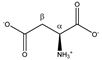 | αCH | 3.921 | dd (8.8; 3.7) | α–β; α–β’ | 056, 057, 058 |
| βCH2 | 2.699 | dd(1) (17.5; 8.8) | β–β’; β–α | 160, 162–164 | |
| 2.833 | dd(2) (17.5; 3.7) | β’–β; β’–α | 155 | ||
β-alanine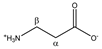 | αCH2 | 2.575 | t (6.8) | α–β | 167–168 |
| βCH2 | 3.201 | t (6.8) | β–α | 129–131 | |
β-hydroxybutyrate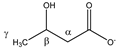 | αCH2 | 2.426 | dd(1) (14.4; 7.4) | α–α’; α–β | 173–176 |
| 2.325 | dd(2) (14.4; 6.4) | α’–α; α’–β | 179–182 | ||
| βCH | 4.172 | m | / | 037, 038, 040 | |
| γCH3 | 1.219 | d (6.3) | γ–β | 220 | |
Betaine | αCH2 | 3.921 | s | / | 057 |
| βCH3 | 3.285 | s | / | 118 | |
Carnitine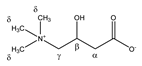 | αCH2 | 2.479 | dd(1) (15.4; 7.1) | α–α’; α–β | 170, 172 |
| 2.439 | dd(2) (15.4; 6.4) | α’–α; α’–β | 172–175 | ||
| βCH | 4.588 | m | / | 029 | |
| γCH2 | 3.450 | m | / | 102, 103 | |
| δCH3 | 3.246 | s | / | 123 | |
Choline | αCH2 | 4.086 | m | / | 042 |
| βCH2 | 3.539 | m | / | 094–096 | |
| γCH3 | 3.222 | s | / | 128 | |
Citrate | CH2a | 2.693 | d (15.6) | a–b | 162,164 |
| CH2b | 2.553 | d (15.6) | b–a | 168 | |
Creatine | αCH2 | 3.950 | s | / | 054 |
| βCH3 | 3.056 | s | / | 141 | |
Creatinine | αCH2 | 4.074 | s | / | 042 |
| βCH3 | 3.063 | s | / | 140 | |
Cysteine | αCH | 3.979 | dd (5.8; 4.1) | α–β; α–β’ | 049–051 |
| βCH2 | 3.112 | dd(1) (14.8; 5.8) | β–β’; β–α | 135–137 | |
| 3.052 | dd(2) (14.8; 4.1) | β’–β; β’–α | 139, 140, 142, 143 | ||
Cystine | αCH | 4.126 | dd (8.2; 4.1) | α–β; α–β’ | 040, 041 |
| βCH2 | 3.210 | dd(1) (14.8; 8.2) | β–β’; β–α | 126, 129–131 | |
| 3.405 | dd(2) (14.8; 4.1) | β’–β; β’–α | 106, 108 | ||
Formate | αCH | 8.477 | s | / | 001 |
Fumarate | αCH | 6.540 | s | / | 021 |
| Glucose α-anomer  β-anomer  | C1H | 5.256 | d (3.8) | / | 025 |
| C2H | 3.557 | dd (9.8; 3.8) | / | 093, 094 | |
| C3H | 3.736 | t (9.6) | / | 073–076 | |
| C4H | 3.435 | t (9.6) | / | 103, 104, 106 | |
| C5H | 3.857 | m | / | 062–066 | |
| C6H | 3.854 | dd(1) (12.2; 7.8) | / | 062, 063, 065, 066 | |
| C6′H | 3.788 | dd(2) (12.2; 5.4) | / | 069–071 | |
| C1H | 4.669 | d (7.8) | / | 028 | |
| C2H | 3.267 | dd (9.4; 8.0) | / | 119, 121, 122 | |
| C3H | 3.513 | t (9.2) | / | 096, 097, 099 | |
| C4H | 3.425 | t (9.4) | / | 103, 106, 107 | |
| C5H | 3.487 | m | / | 098–100 | |
| C6H | 3.747 | dd(1) (12.2; 5.8) | / | 073–075 | |
| C6′H | 3.920 | dd(2) (12.2; 2.0) | / | 056–059 | |
Glutamate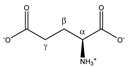 | αCH | 3.779 | dd (7.3; 4.7) | α–β; α–β’ | 070–072 |
| βCH2 | 2.152 | m(1) | / | 189–191 | |
| 2.075 | m(2) | / | 192–194 | ||
| γCH2 | 2.372 | m | / | 176–180 | |
Glutamine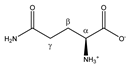 | αCH | 3.793 | t (6.1) | α–β; α–β’ | 069–071 |
| βCH2 | 2.157 | m | / | 189–192 | |
| γCH2 | 2.474 | m | / | 169–174 | |
Glycerol | CH2a | 3.582 | dd (11.8; 6.5) | a–b; a–c | 090–093 |
| CH2b | 3.674 | dd (11.8; 4.3) | b–a; b–c | 079, 080, 082, 083 | |
| CHc | 3.806 | m | / | 067–070 | |
Glycine | αCH2 | 3.580 | s | / | 092 |
Histidine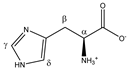 | αCH | 4.007 | dd (7.9; 4.9) | α–β; α–β’ | 046–048 |
| βCH2 | 3.160 | dd(1) (15.5; 7.9) | β–β’; β–α | 132, 134 | |
| 3.262 | dd(2) (15.5; 4.9) | β’–β; β’–α | 119, 120, 122, 123 | ||
| γCH | 7.864 | s | / | 006 | |
| δCH | 7.101 | s | / | 016 | |
Hydroxyproline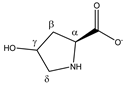 | αCH | 4.370 | dd (10.3; 8.1) | α–β; α–β’ | 033 |
| βCH2 | 2.180 | ddd (13.8; 10.3; 4.2) | β–β’; β–α; β–γ | 189 | |
| 2.450 | ddt (13.8; 8.1; 1.7; 1.7) | β’–β; β’–α; β’–γ; β’–δ’ | 172–174 | ||
| γCH | 4.690 | m | / | 028 | |
| δCH2 | 3.510 | dd (12.6; 3.4) | δ–δ’; δ–γ | 097, 099 | |
| 3.391 | dt (12.6; 1.7; 1.7) | δ’–δ; δ’–γ; δ’–β’ | 108–110 | ||
Hypoxanthine | αCH | 8.222 | s | / | 002 |
| βCH | 8.203 | s | / | 002 | |
Isoleucine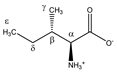 | αCH | 3.693 | d (4.0) | α–β | 079 |
| βCH | 2.002 | m | / | 195–197 | |
| γCH3 | 1.030 | d (7.0) | γ–β | 227 | |
| δCH2 | 1.492 | m(1) | / | 210–212 | |
| 1.282 | m(2) | / | 217–220 | ||
| εCH3 | 0.958 | t (7.4) | ε–δ; ε–δ’ | 233, 234 | |
Isopropanol | αCH | 4.039 | m | / | 042–046 |
| βCH3 | 1.191 | d (6.2) | β–α | 222 | |
Lactate | αCH | 4.133 | q (6.9) | α–β | 039–041 |
| βCH3 | 1.348 | d (6.9) | β–α | 215 | |
Leucine | αCH | 3.756 | dd (8.6; 4.9) | α–β; α–β’ | 072–074 |
| βCH2 | 1.738 | m | / | 202–204 | |
| γCH | 1.738 | m | / | 202–204 | |
| δCH3 | 0.986 | d(1) (6.3) | δ–γ | 231, 232 | |
| 0.975 | d(2) (6.3) | δ’–γ | 232, 233 | ||
Lysine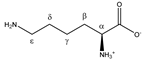 | αCH | 3.777 | t (6.1) | α–β; α–β’ | 070–072 |
| βCH2 | 1.926 | m | / | 198–200 | |
| γCH2 | 1.534 | m(1) | / | 209–211 | |
| 1.463 | m(2) | / | 211–213 | ||
| δCH2 | 1.747 | p | / | 202, 203 | |
| εCH2 | 3.046 | t (7.6) | ε–δ | 141, 142, 144 | |
| Mannose α-anomer  β-anomer 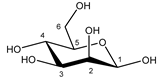 | C1H | 5.205 | d (1.8) | / | 026 |
| C2H | 3.957 | dd (3.4; 1.8) | / | 052–054 | |
| C3H | 3.870 | dd (9.7; 3.6) | / | 062, 063 | |
| C4H | 3.683 | t (9.7) | / | 079, 080, 082 | |
| C5H | 3.837 | m | / | 064–067 | |
| C6H | 3.787 | dd(1) (12.2; 5.5) | / | 069–071 | |
| C6′H | 3.895 | dd(2) (12.2; 2.3) | / | 059, 061, 062 | |
| C1H | 4.924 | d (1.2) | / | 027 | |
| C2H | 3.968 | dd (3.3; 1.2) | / | 051, 052 | |
| C3H | 3.681 | dd (9.7; 3.3) | / | 079, 081, 082 | |
| C4H | 3.598 | t (9.7) | / | 088, 090, 092 | |
| C5H | 3.404 | m | / | 106–108 | |
| C6H | 3.757 | dd(1) (12.2; 6.4) | / | 071, 073, 074 | |
| C6′H | 3.928 | dd(2) (12.2; 2.3) | / | 055, 057 | |
Methionine | αCH | 3.878 | dd (7.1; 5.5) | α–β; α–β’ | 061–063 |
| βCH2 | 2.220 | m(1) | / | 187–188 | |
| 2.142 | m(2) | / | 190–192 | ||
| γCH2 | 2.664 | t (7.6) | γ–β; γ–β’ | 164, 165 | |
| δCH3 | 2.156 | s | / | 189 | |
Myo-inositol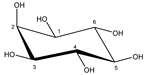 | C1H | 3.645 | t (9.8) | / | 083, 085, 087 |
| C2H | 3.302 | t (9.4) | / | 114, 116, 118 | |
| C3H | 3.645 | t (9.8) | / | 083, 085, 087 | |
| C4H | 3.557 | dd (9.8; 2.9) | / | 093, 094 | |
| C5H | 4.085 | t (2.9) | / | 042 | |
| C6H | 3.557 | dd (9.8; 2.9) | / | 093, 094 | |
N-acetylcysteine | αCH | 4.407 | m | / | 033 |
| βCH2 | 2.946 | m | / | 149, 151, 152 | |
| γCH3 | 2.090 | s | / | 193 | |
Ornithine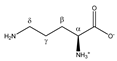 | αCH | 3.802 | t (5.9) | α–β | 068–070 |
| βCH2 | 1.966 | m | / | 196–199 | |
| γCH2 | 1.855 | m(1) | / | 200, 201 | |
| 1.772 | m(2) | / | 201, 202 | ||
| δCH2 | 3.075 | t (7.6) | δ–y; δ–γ’ | 138–140 | |
Oxaloacetate | αCH2 | 2.390 | s | / | 177 |
Phenylalanine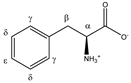 | αCH | 4.014 | dd (7.8; 5.3) | α–β; α–β’ | 045–047 |
| βCH2 | 3.303 | dd(1) (14.5; 7.8) | β–β’; β–α | 114, 115, 117, 118 | |
| 3.147 | dd(2) (14.5; 5.3) | β’–β; β’–α | 134, 135 | ||
| γCH | 7.349 | d (7.3) | γ–δ | 011, 012 | |
| δCH | 7.446 | t (7.3) | δ–ε; δ–γ | 011 | |
| εCH | 7.392 | t (7.3) | ε–δ | 011 | |
Proline | αCH | 4.152 | dd (8.9; 6.4) | α–β; α–β’ | 038–040 |
| βCH2 | 2.371 | m(1) | / | 177–179 | |
| 2.091 | m(2) | / | 191–194 | ||
| γCH2 | 2.024 | m | / | 194–197 | |
| δCH2 | 3.441 | dt(1) (11.6; 7.1; 2.6) | δ–δ’/δ–γ/δ–β’ | 101, 103, 105, 106 | |
| 3.359 | dt(2) (11.6; 7.1; 2.6) | δ’–δ/δ’–γ/δ’–β’ | 110–113 | ||
Pyroglutamate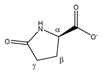 | αCH | 4.196 | dd (8.6; 6.2) | α–β; α–β’ | 037 |
| βCH2 | 2.526 | m(1) | / | 168–170 | |
| 2.055 | m(2) | / | 193–195 | ||
| γCH2 | 2.242 | m | / | 174–176 | |
Pyruvate | αCH3 | 2.390 | s | / | 177 |
Sarcosine | αCH2 | 3.632 | s | / | 087 |
| βCH3 | 2.759 | s | / | 157 | |
Serine | αCH | 3.863 | dd (5.7; 3.7) | α–β; α–β’ | 063, 064 |
| βCH2 | 3.968 | dd(1) (12.2; 5.7) | β–β’; β–α | 050–052, 054 | |
| 4.011 | dd(2) (12.2; 3.7) | β’–β; β’–α | 045–048 | ||
Succinate | αCH2 | 2.424 | s | / | 175 |
Taurine | αCH2 | 3.282 | t (6.6) | α–β | 117, 119, 120 |
| βCH2 | 3.442 | t (6.6) | β–α | 103, 105 | |
Threonine | αCH | 3.606 | d (4.9) | α–β | 088, 089 |
| βCH | 4.275 | dq (6.6; 4.9) | β–γ; β–α | 035, 036 | |
| γCH3 | 1.349 | d (6.6) | γ–β | 215 | |
Tryptophan | αCH | 4.078 | dd (7.7; 5.1) | α–β; α–β’ | 042 |
| βCH2 | 3.329 | dd(1) (15.4; 7.7) | β–β’; β–α | 112–115 | |
| 3.502 | dd(2) (15.4; 5.1) | β’–β; β’–α | 097–100 | ||
| γCH | 7.344 | s | / | 012 | |
| δCH | 7.552 | d (7.8) | δ–ε | 010 | |
| εCH | 7.207 | t (7.8) | ε–δ; ε–ζ | 015 | |
| ζCH | 7.288 | t (7.8) | ζ–ε; ζ–η | 013 | |
| ηCH | 7.750 | d (7.8) | η–ζ | 008 | |
Tyrosine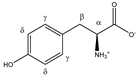 | αCH | 3.960 | dd (7.7; 5.2) | α–β; α–β’ | 051–053 |
| βCH2 | 3.075 | dd(1) (14.5; 7.7) | β–β’; β–α | 137–139, 141 | |
| 3.218 | dd(2) (14.5; 5.2) | β’–β; β’–α | 125, 127–130 | ||
| γCH | 6.918 | d (8.4) | γ–δ | 019 | |
| δCH | 7.212 | d (8.4) | δ–γ | 015 | |
Uridine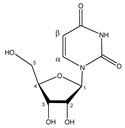 | αCH | 7.892 | d (8.1) | α–β | 005 |
| βCH | 5.921 | d (8.1) | β–α | 022 | |
| C1H | 5.937 | d (4.6) | / | 022 | |
| C2H | 4.375 | t (4.9) | / | 033 | |
| C3H | 4.250 | t (5.4) | / | 036 | |
| C4H | 4.152 | m | / | 038–040 | |
| C5H | 3.828 | dd(1) (12.3; 4.7) | / | 066–068 | |
| C5′H | 3.930 | dd(2) (12.3; 3.0) | / | 055, 057 | |
Valine | αCH | 3.632 | d (4.3) | α–β | 086, 087 |
| βCH | 2.294 | m | / | 180–185 | |
| γCH3 | 1.062 | d(1) (7.1) | γ–β | 226 | |
| 1.010 | d(2) (7.1) | γ’–β | 228, 229 |
| Training Cohort | Validation Cohort | ||||
|---|---|---|---|---|---|
| Controls | LC Patients | Controls | LC Patients | ||
| Number of patients, n | 80 | 80 | 38 | 34 | |
| Sex, n (%) | Male | 48 (60) | 54 (68) | 19 (50) | 24 (71) |
| Female | 32 (40) | 26 (33) | 19 (50) | 10 (29) | |
| Age, years (range) | 67 ± 10 (46–85) | 68 ± 10 (43–88) | 68 ± 12 (38–88) | 70 ± 10 (36–83) | |
| BMI, kg/m2 (range) | 28.8 ± 5.5 (18.7–46.7) | 26.0 ± 4.3 (18.4–38.5) | 29.8 ± 5.0 (20.8–46.6) | 25.7 ± 5.0 (19.9–41.4) | |
| Smoking status, n (%) | Active smoker | 16 (20) | 34 (43) | 5 (13) | 19 (56) |
| Ex-smoker (>6 months) | 38 (48) | 40 (50) | 18 (47) | 14 (41) | |
| Non-smoker | 26 (33) | 6 (8) | 15 (39) | 1 (3) | |
| Packyears, years (range) | 13 ± 19 (0–94) | 35 ± 22 (0–125) | 15 ± 25 (0–125) | 40 ± 22 (0–90) | |
| COPD, n (%) | 5 (6) | 35 (44) | 7 (18) | 17 (50) | |
| Diabetes, n (%) | 17 (21) | 16 (20) | 11 (29) | 5 (15) | |
| Number of tumors, n | 85 | 34 | |||
| Tumor histology, n (%) | NSCLC, adenocarcinoma | 27 (32) | 10 (29) | ||
| NSCLC, squamous carcinoma | 26 (31) | 8 (24) | |||
| NSCLC, adenosquamous carcinoma | 2 (2) | 0 (0) | |||
| NSCLC, carcinoid | 1 (1) | 1 (3) | |||
| NSCLC, NOS | 3 (4) | 2 (6) | |||
| SCLC | 11 (13) | 8 (24) | |||
| Unknown | 15 (18) | 5 (15) | |||
| Tumor stage, n (%) | IA | 17 (20) | 10 (29) | ||
| IB | 6 (7) | 1 (3) | |||
| IIA | 7 (8) | 0 (0) | |||
| IIB | 6 (7) | 1 (3) | |||
| IIIA | 21 (25) | 9 (26) | |||
| IIIB | 9 (11) | 5 (15) | |||
| IV | 19 (22) | 8 (24) | |||
Publisher’s Note: MDPI stays neutral with regard to jurisdictional claims in published maps and institutional affiliations. |
© 2021 by the authors. Licensee MDPI, Basel, Switzerland. This article is an open access article distributed under the terms and conditions of the Creative Commons Attribution (CC BY) license (https://creativecommons.org/licenses/by/4.0/).
Share and Cite
Derveaux, E.; Thomeer, M.; Mesotten, L.; Reekmans, G.; Adriaensens, P. Detection of Lung Cancer via Blood Plasma and 1H-NMR Metabolomics: Validation by a Semi-Targeted and Quantitative Approach Using a Protein-Binding Competitor. Metabolites 2021, 11, 537. https://doi.org/10.3390/metabo11080537
Derveaux E, Thomeer M, Mesotten L, Reekmans G, Adriaensens P. Detection of Lung Cancer via Blood Plasma and 1H-NMR Metabolomics: Validation by a Semi-Targeted and Quantitative Approach Using a Protein-Binding Competitor. Metabolites. 2021; 11(8):537. https://doi.org/10.3390/metabo11080537
Chicago/Turabian StyleDerveaux, Elien, Michiel Thomeer, Liesbet Mesotten, Gunter Reekmans, and Peter Adriaensens. 2021. "Detection of Lung Cancer via Blood Plasma and 1H-NMR Metabolomics: Validation by a Semi-Targeted and Quantitative Approach Using a Protein-Binding Competitor" Metabolites 11, no. 8: 537. https://doi.org/10.3390/metabo11080537
APA StyleDerveaux, E., Thomeer, M., Mesotten, L., Reekmans, G., & Adriaensens, P. (2021). Detection of Lung Cancer via Blood Plasma and 1H-NMR Metabolomics: Validation by a Semi-Targeted and Quantitative Approach Using a Protein-Binding Competitor. Metabolites, 11(8), 537. https://doi.org/10.3390/metabo11080537