Abstract
Metabolomics uses advanced analytical chemistry methods to analyze metabolites in biological samples. The most intensively studied samples are blood and its liquid components: plasma and serum. Armed with advanced equipment and progressive software solutions, the scientific community has shown that small molecules’ roles in living systems are not limited to traditional “building blocks” or “just fuel” for cellular energy. As a result, the conclusions based on studying the metabolome are finding practical reflection in molecular medicine and a better understanding of fundamental biochemical processes in living systems. This review is not a detailed protocol of metabolomic analysis. However, it should support the reader with information about the achievements in the whole process of metabolic exploration of human plasma and serum using mass spectrometry combined with gas chromatography.
1. Introduction
Metabolites are substances with low molecular weight (<1500 Da), intermediates, and products of chemical reactions catalyzed by various enzymes in living systems. In other words, metabolites are small molecules reacting to intrinsic or environmental challenges. The metabolome, in turn, is a “snapshot” of all metabolites in the biological object at a specific time point.
Metabolomics is an essential member of the “omics” family. First, the genome and the transcriptome, made up of four bases, provide possible scenarios of the functioning of biological systems. Next, assembled from 20 amino acids, the proteome shows which protein machines are available. Finally, the metabolome indicates the reaction of the biological system to disturbances happening right now [1].
As the final stage of the spectrum of “omics,” metabolomics reflects the diversity of chemicals arising from the sequential and synergistic interactions of 20,000+ human genes, 60,000+ transcripts, and 1,000,000 types of proteins in the dynamically changing environment [2,3]. The information about how an organism or a cell attempts to retain nutrients while eliminating xenobiotics is vital for predicting the phenotype of a biological system [4].
Exploring the human metabolome is valuable for understanding pathophysiological processes and searching for new diagnostic and prognostic biomarkers of various disorders [5,6], accelerating drug discovery [7], and assessing the impact of diet [8,9], lifestyle [10], and other factors [11].
In the professional community of scientists working in metabolomics, the gas chromatography-mass spectrometry tandem (GC-MS) has a reputation as one of the most reliable, robust, and used analytical platforms, accompanied by a variety of spectral libraries for processing experimental data [12].
Metabolomics, as we imagine it today, appeared relatively recently. In this review, we tried to highlight some excellent methods of sample preparation, subsequent GC-MS analysis, and post-processing that have emerged over the past 20 years to provide a high-throughput characterization of small molecules in blood plasma and serum, the substrates-of-choice for many years.
2. Serum and Plasma Metabolome as a “Snapshot” of a Human Biochemistry
Blood and its components are the “workhorses” and favorite subjects for metabolomics analyses. For the query (blood metabolome) OR (plasma metabolome) OR (serum metabolome), the PubMed repository retrieves more than 16,000 articles published over the past 20 years. The dynamics of the increase in the number of papers is also staggering. If in 2008 fewer than a hundred studies on selected keywords were published, then in 2020, there are already more than 2000 publications.
Such attractiveness of blood for metabolomic studies is due to the low invasiveness of its extraction. Blood is usually analyzed either as serum or plasma.
The serum is a biological liquid obtained when whole blood coagulates. Coagulation is a vital process that prevents excessive blood loss from a minor wound. In a laboratory, it is common to centrifuge the coagulated blood to the bottom of the collection tube, leaving serum above the clot. The main components of serum are water, various proteins, peptides, amino acids, hormones, nitrogen compounds, various ions and salts, traces of nucleic acids, metabolites, and lipids.
Plasma is the liquid component of blood, where coagulation has been prevented. It is obtained when a clotting-prevention agent (called anticoagulant) is added to whole blood and then placed in a centrifuge to separate the cellular material from the lighter liquid layer. Common anticoagulant agents are EDTA (ethylenediaminetetraacetic acid), heparin, and citrate. After centrifugation, the remaining plasma contains fibrinogen and other coagulation factors in their original state. From the biochemical point of view, plasma is practically identical to the liquid fraction of circulating blood (except for anticoagulants). It can be said that the main difference between plasma and serum is the presence of fibrinogen and coagulation proteins. Still, there are many other more subtle differences (e.g., in eicosanoids’ levels [13,14]).
The nomadic nature of this biological fluid is also noteworthy. Blood’s metabolic profile and components provide a global “snapshot” of the transformations of substances and energy occurring in all organs and tissues. The ability of the blood metabolome to reflect internal and external perturbations [15,16] of the organism makes it one of the most important information layers for comprising a global picture of the condition of the individual at a specific point in time [17]. The versatility of the blood metabolome has provided fruitful ground for an impressive body of work investigating rapid [18,19] and slow [20,21] changes in the body. Modern metabolomic approaches allow the identification of characteristic patterns of low molecular weight compounds and associate them with the development of pathologies [22,23,24], lifestyle [25,26], and eating habits [27,28,29] in both personalized mode [10,30,31] and large cohorts [32,33].
Together, serum and plasma are the second most commonly used biofluids in metabolomic studies after urine [34] The preanalytical stages of blood processing are different for plasma and serum. Anticoagulants are added to plasma vacutainers, and coagulation enhancers are added to serum vacutainers. The question arises, are there any differences in the metabolomes of plasma and serum? If so, how do they affect the interpretation of obtained data? Studies show that none of the considered biological fluids has a clear advantage over the other in forming a representative metabolomic image of the object under investigation or the development of potential biomarkers [13,35,36]. Unless the primary plasma preparation looks more attractive: the processing is more reproducible and fast since there is no need to wait for the blood to clot, and clotting time may vary across individuals [37]. Another advantage of plasma over serum is the lower risk of hemolysis and thrombocytosis and the almost complete absence of post-centrifugal coagulation interference that can occur in serum. Plasma and serum metabolomes are comparable in “width”: the average number of unique metabolites identified in plasma and serum routinely using GC-TOF-MS equipment was 178 and 170, respectively, and 80% of this metabolic pool was present in both types of biomaterial [38]. Notably, deltas between the signal intensities of several metabolites in serum and plasma persisted. This observation means that plasma and serum offer similar analytical opportunities. Moreover, the experiments performed on plasma can be compared with those on serum and vice versa, which may facilitate the metabolic comparison of samples obtained using different protocols.
Nevertheless, the choice of the sample may significantly affect the results of experiments for several molecules of interest. Therefore features of different routinely applied protocols should be considered when comparing plasma and serum tests [39,40,41,42]. For example, the profiles of amino acids in plasma and serum differ because several amino acids are prone to conversion during clotting at room temperature (e.g., asparagine converts to aspartic acid and glutamine converts to glutamic acid) [43].
On the other hand, the serum is a more “metabolite-rich” matrix: the concentration of most metabolites in it is generally higher [42]. For example, the platelet activity marker thromboxane B2 (TXB2) concentration in plasma is 0.2–2 ng/mL, and in serum, it is already 2–178 ng/mL [44]. The volume displacement effect can partially explain this phenomenon. It is assumed that after serum deproteinization, the remaining low molecular weight components are distributed in a smaller volume, which increases their concentrations. Perhaps this was the reason for the identification of more potential biomarkers in serum than in plasma in the study of various phenotypes [45].
It is, in any case, evident that there are still more similarities between plasma and serum than differences, and it is impossible to make a clear choice in favor of one or another liquid. Fortunately, there is no need to do this since both plasma and serum are excellent matrices for metabolomic studies with broad applicability.
3. How Many Blood Metabolites Are There?
The potential space of organic substances that make up the metabolome is truly colossal: it lies between 1063 and 10200 unique substances [46]. Even if these theoretical spaces are reduced by several orders or even tens of orders of magnitude, they will not cease to look astronomical. Such an impressive amplification of diverse chemical information is a blessing and a curse of metabolomics at the same time [5]. At the moment, according to the HMDB 5.0, the world’s largest and most comprehensive human metabolome database [47], more than 18 thousand unique low-molecular compounds of various nature have been detected and quantified in human blood. However, the diversity of metabolites in human blood is complex and challenging to assess.
Globally, all human blood metabolites can be divided into water-soluble and lipid-soluble groups. The share of lipid-soluble molecules accounts for 88% of the metabolome (Figure 1). Lipids and lipid-like substances represent a significant and chemically diverse fraction of metabolome (>80,000 lipid molecules exist in humans, and more than 20,000 of them are found in the blood), which play essential roles in living systems. Various functional groups of lipids make them versatile machines serving as cellular barriers (various phospho- and glycolipids [48], membrane matrices (cholesterol), signaling agents (ceramide, sphingosine), and energy reservoirs (triglycerides) [49,50,51].
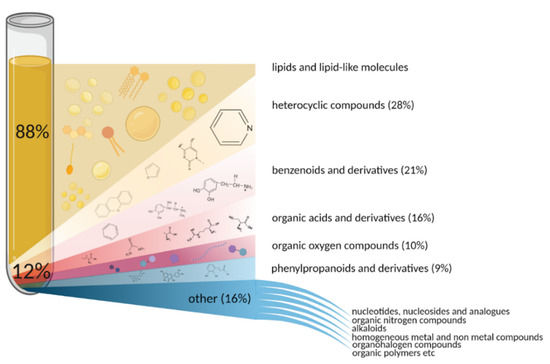
Figure 1.
Diversity of chemical substances comprising human blood metabolome based on HMDB 5.0.
Non-lipid metabolites account for only about 12% of the total blood metabolome. Still, the variety of classes these substances belong to is much wider than that of the lipid-soluble fraction (Figure 1).
Metabolites differ significantly in their physical-chemical characteristics. To illustrate this diversity, we analyzed significant experimentally established and predicted properties of blood metabolites deposited into HMDB 5.0: results are presented in Supplementary Material S1.
This diversity inevitably leads to difficulties throughout metabolome research: from developing universal protocols suitable for a wide range of substances to post-processing and interpretation of obtained results. Even in panoramic mode, metabolomics cannot equally effectively explore and quantify the entire metabolome during one experiment, in contrast to more “mature” genomics, which allows sequencing the entire genome of the object under study. In the case of the proteome and metabolome, it is impossible to detect and quantify all proteins and metabolites, so researchers are forced to work under conditions of myopia, observing only part of the overall picture [52].
The concentration range of small organic molecules in blood covers nine orders of magnitude. The most abundant organic molecules are present at the level of several mM (cholesterol, urea, amino acids), and the limit of the concentrations of quantified metabolites is pM and below (various glycerophospholipids). In general, the average concentration of metabolites in the blood of healthy donors can vary within the range of ±100% (glucose, lactic acid, glutamine, glycine) due to several internal (age, sex, genetic patterns) and external (diet, circadian rhythms, and fitness) determinants [44].
4. Approaches of Metabolome Exploration
Just as proteomics differs from protein chemistry in that it seeks to cover the entire spectrum of protein compounds, metabolomics differs from local analytical techniques in the breadth of view on the profile of low molecular weight molecules. Metabolites are so diverse in physical and chemical properties: a mix of volatile alcohols, hydrophilic sugars, and hydrophobic lipids, amino- and non-amino organic acids comprise the metabolome of the sample. This motivates metabolome researchers to exploit the advantages of several analytical platforms [5].
High-throughput spectroscopic techniques are major tools of metabolomics. The most popular of them are nuclear magnetic resonance (NMR) spectroscopy [53] and mass spectrometry (MS) solo [54] or in tandem with gas (GC) [55,56] or liquid (LC) [57] chromatography (Figure 2). Both spectroscopic platforms provide extensive information on the composition and structure of several compounds of different chemical nature in a single analytical run.
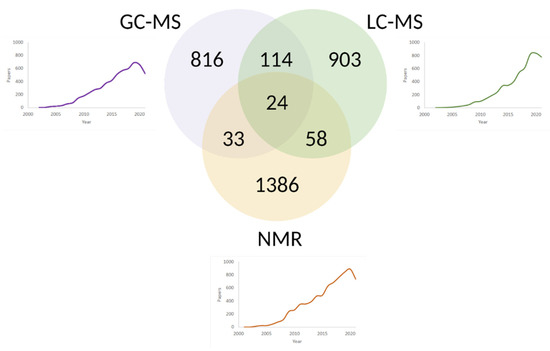
Figure 2.
Venn diagram and timelines comprising the number of scientific publications on blood metabolome studies via LC-MS, GC-MS, and NMR up to date. The queries “LC-MS blood metabolome”, “GC-MS blood metabolome” and “NMR blood metabolome” were addressed to the PubMed repository. The leader in the number of publications is the most mature NMR technology, followed by gas and liquid chromatography in tandem with MS. Due to the different applicability of NMR, LC-MS, GC-MS for various classes of metabolites, the combination of two or even three analytical platforms has been used in 200+ metabolomics projects. The synergy is especially noticeable between GC-MS and LC-MS, used together approximately in 7% of mass spectrometry-based experiments.
4.1. NMR
The NMR method is based on the magnetic properties of the 1H and 13C nuclei. Suppose a molecule containing such nuclei is placed in a magnetic field and irradiated with a radio-frequency pulse. In that case, the atomic nuclei will go into an excited state, and the researcher will be able to register the signal of subsequent relaxation. This signal depends on the amount of the irradiated substance and ultimately contains information about the environment of the nucleus. Thus, the NMR spectrum of a substance is a superposition of signals from all resonating nuclei.
With over 20 years of extensive usage in metabolomics and over 1.5 thousand scientific papers (Figure 2), this method has proven to be a robust and reliable technique with exceptional reproducibility [58,59].
NMR requires relatively simple sample preparation [60]. However, moderate resolution and sensitivity of NMR impede the determination of low-abundant metabolites [61]. Another significant drawback of NMR is the small number of determined metabolites in complex mixtures (from 20 to 200 unique substances, depending on the resolution of NMR) in comparison with MS (potentially more than 500 identified substances). This advantage makes mass spectrometry dominant for exploring a wide range of metabolites [62].
4.2. Tandem of Chromatography and Mass Spectrometry
Separation-based MS techniques take advantage of both “ingredients.” Due to the characteristic pattern of the parent and daughter ions and advanced MS detectors, the specificity of the analysis is ensured without loss of sensitivity [63]. Before MS detection, the procedure of chromatography is carried out to downgrade the complexity of the sample. The sample components are moving through the stationary phase in the flow of the mobile phase. As a result, the complexity of the analyzed mixture entering the mass spectrometer decreases due to the distribution of substances between the mobile and stationary phases of the chromatographic column by their solubility, polarity, and volatility.
As the name suggests, liquid chromatography uses liquids as a mobile phase. An analyte solubility and an affinity for a sorbent in a chromatographic column are decisive physical-chemical separation parameters. Advances in LC-MS in comprehensive coverage of the metabolome are reported in more than 1000 publications (Figure 2). LC-MS is a universal platform suitable for analyzing the majority of plasma and serum metabolites.
GC-MS and LC-MS techniques can be successfully used together to provide comprehensive metabolome profiling [64]. In gas chromatography, the mixture of metabolites is carried by gas, and the compounds are divided in the column space by their volatility. GC-MS has long been used for metabolome profiling due to its separation capacity, sensitivity, and selectivity [12]. Reproducible molecular fragmentation patterns of GC-MS make it one of the most reliable tools for exploring metabolomes. However, the application of GC-MS is limited to volatile compounds, and a large portion of small molecular metabolites are within the range of GC separation.
Due to its excellent ability to separate complex chemical mixtures, two-dimensional gas chromatography is gaining popularity in metabolomics [65]. Series connection of two chromatography columns with different polarities allows separating compounds that co-elute from the first column. This technique becoming the new frontier of GC-MS-based metabolomics is used to characterize several classes of chemical compounds for panoramic and targeted studies of various biological samples, including blood plasma and serum (see Section 5.2.5 “Multidimensional chromatography” for further discussion).
Chemical derivatization before GC significantly improves the volatility and thermal stability of polar and non-volatile metabolites. Therefore, the content of chemical compounds that GC-MS can analyze is expanding [66]. We will build further narratives based on GC-MS technology, which offers a compelling balance of sensitivity (more sensitive than NMR) and reliability (more robust than LC-MS).
The monumental research by Psychogios and co-authors highlighted metabolites routinely found in liquid blood components [44]. The study showed that out of the total pool of 4229 metabolites (including lipids) known at that time, NMR measured 1.2%, GC-MS 2.1%, MS/MS with electrospray ionization (lipids profiling) measured 2.3%, direct flow injection -mass spectrometry (lipids profiling) measured of 79.9%, and tandem MS with direct flow injection was able to access 3.3% of the total serum metabolome.
Each technology used in metabolomics has a unique set of strengths and limitations (Table 1). It is challenging to prudently select an appropriate metabolomics platform equally well suited for studying the entire wide range of metabolites circulating in plasma and serum. However, optimal solutions can be determined for individual classes of substances. For example, the vast majority of identifications in lipid-rich serum and plasma highlights the limitations of GC-MS, which provides less advantageous lipid profiling than LC-MS [67].

Table 1.
Major characteristics of NMR, GC-MS, and LC-MS techniques used in metabolomics.
5. Workflow of GC-MS Analysis of Blood Metabolome
5.1. Sample Preparation
The efficiency of metabolomic analysis largely depends on the stage of sample preparation. Aberrations at this stage affect the list of detected and identified molecules, the quality of the data, and, as a result, the biomedical interpretation of obtained results. Therefore, the choice of sample preparation method mainly depends on the type and volume of the sample, the physical-chemical properties of the analytes being measured, and the analytical platform used for the analysis. Metabolic analysis of plasma or serum by GC-MS involves several sequential sample preparation steps, including quenching, extraction, and derivatization. We have described each of these stages below (Figure 3).
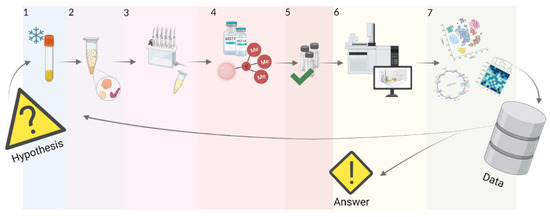
Figure 3.
Stages of standard GC-MS analysis of plasma or serum samples. In a hypothesis-driven study, a metabolomic experiment starts with formulating a hypothesis, which further work will be aimed at confirming or refuting. Preanalytic operations involve quenching enzymatic processes (stage 1) in every biological sample from a representative sample. Further, the sample is purified (stage 2) from interfering protein molecules, followed by liquid or solid-phase extraction (stage 3), which allows the release of metabolites from the plasma or serum matrix and concentrates them in a smaller volume. Next, extracted metabolites are derivatized (stage 4) to improve their volatility and thermal stability. After ensuring that the quality criteria (stage 5) are met, the researcher performs a gas chromatography-mass spectrometric experiment (stage 6). Finally, data processing (stage 7) provides the researcher with either an answer to the original question or the basis for starting a new data-driven study [68].
5.1.1. Quenching
Biological samples can be divided into metabolically active, whose metabolic composition can change over time (cells, tissues), and metabolically inactive, whose metabolic profile is “fixed” (saliva, urine). For metabolically inactive samples, minimal sample preparation is usually applied. Highly active samples require metabolic processes to be quenched [69,70]. Plasma and serum are biological samples of moderate metabolic activity, occupying an intermediate position between inactive urine and active cells, so they still may need a quenching stage (Figure 3, stage 1) [68].
To quench metabolic processes in plasma or serum, it is necessary to abruptly stop enzymatic activity by changing the medium’s polarity, temperature, or pH. Generally, quenching of enzymatic processes in plasma and serum coincides with the extraction of metabolites with an organic solvent.
5.1.2. Protein Cleanup
Interfering proteins presented in plasma and serum may suppress analytical signals of metabolites. Therefore protein molecules should be removed in advance to reduce the complexity of the sample under study and improve the peak resolution of metabolomic profiling. The precipitation procedure is often used to purify plasma or serum from protein contaminants. Precipitation is accomplished by changing the pH and polarity of the solution. As a result, intramolecular interactions are disrupted, the protein denatures, aggregates, and falls out of solution [71,72]. For plasma and serum, the excess amounts of organic solvents such as methanol or acetonitrile [72,73] are used, followed by high-speed centrifugation and separation of the supernatant (Figure 3, stage 2).
It is noteworthy that plasma and serum represent a hydrophilic environment with limited solubility of hydrophobic metabolites such as lipids, fatty acids, steroids, and thyroid hormones. Efficient transport and distribution of these hydrophobic compounds in blood plasma in vivo are achieved due to their interaction with proteins. During the precipitation of proteins, a certain part of the metabolites is lost. To minimize this effect, there is a technique that allows the extraction of coprecipitated metabolites due to the enzymatic cleavage of precipitated proteins; however, the reproducibility of this method requires additional evaluation [74]. The combination of adding an excess of a strong organic solvent such as methyl tert-butyl ether (MTBE) with a subsequent extraction step also increases the coverage of the metabolome [75].
5.1.3. Extraction
Extraction releases metabolites from the biological matrix and concentrates them in a smaller volume (Figure 3, stage 3). The breadth of the research problem dictates the choice of extraction methods.
Target metabolomics allows to qualitatively and quantitatively characterize a specific, often relatively narrow, group of metabolites [76]. In this case, at the extraction stage, it is required to reduce interference from off-target compounds and increase the completeness of extraction of target groups of metabolites.
Panoramic metabolomics is aimed at the broadest possible coverage of a wide variety of chemically diverse metabolites [76]. For such global tasks, an unselective extractant is selected that will effectively extract substances belonging to different chemical classes to ensure adequate depth of metabolite coverage and represent the actual composition of the sample under study. For metabolomic studies of serum and plasma, liquid-phase and solid-phase extraction are used.
Liquid extraction of metabolites can be performed by one- or two-phases systems. Single-phase extraction systems are of particular interest since they decrease the complexity of the experimental procedure and allow for the simultaneous deproteinization and extraction of a comprehensive metabolic fraction. In addition, such designs are attractive for studies on a limited amount of available biological material, inadequate for multiple specific protocol protocols suited for different compounds.
Biphasic extraction is based on the metabolites transfer from one liquid phase to another immiscible liquid phase in which they are more soluble. The most frequently applied organic extractants include acetonitrile, chloroform, acetone, methanol, ethanol, and mixtures at various ratios. The solvents and their proportions can significantly affect the total number of metabolites extracted.
An organized attempt was made to compare various extraction options with each other and select those conditions under which it is possible to extract the largest number of metabolites from the plasma with maximum efficiency: the choice of the extracting agent, its volume, as well as the time and temperature at which the extraction took place, was evaluated [72]. The temperature of the solvent does not affect the peak area at all or shows a slight increase in the case of acetone. A much more critical parameter turned out to be the volume and content of the solvent. Nine parts of methanol:water mixture (8:1, v/v [72]), added to one part of a plasma, provide optimal results in terms of completeness, efficiency, and reproducibility of extraction in comparison to other tested solvents (ethanol, acetonitrile, acetone, chloroform). The stability of the procedure for the extraction of low molecular weight compounds from plasma with methanol is also emphasized in a similar scientific work [77]. To increase the range of extractable metabolites (for example, for the reliable recovery of fatty acids), many protocols use complex solvent combinations, such as methanol:chloroform or methanol:chloroform:water [72]. For example, the protocol by O.Fiehn uses acetonitrile:isopropanol:water (3:3:2, v/v) mixture for extraction. The combination of hydrophilic, lipophilic, and medium-polarity solvents demonstrated high analytical precision and comprehensiveness of extracted metabolome [56].
Another solvent mixture of methanol:chloroform (3:1, v/v) mixture, which, due to nonpolar chloroform, provided better extraction of lipophilic metabolites from the serum sample than methanol alone [78]. The MeOH:MTBE:H2O mixture (2:10:3, v/v/v) was also highly appreciated for its versatility for various chemical classes in comparison with pure methanol and a mixture of methanol:water (3:1, v/v) with subsequent treatment with a mixture of chloroform:water (3:1, v/v) [77].
The composition of the extraction mixture and the extraction time are not the only parameters that can be varied to achieve better recovery. Ultrasonic stimulation can also increase the degree of extraction. It was shown that after four minutes of ultrasonic extraction (40 kHz, 350 W), the intensities of most of the 570 resolved peaks increased compared to two and 10 min of the traditional vortexing [79]. Moreover, by changing the pH, one can also influence the type and number of extracted metabolites. An experiment with blood components showed that the sum of unique molecular features on the chromatography-mass spectrum after extraction at pH 2, pH 7, and pH 9 is 45% more than extraction in a neutral medium [80].
Solid-phase microextraction (SPME) is based on redistributing substances between phases due to sorption or ion-exchange processes. SPME is gaining popularity as a method for sample preparation in metabolomics experiments providing significant reduction in matrix effects [81,82]. SPME process can be fully automated, allowing for high sample throughput and improving method repeatability [83,84]. Among the advantages of SPME, the diversity of commercially available extraction phases manufactured in standardized conditions is noteworthy [85]. For the extraction of a broad metabolome, relatively versatile silica-based C18 resins [86] and complex multicomponent and multilayer coatings, e.g., DVB/CAR/PDMS (divinylbenzene/carboxene/polydimethylsiloxane) are used [87]. Such coatings make it possible to adapt the average pore size in different sorbent layers to different sizes of extracted analytes.
The polyacrylate (PA)-coated SPME cartridge has shown excellent results for recovering volatile organic metabolites from liquid biological samples. When used, the number of well-resolved peaks and their total intensity is higher than with PDMS/DVB or CAR/PDMS coated cartridges [88]. SPME with DVB/CAR/PDMS sorbent mixture made it possible to extract and subsequently identify almost 300 unique metabolites, including hydrocarbons, amines, ethers and esters, alcohols, carboxylic acids, thiols, terpenoids, and heterocyclic compounds, etc. [89].
Moreover, when comparing various complex coatings for solid-phase extraction (PDMS/DVB, PA, DVB/CAR/PDMS, CAR/PDMS, PDMS, and PEG (carbowax-polyethylene glycol)) of volatile organic metabolites, it is also the CAR-DVB-PDMS phase which allowed to detect the largest number of metabolites (63% of the pool of identifications for the sum of all methods) [90].
However, absorbents are rarely used for panoramic profiling [89], but they show good results for extracting certain classes of substances. Thus, polar sorbents (carbowax–divinylbenzene) are effective for extracting polar (alcohols, ketones, nitroaromatics) analytes, and nonpolar sorbents (PDMS) are effective for extracting nonpolar analytes (polycyclic aromatic hydrocarbons, benzene/toluene/ethylbenzene/xylenes) [91]. Solid-phase extraction revealed statistically significant differences between metabolomes of patients with breast cancer and healthy people for several volatile organic compounds (including benzene derivatives, terpenoids, ketones, sulfur compounds, and phenols) [92,93].
5.1.4. Derivatization
Derivatization can be applied before or after chromatographic separation (Figure 3, stage 4). In GC, pre-column derivatization is much more common. Post-column derivatization is quite an exotic procedure enhancing the detectability of the analytes through rapid physical-chemical conversion (pyrolysis, catalytic hydrogenation, etc.). In this case, the chromatogram of the initial mixture is recorded, and then the substance is modified for more accurate mass spectrometric analysis. For example, for post-column derivatization, a dehydrogenation microreactor installed between the GC and MS was used. Since only six-membered rings without quaternary carbon atoms undergo aromatization, this post-column dehydration makes it possible to differentiate between cyclopentane and cyclohexane hydrocarbons [94]. As part of this review, we will focus on predominant pre-column methods.
During GC-MS analysis, volatile low molecular weight compounds pass through a chromatographic column heated to about 300 °C and higher. However, most metabolites (e.g., glucose, lactate, pyruvate, palmitate, etc.) have higher boiling points due to their polar functional groups. They, therefore, are not volatile at the highest temperature allowed for a GC system.
Pre-column chemical derivatization protects polar functional groups, improves the volatility and thermal stability of the molecule [95]. The replacement of acidic protons of amino-, hydroxyl-, carboxyl-, and thiol-groups with other groups (silyl-, alkyl formate-, etc.) weakens intermolecular interactions, decreasing the boiling point and polarity of the metabolite, and increasing its stability [96,97].
The choice of the optimal derivatization reaction for GC-MS-based metabolomics is not always a simple task because there are a plethora of various compromises, more or less suitable for specific molecular targets. Most popular and universal derivatization protocols use trimethylsilylaton strategy and its variants [55]. Alternative variants (alkylation and acylation complete the list of the top three most abundant techniques) expand the “toolbox” of derivatization and will also be described below.
Silylating agents replace the active proton in many functional groups, including OH, COOH, SH, NH, CONH, POH, and SOH with trimethylsilyl (TMS) group [97]. The good volatility and stability characteristics make silylated derivatives highly suitable for GC-MS analysis (Figure 4).
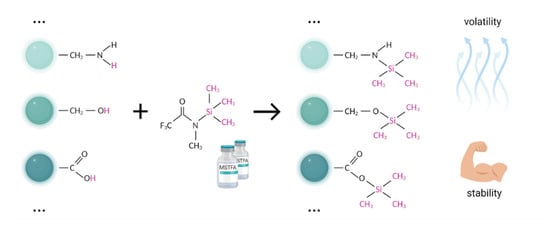
Figure 4.
The typical scheme of trimethylsilylation. Bimolecular nucleophilic substitution (SN2) replaces the active hydrogen (-OH, -COOH, -NH, -NH2, and -SH) by the trimethylsilyl group. Compared to the initial compounds, silylated derivatives generally are more volatile and thermally stable, thus yielding advanced separation of symmetric and narrow chromatographic peaks.
The most commonly used silylation agents are N,O-bis-trimethylsilyltrifluoroacetamide (BSTFA), N-methyl-trimethylsilyltrifluoroacetamide (MSTFA), and N-tert-butyldimethylsilyl-N-methyltrifluoroacetamide (MTBSTFA). Among popular trimethylsilylacetamides, MSTFA is the most volatile, mild, and versatile reagent for the complex profiling of metabolites of blood components [56]. The silylation potential of BSTFA is close to that of MSTFA, but the volatility is slightly lower, which may positively affect the ease of use of this derivatizing agent. Moreover, the stability of BSTFA derivatives ensures low noise and moderate detector fouling [97] (Figure 4).
The molecular weight of the initial molecule plays an essential role in the derivatization. If the molecule has a low molecular weight, there are no fundamental differences between the TMS agents. For relatively large metabolites (dicarboxylic acids, styrenes, monohydroxy-polycyclic aromatic hydrocarbons) without hindered functional groups (9-hydroxyfluorene, sugars), MTBSTFA is an excellent solution. A significant advantage in using MTBSTFA is the absence of highly volatile by-products that interfere with early eluting peaks [98].
Direct silylation of keto- and aldehyde groups produces several redundant compounds, complicating chromatograms’ qualitative and quantitative interpretation [99,100]. To avoid chromatographic artifacts (e.g., keto-enol tautomerization), oximation by hydroxylamines or alkoxyamines is used before silylation. It protects keto- and aldehyde-groups, preventing cyclization of sugars and decarboxylation of α-keto acids [101]. The methoximation takes 1–2 h when heated (usually up to 37–70 °C) or overnight at room temperature [72,102].
It is vital to carry out silylation in an anhydrous medium, such as pyridine, since active hydrogens of water molecules react vigorously with silylating agents. Anhydrous pyridine acts as an acid scavenger and accelerates derivatization [103]. Therefore, the silylation is usually completed at room temperature or heating within an hour to 60–70 °C [104]. Controlled microwave radiation reduces reaction times to minutes [103,105].
An important disadvantage against the background of all the listed advantages of TMS-derivatization is the deteriorative effect of the excess of the TMS-reagent on the sorbent of some types of chromatographic columns (e.g., carbowax (polyethylene glycol) columns) [106].
Alkylation is an alternative derivatization strategy that can be used in metabolomic profiling. Ideologically, alkylation (or arylation in the case of the reagent with aryl group) is similar to silylation, based on nucleophilic substitution of the active hydrogens from the -OH, -COOH, -SH, -NH, or -CONH groups with an aliphatic or aliphatic-aromatic group. The alkylation products are less polar and more stable than the initial molecules, which, if necessary, makes it possible to isolate and “preserve” derivatives [97,107].
Popular alkylating agents are short-chain alkyl- or aryl-halides, in which the cationic moiety carries a specific property, and the anionic moiety is responsible for specific reactivity. In addition to them, dialkyl acetals, diazolalkalanes, pentafluorobenchyl bromide (PFBBr), boron trifluoride in methanol or butanol, tetrabutylammonium hydroxide, dimethyl sulfate are used.
PFBBr alkylates phenols, thiols, and carboxylic acids. Alkyl bromides are used mainly for the derivatization of carboxylic acids and tetrabutylammonium hydroxide (TMH) for low molecular weight amines and carboxylic acids [97].
Alkylation has several features, both attractive to the researcher and undesirable. The advantage of derivatization through alkylation is a wide range of reaction conditions, varying from strongly acidic to strongly basic. Another valuable property is reaction speed. For example, dialkyl acetals react so quickly with functional groups of carboxylic acids, phenols, and thiols that this reaction can be used in flash derivatization directly at the injection port. On the other hand, some alkylating reagents of this type (diazomethane and dimethyl sulfate) are extremely toxic, and some (boron trifluoride) are very unstable even at low temperatures and are extremely sensitive to moisture. Such nuances significantly complicate the process of alkyl derivatization [97].
Like the derivatization approaches described above, the nucleophilic substitution of the active hydrogen of the polar group with the RCO group of the acylating agent allows reducing the polarity of small molecules and improve their behavior in the chromatographic column, although not so effective as silylation or alkylation. Acylylation gives the ability to derivatize a wide variety of compounds for GC analysis, especially amines, amino- and organic acids in serum and plasma [108,109]. For example, a comparison of the ethyl chloroformate derivative of low molecular weight compounds in blood serum made it possible to reliably distinguish between clusters of healthy volunteers and patients with uremia [110].
Unlike the more popular silylation, acylation can be performed in an aqueous medium, which is convenient for metabolomic profiling of plasma and serum [106]. In addition, rapid acylation [111] in an aqueous medium allows some highly volatile polar metabolites, for example, alcohols or phenols [107] to be derivatized without fear of their premature evaporation (which, for example, can happen during aggressive drying before derivatization with silylating agents). Another important advantage of acylation is its amenability to a wide range of chromatographic and mass spectrometric systems due to the simple separation of the reaction products from the reagents [106].
The most popular acylating reagents are chloroformates with the simplest alkyls (methyl, ethyl, isobutyl), which are well suited for analyzing amines, phenols, and carboxylic acids. The classic version of the reaction proceeds in pyridine and requires the corresponding alkyl alcohol (methanol, ethanol, isobutanol). Identical radicals of alcohol and chloroformate are needed to eliminate the probability of the formation of different derivatives for the same acid. After adding an excess of chloroformate, the formed derivatives are extracted, for example, with chloroform [111,112].
The main disadvantage of derivatization with alkylformates is the smaller coverage of metabolome: for example, the protocol is generally not suitable for carbonyls and amides due to their precipitation. Another critical disadvantage, especially compared with silylation, is the limited spectral databases of acylated molecules, making them challenging to identify [55,106,108].
Metabolomics methods employing derivatization are more complex than direct analysis without chemical modifications since the experimenter requires additional intervention. However, in most cases, the advantages of derivatization outweigh its disadvantages, and for this reason, it is still widely used in analytical practice [100]. Moreover, with the democratization of autosamplers that allow chemical derivatization immediately before analysis [12], metabolomic profiling becomes less laborious, and the results obtained become more reliable and reproducible.
5.2. Gas Chromatography
Gas chromatography allows the separation of a vaporized mixture of substances due to differences in the speed of movement of individual components in the flow of the gaseous mobile phase along with the stationary phase of the thermally controlled column.
5.2.1. Injection
Several microliters of the sample are uploaded into the GC system through an injection port (Figure 5). The port is generally heated to a high temperature sufficient for instantaneous sample evaporation but not exceeding its decomposition temperature. Depending on the purpose of the experiment and the concentrations of the target components, injection of the sample can be effected in three modes: direct, split, and splitless. As expected, each mode has its area of applicability, advantages, and drawbacks. Thus, the direct mode is used for thermally labile compounds to avoid contacting the hot injection port and direct the sample directly to the column. In splitless mode, the entire sample is fed to the chromatographic column, but it is vaporized at the injection port. This approach allows the analysis of low-copy compounds. In split mode, only a part of the total sample volume after evaporation enters the column. Dilution of the highly concentrated analyte with gas is intended to make the peaks well resolved and prevent overloading of the column. As expected, at a high split rate (1:400, when 400 parts of the carrier gas dilute one part of the vaporized sample), a low amount of sample injected into the column leads to the low sensitivity of the method. On the other hand, when the split ratio is low (for example, 1:30), the introduction rate into the column increases as the sensitivity increases.
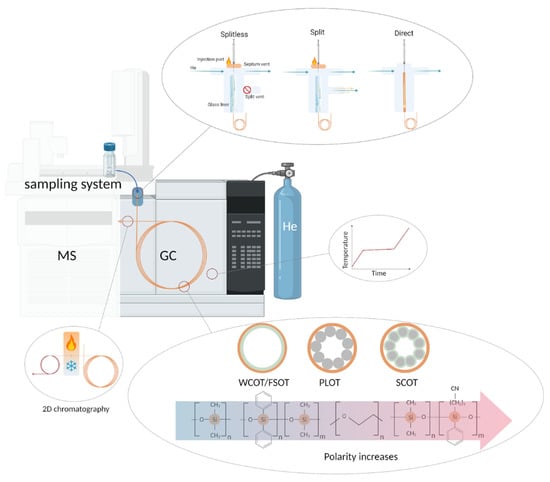
Figure 5.
Schematic illustration of major units in the GC system. Abbreviations in the figure: MS—mass spectrometry, GC—gas chromatography, 2D—two-dimensional chromatography, WCOT-wall-coated open tubular column, PLOT-porous-layer open tubular column, SCOT-support-coated open tubular column, FSOT-and fused silica open tubular column.
The prepared sample enters the chromatographic system through the injection port, which is heated to a high temperature sufficient for instant vaporization of the sample. The majority of GC systems perform two types of sample introduction: split (when the sample is “diluted” by a highly pure carrier gas) and splitless (when most of the sample is uploaded into the column). Alternatively, injection directly into the chromatographic column can be applied to thermally unstable samples and trace analytes. The column itself is a long silica tube filled from the inside with various polymeric substances of different polarity (due to different functional groups in polysiloxanes) acting as a solid or liquid stationary phase. The column is placed in an oven, the temperature in which is maintained constant (isothermal mode) or changes during the wound (temperature-programmed mode). Two capillary columns with different characteristics can be connected in series through a modulator for advanced separation. After separation, eluents get into the detector.
Highly pure H2, N2, and He are used as a mobile phase, carrying a gaseous sample through the column with a minimal effect on the process of chromatographic separation and subsequent mass spectrometric detection. The required level of chromatographic separation primarily determines the choice of carrier gas. Among the three popular gases, 99.9999% He has a priority for complex plasma and serum matrices; N2 is also widely used due to its low operational cost. H2 is less popular because it is flammable and not entirely inert: it can react with mixture components at high temperatures.
5.2.2. Thermal Conditions
After injection, the sample, in whole or in part, enters the chromatographic column, which is in the oven operated in either isothermal or temperature-programmed modes. In isothermal mode, a constant column temperature is maintained during the entire run. This solution is optimal for separating relatively simple mixtures, the components of which have similar RTs. Naturally, for the analysis of a complex sample, the components of which have very different boiling points, it is problematic to choose one temperature that will be maintained throughout the run and provide good separation in an adequate time. Temperature programmed gas chromatography (TPGC) involves heating the column at a controlled rate during the run and then returning to the starting point. Temperature increases speed up the movement of analytes through the column, yielding decreased RTs and duration of analysis (Figure 5).
The temperature gradient allows lower detection limits and improved peak shapes (especially late eluting peaks). The disadvantage of TPGC is a higher noise level at high temperatures compared to isotherm and the need to cool the column between analyses [113].
Interestingly, the isothermal analysis may provide higher internal efficiency than temperature-programmed analysis when analyzing the same complex mixture. However, the higher separation power of isothermal GC is achieved at the expense of extremely long run times, which ultimately last about 1000 times longer than TPGC runs [114]. With the same analysis time, the temperature-programmed option allows 2–3 times more peaks to be resolved [115]. In this regard, various temperature gradients are used to reduce the analysis time and competently resolve the signals [116].
Moreover, separation efficiency can be increased using thermal gradient gas chromatography (TGGC). The essence of this dynamic method is that each section of the column heats up independently, achieving a focusing effect, improving the shape of the peaks, and reducing the noise level. According to theoretical models on normal alkanes, peak performance and resolution in a 100 cm open tubular column operating in TGGC mode are 10–13% higher than in TPGC [117,118]. The need to accurately and rapidly produce and vary thermal gradients along the column significantly complicates the widespread adoption of this method. However, new technologies implying the simultaneous use of resistive heating and convective cooling leave hope for its popularization [118,119].
5.2.3. Solid and Liquid Stationary Phases
The chromatographic column can be packed or capillary. A packed column is a metal or glass tube up to 5 m long and about 3 mm in diameter, filled with a finely powdered stationary phase. Packed columns are rarely used today because the separation efficiency they can provide is hundreds of times less than the efficiency of more advanced capillary columns [120], prepared from high-purity silica. Capillary columns are generally much longer (5–150 m) and thinner (0.05–0.53 mm). This geometry provides a high-speed movement of the sample along the column, allows one to work with microvolumes, and obtain chromatograms with better resolution. In modern capillary columns, stationary phases are applied only on the walls in four ways (Figure 5): wall-coated open tubular (WCOT), porous-layer open tubular (PLOT), support-coated open tubular (SCOT), and fused silica open tubular (FSOT). In the WCOT variant, column walls are coated with a liquid polymer, acting as a stationary phase [121]. In the PLOT column, conglomerates of porous particles are deposited in the inner wall. The inner walls of SCOT columns are lined with a layer of supporting material onto which the stationary phase is attached. FSOT column is a modification of WCOT, in which the capillary is made of fused silica, making it stronger, more flexible, and more inert than the WCOT predecessors. The introduction of crosslinking technology allowed the use of stable thick films in WCOT columns and their modifications, making the SCOT type columns practically irrelevant.
In addition to the column geometry and the method of applying the stationary phase, the stationary phase’s composition also affects the analyte’s behavior in the chromatographic system. Therefore, classical polyethylene glycols and polysiloxanes of various compositions, polarities, and thicknesses (Figure 5) are used. Moreover, ionic liquid SPs exhibit a “dual-nature”, allowing the separation of polar and nonpolar compounds and extending the temperature range at which the column can be operated [122].
A variety of stationary phases are used for blood analysis [12]: e.g., 95% dimethyl/5% diphenyl polysiloxane is popular low-polarity phase [123], and 50% phenyl/50% dimethylpolysiloxane often used as middle-polarity one [124]. When targeting specific metabolites, the phases are selected based on the target compounds. For example, in the analysis of fatty acids in plasma, polyethylene glycol was used [125].
5.2.4. Retention Times and Indices
Depending on the column’s stationary phase, various intermolecular interactions (Van der Waals and dipole-dipole forces, hydrogen bonding, etc.) and polarity of individual compounds of the mixture will determine the strength of its retaining in the column. The stronger interaction between column and compound, the longer its retention time (RT). Compounds with lower boiling points and polarity tend to rapidly transfer through the column and have shorter RTs [126]. However, RT depends not only on the physical-chemical properties of the certain compound but also on various technological aspects of the CG method applied (e.g., column characteristics, thermal conditions, etc.). One of the concepts allowing identification and increasing the convergence of interlaboratory results consists in fixing all possible parameters of the system (the column used, the nature and flow of the carrier gas, temperature conditions) so that the absolute RTs carry information at a qualitative level. Nevertheless, it is difficult to imagine standardization of this level in the entire metabolomics community.
An alternative well-established practice suggests using retention indices (RI) for standardized comparison between different analytical parameters and different GC systems used in different laboratories.
The Kovats index is a pioneer among retention indexes built on a series of n-alkanes (C7–C40, C8–C20, C21–C40) [127]. In addition to n-alkanes, the series of fatty acid methyl esters (FAME) or the so-called M-series, which consists of alkyl-bis-(trifluoromethyl)-phosphine sulfides (CF3)2P(S)CnH2n+1 are used [128]. A homologous batch is added to each sample. Each homolog has a specific point on the retention index scale, and all other compounds are assigned a specific index based on the “coordinates” of the standards. Thus, unlike absolute RT, the compound index between the two reference compounds will remain constant even if the RTs of these analytes change.
Using RI as the only parameter for identifying a compound is risky because RI is not a unique characteristic inherent in only one and no other chemical substance. However, RI is excellent for orthogonal confirmation of identification, supported by mass spectrometry results [129].
5.2.5. Multidimensional Chromatography
In some cases, even high-resolution gas chromatography may be insufficient for the reliable separation of complex biological mixtures.
With two- or even three-dimensional [130] chromatographic systems, that run the sample through two orthogonal columns in series, advanced resolution can be achieved. The second column is usually much shorter than the first, is filled with a different stationary phase, and operates at a higher temperature. If two metabolites leave the first column simultaneously, then the second column can provide separation due to a different stationary phase and temperature conditions [123,131,132]. For example, 100 metabolites in blood were identified using this method, divided in the first column by volatility and in the second by polarity [133].
In another study, which compared serum analysis by one-dimensional and two-dimensional gas chromatography in combination with mass spectrometry, there was a threefold increase in both the total number of peaks (490 ± 26 and 1571 ± 174, respectively) and the number of identified metabolites (348 ± 16 and 1099 ± 118, respectively) in the case of GC×GC-MS [134].
A modulator is located between the columns in a 2D chromatographic system, regulating the temperature or pressure [135]. The modulator continuously accumulates small fractions of the substance from the first column and sends the already concentrated portions to the second column with short pulses for additional separation.
Focusing gives an additional advantage: high and narrow chromatographic peaks (about 100 ms at baseline [65]) increase the resolution and sensitivity of the analysis [135,136,137].
5.3. Mass Spectrometry
After chromatographic separation, the analytes eluting from the column pass through a heated transfer line and interact with an MS detector. This interaction generates a response, which could be digitized and transferred to the data system. The magnitude of the signal from a certain molecular ion (or its fragments) and time from the moment of injection are used to generate a chromatogram.
5.3.1. Ionization
Mass spectrometers separate ions according to their mass-to-charge ratios (m/z). The fundamental laws of nature dictate the need to work with ions: the electromagnetic field providing m/z separation can interact only with charged particles. Thus, the first step required for the mass spectrometric detection of a substance is the conversion of molecules to ions.
Electron impact (EI) is the most common ionization method in GC-MS metabolomics. As the name suggests, ionization occurs due to the collision of electrons with gaseous molecules of a substance. The hot filament emits the electrons, which are accelerated by the high voltage towards the ionization chamber. Typically, the electron energy is 70 eV since, at this energy, it is possible to obtain stable mass spectra with a high degree of ionization and fragmentation of the molecule.
When bombarded with such a beam of energetic electrons, the gaseous substance loses its electron and becomes a molecular ion M+. EI is a hard ionization method, and in most cases, due to significant fluctuations in the electric field around the neutral molecule, the original molecular ion is shattered into fragments.
It is important to note that this fragmentation is reproducible between different experiments and instrumental solutions. High stability, reproducibility, and specificity of fragmentation spectra have allowed the creation of extensive repositories (FiehnLib GC-MS Library [129], Golm Metabolome Database [138], Mass Bank [139], National Institute of Standards and Technology (NIST) [140], METLIN [141], and several other sources) and re-use the deposited data for spectral identification.
In addition to electron ionization, chemical ionization (CI) can be used in GC-MS metabolomics. In CI, new ionized particles are formed when a gaseous molecule interacts not with electrons, as in EI, but with intermediate reactive ions bombarded by electrons. Chemical ionization can be divided into two subtypes, positive (PCI) and negative (NCI). During PCI, the reagent gas (methane, isobutane, ammonia) has a lower affinity for the proton than the analyzed molecules, and the proton is transferred from the reagent gas ions to the analyte molecules forming positively charged ions. In the classic NCI version, the reagent gas contains water due to ionization of which OH-anions are formed.
The GC-CI-MS platform made it possible to create a reproducible and sensitive method (up to 10 pg/mL) for the determination of trace amounts of testosterone and nandrolone esters in blood plasma, showing the linearity of the quantitation in the range of 100–2000 pg/mL [142]. PCI was used for the quantitative analysis of dimethylamine [143]. NCI-MS is also used for analyzing endogenous metabolites in human serum [144], for example, for the study of the PPB-derived eicosanoids in human serum [145].
During electron capture negative chemical ionization (ECNCI), the buffer gas slows down the electrons emitted by the heated filament, lowering their energy to ~2 eV. This option is well suited for molecules with high electron affinity (e.g., metabolites modified by pentafluoropropionyl [146]). Decelerated electrons are more easily captured by molecules, resulting in the formation of negatively charged ions.
Chemical ionization is considered a mild technique because it leads to less fragmentation and a greater chance of encountering an intact parent ion [147]. However, in metabolomics, CI is used less frequently than EI [148]. The lesser popularity may be explained because the metabolomic profile obtained using chemical ionization usually contains fewer identified compounds [149]. For example, in standard NIST SRM 1950 plasma, GC-EI-MS identified 263 metabolites, versus 93 using PCI and 65 using NCI [150]. In general, EI and CI technologies complement each other: EI provides structural information due to comprehensive fragmentation, and CI provides molecular weight information due to the careful preservation of parent ions.
A high pressure (10–150 mPa) is maintained in the ionization chamber at EI and CI, but ionization can effectively occur at atmospheric pressure as well. Thus, atmospheric pressure chemical ionization (APCI) on model mixtures shows results comparable to EI-MS [151]. Atmospheric pressure photoionization (APPI) also has potential in metabolomics, but primarily for targeted research, such as the analysis of polycyclic aromatic hydrocarbons (PAHs) [103]. Both methods are mild and, noteworthy, can also be used in liquid chromatography, so, if necessary, one mass analyzer can be easily connected to different chromatographic devices.
5.3.2. Mass Analyzers
The mass analyzer follows the ion source in the mass spectrometer design. Its task is to measure molecular ions’ mass-to-charge ratio (m/z) and their fragments created at the previous stage. The mass analyzer is followed by an electron multiplier, which, using a cascade of conversion dinoplates, multiplies the number of emission electrons and makes it possible to register an output current of several mA as an analytical signal [152].
GC-MS is a mature technology that uses various types of mass analyzers. The sample preparation carried out before the GC-MS analysis makes the metabolomic fraction of plasma and serum suitable to any mass analyzer, for which there are no design problems with pairing to a gas chromatography system. Further, we describe various mass analyzers (quadrupoles, ion traps, Orbitraps, Fourier transform ion cyclotron resonance mass analyzers, and time-of-flight mass analyzers) with references to relevant experimental projects.
Quadrupoles (Q) are the most common analyzers used in GC-MS. The quadrupole mass analyzer consists of four parallel cylindrical metal rods located in a vacuum chamber. An ion moves equidistantly from these electrodes. The magnetic field generated by Q allows only ions with a certain m/z to pass through. All other ions deviate from a straight path, not reaching the detector. Thus, only one type of ions with a specific m/z can reach the detector at a time, so the sample is analyzed sequentially by enumerating from the lowest to the highest m/z ratios. This analyzer is characterized by a wide dynamic range of determined concentrations, high sensitivity but relatively low resolution [12]. In addition, quadrupole mass analyzers have a low scan rate [153,154], which hampers the deconvolution of overlapping peaks. However, the quadrupole allows for reliable and fast metabolic profiling methods. For example, for the analysis of serum, a method was developed that was practically not inferior in quality to the longer methods. Another competitive advantage of such systems is their reliability and relatively low cost [55,56].
Often, such analyzers are stacked in tandems of three series-connected quadrupoles (QQQ), which allows you to create complex strategies for targeted metabolomic profiling. The first and third quadrupoles filter the ions passing through them by mass. The second quadrupole is a collision cell that is filled with gas. The operating mode of each quadrupole can be set separately, adjusting the technical performance under the pressure of the need. The mode assumes the passage of ions through the mass analyzer only with a specific pathogen m/z. The scanning mode assumes an alternate change in the m/z ratio, as a result of which it is possible to capture the spectrum of the entire mass range [155]. One of the options for using the QQQ scheme is the multiple reaction monitoring (MRM) of target metabolites [156]. For instance, using ultra-sensitive gas chromatography-tandem mass spectrometry diclofenac without preliminary derivatization was detected and quantified in blood samples, with a linearity range between 0.1–200 ng/mL, the limit of quantification of 0.1 ng/mL, and the limit of detection of 0.05 ng/mL [157].
Another low-resolution mass analyzer used in targeted metabolomics is the ion trap (IT) [158]. The main advantages of such devices are the elegance of design solutions and ease of operation. Using such a mass analyzer in combination with gas chromatography, it was possible to quantitatively measure the content of 17 steroids in blood plasma [159]. The disadvantages of low-resolution systems are primarily related to the difficulties in determining the structure of unknown compounds.
High-resolution detectors include time-of-flight mass analyzers (TOF), Fourier transform ion cyclotron resonance (FT-ICR) instruments, and Orbitraps. FT-ICRs and Orbitraps are also based on trapping ions, but their characteristics differ dramatically from quadrupole mass-analyzers. FT-ICR and Orbitraps provide the unbeaten mass resolution and accuracy of any other mass analyzer, even in routine analyses.
In Orbitrap mass analyzers, m/z ratios are estimated through the frequency of harmonic oscillations of the ions along the electric field axis. This type of trap provides high sensitivity and resolution (resolution up to 240,000 at m/z 400 [160]). The enormous capabilities of Orbitrap made it a solution-of-choice in proteomic research [161]; however, these mass analyzers are also widely used in metabolomics [150]. The already mentioned study of standard NIST 1950 plasma demonstrated the advantages of Orbitrap: it separated four times more peaks than the Q mass analyzer (41,588 vs. 8850) [162]. Although the Orbitrap acquisition speed is not fast enough for GC×GC, this mass analyzer performs effectively even in tandem with one-dimensional GC. Thus, in non-human primate serum, the GC×GC-TOF-MS option was able to identify 384 metabolites, while the GC-Orbitrap-MS identified 200 compounds [163].
Ion-cyclotron resonance mass analyzers claim to be the most accurate devices. FT-ICR separates ions by their rotational—cyclotron—frequency in the magnetic field, which is inversely proportional to the m/z. Fourier transformation is used to get and transform signals from these bouncing and rotating ions [164]. The high accuracy of this method makes it attractive in metabolomic studies [165], although it is achieved at the cost of expensive and bulky laboratory solutions. In general, in metabolomics, FT-ICR is used without preliminary chromatographic separation. However, a successful attempt to combine GC and FT-ICR has been made to analyze small molecules in gasoline samples [166]. FT-ICR coupled with high-performance LC was used to profile the endogenous metabolites in plasma of rats with pyrexia treated with different medicines [167].
The main disadvantage of FT-ICR is the slow speed of spectrum acquisition, up to minutes. The number of points over the chromatographic peak may be insufficient when FT-ICR is combined with modern fast chromatography systems [165]. Several metabolomic studies were performed by DI-MS, direct infusion of the sample into the FT-ICR mass spectrometer [168]. This method is suitable for a qualitative and quantitative metabolic analysis of human plasma. DI-FTICR-MS has demonstrated its effectiveness in rapid metabolic profiling. In a study of blood serum from 49 experimental animals, more than 400 metabolites were detected in about one day of analysis, which is much faster than mass spectrometric analysis with preliminary chromatographic separation [169].
Among high-resolution analyzers in metabolomics, TOF mass analyzers have a reputation for reliable and robust devices. TOF devices analyze how long it takes for ions with different m/z ratios but the same initial kinetic energy and constant accelerating voltage to cover a fixed distance. The smaller m/z is, the shorter time will be required to fly through a vacuum chamber.
Time-of-flight analyzers operate with a high scan rate, which allows obtaining sufficient points across the entire peak for better resolution of coeluting peaks. This makes TOF the only mass analyzer fully compatible with GC×GC, which requires a high scan rate [123].
The high resolution of two-dimensional chromatography with a time-of-flight mass analyzer is demonstrated in a study where more than 1000 metabolites were found in blood plasma [134].
Mass analyzers can be combined: so, in addition to the usual sequence of three quadrupole mass analyzers, the various hybrids of mass analyzers are used, e.g., Q-TOF [170] and Q-Orbitrap [171].
Table 2 presents a comparison of the essential characteristics of the most popular mass analyzers used for GC-MS analysis of serum and plasma. Indisputably, for estimation of the performance of a particular mass analyzer, one should consider the analyte and its matrix, the method of preliminary separation, ionization technique, and not only intrinsic characteristics of the device.
Table 2.
Comparison of popular mass analyzers used in plasma and serum metabolomics.
The desired “width” of metabolome analysis is also a critical factor in choosing the type of mass analyzers. For example, in panoramic experiments, TOF and Orbitrap analyzers are the most recommendable. In contrast, in targeted approaches, the background signal from a complex matrix is no longer a bottleneck, so triple quadrupoles and ion traps become preferable.
5.4. Data Processing
Metabolomics is a data-intensive scientific field. The raw data acquired by tandem chromatography with mass spectrometry are a complex three- (or even four in case of GC×GC) dimensional set of retention times, m/z values, and their intensities. Interpretation of results obtained in a GC-MS experiment is a delicate process. Each academic group independently chooses to use commercial or freely available software or even create customized scripts.
Commercial software is mature and user-friendly, usually with a developed graphical interface. The vendor supplies such packages along with the equipment, i.a. ChemStation by Agilent Technologies [172], MassLynx by Waters Corporation [173], ChromaTOF by Leco Corporation [174], Compound Discoverer by Thermo Scientific [175], etc. In accordance with text mining results, commercial software accounts for about 38% of computational solutions used for GC-MS data processing [176].
Conversion of the raw data to an open standard format such as mzML allows subsequent processing via vendor-independent software. The most remarkable example of public software is AMDIS [177]. For more than 20 years of its existence, AMDIS has been “enriched” with various extensions improving its operation [178,179]. In toxicological studies of serum samples, automatic evaluation of GC-MS data using AMDIS and its extensions Maurer/Pfleger/Weber identified additional drugs in 17% of samples that had been ignored by experienced personnel during manual data curation [180].
MetaboliteDetector [181], MetaboAnalyst [182], XCMS [183], metaMS [184], MetAlign [185], and MZmine [186] also are successful examples of public software for GC-MS data processing [187]. It is important to note that in data processing, there is a visible trend to shift to online platforms for data analysis, which opens up opportunities for data analysis with only internet access required. Special attention should be paid to the linkage between XCMS and MetaboAnalyst, which allows the researcher to perform a full cycle of metabolomic data analysis: from pre-processing to enrichment analysis, mapping the identified small molecules to metabolic pathways, etc.
Both public and commercial packages for GC-MS data processing perform primary preparation of raw files (noise smoothing, baseline correction, feature detection, alignment, normalization), library matching, visualization, and, optionally, downstream analysis (Figure 6).
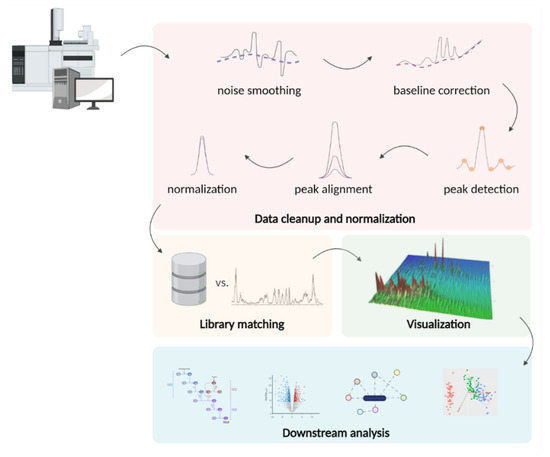
Figure 6.
Typical steps in the processing of GC-MS metabolomics data: noise filtering, baseline correction, peak detection, and normalization. The filtered data obtained after preliminary processing is compared with the spectral libraries. The resulting array of annotated spectra can be visualized and used in further statistical algorithms to build biological models.
After carrying out primary processing, allowing to organize the data and check their integrity, one can extract useful information from the cleaned dataset. The chemometric method for extracting such information involves identifying spectral patterns. These patterns can be compared with each other (for example, when analyzing the metabolome of healthy humans and diseased ones), and only then metabolites are identified. However, there are examples of successful barcoding, when characteristic peak patterns can be used to create a digital image of a person without directly identifying compounds [188].
An alternative approach is used in targeted experiments, in which metabolites are first identified, and the result of the identification is then interpreted. In general, the identification pipeline is carried out as follows: preliminary data processing is performed (subtraction of the baseline, marking of signals with an acceptable signal-to-noise ratio, mass spectral deconvolution, alignment, normalization, and calculation of retention indices [189,190] after which the obtained data are compared with the library data (mass spectra, RI).
Once metabolites are identified, downstream analysis can be performed to frame small molecules in terms of current omics knowledge. Multivariate analysis methods are used to extract meaningful information from large sets of experimental data. These methods can be divided into controlled (the data marked by the “supervisor”) and uncontrolled (no “supervisor” required). Principal component analysis, PCA, is the gold standard for interpreting high-dimensional complex datasets. In a multivariate dataset [191], PCA allows identifying class differences in an uncontrolled manner, without information about the class of samples under study. A class can refer to any relevant characteristic, such as diseased patients and healthy subjects [192].
Controlled methods include orthogonal projection to latent structures-discriminant analysis (OPLS-DA), a linear regression method. The original data set is pre-clustered into certain groups, so it is possible to identify the metabolites responsible for their differences. PCA is considered descriptive, and OPLS-DA is deemed to be predictive. In addition to those described above, there are many different chemometric methods of analysis [193].
In addition to standard approaches for statistical modeling, enrichment analysis [194] and network inference [195] methods are used to help integrate metabolomics data into multi-omics models. The development of deep learning (DL) technologies is anticipated in metabolomics. DL is used for peak alignment and annotation, identification, quantification of compounds, integration data with other omics disciplines to build multi-omics models [196,197]. Already, at the primary processing stage of raw data, using trained neural networks, it is possible to filter out up to 90% of false peaks from complex non-target data LC-MS sets without reducing true positive signals. [198]. In matters of building biological models, DL has not yet demonstrated a clear advantage over classical methods of analysis. However, in many studies, this approach showed decent results [196]. For example, comparing DL methods with classical statistical approaches in classification problems on ten clinical metabolic datasets, none of the DLs became the best, although they all showed good or excellent results [199].
There are several challenges in the processing of metabolomics data. On the one hand, the apparent simplicity of the operations performed hides a lack of transparency in data analysis processes because automated pipelines of data processing, in many cases, look like a “black box.” On the other hand, custom in-house solutions often fail to scale from one laboratory to another. Moreover, most of the peaks in the chromatography-mass spectrum remain unidentified even after extensive data processing.
According to some estimates, only 1.8% of the mass spectra are annotated [200], and all other spectra fall into the “dark metabolome” zone [201]. In this light, to increase the number of annotations, bioinformatics algorithms can be used to simulate mass spectra that are absent in libraries based on structural similarity with related compounds already detected by LC-MS/MS [202,203]. On the other side, the transition from direct identification of compounds in the metabolome to barcoding of m/z features looks especially promising [188].
6. Current Challenges and Prospects in Measuring Metabolites
Metabolomics stays at the nexus of chemistry, biology, data science, chemometrics, and bioinformatics. The challenges of metabolomics cannot be solved without crossing scientific boundaries. Therefore, a detailed study of the metabolome requires coordinated teamwork at all stages: from collecting samples to interpreting the obtained data.
Progress in metabolomics (and GC-MS-based metabolomics, in particular) is “fueled” by optimized strategies of sample preparations, numerous technological advances, initiatives on standardization, and collective efforts to generate and curate databases [204,205]. Thus, the Human Metabolome Project [206], which was launched in 2005, has united and streamlined the efforts of the world metabolic community to collect information about the “detectable” human metabolome, mediated by all the other “omics” processes in various states of the organism [207]. Today we are witnessing tremendous growth of HMDB. HMDB 5.0, released in 2021, contains information on more than 220 thousand metabolites, almost twice as much as in 2018 [47]. We believe that the reason for this is the popularization of large-scale omics research “beyond genomics” [208]. The trend of shifting from genome-wide association studies (GWAS) to metabolome-wide association studies (MWAS) has been gaining momentum since 2008. The results of consolidation of several omics layers appear more and more often [209,210,211,212,213].
Metabolomics quickly responds to public challenges: over 200 publications on COVID-19 metabolomics appeared in less than two years [214,215,216]. The spectrum of application of metabolic knowledge solo or as a part of multi-omics is broad: from microbial stains engineering [217] to precise and personalized health monitoring [218,219,220,221].
Unfortunately, clinical metabolic tests are not registered yet [222]. Nevertheless, there are clear signs of the potential of integration of metabolomics into the clinical space [223], which is hampered by insufficiently effective design of data acquisition and (re-)processing [187,224], imperfect standard operating procedures [225], lack of adequate quality controls [69] and unrepresentative samples collections [226].
From a technical point of view, we believe that for comprehensive and rapid metabolomics, the improvements in the system of separation of complex biological mixtures are the most anticipated and promising since the progress of mass spectrometry alone is unlikely to change our understanding of the metabolome qualitatively. As in proteomics, to provide comprehensive coverage of the metabolome requires a shift to multidimensional chromatography techniques, providing state-of-the-art separation [227].
Beyond instrumental challenges, a series of improvements are required to translate metabolomics in routine medical practice, which is not conceivable without extensive population-wide studies explaining how metabolome interacts with phenotype and health status [31].
If these obstacles are overcome, metabolomics tools have tremendous potential to provide solutions for precision medicine and life sciences research. Already today, there are entire platforms of the complete cycle (for example, Metabolon [228]), within the framework of which the design of the experiment, its implementation, and processing of the obtained data are carried out.
Due to their circulating nature, liquid blood components -plasma and serum- are excellent matrices for metabolomic studies [33]. However, the diverse chemistry and wide dynamic range of blood metabolites require digging deeper and developing tailored analytical techniques to provide proper metabolome coverage. We believe that synergy of advanced analytical tools [229], interdisciplinary researches [230], and standardization efforts [225], will increase the rate of integration of blood metabolomics discoveries into practice, providing health professionals, system biologists, data scientists, engineers, and analytical chemists the opportunity to advance their respective industries.
Supplementary Materials
The following supporting information can be downloaded at: https://www.mdpi.com/article/10.3390/metabo12010015/s1, Supplementary Material S1, presenting the distribution of physical-chemical properties of blood metabolites deposited in HMDB 5.0.
Author Contributions
Conceptualization, O.K. and I.K.; data curation, E.I.; writing—original draft preparation, O.K. and I.K.; visualization, O.K.; project administration and funding acquisition, E.P. All authors have read and agreed to the published version of the manuscript.
Funding
This research was funded by the Ministry of Science and Higher Education of the Russian Federation within the framework of state support for the creation and development of World-Class Research Centers “Digital biodesign and personalized healthcare” No. 75-15-2020-91.
Acknowledgments
The authors would like to express the deepest gratitude to Alexander Revelsky, Ivan Kargov, and Dmitry Rakov for their continuous support.
Conflicts of Interest
The authors declare no conflict of interest. The funders had no role in the design of the study; in the collection, analyses, or interpretation of data; in the writing of the manuscript, or in the decision to publish the results.
References
- Goodacre, R. Metabolomics of a superorganism. J. Nutr. 2007, 137, 259S–266S. [Google Scholar] [CrossRef]
- Kim, S.J.; Kim, S.H.; Kim, J.H.; Hwang, S.; Yoo, H.J. Understanding Metabolomics in Biomedical Research. Endocrinol. Metab. 2016, 31, 7. [Google Scholar] [CrossRef]
- Ponomarenko, E.A.; Poverennaya, E.V.; Ilgisonis, E.V.; Pyatnitskiy, M.A.; Kopylov, A.T.; Zgoda, V.G.; Lisitsa, A.V.; Archakov, A.I. The Size of the Human Proteome: The Width and Depth. Int. J. Anal. Chem. 2016, 2016, 7436849. [Google Scholar] [CrossRef] [PubMed]
- Schrimpe-Rutledge, A.C.; Codreanu, S.G.; Sherrod, S.D.; McLean, J.A. Untargeted Metabolomics Strategies—Challenges and Emerging Directions. J. Am. Soc. Mass Spectrom. 2016, 27, 1897–1905. [Google Scholar] [CrossRef] [PubMed]
- Wishart, D.S. Metabolomics for Investigating Physiological and Pathophysiological Processes. Physiol. Rev. 2019, 99, 1819–1875. [Google Scholar] [CrossRef] [PubMed]
- Johnson, C.H.; Ivanisevic, J.; Siuzdak, G. Metabolomics: Beyond biomarkers and towards mechanisms. Nat. Rev. Mol. Cell Biol. 2016, 17, 451–459. [Google Scholar] [CrossRef]
- Wishart, D.S. Emerging applications of metabolomics in drug discovery and precision medicine. Nat. Rev. Drug Discov. 2016, 15, 473–484. [Google Scholar] [CrossRef]
- Guasch-Ferre, M.; Bhupathiraju, S.N.; Hu, F.B. Use of Metabolomics in Improving Assessment of Dietary Intake. Clin. Chem. 2018, 64, 82–98. [Google Scholar] [CrossRef]
- Li, J.; Guasch-Ferré, M.; Chung, W.; Ruiz-Canela, M.; Toledo, E.; Corella, D.; Bhupathiraju, S.N.; Tobias, D.K.; Tabung, F.K.; Hu, J.; et al. The Mediterranean diet, plasma metabolome, and cardiovascular disease risk. Eur. Heart J. 2020, 41, 2645–2656. [Google Scholar] [CrossRef]
- Jacob, M.; Lopata, A.L.; Dasouki, M.; Abdel Rahman, A.M. Metabolomics toward personalized medicine. Mass Spectrom. Rev. 2019, 38, 221–238. [Google Scholar] [CrossRef]
- Heaney, L.M.; Deighton, K.; Suzuki, T. Non-targeted metabolomics in sport and exercise science. J. Sports Sci. 2019, 37, 959–967. [Google Scholar] [CrossRef]
- Beale, D.J.; Pinu, F.R.; Kouremenos, K.A.; Poojary, M.M.; Narayana, V.K.; Boughton, B.A.; Kanojia, K.; Dayalan, S.; Jones, O.A.H.; Dias, D.A. Review of recent developments in GC-MS approaches to metabolomics-based research. Metabolomics 2018, 14, 152. [Google Scholar] [CrossRef] [PubMed]
- Lima-Oliveira, G.; Monneret, D.; Guerber, F.; Guidi, G.C. Sample management for clinical biochemistry assays: Are serum and plasma interchangeable specimens? Crit. Rev. Clin. Lab. Sci. 2018, 55, 480–500. [Google Scholar] [CrossRef]
- Yasumoto, A.; Tokuoka, S.M.; Kita, Y.; Shimizu, T.; Yatomi, Y. Multiplex quantitative analysis of eicosanoid mediators in human plasma and serum: Possible introduction into clinical testing. J. Chromatogr. B 2017, 1068–1069, 98–104. [Google Scholar] [CrossRef] [PubMed]
- Manzoni, C.; Kia, D.A.; Vandrovcova, J.; Hardy, J.; Wood, N.W.; Lewis, P.A.; Ferrari, R. Genome, transcriptome and proteome: The rise of omics data and their integration in biomedical sciences. Brief. Bioinform. 2018, 19, 286–302. [Google Scholar] [CrossRef] [PubMed]
- Kell, D.B.; Brown, M.; Davey, H.M.; Dunn, W.B.; Spasic, I.; Oliver, S.G. Metabolic footprinting and systems biology: The medium is the message. Nat. Rev. Microbiol. 2005, 3, 557–565. [Google Scholar] [CrossRef]
- Shah, N.J.; Sureshkumar, S.; Shewade, D.G. Metabolomics: A Tool Ahead for Understanding Molecular Mechanisms of Drugs and Diseases. Indian J. Clin. Biochem. 2015, 30, 247–254. [Google Scholar] [CrossRef]
- Mitro, S.D.; Wu, J.; Rahman, M.L.; Cao, Y.; Zhu, Y.; Chen, Z.; Chen, L.; Li, M.; Hinkle, S.N.; Bremer, A.A.; et al. Longitudinal Plasma Metabolomics Profile in Pregnancy-A Study in an Ethnically Diverse U.S. Pregnancy Cohort. Nutrients 2021, 13, 3080. [Google Scholar] [CrossRef]
- Harville, E.W.; Li, Y.Y.; Pan, K.; McRitchie, S.; Pathmasiri, W.; Sumner, S. Untargeted analysis of first trimester serum to reveal biomarkers of pregnancy complications: A case–control discovery phase study. Sci. Rep. 2021, 11, 3468. [Google Scholar] [CrossRef]
- Darst, B.F.; Koscik, R.L.; Hogan, K.J.; Johnson, S.C.; Engelman, C.D. Longitudinal plasma metabolomics of aging and sex. Aging 2019, 11, 1262–1282. [Google Scholar] [CrossRef]
- Thompson, D.S.; Bourdon, C.; Massara, P.; Boyne, M.S.; Forrester, T.E.; Gonzales, G.B.; Bandsma, R.H.J. Childhood severe acute malnutrition is associated with metabolic changes in adulthood. JCI Insight 2020, 5, e141316. [Google Scholar] [CrossRef] [PubMed]
- Aderemi, A.V.; Ayeleso, A.O.; Oyedapo, O.O.; Mukwevho, E. Metabolomics: A Scoping Review of Its Role as a Tool for Disease Biomarker Discovery in Selected Non-Communicable Diseases. Metabolites 2021, 11, 418. [Google Scholar] [CrossRef] [PubMed]
- Sindelar, M.; Stancliffe, E.; Schwaiger-Haber, M.; Anbukumar, D.S.; Adkins-Travis, K.; Goss, C.W.; O’Halloran, J.A.; Mudd, P.A.; Liu, W.C.; Albrecht, R.A.; et al. Longitudinal metabolomics of human plasma reveals prognostic markers of COVID-19 disease severity. Cell Rep. Med. 2021, 2, 100369. [Google Scholar] [CrossRef] [PubMed]
- Kumar, N.; Shahjaman, M.; Mollah, M.N.H.; Islam, S.M.S.; Hoque, M.A. Serum and Plasma Metabolomic Biomarkers for Lung Cancer. Bioinformation 2017, 13, 202–208. [Google Scholar] [CrossRef] [PubMed]
- Wang, T.; Xu, C.; Xu, S.; Gao, L.; Blaženović, I.; Ji, J.; Wang, J.; Sun, X. Untargeted metabolomics analysis by gas chromatography/time-of-flight mass spectrometry of human serum from methamphetamine abusers. Addict. Biol. 2021, 26, e13062. [Google Scholar] [CrossRef]
- Paris, A.; Labrador, B.; Lejeune, F.X.; Canlet, C.; Molina, J.; Guinot, M.; Mégret, A.; Rieu, M.; Thalabard, J.C.; Le Bouc, Y. Metabolomic signatures in elite cyclists: Differential characterization of a seeming normal endocrine status regarding three serum hormones. Metabolomics 2021, 17, 67. [Google Scholar] [CrossRef]
- Tebani, A.; Bekri, S. Paving the Way to Precision Nutrition Through Metabolomics. Front. Nutr. 2019, 6, 41. [Google Scholar] [CrossRef]
- Rafiq, T.; Azab, S.M.; Teo, K.K.; Thabane, L.; Anand, S.S.; Morrison, K.M.; de Souza, R.J.; Britz-McKibbin, P. Nutritional Metabolomics and the Classification of Dietary Biomarker Candidates: A Critical Review. Adv. Nutr. 2021, 12, 2333–2357. [Google Scholar] [CrossRef]
- Stekovic, S.; Hofer, S.J.; Tripolt, N.; Aon, M.A.; Royer, P.; Pein, L.; Stadler, J.T.; Pendl, T.; Prietl, B.; Url, J.; et al. Alternate Day Fasting Improves Physiological and Molecular Markers of Aging in Healthy, Non-obese Humans. Cell Metab. 2019, 30, 462–476.e5. [Google Scholar] [CrossRef]
- Tenori, L.; Oakman, C.; Claudino, W.M.; Bernini, P.; Cappadona, S.; Nepi, S.; Biganzoli, L.; Arbushites, M.C.; Luchinat, C.; Bertini, I.; et al. Exploration of serum metabolomic profiles and outcomes in women with metastatic breast cancer: A pilot study. Mol. Oncol. 2012, 6, 437–444. [Google Scholar] [CrossRef]
- Misra, B. Individualized metabolomics: Opportunities and challenges. Clin. Chem. Lab. Med. 2020, 58, 939–947. [Google Scholar] [CrossRef] [PubMed]
- Bar, N.; Korem, T.; Weissbrod, O.; Zeevi, D.; Rothschild, D.; Leviatan, S.; Kosower, N.; Lotan-Pompan, M.; Weinberger, A.; Le Roy, C.I.; et al. A reference map of potential determinants for the human serum metabolome. Nature 2020, 588, 135–140. [Google Scholar] [CrossRef] [PubMed]
- Dunn, W.B.; Lin, W.; Broadhurst, D.; Begley, P.; Brown, M.; Zelena, E.; Vaughan, A.A.; Halsall, A.; Harding, N.; Knowles, J.D.; et al. Molecular phenotyping of a UK population: Defining the human serum metabolome. Metabolomics 2015, 11, 9–26. [Google Scholar] [CrossRef]
- Sethi, S.; Hayashi, M.A.F.; Barbosa, B.S.; Pontes, J.G.M.; Tasic, L.; Brietzke, E. Metabolomics: From Fundamentals to Clinical Applications; Advances in Experimental Medicine and Biology; Springer: Cham, Switzerland, 2017; Volume 965, ISBN 978-3-319-47655-1. [Google Scholar]
- Ossola, R.; Schiess, R.; Picotti, P.; Rinner, O.; Reiter, L.; Aebersold, R. Biomarker validation in blood specimens by selected reaction monitoring mass spectrometry of N-glycosites. Methods Mol. Biol. 2011, 728, 179–194. [Google Scholar] [CrossRef] [PubMed]
- Plebani, M.; Banfi, G.; Bernardini, S.; Bondanini, F.; Conti, L.; Dorizzi, R.; Ferrara, F.E.; Mancini, R.; Trenti, T. Serum or plasma? An old question looking for new answers. Clin. Chem. Lab. Med. 2020, 58, 178–187. [Google Scholar] [CrossRef] [PubMed]
- Tuck, M.K.; Chan, D.W.; Chia, D.; Godwin, A.K.; Grizzle, W.E.; Krueger, K.E.; Rom, W.; Sanda, M.; Sorbara, L.; Stass, S.; et al. Standard Operating Procedures for Serum and Plasma Collection: Early Detection Research Network Consensus Statement Standard Operating Procedure Integration Working Group. J. Proteome Res. 2010, 8, 113–117. [Google Scholar] [CrossRef]
- Wedge, D.C.; Allwood, J.W.; Dunn, W.; Vaughan, A.A.; Simpson, K.; Brown, M.; Priest, L.; Blackhall, F.H.; Whetton, A.D.; Dive, C.; et al. Is serum or plasma more appropriate for intersubject comparisons in metabolomic studies? An assessment in patients with small-cell lung cancer. Anal. Chem. 2011, 83, 6689–6697. [Google Scholar] [CrossRef]
- Liu, X.; Hoene, M.; Wang, X.; Yin, P.; Häring, H.U.; Xu, G.; Lehmann, R. Serum or plasma, what is the difference? Investigations to facilitate the sample material selection decision making process for metabolomics studies and beyond. Anal. Chim. Acta 2018, 1037, 293–300. [Google Scholar] [CrossRef]
- Dettmer, K.; Almstetter, M.F.; Appel, I.J.; Nürnberger, N.; Schlamberger, G.; Gronwald, W.; Meyer, H.H.D.; Oefner, P.J. Comparison of serum versus plasma collection in gas chromatography—Mass spectrometry-based metabolomics. Electrophoresis 2010, 31, 2365–2373. [Google Scholar] [CrossRef]
- Kaluarachchi, M.; Boulangé, C.L.; Karaman, I.; Lindon, J.C.; Ebbels, T.M.D.; Elliott, P.; Tracy, R.P.; Olson, N.C. A comparison of human serum and plasma metabolites using untargeted 1 H NMR spectroscopy and UPLC-MS. Metabolomics 2018, 14, 32. [Google Scholar] [CrossRef]
- Sotelo-Orozco, J.; Chen, S.Y.; Hertz-Picciotto, I.; Slupsky, C.M. A Comparison of Serum and Plasma Blood Collection Tubes for the Integration of Epidemiological and Metabolomics Data. Front. Mol. Biosci. 2021, 8, 650. [Google Scholar] [CrossRef]
- Sandlers, Y. Amino Acids Profiling for the Diagnosis of Metabolic Disorders. In Biochemical Testing—Clinical Correlation and Diagnosis; InTech Open: London, UK, 2019. [Google Scholar] [CrossRef]
- Psychogios, N.; Hau, D.D.; Peng, J.; Guo, A.C.; Mandal, R.; Bouatra, S.; Sinelnikov, I.; Krishnamurthy, R.; Eisner, R.; Gautam, B.; et al. The Human Serum Metabolome. PLoS ONE 2011, 6, e16957. [Google Scholar] [CrossRef]
- Yu, Z.; Kastenmüller, G.; He, Y.; Belcredi, P.; Möller, G.; Prehn, C.; Mendes, J.; Wahl, S.; Roemisch-Margl, W.; Ceglarek, U.; et al. Differences between human plasma and serum metabolite profiles. PLoS ONE 2011, 6, e21230. [Google Scholar] [CrossRef] [PubMed]
- Peironcely, J.E.; Reijmers, T.; Coulier, L.; Bender, A.; Hankemeier, T. Understanding and classifying metabolite space and metabolite-likeness. PLoS ONE 2011, 6, e28966. [Google Scholar] [CrossRef] [PubMed]
- Wishart, D.S.; Feunang, Y.D.; Marcu, A.; Guo, A.C.; Liang, K.; Vázquez-Fresno, R.; Sajed, T.; Johnson, D.; Li, C.; Karu, N.; et al. HMDB 4.0: The human metabolome database for 2018. Nucleic Acids Res. 2018, 46, D608–D617. [Google Scholar] [CrossRef] [PubMed]
- Harayama, T.; Riezman, H. Understanding the diversity of membrane lipid composition. Nat. Rev. Mol. Cell Biol. 2018, 19, 281–296. [Google Scholar] [CrossRef]
- Züllig, T.; Trötzmüller, M.; Köfeler, H.C. Lipidomics from sample preparation to data analysis: A primer. Anal. Bioanal. Chem. 2020, 412, 2191–2209. [Google Scholar] [CrossRef]
- Quehenberger, O.; Dennis, E.A. The human plasma lipidome. N. Engl. J. Med. 2011, 365, 1812–1823. [Google Scholar] [CrossRef]
- O’Donnell, V.B.; Ekroos, K.; Liebisch, G.; Wakelam, M. Lipidomics: Current state of the art in a fast moving field. Wiley Interdiscip. Rev. Syst. Biol. Med. 2020, 12, e1466. [Google Scholar] [CrossRef]
- Aebersold, R.; Agar, J.N.; Amster, I.J.; Baker, M.S.; Bertozzi, C.R.; Boja, E.S.; Costello, C.E.; Cravatt, B.F.; Fenselau, C.; Garcia, B.A.; et al. How many human proteoforms are there? Nat. Chem. Biol. 2018, 14, 206–214. [Google Scholar] [CrossRef]
- Giraudeau, P. NMR-based metabolomics and fluxomics: Developments and future prospects. Analyst 2020, 145, 2457–2472. [Google Scholar] [CrossRef]
- Kirwan, J.A.; Broadhurst, D.I.; Davidson, R.L.; Viant, M.R. Characterising and correcting batch variation in an automated direct infusion mass spectrometry (DIMS) metabolomics workflow. Anal. Bioanal. Chem. 2013, 405, 5147–5157. [Google Scholar] [CrossRef]
- Wang, Y.; Zhou, L.; Zhou, Y.; Zhao, C.; Lu, X.; Xu, G. A rapid GC method coupled with quadrupole or time of flight mass spectrometry for metabolomics analysis. J. Chromatogr. B Analyt. Technol. Biomed. Life Sci. 2020, 1160, 122355. [Google Scholar] [CrossRef]
- Fiehn, O. Metabolomics by Gas Chromatography-Mass Spectrometry: Combined Targeted and Untargeted Profiling. Curr. Protoc. Mol. Biol. 2016, 114, 30.4.1–30.4.32. [Google Scholar] [CrossRef]
- Gika, H.; Virgiliou, C.; Theodoridis, G.; Plumb, R.S.; Wilson, I.D. Untargeted LC/MS-based metabolic phenotyping (metabonomics/metabolomics): The state of the art. J. Chromatogr. B 2019, 1117, 136–147. [Google Scholar] [CrossRef]
- Beckonert, O.; Keun, H.C.; Ebbels, T.M.D.; Bundy, J.; Holmes, E.; Lindon, J.C.; Nicholson, J.K. Metabolic profiling, metabolomic and metabonomic procedures for NMR spectroscopy of urine, plasma, serum and tissue extracts. Nat. Protoc. 2007, 2, 2692–2703. [Google Scholar] [CrossRef] [PubMed]
- Emwas, A.H.; Roy, R.; McKay, R.T.; Tenori, L.; Saccenti, E.; Nagana Gowda, G.A.; Raftery, D.; Alahmari, F.; Jaremko, L.; Jaremko, M.; et al. NMR Spectroscopy for Metabolomics Research. Metabolites 2019, 9, 123. [Google Scholar] [CrossRef]
- Martias, C.; Baroukh, N.; Mavel, S.; Blasco, H.; Lefèvre, A.; Roch, L.; Montigny, F.; Gatien, J.; Schibler, L.; Dufour-Rainfray, D.; et al. Optimization of Sample Preparation for Metabolomics Exploration of Urine, Feces, Blood and Saliva in Humans Using Combined NMR and UHPLC-HRMS Platforms. Molecules 2021, 26, 4111. [Google Scholar] [CrossRef] [PubMed]
- Nagana Gowda, G.A.; Raftery, D. Can NMR solve some significant challenges in metabolomics? J. Magn. Reson. 2015, 260, 144. [Google Scholar] [CrossRef] [PubMed]
- Emwas, A.H.M. The strengths and weaknesses of NMR spectroscopy and mass spectrometry with particular focus on metabolomics research. Methods Mol. Biol. 2015, 1277, 161–193. [Google Scholar] [CrossRef]
- Wang, Y.; Liu, S.; Hu, Y.; Li, P.; Wan, J.B. Current state of the art of mass spectrometry-based metabolomics studies—A review focusing on wide coverage, high throughput and easy identification. RSC Adv. 2015, 5, 78728–78737. [Google Scholar] [CrossRef]
- Zeki, Ö.C.; Eylem, C.C.; Reçber, T.; Kır, S.; Nemutlu, E. Integration of GC-MS and LC-MS for untargeted metabolomics profiling. J. Pharm. Biomed. Anal. 2020, 190, 113509. [Google Scholar] [CrossRef] [PubMed]
- Higgins Keppler, E.A.; Jenkins, C.L.; Davis, T.J.; Bean, H.D. Advances in the application of comprehensive two-dimensional gas chromatography in metabolomics. TrAC—Trends Anal. Chem. 2018, 109, 275–286. [Google Scholar] [CrossRef] [PubMed]
- Moros, G.; Chatziioannou, A.C.; Gika, H.G.; Raikos, N.; Theodoridis, G. Investigation of the derivatization conditions for GC-MS metabolomics of biological samples. Bioanalysis 2017, 9, 53–65. [Google Scholar] [CrossRef]
- Wu, Z.; Shon, J.C.; Liu, K.-H. Mass Spectrometry-based Lipidomics and Its Application to Biomedical Research. J. Lifestyle Med. 2014, 4, 17–33. [Google Scholar] [CrossRef] [PubMed]
- Chetwynd, A.J.; Dunn, W.B.; Rodriguez-Blanco, G.; Chetwynd, A.J.; Dunn, W.B.; Rodriguez-Blanco, G. Collection and Preparation of Clinical Samples for Metabolomics. Adv. Exp. Med. Biol. 2017, 965, 19–44. [Google Scholar] [CrossRef]
- Lu, W.; Su, X.; Klein, M.S.; Lewis, I.A.; Fiehn, O.; Rabinowitz, J.D. Metabolite Measurement: Pitfalls to Avoid and Practices to Follow. Annu. Rev. Biochem. 2017, 86, 277–304. [Google Scholar] [CrossRef]
- Hernández Bort, J.A.; Shanmukam, V.; Pabst, M.; Windwarder, M.; Neumann, L.; Alchalabi, A.; Krebiehl, G.; Koellensperger, G.; Hann, S.; Sonntag, D.; et al. Reduced quenching and extraction time for mammalian cells using filtration and syringe extraction. J. Biotechnol. 2014, 182–183, 97–103. [Google Scholar] [CrossRef]
- Castro-Perez, J.; Prakash, C. Recent advances in mass spectrometric and other analytical techniques for the identification of drug metabolites. In Identification and Quantification of Drugs, Metabolites, Drug Metabolizing Enzymes, and Transporters; Elsevier: Amsterdam, The Netherlands, 2020; pp. 39–71. [Google Scholar] [CrossRef]
- Jiye, A.; Trygg, J.; Gullberg, J.; Johansson, A.I.; Jonsson, P.; Antti, H.; Marklund, S.L.; Moritz, T. Extraction and GC/MS analysis of the human blood plasma metabolome. Anal. Chem. 2005, 77, 8086–8094. [Google Scholar] [CrossRef]
- Want, E.J.; O’Maille, G.; Smith, C.A.; Brandon, T.R.; Uritboonthai, W.; Qin, C.; Trauger, S.A.; Siuzdak, G. Solvent-dependent metabolite distribution, clustering, and protein extraction for serum profiling with mass spectrometry. Anal. Chem. 2006, 78, 743–752. [Google Scholar] [CrossRef]
- Wawrzyniak, R.; Kosnowska, A.; Macioszek, S.; Bartoszewski, R.; Markuszewski, M.J. New plasma preparation approach to enrich metabolome coverage in untargeted metabolomics: Plasma protein bound hydrophobic metabolite release with proteinase K. Sci. Rep. 2018, 8, 9541. [Google Scholar] [CrossRef] [PubMed]
- Yang, Y.; Cruickshank, C.; Armstrong, M.; Mahaffey, S.; Reisdorph, R.; Reisdorph, N. New sample preparation approach for mass spectrometry-based profiling of plasma results in improved coverage of metabolome. J. Chromatogr. A 2013, 1300, 217–226. [Google Scholar] [CrossRef]
- Lelli, V.; Belardo, A.; Timperio, A.M. From Targeted Quantification to Untargeted Metabolomics. In Metabolomics—Methodology and Applications in Medical Sciences and Life Sciences; InTech Open: London, UK, 2021. [Google Scholar] [CrossRef]
- He, Z.; Liu, Z.; Gong, L. Systematic evaluation of sample preparation strategy for GC-MS-based plasma metabolomics and its application in osteoarthritis. Anal. Biochem. 2021, 621, 114153. [Google Scholar] [CrossRef] [PubMed]
- Qiu, Y.; Reed, D. Gas Chromatography in Metabolomics Study. In Advances in Gas Chromatography; InTech Open: London, UK, 2014. [Google Scholar] [CrossRef]
- Liu, Y.; Chen, T.; Qiu, Y.; Cheng, Y.; Cao, Y.; Zhao, A.; Jia, W. An ultrasonication-assisted extraction and derivatization protocol for GC/TOFMS-based metabolite profiling. Anal. Bioanal. Chem. 2011, 400, 1405–1417. [Google Scholar] [CrossRef] [PubMed]
- Sana, T.; Fischer, S. Maximizing Metabolite Extraction for Comprehensive Metabolomics Studies of Erythrocytes. Available online: https://www.agilent.com/cs/library/applications/5989-7407EN.pdf (accessed on 23 November 2021).
- Tulipani, S.; Llorach, R.; Urpi-Sarda, M.; Andres-Lacueva, C. Comparative analysis of sample preparation methods to handle the complexity of the blood fluid metabolome: When less is more. Anal. Chem. 2013, 85, 341–348. [Google Scholar] [CrossRef]
- Sitnikov, D.G.; Monnin, C.S.; Vuckovic, D. Systematic Assessment of Seven Solvent and Solid-Phase Extraction Methods for Metabolomics Analysis of Human Plasma by LC-MS. Sci. Rep. 2016, 6, 38885. [Google Scholar] [CrossRef]
- Michopoulos, F.; Lai, L.; Gika, H.; Theodoridis, G.; Wilson, I. UPLC-MS-Based Analysis of Human Plasma for Metabonomics Using Solvent Precipitation or Solid Phase Extraction. J. Proteome Res. 2009, 8, 2114–2121. [Google Scholar] [CrossRef]
- Rico, E.; González, O.; Blanco, M.E.; Alonso, R.M. Evaluation of human plasma sample preparation protocols for untargeted metabolic profiles analyzed by UHPLC-ESI-TOF-MS. Anal. Bioanal. Chem. 2014, 406, 7641–7652. [Google Scholar] [CrossRef]
- Bojko, B.; Reyes-Garcés, N.; Bessonneau, V.; Goryński, K.; Mousavi, F.; Souza Silva, E.A.; Pawliszyn, J. Solid-phase microextraction in metabolomics. TrAC—Trends Anal. Chem. 2014, 61, 168–180. [Google Scholar] [CrossRef]
- Musharraf, S.G.; Mazhar, S.; Siddiqui, A.J.; Choudhary, M.I. Metabolite profiling of human plasma by different extraction methods through gas chromatography–mass spectrometry—An objective comparison. Anal. Chim. Acta 2013, 804, 180–189. [Google Scholar] [CrossRef]
- Caldeira, M.; Barros, A.S.; Bilelo, M.J.; Parada, A.; Câmara, J.S.; Rocha, S.M. Profiling allergic asthma volatile metabolic patterns using a headspace-solid phase microextraction/gas chromatography based methodology. J. Chromatogr. A 2011, 1218, 3771–3780. [Google Scholar] [CrossRef] [PubMed]
- Zhang, S.; Raftery, D. Headspace SPME-GC-MS Metabolomics Analysis of Urinary Volatile Organic Compounds (VOCs). Methods Mol. Biol. 2014, 1198, 265–272. [Google Scholar] [CrossRef] [PubMed]
- Rocha, S.M.; Caldeira, M.; Carrola, J.; Santos, M.; Cruz, N.; Duarte, I.F. Exploring the human urine metabolomic potentialities by comprehensive two-dimensional gas chromatography coupled to time of flight mass spectrometry. J. Chromatogr. A 2012, 1252, 155–163. [Google Scholar] [CrossRef] [PubMed]
- Dixon, E.; Clubb, C.; Pittman, S.; Ammann, L.; Rasheed, Z.; Kazmi, N.; Keshavarzian, A.; Gillevet, P.; Rangwala, H.; Couch, R.D. Solid-Phase Microextraction and the Human Fecal VOC Metabolome. PLoS ONE 2011, 6, e18471. [Google Scholar] [CrossRef]
- De Fátima Alpendurada, M. Solid-phase microextraction: A promising technique for sample preparation in environmental analysis. J. Chromatogr. A 2000, 889, 3–14. [Google Scholar] [CrossRef]
- Silva, C.L.; Passos, M.; Câmara, J.S. Solid phase microextraction, mass spectrometry and metabolomic approaches for detection of potential urinary cancer biomarkers--a powerful strategy for breast cancer diagnosis. Talanta 2012, 89, 360–368. [Google Scholar] [CrossRef]
- Silva, C.L.; Passos, M.; Cmara, J.S. Investigation of urinary volatile organic metabolites as potential cancer biomarkers by solid-phase microextraction in combination with gas chromatography-mass spectrometry. Br. J. Cancer 2011, 105, 1894–1904. [Google Scholar] [CrossRef]
- Halket, J.M.; Zaikin, V.G. Derivatization in Mass Spectrometry—7. On-Line Derivatization/Degradation. Eur. J. Mass Spectr. 2017, 12, 1–13. [Google Scholar] [CrossRef]
- Kanani, H.; Chrysanthopoulos, P.K.; Klapa, M.I. Standardizing GC-MS metabolomics. J. Chromatogr. B Analyt. Technol. Biomed. Life Sci. 2008, 871, 191–201. [Google Scholar] [CrossRef]
- Adebo, O.A.; Oyeyinka, S.A.; Adebiyi, J.A.; Feng, X.; Wilkin, J.D.; Kewuyemi, Y.O.; Abrahams, A.M.; Tugizimana, F. Application of gas chromatography–mass spectrometry (GC-MS)-based metabolomics for the study of fermented cereal and legume foods: A review. Int. J. Food Sci. Technol. 2021, 56, 1514–1534. [Google Scholar] [CrossRef]
- Orata, F. Derivatization Reactions and Reagents for Gas Chromatography Analysis. In Advanced Gas Chromatography—Progress in Agricultural, Biomedical and Industrial Applications; InTech: Rijeka, Croatia, 2012. [Google Scholar] [CrossRef]
- Schummer, C.; Delhomme, O.; Appenzeller, B.M.R.; Wennig, R.; Millet, M. Comparison of MTBSTFA and BSTFA in derivatization reactions of polar compounds prior to GC/MS analysis. Talanta 2009, 77, 1473–1482. [Google Scholar] [CrossRef] [PubMed]
- Ruiz-Matute, A.I.; Hernández-Hernández, O.; Rodríguez-Sánchez, S.; Sanz, M.L.; Martínez-Castro, I. Derivatization of carbohydrates for GC and GC-MS analyses. J. Chromatogr. B Analyt. Technol. Biomed. Life Sci. 2011, 879, 1226–1240. [Google Scholar] [CrossRef] [PubMed]
- Moldoveanu, S.C.; David, V. Derivatization Methods in GC and GC/MS. In Gas Chromatography—Derivatization, Sample Preparation, Application; InTech Open: London, UK, 2018. [Google Scholar] [CrossRef]
- Little, J.L. Artifacts in trimethylsilyl derivatization reactions and ways to avoid them. J. Chromatogr. A 1999, 844, 1–22. [Google Scholar] [CrossRef]
- Gullberg, J.; Jonsson, P.; Nordström, A.; Sjöström, M.; Moritz, T. Design of experiments: An efficient strategy to identify factors influencing extraction and derivatization of Arabidopsis thaliana samples in metabolomic studies with gas chromatography/mass spectrometry. Anal. Biochem. 2004, 331, 283–295. [Google Scholar] [CrossRef] [PubMed]
- Jiang, B.; Liang, Y.; Xu, C.; Zhang, J.; Hu, M.; Shi, Q. Polycyclic aromatic hydrocarbons (PAHs) in ambient aerosols from Beijing: Characterization of low volatile pahs by positive-ion atmospheric pressure photoionization (APPI) coupled with fourier transform ion cyclotron resonance. Environ. Sci. Technol. 2014, 48, 4716–4723. [Google Scholar] [CrossRef]
- Miyagawa, H.; Bamba, T. Comparison of sequential derivatization with concurrent methods for GC/MS-based metabolomics. J. Biosci. Bioeng. 2019, 127, 160–168. [Google Scholar] [CrossRef]
- Hyötyläinen, T. Sample Collection, Storage and Preparation. In Chromatographic Methods in Metabolomics; RSC Chromatography Monographs; Royal Society of Chemistry: London, UK, 2013; Chapter 2; pp. 11–42. [Google Scholar] [CrossRef]
- Villas-Bôas, S.G.; Smart, K.F.; Sivakumaran, S.; Lane, G.A. Alkylation or Silylation for Analysis of Amino and Non-Amino Organic Acids by GC-MS? Metabolism 2011, 1, 3–20. [Google Scholar] [CrossRef]
- Ferreira, A.M.C.; Laespada, M.E.F.; Pavón, J.L.P.; Cordero, B.M. In situ aqueous derivatization as sample preparation technique for gas chromatographic determinations. J. Chromatogr. A 2013, 1296, 70–83. [Google Scholar] [CrossRef]
- Qiu, Y.; Su, M.; Liu, Y.; Chen, M.; Gu, J.; Zhang, J.; Jia, W. Application of ethyl chloroformate derivatization for gas chromatography-mass spectrometry based metabonomic profiling. Anal. Chim. Acta 2007, 583, 277–283. [Google Scholar] [CrossRef]
- Hušek, P.; Matucha, P.; Vránková, A.; Šimek, P. Simple plasma work-up for a fast chromatographic analysis of homocysteine, cysteine, methionine and aromatic amino acids. J. Chromatogr. B 2003, 789, 311–322. [Google Scholar] [CrossRef]
- Tao, X.; Liu, Y.; Wang, Y.; Qiu, Y.; Lin, J.; Zhao, A.; Su, M.; Jia, W. GC-MS with ethyl chloroformate derivatization for comprehensive analysis of metabolites in serum and its application to human uremia. Anal. Bioanal. Chem. 2008, 391, 2881–2889. [Google Scholar] [CrossRef] [PubMed]
- Husek, P.; Simek, P. Alkyl Chloroformates in Sample Derivatization Strategies for GC Analysis. Review on a Decade Use of the Reagents as Esterifying Agents. Curr. Pharm. Anal. 2006, 2, 23–43. [Google Scholar] [CrossRef]
- Hušek, P. Chloroformates in gas chromatography as general purpose derivatizing agents. J. Chromatogr. B Biomed. Sci. Appl. 1998, 717, 57–91. [Google Scholar] [CrossRef]
- McNair, H.M.; Miller, J.M.; Snow, N.H. Temperature Programming. In Basic Gas Chromatography; John Wiley & Sons, Inc.: Hoboken, NJ, USA, 2019; pp. 87–98. [Google Scholar] [CrossRef]
- Blumberg, L.M.; Klee, M.S. Quantitative comparison of performance of isothermal and temperature-programmed gas chromatography. J. Chromatogr. A 2001, 933, 13–26. [Google Scholar] [CrossRef]
- Blumberg, L.M. Metrics of separation performance in chromatography: Part 2. Separation performance of a heating ramp in temperature-programmed gas chromatography. J. Chromatogr. A 2012, 1244, 148–160. [Google Scholar] [CrossRef]
- Jespers, S.; Roeleveld, K.; Lynen, F.; Broeckhoven, K.; Desmet, G. Kinetic plots for programmed temperature gas chromatography. J. Chromatogr. A 2016, 1450, 94–100. [Google Scholar] [CrossRef]
- Tolley, H.D.; Tolley, S.E.; Wang, A.; Lee, M.L. Moving thermal gradients in gas chromatography. J. Chromatogr. A 2014, 1374, 189–198. [Google Scholar] [CrossRef]
- Avila, S.; Tolley, H.D.; Iverson, B.D.; Hawkins, A.R.; Johnson, S.L.; Lee, M.L. Comparison of the Dynamic Thermal Gradient to Temperature-Programmed Conditions in Gas Chromatography Using a Stochastic Transport Model. Anal. Chem. 2021, 93, 11785–11791. [Google Scholar] [CrossRef]
- Contreras, J.A.; Wang, A.; Rockwood, A.L.; Tolley, H.D.; Lee, M.L. Dynamic thermal gradient gas chromatography. J. Chromatogr. A 2013, 1302, 143–151. [Google Scholar] [CrossRef]
- Honour, J.W. Gas chromatography-mass spectrometry. Methods Mol. Biol. 2006, 324, 53–74. [Google Scholar] [CrossRef] [PubMed]
- Poole, C.F.; Poole, S.K. Separation characteristics of wall-coated open-tubular columns for gas chromatography. J. Chromatogr. A 2008, 1184, 254–280. [Google Scholar] [CrossRef] [PubMed]
- Poole, C.F.; Poole, S.K. Ionic liquid stationary phases for gas chromatography. J. Sep. Sci. 2011, 34, 888–900. [Google Scholar] [CrossRef] [PubMed]
- Almstetter, M.F.; Oefner, P.J.; Dettmer, K. Comprehensive two-dimensional gas chromatography in metabolomics. Anal. Bioanal. Chem. 2012, 402, 1993–2013. [Google Scholar] [CrossRef] [PubMed]
- Papadimitropoulos, M.E.P.; Vasilopoulou, C.G.; Maga-Nteve, C.; Klapa, M.I. Untargeted GC-MS Metabolomics. Methods Mol. Biol. 2018, 1738, 133–147. [Google Scholar] [CrossRef] [PubMed]
- Dołowy, M.; Pyka, A. Chromatographic methods in the separation of long-chain mono- and polyunsaturated fatty acids. J. Chem. 2015, 2015, 120830. [Google Scholar] [CrossRef]
- Rahman, M.M.; El-Aty, A.M.A.; Choi, J.-H.; Shin, H.-C.; Shin, S.C.; Shim, J.-H. Basic Overview on Gas Chromatography Columns. Anal. Sep. Sci. 2015, 3, 823–834. [Google Scholar] [CrossRef]
- Kováts, E. Gas-chromatographische Charakterisierung organischer Verbindungen. Teil 1: Retentionsindices aliphatischer Halogenide, Alkohole, Aldehyde und Ketone. Helv. Chim. Acta 1958, 41, 1915–1932. [Google Scholar] [CrossRef]
- Kostiainen, R.; Nokeleinen, S. Use of M-series retention index standards in the identification of trichothecenes by electron impact mass spectrometry. J. Chromatogr. 1990, 513, 31–37. [Google Scholar] [CrossRef]
- Kind, T.; Wohlgemuth, G.; Lee, D.Y.; Lu, Y.; Palazoglu, M.; Shahbaz, S.; Fiehn, O. FiehnLib: Mass spectral and retention index libraries for metabolomics based on quadrupole and time-of-flight gas chromatography/mass spectrometry. Anal. Chem. 2009, 81, 10038–10048. [Google Scholar] [CrossRef]
- Trinklein, T.J.; Schöneich, S.; Sudol, P.E.; Warren, C.G.; Gough, D.V.; Synovec, R.E. Total-transfer comprehensive three-dimensional gas chromatography with time-of-flight mass spectrometry. J. Chromatogr. A 2020, 1634, 461654. [Google Scholar] [CrossRef]
- Haggarty, J.; Burgess, K.E. Recent advances in liquid and gas chromatography methodology for extending coverage of the metabolome. Curr. Opin. Biotechnol. 2017, 43, 77–85. [Google Scholar] [CrossRef]
- Yuan, F.; Kim, S.; Yin, X.; Zhang, X.; Kato, I. Integrating Two-Dimensional Gas and Liquid Chromatography-Mass Spectrometry for Untargeted Colorectal Cancer Metabolomics: A Proof-of-Principle Study. Metabolites 2020, 10, 343. [Google Scholar] [CrossRef]
- Beckstrom, A.C.; Tanya, P.; Humston, E.M.; Snyder, L.R.; Synovec, R.E.; Juul, S.E. The perinatal transition of the circulating metabolome in a nonhuman primate. Pediatr. Res. 2012, 71, 338–344. [Google Scholar] [CrossRef]
- Winnike, J.H.; Wei, X.; Knagge, K.J.; Colman, S.D.; Gregory, S.G.; Zhang, X. Comparison of GC-MS and GC×GC-MS in the analysis of human serum samples for biomarker discovery. J. Proteome Res. 2015, 14, 1810–1817. [Google Scholar] [CrossRef]
- Dallüge, J.; Beens, J.; Brinkman, U.A.T. Comprehensive two-dimensional gas chromatography: A powerful and versatile analytical tool. J. Chromatogr. A 2003, 1000, 69–108. [Google Scholar] [CrossRef]
- Górecki, T.; Harynuk, J.; Panić, O. The evolution of comprehensive two-dimensional gas chromatography (GC × GC). J. Sep. Sci. 2004, 27, 359–379. [Google Scholar] [CrossRef]
- Prodhan, M.A.I.; Shi, B.; Song, M.; He, L.; Yuan, F.; Yin, X.; Bohman, P.; McClain, C.J.; Zhang, X. Integrating comprehensive two-dimensional gas chromatography mass spectrometry and parallel two-dimensional liquid chromatography mass spectrometry for untargeted metabolomics. Analyst 2019, 144, 4331–4341. [Google Scholar] [CrossRef]
- Hummel, J.; Strehmel, N.; Bölling, C.; Schmidt, S.; Walther, D.; Kopka, J. Mass Spectral Search and Analysis Using the Golm Metabolome Database. In The Handbook of Plant Metabolomics; Wiley-VCH: Weinheim, Germany, 2013; Chapter 18; pp. 321–343. [Google Scholar] [CrossRef]
- Oberacher, H.; Sasse, M.; Antignac, J.P.; Guitton, Y.; Debrauwer, L.; Jamin, E.L.; Schulze, T.; Krauss, M.; Covaci, A.; Caballero-Casero, N.; et al. A European proposal for quality control and quality assurance of tandem mass spectral libraries. Environ. Sci. Eur. 2020, 32, 43. [Google Scholar] [CrossRef]
- NIST Standard Reference Database 1A. Available online: https://www.nist.gov/srd/nist-standard-reference-database-1a (accessed on 23 November 2021).
- Montenegro-Burke, J.R.; Guijas, C.; Siuzdak, G. METLIN: A Tandem Mass Spectral Library of Standards. Methods Mol. Biol. 2020, 2104, 149–163. [Google Scholar] [CrossRef]
- Van Renterghem, P.; Viaene, W.; Van Gansbeke, W.; Barrabin, J.; Iannone, M.; Polet, M.; T’Sjoen, G.; Deventer, K.; Van Eenoo, P. Validation of an ultra-sensitive detection method for steroid esters in plasma for doping analysis using positive chemical ionization GC-MS/MS. J. Chromatogr. B. Analyt. Technol. Biomed. Life Sci. 2020, 1141, 122026. [Google Scholar] [CrossRef]
- Chobanyan, K.; Mitschke, A.; Gutzki, F.M.; Stichtenoth, D.O.; Tsikas, D. Accurate quantification of dimethylamine (DMA) in human plasma and serum by GC-MS and GC-tandem MS as pentafluorobenzamide derivative in the positive-ion chemical ionization mode. J. Chromatogr. B Analyt. Technol. Biomed. Life Sci. 2007, 851, 240–249. [Google Scholar] [CrossRef] [PubMed]
- Špánik, I.; Machyňáková, A. Recent applications of gas chromatography with high-resolution mass spectrometry. J. Sep. Sci. 2018, 41, 163–179. [Google Scholar] [CrossRef] [PubMed]
- Tsikas, D.; Zoerner, A.A. Analysis of eicosanoids by LC-MS/MS and GC-MS/MS: A historical retrospect and a discussion. J. Chromatogr. B Analyt. Technol. Biomed. Life Sci. 2014, 964, 79–88. [Google Scholar] [CrossRef] [PubMed]
- Tsikas, D.; Hanff, E.; Kayacelebi, A.A.; Böhmer, A. Gas chromatographic-mass spectrometric analysis of the tripeptide glutathione in the electron-capture negative-ion chemical ionization mode. Amino Acids 2016, 48, 593–598. [Google Scholar] [CrossRef]
- Warren, C.R. Use of chemical ionization for GC-MS metabolite profiling. Metabolomics 2013, 9, 110–120. [Google Scholar] [CrossRef]
- Lisec, J.; Hoffmann, F.; Schmitt, C.; Jaeger, C. Extending the Dynamic Range in Metabolomics Experiments by Automatic Correction of Peaks Exceeding the Detection Limit. Anal. Chem. 2016, 88, 7487–7492. [Google Scholar] [CrossRef]
- Turner, M.A.; Guallar-Hoyas, C.; Kent, A.L.; Wilson, I.D.; Thomas, C.L. Comparison of metabolomic profiles obtained using chemical ionization and electron ionization MS in exhaled breath. Bioanalysis 2011, 3, 2731–2738. [Google Scholar] [CrossRef]
- Misra, B.B.; Olivier, M. High Resolution GC-Orbitrap-MS Metabolomics Using Both Electron Ionization and Chemical Ionization for Analysis of Human Plasma. J. Proteome Res. 2020, 19, 2717–2731. [Google Scholar] [CrossRef]
- Wachsmuth, C.J.; Hahn, T.A.; Oefner, P.J.; Dettmer, K. Enhanced metabolite profiling using a redesigned atmospheric pressure chemical ionization source for gas chromatography coupled to high-resolution time-of-flight mass spectrometry. Anal. Bioanal. Chem. 2015, 407. [Google Scholar] [CrossRef]
- Roboz, J. A History of Ion Current Detectors for Mass Spectrometry. In Volume 9: Historical Perspectives, Part A: The Development of Mass Spectrometry of The Encyclopedia of Mass Spectrometry; Elsevier: Amsterdam, The Netherlands, 2016; pp. 183–188. [Google Scholar] [CrossRef]
- Kirchner, M.; Matisová, E.; Hrouzková, S.; De Zeeuw, J. Possibilities and limitations of quadrupole mass spectrometric detector in fast gas chromatography. J. Chromatogr. A 2005, 1090, 126–132. [Google Scholar] [CrossRef]
- Purcaro, G.; Tranchida, P.Q.; Ragonese, C.; Conte, L.; Dugo, P.; Dugo, G.; Mondello, L. Evaluation of a rapid-scanning quadrupole mass spectrometer in an apolar × ionic-liquid comprehensive two-dimensional gas chromatography system. Anal. Chem. 2010, 82, 8583–8590. [Google Scholar] [CrossRef] [PubMed]
- Schwaiger-Haber, M.; Stancliffe, E.; Arends, V.; Thyagarajan, B.; Sindelar, M.; Patti, G.J. A Workflow to Perform Targeted Metabolomics at the Untargeted Scale on a Triple Quadrupole Mass Spectrometer. ACS Meas. Sci. Au 2021, 1, 35–45. [Google Scholar] [CrossRef]
- Jayasinghe, N.S.; Mendis, H.; Roessner, U.; Dias, D.A. Quantification of Sugars and Organic Acids in Biological Matrices Using GC-QqQ-MS. Methods Mol. Biol. 2018, 1778, 207–223. [Google Scholar] [CrossRef]
- Szpot, P.; Wachełko, O.; Zawadzki, M. Application of ultra-sensitive GC-QqQ-MS/MS (MRM) method for the determination of diclofenac in whole blood samples without derivatization. J. Chromatogr. B 2021, 1179, 122860. [Google Scholar] [CrossRef]
- Balogh, M.P. Debating Resolutiom and Mass Accuracy. LC-GC Eur. 2004, 17, 152–159. [Google Scholar]
- Toribio-Delgado, A.F.; Maynar-Mariño, M.; Caballero-Loscos, M.J.; Robles-Gil, M.C.; Olcina-Camacho, G.J.; Maynar-Mariño, J.I. Qualification and Quantification of Seventeen Natural Steroids in Plasma by GC–Q-MS and GC-IT–MS/MS. J. Chromatogr. Sci. 2012, 50, 349–357. [Google Scholar] [CrossRef]
- Eliuk, S.; Makarov, A. Evolution of Orbitrap Mass Spectrometry Instrumentation. Annu. Rev. Anal. Chem. 2015, 8, 61–80. [Google Scholar] [CrossRef]
- Makarov, A. Orbitrap journey: Taming the ion rings. Nat. Commun. 2019, 10, 3743. [Google Scholar] [CrossRef] [PubMed]
- Stettin, D.; Poulin, R.X.; Pohnert, G. Metabolomics Benefits from Orbitrap GC-MS-Comparison of Low- and High-Resolution GC-MS. Metabolites 2020, 10, 143. [Google Scholar] [CrossRef]
- Misra, B.B.; Bassey, E.; Bishop, A.C.; Kusel, D.T.; Cox, L.A.; Olivier, M. High-resolution gas chromatography/mass spectrometry metabolomics of non-human primate serum. Rapid Commun. Mass Spectrom. 2018, 32, 1497–1506. [Google Scholar] [CrossRef] [PubMed]
- Nikolaev, E.N.; Kostyukevich, Y.I.; Vladimirov, G.N. Fourier transform ion cyclotron resonance (FT ICR) mass spectrometry: Theory and simulations. Mass Spectrom. Rev. 2016, 35, 219–258. [Google Scholar] [CrossRef] [PubMed]
- Ghaste, M.; Mistrik, R.; Shulaev, V. Applications of Fourier Transform Ion Cyclotron Resonance (FT-ICR) and Orbitrap Based High Resolution Mass Spectrometry in Metabolomics and Lipidomics. Int. J. Mol. Sci. 2016, 17, 816. [Google Scholar] [CrossRef] [PubMed]
- Luo, Z.; Heffner, C.; Solouki, T. Multidimensional GC-fourier transform ion cyclotron resonance MS analyses: Utilizing gas-phase basicities to characterize multicomponent gasoline samples. J. Chromatogr. Sci. 2009, 47, 75–82. [Google Scholar] [CrossRef][Green Version]
- Liu, T.; Li, R.; Cui, Y.; Yu, Z.; Zhao, Y. Metabonomic analysis of plasma biochemical changes in pyrexia rats after treatment with Gegenqinlian decoction, aspirin and itraconazole by UHPLC-FT-ICR-MS. J. Pharm. Anal. 2020, 10, 581–587. [Google Scholar] [CrossRef]
- Junot, C.; Madalinski, G.; Tabet, J.C.; Ezan, E. Fourier transform mass spectrometry for metabolome analysis. Analyst 2010, 135, 2203–2219. [Google Scholar] [CrossRef]
- Han, J.; Danell, R.M.; Patel, J.R.; Gumerov, D.R.; Scarlett, C.O.; Speir, J.P.; Parker, C.E.; Rusyn, I.; Zeisel, S.; Borchers, C.H. Towards high-throughput metabolomics using ultrahigh-field Fourier transform ion cyclotron resonance mass spectrometry. Metabolomics 2008, 4, 128–140. [Google Scholar] [CrossRef]
- Macherone, A. The Future of GC/Q-TOF in Environmental Analysis. Compr. Anal. Chem. 2013, 61, 471–490. [Google Scholar] [CrossRef]
- Peterson, A.C.; Balloon, A.J.; Westphall, M.S.; Coon, J.J. Development of a GC/quadrupole-orbitrap mass spectrometer, part II: New approaches for discovery metabolomics. Anal. Chem. 2014, 86, 10044–10051. [Google Scholar] [CrossRef]
- Understanding Your Agilent ChemStation. Available online: https://www.agilent.com/cs/library/usermanuals/Public/G2070-91126_Understanding.pdf (accessed on 24 November 2021).
- MassLynx Mass Spectrometry Software. Available online: https://www.waters.com/waters/en_US/MassLynx-Mass-Spectrometry-Software-/nav.htm?locale=en_US&cid=513164 (accessed on 23 November 2021).
- ChromaTOF® Software. Available online: https://www.leco.com/product/chromatof-software (accessed on 23 November 2021).
- Compound Discoverer Software. Available online: https://www.thermofisher.com/ru/ru/home/industrial/mass-spectrometry/liquid-chromatography-mass-spectrometry-lc-ms/lc-ms-software/multi-omics-data-analysis/compound-discoverer-software.html (accessed on 23 November 2021).
- O’Callaghan, S.; De Souza, D.P.; Isaac, A.; Wang, Q.; Hodkinson, L.; Olshansky, M.; Erwin, T.; Appelbe, B.; Tull, D.L.; Roessner, U.; et al. PyMS: A Python toolkit for processing of gas chromatography-mass spectrometry (GC-MS) data. Application and comparative study of selected tools. BMC Bioinform. 2012, 13, 115. [Google Scholar] [CrossRef] [PubMed]
- Stein, S.E. An integrated method for spectrum extraction and compound identification from gas chromatography/mass spectrometry data. J. Am. Soc. Mass Spectrom. 1999, 10, 770–781. [Google Scholar] [CrossRef]
- Aggio, R.; Villas-Bôas, S.G.; Ruggiero, K. Metab: An R package for high-throughput analysis of metabolomics data generated by GC-MS. Bioinformatics 2011, 27, 2316–2318. [Google Scholar] [CrossRef]
- Behrends, V.; Tredwell, G.D.; Bundy, J.G. A software complement to AMDIS for processing GC-MS metabolomic data. Anal. Biochem. 2011, 415, 206–208. [Google Scholar] [CrossRef]
- Grapp, M.; Maurer, H.H.; Desel, H. Systematic forensic toxicological analysis by GC-MS in serum using automated mass spectral deconvolution and identification system. Drug Test. Anal. 2016, 8, 816–825. [Google Scholar] [CrossRef]
- Hiller, K.; Hangebrauk, J.; Jäger, C.; Spura, J.; Schreiber, K.; Schomburg, D. MetaboliteDetector: Comprehensive Analysis Tool for Targeted and Nontargeted GC/MS Based Metabolome Analysis. Anal. Chem. 2009, 81, 3429–3439. [Google Scholar] [CrossRef]
- Pang, Z.; Chong, J.; Zhou, G.; De Lima Morais, D.A.; Chang, L.; Barrette, M.; Gauthier, C.; Jacques, P.É.; Li, S.; Xia, J. MetaboAnalyst 5.0: Narrowing the gap between raw spectra and functional insights. Nucleic Acids Res. 2021, 49, W388–W396. [Google Scholar] [CrossRef] [PubMed]
- Domingo-Almenara, X.; Siuzdak, G. Metabolomics Data Processing Using XCMS. Methods Mol. Biol. 2020, 2104, 11–24. [Google Scholar] [CrossRef]
- Wehrens, R.; Weingart, G.; Mattivi, F. metaMS: An open-source pipeline for GC-MS-based untargeted metabolomics. J. Chromatogr. B. Analyt. Technol. Biomed. Life Sci. 2014, 966, 109–116. [Google Scholar] [CrossRef]
- Lapierre, N.; Alser, M.; Eskin, E.; Koslicki, D.; Mangul, S. Metalign: Efficient alignment-based metagenomic profiling via containment min hash. Genome Biol. 2020, 21, 242. [Google Scholar] [CrossRef]
- Pluskal, T.; Castillo, S.; Villar-Briones, A.; Orešič, M. MZmine 2: Modular framework for processing, visualizing, and analyzing mass spectrometry-based molecular profile data. BMC Bioinform. 2010, 11, 395. [Google Scholar] [CrossRef]
- Yao, L.; Sheflin, A.M.; Broeckling, C.D.; Prenni, J.E. Data Processing for GC-MS- and LC-MS-Based Untargeted Metabolomics. Methods Mol. Biol. 2019, 1978, 287–299. [Google Scholar] [CrossRef] [PubMed]
- Balashova, E.E.; Lokhov, P.G.; Ponomarenko, E.A.; Markin, S.S.; Lisitsa, A.V.; Archakov, A.I. Metabolomic diagnostics and human digital image. Pers. Med. 2019, 16, 133–144. [Google Scholar] [CrossRef] [PubMed]
- Kind, T.; Fiehn, O. Advances in structure elucidation of small molecules using mass spectrometry. Bioanal. Rev. 2010, 2, 23–60. [Google Scholar] [CrossRef] [PubMed]
- Boccard, J.; Veuthey, J.L.; Rudaz, S. Knowledge discovery in metabolomics: An overview of MS data handling. J. Sep. Sci. 2010, 33, 290–304. [Google Scholar] [CrossRef]
- Manfredi, M.; Conte, E.; Barberis, E.; Buzzi, A.; Robotti, E.; Caneparo, V.; Cecconi, D.; Brandi, J.; Vanni, E.; Finocchiaro, M.; et al. Integrated serum proteins and fatty acids analysis for putative biomarker discovery in inflammatory bowel disease. J. Proteomics 2019, 195, 138–149. [Google Scholar] [CrossRef]
- Worley, B.; Powers, R. Multivariate Analysis in Metabolomics. Curr. Metabolomics 2013, 1, 92. [Google Scholar] [CrossRef]
- Tugizimana, F.; Piater, L.; Dubery, I. Plant metabolomics: A new frontier in phytochemical analysis. S. Afr. J. Sci. 2013, 109, 11. [Google Scholar] [CrossRef]
- Canzler, S.; Hackermüller, J. multiGSEA: A GSEA-based pathway enrichment analysis for multi-omics data. BMC Bioinform. 2020, 21, 561. [Google Scholar] [CrossRef]
- Jahagirdar, S.; Saccenti, E. Evaluation of Single Sample Network Inference Methods for Metabolomics-Based Systems Medicine. J. Proteome Res. 2020, 20, 932–949. [Google Scholar] [CrossRef]
- Pomyen, Y.; Wanichthanarak, K.; Poungsombat, P.; Fahrmann, J.; Grapov, D.; Khoomrung, S. Deep metabolome: Applications of deep learning in metabolomics. Comput. Struct. Biotechnol. J. 2020, 18, 2818–2825. [Google Scholar] [CrossRef] [PubMed]
- Wang, H.; Pujos-Guillot, E.; Comte, B.; De Miranda, J.L.; Spiwok, V.; Chorbev, I.; Castiglione, F.; Tieri, P.; Watterson, S.; McAllister, R.; et al. Deep learning in systems medicine. Brief. Bioinform. 2021, 22, 1543–1559. [Google Scholar] [CrossRef]
- Kantz, E.D.; Tiwari, S.; Watrous, J.D.; Cheng, S.; Jain, M. Deep Neural Networks for Classification of LC-MS Spectral Peaks. Anal. Chem. 2019, 91, 12407–12413. [Google Scholar] [CrossRef]
- Mendez, K.M.; Broadhurst, D.I.; Reinke, S.N. The application of artificial neural networks in metabolomics: A historical perspective. Metabolomics 2019, 15, 142. [Google Scholar] [CrossRef]
- Da Silva, R.R.; Dorrestein, P.C.; Quinn, R.A. Illuminating the dark matter in metabolomics. Proc. Natl. Acad. Sci. USA 2015, 112, 12549–12550. [Google Scholar] [CrossRef] [PubMed]
- Jones, O.A.H. Illuminating the dark metabolome to advance the molecular characterisation of biological systems. Metabolomics 2018, 14, 101. [Google Scholar] [CrossRef]
- Ji, H.; Xu, Y.; Lu, H.; Zhang, Z. Deep MS/MS-Aided Structural-Similarity Scoring for Unknown Metabolite Identification. Anal. Chem. 2019, 91, 5629–5637. [Google Scholar] [CrossRef] [PubMed]
- Shen, X.; Wang, R.; Xiong, X.; Yin, Y.; Cai, Y.; Ma, Z.; Liu, N.; Zhu, Z.J. Metabolic reaction network-based recursive metabolite annotation for untargeted metabolomics. Nat. Commun. 2019, 10, 1516. [Google Scholar] [CrossRef]
- Sud, M.; Fahy, E.; Cotter, D.; Azam, K.; Vadivelu, I.; Burant, C.; Edison, A.; Fiehn, O.; Higashi, R.; Nair, K.S.; et al. Metabolomics Workbench: An international repository for metabolomics data and metadata, metabolite standards, protocols, tutorials and training, and analysis tools. Nucleic Acids Res. 2016, 44, D463–D470. [Google Scholar] [CrossRef]
- Haug, K.; Cochrane, K.; Nainala, V.C.; Williams, M.; Chang, J.; Jayaseelan, K.V.; O’Donovan, C. MetaboLights: A resource evolving in response to the needs of its scientific community. Nucleic Acids Res. 2020, 48, D440–D444. [Google Scholar] [CrossRef]
- Wishart, D.S. Proteomics and the Human Metabolome Project. Expert Rev. Proteomics 2014, 4, 333–335. [Google Scholar] [CrossRef]
- Wishart, D. Systems Biology Resources Arising from the Human Metabolome Project. In Genetics Meets Metabolomics; Springer: New York, NY, USA, 2012; pp. 157–175. [Google Scholar] [CrossRef]
- Costa dos Santos, G.; Renovato-Martins, M.; de Brito, N.M. The remodel of the “central dogma”: A metabolomics interaction perspective. Metabolomics 2021, 17, 48. [Google Scholar] [CrossRef]
- Suhre, K.; Zaghlool, S. Connecting the epigenome, metabolome and proteome for a deeper understanding of disease. J. Intern. Med. 2021, 290, 527–548. [Google Scholar] [CrossRef] [PubMed]
- A Table of All Published GWAS with Metabolomics—Human Metabolic Individuality. Available online: http://www.metabolomix.com/list-of-all-published-gwas-with-metabolomics/ (accessed on 23 November 2021).
- Koshiba, S.; Motoike, I.; Saigusa, D.; Inoue, J.; Shirota, M.; Katoh, Y.; Katsuoka, F.; Danjoh, I.; Hozawa, A.; Kuriyama, S.; et al. Omics research project on prospective cohort studies from the Tohoku Medical Megabank Project. Genes Cells 2018, 23, 406–417. [Google Scholar] [CrossRef]
- Tsepilov, Y.A.; Sharapov, S.Z.; Zaytseva, O.O.; Krumsek, J.; Prehn, C.; Adamski, J.; Kastenmüller, G.; Wang-Sattler, R.; Strauch, K.; Gieger, C.; et al. A network-based conditional genetic association analysis of the human metabolome. Gigascience 2018, 7. [Google Scholar] [CrossRef]
- Cheng, Y.; Schlosser, P.; Hertel, J.; Sekula, P.; Oefner, P.J.; Spiekerkoetter, U.; Mielke, J.; Freitag, D.F.; Schmidts, M.; Oefner, P.J.; et al. Rare genetic variants affecting urine metabolite levels link population variation to inborn errors of metabolism. Nat. Commun. 2021, 12, 964. [Google Scholar] [CrossRef] [PubMed]
- Grassin-Delyle, S.; Roquencourt, C.; Moine, P.; Saffroy, G.; Carn, S.; Heming, N.; Fleuriet, J.; Salvator, H.; Naline, E.; Couderc, L.J.; et al. Metabolomics of exhaled breath in critically ill COVID-19 patients: A pilot study. EBioMedicine 2021, 63, 103154. [Google Scholar] [CrossRef] [PubMed]
- Su, Y.; Chen, D.; Yuan, D.; Lausted, C.; Choi, J.; Dai, C.L.; Voillet, V.; Duvvuri, V.R.; Scherler, K.; Troisch, P.; et al. Multi-Omics Resolves a Sharp Disease-State Shift between Mild and Moderate COVID-19. Cell 2020, 183, 1479–1495.e20. [Google Scholar] [CrossRef] [PubMed]
- Song, J.W.; Lam, S.M.; Fan, X.; Cao, W.J.; Wang, S.Y.; Tian, H.; Chua, G.H.; Zhang, C.; Meng, F.P.; Xu, Z.; et al. Omics-Driven Systems Interrogation of Metabolic Dysregulation in COVID-19 Pathogenesis. Cell Metab. 2020, 32, 188–202.e5. [Google Scholar] [CrossRef]
- Choi, K.R.; Jang, W.D.; Yang, D.; Cho, J.S.; Park, D.; Lee, S.Y. Systems Metabolic Engineering Strategies: Integrating Systems and Synthetic Biology with Metabolic Engineering. Trends Biotechnol. 2019, 37, 817–837. [Google Scholar] [CrossRef]
- Mahajan, U.M.; Alnatsha, A.; Li, Q.; Oehrle, B.; Weiss, F.U.; Sendler, M.; Distler, M.; Uhl, W.; Fahlbusch, T.; Goni, E.; et al. Plasma Metabolome Profiling Identifies Metabolic Subtypes of Pancreatic Ductal Adenocarcinoma. Cells 2021, 10, 1821. [Google Scholar] [CrossRef] [PubMed]
- Dörr, J.R.; Yu, Y.; Milanovic, M.; Beuster, G.; Zasada, C.; Däbritz, J.H.M.; Lisec, J.; Lenze, D.; Gerhardt, A.; Schleicher, K.; et al. Synthetic lethal metabolic targeting of cellular senescence in cancer therapy. Nature 2013, 501, 421–425. [Google Scholar] [CrossRef]
- Smith, A.M.; Natowicz, M.R.; Braas, D.; Ludwig, M.A.; Ney, D.M.; Donley, E.L.R.; Burrier, R.E.; Amaral, D.G. A Metabolomics Approach to Screening for Autism Risk in the Children’s Autism Metabolome Project. Autism Res. 2020, 13, 1270–1285. [Google Scholar] [CrossRef]
- Perng, W.; Rifas-Shiman, S.L.; Sordillo, J.; Hivert, M.F.; Oken, E. Metabolomic Profiles of Overweight/Obesity Phenotypes During Adolescence: A Cross-Sectional Study in Project Viva. Obesity 2020, 28, 379–387. [Google Scholar] [CrossRef] [PubMed]
- Considine, E.C. The Search for Clinically Useful Biomarkers of Complex Disease: A Data Analysis Perspective. Metabolites 2019, 9, 126. [Google Scholar] [CrossRef]
- Kennedy, A.D.; Wittmann, B.M.; Evans, A.M.; Miller, L.A.D.; Toal, D.R.; Lonergan, S.; Elsea, S.H.; Pappan, K.L. Metabolomics in the clinic: A review of the shared and unique features of untargeted metabolomics for clinical research and clinical testing. J. Mass Spectrom. 2018, 53, 1143–1154. [Google Scholar] [CrossRef] [PubMed]
- Jarmusch, A.K.; Wang, M.; Aceves, C.M.; Advani, R.S.; Aguirre, S.; Aksenov, A.A.; Aleti, G.; Aron, A.T.; Bauermeister, A.; Bolleddu, S.; et al. ReDU: A framework to find and reanalyze public mass spectrometry data. Nat. Methods 2020, 17, 901–904. [Google Scholar] [CrossRef] [PubMed]
- Spicer, R.A.; Salek, R.; Steinbeck, C. A decade after the metabolomics standards initiative it’s time for a revision. Sci. Data 2017, 4, 170138. [Google Scholar] [CrossRef]
- Trifonova, O.P.; Maslov, D.L.; Balashova, E.E.; Lokhov, P.G. Mass spectrometry-based metabolomics diagnostics—Myth or reality? Expert Rev. Proteom. 2021, 18, 7–12. [Google Scholar] [CrossRef]
- Shishkova, E.; Hebert, A.S.; Coon, J.J. Now, More Than Ever, Proteomics Needs Better Chromatography. Cell Syst. 2016, 3, 321–324. [Google Scholar] [CrossRef]
- Metabolon—Enlightening Life. Available online: https://www.metabolon.com/ (accessed on 23 November 2021).
- Alseekh, S.; Aharoni, A.; Brotman, Y.; Contrepois, K.; D’Auria, J.; Ewald, J.; Ewald, J.C.; Fraser, P.D.; Giavalisco, P.; Hall, R.D.; et al. Mass spectrometry-based metabolomics: A guide for annotation, quantification and best reporting practices. Nat. Methods 2021, 18, 747–756. [Google Scholar] [CrossRef] [PubMed]
- Jendoubi, T. Approaches to Integrating Metabolomics and Multi-Omics Data: A Primer. Metabolites 2021, 11, 184. [Google Scholar] [CrossRef] [PubMed]


Publisher’s Note: MDPI stays neutral with regard to jurisdictional claims in published maps and institutional affiliations. |
© 2021 by the authors. Licensee MDPI, Basel, Switzerland. This article is an open access article distributed under the terms and conditions of the Creative Commons Attribution (CC BY) license (https://creativecommons.org/licenses/by/4.0/).