
Machine Learning Applied to Omics Datasets Predicts Mortality in Patients with Alcoholic Hepatitis

 , ,
, ,
Abstract
:
1. Introduction
2. Results
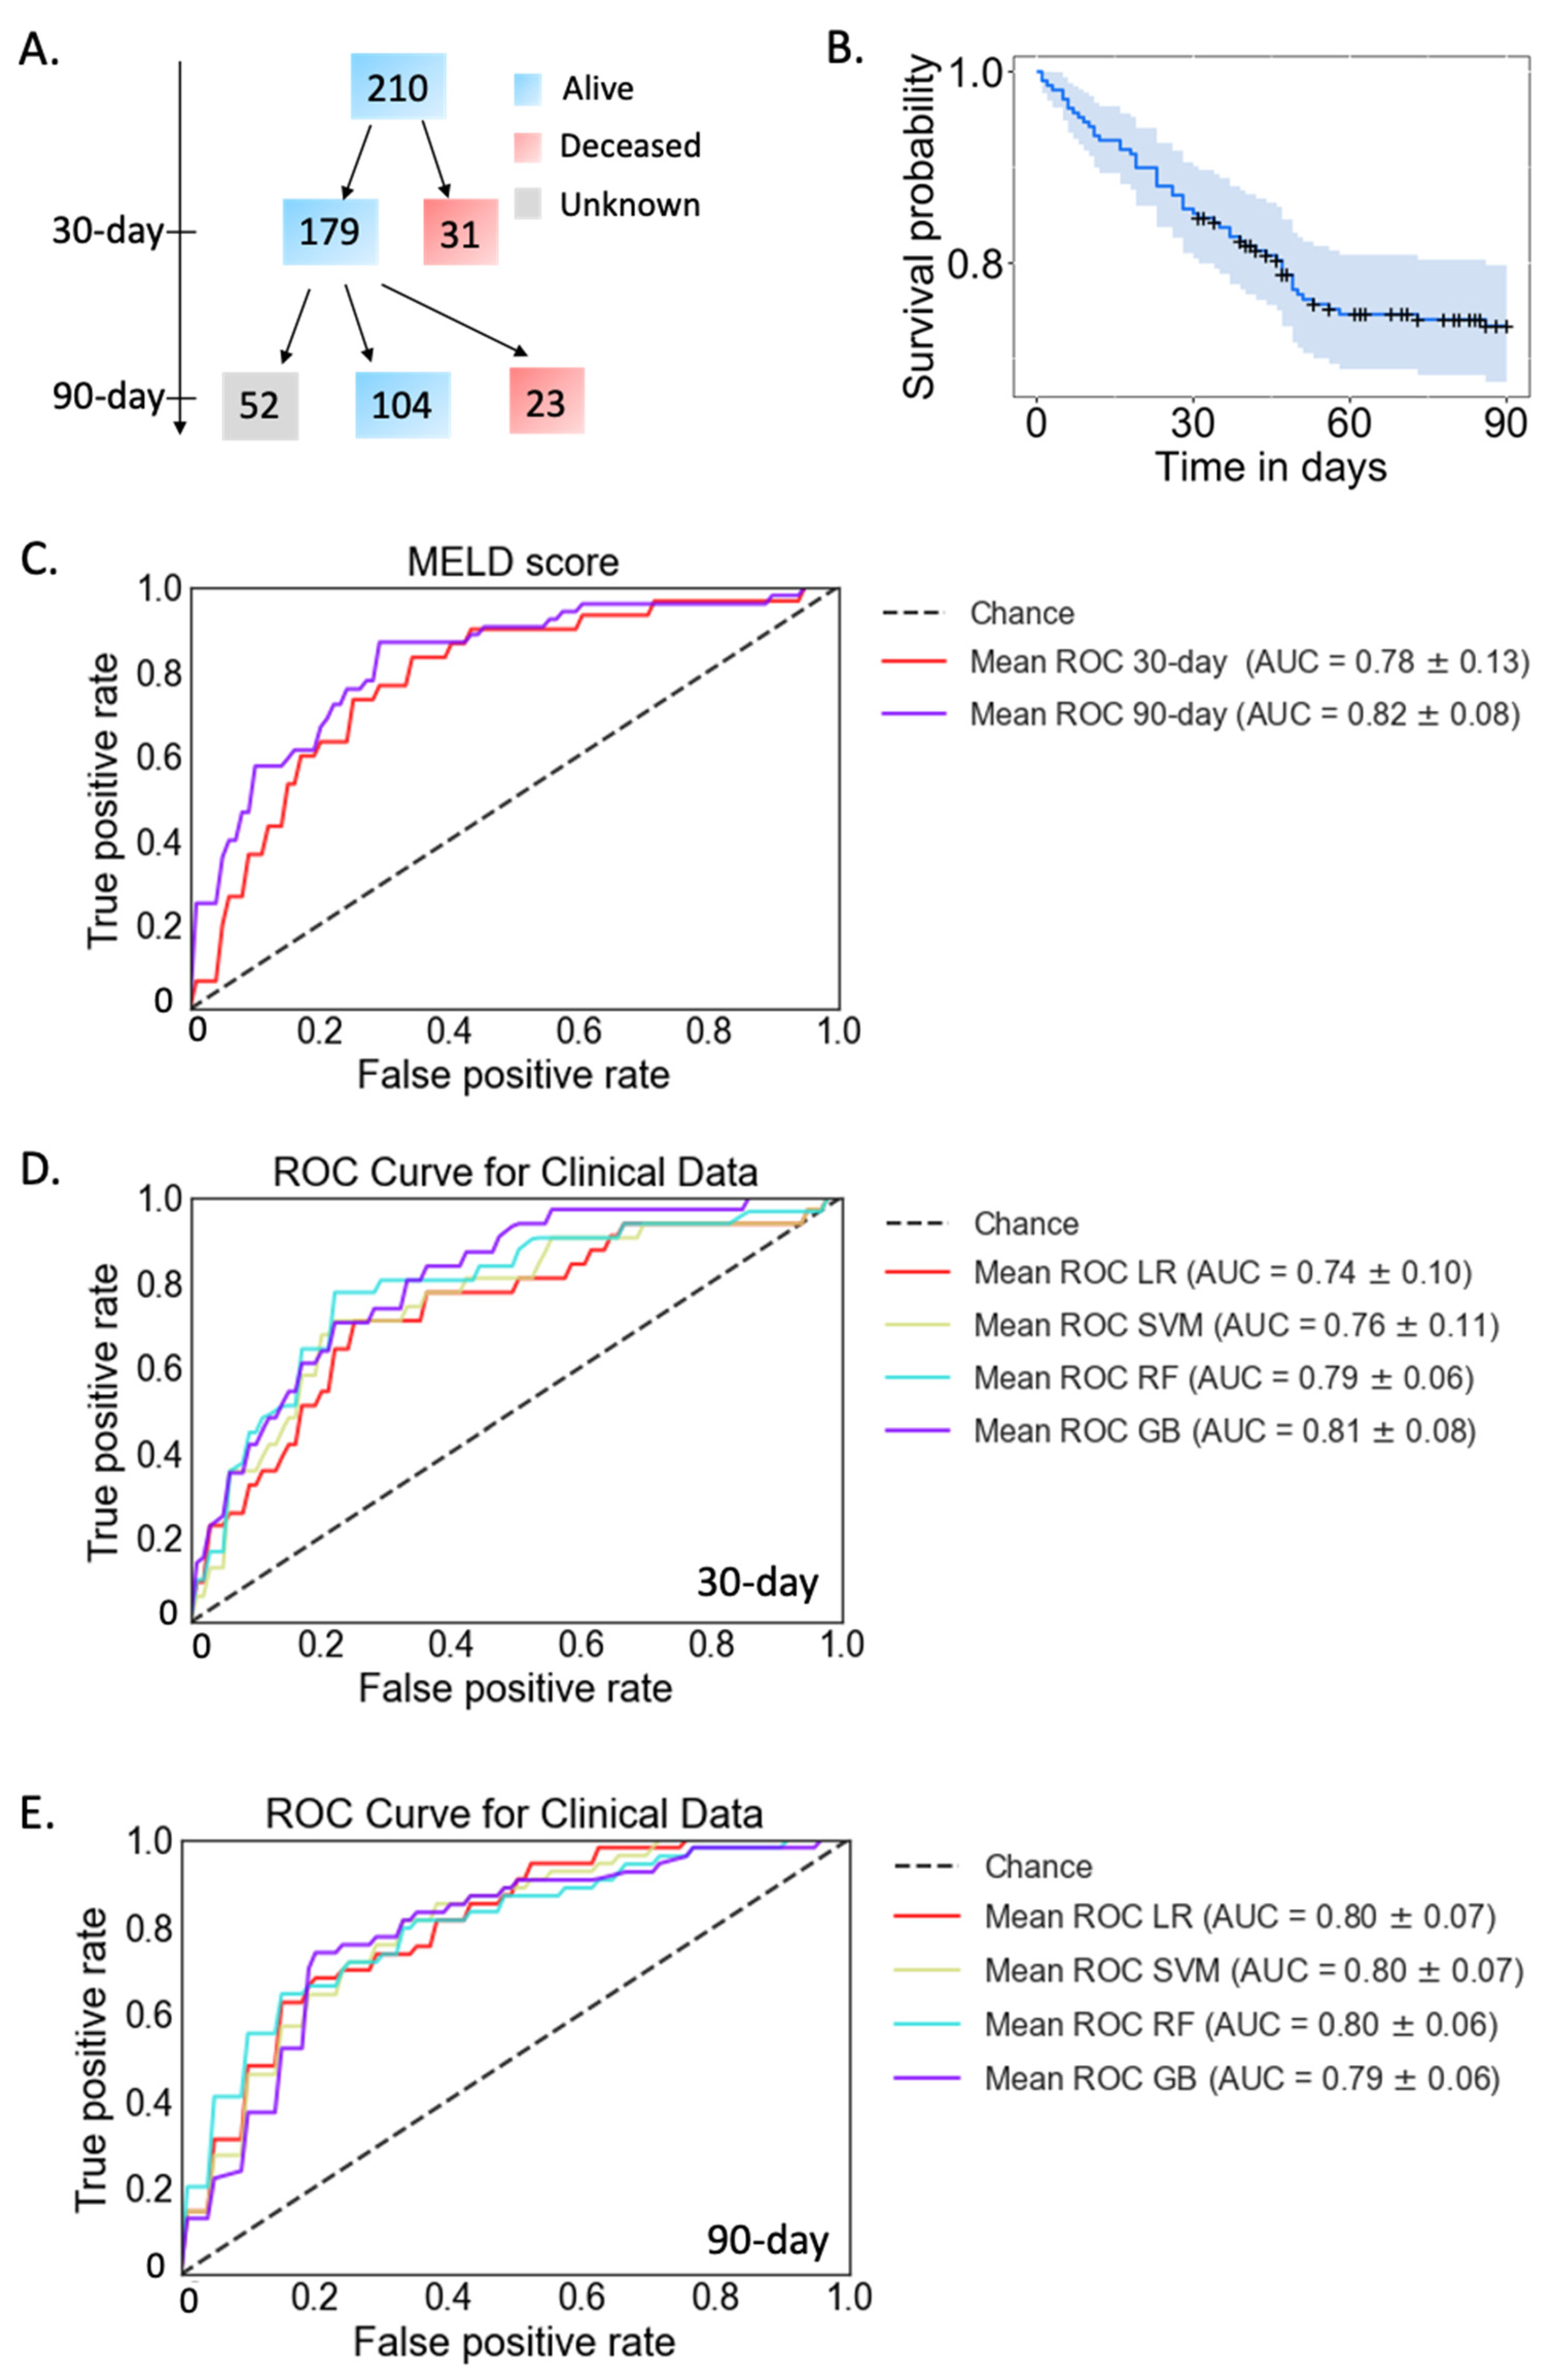
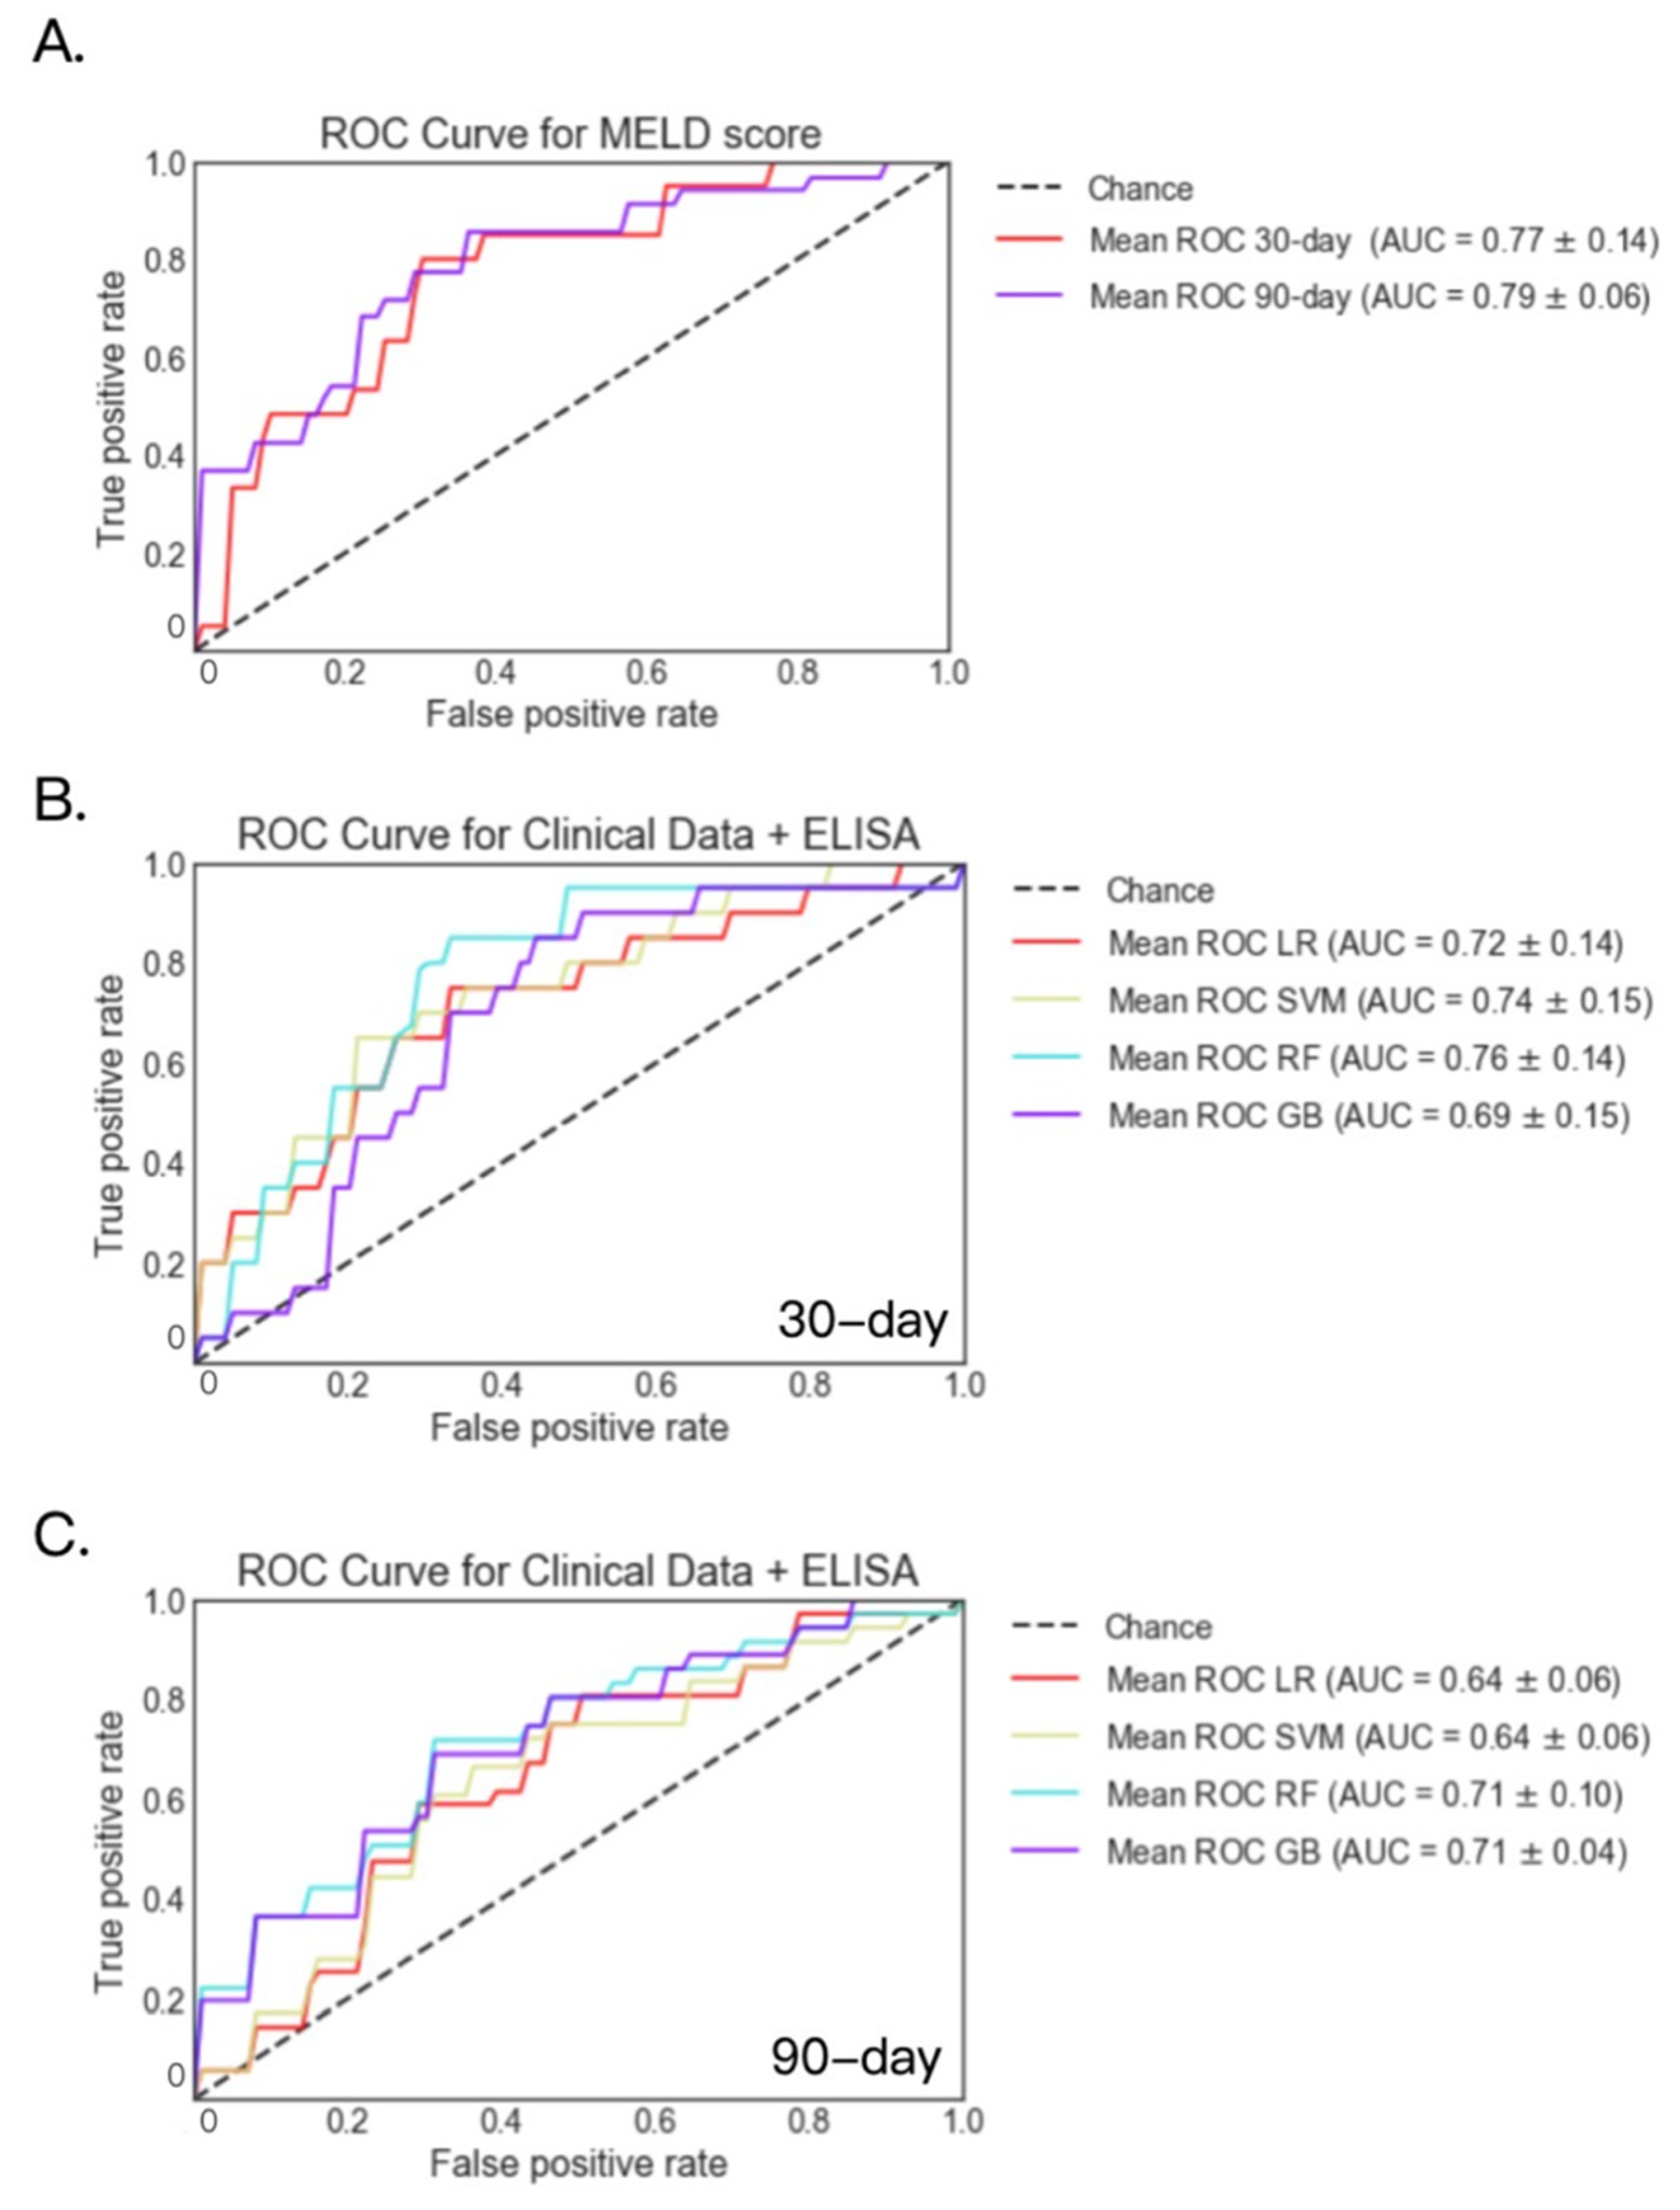
2.1. Mortality Prediction with Clinical Data in Patients with Alcoholic Hepatitis
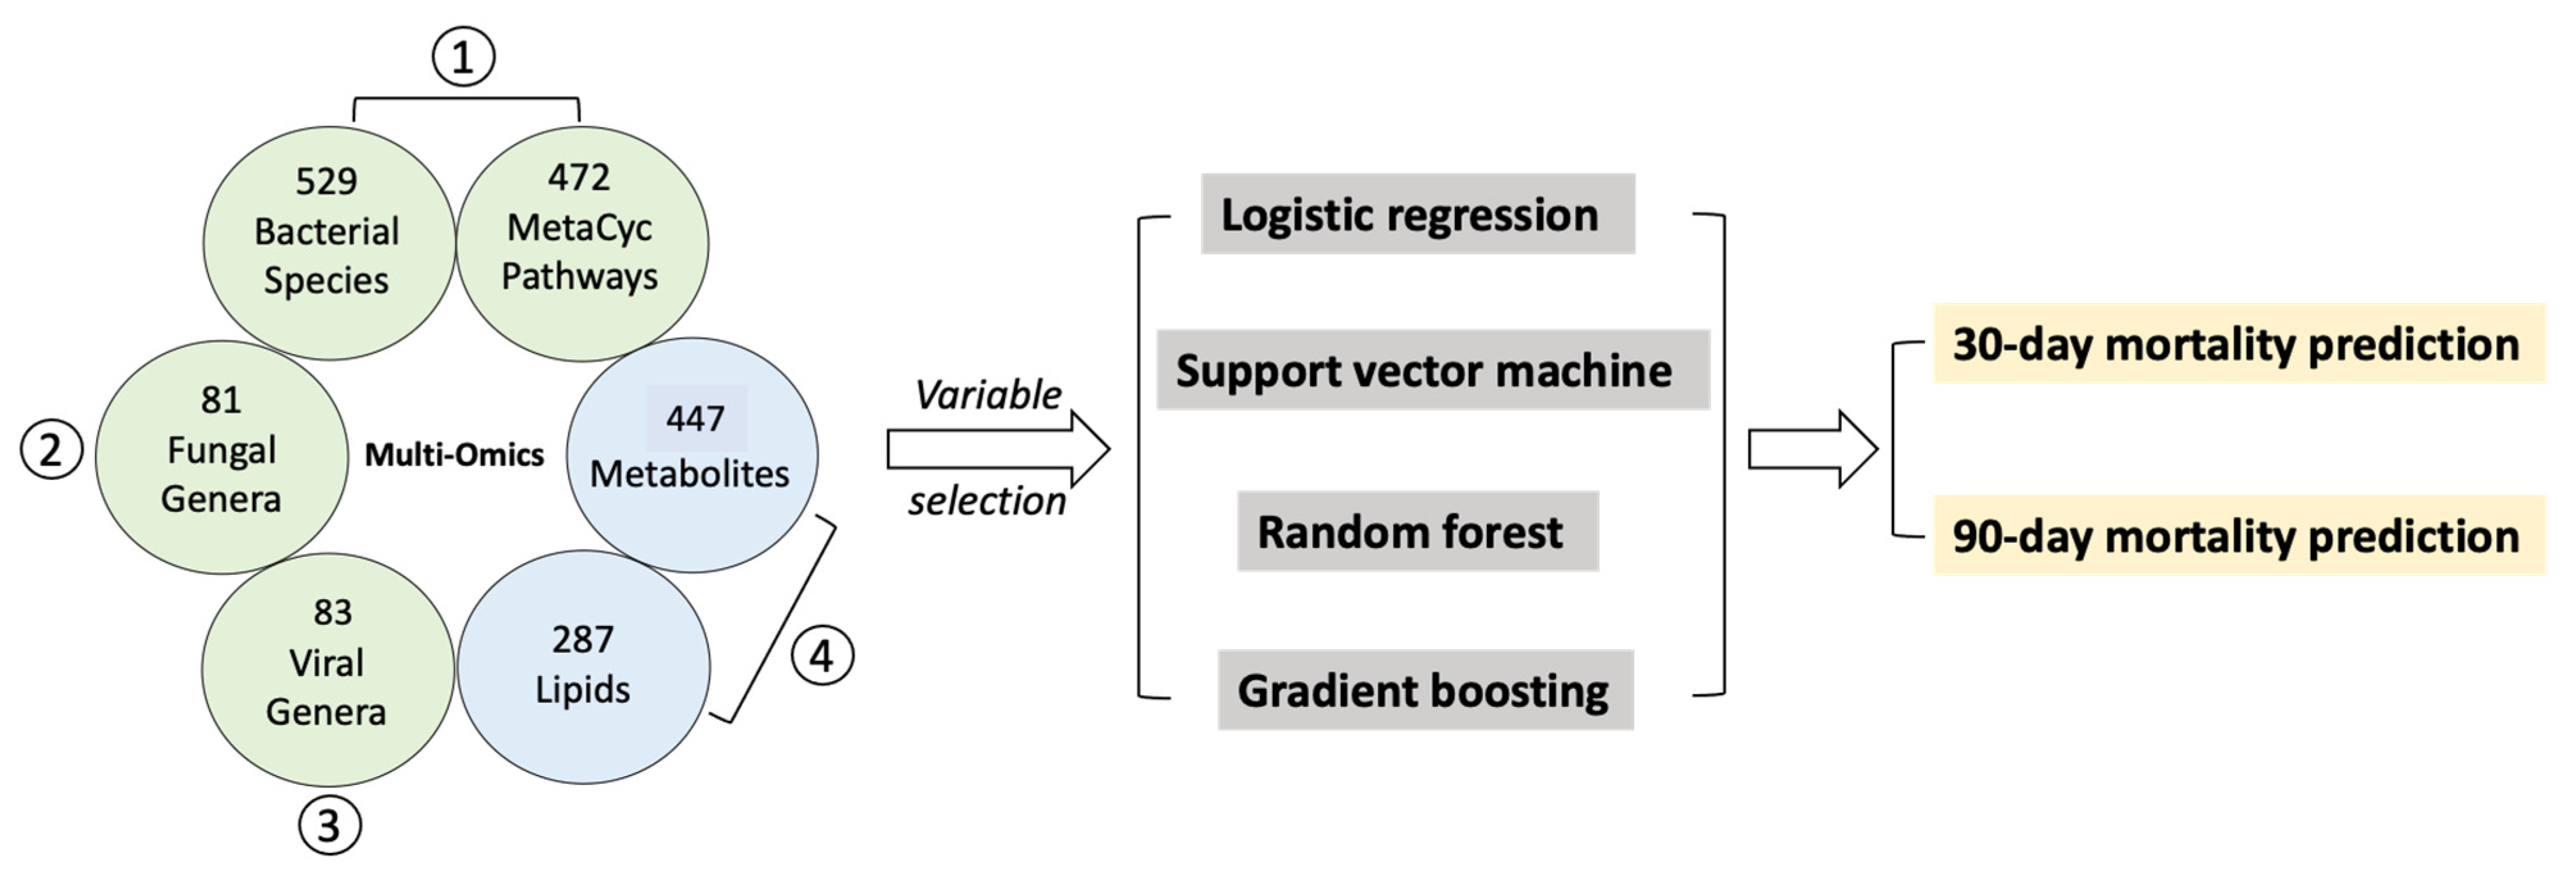
2.2. Selected Variables from Multi-Omics Datasets
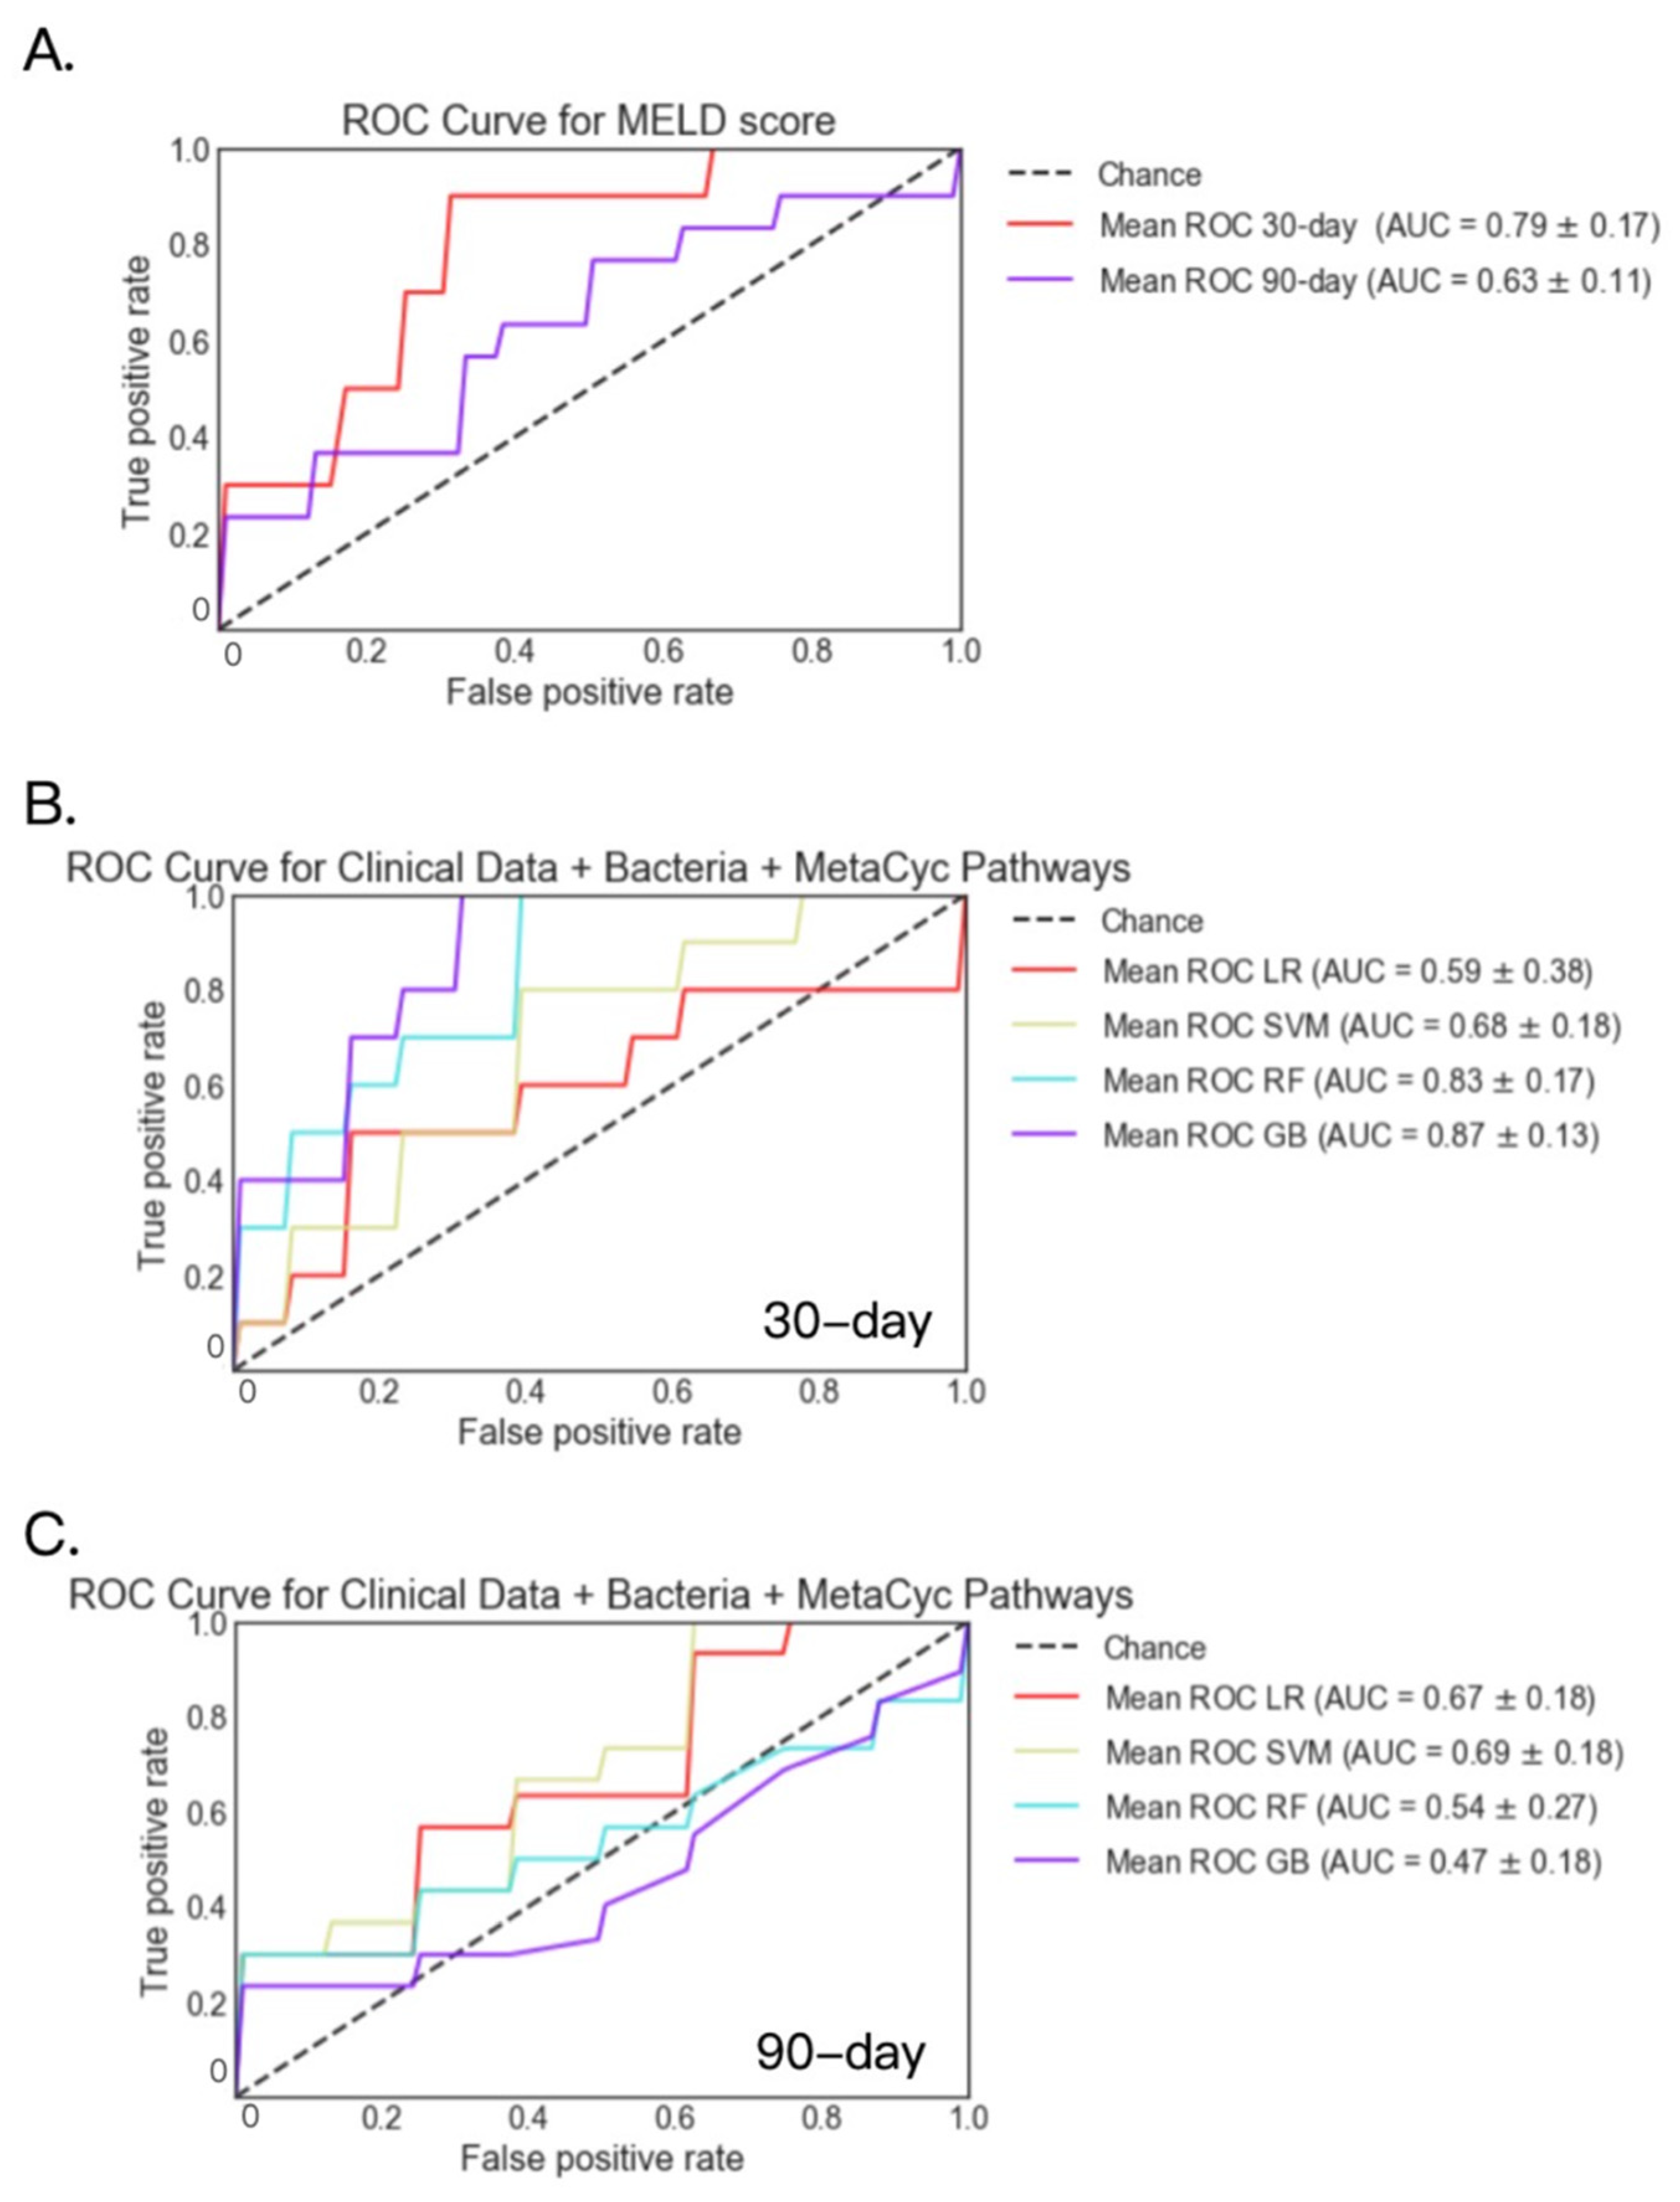
2.3. Fecal Bacteria and MetaCyc Pathways
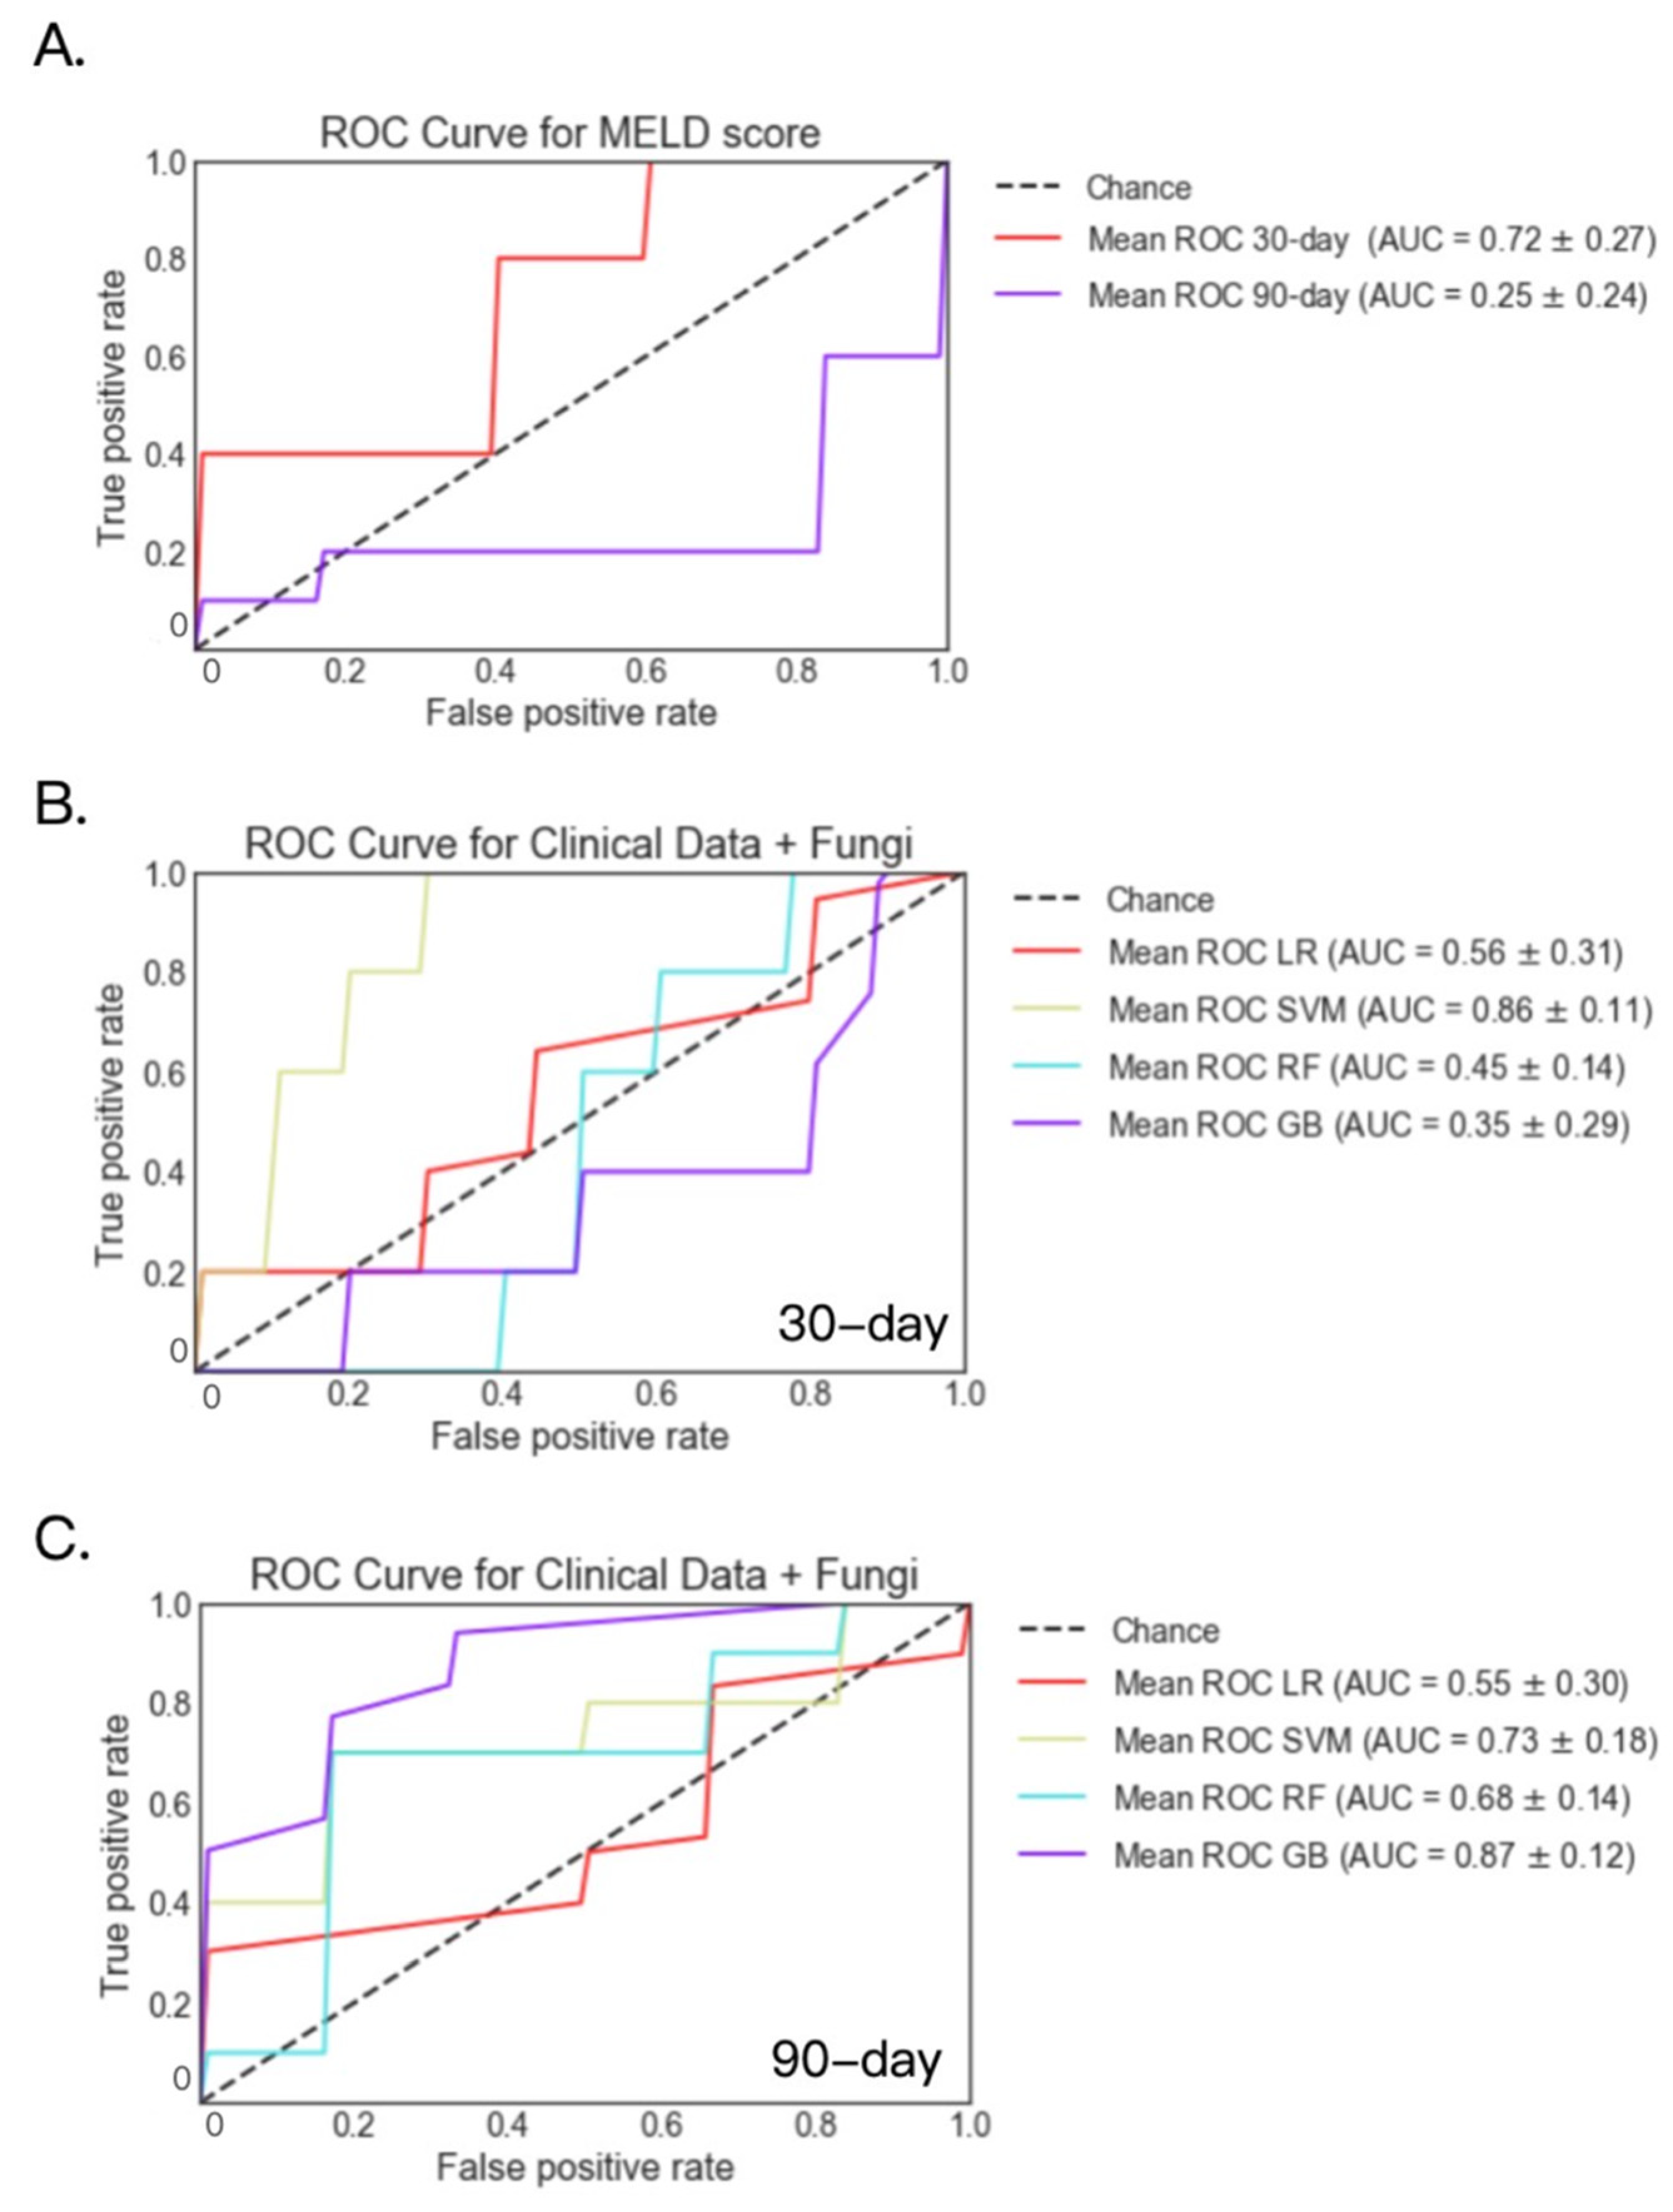
2.4. Fecal Fungal Datasets
2.5. Fecal Viral Datasets
2.6. Serum Metabolites and Lipids
2.7. ASCA, Zonulin and LBP
3. Discussion
4. Materials and Methods
4.1. Patients
4.2. Shotgun Metagenomics
4.3. Mycobiome Analysis
4.4. Viral Metagenomics
4.5. Untargeted Metabolomics and Lipidomics
4.6. Enzyme Linked Immunosorbent Assay (ELISA)
4.7. Machine Learning Models
Supplementary Materials
Author Contributions
Funding
Institutional Review Board Statement
Informed Consent Statement
Data Availability Statement
Acknowledgments
Conflicts of Interest
References
- Osna, N.A.; Donohue, T.M.; Kharbanda, K.K. Alcoholic Liver Disease: Pathogenesis and Current Management. Alcohol. Res. 2017, 38, 147–161. [Google Scholar]
- Sandahl, T.D.; Jepsen, P.; Thomsen, K.L.; Vilstrup, H. Incidence and Mortality of Alcoholic Hepatitis in Denmark 1999–2008: A Nationwide Population Based Cohort Study. J. Hepatol. 2011, 54, 760–764. [Google Scholar] [CrossRef]
- Dominguez, M.; Rincón, D.; Abraldes, J.G.; Miquel, R.; Colmenero, J.; Bellot, P.; García-Pagán, J.-C.; Fernández, R.; Moreno, M.; Bañares, R.; et al. A New Scoring System for Prognostic Stratification of Patients with Alcoholic Hepatitis. Am. J. Gastroenterol. 2008, 103, 2747–2756. [Google Scholar] [CrossRef]
- Llopis, M.; Cassard, A.M.; Wrzosek, L.; Boschat, L.; Bruneau, A.; Ferrere, G.; Puchois, V.; Martin, J.C.; Lepage, P.; Le Roy, T.; et al. Intestinal Microbiota Contributes to Individual Susceptibility to Alcoholic Liver Disease. Gut 2016, 65, 830–839. [Google Scholar] [CrossRef]
- Philips, C.A.; Phadke, N.; Ganesan, K.; Ranade, S.; Augustine, P. Corticosteroids, Nutrition, Pentoxifylline, or Fecal Microbiota Transplantation for Severe Alcoholic Hepatitis. Indian J. Gastroenterol. 2018, 37, 215–225. [Google Scholar] [CrossRef]
- Duan, Y.; Llorente, C.; Lang, S.; Brandl, K.; Chu, H.; Jiang, L.; White, R.C.; Clarke, T.H.; Nguyen, K.; Torralba, M.; et al. Bacteriophage Targeting of Gut Bacterium Attenuates Alcoholic Liver Disease. Nature 2019, 575, 505–511. [Google Scholar] [CrossRef] [PubMed]
- Chu, H.; Duan, Y.; Lang, S.; Jiang, L.; Wang, Y.; Llorente, C.; Liu, J.; Mogavero, S.; Bosques-Padilla, F.; Abraldes, J.G.; et al. The Candida Albicans Exotoxin Candidalysin Promotes Alcohol-Associated Liver Disease. J. Hepatol. 2020, 72, 391–400. [Google Scholar] [CrossRef]
- Lang, S.; Duan, Y.; Liu, J.; Torralba, M.G.; Kuelbs, C.; Ventura-Cots, M.; Abraldes, J.G.; Bosques-Padilla, F.; Verna, E.C.; Brown, R.S.; et al. Intestinal Fungal Dysbiosis and Systemic Immune Response to Fungi in Patients With Alcoholic Hepatitis. Hepatology 2020, 71, 522–538. [Google Scholar] [CrossRef] [PubMed]
- Jang, L.; Lang, S.; Duan, Y.; Zhang, X.; Gao, B.; Chopyk, J.; Schwanemann, L.K.; Ventura-Cots, M.; Bataller, R.; Bosques-Padilla, F.; et al. Intestinal Virome in Patients With Alcoholic Hepatitis. Hepatology 2020, 72, 2182–2196. [Google Scholar] [CrossRef]
- Saha, B.; Tornai, D.; Kodys, K.; Adejumo, A.; Lowe, P.; McClain, C.; Mitchell, M.; McCullough, A.; Dasarathy, S.; Kroll-Desrosiers, A.; et al. Biomarkers of Macrophage Activation and Immune Danger Signals Predict Clinical Outcomes in Alcoholic Hepatitis. Hepatology 2019, 70, 1134–1149. [Google Scholar] [CrossRef] [PubMed]
- Heelan, B.T.; Allan, S.; Barnes, R.M. Identification of a 200-KDa Glycoprotein Antigen of Saccharomyces Cerevisiae. Immunol. Lett. 1991, 28, 181–185. [Google Scholar] [CrossRef]
- Wang, L.; Llorente, C.; Hartmann, P.; Yang, A.-M.; Chen, P.; Schnabl, B. Methods to Determine Intestinal Permeability and Bacterial Translocation during Liver Disease. J. Immunol. Methods 2015, 421, 44–53. [Google Scholar] [CrossRef] [Green Version]
- Fasano, A. Zonulin and Its Regulation of Intestinal Barrier Function: The Biological Door to Inflammation, Autoimmunity, and Cancer. Physiol. Rev. 2011, 91, 151–175. [Google Scholar] [CrossRef] [Green Version]
- Gutsmann, T.; Müller, M.; Carroll, S.F.; MacKenzie, R.C.; Wiese, A.; Seydel, U. Dual Role of Lipopolysaccharide (LPS)-Binding Protein in Neutralization of LPS and Enhancement of LPS-Induced Activation of Mononuclear Cells. Infect. Immun. 2001, 69, 6942–6950. [Google Scholar] [CrossRef] [Green Version]
- Chiappini, F.; Coilly, A.; Kadar, H.; Gual, P.; Tran, A.; Desterke, C.; Samuel, D.; Duclos-Vallée, J.-C.; Touboul, D.; Bertrand-Michel, J.; et al. Metabolism Dysregulation Induces a Specific Lipid Signature of Nonalcoholic Steatohepatitis in Patients. Sci. Rep. 2017, 7, 46658. [Google Scholar] [CrossRef] [Green Version]
- Caussy, C.; Tripathi, A.; Humphrey, G.; Bassirian, S.; Singh, S.; Faulkner, C.; Bettencourt, R.; Rizo, E.; Richards, L.; Xu, Z.Z.; et al. A Gut Microbiome Signature for Cirrhosis Due to Nonalcoholic Fatty Liver Disease. Nat. Commun. 2019, 10, 1406. [Google Scholar] [CrossRef]
- European Association for the Study of Liver EASL Clinical Practical Guidelines: Management of Alcoholic Liver Disease. J. Hepatol. 2012, 57, 399–420. [CrossRef]
- Forrest, E.H.; Atkinson, S.R.; Richardson, P.; Masson, S.; Ryder, S.; Thursz, M.R.; Allison, M. STOPAH trial Management Group Application of Prognostic Scores in the STOPAH Trial: Discriminant Function Is No Longer the Optimal Scoring System in Alcoholic Hepatitis. J. Hepatol. 2018, 68, 511–518. [Google Scholar] [CrossRef] [PubMed] [Green Version]
- Wu, C.-C.; Yeh, W.-C.; Hsu, W.-D.; Islam, M.M.; Nguyen, P.A.A.; Poly, T.N.; Wang, Y.-C.; Yang, H.-C.; Jack Li, Y.-C. Prediction of Fatty Liver Disease Using Machine Learning Algorithms. Comput. Methods Programs Biomed. 2019, 170, 23–29. [Google Scholar] [CrossRef] [PubMed]
- Wei, R.; Wang, J.; Wang, X.; Xie, G.; Wang, Y.; Zhang, H.; Peng, C.-Y.; Rajani, C.; Kwee, S.; Liu, P.; et al. Clinical Prediction of HBV and HCV Related Hepatic Fibrosis Using Machine Learning. EBioMedicine 2018, 35, 124–132. [Google Scholar] [CrossRef] [PubMed] [Green Version]
- Oh, T.G.; Kim, S.M.; Caussy, C.; Fu, T.; Guo, J.; Bassirian, S.; Singh, S.; Madamba, E.V.; Bettencourt, R.; Richards, L.; et al. A Universal Gut Microbiome-Derived Signature Predicts Cirrhosis. Cell Metab. 2020, 32, 878–888.e6. [Google Scholar] [CrossRef] [PubMed]
- Samant, S.; Lee, H.; Ghassemi, M.; Chen, J.; Cook, J.L.; Mankin, A.S.; Neyfakh, A.A. Nucleotide Biosynthesis Is Critical for Growth of Bacteria in Human Blood. PLoS Pathog. 2008, 4, e37. [Google Scholar] [CrossRef]
- Gao, B.; Lang, S.; Duan, Y.; Wang, Y.; Shawcross, D.L.; Louvet, A.; Mathurin, P.; Ho, S.B.; Stärkel, P.; Schnabl, B. Serum and Fecal Oxylipins in Patients with Alcohol-Related Liver Disease. Dig. Dis. Sci. 2019, 64, 1878–1892. [Google Scholar] [CrossRef]
- Gao, B.; Emami, A.; Zhou, R.; Lang, S.; Duan, Y.; Wang, Y.; Jiang, L.; Loomba, R.; Brenner, D.; Stärkel, P.; et al. Functional Microbial Responses to Alcohol Abstinence in Patients with Alcohol Use Disorder. Front. Physiol. 2020, 11. [Google Scholar] [CrossRef] [Green Version]
- Truong, D.T.; Franzosa, E.A.; Tickle, T.L.; Scholz, M.; Weingart, G.; Pasolli, E.; Tett, A.; Huttenhower, C.; Segata, N. MetaPhlAn2 for Enhanced Metagenomic Taxonomic Profiling. Nat. Methods 2015, 12, 902–903. [Google Scholar] [CrossRef]
- Franzosa, E.A.; McIver, L.J.; Rahnavard, G.; Thompson, L.R.; Schirmer, M.; Weingart, G.; Lipson, K.S.; Knight, R.; Caporaso, J.G.; Segata, N.; et al. Species-Level Functional Profiling of Metagenomes and Metatranscriptomes. Nat. Methods 2018, 15, 962–968. [Google Scholar] [CrossRef] [PubMed]
- Caspi, R.; Billington, R.; Keseler, I.M.; Kothari, A.; Krummenacker, M.; Midford, P.E.; Ong, W.K.; Paley, S.; Subhraveti, P.; Karp, P.D. The MetaCyc Database of Metabolic Pathways and Enzymes-a 2019 Update. Nucleic Acids Res. 2020, 48, D445–D453. [Google Scholar] [CrossRef] [PubMed] [Green Version]
- Conceição-Neto, N.; Yinda, K.C.; Van Ranst, M.; Matthijnssens, J. NetoVIR: Modular Approach to Customize Sample Preparation Procedures for Viral Metagenomics. Methods Mol. Biol. 2018, 1838, 85–95. [Google Scholar] [CrossRef] [PubMed]
- Kostic, A.D.; Ojesina, A.I.; Pedamallu, C.S.; Jung, J.; Verhaak, R.G.W.; Getz, G.; Meyerson, M. PathSeq: Software to Identify or Discover Microbes by Deep Sequencing of Human Tissue. Nat. Biotechnol. 2011, 29, 393–396. [Google Scholar] [CrossRef] [Green Version]
- Gao, B.; Lue, H.-W.; Podolak, J.; Fan, S.; Zhang, Y.; Serawat, A.; Alumkal, J.J.; Fiehn, O.; Thomas, G.V. Multi-Omics Analyses Detail Metabolic Reprogramming in Lipids, Carnitines, and Use of Glycolytic Intermediates between Prostate Small Cell Neuroendocrine Carcinoma and Prostate Adenocarcinoma. Metabolites 2019, 9, 82. [Google Scholar] [CrossRef] [Green Version]
- Skogerson, K.; Wohlgemuth, G.; Barupal, D.K.; Fiehn, O. The Volatile Compound BinBase Mass Spectral Database. BMC Bioinform. 2011, 12, 321. [Google Scholar] [CrossRef] [Green Version]
- Tsugawa, H.; Cajka, T.; Kind, T.; Ma, Y.; Higgins, B.; Ikeda, K.; Kanazawa, M.; VanderGheynst, J.; Fiehn, O.; Arita, M. MS-DIAL: Data-Independent MS/MS Deconvolution for Comprehensive Metabolome Analysis. Nat. Methods 2015, 12, 523–526. [Google Scholar] [CrossRef] [PubMed]
- Schrimpe-Rutledge, A.C.; Codreanu, S.G.; Sherrod, S.D.; McLean, J.A. Untargeted Metabolomics Strategies—Challenges and Emerging Directions. J. Am. Soc. Mass Spectrom. 2016, 27, 1897–1905. [Google Scholar] [CrossRef] [PubMed] [Green Version]
- DeFelice, B.C.; Mehta, S.S.; Samra, S.; Čajka, T.; Wancewicz, B.; Fahrmann, J.F.; Fiehn, O. Mass Spectral Feature List Optimizer (MS-FLO): A Tool To Minimize False Positive Peak Reports in Untargeted Liquid Chromatography–Mass Spectroscopy (LC-MS) Data Processing. Anal. Chem. 2017, 89, 3250–3255. [Google Scholar] [CrossRef] [PubMed]
- Hosmer, D.W., Jr.; Lemeshow, S.; Sturdivant, R.X. Applied Logistic Regression, 3rd ed.; John Wiley & Sons: New York, NY, USA, 2013. [Google Scholar]
- Cortes, C.; Vapnik, V. Support-Vector Networks. Mach. Learn. 1995, 20, 273–297. [Google Scholar] [CrossRef]
- Breiman, L. Random Forests. Mach. Learn. 2001, 45, 5–32. [Google Scholar] [CrossRef] [Green Version]
- Friedman, J.H. Greedy Function Approximation: A Gradient Boosting Machine. Ann. Statist. 2001, 29, 1189–1232. [Google Scholar] [CrossRef]
- Azur, M.J.; Stuart, E.A.; Frangakis, C.; Leaf, P.J. Multiple Imputation by Chained Equations: What Is It and How Does It Work? Int. J. Methods Psychiatr. Res. 2011, 20, 40–49. [Google Scholar] [CrossRef] [PubMed]
- Chawla, N.V.; Bowyer, K.W.; Hall, L.O.; Kegelmeyer, W.P. SMOTE: Synthetic Minority over-Sampling Technique. J. Artif. Intell. Res. 2002, 16, 321–357. [Google Scholar] [CrossRef]
- Wright, M.N.; Ziegler, A. Ranger: A Fast Implementation of Random Forests for High Dimensional Data in C++ and R. J. Stat. Softw. 2017, 77, 1–17. [Google Scholar] [CrossRef] [Green Version]


| Clinical Parameters | Alcoholic Hepatitis (n = 210) | |
|---|---|---|
| Sex (% male), n (%), n = 208 | 138 (66.3%) | |
| Age (years), n = 198 | 49.3 (26.4–74.8) | |
| BMI (kg/m2), n = 165 | 28.2 (16.2–48.3) | |
| Laboratory parameter | ||
| Creatinine (mg/dL), n = 195 | 1.1 (0.3–8.1) | |
| Bilirubin (mg/dL), n = 194 | 16.0 (2.5–51.8) | |
| AST (IU/L), n = 195 | 165.2 (34.0–1858.0) | |
| ALT (IU/L), n = 194 | 57.5 (14.0–404.0) | |
| Albumin (g/dL), n = 188 | 2.6 (1.1–4.2) | |
| INR, n = 194 | 1.9 (0.8–7.6) | |
| GGT (IU/L), n = 114 | 602.6 (33.0–3650.0) | |
| Platelet count (109/L), n = 191 | 136.5 (12.2–447.0) | |
| Alkaline phosphatase (U/L), n = 192 | 207.6 (21.2–1153.0) | |
| Prothrombin time, s, n = 168 | 29.3 (9.0–141.0) | |
| Sodium (mEq/L), n = 194 | 133.0 (106.0–148.0) | |
| FIB-4, n = 189 | 11.5 (0.7–116.0) | |
| FIB-4 > 3.25 (F3-F4), n (%) | 171 (90.5%) | |
| Treatment at admission | ||
| Steroids, n (%), n = 193 | 83 (43.0%) | |
| Antibiotics, n (%), n = 193 | 53 (27.5%) | |
| Proton pump inhibitors, n (%), n = 98 | 13 (13.3%) | |
| Infections, n (%), n = 158 | 41 (25.9%) | |
| Clinical scores and outcome | ||
| MELD, median (range), n = 192 | 26.8 (10.1–48.6) | |
| MELD > 21, n (%) | 158 (82.3%) | |
| 30-day mortality (n = 210) | 31 (14.8%) | |
| 90-day mortality (n = 158) | 54 (34.2%) | |
| Histology | ||
| Liver biopsy available, n (%), n = 197 | 120 (60.9%) | |
| Stage of fibrosis, n (%), n = 118 | 0 | 3 (2.5%) |
| 1 | 3 (2.5%) | |
| 2 | 15 (12.7%) | |
| 3 | 18 (15.3%) | |
| 4 | 79 (66.9%) |
| Clinical Data | Clinical Data + Bacteria + MetaCyc Pathways | Clinical Data + Fungi | |
| 30-day | age | international normalized ratio | creatinine |
| creatinine | creatinine | international normalized ratio | |
| bilirubin | sodium | bilirubin | |
| albumin | PWY-6125: superpathway of guanosine nucleotides de novo biosynthesis II | sodium | |
| international normalized ratio | DTDPRHAMSYN-PWY: dTDP-L-rhamnose biosynthesis I | Aspergillus | |
| alanine transaminase | PWY-7229: superpathway of adenosine nucleotides de novo biosynthesis I | alkaline phosphatase | |
| alkaline phosphatase | PWY-7222: guanosine deoxyribonucleotides de novo biosynthesis II | age | |
| platelet count | PWY-7228: superpathway of guanosine nucleotides de novo biosynthesis I | aspartate transaminase | |
| white blood cell count | PANTO-PWY: phosphopantothenate biosynthesis I | platelets | |
| aspartate transaminase | PWY-6126: superpathway of adenosine nucleotides de novo biosynthesis II | alanine transaminase | |
| sodium | PWY-7220: adenosine deoxyribonucleotides de novo biosynthesis II | white blood cell count | |
| 90-day | age | international normalized ratio | creatinine |
| creatinine | creatinine | bilirubin | |
| bilirubin | bilirubin | sodium | |
| albumin | sodium | international normalized ratio | |
| international normalized ratio | PWY-7229: superpathway of adenosine nucleotides de novo biosynthesis I | age | |
| alanine transaminase | DTDPRHAMSYN-PWY: dTDP-L-rhamnose biosynthesis I | albumin | |
| alkaline phosphatase | GLUCOSE1PMETAB-PWY: glucose and glucose-1 phosphate degradation | alkaline phosphatase | |
| platelet count | PWY-5989: stearate biosynthesis II bacteria and plants | aspartate transaminase | |
| white blood cell count | Clostridium nexile | platelets | |
| aspartate transaminase | PWY0-1297: superpathway of purine deoxyribonucleosides degradation | white blood cell count | |
| sodium | PWY-6125: superpathway of guanosine nucleotides de novo biosynthesis II | alanine transaminase | |
| Clinical Data + Virus | Clinical Data + ELISA | Clinical Data + Metabolites + Lipids | |
| 30-day | creatinine | creatinine | creatinine |
| international normalized ratio | international normalized ratio | L-Hydroxyarginine | |
| bilirubin | bilirubin | bilirubin | |
| sodium | Zonulin | Urea | |
| Epsilon15 virus | albumin | Pseudo uridine | |
| aspartate transaminase | sodium | Maltose | |
| P22 virus | Lipopolysaccharide binding protein | Erythritol | |
| Lambda virus | Anti-Saccharomyces cerevisiae antibodies | Metabolite creatinine | |
| alkaline phosphatase | age | S-adenosyl homocysteine | |
| alanine transaminase | platelets | L-Carnitine | |
| age | alanine transaminase | Adenine | |
| 90-day | creatinine | creatinine | creatinine |
| international normalized ratio | international normalized ratio | international normalized ratio | |
| bilirubin | bilirubin | L-Homocitrulline | |
| sodium | age | Lyxitol | |
| age | Anti-Saccharomyces cerevisiae antibodies | Pseudo uridine | |
| albumin | sodium | L-Hydroxyarginine | |
| alanine transaminase | white blood cell count | Adipoyl-L-carnitine | |
| alkaline phosphatase | Zonulin | Asymmetric dimethylarginine | |
| Epsilon15 virus | albumin | sodium | |
| platelets | Lipopolysaccharide binding protein | Acyl carnitines | |
| white blood cell count | alkaline phosphatase | Kynurenic acid |
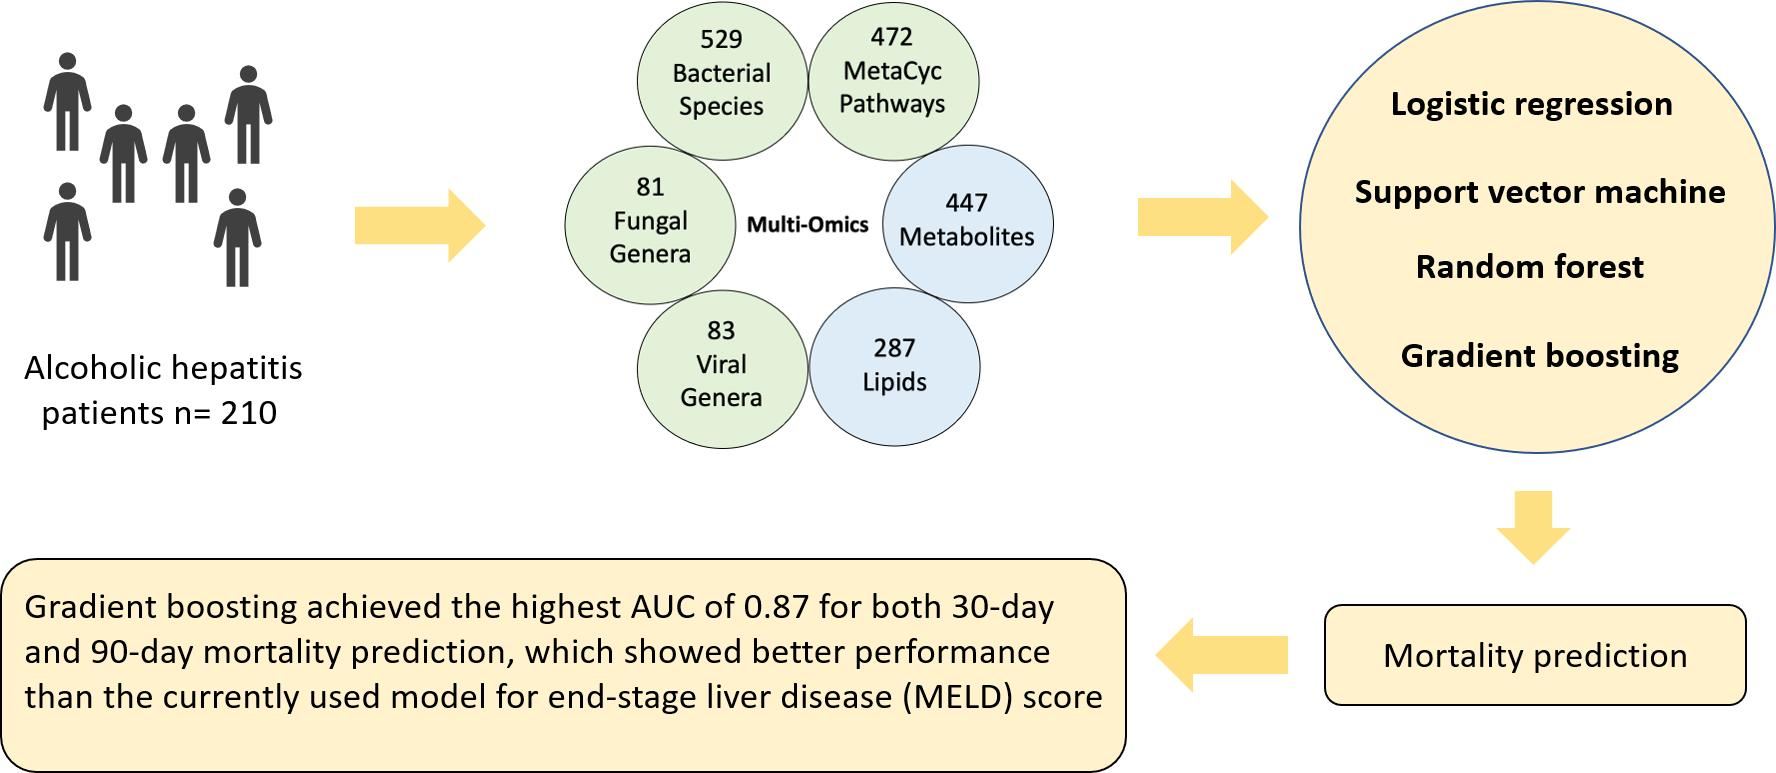
| Model | Clinical Data | Clinical Data + Bacteria + Metacyc Pathways | Clinical Data + Fungi | Clinical Data + Virus | Clinical Data + Metabolites + Lipids | Clinical Data + ELISA | |
|---|---|---|---|---|---|---|---|
| 30-day Mortality | LR(MELD) | 0.78 | 0.79 | 0.72 | 0.72 | 0.77 | 0.77 |
| LR | 0.74 | 0.59 | 0.56 | 0.87 | 0.65 | 0.72 | |
| SVM | 0.76 | 0.68 | 0.86 | 0.80 | 0.74 | 0.74 | |
| RF | 0.79 | 0.83 | 0.45 | 0.74 | 0.73 | 0.76 | |
| GB | 0.81 | 0.87 | 0.35 | 0.69 | 0.71 | 0.69 | |
| 90-day Mortality | LR(MELD) | 0.82 | 0.63 | 0.25 | 0.67 | 0.83 | 0.79 |
| LR | 0.80 | 0.67 | 0.55 | 0.62 | 0.67 | 0.64 | |
| SVM | 0.80 | 0.69 | 0.73 | 0.63 | 0.69 | 0.64 | |
| RF | 0.80 | 0.54 | 0.68 | 0.53 | 0.78 | 0.71 | |
| GB | 0.79 | 0.47 | 0.87 | 0.58 | 0.71 | 0.71 |
Publisher’s Note: MDPI stays neutral with regard to jurisdictional claims in published maps and institutional affiliations. |
© 2022 by the authors. Licensee MDPI, Basel, Switzerland. This article is an open access article distributed under the terms and conditions of the Creative Commons Attribution (CC BY) license (https://creativecommons.org/licenses/by/4.0/).
Share and Cite
Gao, B.; Wu, T.-C.; Lang, S.; Jiang, L.; Duan, Y.; Fouts, D.E.; Zhang, X.; Tu, X.-M.; Schnabl, B. Machine Learning Applied to Omics Datasets Predicts Mortality in Patients with Alcoholic Hepatitis. Metabolites 2022, 12, 41. https://doi.org/10.3390/metabo12010041
Gao B, Wu T-C, Lang S, Jiang L, Duan Y, Fouts DE, Zhang X, Tu X-M, Schnabl B. Machine Learning Applied to Omics Datasets Predicts Mortality in Patients with Alcoholic Hepatitis. Metabolites. 2022; 12(1):41. https://doi.org/10.3390/metabo12010041
Chicago/Turabian StyleGao, Bei, Tsung-Chin Wu, Sonja Lang, Lu Jiang, Yi Duan, Derrick E. Fouts, Xinlian Zhang, Xin-Ming Tu, and Bernd Schnabl. 2022. "Machine Learning Applied to Omics Datasets Predicts Mortality in Patients with Alcoholic Hepatitis" Metabolites 12, no. 1: 41. https://doi.org/10.3390/metabo12010041