Article

Metabolomic Signatures in Doxorubicin-Induced Metabolites Characterization, Metabolic Inhibition, and Signaling Pathway Mechanisms in Colon Cancer HCT116 Cells

by
Raja Ganesan
1,2,*,†,
Vasantha-Srinivasan Prabhakaran
3 and
Abilash Valsala Gopalakrishnan
4,*,†
1
Institute for Liver and Digestive Diseases, College of Medicine, Hallym University, Chuncheon 24253, Korea
2
Department of Biological Sciences, Pusan National University, Busan 46241, Korea
3
Department of Bioinformatics, Saveetha School of Engineering, Saveetha Institute of Medical and Technical Sciences (SIMATS), Chennai 602105, India
4
Department of Biomedical Sciences, School of Biosciences and Technology, Vellore Institute of Technology (VIT), Vellore 632014, India
*
Authors to whom correspondence should be addressed.
These authors contributed equally to this work.
Metabolites 2022, 12(11), 1047; https://doi.org/10.3390/metabo12111047
Submission received: 28 September 2022 / Revised: 19 October 2022 / Accepted: 28 October 2022 / Published: 31 October 2022
(This article belongs to the Special Issue Is Cancer a Metabolic Disease? The Answer of Metabolomics Volume 2)

Abstract

:
Doxorubicin (DOX) is a chemotherapeutic agent is used for various cancer cells. To characterize the chemical structural components and metabolic inhibition, we applied a DOX to HCT116 colon cancer cells using an independent metabolites profiling approach. Chemical metabolomics has been involved in the new drug delivery systems. Metabolomics profiling of DOX-applied HCT116 colon cancer cellular metabolisms is rare. We used 1H nuclear magnetic resonance (NMR) spectroscopy in this study to clarify how DOX exposure affected HCT116 colon cancer cells. Metabolomics profiling in HCT116 cells detects 50 metabolites. Tracking metabolites can reveal pathway activities. HCT116 colon cancer cells were evenly treated with different concentrations of DOX for 24 h. The endogenous metabolites were identified by comparison with healthy cells. We found that acetate, glucose, glutamate, glutamine, sn-glycero-3-phosphocholine, valine, methionine, and isoleucine were increased. Metabolic expression of alanine, choline, fumarate, taurine, o-phosphocholine, inosine, lysine, and phenylalanine was decreased in HCT116 cancer cells. The metabolic phenotypic expression is markedly altered during a high dose of DOX. It is the first time that there is a metabolite pool and phenotypic expression in colon cancer cells. Targeting the DOX-metabolite axis may be a novel strategy for improving the curative effect of DOX-based therapy for colon cancer cells. These methods facilitate the routine metabolomic analysis of cancer cells.

1. Introduction

Colorectal carcinoma is the world’s third most commonly diagnosed cancer and the second most common cause of death from cancer [1]. Chemotherapeutic drugs of doxorubicin hydrochloride (DOX) have been utilized to eradicate leukemia cells due to their anticancer activity and inhibition of tumorigenesis by reducing cell division. However, DOX-based drug resistance has limited their utility [2,3]. The development of novel cancer therapeutics relies heavily on in vivo systems. At the same time, cancer cell lines provide a comprehensive dataset of the alterations in the metabolite levels in cancer cells and can produce significant information [4]. DOX is used as a chemotherapeutic drug for many cancers. Clinicians frequently need to reduce the dose, reducing efficacy [5,6].
Metabolomics studies have already shown alterations in colon cancer metabolites [7,8,9,10]. Metabolomics is typically performed using millions of cells, cultured cells, and tumor specimens [11,12]. Metabolomics has been a great study for comprehensive small-molecule analysis. The small molecules (e.g., sugars, amino acids, proteins, nucleic acids, and lipids) are essential for improving the overall quality of disease and are required for palliative care [13]. As a result, metabolites serve as the strongest predictors of cellular phenotypic expression and reveal substantial changes inside cancer cells [14,15]. Additionally, metabolites can interact with other biomolecules expressed in sick cells. Today, NMR spectroscopy’s metabolomic profiling in cancer cells is a rapidly advancing technology.
Herein, we describe an evaluating biomimetic pattern in colorectal carcinoma (HCT116 cancer cells) using metabolomics analysis that was proposed for investigating the DOX-applied metabolic pathways in cells. We also evaluate how the DOX treatment of HCT116 cancer cells affected their metabolic pathways. The experimental analyses in this work utilize cytotoxicity and metabolomics approaches. Herein, we demonstrate a practical approach to DOX-applied cellular viability, metabolic pathways, and metabolic discrimination in colon cancer cells. We provide strong evidence that cancer metabolic phenotypes reflect DOX-associated systemic metabolic changes.

2. Materials and Methods

2.1. Chemicals and Reagents

Doxorubicin hydrochloride (DOX; Product Number: D1515; CAS Number: 25316-40-9; formula: C27H29NO11.HCL) was obtained from Sigma–Aldrich Chemicals (St. Louis, MO, USA). DOX has a molecular weight of 579.98 g/mol and is in the form of powder. Methanol (CH3OH) and chloroform (CHCl3) were purchased from Sigma–Aldrich. Dulbecco’s Modified Eagle’s medium (DMEM; Lot No: 09221712, GenDEPOT, St. Louis, MI, USA) and 10% (v/v) fetal bovine serum (FBS; Lot No: WB0009) were purchased from GE Healthcare Life Science (Queensland, Australia). HCT116 colon cancer cells were purchased from American Type Culture Collection (ATCC; Manassas, VA, USA). TSP-d4 is a 3-(trimethylsilyl) propionic acid that was purchased from Cambridge Isotope Laboratories in the United States.

2.2. DOX Solution Preparation

DOX was distributed in an aqueous media in accordance with earlier findings [16,17]. Briefly, 0.75, 1.5, and 7.5 µg/mL of DOX was added to 1% (w/v) bovine serum albumin (BSA) in 2 mL phosphate buffer solution (PBS). In order to improve the dispersibility of DOX, BSA was utilized. The obtained suspensions were then dispersed using a homogenizer with 200 W for 10–15 min under sterile conditions. After centrifugation at 2000× g for 15 min, insoluble DOX aggregates in the pellets were removed, and the supernatants were further homogenized by ultrasonic dispersive technology at 200 W for 15 min under sterile conditions. Cells were homogenized using a Precellys24 (PeqLab, Erlangen, Germany). The resulting DOX dispersions were kept at 4 °C for further research. Each solution was made with Milli-Q water with a resistivity (ultrapure water: 18.2 MΩ·cm).

2.3. Cell Culture and DOX Treatments

HCT116 colorectal cancer cells (HCT116 cells) (5 × 10⁶ cells per well) were cultured in DMEM supplemented with 10% (v/v) FBS and 1% (v/v) penicillin/streptomycin. The cells we employed in this work were passaged 2 to 5 times and kept in DMEM at 37 °C with 5% CO2 at subconfluence conditions.
Furthermore, HCT116 cells were incubated for at least 24 h with L-glutamine (1%, 2.0 mm), FBS (10%), penicillin (100 U/mL), streptomycin (100 µg/mL), and gentamycin (1 mL) at 5% CO2 incubator in 37 °C. Cells were stained with trypan blue dye (0.04%) once cell confluency was attained, and hemocytometer measurements were made. DOX was sonicated for 15 min before addition. HCT116 cells were evenly divided into four different concentrations (Control, 0; 0.75, 1.5, and 7.5 µg/mL DOX; n = 6) and incubated for 24 h at 37 °C.

2.4. WST-8 Cell Viability Assay

According to previous tests [18], HCT116 cells were seeded in 96-well plates at 5 × 10³ cells per well, leaving them to adhere for 24 h. Then culture medium was changed by DOX different concentrations for 24 h. After incubation, highly sensitive water-soluble tetrazolium salt (WST-8; 10 μL/mL) was added to each well, and cell cytotoxicity was measured using a Cellrix® viability assay kit (Seoul, Korea). Cell viability was calculated by normalizing the absorbance at 450 nm. The non-DOX-treated cells were considered to be 100% viable.

2.5. Isolation of HCT116 Cells and Quenching Metabolome

Samples were prepared for metabolomics analysis as previously described [16,19,20]. First, 2 mL of medium for each sample was collected after 24 h, frozen in liquid nitrogen, and stored at −80 °C. All samples were allowed to thaw for 5 min. Next, 80 µL of chloroform was added to the samples at 4 °C and left to incubate for 30 min. Samples were then homogenized by vortexing and transferred to a 1.5 mL plastic tube. Next, 125 µL of deionized water and 125 µL of chloroform were added at 4 °C and vortexed again. For phase separation, samples were centrifuged at 13,000× g for 20 min at 4 °C. Subsequently, the two phases found in the aqueous phase (top: polar metabolites) and the organic phase (bottom: nonpolar metabolites) were separated into different tubes. The aqueous phase (polar metabolites) was lyophilized overnight to remove methanol and water.
A lot of research was conducted on the outcomes of cell quenching in liquid nitrogen. This typically serves as the initial step in various extraction techniques (immediately following the removal of the growing medium) right before cell washing to remove the medium residues. However, it was found in this study that washing the DOX-applied HCT116 cells after the quenching stage resulted in a considerable loss of the cell metabolites, most likely because the freezing step causes the cell wall to collapse, resulting in metabolite leakage. Quenching and washing were performed in reverse order to solve this issue.
Samples were allowed to thaw for 5 min. Then, 400 µL of all samples was diluted with 100 µL of buffer solution to a final concentration of 150 mM with phosphate buffer (pH: 7.2 in 100% D2O) containing 1 mM TSP-d4 as an internal standard. This solution was then added to the aqueous phase. After being vortexed and centrifuged at 12,000× g for 5 min, the supernatant from the samples was transferred in the amount of 550 µL to a 5 mm NMR tube.

2.6. Instrumentation of NMR and Data Files

NMR data were analyzed as previously described [16,21]. Briefly, 1D proton (1H)-NMR spectra were recorded at 26 °C using a Bruker Advance 600 MHz NMR spectrometer (Billerica, MA, USA). Spin-echo sequence (recycle delay-90°-(τ-180°-τ) n -acquisition) of t2- edited Carr–Purcell–Meiboom–Gill (CPMG) was used. Water-suppressed 1H-NMR spectra were acquired. Before measurements, for equilibrium maintenance, samples were kept for 5 min inside the NMR probe at 298 K. A total of 128 scans were requested. The width was found at 9615.4 Hz. 1H-spectral resonance width contained 15 to −1 ppm, and each sample took 8–10 min to be measured. The resonance of the water domain (δ 4.48–4.68) was removed. The phosphate buffer containing TSP-d4 was used as a reference at 0 ppm. The data settings of 1H (e.g., baseline, filling, and TSP adjustment at 0 ppm) were handled by using the Chenomx NMR Suite software (Chenomx Inc., Edmonton, AB, Canada).

2.7. Computational Tools and Statistical Analysis

Use of the in-house MetaboAnalyst 5.0 software, score plot analysis such as principal component analysis (PCA), and orthogonal projections to latent structures discriminant analysis (OPLS-DA) were applied to the NMR data. The goodness of fit (R2), the goodness of prediction (Q2) of the score plot, metabolite sets enrichment analysis (MSEA), and VIP scores (cutoff, >1) were assessed. The difference between R2 and Q2 decreases with the score plots’ robustness.
The logarithmic transformation of the acquired concentrations was used to reduce the impact of both noise and the high variance of the variables. Pareto scaling was applied. It can divide each variable by the square root of its standard deviation. The normalized metabolite concentrations (mM) are presented as the mean ± standard deviations (SD). p-values < 0.05 were considered to be statistically significant.

3. Results

3.1. Optimization of the Quenching and Extraction Procedures for DOX-Treated Cells

Figure 1a shows the chemical structure of DOX [22]. As per Martineau et al. [23], 1H-NMR-based metabolomics analysis to recover the cell metabolites was achieved by combining different steps. Identifying several crucial portions that needed a significant amount of optimization was possible by examining and assessing the various extraction techniques. Figure 1b shows the flowchart design and the experimental pipeline for the metabolomics analysis. All data were autoscaled before analysis. The spectral features were extracted and used for pathway analysis in extracted metabolites.

3.2. Cell Viability-Treatment with DOX in HCT116 Cells

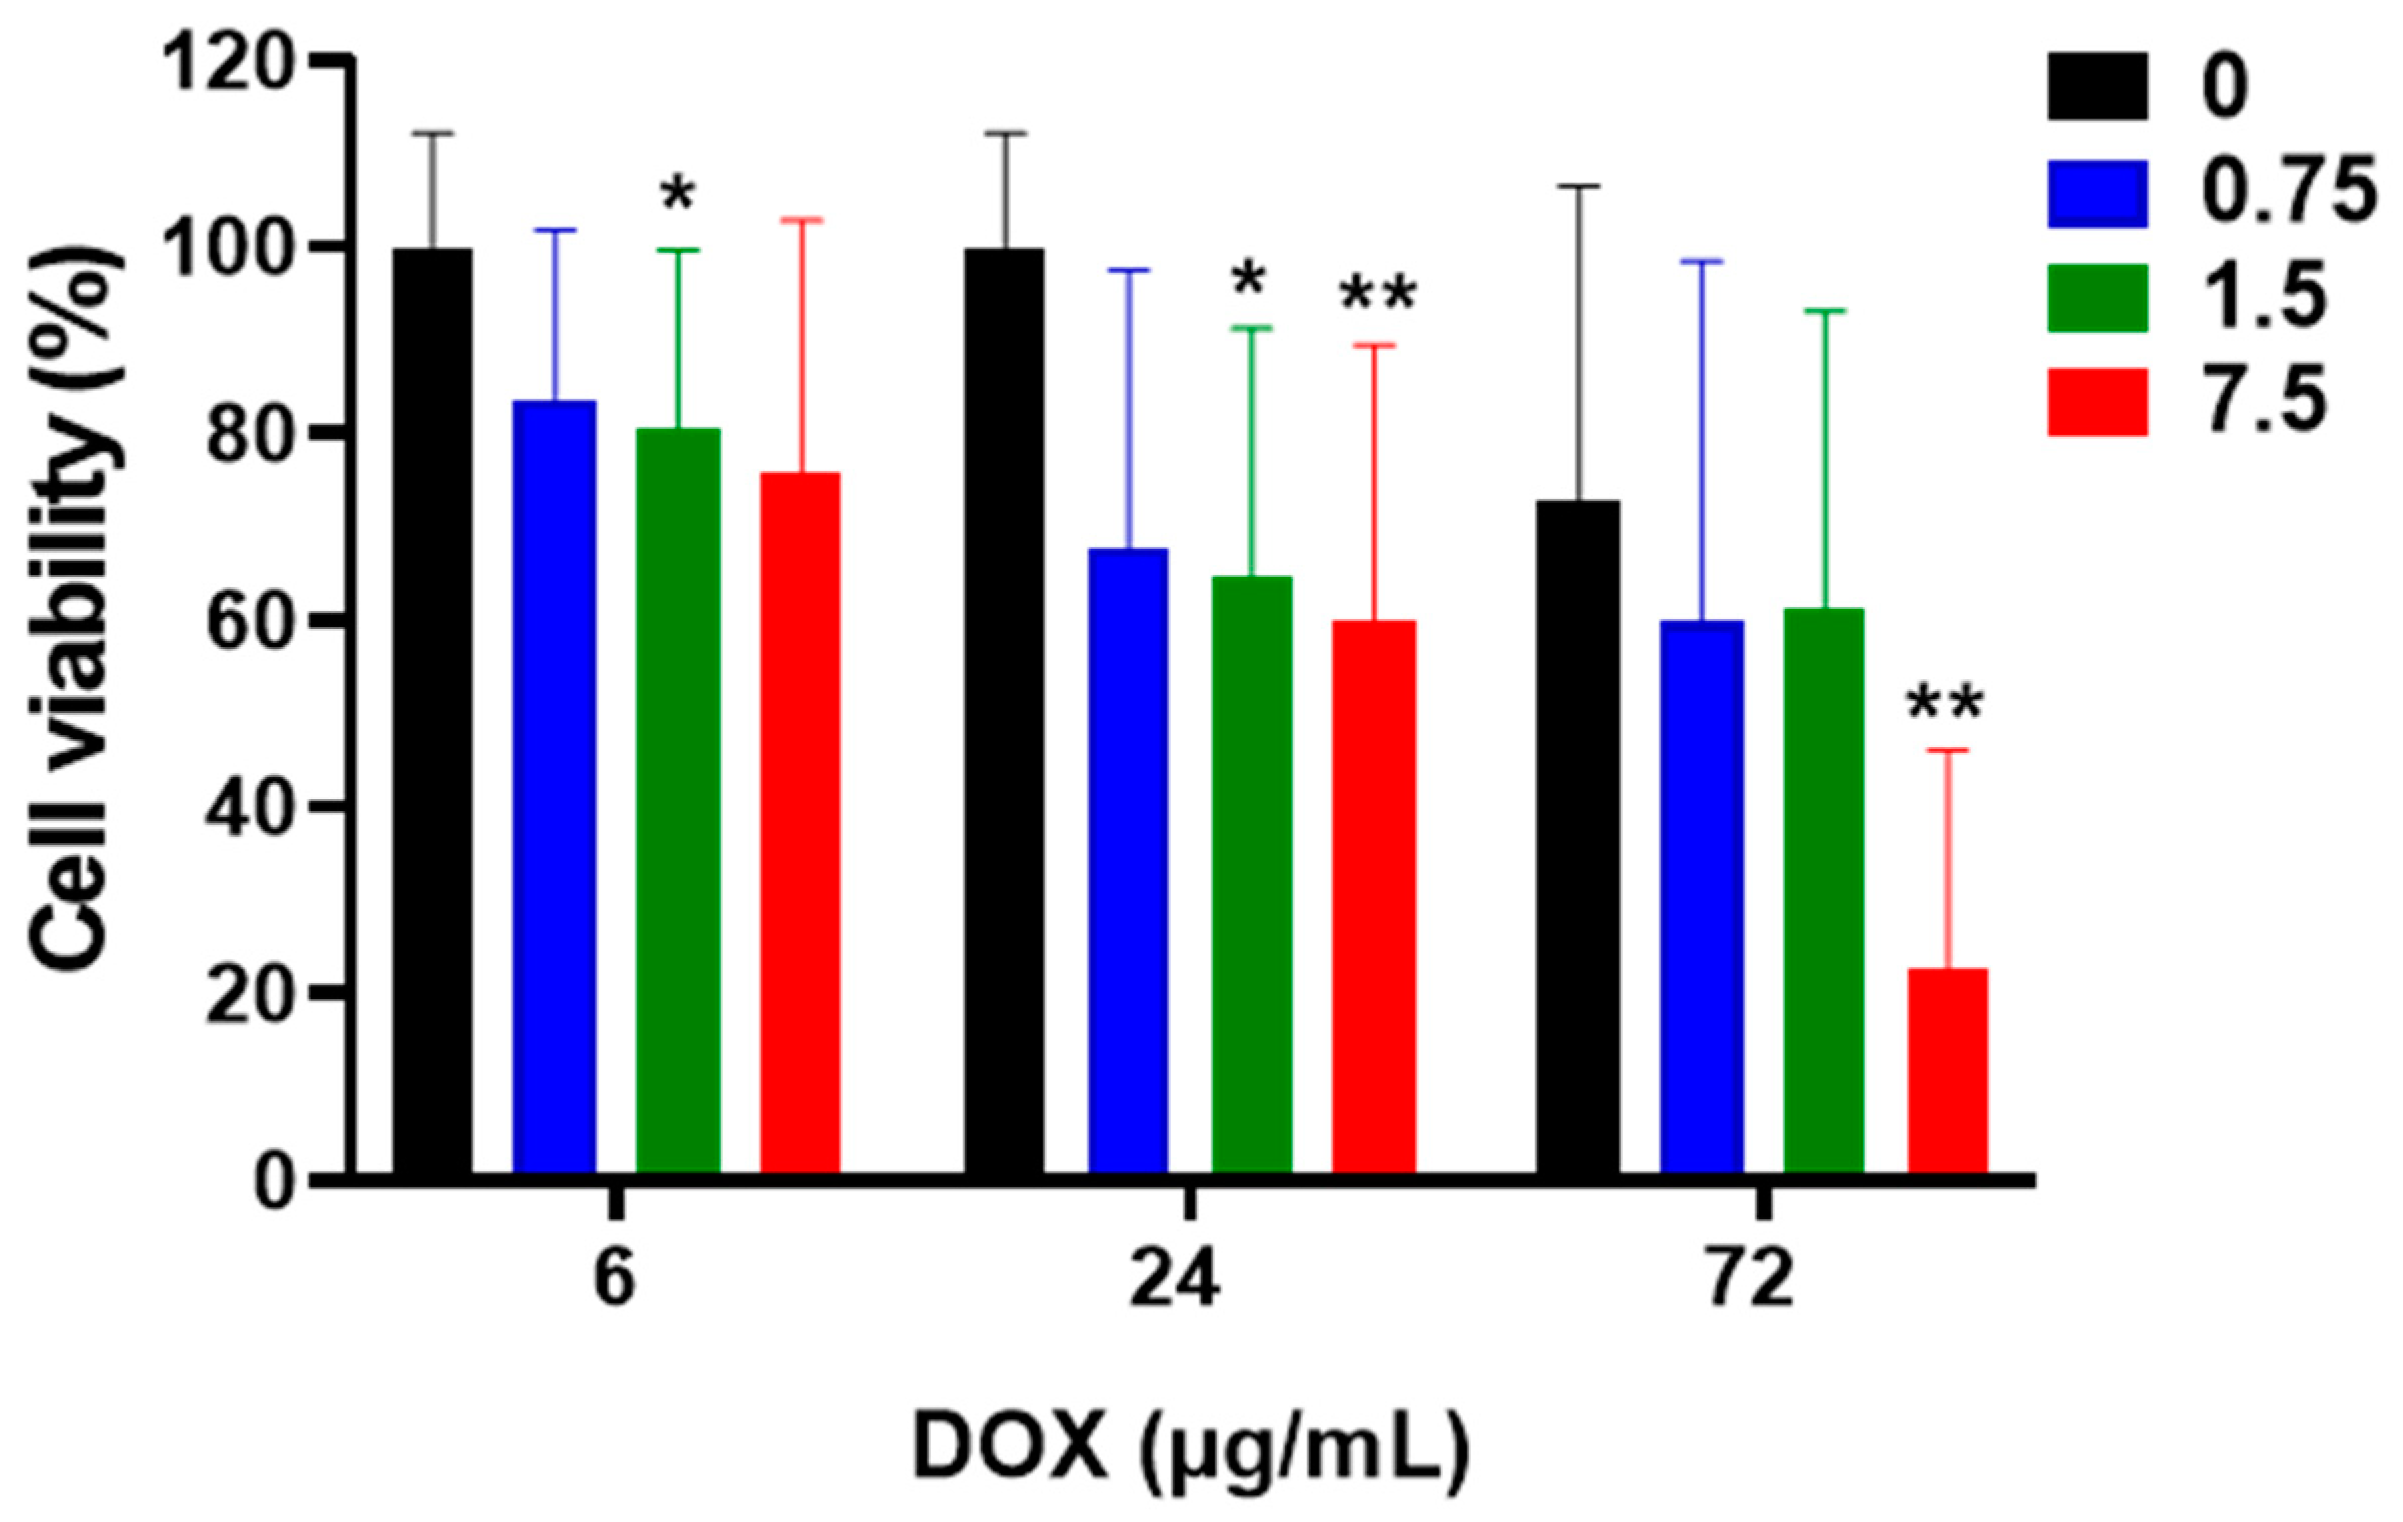
The cell viability of HCT116 cells cultured in the hypoxic environment decreased by 81 percent from 6 to 72 h. The effect of treatments with DOX and cellular viability are summarized in Figure 2.
DOX-applied HCT116 cells develop into a subconfluent monolayer, and it was discovered that it was particularly challenging to remove the cell growth media during the washing process entirely. Because of its residual signals that were dispersed throughout the central area of the NMR spectrum, glucose, one of the most prevalent components of the medium, presented special difficulties for the spectral interpretation of the extracted metabolome. There are now four washing steps instead of three to prevent this. After cleaning, the cells could be mechanically scraped off the plates, and the metabolic activity of the cells could then be quickly put to rest by liquid nitrogen.

3.3. Integration of Targeted Metabolomics Datasets

This study determined and targeted 50 metabolites with DOX concentrations using 1H-edited spectroscopic peaks. Most 1H signals fall in the 0.5–5.5 ppm region, so we focused the analysis on it. Phosphate buffer was employed as a reference. Per Pascal’s triangle, the spectral data multiplicity of DOX was calculated and calibrated. The potential metabolites were profiled and quantified using their 1H nuclei (e.g., CH, CH2, and CH3) and proton multiplicity, as shown in Table 1.
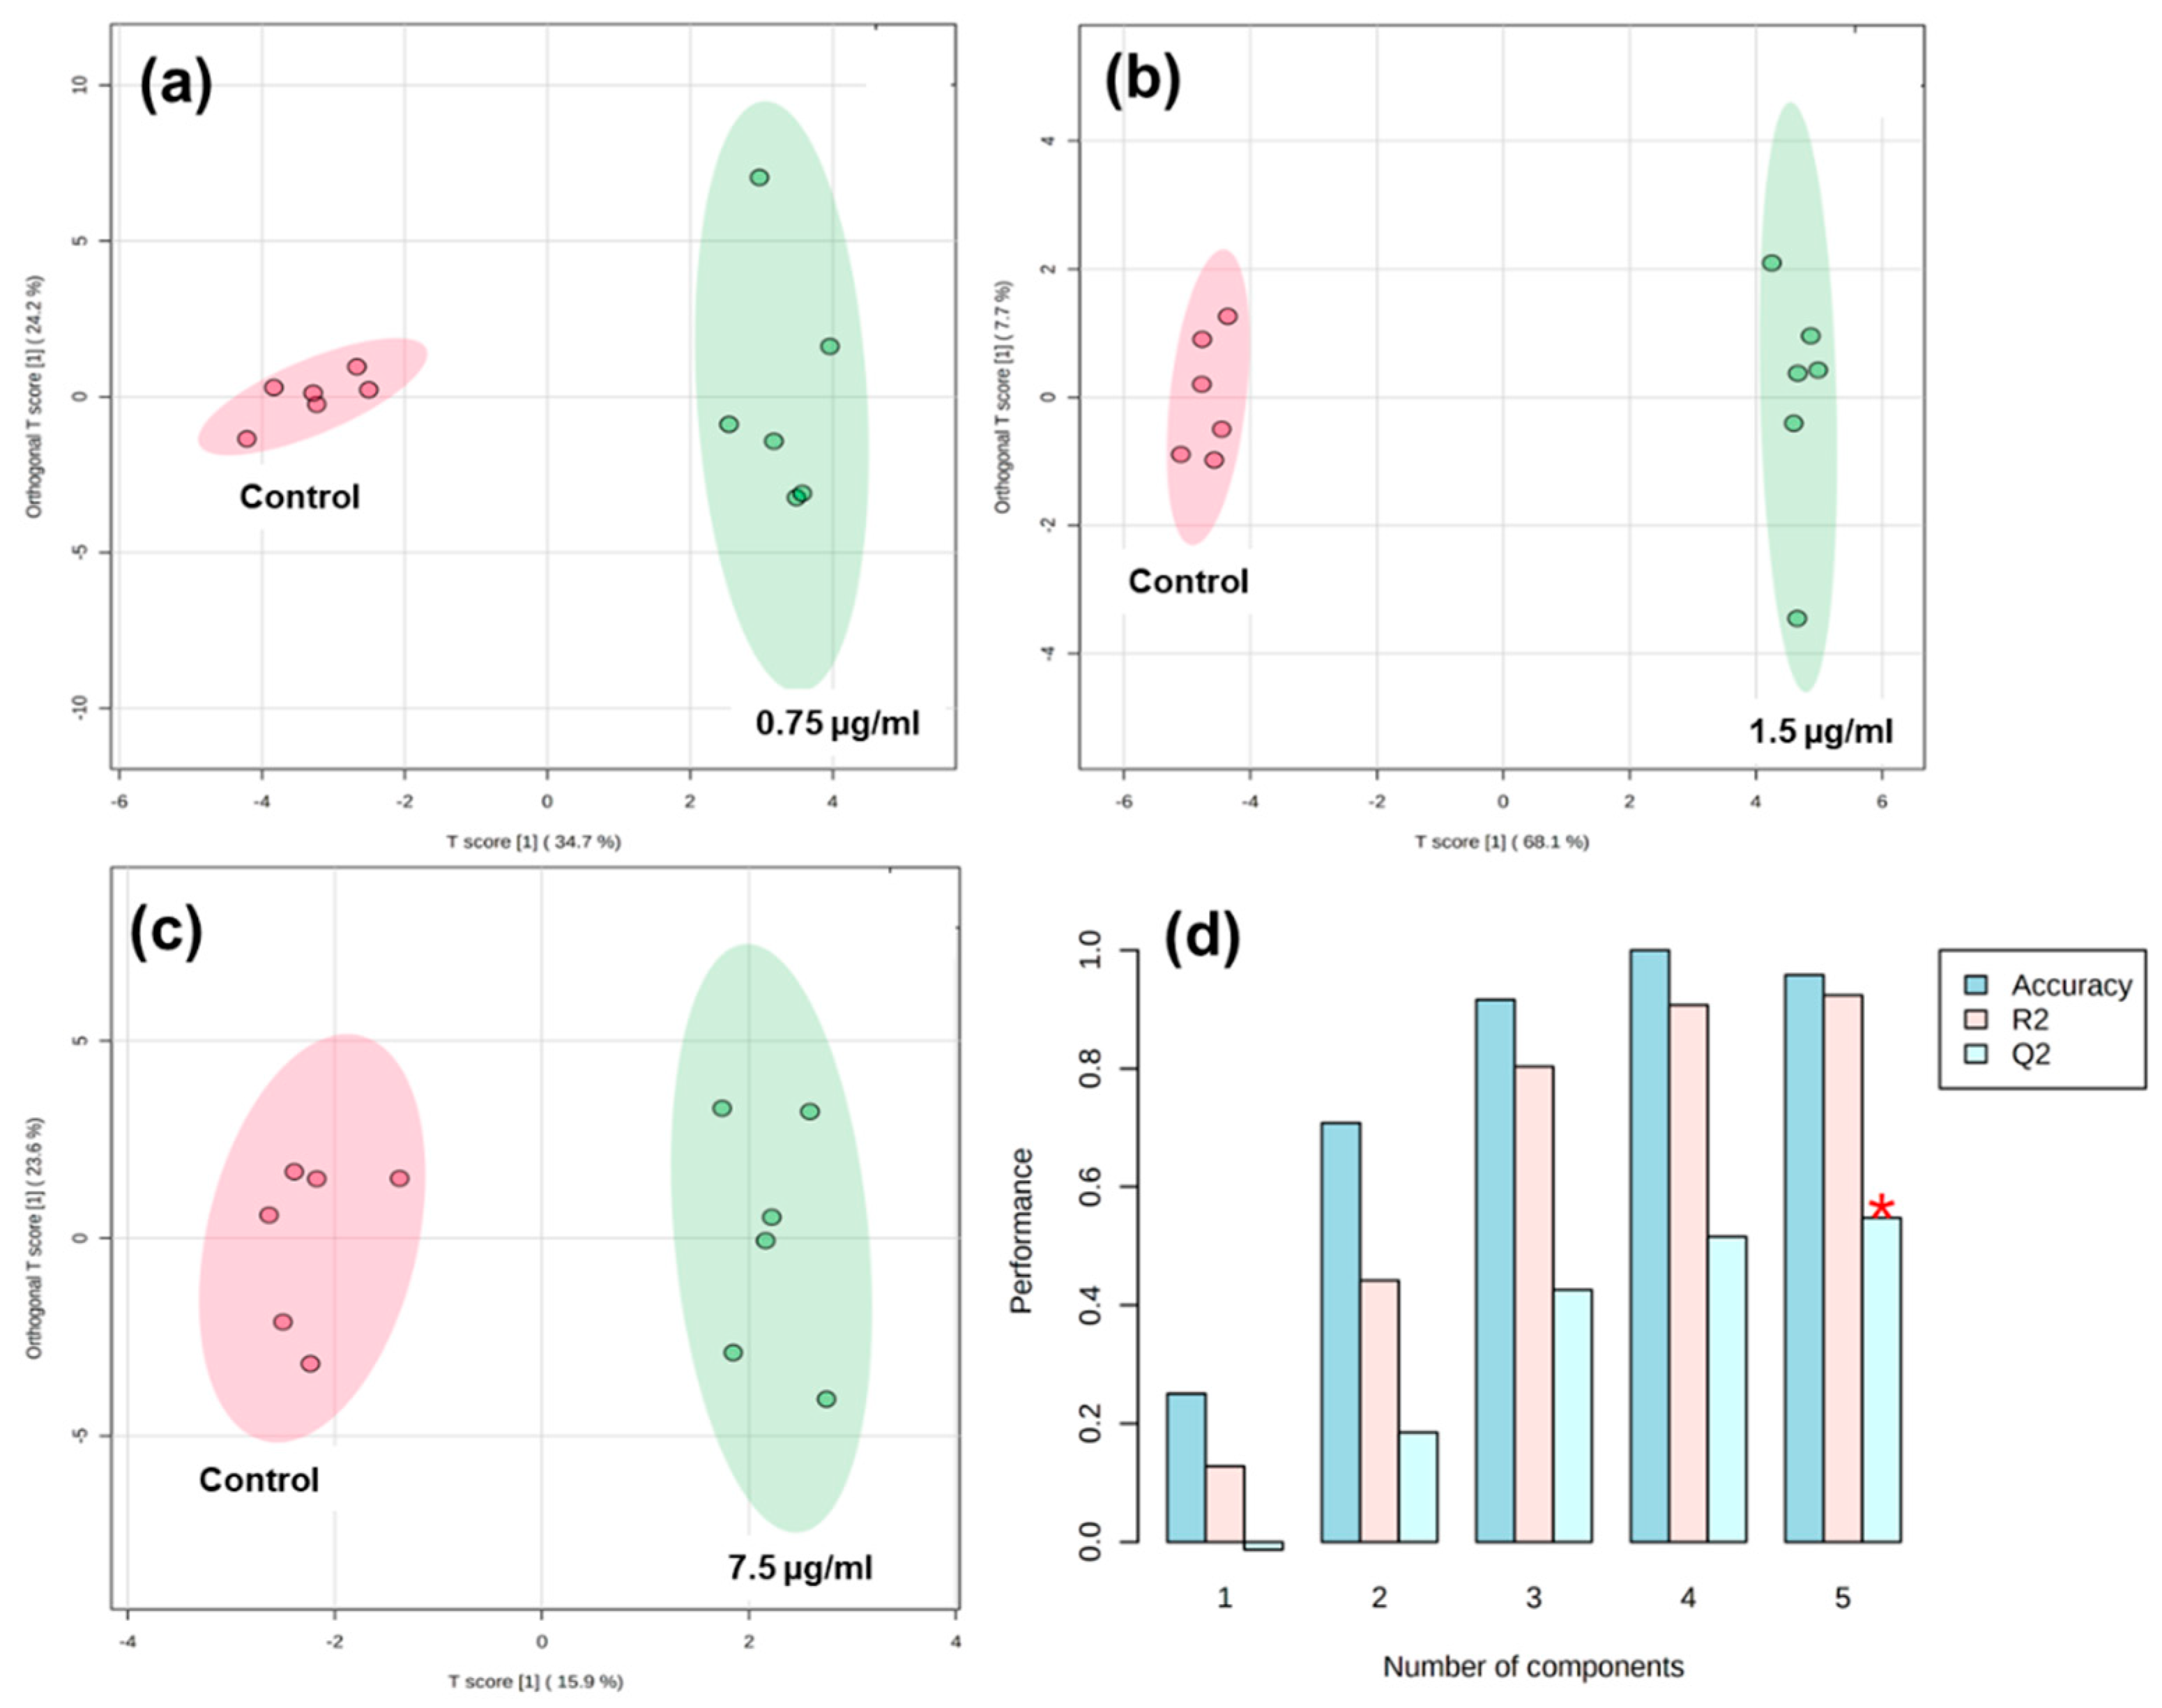
This technique is utilized to estimate probability density functions, which may result in practical applications of probability distributions in DOX-applied HCT116 cells. The metabolites and their normalized concentrations (mM) were evaluated based on the solvent. OPLS-DA score plot-based DOX in HCT116 cellular metabolic discrimination are as follows: 0.75 µg/mL, 58.9%; 1.5 µg/mL, 75.8%; and 7.5 µg/mL, 39.5%. These data could disperse the fundamental level of metabolic variations (Figure 3a–c). The unsupervised technique of PCA score plot was used to visualize basic metabolic clarity in DOX-treated HCT116 cell data (data not shown). At 1.5 µg/mL of DOX, the highest percentage of metabolic classification was found compared to others. The OPLS-DA score plot indicated that all samples were within the 95% confidence interval (Hotelling T2 ellipse). OPLS-DA analysis was used to classify and filter the metabolites.
The cumulative R2 and Q2 values were greater than 0.6, indicating that the OPLS-DA score plot was suitable for determining the difference between control and HCT116 cells (Figure 3d). The metabolic deference was screened from low DOX to high DOX concentrations. This metabolic difference of DOX treatment was further confirmed with a 100-premutation test, which could verify its stability and reliability. Here, the OPLS-DA score plot did not overfit.

3.4. Volcano Plots and Heatmap Analysis of HCT116 Cells Metabolites

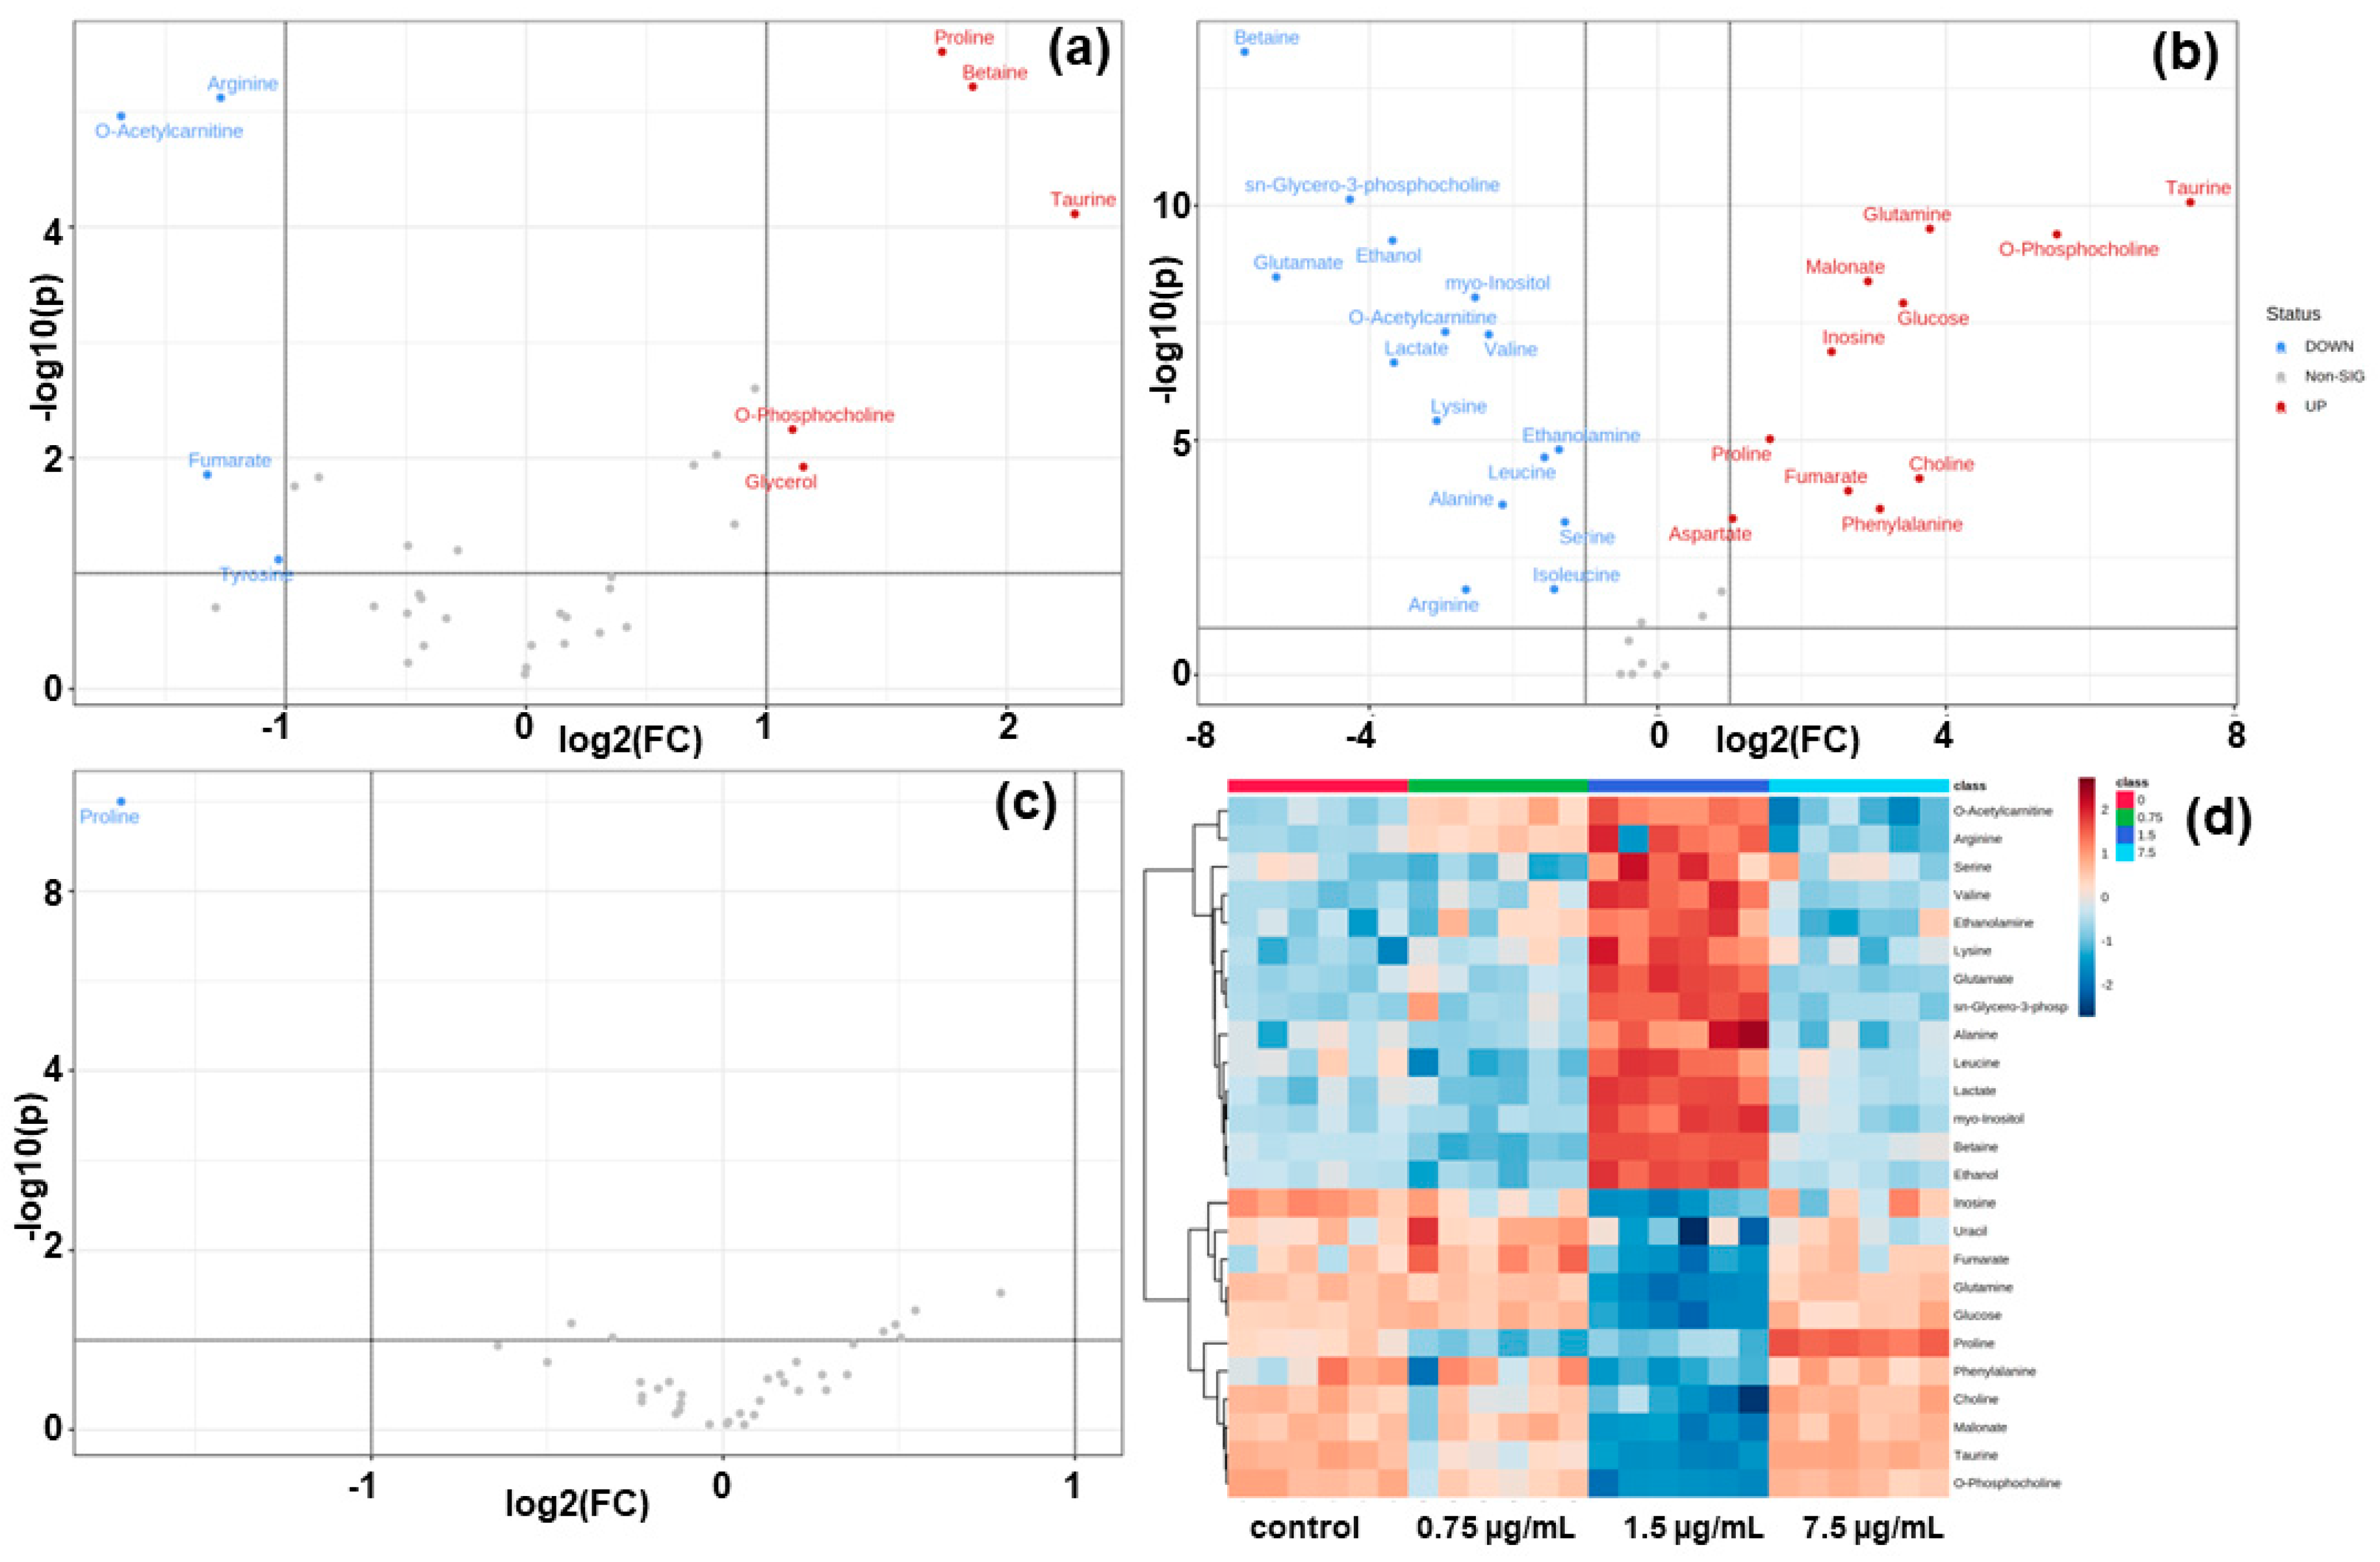
Figure 4a–c show volcano plots of differentially expressed metabolites in HCT116 cancer cells induced by DOX. False discovery rates (FDRs) were plotted against DOX-induced log2 fold changes in HCT116 cancer cells. The 1.5 µg/mL of DOX-applied up- and downregulated metabolites were found to be more than 0.75 µg/mL of DOX. Interestingly, there are no upregulated metabolites in 7.5 µg/mL of DOX-treated in HCT116 cells (Figure 4c). The DOX-applied volcano plot has been studied in all drug-applied groups. A volcano plot of HCT116 cellular metabolites in positive and negative modes was summarized.
The DOX-treated top 25 metabolites’ phenotypic expression is shown as a heatmap in Figure 4d. The metabolites from heatmap analysis of HCT116 cells were identified as candidate biomarkers. The metabolites were filtered and collated with a VIP score > 1 (data not shown). The top 25 metabolites were identified as candidate biometers. Expression levels were assessed and compared to determine the metabolites in 0.75 µg/mL, 1.5 µg/mL, and 7.5 µg/mL of DOX in HCT116 cells.

3.5. Tailored Metabolic Adaptations to DOX and Primary Metabolites with Pathways

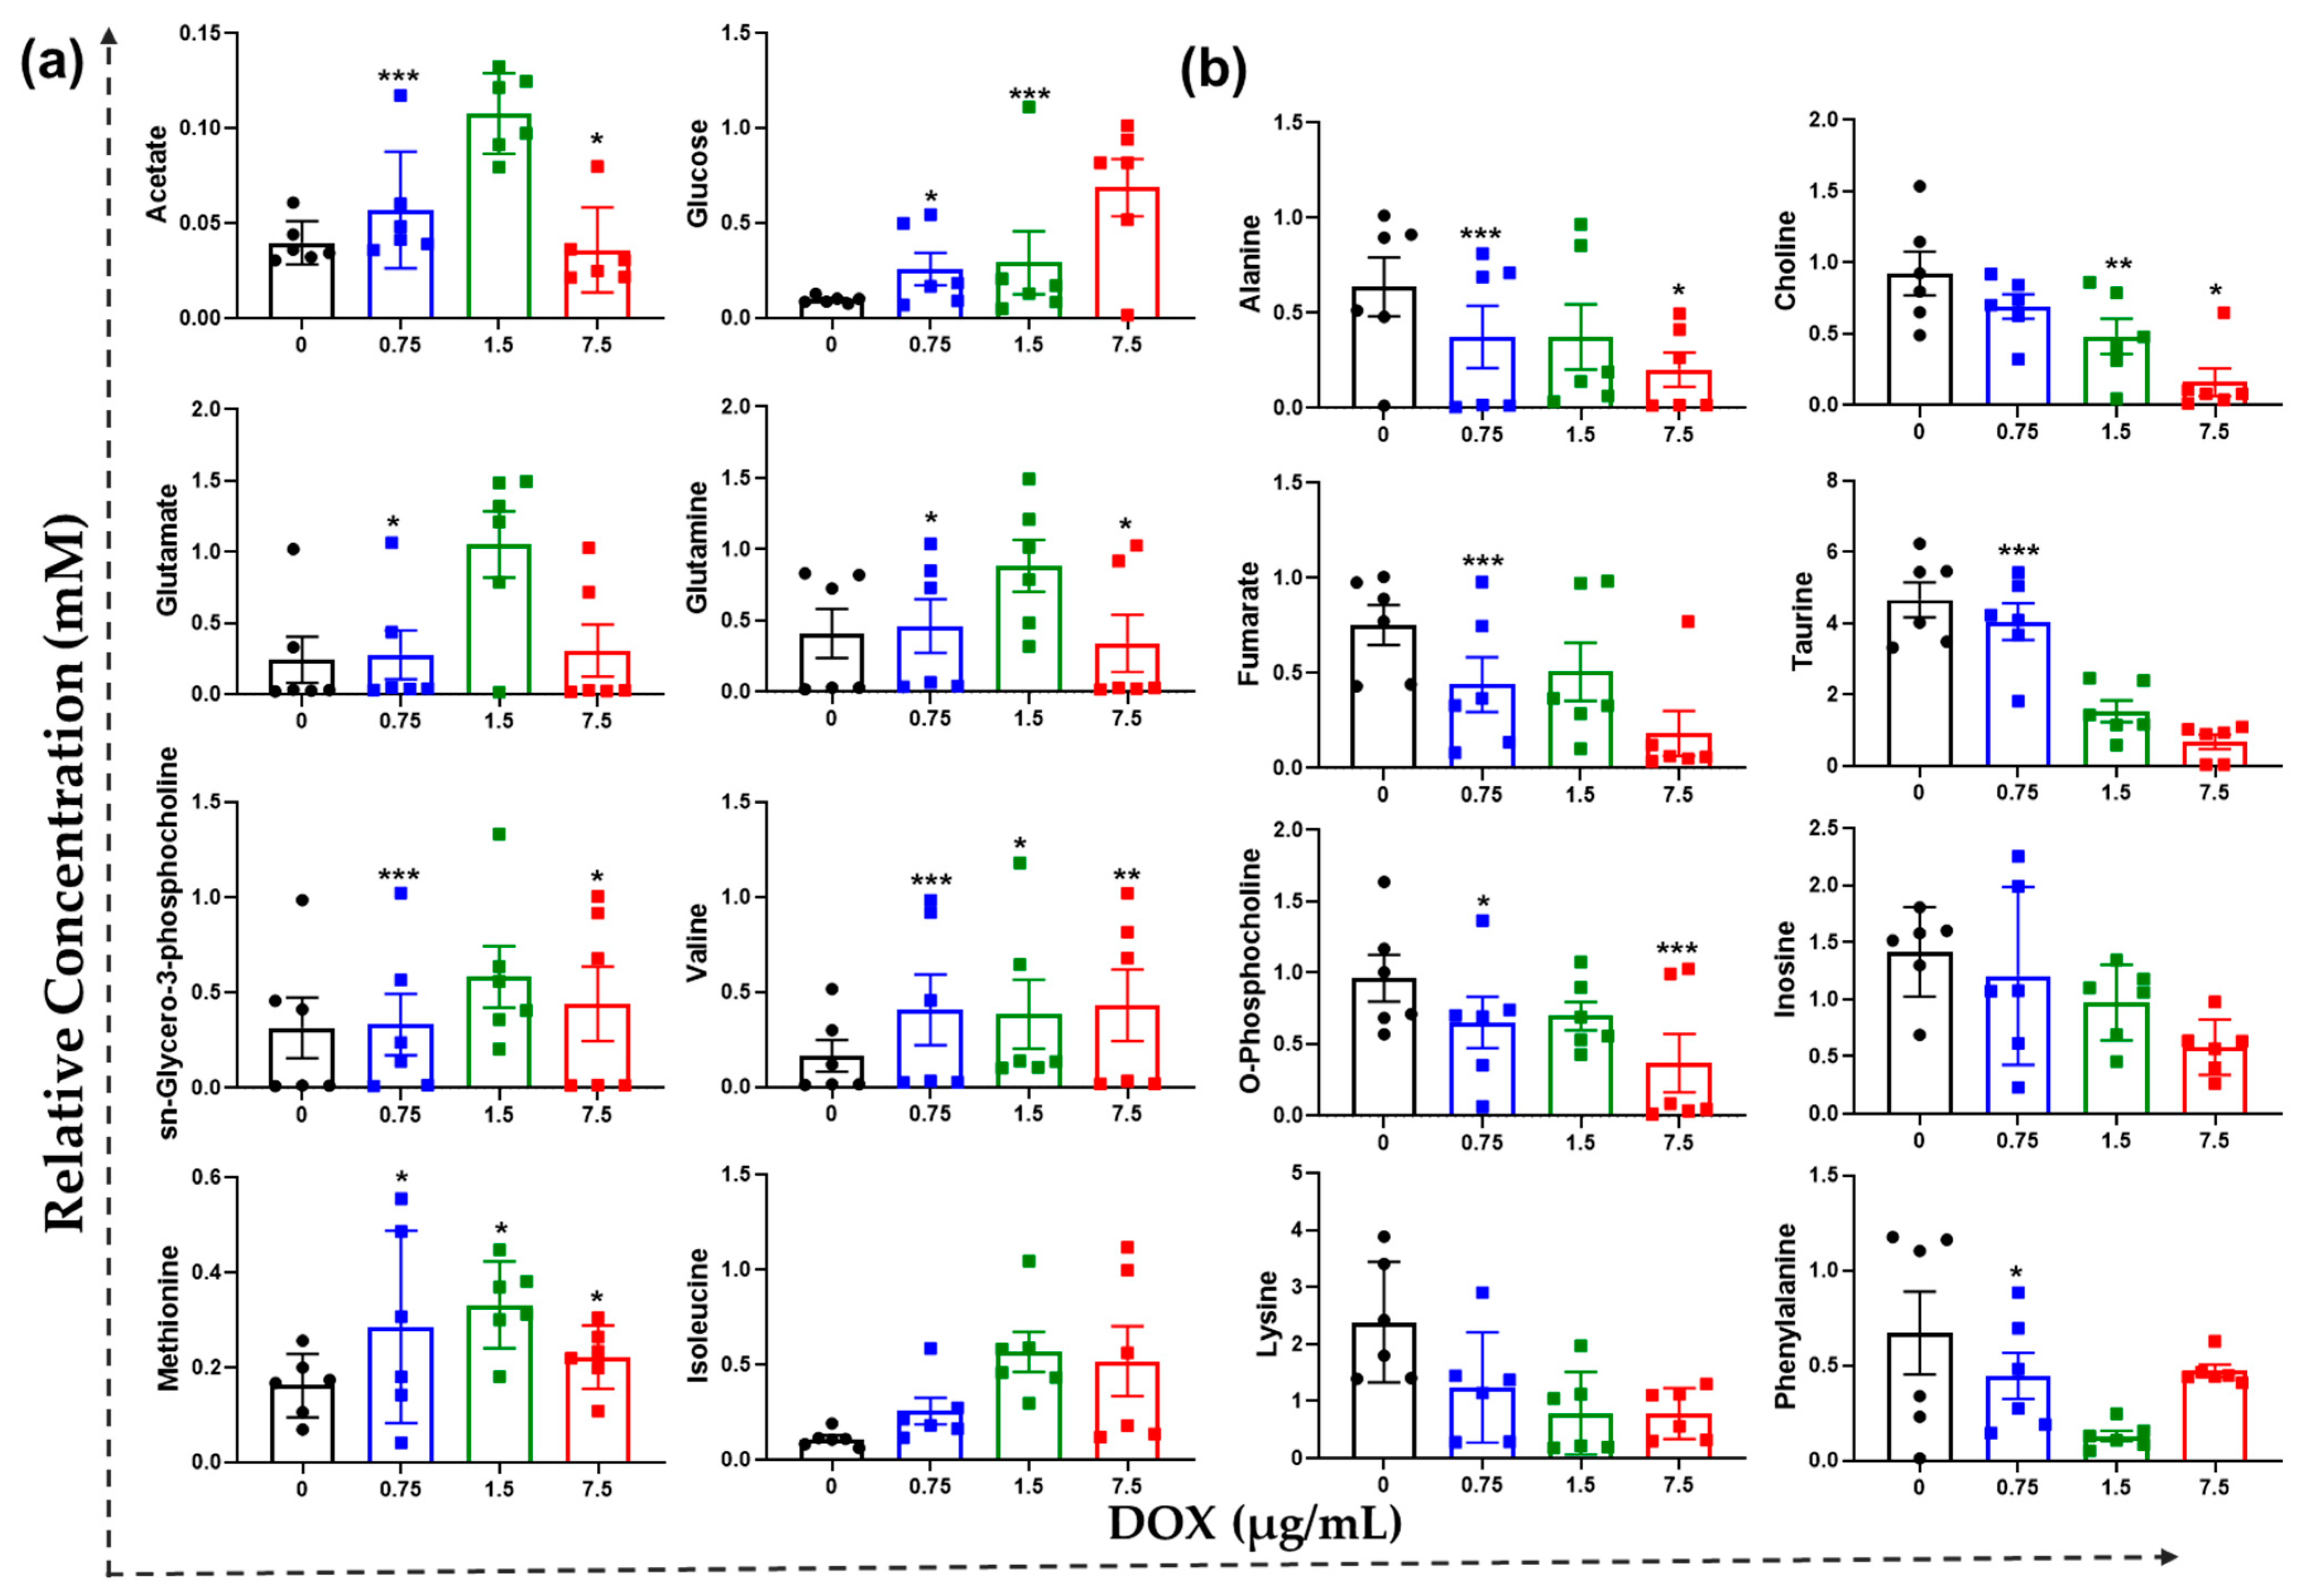
Among the amino acid metabolites, glutamate, glutamine, sn-glycero-3-PCho, valine, methionine, and isoleucine were increased in HCT116 cells by DOX treatment. Acetate and glucose were increased in cancer cells (Figure 5a). Acetate and glucose are the by-products of energy metabolism. DOX concurrently increased many significant metabolites in HCT116 cells. Several amino acids were significantly decreased by DOX, when amino acids may be involved in autophagy and mitophagy [24]. DOX treatment also induced metabolic downregulation in specific amino acids such as alanine, choline, taurine, o-phosphocholine, inosine, lysine, and phenylalanine (Figure 5b). These observations suggested a decrease in ATP production through glycolysis and oxidative phosphorylation. This could be related to the inhibition of metabolic synthesis in the cells.
The metabolites were quantified as before by targeted metabolomics [25]. The increase in hepatic glucose content suggests an enhancement of glycogenesis. Taurine and glutathione (GSH) were most closely associated with liver injury after DOX exposure. GSH, which is biosynthesized from cysteine, glycine, and glutamate, is the most abundant cellular redox molecule and plays a significant role in antioxidant functions [15,19].
The DOX effect appears specific for neurological metabolites, glutamate, and glutamine passed to induce neurogenesis behaviors. The neurological effects of glutamate and glutamine were observed in adult mice C57BL/6J mice treated with indole and DOX [26]. Several molecules are also associated with neurological dysfunction. The relative concentration of eight upregulated and eight downregulated metabolites from the 1H-NMR analysis were analyzed (Figure 5). These metabolites showed valid metabolites for OPLS-DA modal discrimination. There are many significant metabolites among DOX-treated groups.
Phosphocholine is a metabolite that partially comes from processing dietary carnitine into trimethylamine and choline. The evidence demonstrated that valine was associated with brain injury, which our study further confirmed by increased valine in DOC treatment. L-valine deficiency is noticeable in neurological defects in the brain [27].
The top metabolites identified by this analysis highlighted changes in selected metabolic pathways in HCT116 cancer cells. Pathways enrichment analysis was employed using the total quantified metabolites (Figure 6a–c). The pathways are represented as circles. We confirmed that metabolites taken from cancer cells undergoing transformation demonstrated significant changes in metabolites and metabolic pathways. Taurine and purine metabolism were highly altered in cancer cells, which could be used at therapeutic intervals. This greater capacity is further confirmed by HCT116 cells having a higher mitochondrial volume than control or DOX cells.
The metabolites regulation successfully distinguished and identified the cancer metabolites from the control metabolites. The gut microbe ecosystem modulates and shapes many metabolic, immunological, structural, and neurological functions [28]. Most appropriate metabolisms were marked.
Figure 6 shows that 0.75 µg/mL of DOX significantly regulated the citrate cycle (TCA cycle); taurine and hypotaurine metabolism; valine, leucine, and isoleucine degradation; and alanine, aspartate, and glutamate metabolism. At 1.5 µg/mL of DOX in colon cancer cells, the alanine, aspartate, and glutamate metabolism; D-glutamine, and D-glutamate metabolisms; citrate cycle (TCA cycle); and taurine and hypotaurine metabolism have been altered. Similarly, arginine and proline metabolism; alanine, aspartate, glutamate metabolism; D-glutamine and D-glutamate metabolism; and glycolysis/gluconeogenesis most robustly contributed to 7.5 µg/mL of DOX treatment.
Study findings support that changes in colon cancer metabolites could contribute to physiological responses to gut microbiota. Human prostate cancer metabolomics via high-resolution NMR spectroscopy has analyzed the metabolites in prostate tissue, seminal fluid, serum, and urine [29,30]. Figure 7 represents the HCT116 cancer cells after DOX treatment. The schematic diagram of glycolysis and TCA cycle imbalance by DOX in colon cancer cells has been summarized.
This study has some limitations. These findings show that DOX resistance exhibits separate basic metabolic vulnerabilities despite shared chemotherapeutic adaptations. Metabolic therapies can address these vulnerabilities to inhibit drug-resistant tumor growth.

4. Discussion

The study revealed the metabolite regulation of HCT116 cells with DOX treatment. We reduced the noise ratio in all spectrums. We increased the spectral signal resolution by employing NMR spectroscopy. We reduced contamination by eliminating sample drying and increased NMR performance by extracting metabolites with 80% acetonitrile [31,32]. This technique can be used to evaluate any cellular metabolites, but in practice, it is most helpful when cell counts are modest and enzymatic dissociation is unnecessary. The R2Y and Q2Y values in OPLS-DA score plots were observed in the distinct metabolic clusters of DOX-treated HCT116 cells [33,34].
Our observation of increased glucose levels by DOX treatment might suggest the inhibition of glycolytic processes and could be linked with the inhibition of cell proliferation. The intervention in glutamate metabolism by glutaminase inhibitors was shown to impact glutathione levels, which could reduce the antioxidative tumor capacity. Due to the high incidence of DOX-mediated anticancer activity, research usually positively affects cellar proliferation. DOX-responsive metabolic profiling detected early toxicity metabolite signature [35]. Evidence suggests that DOX causes these current harmful consequences by producing free radicals, lipid peroxidation, and oxidative damage to tissues and organs [36,37].
An increased amount of acetate and glucose in cancer cells was observed after repeated exposure to DOX. It was concluded that the DOX might remarkably block some signaling pathways. The alteration in glycolysis, TCA cycle, nucleotide synthesis, and choline metabolisms could be associated with growth suppression, which we found in DOX-treated HCT116 cells. These findings underscore the significance of colon cancer metabolites that regulate metabolic reactions that disturb energy, amino acids during metabolic transcriptional changes in mitochondria, and adult neurotransmitter impairment. Herein, we inferred the mechanism of metabolites inhibition enhancing the efficacy of chemotherapeutics could be clarified through metabolomics analysis. Notably, the changes in metabolites indicated that DOX was likely a source of therapeutic drugs for colon cancer cells. The DOX also contains other bioactive therapeutic drug roles.
Breast cancer cells resistant to both medications demonstrated well-known anthracyclines resistance mechanisms in a cancer cell line, such as enhanced drug efflux, lysosomal activity, and oxidative stress response [38,39]. Our in vitro studies display direct, metabolite-specific disorders, demonstrating phenotypic expression [40,41].
Our data gave evidence that DOX inhibits the TCA cycle-medicated mitochondrial damage. However, the reduced fumarate production by DOX may inhibit the ATP molecule production from TCA cycle transporters. Our study shows TCA cycle arrest, metabolite depletion, and mitochondrial dysfunction induced by DOX. In this context, impaired metabolites in mitochondria have been linked to anticancer activity [40,42,43].
We observed a metabolic difference in the abundance of metabolites in HCT116 cells. Functional studies will be required to assess the biological significance of the difference. Cancer cells are undergone metabolic changes to survive oxidative stress during metastasis [44,45]. A better understanding of the metabolic changes could reveal new therapeutic vulnerabilities to colon cancer progression.

5. Conclusions

We have implemented a fully automated study in HCT116 cancer cells with optimized peak detection, alignment, and an annotation task using 1H-NMR data. The raw spectra processing produces a peak intensity table and peak annotation table. We found that the metabolites of glutamate, glutamine, sn-glycero-3-PCho, valine, methionine, and isoleucine were increased. The specific amino acids such as alanine, choline, taurine, o-phosphocholine, inosine, lysine, and phenylalanine were downregulated in colon cancer HCT116 cells. In the future, we aim to screen more data in HCT116 cells by DOX treatment to support cancer metabolic regulation.

Author Contributions

Conceptualization, R.G.; methodology, R.G.; software, R.G.; validation, R.G., A.V.G. and V.-S.P.; resources, V.-S.P.; writing—original draft preparation, R.G.; writing—review and editing, R.G. and A.V.G.; supervision, R.G. and A.V.G. All authors have read and agreed to the published version of the manuscript.

Funding

This research received no external funding.

Institutional Review Board Statement

Not applicable.

Informed Consent Statement

Not applicable.

Data Availability Statement

The data presented in this study are available in the article.

Conflicts of Interest

The authors declare no conflict of interest.

References

  1. Jemal, A.; Bray, F.; Center, M.M.; Ferlay, J.; Ward, E.; Forman, D. Global cancer statistics. CA Cancer J. Clin. 2011, 61, 69–90. [Google Scholar] [CrossRef] [PubMed] [Green Version]
  2. Duncan, R.; Gaspar, R. Nanomedicine(s) under the microscope. Mol. Pharm. 2011, 8, 2101–2141. [Google Scholar] [CrossRef] [PubMed]
  3. Raja, G.; Cao, S.; Kim, D.-H.; Kim, T.-J. Mechanoregulation of titanium dioxide nanoparticles in cancer therapy. Mater. Sci. Eng. C 2020, 107, 110303. [Google Scholar] [CrossRef] [PubMed]
  4. Wang, L.; Song, Y.; Parikh, A.; Joyce, P.; Chung, R.; Liu, L.; Afinjuomo, F.; Hayball, J.D.; Petrovsky, N.; Barclay, T.G.; et al. Doxorubicin-loaded delta inulin conjugates for controlled and targeted drug delivery: Development, characterization, and in vitro evaluation. Pharmaceutics 2019, 11, 581. [Google Scholar] [CrossRef] [PubMed] [Green Version]
  5. Koshkaryev, A.; Sawant, R.; Deshpande, M.; Torchilin, V. Immunoconjugates and long circulating systems: Origins, current state of the art and future directions. Adv. Drug Deliv. Rev. 2013, 65, 24–35. [Google Scholar] [CrossRef] [Green Version]
  6. Raja, G.; Jang, Y.-K.; Suh, J.-S.; Kim, H.-S.; Ahn, S.H.; Kim, T.-J. Microcellular environmental regulation of silver nanoparticles in cancer therapy: A critical review. Cancers 2020, 12, 664. [Google Scholar] [CrossRef] [Green Version]
  7. Frezza, C.; Zheng, L.; Tennant, D.A.; Papkovsky, D.B.; Hedley, B.A.; Kalna, G.; Watson, D.G.; Gottlieb, E. Metabolic profiling of hypoxic cells revealed a catabolic signature required for cell survival. PLoS ONE 2011, 6, e24411. [Google Scholar] [CrossRef] [Green Version]
  8. Kotze, H.L.; Armitage, E.G.; Sharkey, K.J.; Allwood, J.W.; Dunn, W.B.; Williams, K.J.; Goodacre, R. A novel untargeted metabolomics correlation-based network analysis incorporating human metabolic reconstructions. BMC Syst. Biol. 2013, 7, 107. [Google Scholar] [CrossRef] [Green Version]
  9. Loftus, N.J.; Lai, L.; Wilkinson, R.W.; Odedra, R.; Wilson, I.D.; Barnes, A.J. Global metabolite profiling of human colorectal cancer xenografts in mice using hplc–ms/ms. J. Proteome Res. 2013, 12, 2980–2986. [Google Scholar] [CrossRef]
  10. Tolstikov, V.; Nikolayev, A.; Dong, S.; Zhao, G.; Kuo, M.-S. Metabolomics analysis of metabolic effects of nicotinamide phosphoribosyltransferase (nampt) inhibition on human cancer cells. PLoS ONE 2014, 9, e114019. [Google Scholar] [CrossRef]
  11. Jang, C.; Chen, L.; Rabinowitz, J.D. Metabolomics and isotope tracing. Cell 2018, 173, 822–837. [Google Scholar] [CrossRef] [PubMed] [Green Version]
  12. Aftab, O.; Engskog, M.K.; Haglöf, J.; Elmsjö, A.; Arvidsson, T.; Pettersson, C.; Hammerling, U.; Gustafsson, M.G. Nmr spectroscopy-based metabolic profiling of drug-induced changes in vitro can discriminate between pharmacological classes. J. Chem. Inf. Model. 2014, 54, 3251–3258. [Google Scholar] [CrossRef] [PubMed]
  13. Johanningsmeier, S.D.; Harris, G.K.; Klevorn, C.M. Metabolomic technologies for improving the quality of food: Practice and promise. Annu. Rev. Food Sci. Technol. 2016, 7, 413–438. [Google Scholar] [CrossRef] [PubMed] [Green Version]
  14. Raja, G.; Jung, Y.; Jung, S.H.; Kim, T.-J. 1h-nmr-based metabolomics for cancer targeting and metabolic engineering—A review. Process Biochem. 2020, 99, 112–122. [Google Scholar] [CrossRef]
  15. Raja, G.; Jang, Y.-K.; Suh, J.-S.; Prabhakaran, V.-S.; Kim, T.-J. Advanced understanding of genetic risk and metabolite signatures in construction workers via cytogenetics and metabolomics analysis. Process Biochem. 2019, 86, 117–126. [Google Scholar] [CrossRef]
  16. Armiñán, A.; Palomino-Schätzlein, M.; Deladriere, C.; Arroyo-Crespo, J.J.; Vicente-Ruiz, S.; Vicent, M.J.; Pineda-Lucena, A. Metabolomics facilitates the discrimination of the specific anticancer effects of free- and polymer-conjugated doxorubicin in breast cancer models. Biomaterials 2018, 162, 144–153. [Google Scholar] [CrossRef]
  17. Pramod, P.S.; Shah, R.; Jayakannan, M. Dual stimuli polysaccharide nanovesicles for conjugated and physically loaded doxorubicin delivery in breast cancer cells. Nanoscale 2015, 7, 6636–6652. [Google Scholar] [CrossRef] [Green Version]
  18. Rosli, N.F.; Fojtů, M.; Fisher, A.C.; Pumera, M. Graphene oxide nanoplatelets potentiate anticancer effect of cisplatin in human lung cancer cells. Langmuir 2019, 35, 3176–3182. [Google Scholar] [CrossRef]
  19. Raja, G.; Selvaraj, V.; Suk, M.; Suk, K.T.; Kim, T.-J. Metabolic phenotyping analysis of graphene oxide nanosheets exposures in breast cancer cells: Metabolomics profiling techniques. Process Biochem. 2021, 104, 39–45. [Google Scholar] [CrossRef]
  20. Lauri, I.; Savorani, F.; Iaccarino, N.; Zizza, P.; Pavone, L.M.; Novellino, E.; Engelsen, S.B.; Randazzo, A. Development of an optimized protocol for nmr metabolomics studies of human colon cancer cell lines and first insight from testing of the protocol using DNA g-quadruplex ligands as novel anticancer drugs. Metabolites 2016, 6, 4. [Google Scholar] [CrossRef]
  21. Niu, Q.Y.; Li, Z.Y.; Du, G.H.; Qin, X.M. (1)h nmr based metabolomic profiling revealed doxorubicin-induced systematic alterations in a rat model. J. Pharm. Biomed. Anal. 2016, 118, 338–348. [Google Scholar] [CrossRef] [PubMed]
  22. Nicoletto, R.E.; Ofner, C.M. Cytotoxic mechanisms of doxorubicin at clinically relevant concentrations in breast cancer cells. Cancer Chemother. Pharmacol. 2022, 89, 285–311. [Google Scholar] [CrossRef] [PubMed]
  23. Martineau, E.; Tea, I.; Loaëc, G.; Giraudeau, P.; Akoka, S. Strategy for choosing extraction procedures for nmr-based metabolomic analysis of mammalian cells. Anal. Bioanal. Chem. 2011, 401, 2133–2142. [Google Scholar] [CrossRef]
  24. Ding, W.X.; Yin, X.M. Mitophagy: Mechanisms, pathophysiological roles, and analysis. Biol. Chem. 2012, 393, 547–564. [Google Scholar] [CrossRef] [Green Version]
  25. Feng, R.; Guo, X.; Kou, Y.; Xu, X.; Hong, C.; Zhang, W.; An, Y.; Philips, C.A.; Mancuso, A.; Qi, X. Association of lipid profile with decompensation, liver dysfunction, and mortality in patients with liver cirrhosis. Postgrad. Med. 2021, 133, 626–638. [Google Scholar] [CrossRef]
  26. Geng, C.; Cui, C.; Wang, C.; Lu, S.; Zhang, M.; Chen, D.; Jiang, P. Systematic evaluations of doxorubicin-induced toxicity in rats based on metabolomics. ACS Omega 2021, 6, 358–366. [Google Scholar] [CrossRef] [PubMed]
  27. Altınkaynak, Y.; Kural, B.; Akcan, B.A.; Bodur, A.; Özer, S.; Yuluğ, E.; Munğan, S.; Kaya, C.; Örem, A. Protective effects of l-theanine against doxorubicin-induced nephrotoxicity in rats. Biomed. Pharmacother. 2018, 108, 1524–1534. [Google Scholar] [CrossRef] [PubMed]
  28. Adak, A.; Khan, M.R. An insight into gut microbiota and its functionalities. Cell. Mol. Life Sci. CMLS 2019, 76, 473–493. [Google Scholar] [CrossRef]
  29. Kumar, V.; Dwivedi, D.K.; Jagannathan, N.R. High-resolution nmr spectroscopy of human body fluids and tissues in relation to prostate cancer. NMR Biomed. 2014, 27, 80–89. [Google Scholar] [CrossRef]
  30. Fan, T.W.M.; Lane, A.N. Applications of nmr spectroscopy to systems biochemistry. Prog. Nucl. Magn. Reson. Spectrosc. 2016, 92–93, 18–53. [Google Scholar] [CrossRef]
  31. Hu, R.; Li, T.; Yang, Y.; Tian, Y.; Zhang, L. Nmr-based metabolomics in cancer research. In Cancer Metabolomics: Methods and Applications; Hu, S., Ed.; Springer International Publishing: Cham, Switzerland, 2021; pp. 201–218. [Google Scholar]
  32. Nagana Gowda, G.A.; Raftery, D. Recent advances in nmr-based metabolomics. Anal. Chem. 2017, 89, 490–510. [Google Scholar] [CrossRef] [PubMed]
  33. Bingol, K.; Brüschweiler, R. Multidimensional approaches to nmr-based metabolomics. Anal. Chem. 2014, 86, 47–57. [Google Scholar] [CrossRef] [Green Version]
  34. Ganesan, R.; Vasantha-Srinivasan, P.; Sadhasivam, D.R.; Subramanian, R.; Vimalraj, S.; Suk, K.T. Carbon nanotubes induce metabolomic profile disturbances in zebrafish: Nmr-based metabolomics platform. Front. Mol. Biosci. 2021, 8, 688827. [Google Scholar] [CrossRef] [PubMed]
  35. Nagai, K.; Oda, A.; Konishi, H. Theanine prevents doxorubicin-induced acute hepatotoxicity by reducing intrinsic apoptotic response. Food Chem. Toxicol. Int. J. Publ. Br. Ind. Biol. Res. Assoc. 2015, 78, 147–152. [Google Scholar] [CrossRef]
  36. Carvalho, C.; Santos, R.X.; Cardoso, S.; Correia, S.; Oliveira, P.J.; Santos, M.S.; Moreira, P.I. Doxorubicin: The good, the bad and the ugly effect. Curr. Med. Chem. 2009, 16, 3267–3285. [Google Scholar] [CrossRef] [PubMed]
  37. Su, Z.; Ye, J.; Qin, Z.; Ding, X. Protective effects of madecassoside against doxorubicin induced nephrotoxicity in vivo and in vitro. Sci. Rep. 2015, 5, 18314. [Google Scholar] [CrossRef] [PubMed] [Green Version]
  38. Hembruff, S.L.; Laberge, M.L.; Villeneuve, D.J.; Guo, B.; Veitch, Z.; Cecchetto, M.; Parissenti, A.M. Role of drug transporters and drug accumulation in the temporal acquisition of drug resistance. BMC Cancer 2008, 8, 318. [Google Scholar] [CrossRef] [PubMed] [Green Version]
  39. Guo, B.; Tam, A.; Santi, S.A.; Parissenti, A.M. Role of autophagy and lysosomal drug sequestration in acquired resistance to doxorubicin in mcf-7 cells. BMC Cancer 2016, 16, 762. [Google Scholar] [CrossRef] [Green Version]
  40. Dubbelboer, I.R.; Pavlovic, N.; Heindryckx, F.; Sjögren, E.; Lennernäs, H. Liver cancer cell lines treated with doxorubicin under normoxia and hypoxia: Cell viability and oncologic protein profile. Cancers 2019, 11, 1024. [Google Scholar] [CrossRef] [Green Version]
  41. Tacar, O.; Sriamornsak, P.; Dass, C.R. Doxorubicin: An update on anticancer molecular action, toxicity and novel drug delivery systems. J. Pharm. Pharmacol. 2012, 65, 157–170. [Google Scholar] [CrossRef]
  42. Eom, Y.-W.; Kim, M.A.; Park, S.S.; Goo, M.J.; Kwon, H.J.; Sohn, S.; Kim, W.-H.; Yoon, G.; Choi, K.S. Two distinct modes of cell death induced by doxorubicin: Apoptosis and cell death through mitotic catastrophe accompanied by senescence-like phenotype. Oncogene 2005, 24, 4765–4777. [Google Scholar] [CrossRef] [PubMed] [Green Version]
  43. Wei, L.; Surma, M.; Gough, G.; Shi, S.; Lambert-Cheatham, N.; Chang, J.; Shi, J. Dissecting the mechanisms of doxorubicin and oxidative stress-induced cytotoxicity: The involvement of actin cytoskeleton and rock1. PLoS ONE 2015, 10, e0131763. [Google Scholar]
  44. Piskounova, E.; Agathocleous, M.; Murphy, M.M.; Hu, Z.; Huddlestun, S.E.; Zhao, Z.; Leitch, A.M.; Johnson, T.M.; DeBerardinis, R.J.; Morrison, S.J. Oxidative stress inhibits distant metastasis by human melanoma cells. Nature 2015, 527, 186–191. [Google Scholar] [CrossRef] [Green Version]
  45. Tasdogan, A.; Faubert, B.; Ramesh, V.; Ubellacker, J.M.; Shen, B.; Solmonson, A.; Murphy, M.M.; Gu, Z.; Gu, W.; Martin, M.; et al. Metabolic heterogeneity confers differences in melanoma metastatic potential. Nature 2020, 577, 115–120. [Google Scholar] [CrossRef] [PubMed]
Figure 1. The schematic depicts the current HCT116 cells utilized in metabolomics and its future metabolic therapeutic applications. (a) Chemical structure of doxorubicin hydrochloride. (b) The experimental flow of DOX-applied HCT 116 cells and 1H-NMR-based metabolomics analysis.
Metabolites 12 01047 g001
Figure 2. DOX and colon cancer cell viability affect different times (6, 24, and 72 h). Three DOX concentration (0, control; 0.75 µg/mL; 1.5 µg/mL; and 7.5 µg/mL) at three time points were recorded. At least 6 replicates were used for each tested concentration. The bar graphs show 0, black; 0.75 µg/mL, blue; 1.5 µg/mL, green; and 7.5 µg/mL, red. Tested with 2-way ANOVA with Tukey’s multiple comparison test, significant adjusted p < 0.05. * and ** represent p < 0.05 and p < 0.001, respectively.
Metabolites 12 01047 g002
Figure 3. Outline of HCT116 cancer metabolic profile based on OPLS-DA scores scatter plot visualization. Results from the raw spectra processing. (a) 0.75 µg/mL of DOX; (b) 1.5 µg/mL of DOX; (c) 7.5 µg/mL of DOX-treated HCT116 cells. The pink and green circles indicate control and DOX-treated cancer cells, respectively. Two-Dimensional OPLS-DA score plot in HCT116 cancer metabolic profile visualization. (d) R2 and Q2 performance analysis. A red asterisk indicates the highest expression of Q2 values of components.
Metabolites 12 01047 g003
Figure 4. Functional volcano plot and heatmap analysis of quantified metabolome patterns: (a) 0.75 µg/mL DOX; (b) 1.5 µg/mL DOX; (c) 7.5 µg/mL DOX treated in HCT116 cells. This is a screenshot of a heatmap based functional analysis in HCT116 cells. (d) The correlation matrix of the top 25 metabolites significantly altered. The correlation type (positive or negative) and strength (color intensity) are coded brown and blue, respectively, normalized between −3 and +3 according to the bar on the right.
Metabolites 12 01047 g004
Figure 5. Essential metabolites are assigned higher priority scores using metabolomics profiling with DOX treatment. (a) Expression of acetate, glucose, glutamate, glutamine, sn-glycero-3-PCho, valine, methionine, and isoleucine were increased metabolites in HCT116 cancer cells. (b) Expression of alanine, choline, fumarate, taurine, o-phosphocholine, inosine, lysine, and phenylalanine were decreased their regulation in HCT116 cancer cells. The black dot represents the control; the blue dot represents 0.75 µg/mL of DOX; the green dot represents 1.5 µg/mL of DOX; and the red dot represents 7.5 µg/mL of DOX. *, ** and *** represent p < 0.05, p < 0.01, and p < 0.001, respectively.
Metabolites 12 01047 g005
Figure 6. (a) 0.75 µg/mL of DOX; (b) 1.5 µg/mL of DOX; (c) 7.5 µg/mL of DOX. The metabolite set enrichment analysis of our metabolites with DOX treatment in HCT116 cells. Pathway analysis is displayed from HCT116 cells datasets using the Holm-Bonferroni method and False Discovery Rate. Each row represents a pathway, and each column represents a -log10 (p-value). The topmost pathway shows the results from the top down (according to the enrichment ratio). A purple arrow indicates significant metabolic pathways.
Metabolites 12 01047 g006
Figure 7. The schematic regulation of TCA cycle-associated activity by DOX treatment in HCT116 cancer cells. Red- and green-colored metabolites were represented as increased and decreased in HCT116 cells, respectively. The red sign shows a possible metabolic chemical reaction inhibition in cancer cells. *, ** and *** represent p < 0.05, p < 0.01, and p < 0.001, respectively.
Metabolites 12 01047 g007
Table 1. The characterization of metabolome by 1H-NMR spectroscopy. 1H-NMR-based metabolomic quantification and targeted metabolites from cancer cells.
δ 1H (ppm) and Multiplicity aTargeted
Metabolites
Chemical
Formula
MW
(Da)
1.90 (s)AcetateC2H4O260.05
3.89 (dd); 2.80 (dd); 2.66 (dd)AspartateC4H7NO4133.10
3.78 (q); 1.47 (d) AlanineC3H7NO289.09
3.76 (t); 1.90 (m); 1.68 (m)AsparagineC6H14N4O2132.12
8.52 (s); 8.12 (d); 4.50 (m); 4.21 (m)ATPC10H16N5O13P3507.18
8.54 (s); 5.94 (m); 4.11 (m); 4.00 (m)ADPC10H15N5O10P2427.201
8.22 (s); 6.16 (s); 4.53 (dd); 4.34 (d)AMPC10H14N5O7P347.221
3.89 (s); 3.25 (s)BetaineC24H26N2O13550.45
2.65 (d); 2.53 (d)CitrateC6H8O7192.12
4.05 (dd); 3.50 (dd); 3.18 (s)CholineC5H14NO104.17
6.51 (s)FumarateC4H4O4116.072
5.22 (d); 4.64 (d); 3.88 (dd); 3.72 (m); 3.40 (m)Glucose C6H12O6180.16
4.20 (q); 3.78 (m); 2.97 (dd); 2.15 (m)GlutathioneC10H17N3O6S307.32
3.76 (t); 2.44 (m); 2.12 (m)Glutamate C5H9NO4147.129
5.75 (m); 7.80 (m); 6.16 (t)GlutamineC5H10N2O3146.144
4.10 (q); 1.32 (d)LactateC3H6O3342.3
3.66 (d); 1.96 (m); 0.99 (d); 0.92 (t)IsoleucineC6H13NO2131.17
3.60 (d); 2.261 (m); 0.97 (d) ValineC5H11NO2117.146
3.72 (m); 1.70 (m); 0.94 (t)LeucineC6H13NO2131.17
8.30 (s); 6.05 (d); 4.42 (dd); 3.82 (dd)InosineC10H12N4O5268.23
2.37 (s)OxalacetateC4H4O5132.071
2.61 (m); 2.51 (dd); 2.11 (dd); 1.07 (d)MethylsuccinateC5H8O4132.11
4.05 (t); 3.61 (t); 3.52 (dd); 3.26 (t)Myo-InositolC6H12O6180.16
7.33 (d); 7.37 (m); 7.43 (m)PhenylalanineC9H11NO2165.19
2.46 (s)PyruvateC3H4O388.0621
2.39 (s)SuccinateC4H6O4118.088
3.43 (t); 3.42 (t); 3.25 (t)TaurineC2H7NO3S125.15
4.24 (m); 3.57 (d); 1.31 (d)ThreonineC4H9NO3119.12
7.72 (d); 7.31 (s); 4.04 (dd); 3.29 (dd)TryptophanC11H12N2O2204.26
2.89 (s)TrimethylamineC3H9N59.1103
7.24 (d); 6.94 (m); 3.34 (dd); 3.30 (dd)TyrosineC9H11NO3181.188
3.25 (s)TMAOC3H9NO75.11
7.892 (s)XanthineC5H4N4O2152.110
Note and Abbreviations; a—Singlet (s); doublet (d); triplet (t); doublet of doublets (dd); quartets (q); multiplets (m); molecular weight (MW); parts-per-million (ppm); adenosine monophosphate (AMP); adenosine diphosphate (ADP); adenosine triphosphate (ATP); Trimethylamine N-oxide (TMAO).
Publisher’s Note: MDPI stays neutral with regard to jurisdictional claims in published maps and institutional affiliations.