
Causal Effects of Circulating Lipid Traits on Epithelial Ovarian Cancer: A Two-Sample Mendelian Randomization Study


Abstract
:1. Introduction
2. Experimental Design
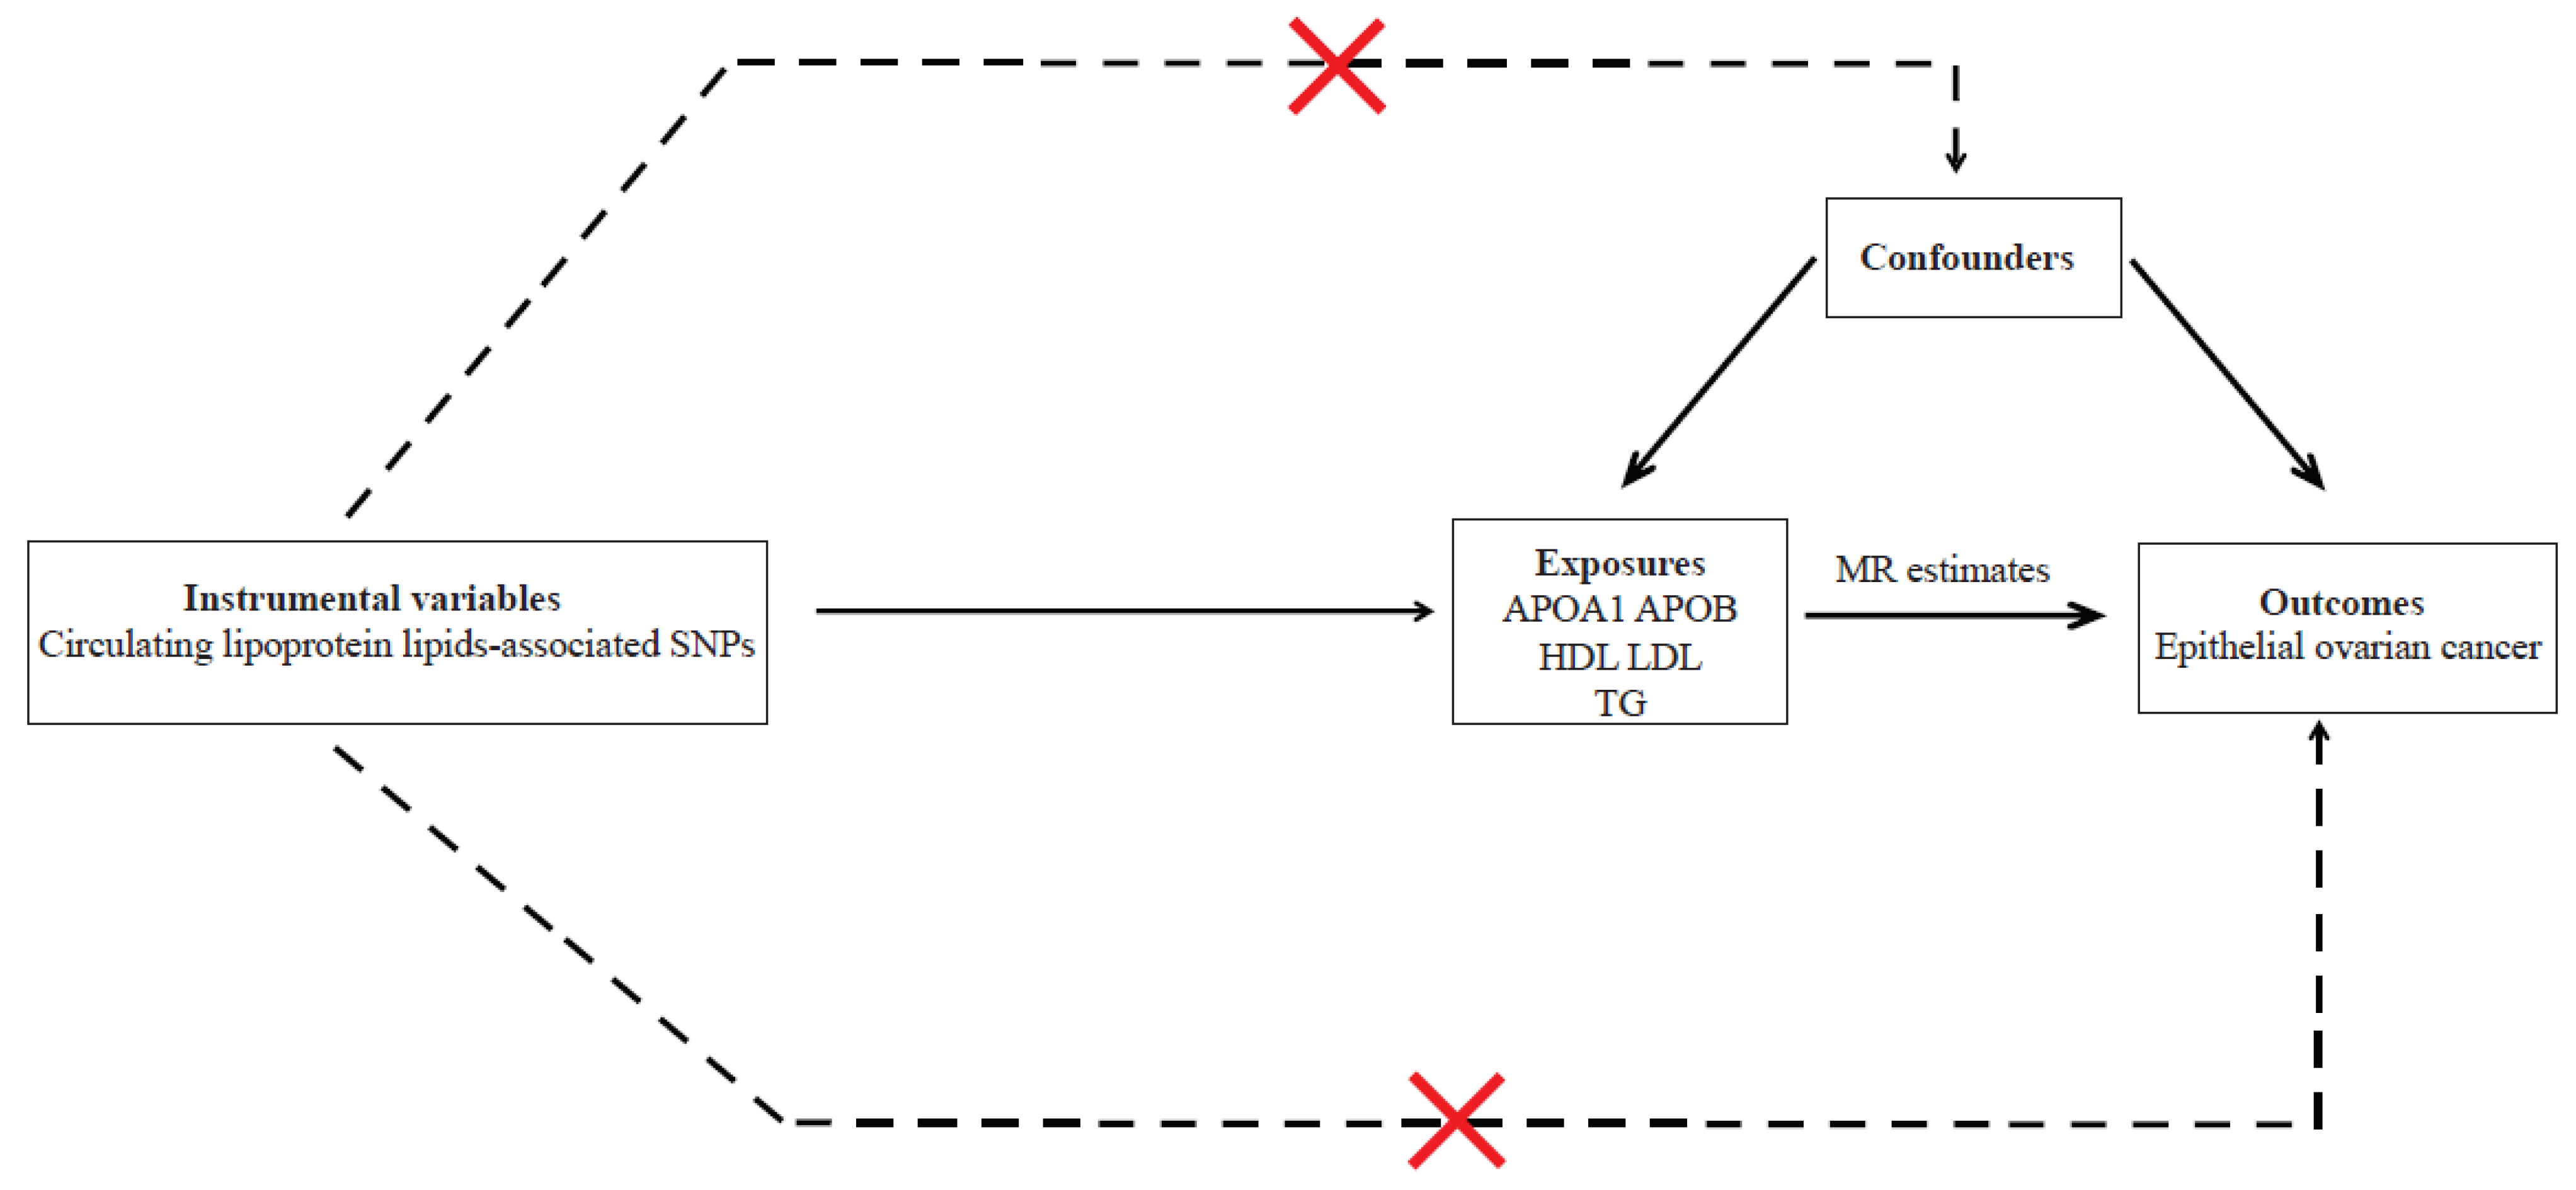
2.1. Assumptions of MR Study and Study Design Overview
2.2. Instrumental Variables
2.3. Outcome Data Sources
2.4. Statistical Analysis
3. Results
4. Discussion
Supplementary Materials
Author Contributions
Funding
Institutional Review Board Statement
Informed Consent Statement
Data Availability Statement
Acknowledgments
Conflicts of Interest
References
- Bray, F.; Ferlay, J.; Soerjomataram, I.; Siegel, R.L.; Torre, L.A.; Jemal, A. Global cancer statistics 2018: GLOBOCAN estimates of incidence and mortality worldwide for 36 cancers in 185 countries. CA Cancer J. Clin. 2018, 68, 394–424. [Google Scholar] [CrossRef] [PubMed] [Green Version]
- Wang, L.; Zhong, L.; Xu, B.; Chen, M.; Huang, H. Diabetes mellitus and the risk of ovarian cancer: A systematic review and meta-analysis of cohort and case-control studies. BMJ Open 2020, 10, e040137. [Google Scholar] [CrossRef] [PubMed]
- Lheureux, S.; Braunstein, M.; Oza, A.M. Epithelial ovarian cancer: Evolution of management in the era of precision medicine. CA Cancer J. Clin. 2019, 69, 280–304. [Google Scholar] [CrossRef] [PubMed] [Green Version]
- Matulonis, U.A.; Sood, A.K.; Fallowfield, L.; Howitt, B.E.; Sehouli, J.; Karlan, B.Y. Ovarian cancer. Nat. Rev. Dis. Primers 2016, 2, 16061. [Google Scholar] [CrossRef] [PubMed]
- Torre, L.A.; Trabert, B.; DeSantis, C.E.; Miller, K.D.; Samimi, G.; Runowicz, C.D.; Gaudet, M.M.; Jemal, A.; Siegel, R.L. Ovarian cancer statistics, 2018. CA Cancer J. Clin. 2018, 68, 284–296. [Google Scholar] [CrossRef] [PubMed] [Green Version]
- Mallen, A.R.; Townsend, M.K.; Tworoger, S.S. Risk Factors for Ovarian Carcinoma. Hematol. Oncol. Clin. N. Am 2018, 32, 891–902. [Google Scholar] [CrossRef] [PubMed]
- Stewart, C.; Ralyea, C.; Lockwood, S. Ovarian Cancer: An Integrated Review. Semin. Oncol. Nurs. 2019, 35, 151–156. [Google Scholar] [CrossRef]
- Huang, X.; Wang, X.; Shang, J.; Lin, Y.; Yang, Y.; Song, Y.; Yu, S. Association between dietary fiber intake and risk of ovarian cancer: A meta-analysis of observational studies. J. Int. Med. Res. 2018, 46, 3995–4005. [Google Scholar] [CrossRef] [Green Version]
- Guo, H.; Guo, J.; Xie, W.; Yuan, L.; Sheng, X. The role of vitamin D in ovarian cancer: Epidemiology, molecular mechanism and prevention. J. Ovarian Res. 2018, 11, 71. [Google Scholar] [CrossRef]
- Zhang, Y.; Wu, J.; Liang, J.Y.; Huang, X.; Xia, L.; Ma, D.W.; Xu, X.; Wu, P. Association of serum lipids and severity of epithelial ovarian cancer: An observational cohort study of 349 Chinese patients. J. Biomed. Res. 2018, 32, 336–342. [Google Scholar] [CrossRef]
- OnwukaJ, U.; Okekunle, A.P.; Olutola, O.M.; Akpa, O.M.; Feng, R. Lipid profile and risk of ovarian tumours: A meta-analysis. BMC Cancer 2020, 20, 200. [Google Scholar] [CrossRef]
- Zhang, D.; Xi, Y.; Feng, Y. Ovarian cancer risk in relation to blood lipid levels and hyperlipidemia: A systematic review and meta-analysis of observational epidemiologic studies. Eur. J. Cancer Prev. 2021, 30, 161–170. [Google Scholar] [CrossRef]
- Delimaris, I.; Faviou, E.; Antonakos, G.; Stathopoulou, E.; Zachari, A.; Dionyssiou-Asteriou, A. Oxidized LDL, serum oxidizability and serum lipid levels in patients with breast or ovarian cancer. Clin. Biochem. 2007, 40, 1129–1134. [Google Scholar] [CrossRef]
- Melvin, J.C.; Seth, D.; Holmberg, L.; Garmo, H.; Hammar, N.; Jungner, I.; Walldius, G.; Lambe, M.; Wigertz, A.; Van Hemelrijck, M. Lipid profiles and risk of breast and ovarian cancer in the Swedish AMORIS study. Cancer Epidemiol. Biomark. Prev. 2012, 21, 1381–1384. [Google Scholar] [CrossRef] [PubMed] [Green Version]
- Richardson, T.G.; Sanderson, E.; Palmer, T.M.; Ala-Korpela, M.; Ference, B.A.; Smith, G.D.; Holmes, M.V. Evaluating the relationship between circulating lipoprotein lipids and apolipoproteins with risk of coronary heart disease: A multivariable Mendelian randomisation analysis. PLoS Med. 2020, 17, e1003062. [Google Scholar] [CrossRef] [PubMed] [Green Version]
- Phelan, C.M.; Kuchenbaecker, K.B.; Tyrer, J.P.; Kar, S.P.; Lawrenson, K.; Winham, S.J.; Dennis, J.; Pirie, A.; Riggan, M.J.; Chornokur, G.; et al. Identification of 12 new susceptibility loci for different histotypes of epithelial ovarian cancer. Nat. Genet. 2017, 49, 680–691. [Google Scholar] [CrossRef] [Green Version]
- Hartwig, F.P.; Davies, N.M.; Hemani, G.; Smith, G.D. Two-sample Mendelian randomization: Avoiding the downsides of a powerful, widely applicable but potentially fallible technique. Int. J. Epidemiol. 2016, 45, 1717–1726. [Google Scholar] [CrossRef] [PubMed] [Green Version]
- Bowden, J.; Smith, G.D.; Haycock, P.C.; Burgess, S. Consistent Estimation in Mendelian Randomization with Some Invalid Instruments Using a Weighted Median Estimator. Genet. Epidemiol. 2016, 40, 304–314. [Google Scholar] [CrossRef] [Green Version]
- Bowden, J.; Smith, G.D.; Burgess, S. Mendelian randomization with invalid instruments: Effect estimation and bias detection through Egger regression. Int. J. Epidemiol. 2015, 44, 512–525. [Google Scholar] [CrossRef] [Green Version]
- Verbanck, M.; Chen, C.-Y.; Neale, B.; Do, R. Detection of widespread horizontal pleiotropy in causal relationships inferred from Mendelian randomization between complex traits and diseases. Nat. Genet. 2018, 50, 693–698. [Google Scholar] [CrossRef]
- Yavorska, O.O.; Burgess, S. MendelianRandomization: An R package for performing Mendelian randomization analyses using summarized data. Int. J. Epidemiol. 2017, 46, 1734–1739. [Google Scholar] [CrossRef] [PubMed] [Green Version]
- Hemani, G.; Zheng, J.; Elsworth, B.; Wade, K.H.; Haberland, V.; Baird, D.; Chaeles, L.; Burgess, S.; Bowden, J. The MR-Base platform supports systematic causal inference across the human phenome. Elife 2018, 7, e34408. [Google Scholar] [CrossRef] [PubMed]
- Lin, Q.Q.; Liu, W.; Xu, S.; Sun, L. Associations of preoperative serum high-density lipoprotein cholesterol and low-density lipoprotein cholesterol levels with the prognosis of ovarian cancer. Arch. Gynecol. Obstet. 2022, 305, 683–691. [Google Scholar] [CrossRef] [PubMed]
- Camuzcuoglu, H.; Arioz, D.T.; Toy, H.; Kurt, S.; Celik, H.; Erel, O. Serum paraoxonase and arylesterase activities in patients with epithelial ovarian cancer. Gynecol. Oncol. 2009, 112, 481–485. [Google Scholar] [CrossRef] [PubMed]
- Johnatty, S.E.; Tyrer, J.P.; Kar, S.; Beesley, J.; Lu, Y.; Gao, B.; Fasching, P.A.; Hein, A.; Ekici, A.B.; Beckmann, M.W.; et al. Genome-wide Analysis Identifies Novel Loci Associated with Ovarian Cancer Outcomes: Findings from the Ovarian Cancer Association Consortium. Clin. Cancer Res. 2015, 21, 5264–5276. [Google Scholar] [CrossRef] [Green Version]
- Trabert, B.; Hathaway, C.A.; Rice, M.S.; Rimm, E.B.; Sluss, P.M.; Terry, K.L.; Zeleznik, O.A.; Tworoger, S.S. Ovarian Cancer Risk in Relation to Blood Cholesterol and Triglycerides. Cancer Epidemiol. Biomark. Prev. 2021, 30, 2044–2051. [Google Scholar] [CrossRef]
- Hishinuma, E.; Shimada, M.; Matsukawa, N.; Saigusa, D.; Li, B.; Kudo, K.; Tsuji, K.; Shigeta, S.; Tokunaga, H.; Kumada, K.; et al. Wide-Targeted Metabolome Analysis Identifies Potential Biomarkers for Prognosis Prediction of Epithelial Ovarian Cancer. Toxins 2021, 13, 461. [Google Scholar] [CrossRef]
- Zeleznik, O.A.; Eliassen, A.H.; Kraft, P.; Poole, E.M.; Rosner, B.A.; Jeanfavre, S.; Deik, A.A.; Bullock, K.; Hitchcock, D.S.; Avila-Pacheco, J.; et al. A Prospective Analysis of Circulating Plasma Metabolites Associated with Ovarian Cancer Risk. Cancer Res. 2020, 80, 1357–1367. [Google Scholar] [CrossRef] [PubMed] [Green Version]
- Zhao, Z.; Cai, Q.; Xu, Y. The Lipidomic Analyses in Low and Highly Aggressive Ovarian Cancer Cell Lines. Lipids 2016, 51, 179–187. [Google Scholar] [CrossRef]
- Li, A.J.; Elmore, R.G.; Chen, I.Y.D.; Karlan, B.Y. Serum low-density lipoprotein levels correlate with survival in advanced stage epithelial ovarian cancers. Gynecol. Oncol. 2010, 116, 78–81. [Google Scholar] [CrossRef]
- Zhu, F.F.; Xu, X.X.; Shi, B.B.; Zeng, L.C.; Wang, L.; Wu, X.Q.; Zhu, H. The positive predictive value of low-density lipoprotein for recurrence-free survival in ovarian cancer. Int. J. Gynecol. Obstet. 2018, 143, 232–238. [Google Scholar] [CrossRef]
- Podzielinski, I.; Saunders, B.A.; Kimbler, K.D.; Branscum, A.J.; Fung, E.T.; DePriest, P.D.; van Nagell, J.R.; Ueland, F.R.; Baron, A.T. Apolipoprotein Concentrations Are Elevated in Malignant Ovarian Cyst Fluids Suggesting That Lipoprotein Metabolism Is Dysregulated in Epithelial Ovarian Cancer. Cancer Investig. 2013, 31, 258–272. [Google Scholar] [CrossRef] [PubMed]
- Heinecke, J.W. Oxidants and antioxidants in the pathogenesis of atherosclerosis: Implications for the oxidized low density lipoprotein hypothesis. Atherosclerosis 1998, 141, 1–15. [Google Scholar] [CrossRef] [PubMed]
- Navab, M.; Hama, S.Y.; Anantharamaiah, G.M.; Hassan, K.; Hough, G.P.; Watson, A.D.; Reddy, S.T.; Sevanian, A.; Fonarow, G.C.; Fogelman, A.M. Normal high density lipoprotein inhibits three steps in the formation of mildly oxidized low density lipoprotein: Steps 2 and 3. J. Lipid Res. 2000, 41, 1495–1508. [Google Scholar] [CrossRef]
- Su, F.; Kozak, K.R.; Imaizumi, S.; Gao, F.; Amneus, M.W.; Grijalva, V.; Ng, C.; Wagner, A.; Hough, G.; Farias-Eisner, G.; et al. Apolipoprotein A-I (apoA-I) and apoA-I mimetic peptides inhibit tumor development in a mouse model of ovarian cancer. Proc. Natl. Acad. Sci. USA 2010, 107, 19997–20002. [Google Scholar] [CrossRef] [Green Version]
- Su, F.; Gm, A.; Palgunachari, M.N.; White, C.R.; Stessman, H.; Wu, Y.; Vadgama, J.; Pietras, R.; Nguyen, D.; Reddy, S.T. Bovine HDL and Dual Domain HDL-Mimetic Peptides Inhibit Tumor Development in Mice. J. Cancer Res. Ther. Oncol. 2020, 8, 101. [Google Scholar] [CrossRef]
- Bjornson, E.; Adiels, M.; Taskinen, M.R.; Boren, J. Kinetics of plasma triglycerides in abdominal obesity. Curr. Opin. Lipidol. 2017, 28, 11–18. [Google Scholar] [CrossRef]
- Pradeep, S.; Kim, S.W.; Wu, S.Y.; Nishimura, M.; Chaluvally-Raghavan, P.; Miyake, T.; Pecot, C.V.; Kim, S.-J.; Choi, H.J.; Bischoff, F.Z.; et al. Hematogenous Metastasis of Ovarian Cancer: Rethinking Mode of Spread. Cancer Cell 2014, 26, 77–91. [Google Scholar] [CrossRef] [Green Version]
- Nieman, K.M.; Kenny, H.A.; Penicka, C.V.; Ladanyi, A.; Buell-Gutbrod, R.; Zillhardt, M.R.; Romero, I.L.; Carey, M.S.; Mills, G.B.; Hotamisligil, G.S.; et al. Adipocytes promote ovarian cancer metastasis and provide energy for rapid tumor growth. Nat. Med. 2011, 17, 1498–1503. [Google Scholar] [CrossRef] [PubMed] [Green Version]
- Miranda, F.; Mannion, D.; Liu, S.J.; Zheng, Y.Y.; Mangala, L.S.; Redondo, C.; Herrero-Gonzalez, S.; Xu, R.; Taylor, C.; Chedom, D.F.; et al. Salt-Inducible Kinase 2 Couples Ovarian Cancer Cell Metabolism with Survival at the Adipocyte-Rich Metastatic Niche. Cancer Cell 2016, 30, 273–289. [Google Scholar] [CrossRef]

| Exposures | Consortium | No. SNPs | Sample Size | Adjustments | Population |
|---|---|---|---|---|---|
| APOA1 | UK Biobank | 299 | 393,193 | Age, sex, and genotyping chip | European |
| APOB | UK Biobank | 198 | 439,214 | ||
| HDL | UK Biobank | 362 | 403,943 | ||
| LDL | UK Biobank | 158 | 440,546 | ||
| TG | UK Biobank | 313 | 441,016 | ||
| Main outcomes | Dataset | No. cases | Control | Total | Population |
| All SOC | OCAC | 25,509 | 40,941 | 66450 | European |
| Clear cell OC | OCAC | 1366 | 40,941 | ||
| Endometrioid OC | OCAC | 2810 | 40,941 | ||
| LMPOC | OCAC | 3103 | 40,941 | ||
| HGLGSOC | OCAC | 14,049 | 40,941 | ||
| HGSOC | OCAC | 13,037 | 40,941 | ||
| LGSOC | OCAC | 1012 | 40,941 | ||
| LGLMSOC | OCAC | 2966 | 40,941 | ||
| LMSOC | OCAC | 1954 | 40,941 | ||
| Invasive and low malignant potential MOC | OCAC | 2566 | 40,941 | ||
| Invasive MOC | OCAC | 1417 | 40,941 | ||
| LMMOC | OCAC | 1149 | 40,941 |
| Main Outcome | Method | No. of SNPs | OR (95% CI) | p for Association | p for Heterogeneity Test | p for MR-Egger Intercept | p for MR-PRESSO Global Test |
|---|---|---|---|---|---|---|---|
| All EOC | IVW | 322 | 1.02 (0.94–1.10) | 0.697 | <1 × 10⁻³ | 0.218 | |
| MR Egger | 322 | 1.08 (0.95–1.21) | 0.235 | <1 × 10⁻³ | |||
| Weighted median | 322 | 1.05 (0.94–1.17) | 0.376 | ||||
| MR-PRESSO (outlier corrected, 2 outliers) | 320 | 1.01 (1.01–1.02) | 0.719 | <1 × 10⁻⁴ | |||
| Clear cell OC | IVW | 322 | 1.20 (0.98–1.46) | 0.084 | 0.093 | 0.655 | |
| MR Egger | 322 | 0.96 (0.83–1.55) | 0.435 | 0.088 | |||
| Weighted median | 322 | 1.11 (0.76–1.62) | 0.589 | ||||
| MR-PRESSO (raw, 0 outliers) | 322 | 1.20 (1.18–1.21) | 0.085 | 0.090 | |||
| Endometrioid OC | IVW | 322 | 0.98 (0.85–1.14) | 0.798 | 0.041 | 0.469 | |
| MR Egger | 322 | 1.05 (0.83–1.31) | 0.701 | 0.040 | |||
| Weighted median | 322 | 1.24 (0.97–1.59) | 0.082 | ||||
| MR-PRESSO (raw, 0 outliers) | 322 | 0.98 (0.97–0.99) | 0.798 | 0.037 | |||
| LMPOC | IVW | 322 | 0.80 (0.69–0.93) | 0.004 | <1 × 10⁻³ | 0.155 | |
| MR Egger | 322 | 0.91 (0.72–1.15) | 0.439 | <1 × 10⁻³ | |||
| Weighted median | 322 | 0.79 (0.63–0.99) | 0.039 | ||||
| MR-PRESSO (outlier corrected, 1 outlier) | 321 | 0.81 (0.81–0.82) | 0.005 | <1 × 10⁻³ | |||
| HGLGSOC | IVW | 322 | 1.00 (0.91–1.10) | 0.930 | <1 × 10⁻³ | 0.174 | |
| MR Egger | 322 | 1.08 (0.94–1.25) | 0.276 | <1 × 10⁻³ | |||
| Weighted median | 322 | 1.05 (0.93–1.20) | 0.429 | ||||
| MR-PRESSO (outlier corrected, 3 outliers) | 319 | 1.01 (1.00–1.01) | 0.882 | <1 × 10⁻⁴ | |||
| HGSOC | IVW | 322 | 1.02 (0.92–1.12) | 0.738 | <1 × 10⁻³ | 0.224 | |
| MR Egger | 322 | 1.09 (0.94–1.27) | 0.254 | <1 × 10⁻³ | |||
| Weighted median | 322 | 1.09 (0.95–1.25) | 0.232 | ||||
| MR-PRESSO (outlier corrected, 2 outliers) | 320 | 1.01 (1.01–1.02) | 0.782 | <1 × 10⁻⁴ | |||
| LGSOC | IVW | 322 | 0.80 (0.63–1.01) | 0.064 | 0.283 | ||
| MR Egger | 322 | 0.94 (0.66–1.36) | 0.756 | 0.288 | 0.245 | ||
| Weighted median | 322 | 0.86 (0.58–1.27) | 0.440 | ||||
| MR-PRESSO (raw, 0 outliers) | 322 | 0.80 (0.79–0.81) | 0.065 | 0.280 | |||
| LGLMSOC | IVW | 322 | 0.77 (0.66–0.90) | 0.001 | 0.001 | 0.228 | |
| MR Egger | 322 | 0.86 (0.68–1.09) | 0.221 | 0.001 | |||
| Weighted median | 322 | 0.84 (0.66–1.07) | 0.158 | ||||
| MR-PRESSO (outlier corrected, 1 outlier) | 321 | 0.78 (0.78–0.79) | 0.001 | 0.001 | |||
| LMSOC | IVW | 322 | 0.76 (0.63–0.90) | 0.002 | 0.024 | 0.358 | |
| MR Egger | 322 | 0.83 (0.63–1.10) | 0.197 | 0.023 | |||
| Weighted median | 322 | 0.81 (0.62–1.08) | 0.152 | ||||
| MR-PRESSO (outlier corrected, 1 outlier) | 321 | 0.77 (0.76–0.78) | 0.002 | 0.023 | |||
| MOC: invasive and low malignant potential | IVW | 322 | 0.98 (0.84–1.15) | 0.821 | 0.023 | 0.015 | |
| MR Egger | 322 | 1.23 (0.97–1.55) | 0.088 | 0.037 | |||
| Weighted median | 322 | 1.07 (0.82–1.40) | 0.609 | ||||
| MR-PRESSO (raw, 0 outliers) | 322 | 0.98 (0.97–0.99) | 0.821 | 0.024 | |||
| Invasive MOC | IVW | 322 | 1.08 (0.88–1.32) | 0.456 | 0.075 | 0.029 | |
| MR Egger | 322 | 1.40 (1.03–0.09) | 0.032 | 0.100 | |||
| Weighted median | 322 | 1.18 (0.83–1.68) | 0.361 | ||||
| MR-PRESSO (raw, 0 outliers) | 322 | 1.08 (1.07–1.09) | 0.457 | 0.075 | |||
| LMMOC | IVW | 322 | 0.86 (0.68–1.10) | 0.228 | 0.001 | 0.194 | |
| MR Egger | 322 | 1.04 (0.72–1.50) | 0.841 | 0.001 | |||
| Weighted median | 322 | 0.86 (0.59–1.26) | 0.446 | ||||
| MR-PRESSO (raw, 0 outliers) | 322 | 0.86 (0.85–0.88) | 0.229 | 0.001 |
| Main Outcomes | Method | No. of SNPs | OR (95% CI) | pfor Association | pfor Heterogeneity Test | pfor MR-Egger Intercept | pfor MR-PRESSO Global Test |
|---|---|---|---|---|---|---|---|
| All EOC | IVW | 280 | 1.05 (0.97–1.13) | 0.204 | <1 × 10⁻³ | 0.092 | |
| MR Egger | 280 | 0.98 (0.87–1.09) | 0.674 | 0.001 | |||
| Weighted median | 280 | 0.97 (0.87–1.09) | 0.631 | ||||
| MR-PRESSO (raw, 0 outliers) | 280 | 1.05 (1.05–1.05) | 0.205 | <1 × 10⁻³ | |||
| Clear cell OC | IVW | 280 | 0.88 (0.72–1.08) | 0.222 | 0.272 | 0.500 | |
| MR Egger | 280 | 0.81 (0.60–1.11) | 0.190 | 0.265 | |||
| Weighted median | 280 | 0.81 (0.56–1.15) | 0.237 | ||||
| MR-PRESSO (raw, 0 outliers) | 280 | 0.88 (0.87–0.89) | 0.223 | 0.266 | |||
| Endometrioid OC | IVW | 280 | 1.13 (0.97–1.33) | 0.121 | 0.006 | 0.142 | |
| MR Egger | 280 | 0.99 (0.78–1.26) | 0.942 | 0.007 | |||
| Weighted median | 280 | 1.00 (0.78–1.27) | 0.976 | ||||
| MR-PRESSO (raw, 0 outliers) | 280 | 1.13 (1.12–1.14) | 0.122 | 0.005 | |||
| LMPOC | IVW | 280 | 1.10 (0.95–1.27) | 0.193 | 0.155 | 0.738 | |
| MR Egger | 280 | 1.07 (0.86–1.33) | 0.541 | 0.146 | |||
| Weighted median | 280 | 1.05 (0.83–1.33) | 0.692 | ||||
| MR-PRESSO (raw, 0 outliers) | 280 | 1.10 (1.09–1.11) | 0.195 | 0.159 | |||
| HGLGSOC | IVW | 280 | 1.04 (0.95–1.13) | 0.426 | <1 × 10⁻³ | 0.250 | |
| MR Egger | 280 | 0.98 (0.85–1.12) | 0.738 | <1 × 10⁻³ | |||
| Weighted median | 280 | 1.08 (0.95–1.22) | 0.248 | ||||
| MR-PRESSO (raw, 0 outliers) | 280 | 1.04 (1.03–1.04) | 0.427 | <1 × 10⁻⁴ | |||
| HGSOC | IVW | 280 | 1.02 (0.93–1.12) | 0.731 | <1 × 10⁻³ | 0.413 | |
| MR Egger | 280 | 0.97 (0.84–1.12) | 0.700 | <1 × 10⁻³ | |||
| Weighted median | 280 | 1.02 (0.89–1.17) | 0.795 | ||||
| MR-PRESSO (raw, 0 outliers) | 280 | 1.02 (1.01–1.02) | 0.731 | <1 × 10⁻⁴ | |||
| LGSOC | IVW | 280 | 1.43 (1.10–1.86) | 0.007 | 0.015 | 0.076 | |
| MR Egger | 280 | 1.10 (0.74–1.62) | 0.647 | 0.020 | |||
| Weighted median | 280 | 1.15 (0.76–1.75) | 0.508 | ||||
| MR-PRESSO (outlier corrected, 1 outlier) | 279 | 1.45 (1.44–1.47) | 0.005 | 0.017 | |||
| LGLMSOC | IVW | 280 | 1.28 (1.10–1.48) | 0.001 | 0.185 | 0.108 | |
| MR Egger | 280 | 1.11 (0.89–1.39) | 0.342 | 0.205 | |||
| Weighted median | 280 | 1.01 (0.80–1.28) | 0.939 | ||||
| MR-PRESSO (raw, 0 outliers) | 280 | 1.28 (1.27–1.29) | 0.001 | 0.182 | |||
| LMSOC | IVW | 280 | 1.22 (1.02–1.44) | 0.027 | 0.470 | 0.398 | |
| MR Egger | 280 | 1.12 (0.86–1.45) | 0.403 | 0.466 | |||
| Weighted median | 280 | 1.19 (0.90–1.57) | 0.233 | ||||
| MR-PRESSO (raw, 0 outliers) | 280 | 1.22 (1.20–1.23) | 0.027 | 0.480 | |||
| MOC: invasive and low malignant potential | IVW | 280 | 0.99 (0.86–1.15) | 0.935 | 0.478 | 0.242 | |
| MR Egger | 280 | 0.90 (0.72–1.12) | 0.353 | 0.484 | |||
| Weighted median | 280 | 0.98 (0.76–1.25) | 0.851 | ||||
| MR-PRESSO (raw, 0 outliers) | 280 | 0.99 (0.99–1.00) | 0.935 | 0.482 | |||
| Invasive MOC | IVW | 280 | 1.06 (0.87–1.29) | 0.575 | 0.739 | 0.032 | |
| MR Egger | 280 | 0.83 (0.62–1.11) | 0.216 | 0.789 | |||
| Weighted median | 280 | 0.94 (0.69–1.29) | 0.707 | ||||
| MR-PRESSO (raw, 0 outliers) | 280 | 1.06 (1.05–1.07) | 0.564 | 0.736 | |||
| LMMOC | IVW | 280 | 0.95 (0.75–1.19) | 0.643 | 0.083 | 0.569 | |
| MR Egger | 280 | 1.02 (0.72–1.45) | 0.906 | 0.079 | |||
| Weighted median | 280 | 0.92 (0.64–1.33) | 0.671 | ||||
| MR-PRESSO (raw, 0 outliers) | 280 | 0.95 (0.93–0.96) | 0.644 | 0.090 |
Publisher’s Note: MDPI stays neutral with regard to jurisdictional claims in published maps and institutional affiliations. |
© 2022 by the authors. Licensee MDPI, Basel, Switzerland. This article is an open access article distributed under the terms and conditions of the Creative Commons Attribution (CC BY) license (https://creativecommons.org/licenses/by/4.0/).
Share and Cite
Meng, H.; Wang, R.; Song, Z.; Wang, F. Causal Effects of Circulating Lipid Traits on Epithelial Ovarian Cancer: A Two-Sample Mendelian Randomization Study. Metabolites 2022, 12, 1175. https://doi.org/10.3390/metabo12121175
Meng H, Wang R, Song Z, Wang F. Causal Effects of Circulating Lipid Traits on Epithelial Ovarian Cancer: A Two-Sample Mendelian Randomization Study. Metabolites. 2022; 12(12):1175. https://doi.org/10.3390/metabo12121175
Chicago/Turabian StyleMeng, Hongen, Rong Wang, Zijun Song, and Fudi Wang. 2022. "Causal Effects of Circulating Lipid Traits on Epithelial Ovarian Cancer: A Two-Sample Mendelian Randomization Study" Metabolites 12, no. 12: 1175. https://doi.org/10.3390/metabo12121175
APA StyleMeng, H., Wang, R., Song, Z., & Wang, F. (2022). Causal Effects of Circulating Lipid Traits on Epithelial Ovarian Cancer: A Two-Sample Mendelian Randomization Study. Metabolites, 12(12), 1175. https://doi.org/10.3390/metabo12121175