
Comparison of Lysis and Detachment Sample Preparation Methods for Cultured Triple-Negative Breast Cancer Cells Using UHPLC–HRMS-Based Metabolomics


Abstract
:1. Introduction
2. Results
3. Discussion
4. Materials and Methods
4.1. Chemical and Reagents
4.2. Cell Culture
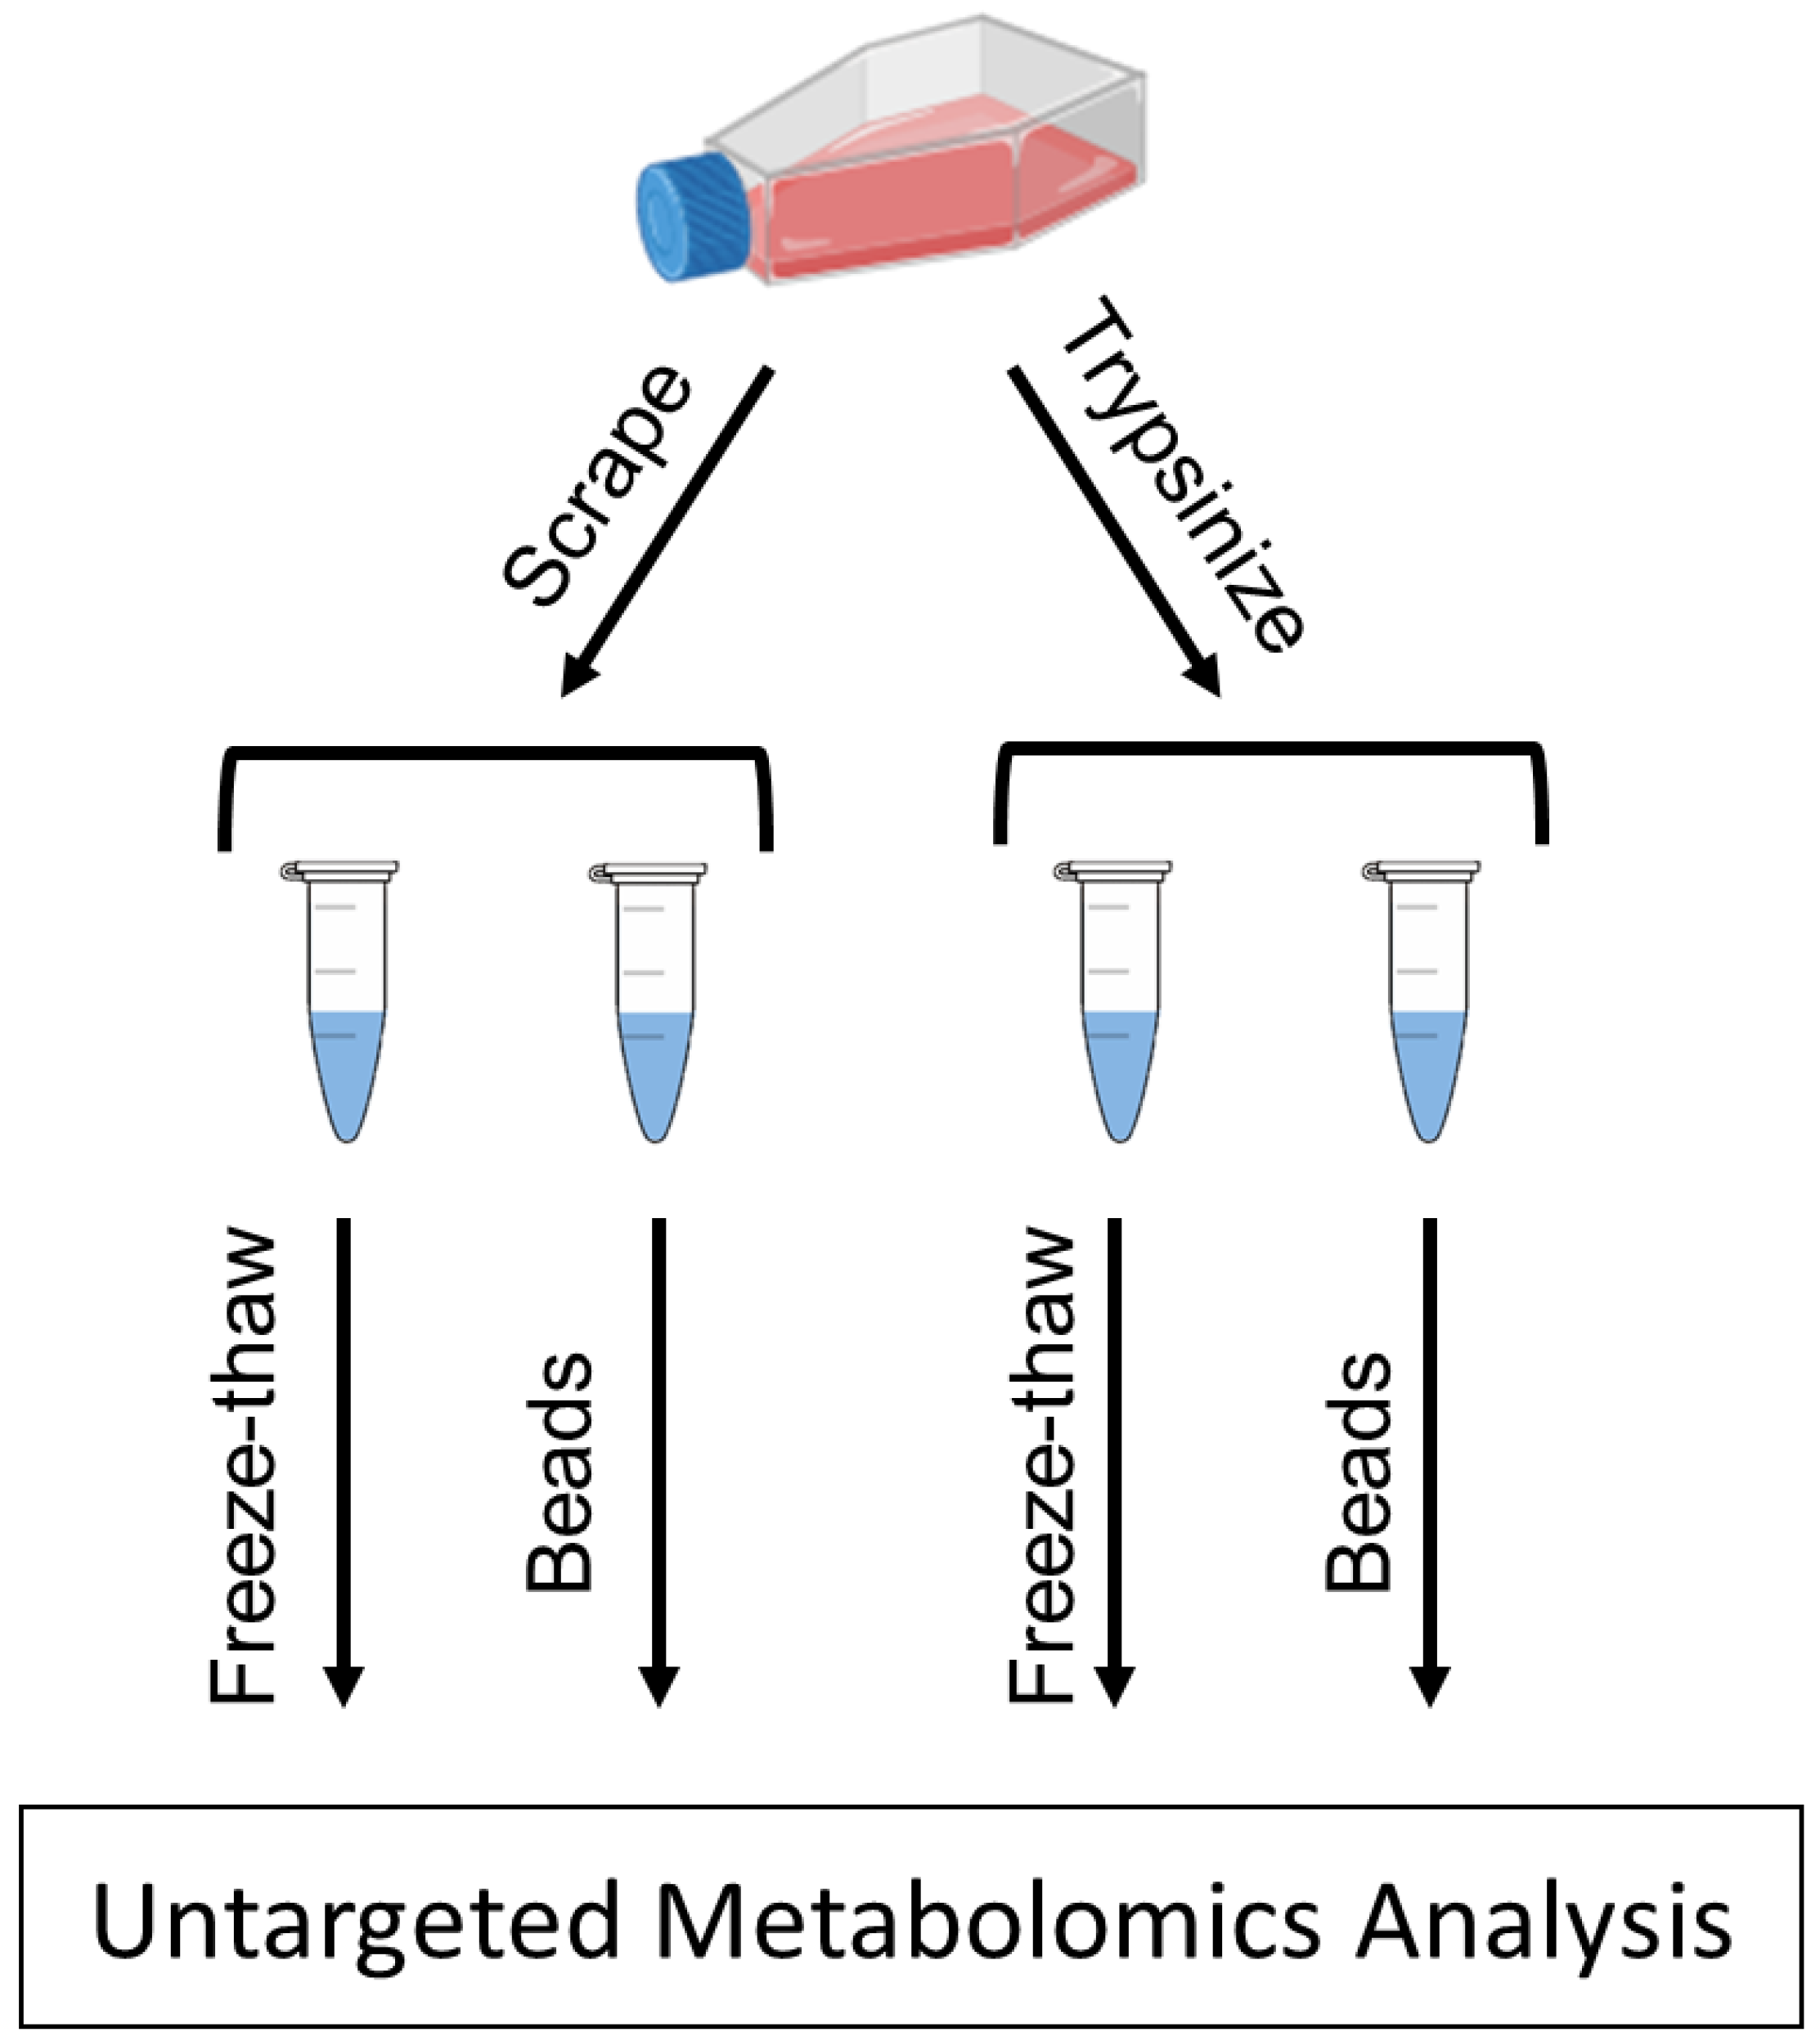
4.3. Cell Scraping Detachment Method
4.4. Trypsinization Detachment Method
4.5. Bead Homogenization
4.6. Freeze–Thaw Cycling
4.7. Protein Measurement
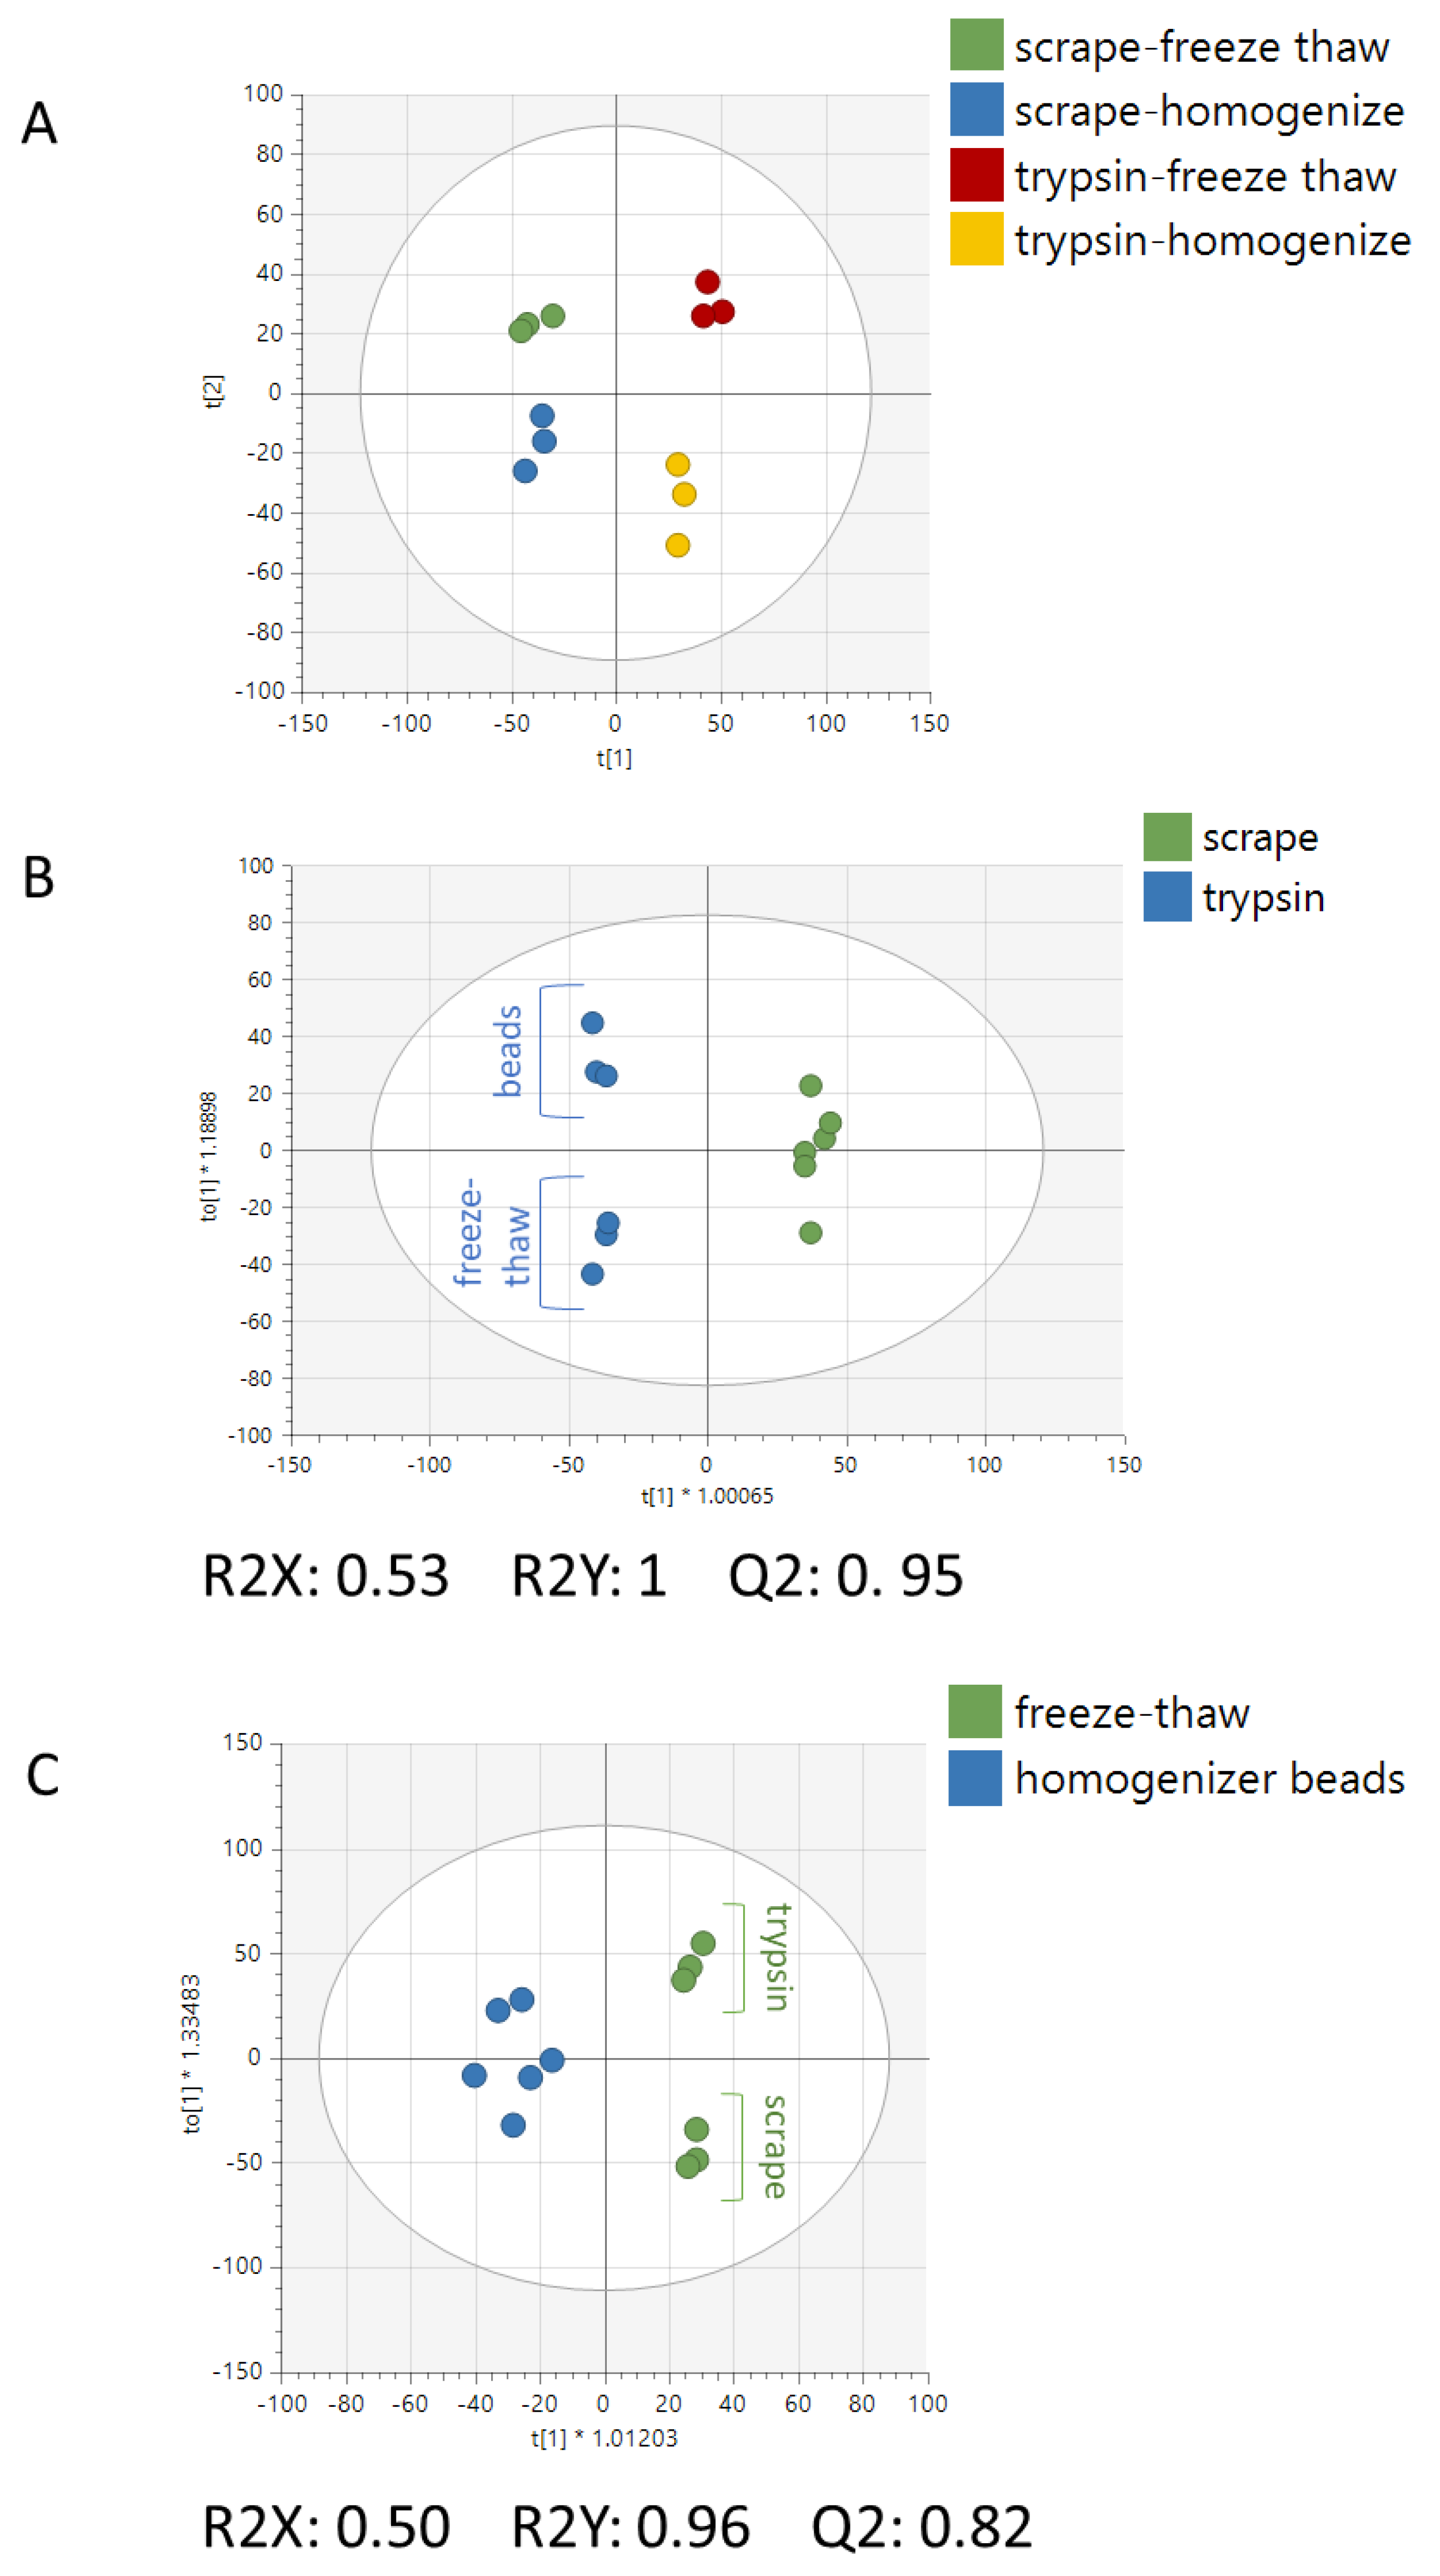
4.8. UHPLC–HRMS Data Acquisition and Multivariate Statistical Analysis
4.9. Pathway Analysis
4.10. Metabolite Identification
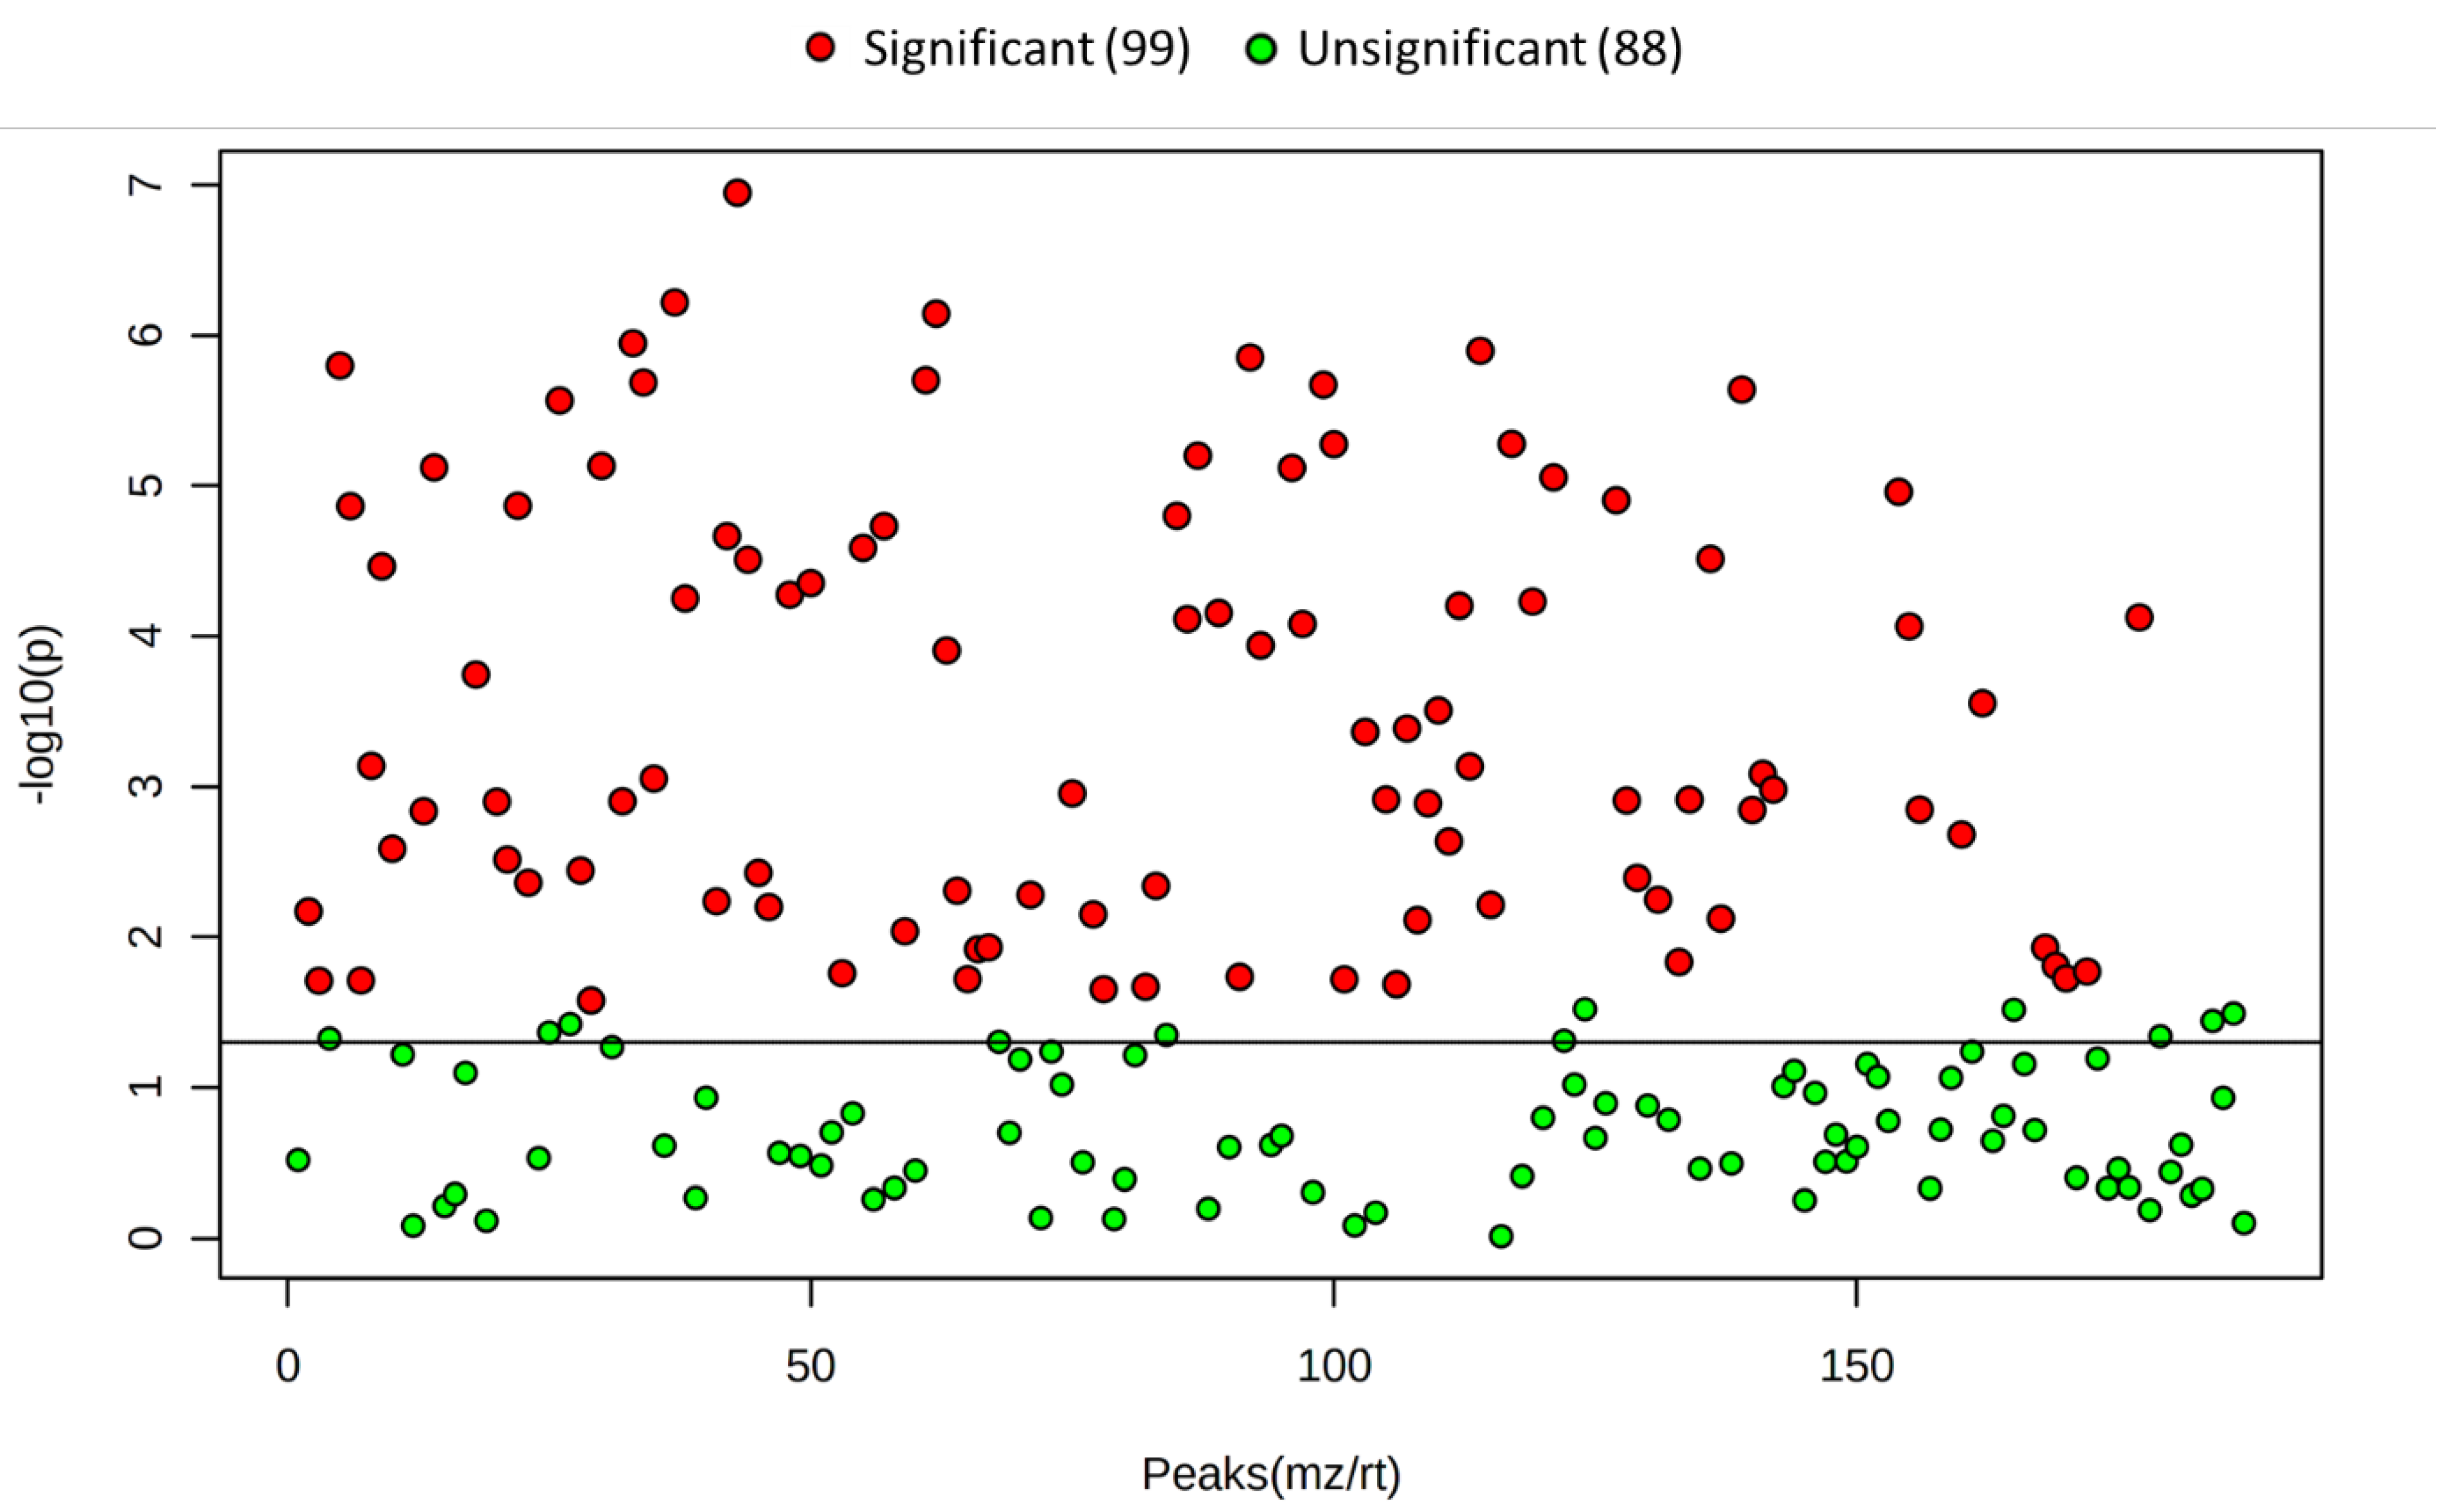
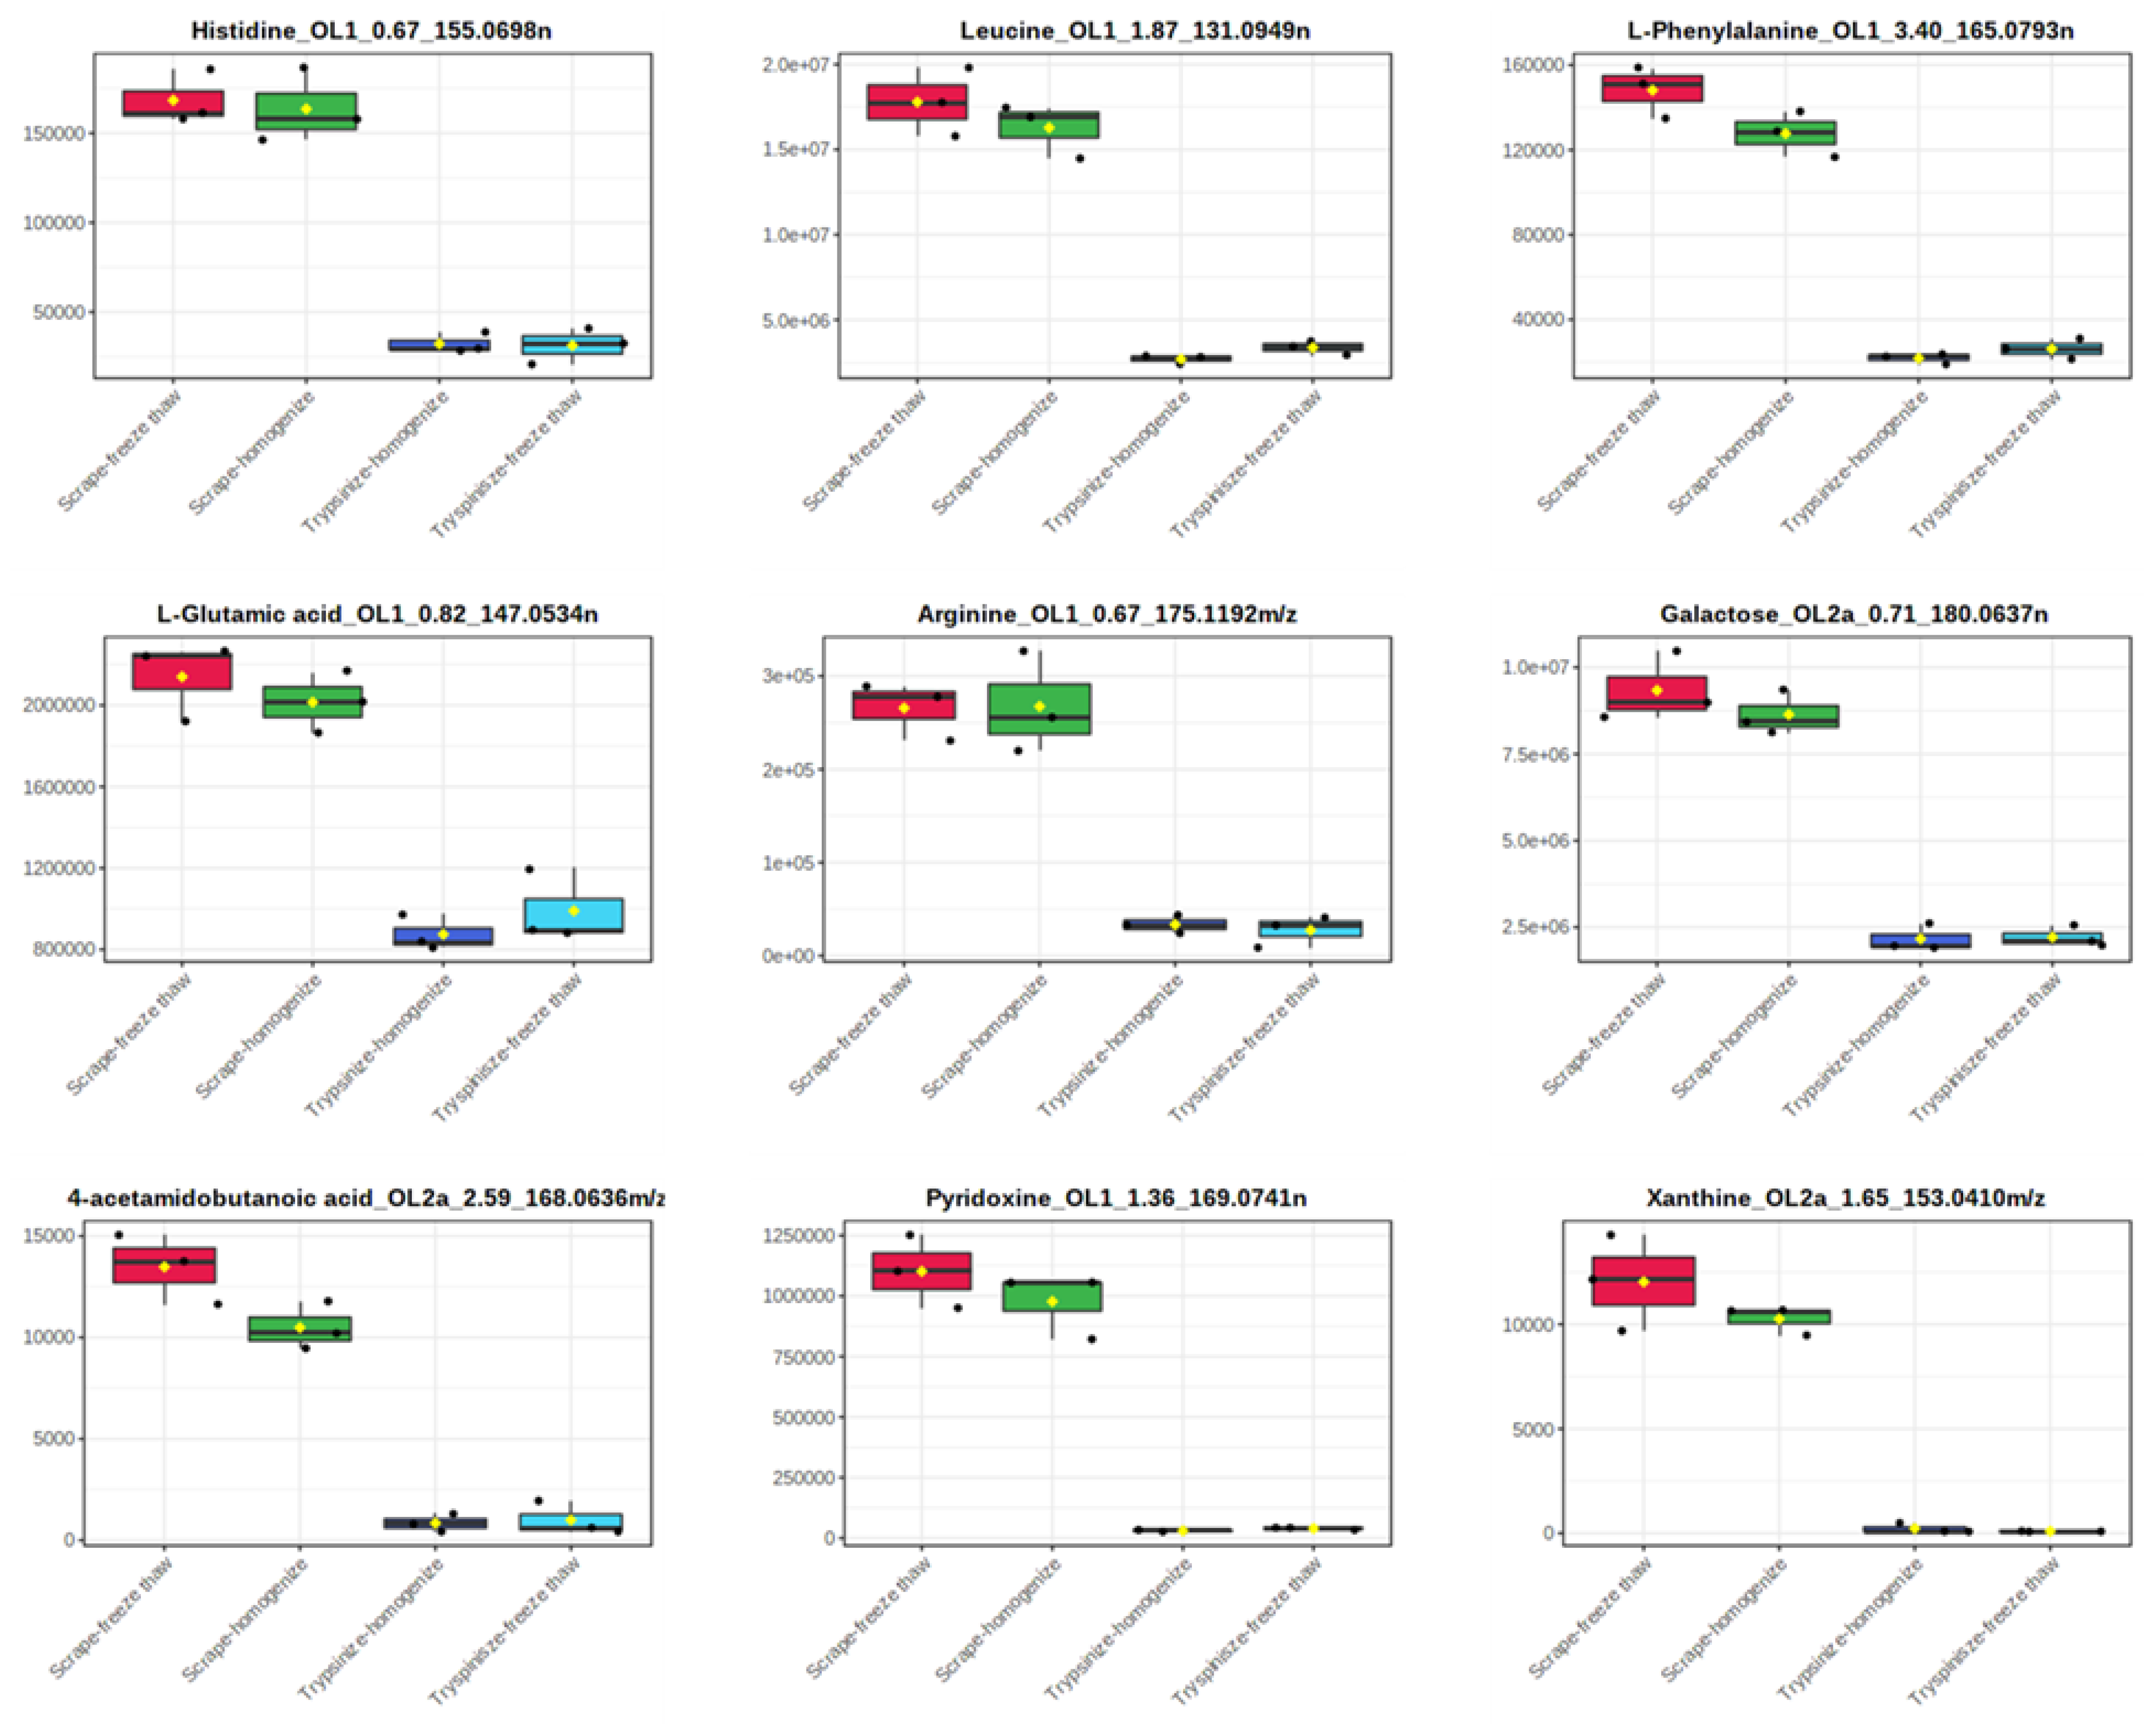
4.11. Statistical Analysis of Identified Metabolites
5. Conclusions
Supplementary Materials
Author Contributions
Funding
Institutional Review Board Statement
Informed Consent Statement
Data Availability Statement
Conflicts of Interest
References
- DeBerardinis, R.J.; Chandel, N.S. Fundamentals of cancer metabolism. Sci. Adv. 2016, 2, e1600200. [Google Scholar] [CrossRef] [PubMed] [Green Version]
- Rahman, M.; Hasan, M.R. Cancer metabolism and drug resistance. Metabolites 2015, 5, 571–600. [Google Scholar] [CrossRef] [PubMed] [Green Version]
- Boroughs, L.K.; DeBerardinis, R.J. Metabolic pathways promoting cancer cell survival and growth. Nat. Cell Biol. 2015, 17, 351–359. [Google Scholar] [CrossRef] [Green Version]
- Wong, C.C.; Qian, Y.; Yu, J. Interplay between epigenetics and metabolism in oncogenesis: Mechanisms and therapeutic approaches. Oncogene 2017, 36, 3359–3374. [Google Scholar] [CrossRef]
- Levine, A.J.; Puzio-kuter, A.M. The control of the metabolic switch in cancer by oncogenes and tumor suppressor genes. Science 2010, 330, 1340–1344. [Google Scholar] [CrossRef] [Green Version]
- Liu, X.; Locasale, J.W. Metabolomics—A primer. Trends Biochem. Sci. 2017, 42, 274–284. [Google Scholar] [CrossRef] [PubMed] [Green Version]
- Sumner, L.W.; Amberg, A.; Barrett, D.; Beale, M.H.; Beger, R.; Daykin, C.A.; Fan, T.W.M.; Fiehn, O.; Goodacre, R.; Griffin, J.L.; et al. Proposed minimum reporting standards for chemical analysis: Chemical Analysis Working Group (CAWG) Metabolomics Standards Initiative (MSI). Metabolomics 2007, 3, 211–221. [Google Scholar] [CrossRef] [Green Version]
- Herman, S.; Emami Khoonsari, P.; Aftab, O.; Krishnan, S.; Strömbom, E.; Larsson, R.; Hammerling, U.; Spjuth, O.; Kultima, K.; Gustafsson, M. Mass spectrometry based metabolomics for in vitro systems pharmacology: Pitfalls, challenges, and computational solutions. Metabolomics 2017, 13, 79. [Google Scholar] [CrossRef]
- Peterson, A.L.; Walker, A.K.; Sloan, E.K.; Creek, D.J. Optimized method for untargeted metabolomics analysis of MDA-MB-231 breast cancer cells. Metabolites 2016, 6, 30. [Google Scholar] [CrossRef]
- Bi, H.; Krausz, K.W.; Manna, S.K.; Li, F.; Johnson, C.H.; Gonzalez, F.J. Optimization of harvesting, extraction, and analytical protocols for UPLC-ESI-MS-based metabolomic analysis of adherent mammalian cancer cells. Anal. Bioanal. Chem. 2013, 405, 5279–5289. [Google Scholar] [CrossRef] [Green Version]
- Dettmer, K.; Nürnberger, N.; Kaspar, H.; Gruber, M.A.; Almstetter, M.F.; Oefner, P.J. Metabolite extraction from adherently growing mammalian cells for metabolomics studies: Optimization of harvesting and extraction protocols. Anal. Bioanal. Chem. 2011, 399, 1127–1139. [Google Scholar] [CrossRef] [PubMed]
- Muschet, C.; Möller, G.; Prehn, C.; de Angelis, M.H.; Adamski, J.; Tokarz, J. Removing the bottlenecks of cell culture metabolomics: Fast normalization procedure, correlation of metabolites to cell number, and impact of the cell harvesting method. Metabolomics 2016, 12, 151. [Google Scholar] [CrossRef] [PubMed] [Green Version]
- Lorenz, M.A.; Burant, C.F.; Kennedy, R.T. Reducing time and increasing sensitivity in sample preparation for adherent mammalian cell metabolomics. Anal. Chem. 2011, 83, 3406–3414. [Google Scholar] [CrossRef] [PubMed] [Green Version]
- Ibáñez, C.; Simó, C.; Palazoglu, M.; Cifuentes, A. GC-MS based metabolomics of colon cancer cells using different extraction solvents. Anal. Chim. Acta 2017, 986, 48–56. [Google Scholar] [CrossRef] [PubMed] [Green Version]
- Danielsson, A.P.H.; Moritz, T.; Mulder, H.; Spégel, P. Development and optimization of a metabolomic method for analysis of adherent cell cultures. Anal. Biochem. 2010, 404, 30–39. [Google Scholar] [CrossRef] [PubMed]
- Kapoore, R.V.; Coyle, R.; Staton, C.A.; Brown, N.J.; Vaidyanathan, S. Influence of washing and quenching in profiling the metabolome of adherent mammalian cells: A case study with the metastatic breast cancer cell line MDA-MB-231. Analyst 2017, 142, 2038–2049. [Google Scholar] [CrossRef] [Green Version]
- Kapoore, R.V.; Coyle, R.; Staton, C.A.; Brown, N.J.; Vaidyanathan, S. Cell line dependence of metabolite leakage in metabolome analyses of adherent normal and cancer cell lines. Metabolomics 2015, 11, 1743–1755. [Google Scholar] [CrossRef]
- Kathryn, J.C.; Sireesha, V.G.; Stanley, L. Triple Negative Breast Cancer Cell Lines: One Tool in the Search for Better Treatment of Triple Negative Breast Cancer. Breast Dis. 2012, 32, 35–48. [Google Scholar] [CrossRef] [Green Version]
- Triba, M.N.; Le Moyec, L.; Amathieu, R.; Goossens, C.; Bouchemal, N.; Nahon, P.; Rutledge, D.N.; Savarin, P. PLS/OPLS models in metabolomics: The impact of permutation of dataset rows on the K-fold cross-validation quality parameters. Mol. Biosyst. 2015, 11, 13–19. [Google Scholar] [CrossRef]
- Luo, X.; Gu, X.; Li, L. Development of a simple and efficient method of harvesting and lysing adherent mammalian cells for chemical isotope labeling LC-MS-based cellular metabolomics. Anal. Chim. Acta 2018, 1037, 97–106. [Google Scholar] [CrossRef]
- Endo, H.; Owada, S.; Inagaki, Y.; Shida, Y.; Tatemichi, M. Metabolic reprogramming sustains cancer cell survival following extracellular matrix detachment. Redox Biol. 2020, 36, 101643. [Google Scholar] [CrossRef] [PubMed]
- Wilson, D.F. Regulation of cellular metabolism: Programming and maintaining metabolic homeostasis. J. Appl. Physiol. 2013, 115, 1583–1588. [Google Scholar] [CrossRef] [PubMed] [Green Version]
- Paoli, P.; Giannoni, E.; Chiarugi, P. Anoikis molecular pathways and its role in cancer progression. Biochim. Biophys. Acta-Mol. Cell Res. 2013, 1833, 3481–3498. [Google Scholar] [CrossRef] [Green Version]
- Rushing, B.; McRitchie, S.; Arbeeva, L.; Nelson, A.; Azcarate-Peril, M.; Li, Y.; Qian, Y.; Pathmasiri, W.; Sumner, S.; Loeser, R. Fecal metabolomics reveals products of dysregulated proteloysis and altered microbial metabolism in obesity-related osteoarthritis. Osteoarthr. Cartil. 2022, 30, 81–91. [Google Scholar] [CrossRef] [PubMed]
- Li, S.; Li, Y.; Rushing, B.R.; Harris, S.E.; McRitchie, S.L.; Sumner, S.J.; Dohlman, H.G. Multi-omics analysis of multiple glucose-sensing receptor systems in yeast. Biomolecules 2022, 12, 175. [Google Scholar] [CrossRef]
- Li, Y.-Y.; Ghanbari, R.; Pathmasiri, W.; McRitchie, S.; Poustchi, H.; Shayanrad, A.; Roshandel, G.; Etemadi, A.; Pollock, J.D.; Malekzadeh, R.; et al. Untargeted Metabolomics: Biochemical Perturbations in Golestan Cohort Study Opium Users Inform Intervention Strategies. Front. Nutr. 2020, 7, 2020–2021. [Google Scholar] [CrossRef]
- Li, S.; Li, Y.; Rushing, B.R.; Harris, S.E.; McRitchie, S.L.; Jones, J.C.; Dominguez, D.; Sumner, S.J.; Dohlman, H.G. Multi-omics analysis of glucose-mediated signaling by a moonlighting Gβ protein Asc1/RACK1. PLoS Genet. 2021, 17, e1009640. [Google Scholar] [CrossRef]
- Pang, Z.; Chong, J.; Zhou, G.; De Lima Morais, D.A.; Chang, L.; Barrette, M.; Gauthier, C.; Jacques, P.É.; Li, S.; Xia, J. MetaboAnalyst 5.0: Narrowing the gap between raw spectra and functional insights. Nucleic Acids Res. 2021, 49, 388–396. [Google Scholar] [CrossRef]


| Trypsinized vs. Scraped | |||
|---|---|---|---|
| Pathway Name | Mummichog_Pvals | GSEA_Pvals | Combined_Pvals |
| Tyrosine metabolism | 0.00071 | 0.0101 | 9.00 × 10⁻⁵ |
| Urea cycle/amino group metabolism | 0.00285 | 0.01075 | 0.00035 |
| Arginine and proline metabolism | 0.00153 | 0.02273 | 0.00039 |
| Vitamin B6 (pyridoxine) metabolism | 0.00845 | 0.01282 | 0.0011 |
| Tryptophan metabolism | 0.02778 | 0.01053 | 0.00267 |
| Aspartate and asparagine metabolism | 0.01479 | 0.03061 | 0.00394 |
| Vitamin B3 (nicotinate and nicotinamide) metabolism | 0.02075 | 0.05952 | 0.00951 |
| Starch and sucrose metabolism | 0.06117 | 0.02326 | 0.01075 |
| Methionine and cysteine metabolism | 0.03379 | 0.04494 | 0.01137 |
| Glycine, serine, alanine and threonine metabolism | 0.1673 | 0.01087 | 0.0133 |
| Alanine and aspartate metabolism | 0.03482 | 0.06098 | 0.01519 |
| Nitrogen metabolism | 0.06117 | 0.04651 | 0.01952 |
| Nucleotide sugar metabolism | 0.2055 | 0.01852 | 0.02501 |
| Benzoate degradation via CoA ligation | 0.04187 | 0.1176 | 0.03109 |
| N-Glycan biosynthesis | 0.5143 | 0.0119 | 0.03731 |
| Dynorphin metabolism | 0.2055 | 0.04167 | 0.04933 |
| Homogenizer Beads vs. Freeze–Thaw | |||
| Pathway Name | Mummichog_Pvals | GSEA_Pvals | Combined_Pvals |
| Tryptophan metabolism | 0.00656 | 0.05263 | 0.0031 |
| De novo fatty acid biosynthesis | 0.04632 | 0.01818 | 0.0068 |
| Fatty acid activation | 0.02136 | 0.08621 | 0.01344 |
| Fatty acid metabolism | 0.02136 | 0.1552 | 0.02224 |
| Scrape–Freeze–Thaw | Scrape–Homogenize | Trypsinize–Homogenize | Trypsinize–Freeze–Thaw | |||||
|---|---|---|---|---|---|---|---|---|
| Compound | Avg | RSD (%) | Avg | RSD (%) | Avg | RSD (%) | Avg | RSD (%) |
| Putrescine_OL1_0.54_89.1075 m/z | 2992 | 42.4 | 1674 | 86.0 | 1014 | 44.9 | 1525 | 96.9 |
| L-Lysine_OL1_0.56_147.1130 m/z | 22,207 | 31.3 | 20,342 | 38.4 | 5156 | 27.9 | 6412 | 8.5 |
| Spermidine_OL1_0.59_146.1654 m/z | 202,200 | 27.4 | 41,381 | 52.4 | 367,082 | 59.1 | 28,400 | 82.2 |
| Spermine_OL1_0.65_203.2233 m/z | 110,891 | 51.5 | 25,909 | 52.8 | 271,520 | 69.6 | 22,128 | 55.8 |
| Histidine_OL1_0.67_155.0698 n | 168,403 | 9.0 | 163,603 | 12.7 | 32,176 | 17.6 | 31,296 | 32.0 |
| Arginine_OL1_0.67_175.1192 m/z | 265,818 | 11.6 | 267,533 | 20.4 | 33,540 | 29.1 | 27,417 | 61.0 |
| N,N,N-Trimethyllysine_OL1_0.67_189.1601 m/z | 6356 | 36.9 | 6554 | 12.1 | 3118 | 6.8 | 2329 | 86.7 |
| Glutamine_OL1_0.69_146.0694 n | 1,472,545 | 8.0 | 1,442,283 | 2.4 | 704,975 | 17.0 | 761,455 | 39.8 |
| Thiamine_OL1_0.69_265.1120 m/z | 305,026 | 7.0 | 282,389 | 12.7 | 56,499 | 12.8 | 68,323 | 86.7 |
| Creatinine_OL1_0.71_113.0591 n | 175,014 | 7.3 | 165,813 | 16.8 | 92,045 | 14.8 | 114,427 | 19.5 |
| Threonine_OL1_0.71_120.0657 m/z | 77,169 | 4.9 | 76,222 | 6.0 | 51,248 | 19.8 | 53,769 | 41.3 |
| L-Cartinine_OL1_0.71_162.1127 m/z | 526,264 | 13.4 | 475,538 | 19.5 | 396,120 | 20.1 | 421,175 | 80.6 |
| Galactitol_OL1_0.71_205.0686 m/z | 237,325 | 8.5 | 230,700 | 9.0 | 112,259 | 5.8 | 102,267 | 59.3 |
| Lactose_OL1_0.71_342.1166 n | 230,068 | 25.0 | 206,361 | 12.1 | 1,776,784 | 10.5 | 2,207,958 | 18.9 |
| Creatine_OL1_0.72_132.0770 m/z | 94,761 | 8.1 | 94,497 | 8.2 | 143,864 | 5.9 | 125,815 | 83.2 |
| Deoxycarnitine_OL1_0.72_146.1178 m/z | 20,921 | 26.2 | 20,727 | 18.6 | 34,590 | 33.9 | 22,083 | 97.2 |
| L-Proline_OL1_0.75_115.0635 n | 351,132 | 9.3 | 341,882 | 14.4 | 470,374 | 31.4 | 623,017 | 31.3 |
| L-Serine_OL1_0.78_105.0428 n | 43,852 | 5.8 | 43,025 | 8.9 | 22,294 | 6.9 | 22,194 | 30.6 |
| L-Asparagine_OL1_0.8_133.0610 m/z | 9458 | 10.3 | 8823 | 7.9 | 7919 | 18.2 | 7657 | 55.1 |
| 2-Aminoadipic Acid_OL1_0.8_162.0763 m/z | 103,200 | 9.2 | 100,713 | 4.3 | 60,123 | 5.9 | 80,185 | 17.9 |
| S-Adenosylmethionine_OL1_0.8_399.1450 m/z | 27,144 | 23.1 | 22,708 | 32.7 | 44,605 | 31.2 | 65,449 | 16.4 |
| L-Glutamic Acid_OL1_0.82_147.0534 n | 2,140,291 | 9.1 | 2,015,112 | 7.4 | 874,729 | 10.2 | 990,198 | 18.5 |
| N-Acetylserine_OL1_0.87_170.0427 m/z | 385,191 | 11.3 | 339,478 | 11.8 | 433,571 | 10.8 | 535,675 | 9.8 |
| 1-Aminocyclopropanecarboxylic Acid_OL1_0.91_101.0479 n | 539,979 | 8.6 | 502,411 | 8.6 | 446,443 | 7.9 | 495,069 | 16.7 |
| D-Aspartic Acid_OL1_0.91_134.0450 m/z | 671,296 | 18.1 | 594,642 | 17.2 | 828,733 | 11.0 | 945,140 | 19.8 |
| L-Cystine_OL1_0.91_241.0316 m/z | 104,297 | 12.3 | 100,058 | 18.5 | 2009 | 75.5 | 1402 | 35.1 |
| L-Serine_OL1_0.91_88.0395 m/z | 19,781 | 14.6 | 18,576 | 15.6 | 23,792 | 9.8 | 27,695 | 17.2 |
| Phosphorylcholine_OL1_0.98_183.0664 n | 18,637,731 | 8.7 | 17,187,394 | 14.4 | 18,140,958 | 11.8 | 26,579,422 | 10.6 |
| Acetylcarnitine_OL1_1.07_204.1235 m/z | 33,374 | 13.8 | 29,443 | 22.0 | 37,426 | 11.6 | 48,813 | 17.9 |
| Nicotinamide_OL1_1.16_123.0555 m/z | 408,693 | 16.8 | 400,555 | 14.2 | 54,688 | 1.2 | 57,120 | 7.4 |
| N-Acetylaspartate_OL1_1.27_175.0484 n | 80,089 | 9.7 | 77,520 | 12.5 | 78,246 | 10.4 | 101,863 | 13.7 |
| L-Glutathione Reduced_OL1_1.32_307.0843 n | 24,688,792 | 14.7 | 21,418,891 | 19.9 | 30,277,732 | 8.3 | 41,337,083 | 11.9 |
| Pyridoxine_OL1_1.36_169.0741 n | 1,102,166 | 13.7 | 977,926 | 13.8 | 30,102 | 11.4 | 39,539 | 12.4 |
| Pyroglutamic Acid_OL1_1.49_130.0502 m/z | 2,123,041 | 12.2 | 2,054,021 | 12.5 | 354,201 | 7.6 | 395,546 | 16.4 |
| Succinic Acid_OL1_1.67_118.0268 n | 39,389 | 1.1 | 44,925 | 16.5 | 24,518 | 20.4 | 23,208 | 10.2 |
| N-Acetylglutamate_OL1_1.76_189.0641 n | 27,615 | 8.1 | 26,479 | 14.4 | 26,836 | 3.6 | 31,166 | 11.2 |
| Leucine_OL1_1.87_131.0949 n | 17,790,828 | 11.3 | 16,285,136 | 9.7 | 2,683,726 | 9.5 | 3,369,993 | 12.6 |
| Glycodeoxycholic Acid_OL1_13.07_449.3147 n | 31,623 | 26.9 | 28,427 | 18.5 | 4 | 173.2 | 488 | 3.1 |
| Palmitoleic Acid_OL1_13.6_254.2250 n | 45,654 | 4.2 | 48,022 | 4.4 | 49,662 | 5.6 | 47,474 | 10.8 |
| Propanoylcarnitine_OL1_2.17_218.1391 m/z | 143,866 | 12.8 | 128,195 | 16.4 | 108,344 | 13.1 | 147,557 | 14.2 |
| Adenosine_OL1_2.62_268.1045 m/z | 322,597 | 14.4 | 234,125 | 23.3 | 157,091 | 65.4 | 64,987 | 16.1 |
| Kynurenine_OL1_3.09_209.0926 m/z | 8736 | 13.0 | 7779 | 18.4 | 1318 | 15.1 | 1321 | 69.8 |
| L-Phenylalanine_OL1_3.4_165.0793 n | 148,133 | 8.3 | 127,736 | 8.3 | 21,789 | 11.4 | 26,215 | 18.3 |
| Butanoylcarnitine_OL1_3.7_232.1549 m/z | 65,075 | 15.5 | 62,277 | 3.8 | 326,341 | 17.7 | 424,502 | 18.7 |
| Pantothenate_OL1_4.16_219.1112 n | 2,002,286 | 5.7 | 1,819,190 | 15.1 | 1,150,498 | 10.8 | 1,601,215 | 13.8 |
| Valerylcarnitine_OL1_4.86_246.1705 m/z | 87,542 | 11.4 | 76,800 | 19.6 | 43,760 | 17.4 | 58,454 | 19.0 |
| Methylthioadenosine_OL1_4.95_298.0974 m/z | 247,549 | 7.6 | 247,579 | 11.7 | 203,744 | 19.4 | 220,645 | 13.0 |
| 4-Hydroxybenzaldehyde_OL1_5.44_105.0337 m/z | 3808 | 23.8 | 3294 | 12.9 | 567 | 1.8 | 559 | 7.5 |
| 2-Hydroxyphenylacetate_OL1_6.47_153.0549 m/z | 12,314 | 4.1 | 13,598 | 9.1 | 11,840 | 4.3 | 11,954 | 14.8 |
| Riboflavin_OL1_6.74_377.1463 m/z | 45,334 | 21.5 | 36,882 | 24.1 | 590 | 27.5 | 1343 | 24.9 |
| 2-Octenedioic Acid_OL1_7.13_173.0811 m/z | 5113 | 44.6 | 7319 | 57.7 | 2395 | 51.0 | 4038 | 92.4 |
| Azelate_OL1_8.7_188.1053 n | 268,336 | 2.9 | 253,718 | 4.8 | 253,716 | 2.9 | 288,027 | 12.8 |
| Lumichrome_OL1_8.72_265.0701 m/z | 3870 | 22.1 | 4448 | 14.0 | 2179 | 26.4 | 1606 | 89.5 |
| Glycerol_OL2a_0.6_115.0367 m/z | 1121 | 32.7 | 2066 | 10.9 | 1477 | 31.3 | 2534 | 50.0 |
| Creatine_OL2a_0.63_263.1465 m/z | 75,190 | 21.2 | 70,905 | 20.0 | 1227 | 113.3 | 2808 | 59.6 |
| N,N,N-Trimethyllysine_OL2a_0.65_211.1420 m/z | 577 | 123.1 | 287 | 173.2 | 0 | - | 373 | 90.5 |
| Histidine_OL2a_0.67_178.0590 m/z | 12,284 | 7.7 | 13,639 | 8.6 | 3812 | 31.7 | 3235 | 60.2 |
| Sarcosine_OL2a_0.69_112.0370 m/z | 868 | 32.3 | 742 | 27.9 | 1370 | 7.2 | 1159 | 81.7 |
| L-Lysine_OL2a_0.69_129.1024 m/z | 598 | 72.2 | 181 | 173.2 | 603 | 84.7 | 2139 | 36.0 |
| Betaine_OL2a_0.69_150.1127 m/z | 0 | - | 1523 | 142.4 | 315 | 97.1 | 99 | 122.0 |
| Betaine_OL2a_0.71_140.0684 m/z | 104,380 | 9.4 | 94,252 | 13.8 | 16,865 | 21.0 | 21,989 | 21.6 |
| Galactose_OL2a_0.71_180.0637 n | 9,339,956 | 10.7 | 8,638,770 | 7.4 | 2,165,989 | 18.2 | 2,210,381 | 14.0 |
| Galactose_OL2a_0.71_219.0269 m/z | 888,396 | 7.0 | 783,629 | 6.6 | 376,622 | 18.2 | 529,905 | 20.4 |
| Trimethylamine Oxide_OL2a_0.71_76.0758 m/z | 624 | 52.7 | 815 | 32.0 | 105 | 62.9 | 31 | 173.2 |
| Arabitol_OL2a_0.72_175.0580 m/z | 8611 | 47.2 | 8464 | 15.0 | 3476 | 13.8 | 2267 | 86.6 |
| Sorbitol_OL2a_0.72_221.0425 m/z | 14,185 | 8.6 | 13,373 | 2.7 | 6125 | 21.6 | 6555 | 80.8 |
| Sucrose_OL2a_0.72_325.1133 m/z | 520 | 173.2 | 420 | 173.2 | 6975 | 17.8 | 4244 | 89.9 |
| Pipecolate_OL2a_0.72_94.0653 m/z | 3490 | 27.8 | 5576 | 16.4 | 6494 | 53.1 | 1542 | 57.2 |
| Uracil_OL2a_0.75_113.0347 m/z | 3350 | 30.5 | 3567 | 9.9 | 6473 | 53.9 | 3620 | 13.5 |
| N-Acetylputrescine_OL2a_0.75_113.1075 m/z | 0 | - | 160 | 173.2 | 607 | 70.5 | 21 | 173.2 |
| Glycerol_OL2a_0.75_115.0368 m/z | 6206 | 50.0 | 6747 | 12.6 | 1357 | 32.5 | 1147 | 93.2 |
| Creatine_OL2a_0.75_154.0589 m/z | 3381 | 48.7 | 4280 | 19.9 | 3520 | 4.8 | 2818 | 87.7 |
| Deoxyribose_OL2a_0.76_117.0548 m/z | 11,747 | 15.8 | 10,872 | 43.0 | 4871 | 14.0 | 5724 | 63.0 |
| Choline_OL2a_0.76_143.0705 m/z | 3740 | 10.7 | 3714 | 7.9 | 4828 | 12.2 | 3992 | 17.7 |
| Taurine_OL2a_0.78_126.0221 m/z | 7535 | 30.2 | 7801 | 24.1 | 68,493 | 22.3 | 71,492 | 38.9 |
| 3-(Carbamoylamino)Propanoic Acid_OL2a_0.78_155.0429 m/z | 4671 | 28.5 | 4045 | 43.0 | 7551 | 2.6 | 6199 | 65.8 |
| Pyridoxal_OL2a_0.78_168.0658 m/z | 1977 | 18.9 | 2218 | 36.2 | 917 | 14.3 | 518 | 72.0 |
| Fructose_OL2a_0.78_213.0973 m/z | 181 | 87.8 | 59 | 173.2 | 3964 | 15.8 | 3376 | 87.2 |
| Glycine_OL2a_0.78_76.0394 m/z | 16,396 | 6.1 | 15,563 | 7.8 | 17,457 | 11.3 | 18,217 | 31.4 |
| 5-Aminolevulinate_OL2a_0.8_132.0657 m/z | 7413 | 13.8 | 8389 | 15.6 | 7112 | 10.4 | 6998 | 15.0 |
| 3-Methyladenine_OL2a_0.8_150.0777 m/z | 1058 | 13.8 | 1531 | 7.9 | 11,761 | 78.6 | 1813 | 30.9 |
| Spermine_OL2a_0.8_203.2234 m/z | 71,359 | 30.7 | 41,512 | 20.4 | 183,518 | 57.7 | 11,527 | 48.6 |
| Deoxyribose_OL2a_0.8_99.0442 m/z | 13,993 | 4.7 | 13,684 | 5.7 | 16,206 | 2.2 | 16,056 | 6.2 |
| Xylose_OL2a_0.82_115.0392 m/z | 7632 | 15.1 | 7779 | 7.4 | 9921 | 11.4 | 10,416 | 16.3 |
| 5-Aminopentanoate_OL2a_0.82_118.0865 m/z | 722,647 | 13.1 | 669,054 | 13.3 | 187,580 | 3.1 | 193,015 | 31.4 |
| Glutamyl-Valine_OL2a_0.82_247.1292 m/z | 20,682 | 27.9 | 18,403 | 19.8 | 70 | 173.2 | 53 | 173.2 |
| L-Lysine_OL2a_0.91_147.1131 m/z | 87,495 | 16.5 | 78,912 | 15.1 | 7815 | 6.9 | 8954 | 17.9 |
| Dihydroorotic Acid_OL2a_0.91_191.0666 m/z | 7007 | 15.9 | 6597 | 37.0 | 7747 | 11.6 | 5671 | 47.1 |
| Cytidine_OL2a_0.91_276.1194 m/z | 136,179 | 23.1 | 126,828 | 18.5 | 16,521 | 10.8 | 19,062 | 15.1 |
| Hypotaurine_OL2a_0.96_110.0272 m/z | 2926 | 14.9 | 2486 | 13.9 | 2760 | 15.6 | 3432 | 23.4 |
| Phosphorylcholine_OL2a_0.96_183.0664 n | 162,563 | 29.0 | 132,261 | 47.2 | 135,874 | 40.8 | 391,675 | 37.4 |
| Betaine_OL2a_1.05_118.0865 m/z | 1,157,973 | 9.1 | 1,053,217 | 12.3 | 268,966 | 3.9 | 311,624 | 6.2 |
| Pyridoxal_OL2a_1.14_168.0658 m/z | 3417 | 15.3 | 3279 | 22.2 | 763 | 21.0 | 643 | 55.8 |
| L-Glutathione Reduced_OL2a_1.14_290.0808 m/z | 1975 | 49.5 | 1679 | 49.3 | 2154 | 16.0 | 6728 | 92.6 |
| Shikimic Acid_OL2a_1.16_139.0392 m/z | 1048 | 16.7 | 1247 | 6.5 | 887 | 26.9 | 1004 | 22.1 |
| L-Methionine_OL2a_1.18_172.0406 m/z | 8726 | 14.2 | 6260 | 22.7 | 173 | 87.8 | 396 | 57.8 |
| Uric Acid_OL2a_1.27_169.0359 m/z | 5373 | 18.1 | 4778 | 25.6 | 0 | - | 0 | - |
| N-Acetylaspartate_OL2a_1.29_158.0451 m/z | 1920 | 14.8 | 1627 | 35.3 | 2542 | 14.3 | 2536 | 60.6 |
| Xanthine_OL2a_1.65_153.0410 m/z | 12,029 | 19.1 | 10,254 | 6.7 | 165 | 173.2 | 0 | - |
| L-Tyrosine_OL2a_1.71_204.0635 m/z | 23,973 | 19.5 | 20,174 | 8.0 | 1793 | 19.2 | 2099 | 18.7 |
| Sebacate_OL2a_10.06_225.1102 m/z | 92,992 | 5.6 | 92,015 | 3.1 | 92,176 | 2.8 | 103,904 | 4.8 |
| 2-(2-Carboxyethyl)-4-Methyl-5-Propylfuran-3-Carboxylic Acid (CMPF)_OL2a_11.97_263.0895 m/z | 3580 | 12.5 | 3631 | 11.5 | 3347 | 12.9 | 3506 | 6.4 |
| 12-Hydroxydodecanoic Acid_OL2a_12.05_239.1622 m/z | 300,056 | 5.7 | 276,373 | 2.7 | 266,376 | 3.2 | 326,278 | 0.1 |
| 17-Octadecynoic Acid_OL2a_14.74_303.2296 m/z | 3451 | 17.0 | 3669 | 23.0 | 3747 | 10.7 | 4109 | 16.9 |
| Oleic Acid_OL2a_15.49_283.2634 m/z | 4171 | 39.5 | 9314 | 5.9 | 12,433 | 23.0 | 5478 | 6.8 |
| Oleic Acid_OL2a_15.67_283.2635 m/z | 716 | 106.3 | 2885 | 35.4 | 2845 | 44.9 | 538 | 87.0 |
| 25-Hydroxycholesterol_OL2a_15.86_367.3361 m/z | 5383 | 28.5 | 31,189 | 14.6 | 21,320 | 21.8 | 15,555 | 31.2 |
| Arachidonic Acid_OL2a_15.88_287.2371 m/z | 0 | - | 692 | 97.0 | 3528 | 43.2 | 1462 | 46.3 |
| 24-Hydroxychloesterol_OL2a_16.12_425.3393 m/z | 2979 | 51.4 | 6453 | 25.3 | 8977 | 14.7 | 12,584 | 20.6 |
| 10Z-Nonadecenoic Acid_OL2a_16.23_319.2610 m/z | 1139 | 119.5 | 1296 | 72.6 | 6095 | 12.4 | 5706 | 15.5 |
| 10Z-Nonadecenoic Acid_OL2a_16.25_297.2792 m/z | 895 | 117.9 | 206 | 173.2 | 3779 | 21.6 | 2407 | 32.8 |
| 7-Dehydrocholesterol_OL2a_17.29_407.3288 m/z | 2855 | 22.6 | 1802 | 35.4 | 9337 | 27.6 | 11,165 | 1.8 |
| 5-Hydroxytryptophan_OL2a_2.5_185.0708 m/z | 2510 | 16.1 | 1877 | 15.5 | 2485 | 16.8 | 3953 | 8.6 |
| 4-Acetamidobutanoic Acid_OL2a_2.59_168.0636 m/z | 13,487 | 12.8 | 10,492 | 11.3 | 847 | 51.9 | 998 | 83.1 |
| Cyclic AMP_OL2a_3.04_330.0603 m/z | 755 | 39.1 | 914 | 64.0 | 10,860 | 3.2 | 8639 | 69.4 |
| Methyglutarate_OL2a_4.49_169.0475 m/z | 11,990 | 5.5 | 11,958 | 6.8 | 11,634 | 4.9 | 11,874 | 13.4 |
| L-Tryptophan_OL2a_4.49_227.0796 m/z | 45,154 | 14.4 | 38,462 | 10.7 | 7886 | 12.8 | 8910 | 30.9 |
| Tiglylcarnitine_OL2a_4.59_244.1548 m/z | 6477 | 4.4 | 5385 | 13.6 | 4495 | 3.9 | 3982 | 86.8 |
| 3-Propylmalic Acid_OL2a_4.78_176.0688 n | 8328 | 20.2 | 46,028 | 22.2 | 65,600 | 19.5 | 9590 | 11.2 |
| 3-Hydroxysuberic Acid_OL2a_5.2_173.0812 m/z | 1098 | 61.7 | 761 | 54.0 | 337 | 56.2 | 362 | 51.2 |
| Hippuric Acid_OL2a_5.44_202.0478 m/z | 20,814 | 18.4 | 18,500 | 13.1 | 2256 | 31.7 | 2030 | 10.9 |
| 3,3-Dimethylpentanedionate_OL2a_6.08_183.0632 m/z | 26,837 | 7.0 | 25,321 | 8.2 | 22,685 | 1.8 | 26,993 | 7.0 |
| N-Acetylleucine_OL2a_6.25_196.0949 m/z | 1666 | 33.7 | 2598 | 42.8 | 877 | 36.9 | 1382 | 48.1 |
| 2-Hydroxyphenylacetate_OL2a_6.32_135.0442 m/z | 7126 | 10.8 | 8264 | 7.3 | 8772 | 4.1 | 8172 | 2.9 |
| Phenylethanolamine_OL2a_6.81_120.0810 m/z | 844 | 33.1 | 1348 | 41.7 | 1730 | 33.0 | 1437 | 28.2 |
| 2-Octenedioic Acid_OL2a_6.81_195.0632 m/z | 3387 | 13.2 | 2517 | 12.6 | 2645 | 16.8 | 2972 | 15.3 |
| Dethiobiotin_OL2a_7.37_429.2716 m/z | 201 | 173.2 | 229 | 87.2 | 59,537 | 22.1 | 78,517 | 17.8 |
| 2-Octenedioic Acid_OL2a_7.42_195.0631 m/z | 7730 | 17.3 | 5094 | 9.2 | 3140 | 38.0 | 7516 | 8.4 |
| Suberate_OL2a_7.47_197.0789 m/z | 129,165 | 4.3 | 118,707 | 4.1 | 117,587 | 2.1 | 137,784 | 4.8 |
| Suberate_OL2a_7.6_157.0862 m/z | 23,101 | 11.6 | 23,341 | 6.1 | 19,390 | 8.1 | 20,297 | 13.2 |
| Caprylate_OL2a_9.32_167.1047 m/z | 27,549 | 5.2 | 27,692 | 7.5 | 28,494 | 2.5 | 32,939 | 3.8 |
| Sebacate_OL2a_9.72_225.1102 m/z | 52,739 | 6.7 | 48,714 | 3.8 | 46,481 | 12.6 | 53,830 | 6.9 |
| 10-Hydroxy-2-Decenoic Acid_OL2a_9.84_209.1152 m/z | 117,259 | 4.7 | 116,924 | 2.7 | 115,816 | 4.8 | 129,228 | 0.7 |
| 3-Hydroxyadipic 3,6 Lactone_OL2b_0.69_144.0424 n | 34,905 | 7.9 | 31,933 | 9.1 | 56,260 | 19.5 | 64,756 | 13.0 |
| Acetoacetate_OL2b_0.71_102.0318 n | 39,375 | 8.5 | 36,703 | 2.3 | 37,028 | 3.1 | 40,002 | 8.9 |
| 3-Hydroxy-3-Methylglutaric Acid_OL2b_0.75_185.0424 m/z | 17,639 | 20.2 | 15,247 | 11.9 | 3647 | 10.1 | 3117 | 19.3 |
| Propionyl-L-Carnitine_OL2b_0.76_218.1391 m/z | 240,975 | 7.0 | 229,428 | 9.6 | 216,814 | 11.9 | 354,568 | 18.6 |
| Adipate_OL2b_0.8_111.0442 m/z | 34,128 | 1.6 | 34,202 | 5.8 | 33,653 | 4.9 | 35,715 | 0.7 |
| Pyridoxine_OL2b_0.8_169.0741 n | 286,515 | 17.4 | 256,692 | 9.7 | 15,455 | 13.7 | 14,008 | 71.9 |
| Pyroglutamic Acid_OL2b_0.82_259.0929 m/z | 11,248 | 38.6 | 10,178 | 24.9 | 0 | - | 0 | - |
| 2-Hydroxybutyrate_OL2b_0.82_87.0442 m/z | 8654 | 7.0 | 8841 | 5.6 | 10,005 | 4.0 | 10,868 | 0.3 |
| L-Cysteinylglycine_OL2b_1.29_179.0488 m/z | 157,188 | 14.9 | 137,522 | 22.2 | 194,013 | 8.6 | 266,356 | 10.1 |
| Glutarate_OL2b_1.67_115.0392 m/z | 29,496 | 2.4 | 30,845 | 5.5 | 26,960 | 9.6 | 26,663 | 9.5 |
| 3-Methyladenine_OL2b_1.87_150.0777 m/z | 768 | 22.7 | 429 | 136.3 | 2705 | 66.5 | 1279 | 11.0 |
| Benzoate_OL2b_10.34_105.0337 m/z | 1707 | 5.5 | 1842 | 17.8 | 1346 | 28.5 | 1501 | 48.1 |
| 2-Octenedioic Acid_OL2b_11.17_173.0811 m/z | 0 | - | 0 | - | 1342 | 99.6 | 0 | - |
| 10-Hydroxydecanoic Acid_OL2b_11.39_153.1277 m/z | 9020 | 1.7 | 8179 | 0.7 | 8623 | 8.7 | 8677 | 7.6 |
| 10-Hydroxydecanoic Acid_OL2b_11.42_171.1383 m/z | 11,427 | 0.8 | 10,545 | 5.9 | 10,166 | 7.9 | 10,899 | 8.0 |
| Sphinganine_OL2b_11.92_302.3058 m/z | 54,577 | 7.3 | 55,845 | 2.8 | 53,097 | 6.7 | 57,716 | 2.4 |
| Azelate_OL2b_12.05_153.0912 m/z | 6061 | 7.5 | 6831 | 2.1 | 6209 | 14.8 | 6855 | 5.6 |
| Heptanoic Acid_OL2b_12.45_283.1883 m/z | 48,315 | 4.2 | 46,278 | 5.3 | 45,251 | 2.9 | 52,254 | 8.8 |
| Sphinganine_OL2b_12.47_284.2952 m/z | 2750 | 47.7 | 2659 | 27.2 | 5898 | 38.0 | 7522 | 50.9 |
| 2-Hydroxytetradecanoic Acid_OL2b_12.73_267.1934 m/z | 43,587 | 4.9 | 42,755 | 9.2 | 44,157 | 2.7 | 48,037 | 6.1 |
| Sphinganine_OL2b_12.75_302.3058 m/z | 16,252 | 19.1 | 16,622 | 25.9 | 47,603 | 11.8 | 56,698 | 10.6 |
| Sphinganine_OL2b_12.82_284.2952 m/z | 3644 | 18.8 | 4261 | 20.3 | 13,496 | 17.6 | 13,425 | 15.9 |
| Hexadecanoylcarnitine_OL2b_13.1_400.3428 m/z | 16,550 | 7.3 | 15,958 | 4.4 | 19,620 | 11.5 | 25,724 | 12.2 |
| Benzoate_OL2b_13.15_105.0337 m/z | 1858 | 8.3 | 1680 | 1.0 | 1746 | 6.3 | 1752 | 10.5 |
| Linoleic Acid_OL2b_13.19_263.2374 m/z | 9159 | 13.6 | 8004 | 5.8 | 7610 | 11.6 | 8222 | 2.5 |
| Oleoylcarnitine_OL2b_13.27_426.3584 m/z | 20,182 | 12.4 | 18,244 | 24.1 | 17,383 | 14.8 | 24,494 | 10.1 |
| 12-Hydroxy-9-Cis-Octadecenoic Acid_OL2b_13.47_263.2373 m/z | 11,675 | 12.9 | 10,852 | 8.4 | 7759 | 5.0 | 8027 | 8.6 |
| Octadecanoylcarnitine_OL2b_13.67_428.3741 m/z | 22,954 | 10.3 | 22,440 | 12.7 | 26,152 | 20.7 | 34,914 | 22.5 |
| Linoleic Acid_OL2b_13.9_263.2373 m/z | 6141 | 25.8 | 5205 | 14.5 | 1131 | 9.4 | 1722 | 23.7 |
| 2-Hydroxytetradecanoic Acid_OL2b_13.92_267.1933 m/z | 27,633 | 1.3 | 26,690 | 1.8 | 25,513 | 7.7 | 26,874 | 3.6 |
| Palmitoleic Acid_OL2b_14.1_254.2249 n | 13,604 | 8.8 | 16,263 | 5.6 | 16,053 | 11.1 | 15,906 | 10.2 |
| 12-Hydroxy-9-Cis-Octadecenoic Acid_OL2b_14.28_321.2403 m/z | 494,789 | 4.8 | 560,842 | 2.0 | 561,252 | 4.2 | 532,630 | 6.3 |
| 2-Hydroxyglutarate_OL2b_14.35_297.0827 m/z | 4411 | 17.7 | 6365 | 28.2 | 6406 | 18.4 | 4074 | 8.4 |
| Palmitoleic Acid_OL2b_14.58_254.2248 n | 46,698 | 14.3 | 51,379 | 12.5 | 58,247 | 14.3 | 57,708 | 8.9 |
| Palmitoleic Acid_OL2b_14.79_254.2248 n | 40,233 | 8.1 | 51,315 | 12.9 | 60,231 | 9.3 | 47,499 | 11.6 |
| Eicosapentaenoate_OL2b_14.94_325.2140 m/z | 867 | 10.3 | 15,576 | 58.1 | 11,425 | 42.1 | 711 | 10.4 |
| Docosahexaenoate_OL2b_15.21_328.2403 n | 112,516 | 20.5 | 329,323 | 43.5 | 292,259 | 38.5 | 66,066 | 1.5 |
| 27-Hydroxycholesterol_OL2b_15.37_385.3468 m/z | 31,043 | 45.5 | 23,565 | 34.7 | 33,490 | 23.1 | 43,309 | 45.5 |
| 3-Hydroxy-3-Methylglutaric Acid_OL2b_3.21_145.0498 m/z | 14,199 | 10.1 | 15,513 | 19.1 | 9555 | 24.4 | 9991 | 9.0 |
| Β-Nicotinamide Mononucleotide_OL2b_3.28_335.0645 m/z | 976,592 | 7.2 | 928,731 | 15.9 | 776,931 | 8.7 | 1,065,967 | 12.3 |
| Leucine_OL2b_3.77_154.0842 m/z | 55,154 | 49.7 | 68,733 | 49.4 | 30,573 | 74.7 | 40,142 | 85.4 |
| N-Acetyl-D-Glucosamine_OL2b_3.8_204.0871 m/z | 10,823 | 23.1 | 10,618 | 25.7 | 7804 | 18.7 | 10,025 | 15.1 |
| 10-Hydroxydecanoic Acid_OL2b_3.82_153.1277 m/z | 5351 | 9.9 | 5687 | 21.9 | 6232 | 17.6 | 6492 | 9.0 |
| Glutarate_OL2b_3.89_155.0317 m/z | 5471 | 11.0 | 15,289 | 17.5 | 9519 | 18.6 | 2705 | 19.0 |
| N-Acetylserotonin_OL2b_5.93_219.1133 m/z | 8978 | 6.6 | 9545 | 10.2 | 8470 | 10.4 | 8677 | 18.3 |
| 2′,4′-Dihydroxyacetophenone_OL2b_6.18_153.0549 m/z | 15,564 | 4.1 | 15,019 | 7.5 | 14,038 | 2.1 | 16,217 | 4.9 |
| Sebacate_OL2b_6.57_167.1070 m/z | 9903 | 8.2 | 9679 | 16.8 | 8116 | 19.3 | 8824 | 10.8 |
| Sebacate_OL2b_6.81_167.1070 m/z | 3801 | 13.2 | 3013 | 15.0 | 2798 | 32.3 | 3462 | 11.0 |
| Pantothenate_OL2b_6.98_242.1004 m/z | 4065 | 21.2 | 3328 | 18.3 | 3597 | 9.3 | 3750 | 10.9 |
| Sebacate_OL2b_7.47_203.1282 m/z | 10,163 | 5.2 | 9709 | 4.2 | 9555 | 4.1 | 10,235 | 9.0 |
| Hexanoyl Glycine_OL2b_7.99_196.0948 m/z | 35 | 173.2 | 1665 | 108.1 | 4102 | 59.9 | 116 | 16.6 |
| Benzoate_OL2b_8.62_105.0337 m/z | 1728 | 11.9 | 1440 | 21.0 | 1131 | 34.3 | 1630 | 9.7 |
| Paraxanthine_OL2b_8.65_180.0641 n | 94,367 | 14.5 | 127,026 | 18.4 | 113,606 | 7.2 | 85,535 | 9.1 |
| 10-Hydroxydecanoic Acid_OL2b_9.97_153.1277m/z | 7148 | 2.5 | 7353 | 15.6 | 6869 | 1.4 | 7221 | 4.1 |
Publisher’s Note: MDPI stays neutral with regard to jurisdictional claims in published maps and institutional affiliations. |
© 2022 by the authors. Licensee MDPI, Basel, Switzerland. This article is an open access article distributed under the terms and conditions of the Creative Commons Attribution (CC BY) license (https://creativecommons.org/licenses/by/4.0/).
Share and Cite
Rushing, B.R.; Schroder, M.; Sumner, S.C.J. Comparison of Lysis and Detachment Sample Preparation Methods for Cultured Triple-Negative Breast Cancer Cells Using UHPLC–HRMS-Based Metabolomics. Metabolites 2022, 12, 168. https://doi.org/10.3390/metabo12020168
Rushing BR, Schroder M, Sumner SCJ. Comparison of Lysis and Detachment Sample Preparation Methods for Cultured Triple-Negative Breast Cancer Cells Using UHPLC–HRMS-Based Metabolomics. Metabolites. 2022; 12(2):168. https://doi.org/10.3390/metabo12020168
Chicago/Turabian StyleRushing, Blake R., Madison Schroder, and Susan C. J. Sumner. 2022. "Comparison of Lysis and Detachment Sample Preparation Methods for Cultured Triple-Negative Breast Cancer Cells Using UHPLC–HRMS-Based Metabolomics" Metabolites 12, no. 2: 168. https://doi.org/10.3390/metabo12020168