Article

FOXO3 Expression in Macrophages Is Lowered by a High-Fat Diet and Regulates Colonic Inflammation and Tumorigenesis

1
Department of Pathology and Laboratory Medicine, School of Medicine, Tulane University, New Orleans, LA 70012, USA
2
Division of Endocrine and Oncologic Surgery, Department of Surgery, Tulane University, New Orleans, LA 70012, USA
3
Department of Biochemistry and Molecular Biology, School of Medicine, Tulane University, New Orleans, LA 70012, USA
*
Author to whom correspondence should be addressed.
Metabolites 2022, 12(3), 250; https://doi.org/10.3390/metabo12030250
Submission received: 13 December 2021 / Revised: 23 February 2022 / Accepted: 24 February 2022 / Published: 16 March 2022

Abstract

:
Obesity, characterized by augmented inflammation and tumorigenesis, is linked to genetic predispositions, such as FOXO3 polymorphisms. As obesity is associated with aberrant macrophages infiltrating different tissues, including the colon, we aimed to identify FOXO3-dependent transcriptomic changes in macrophages that drive obesity-mediated colonic inflammation and tumorigenesis. We found that in mouse colon, high-fat-diet-(HFD)-related obesity led to diminished FOXO3 levels and increased macrophages. Transcriptomic analysis of mouse peritoneal FOXO3-deficient macrophages showed significant differentially expressed genes (DEGs; FDR < 0.05) similar to HFD obese colons. These DEG-related pathways, linked to mouse colonic inflammation and tumorigenesis, were similar to those in inflammatory bowel disease (IBD) and human colon cancer. Additionally, we identified a specific transcriptional signature for the macrophage-FOXO3 axis (MAC-FOXO382), which separated the transcriptome of affected tissue from control in both IBD (p = 5.2 × 10⁸ and colon cancer (p = 1.9 × 10¹¹), revealing its significance in human colonic pathobiologies. Further, we identified (heatmap) and validated (qPCR) DEGs specific to FOXO3-deficient macrophages with established roles both in IBD and colon cancer (IL-1B, CXCR2, S100A8, S100A9, and TREM1) and those with unexamined roles in these colonic pathobiologies (STRA6, SERPINH1, LAMB1, NFE2L3, OLR1, DNAJC28 and VSIG10). These findings establish an important understanding of how HFD obesity and related metabolites promote colonic pathobiologies.

Graphical Abstract

1. Introduction

Obesity is characterized by a systemic inflammatory state and augmented tumorigenesis in various tissues, including the colon [1,2,3]. In the human population, obesity is accompanied by genetic predispositions such as polymorphisms of the FOXO3 gene that lead to its lowered levels [4]. FOXO3, a transcription factor, plays a central role in diverse cellular functions in colonic and immune cells, including macrophages [5,6]. Therefore, elucidating how obesity, through loss of FOXO3 in macrophages, promotes colonic inflammation and tumorigenesis will provide conceptual advances in understanding this worldwide epidemic and the mechanisms driving these human pathobiologies.
Macrophages are critical for tissue homeostasis and repair [7,8]. Their aberrant function promotes inflammation and tumorigenesis [9,10]. Depending on the stimuli, macrophages polarize towards different subpopulations with distinct characteristics and functions [11,12]. Further, tissue microenvironments, such as those found in the adipose tissue of obese individuals and in colon tissue affected by infection, inflammation, and tumorigenesis, contribute to the polarization of macrophages [13,14]. Additionally, macrophages release cytokines which result in tissue damage that exacerbates chronic inflammation [15]. In inflammatory bowel disease (IBD), aberrant macrophages (enriched for CD68+ and CD14hiCD16+ phenotypes) in the inflamed intestine promote cytokine production and delayed bacterial clearance, thereby promoting tissue injury and worsening disease outcome [7,16,17]. Moreover, macrophages promote tumor progression through angiogenesis, intravasation and metastasis [18,19]. Breast and pancreatic tumor expansion and metastasis are facilitated by extracellular matrix remodeling, mediated by macrophages [20,21]. In colonic tumors, increased macrophage infiltration with M1/NOS2+ or M2/CD163+ phenotypes is associated with cancer aggressiveness, growth, and poor survival rates [22,23]. Therefore, it is plausible that with obesity mediators and metabolites, aberrant peritoneal macrophages are a critical player in promoting colonic inflammation and tumorigenesis.
Forkhead Box O3 (FOXO3) transcription factor has diverse cellular functions, including growth, immune response, and metabolic homeostasis [24,25,26]. In humans, obesity is associated with polymorphisms in the FOXO3 gene [4]. Further, a high-fat diet (HFD) shortens the lifespan of mice by diminishing FOXO3 levels in the central nervous system [27]. Obesity mediators and metabolites cause a loss of FOXO3 in colonic cells [28,29], revealing an important role of FOXO3 in obesity-mediated changes in the colon. Additionally, in colonic cells, bacterial products and inflammatory mediators abrogate FOXO3 function to further promote inflammation [30,31]. Genome-wide association studies (GWAS) identified a polymorphism in FOXO3 that is associated with IBD severity [32]. FOXO3 also plays a critical role in immune cells, and its deficiency promotes the activation of T cells and macrophages [33,34]. Moreover, FOXO3 acts as a tumor suppressor, and its loss of activity has been shown to be closely associated with cancer initiation and progression [35]. In human colon cancer, markedly reduced FOXO3 levels correlate to advanced tumors [36]. We have previously shown in mice that FOXO3 deficiency promotes the development and progression of inflammatory colon cancer [28,30,31,37,38]. Additionally, the colons of FOXO3-deficient mice have an enrichment in macrophages and elevated levels of intracellular lipid droplets [29,38]. Therefore, it is plausible that the loss of FOXO3 in both colonic cells and macrophages may be critical in driving obesity-mediated colonic inflammation and tumorigenesis.
Here, we established the significance of the loss of FOXO3-dependent functions of macrophages in intestinal inflammation and tumorigenesis. These findings will provide conceptual advances in understanding how obesity (mediators and metabolites) promotes these colonic pathobiologies.

2. Results

2.1. HFD Obesity in Mice Mediates Increased Presence of Macrophages and Loss of FOXO3 in Colon

Obesity is associated with aberrant macrophages present in different tissues, which may drive colonic pathobiologies [39,40]. In human populations, obesity is associated with polymorphisms in the FOXO3 gene [4]. Additionally, obesity mediators and metabolites cause a loss of FOXO3 in colonic cells [28,29]. Therefore, we hypothesized that the loss of FOXO3 via obesity contributes to the development of pathobiologies in various tissues, especially the colon. First, we utilized transcriptomic data obtained from the colon of both HFD obese mice and mice fed with regular diet (RD) (SRP093363). As we described before [41], consistent with an obese phenotype, mice on a HFD gained, on average, 54 ± 2 * g, while mice on a RD gained 33 ± 3 g during a period of 20 weeks (* p < 0.05). From these mice, we utilized transcriptomes obtained from their colon [41] to assess macrophage levels with CIBERSORT [42]. This is a platform that employs the transcriptional signatures of specific immune cells to determine their levels in the tissue. There was an abundance of macrophages in the colon of HFD obese mice relative to control (RD) (Figure 1A). Moreover, we assessed scraped mucosa from the colon of HFD obese and RD control mice for FOXO3 status. We found increased phosphorylated (inactive) FOXO3 levels in HFD obese mice colonic mucosa relative to control (Figure 1B). Therefore, as HFD obesity causes increased macrophages as well as loss of FOXO3 in mouse colon, we determined that the loss of FOXO3 in macrophages contributes to obesity-mediated colonic pathobiology. We obtained intraperitoneal macrophages [43,44] from FOXO3 knockout (KO) and wildtype (WT) mice in order to determine systemic transcriptional changes (RNA-seq). The population of these induced peritoneal macrophages included a slight number of other immune cells [43,45] which, after further sequencing and bioinformatic analysis, proved to be insignificant. Transcriptional assessment showed a significant number of differentially expressed genes (DEGs) in macrophages obtained from FOXO3-deficient mice relative to control (WT). Among these DEGs, 501 were increased, and 380 were decreased (Figure 1C) (>|1.5|-fold change, FDR < 0.05). The diseases and functions associated with these DEGs include cancer, gastrointestinal diseases, inflammatory response, and lipid metabolism (Figure 1D). Further, pathways associated with these DEGs were compared to transcriptomes obtained from the colon of HFD obese mice. We found similarities in pathways and upstream regulators of FOXO3-deficient macrophages with HFD obese mice colon associated with inflammation (IL-1A, IL-1B, IL-6, IL-8 signaling), growth (ILK signaling, CDK5 signaling, VEGF signaling) and cancer (cAMP-mediated signaling) (Figure 1E,F). Together, these data revealed that systemic transcriptional changes, mediated by the loss of FOXO3 in macrophages, are similar to those seen in the colon of HFD obese mice, which suggests a critical role of the macrophage-FOXO3 axis in driving obesity-mediated colonic changes.

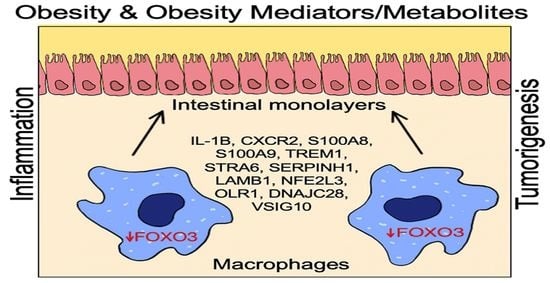
2.2. FOXO3 Deficiency in Macrophages Is Associated with Colonic Inflammation and Cancer

To determine whether FOXO3 deficiency in macrophages contributes to colonic inflammatory and tumorigenic processes, we assessed publicly available transcriptomes obtained from mouse colon with inflammation and dysplasia. Pathways and upstream regulators representing transcriptomes of FOXO3-deficient macrophages showed strong similarity to those related to inflammation and tumorigenesis in mouse colon (GSE31106) (Figure 2A–D). Next, we assessed publicly available transcriptomes from IBD and colon cancer patient cohorts to determine the significance of FOXO3-deficient macrophages in human colonic inflammation and tumorigenesis. We found that transcriptomes of FOXO3-deficient macrophages represented similar alterations in pathways and upstream regulators as those seen in IBD (GSE4183) and colon cancer (GSE4183, GSE141174). Specifically, these shared pathways with IBD were linked to inflammation (TNF, IL-1A, IL-1B, NFkB, IL-6) and growth (TREM1, TGFB1) (Figure 3A,B), while other pathways shared with colon cancer were associated with colorectal metastatic signaling, growth (TREM1, NFkB and HMGB1) and inflammation (IL-8, IL-6) (Figure 3C,D). These data demonstrated that FOXO3 deficiency in macrophages is associated with colonic inflammatory and tumorigenic pathobiologies.

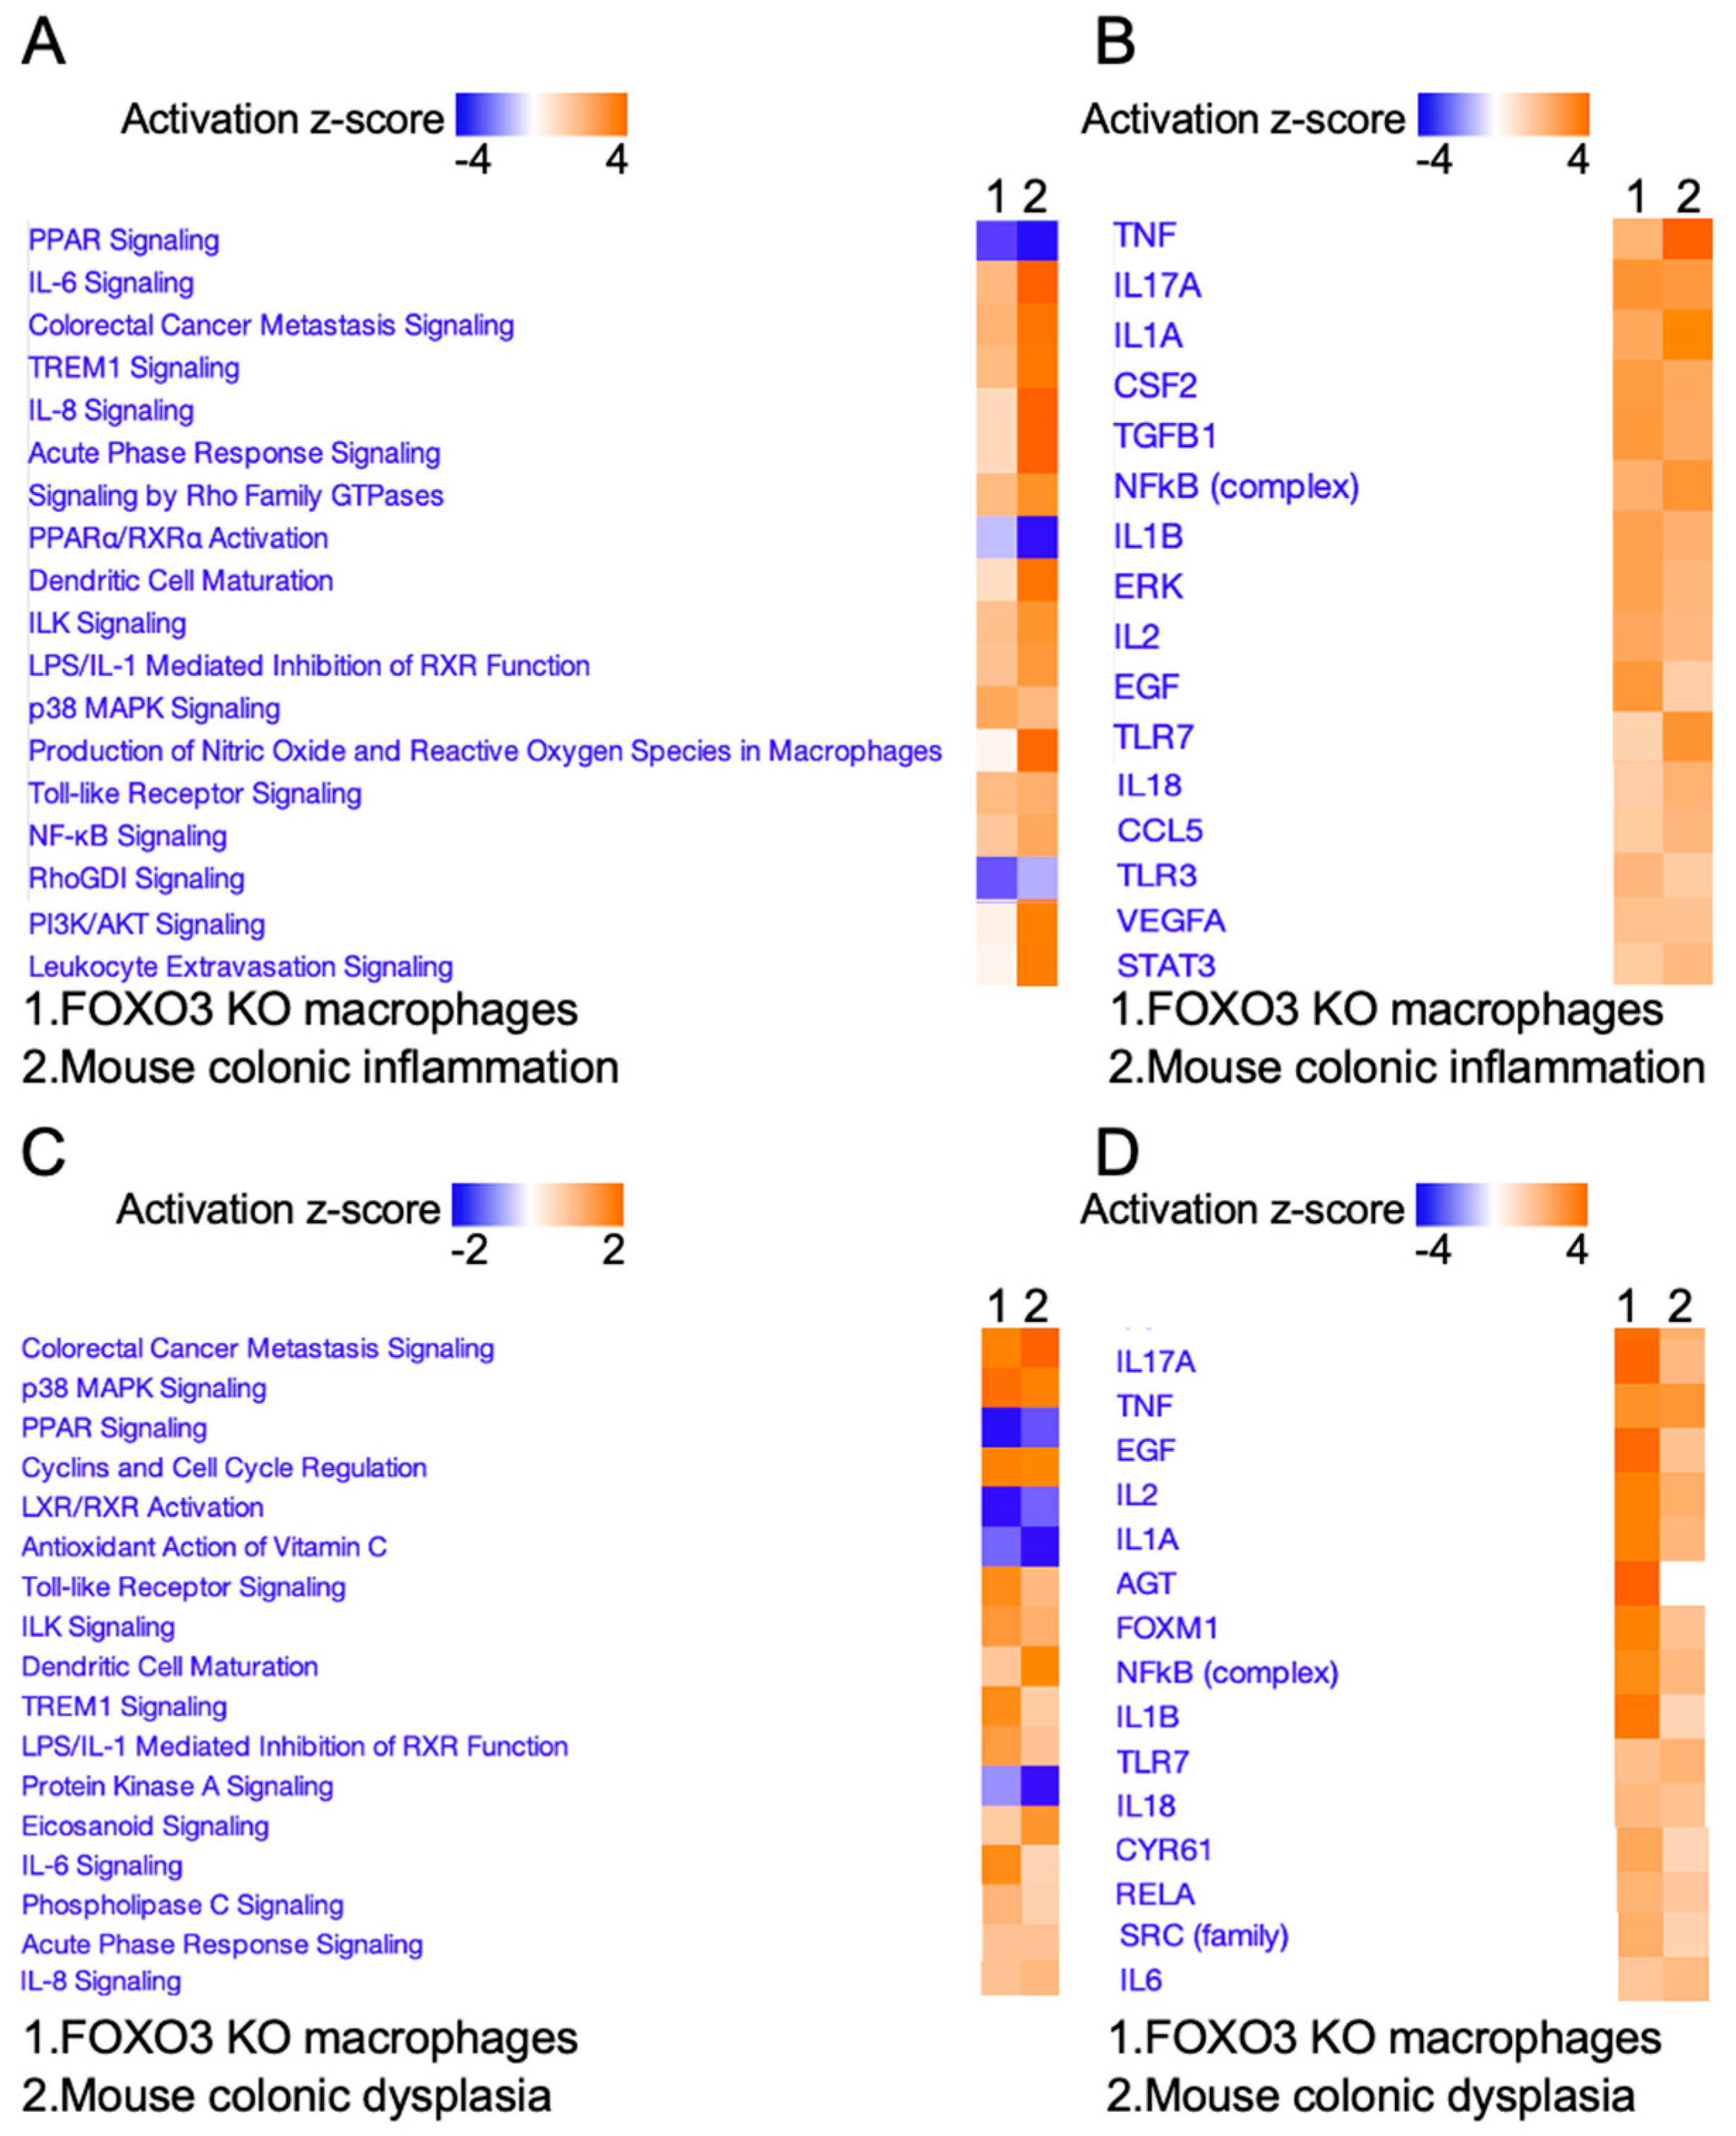
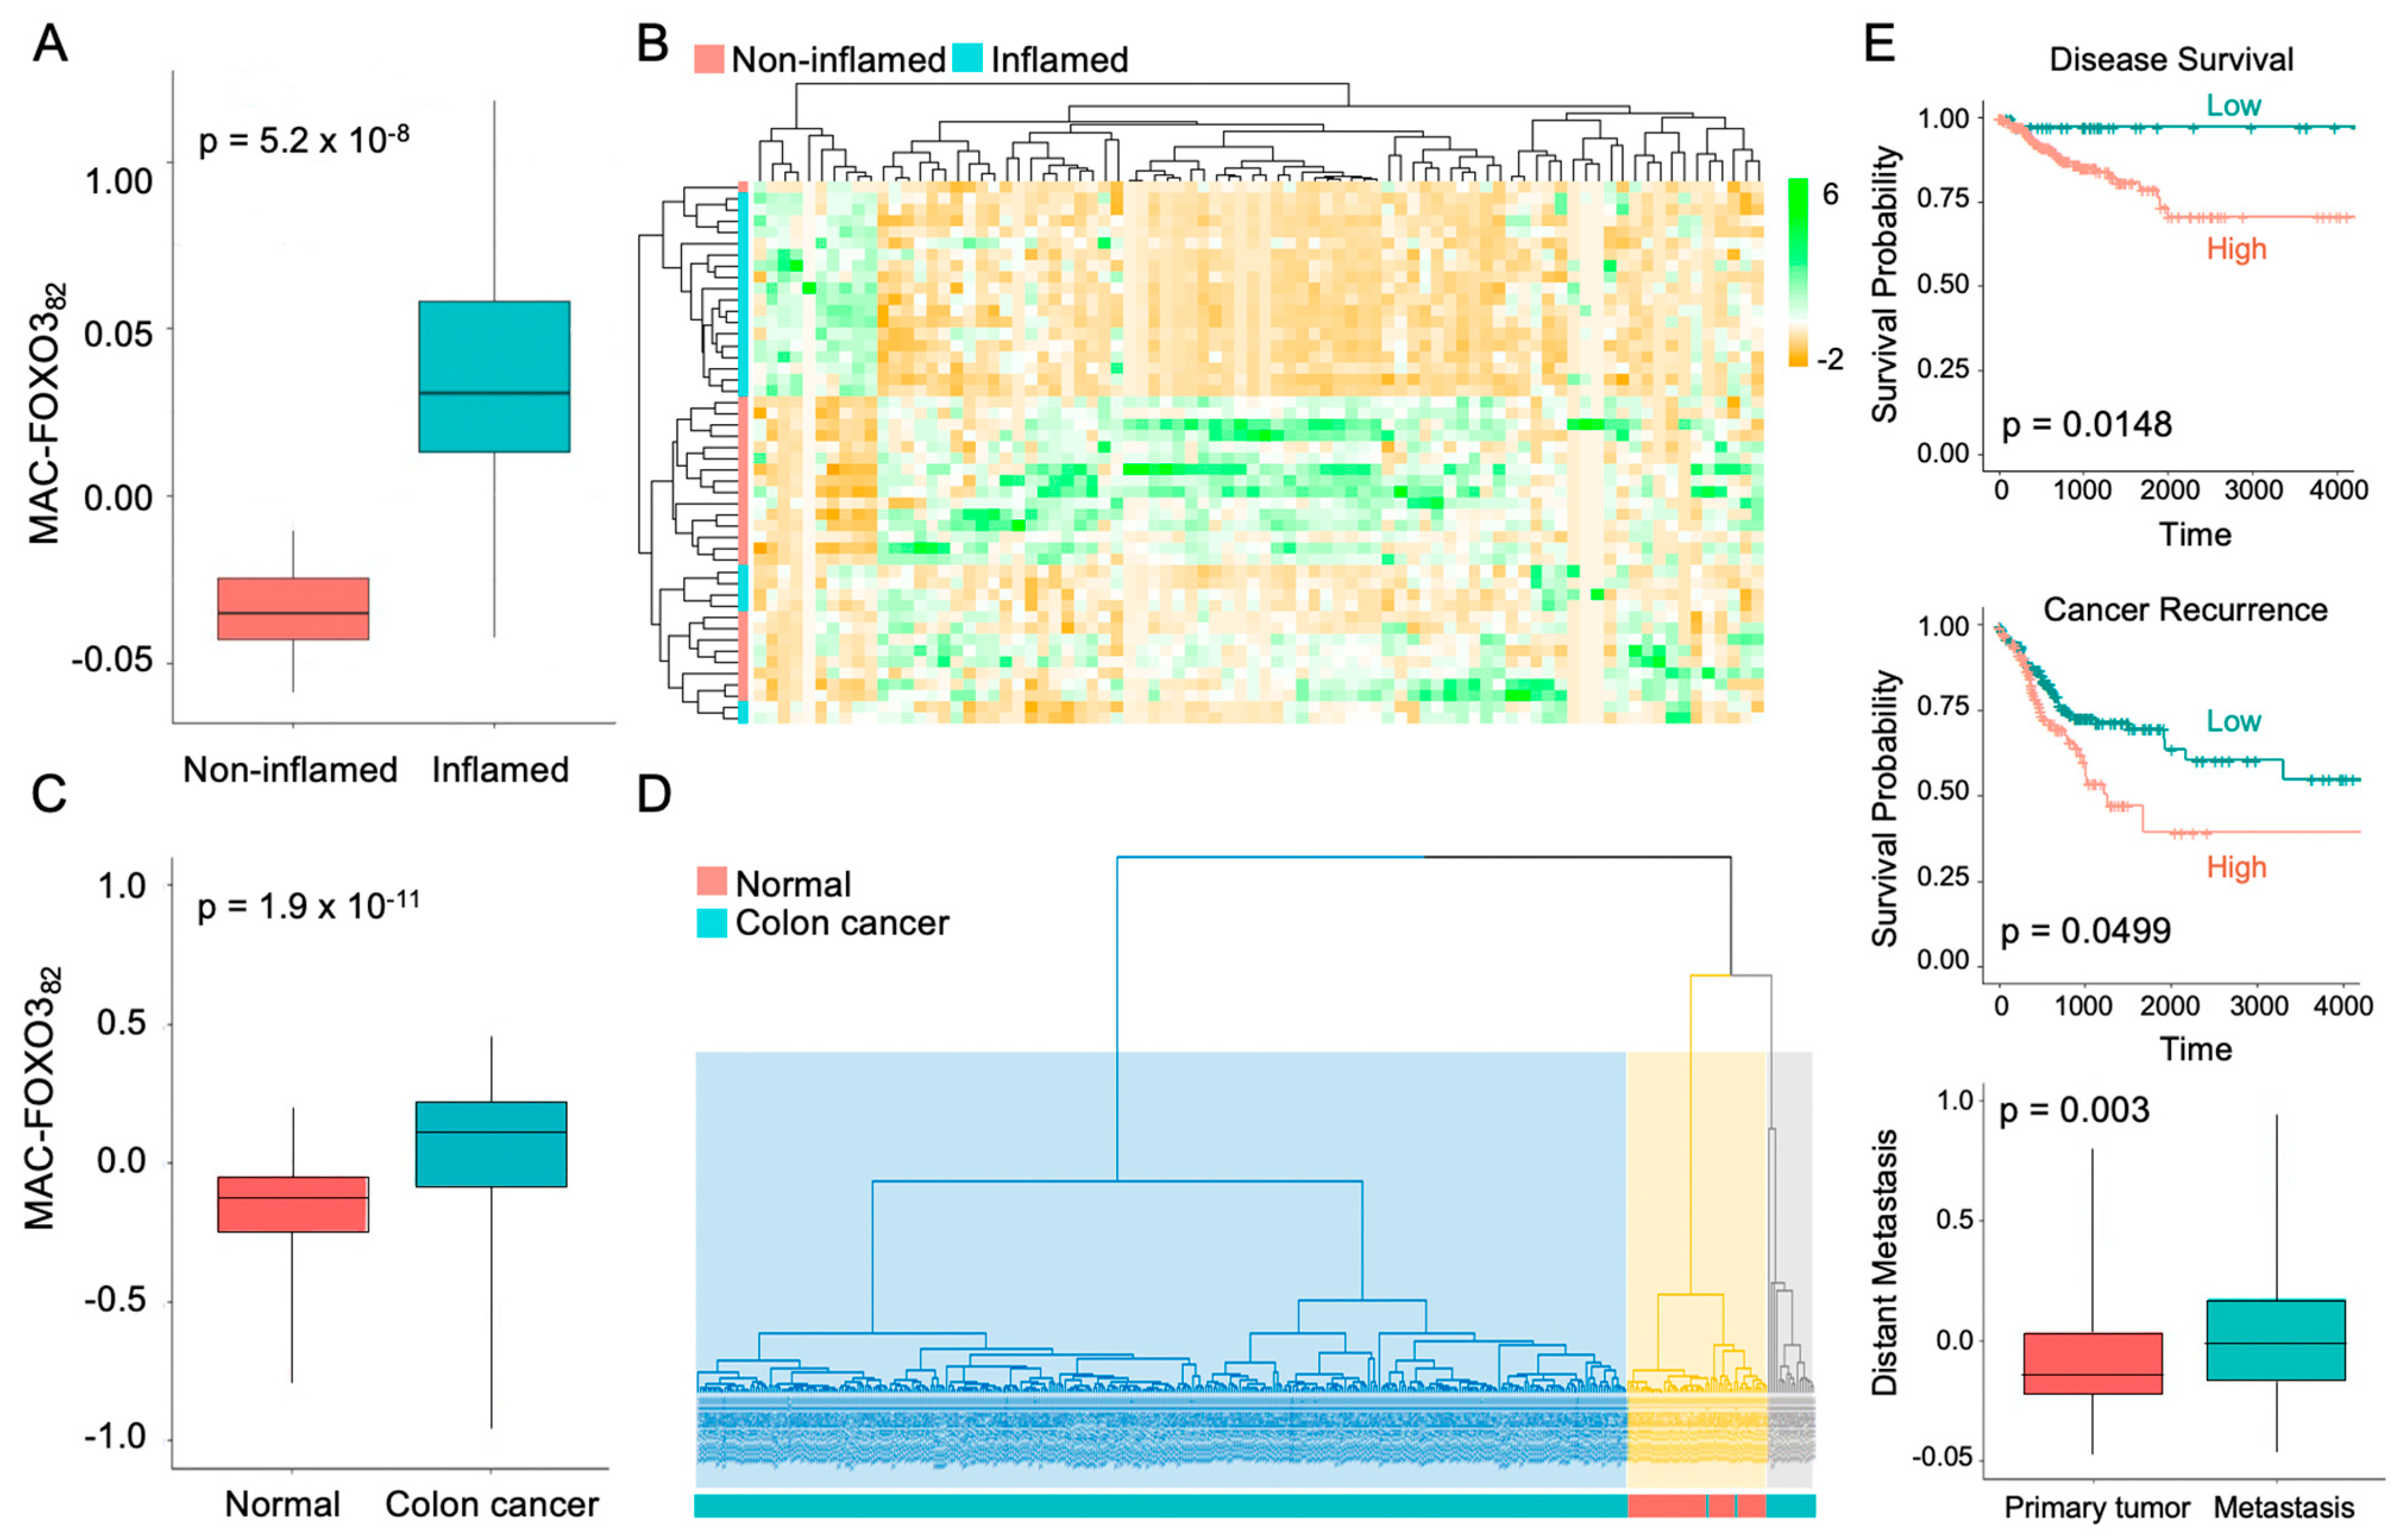
2.3. FOXO3-Deficient Macrophage Signature Is Prevalent in Human Colonic Inflammation and Cancer

Next, to determine the significance of the macrophage-FOXO3 axis in colonic pathobiologies, we established a transcriptional signature for FOXO3-deficient peritoneal macrophages. A transcriptional panel of DEGs from FOXO3-deficient macrophages relative to control (WT) was generated by calculating fold change between the 2 groups, meeting stringent differential expression and statistical thresholds of log2 fold-change > |1.5| and an adjusted p-value < 0.001. The panel was comprised of 82 DEGs (MAC-FOXO382), among which 65 were upregulated and 17 were downregulated in FOXO3-deficient macrophages relative to control (Table 1). Principal component analysis (PCA) showed that MAC-FOXO382 separated the transcriptomes from IBD samples according to their inflamed and control (non-inflamed) states with high significance (p = 5.2 × 10⁻⁸) (GSE4183, Figure 4A). Further, unsupervised hierarchal clustering of MAC-FOXO382 separated transcriptomes from IBD samples into inflamed and non-inflamed groups (Figure 4B). Additionally, MAC-FOXO382 separated cancer samples from normal with a high significance, as shown by PCA (p = 1.9 × 10⁻¹¹) and unsupervised hierarchal clustering (TCGA, Figure 4C,D). In colon cancer patients, Kaplan–Meier estimates showed that increased MAC-FOXO382 presence is associated with poor survival rates, increased risk of cancer recurrence, and distant metastasis (TCGA, Figure 4E). Together, these data demonstrated that the macrophage-FOXO3 axis is associated with both human IBD and colon cancer.

2.4. Expression of Select FOXO3-Dependent Genes in Peritoneal Macrophages

Next, we identified the top DEGs specific to FOXO3-deficient peritoneal macrophages relative to control shown in a heatmap, Figure 5A, many of which are also represented in MAC-FOXO382. These DEGs were validated in FOXO3-deficient macrophages (vs WT) by qPCR, and their status was determined in publicly available transcriptomes of IBD and human colon cancer cohorts. It is important to consider that these DEGs may vary in expression in different subtypes of macrophages or in other cell types. We found these DEGs with established roles in human colonic inflammation and tumorigenesis such as Interleukin 1 Beta (IL-1B), C-X-C Motif Chemokine Receptor 2 (CXCR2), S100 Calcium-binding Protein A8 (S100A8), S100 Calcium-binding Protein A9 (S100A9), and Triggering Receptor Expressed On Myeloid Cells 1 (TREM1) to be significantly increased in FOXO3-deficient macrophages (Figure 5B). Similar alterations in these DEGs were also seen in publicly available transcriptomes from human IBD and colon cancer (Figure 5C,D). These findings reveal that FOXO3 deficiency in macrophages significantly contributes to systemic transcriptional alteration found in IBD and colon cancer.
Furthermore, we validated DEGs in FOXO3-deficient macrophages, whose role in IBD and colon cancer is not yet well understood, including Stimulated By Retinoic Acid Gene 6 Protein Homolog (STRA6), Serpin Family H Member 1 (SERPINH1), Laminin Subunit Beta 1 (LAMB1), Oxidized Low-Density Lipoprotein Receptor 1 (OLR1), Nuclear Factor, Erythroid 2-like 3 (NFE2L3), DnaJ Heat Shock Protein Family (Hsp40) Member C28 (DNAJC28) and V-Set And Immunoglobulin Domain-containing 10 (VSIG10) (Figure 6A). These novel DEGs showed similar alterations in transcriptomes of human IBD and colon cancer, suggesting that they may play a role in these human pathobiologies (Figure 6B,C). These data establish loss of FOXO3-dependent novel genes in macrophages that may regulate these human pathobiologies.

3. Discussion

Obesity is a chronic inflammatory state associated with increased risk and progression of colon cancer [1,2,3]. Here, we demonstrated that the loss of FOXO3 in macrophages plays a critical role in obesity-mediated inflammation and tumorigenesis in the colon. We identified that the transcriptome of FOXO3-deficient peritoneal macrophages, similar to the transcriptome from mouse HFD obese colon, shared pathways with colonic inflammation and tumorigenesis. Furthermore, we showed the significance of a MAC-FOXO382 transcriptional signature in human colonic inflammation (seen in IBD) and tumorigenesis (in colon cancer). Ultimately, we identified differentially expressed genes from FOXO3-deficient macrophages with established roles in both IBD and colon cancer, as well as novel genes whose roles in these colonic pathobiologies are not well understood. Together, these findings establish the significance of the loss of FOXO3 in macrophages in colonic pathobiologies and provide conceptual advances in our understanding of how obesity, via both its mediators and metabolites, promotes these disease processes.
We identified, in macrophages, alterations in gene expression dependent on the loss of FOXO3 that are associated with colonic inflammation and tumorigenesis. Macrophages play a central role in tissue homeostasis, including the colon [8,46]. Their polarization is accompanied by metabolic reprogramming, such as the pro-inflammatory subtype mainly shifting to glycolysis, whereas the anti-inflammatory subtype shifts to mitochondrial oxidative phosphorylation [47]. Furthermore, altered lipid metabolism in macrophages is associated with their inflammatory response [47], supporting their direct contribution to the immune-metabolic axis within tissues. Indirectly, these macrophages, by releasing cytokines and metabolites, can further facilitate colonic cells’ inflammatory and tumorigenic responses [8,46,48]. Increased malate, fumarate, citrate and glutamate metabolites in macrophages [47] can augment the immuno-metabolic axis in tissue. Moreover, as FOXO3 emerges as an important regulator of macrophage function [6,49] and controls metabolism in various cells [25,26], it is plausible that FOXO3 plays a central role in metabolic reprograming in macrophages. This critical immuno-metabolic function of FOXO3 is also seen in colonic cells [30,31]. Further, altered macrophages can impair barrier function, as seen in IBD, in addition to promoting the tumor microenvironment [16,50]. Our study showed that obesity mediators and metabolites lead to diminished levels of FOXO3 and increased macrophages in the colon, suggesting a central role of FOXO3 in metabolic reprogramming of both macrophages and intestinal epithelial cells. Consequently, macrophage metabolism is often abnormal in disease states, and their loss of FOXO3-mediated metabolic reprogramming presents a potential therapeutic target for colonic inflammation and tumorigenesis facilitated by obesity.
We validated select differentially expressed genes of FOXO3-deficient macrophages with established roles both in IBD and colon cancer. Increased IL-1B, a potent inflammatory mediator, is associated with promoting colonic inflammation and tumorigenesis [51,52]. In human cartilage, IL-1B causes a loss of FOXO3 [53], which suggests feedback between IL-1B and FOXO3. Further, CXCR2, essential for the maintenance, survival, and self-renewal of hematopoietic cells [54], is elevated with FOXO3 deficiency in macrophages. CXCR2 contributes to inflammation and tumorigenesis in several tissues, including the colon [55,56]. Additionally, S100A8/A9 plays a significant role in colonic inflammatory response and tumorigenesis [57,58]. Their high levels in inflamed tissue position them as a potential biomarker for IBD [59]. Further, TREM1, a membrane receptor in macrophages, drives the innate immune response against bacterial products, thus worsening the course of IBD [60]. In lung and colon cancer, increased TREM1 promotes tumorigenesis [61,62]. These findings establish a critical role of FOXO3 in macrophages, driving colonic inflammation and cancer.
We also identified several differentially expressed genes in FOXO3-deficient macrophages with unexamined roles in colonic inflammation and tumorigenesis. STRA6 regulates the homeostasis and uptake of retinol [63]. HFD-induced STRA6 expression in adipose tissue increases the secretion of inflammatory mediators [64]. As retinoic acid is important for immune cells associated with IBD [65], STRA6 is a novel regulator in these inflammatory processes. Further, polymorphisms in the STRA6 gene are associated with increased incidences and aggressive courses of non-small cell lung cancer [66]. One study shows that in mouse colon, HFD-mediated increased STRA6 may promote tumorigenesis via cancer stem cell populations [67]. Moreover, SERPINH1 is important in the regulation of the extracellular matrix [68]. Recent studies showed that in mouse models of colonic inflammation, SERPINH1 is expressed in infiltrating immune cells and plays a role in extracellular matrix remodeling that promotes colon cancer progression [69]. Additionally, LAMB1 is a member of laminins important for the integrity of the epithelial-stromal network. A genome-wide study (GWAS) identified LAMB1 as a possible driver in IBD pathogenesis through impaired barrier function [70,71,72]. One study showed increased blood levels of LAMB1 in colon cancer patients relative to controls, highlighting its potential biomarker properties [73]. Another FOXO3-dependent gene in macrophages, the transcription factor NFE2L3 [74], is implicated in colonic inflammation and tumorigenesis. Increased expression of NFE2L3 is seen in ulcerative colitis and colon cancer [75,76,77]. Furthermore, OLR1, a low-density lipoprotein receptor with immune response function, is found to be expressed in human intestinal epithelial cells and is involved in the regulation of barrier function [78,79]. Increased expression of OLR1 in pancreatic and colon cancer has been associated with metastasis and poor prognosis [80,81,82]. Furthermore, the roles of VSIG10 and DNAJC28, which may be involved in stem cell function [83,84], in IBD and colon cancer, remain unknown. These novel FOXO3-dependent genes in macrophages provide a basis for conceptual advances in diagnostic medicine and targeted therapy in human pathobiologies.
Obesity, associated with systemic inflammation and increased risk and progression of colon cancer, is increasingly prevalent both in the industrialized and developing world [1,2,3]. Obesity mediators and metabolites affect immune cell populations such as macrophages, thereby promoting inflammation and providing a niche for tumor progression [18,19,39,85]. Additionally, obesity has a wider implication in metabolic disorders such as type II diabetes, hypertension and coronary artery diseases in which macrophages play a significant role in the development of inflammatory response and insulin resistance [39,40,86]. Here we showed that obesity, whether directly or indirectly, drives colonic inflammation and tumorigenesis through the inactivation of FOXO3 in macrophages. Additionally, we established the significance of the macrophage-FOXO3 axis in both IBD and colon cancer. In future studies, the novel differentially expressed genes that we have identified, which are FOXO3-dependent in macrophages, will be examined for their roles in these colonic pathobiologies. Moreover, as macrophage subpopulations vary in different tissue, it is important to note that this macrophage-FOXO3 axis can be extrapolated to other macrophage subtypes in obesity-related disorders. Further findings would expand our understanding of mechanisms involved in obesity-related disorders mediated by the macrophage-FOXO3 axis, help us identify key regulators of other metabolic disorders and develop individualized treatment options.

4. Materials and Methods

4.1. Human IBD and Colon Cancer Samples

Publicly available transcriptomes obtained from inflammatory bowel disease included control and inflamed colon samples (n = 23; GSE4183). Additionally, publicly available transcriptomic data was obtained from colon cancer patients from two cohorts, including normal colon and tumors (n = 29, GSE4183, GSE141174). Moreover, publicly available transcriptomic data of colon cancer patients, including normal controls, were utilized (n = 498, TCGA). These data are acquired using NCBI’s GEO2R.

4.2. Mice

Mice, strain C57BL/6, male and female, were housed in microisolator cages under pathogen-free conditions at Tulane University School of Medicine. Both wildtype (WT) and FOXO3 knockout (FOXO3 KO) [87] mice had free access to standard chow diet and water. All littermates were genotyped to identify homozygous WT and FOXO3 KO [87], according to the guidelines of Tulane Institutional Animal Care and Use Committee.
Additionally, mice (57BL/6 strain) obtained from Jackson laboratory (6 weeks old) were housed at Tulane University School of Medicine. One group of mice were maintained on a standard chow diet and the other on a high-fat chow diet, 60% kcal/fat (D12492). For a period of 20 weeks, mice from both diet groups consistently gained weight; however, the weight of mice on a high-fat diet was more than 50% higher than mice on a regular diet [41]. Colons from these mice were utilized for protein extraction and transcriptomic analysis. Transcriptomes, previously acquired [41], from colons of high-fat-diet obese mice compared to regular diet (n = 3 for each group) are available through NCBI’s Sequence Read Archive (SRP093363).
Moreover, publicly available transcriptomes obtained from mice with colonic inflammation (n = 3) and dysplasia (n = 3) were utilized (GSE31106).

4.3. Mouse Peritoneal Macrophage

Experimental mice (six- to eight-weeks old) were injected intraperitoneally with 3% thioglycollate solution (Thermofisher, Waltham, MA, USA), which causes a peritoneal inflammatory response that allows for macrophage maturation [43,44]. After four days, mouse peritoneal cells, predominantly macrophages [43,88], were harvested from the abdominal cavity and pelleted (4 °C for 10 min).

4.4. RNA Isolation and cDNA Synthesis

Total RNA from harvested macrophages was isolated using the miRNeasy kit (Zymo Research, Irvibe, CA, USA), following the manufacturer’s instructions. RNA was assessed for quality by Agilent Bioanalyzer (Agilent Technologies, Santa Clara, CA, USA). Samples having RNA integrity numbers (RIN) more than 7 were utilized. RNA was then reverse transcribed to cDNA with qScipt cDNA SuperMix (Quantabio, Bevely, MA, USA).

4.5. qPCR

cDNA was generated from macrophages and used for qPCR as described previously [41]. The primers used for amplification of mouse cDNA are as follows: (mIL-1B-FOR 5′-TGCCACCTTTTGACAGTGATG-3′, mIL-1B-REV 5′-TTCTTGTGACCCTGAGCGAC-3′, mCXCR2-FOR 5′-GCTCACAAACAGCGTCGTAG-3′, mCXCR2-REV 5′-ATGGGCAGGGCCAGAATTAC-3′, mS100A8-FOR 5′-ATCCTTTGTCAGCTCCGTCTTC-3′, mS100A8-REV 5′-CTTCTCCAGTTCAGACGGCA-3′, mS100A9-FOR 5′-CTGCATGAGAACAACCCACG-3′, mS100A9-REV 5′-TCCCTTTAGACTTGGTTGGGC-3′, mTREM1-FOR 5′- ACAGAGGCAGTCGTTGGAG-3′, mTREM1-REV 5′-AGTGAACACATCTGAAGAACCTGAG-3′, mSTRA6-FOR 5′-GGTTCTTAAAGCAGGTGTGGG-3′, mSTRA6-REV 5′-ATGCTCCAGCTCTTCTTCCTAAC-3′, mVSIG10-FOR 5′-GGTTGAGTGTGAAAGAACCGC-3′, mVSIG10-REV 5′-GCGGTCTAAGTTCCCGTTGA-3′, mSERPINH1-FOR 5′-CCCGGCCCAGAATGAAAAAG-3′, mSERPINH1-REV 5′-TGGCTTTACCACCCAGTGAC-3′, mLAMB1-FOR 5′-GTGAGGAGAACAAAGTAGTTAAGCG-3′, mLAMB1-REV 5′-TGCCTGTCTTTTCTTCGGGT-3′, mNFE2L3-FOR 5′-TCTGTTGAGCTTGGTAGGGC-3′, mNFE2L3-REV 5′-CGAAGCCGAGAAGGGGTTAG-3′, mOLR1-FOR 5′-TGAAGCCTGCGAATGACGAG-3′, mOLR1-REV 5′-GGTTGGGAGACTTTGGAGGG-3′,mDNAJC28-FOR 5′-CCCATCACGTCTGTGAAGATCA-3′, mDNAJC28-REV 5′-GTTGGCGAAGAACTCCCTC-3′. The comparative Ct method was used to determine mRNA levels with GAPDH as a housekeeping control. cDNA was quantified using the C1000 Thermal Cycler system (Bio-Rad, Hercules, CA, USA) and PerfeCTa SYBR Green FastMix (Quantabio, USA).

4.6. Protein Extraction and Immunoblot

Protein extraction and immunoblots were performed as described previously [30,31,41]. The following specific antibodies against proteins were used: phosphorylated FOXO3 (Ser253) (Cell Signaling, Danvers, MA, USA) and β-actin (Cell Signaling). IRDye conjugated secondary antibodies (LI-COR, Lincoln, NE, USA) were used for protein visualization through the ChemiDoc MP imaging system (Bio-rad).

4.7. RNA Sequencing and Differential Expression Testing

RNA sequencing (RNA-seq) was performed as described before [38,41]. The sequencing data and the experiment design have been submitted to NCBI’s Sequence Read Archive, which are publicly available under study accession number GSE198058.

4.8. Transcriptome and Pathway Analysis

Data analysis for RNA-seq was performed using Ingenuity Pathway Analysis (IPA) (Qiagen, Germantown, MD). Differentially expressed genes (DEGs) meeting an expression threshold of >|1.5|-fold change relative to control and a false discovery rate (FDR) of less than 0.05 were entered into IPA. Clustered heatmaps of z-scaled transcripts per million (TPM) values for the top genes across all samples were generated using a Python data visualization package (Seaborn). TCGA network data was utilized for the expression of select transcripts (https://cistrome.shinyapps.io/timer, accessed on 10 October 2021) [89].

4.9. Hierarchical Clustering

Hierarchical clustering of transcriptomes from FOXO3-deficient macrophages relative to other experimental groups was performed using an uncentered correlation as a symmetric matrix, Pearson correlation for the similarity measure and complete linkage using Cluster3 software 38. The heatmaps were visualized with JavaTree software 39 (1.2.0 version, https://sourceforge.net/projects/jtreeview/files/jtreeview/1.2.0/ accessed on 10 October 2021)

4.10. Principal Component Analysis and Transcriptional Signature score

Principal component analysis (PCA) of FOXO3-deficient macrophage signatures with IBD (GSE4183) and human colon cancer (TCGA) transcriptomes was performed by FactoMineR R package with the PCA function. Percentage of variation and the first two coordinates of the above-mentioned samples were plotted. The following formula was utilized for the summary of multicohort signature in a single value:
Score = mean[log2(x + 1 m)]
where ‘x’ represents the expression of transcript, and ‘m’ represents the median of transcripts [90].

4.11. CIBERSORT

For quantification of macrophages in mouse colonic tissue, a computational method (CIBERSORT) was utilized for the assessment of RNA-seq [42]. For this purpose, mixture files of transcript per million from RNA-seq data were created, followed by generation of a specific murine immune cell and colonic cell signature along with phenotype files and reference in accordance to CIBERSORT specification (http://cibersort.stanford.edu, accessed on 10 May 2021) by employing the RNA-seq run accession numbers as previously described [38]. Values with a significance threshold (p < 0.05) were included in the analysis.

4.12. Statistical Analysis

All results are represented as means ± S.E. The statistical analysis of experiments was carried out by Student’s unpaired t-test or through ANOVA for one-war analysis of variance as well as Student–Newman–Keuls post-test in Graph Pad Software. A p-value of <0.05 was considered significant.

Author Contributions

Conceptualization, R.I., H.M.P. and S.D.S.; methodology R.I., H.M.P.; validation, A.N.K., Y.K.; formal analysis, R.I., H.M.P.; investigation, R.I., H.M.P., A.N.K.; data curation, R.I., H.M.P.; writing—original draft preparation, R.I., S.D.S.; writing—review and editing, R.I., H.M.P., A.N.K., Y.K., E.R., E.K., H.L.M., S.D.S.; supervision, S.D.S.; funding acquisition, S.D.S. All authors have read and agreed to the published version of the manuscript.

Funding

This work is supported by NIH R01 (CA252055, CA212518) and the Crohn’s & Colitis Foundation (663445).

Institutional Review Board Statement

The study was conducted according to the guidelines approved by the Institutional Review Board (or Ethics Committee) of Tulane University (Protocol number 867, approved on 25 August 2021).

Informed Consent Statement

Patient consent was waived due to the publicly available transcriptomes were obtained from Inflammatory Bowel Dis-ease included control and inflamed colon samples (n = 23; GSE4183). Additionally, pub-licly available transcriptomic data was obtained from colon cancer patients from two cohorts including normal colon and tumors (n = 29, GSE4183, GSE141174). Moreover, publicly available transcriptomic data of colon cancer patients including normal were utilized (n = 498, TCGA). These data are acquired using NCBI’s GEO2R.

Data Availability Statement

The data presented in this study are available on request from the corresponding author. The data are not publicly available due to privacy restrictions.

Conflicts of Interest

We report that we do not have any direct or indirect competing interest.

References

  1. Bray, G.A. The underlying basis for obesity: Relationship to cancer. J. Nutr. 2002, 132, 3451S–3455S. [Google Scholar] [CrossRef] [PubMed] [Green Version]
  2. Demark-Wahnefried, W.; Platz, E.A.; Ligibel, J.A.; Blair, C.K.; Courneya, K.S.; Meyerhardt, J.A.; Ganz, P.A.; Rock, C.L.; Schmitz, K.H.; Wadden, T.; et al. The role of obesity in cancer survival and recurrence. Cancer Epidemiol. Biomark. Prev. 2012, 21, 1244–1259. [Google Scholar] [CrossRef] [PubMed] [Green Version]
  3. Rawla, P.; Sunkara, T.; Barsouk, A. Epidemiology of colorectal cancer: Incidence, mortality, survival, and risk factors. Prz. Gastroenterol. 2019, 14, 89–103. [Google Scholar] [CrossRef] [PubMed]
  4. Kim, J.R.; Jung, H.S.; Bae, S.W.; Kim, J.H.; Park, B.L.; Choi, Y.H.; Cho, H.Y.; Cheong, H.S.; Shin, H.D. Polymorphisms in FOXO gene family and association analysis with BMI. Obesity 2006, 14, 188–193. [Google Scholar] [CrossRef] [PubMed]
  5. Peng, S.L. Foxo in the immune system. Oncogene 2008, 27, 2337–2344. [Google Scholar] [CrossRef] [PubMed] [Green Version]
  6. Senokuchi, T.; Liang, C.P.; Seimon, T.A.; Han, S.; Matsumoto, M.; Banks, A.S.; Paik, J.H.; DePinho, R.A.; Accili, D.; Tabas, I.; et al. Forkhead transcription factors (FoxOs) promote apoptosis of insulin-resistant macrophages during cholesterol-induced endoplasmic reticulum stress. Diabetes 2008, 57, 2967–2976. [Google Scholar] [CrossRef] [PubMed] [Green Version]
  7. Na, Y.R.; Stakenborg, M.; Seok, S.H.; Matteoli, G. Macrophages in intestinal inflammation and resolution: A potential therapeutic target in IBD. Nat. Rev. Gastroenterol. Hepatol. 2019, 16, 531–543. [Google Scholar] [CrossRef] [PubMed]
  8. Mosser, D.M.; Hamidzadeh, K.; Goncalves, R. Macrophages and the maintenance of homeostasis. Cell. Mol. Immunol. 2021, 18, 579–587. [Google Scholar] [CrossRef] [PubMed]
  9. Viola, A.; Munari, F.; Sanchez-Rodriguez, R.; Scolaro, T.; Castegna, A. The Metabolic Signature of Macrophage Responses. Front. Immunol. 2019, 10, 1462. [Google Scholar] [CrossRef] [PubMed] [Green Version]
  10. Zhang, C.; Yang, M.; Ericsson, A.C. Function of Macrophages in Disease: Current Understanding on Molecular Mechanisms. Front. Immunol. 2021, 12, 620510. [Google Scholar] [CrossRef]
  11. Martinez, F.O.; Gordon, S. The M1 and M2 paradigm of macrophage activation: Time for reassessment. F1000Prime Rep. 2014, 6, 13. [Google Scholar] [CrossRef] [PubMed] [Green Version]
  12. Chavez-Galan, L.; Olleros, M.L.; Vesin, D.; Garcia, I. Much More than M1 and M2 Macrophages, There are also CD169(+) and TCR(+) Macrophages. Front. Immunol. 2015, 6, 263. [Google Scholar] [CrossRef] [PubMed]
  13. Morris, D.L.; Singer, K.; Lumeng, C.N. Adipose tissue macrophages: Phenotypic plasticity and diversity in lean and obese states. Curr. Opin. Clin. Nutr. Metab. Care 2011, 14, 341–346. [Google Scholar] [CrossRef] [PubMed] [Green Version]
  14. Isidro, R.A.; Appleyard, C.B. Colonic macrophage polarization in homeostasis, inflammation, and cancer. Am. J. Physiol.-Gastrointest. Liver Physiol. 2016, 311, G59–G73. [Google Scholar] [CrossRef] [PubMed]
  15. Hamidzadeh, K.; Christensen, S.M.; Dalby, E.; Chandrasekaran, P.; Mosser, D.M. Macrophages and the Recovery from Acute and Chronic Inflammation. Annu. Rev. Physiol. 2017, 79, 567–592. [Google Scholar] [CrossRef] [PubMed] [Green Version]
  16. Liu, H.; Dasgupta, S.; Fu, Y.; Bailey, B.; Roy, C.; Lightcap, E.; Faustin, B. Subsets of mononuclear phagocytes are enriched in the inflamed colons of patients with IBD. BMC Immunol. 2019, 20, 42. [Google Scholar] [CrossRef] [PubMed] [Green Version]
  17. Kuhl, A.A.; Erben, U.; Kredel, L.I.; Siegmund, B. Diversity of Intestinal Macrophages in Inflammatory Bowel Diseases. Front. Immunol. 2015, 6, 613. [Google Scholar] [CrossRef] [PubMed] [Green Version]
  18. Nielsen, S.R.; Schmid, M.C. Macrophages as Key Drivers of Cancer Progression and Metastasis. Mediat. Inflamm. 2017, 2017, 9624760. [Google Scholar] [CrossRef] [PubMed]
  19. Dandekar, R.C.; Kingaonkar, A.V.; Dhabekar, G.S. Role of macrophages in malignancy. Ann. Maxillofac. Surg. 2011, 1, 150–154. [Google Scholar] [CrossRef] [Green Version]
  20. Qiu, S.Q.; Waaijer, S.J.H.; Zwager, M.C.; de Vries, E.G.E.; van der Vegt, B.; Schroder, C.P. Tumor-associated macrophages in breast cancer: Innocent bystander or important player? Cancer Treat. Rev. 2018, 70, 178–189. [Google Scholar] [CrossRef] [Green Version]
  21. Yang, S.; Liu, Q.; Liao, Q. Tumor-Associated Macrophages in Pancreatic Ductal Adenocarcinoma: Origin, Polarization, Function, and Reprogramming. Front. Cell Dev. Biol. 2020, 8, 607209. [Google Scholar] [CrossRef] [PubMed]
  22. Zhong, X.; Chen, B.; Yang, Z. The Role of Tumor-Associated Macrophages in Colorectal Carcinoma Progression. Cell. Physiol. Biochem. 2018, 45, 356–365. [Google Scholar] [CrossRef]
  23. Edin, S.; Wikberg, M.L.; Dahlin, A.M.; Rutegard, J.; Oberg, A.; Oldenborg, P.A.; Palmqvist, R. The distribution of macrophages with a M1 or M2 phenotype in relation to prognosis and the molecular characteristics of colorectal cancer. PLoS ONE 2012, 7, e47045. [Google Scholar] [CrossRef] [PubMed] [Green Version]
  24. Stefanetti, R.J.; Voisin, S.; Russell, A.; Lamon, S. Recent advances in understanding the role of FOXO3. F1000Research 2018, 7. [Google Scholar] [CrossRef] [Green Version]
  25. Wang, L.; Zhu, X.; Sun, X.; Yang, X.; Chang, X.; Xia, M.; Lu, Y.; Xia, P.; Yan, H.; Bian, H.; et al. FoxO3 regulates hepatic triglyceride metabolism via modulation of the expression of sterol regulatory-element binding protein 1c. Lipids Health Dis. 2019, 18, 197. [Google Scholar] [CrossRef] [Green Version]
  26. Lee, S.; Dong, H.H. FoxO integration of insulin signaling with glucose and lipid metabolism. J. Endocrinol. 2017, 233, R67–R79. [Google Scholar] [CrossRef] [Green Version]
  27. Zemva, J.; Schilbach, K.; Stohr, O.; Moll, L.; Franko, A.; Krone, W.; Wiesner, R.J.; Schubert, M. Central FoxO3a and FoxO6 expression is down-regulated in obesity induced diabetes but not in aging. Exp. Clin. Endocrinol. Diabetes 2012, 120, 340–350. [Google Scholar] [CrossRef]
  28. Heller, S.; Cable, C.; Penrose, H.; Makboul, R.; Biswas, D.; Cabe, M.; Crawford, S.E.; Savkovic, S.D. Intestinal inflammation requires FOXO3 and Prostaglandin E2 dependent lipogenesis and elevated lipid droplets. Am. J. Physiol.-Gastrointest. Liver Physiol. 2016, 310, G844–G854. [Google Scholar] [CrossRef] [PubMed] [Green Version]
  29. Qi, W.; Fitchev, P.S.; Cornwell, M.L.; Greenberg, J.; Cabe, M.; Weber, C.R.; Roy, H.K.; Crawford, S.E.; Savkovic, S.D. FOXO3 growth inhibition of colonic cells is dependent on intraepithelial lipid droplet density. J. Biol. Chem. 2013, 288, 16274–16281. [Google Scholar] [CrossRef] [Green Version]
  30. Snoeks, L.; Weber, C.R.; Turner, J.R.; Bhattacharyya, M.; Wasland, K.; Savkovic, S.D. Tumor suppressor Foxo3a is involved in the regulation of lipopolysaccharide-induced interleukin-8 in intestinal HT-29 cells. Infect. Immun. 2008, 76, 4677–4685. [Google Scholar] [CrossRef] [Green Version]
  31. Snoeks, L.; Weber, C.R.; Wasland, K.; Turner, J.R.; Vainder, C.; Qi, W.; Savkovic, S.D. Tumor suppressor FOXO3 participates in the regulation of intestinal inflammation. Lab. Investig. J. Tech. Methods Pathol. 2009, 89, 1053–1062. [Google Scholar] [CrossRef] [PubMed] [Green Version]
  32. Lee, J.C.; Espeli, M.; Anderson, C.A.; Linterman, M.A.; Pocock, J.M.; Williams, N.J.; Roberts, R.; Viatte, S.; Fu, B.; Peshu, N.; et al. Human SNP links differential outcomes in inflammatory and infectious disease to a FOXO3-regulated pathway. Cell 2013, 155, 57–69. [Google Scholar] [CrossRef] [PubMed] [Green Version]
  33. Cui, M.; Huang, Y.; Zhao, Y.; Zheng, J. Transcription factor FOXO3a mediates apoptosis in HIV-1-infected macrophages. J. Immunol. 2008, 180, 898–906. [Google Scholar] [CrossRef] [PubMed]
  34. Peng, S.L. Forkhead transcription factors in chronic inflammation. Int. J. Biochem. Cell Biol. 2010, 42, 482–485. [Google Scholar] [CrossRef] [PubMed] [Green Version]
  35. Liu, Y.; Ao, X.; Ding, W.; Ponnusamy, M.; Wu, W.; Hao, X.; Yu, W.; Wang, Y.; Li, P.; Wang, J. Critical role of FOXO3a in carcinogenesis. Mol. Cancer 2018, 17, 104. [Google Scholar] [CrossRef] [PubMed] [Green Version]
  36. Bullock, M.D.; Bruce, A.; Sreekumar, R.; Curtis, n.; Cheung, T.; Reading, I.; Primrose, J.N.; Ottensmeier, C.; Packham, G.K.; Thomas, G.; et al. FOXO3 expression during colorectal cancer progression: Biomarker potential reflects a tumour suppressor role. Br. J. Cancer 2013, 109, 387–394. [Google Scholar] [CrossRef] [PubMed]
  37. Qi, W.; Weber, C.R.; Wasland, K.; Roy, H.; Wali, R.; Joshi, S.; Savkovic, S.D. Tumor suppressor FOXO3 mediates signals from the EGF receptor to regulate proliferation of colonic cells. Am. J. Physiol.-Gastrointest. Liver Physiol. 2011, 300, G264–G272. [Google Scholar] [CrossRef] [PubMed] [Green Version]
  38. Penrose, H.M.; Cable, C.; Heller, S.; Ungerleider, n.; Nakhoul, H.; Baddoo, M.; Hartono, A.B.; Lee, S.B.; Burow, M.E.; Flemington, E.F.; et al. Loss of Forkhead Box O3 Facilitates Inflammatory Colon Cancer: Transcriptome Profiling of the Immune Landscape and Novel Targets. Cell. Mol. Gastroenterol. Hepatol. 2019, 7, 391–408. [Google Scholar] [CrossRef] [PubMed] [Green Version]
  39. Castoldi, A.; Naffah de Souza, C.; Camara, N.O.; Moraes-Vieira, P.M. The Macrophage Switch in Obesity Development. Front. Immunol. 2015, 6, 637. [Google Scholar] [CrossRef] [PubMed] [Green Version]
  40. Kawano, Y.; Nakae, J.; Watanabe, N.; Kikuchi, T.; Tateya, S.; Tamori, Y.; Kaneko, M.; Abe, T.; Onodera, M.; Itoh, H. Colonic Pro-inflammatory Macrophages Cause Insulin Resistance in an Intestinal Ccl2/Ccr2-Dependent Manner. Cell Metab. 2016, 24, 295–310. [Google Scholar] [CrossRef] [Green Version]
  41. Penrose, H.M.; Heller, S.; Cable, C.; Nakhoul, H.; Baddoo, M.; Flemington, E.; Crawford, S.E.; Savkovic, S.D. High-fat diet induced leptin and Wnt expression: RNA-sequencing and pathway analysis of mouse colonic tissue and tumors. Carcinogenesis 2017, 38, 302–311. [Google Scholar] [CrossRef] [PubMed] [Green Version]
  42. Newman, A.M.; Liu, C.L.; Green, M.R.; Gentles, A.J.; Feng, W.; Xu, Y.; Hoang, C.D.; Diehn, M.; Alizadeh, A.A. Robust enumeration of cell subsets from tissue expression profiles. Nat. Methods 2015, 12, 453–457. [Google Scholar] [CrossRef] [PubMed] [Green Version]
  43. Davies, L.C.; Rosas, M.; Jenkins, S.J.; Liao, C.T.; Scurr, M.J.; Brombacher, F.; Fraser, D.J.; Allen, J.E.; Jones, S.A.; Taylor, P.R. Distinct bone marrow-derived and tissue-resident macrophage lineages proliferate at key stages during inflammation. Nat. Commun. 2013, 4, 1886. [Google Scholar] [CrossRef] [PubMed] [Green Version]
  44. Layoun, A.; Samba, M.; Santos, M.M. Isolation of murine peritoneal macrophages to carry out gene expression analysis upon Toll-like receptors stimulation. J. Vis. Exp. 2015, e52749. [Google Scholar] [CrossRef] [PubMed] [Green Version]
  45. Misharin, A.V.; Saber, R.; Perlman, H. Eosinophil contamination of thioglycollate-elicited peritoneal macrophage cultures skews the functional readouts of in vitro assays. J. Leukoc. Biol. 2012, 92, 325–331. [Google Scholar] [CrossRef] [PubMed] [Green Version]
  46. Han, X.; Ding, S.; Jiang, H.; Liu, G. Roles of Macrophages in the Development and Treatment of Gut Inflammation. Front. Cell Dev. Biol. 2021, 9, 625423. [Google Scholar] [CrossRef]
  47. Liu, Y.; Xu, R.; Gu, H.; Zhang, E.; Qu, J.; Cao, W.; Huang, X.; Yan, H.; He, J.; Cai, Z. Metabolic reprogramming in macrophage responses. Biomark. Res. 2021, 9, 1. [Google Scholar] [CrossRef]
  48. Franze, E.; Laudisi, F.; Di Grazia, A.; Maronek, M.; Bellato, V.; Sica, G.; Monteleone, G. Macrophages produce and functionally respond to interleukin-34 in colon cancer. Cell Death Discov. 2020, 6, 117. [Google Scholar] [CrossRef]
  49. Wu, X.; Fan, Z.; Chen, M.; Chen, Y.; Rong, D.; Cui, Z.; Yuan, Y.; Zhuo, L.; Xu, Y. Forkhead transcription factor FOXO3a mediates interferon-gamma-induced MHC II transcription in macrophages. Immunology 2019, 158, 304–313. [Google Scholar] [CrossRef] [PubMed]
  50. Braster, R.; Bogels, M.; Beelen, R.H.; van Egmond, M. The delicate balance of macrophages in colorectal cancer; their role in tumour development and therapeutic potential. Immunobiology 2017, 222, 21–30. [Google Scholar] [CrossRef]
  51. Mao, L.; Kitani, A.; Strober, W.; Fuss, I.J. The Role of NLRP3 and IL-1beta in the Pathogenesis of Inflammatory Bowel Disease. Front. Immunol. 2018, 9, 2566. [Google Scholar] [CrossRef] [PubMed] [Green Version]
  52. Li, Y.; Wang, L.; Pappan, L.; Galliher-Beckley, A.; Shi, J. IL-1beta promotes stemness and invasiveness of colon cancer cells through Zeb1 activation. Mol. Cancer 2012, 11, 87. [Google Scholar] [CrossRef] [PubMed] [Green Version]
  53. Akasaki, Y.; Hasegawa, A.; Saito, M.; Asahara, H.; Iwamoto, Y.; Lotz, M.K. Dysregulated FOXO transcription factors in articular cartilage in aging and osteoarthritis. Osteoarthr. Cartil. 2014, 22, 162–170. [Google Scholar] [CrossRef] [PubMed] [Green Version]
  54. Sinclair, A.; Park, L.; Shah, M.; Drotar, M.; Calaminus, S.; Hopcroft, L.E.; Kinstrie, R.; Guitart, A.V.; Dunn, K.; Abraham, S.A.; et al. CXCR2 and CXCL4 regulate survival and self-renewal of hematopoietic stem/progenitor cells. Blood 2016, 128, 371–383. [Google Scholar] [CrossRef] [PubMed] [Green Version]
  55. Zhu, F.; He, H.; Fan, L.; Ma, C.; Xu, Z.; Xue, Y.; Wang, Y.; Zhang, C.; Zhou, G. Blockade of CXCR2 suppresses proinflammatory activities of neutrophils in ulcerative colitis. Am. J. Transl. Res. 2020, 12, 5237–5251. [Google Scholar] [PubMed]
  56. Desurmont, T.; Skrypek, n.; Duhamel, A.; Jonckheere, n.; Millet, G.; Leteurtre, E.; Gosset, P.; Duchene, B.; Ramdane, n.; Hebbar, M.; et al. Overexpression of chemokine receptor CXCR2 and ligand CXCL7 in liver metastases from colon cancer is correlated to shorter disease-free and overall survival. Cancer Sci. 2015, 106, 262–269. [Google Scholar] [CrossRef] [PubMed] [Green Version]
  57. Wang, S.; Song, R.; Wang, Z.; Jing, Z.; Wang, S.; Ma, J. S100A8/A9 in Inflammation. Front. Immunol. 2018, 9, 1298. [Google Scholar] [CrossRef] [PubMed]
  58. Ichikawa, M.; Williams, R.; Wang, L.; Vogl, T.; Srikrishna, G. S100A8/A9 activate key genes and pathways in colon tumor progression. Mol. Cancer Res. 2011, 9, 133–148. [Google Scholar] [CrossRef] [PubMed] [Green Version]
  59. Okada, K.; Okabe, M.; Kimura, Y.; Itoh, H.; Ikemoto, M. Serum S100A8/A9 as a Potentially Sensitive Biomarker for Inflammatory Bowel Disease. Lab. Med. 2019, 50, 370–380. [Google Scholar] [CrossRef] [PubMed]
  60. Caer, C.; Gorreja, F.; Forsskahl, S.K.; Brynjolfsson, S.F.; Szeponik, L.; Magnusson, M.K.; Borjesson, L.G.; Block, M.; Bexe-Lindskog, E.; Wick, M.J. TREM-1+ Macrophages Define a Pathogenic Cell Subset in the Intestine of Crohn’s Disease Patients. J. Crohns Colitis 2021, 15, 1346–1361. [Google Scholar] [CrossRef]
  61. Ho, C.C.; Liao, W.Y.; Wang, C.Y.; Lu, Y.H.; Huang, H.Y.; Chen, H.Y.; Chan, W.K.; Chen, H.W.; Yang, P.C. TREM-1 expression in tumor-associated macrophages and clinical outcome in lung cancer. Am. J. Respir. Crit. Care Med. 2008, 177, 763–770. [Google Scholar] [CrossRef] [PubMed]
  62. Saurer, L.; Zysset, D.; Rihs, S.; Mager, L.; Gusberti, M.; Simillion, C.; Lugli, A.; Zlobec, I.; Krebs, P.; Mueller, C. TREM-1 promotes intestinal tumorigenesis. Sci. Rep. 2017, 7, 14870. [Google Scholar] [CrossRef] [PubMed] [Green Version]
  63. Kelly, M.; von Lintig, J. STRA6: Role in cellular retinol uptake and efflux. Hepatobiliary Surg. Nutr. 2015, 4, 229–242. [Google Scholar] [CrossRef] [PubMed]
  64. Gokulakrishnan, K.; Pandey, G.K.; Sathishkumar, C.; Sundararajan, S.; Durairaj, P.; Manickam, N.; Mohan, V.; Balasubramanyam, M. Augmentation of RBP4/STRA6 signaling leads to insulin resistance and inflammation and the plausible therapeutic role of vildagliptin and metformin. Mol. Biol. Rep. 2021, 48, 4093–4106. [Google Scholar] [CrossRef] [PubMed]
  65. Oliveira, L.M.; Teixeira, F.M.E.; Sato, M.N. Impact of Retinoic Acid on Immune Cells and Inflammatory Diseases. Mediat. Inflamm. 2018, 2018, 3067126. [Google Scholar] [CrossRef] [PubMed] [Green Version]
  66. Muniz-Hernandez, S.; Velazquez-Fernandez, J.B.; Diaz-Chavez, J.; Mondragon-Fonseca, O.; Mayen-Lobo, Y.; Ortega, A.; Lopez-Lopez, M.; Arrieta, O. STRA6 Polymorphisms Are Associated with EGFR Mutations in Locally-Advanced and Metastatic Non-Small Cell Lung Cancer Patients. Front. Oncol. 2020, 10, 579561. [Google Scholar] [CrossRef] [PubMed]
  67. Karunanithi, S.; Levi, L.; DeVecchio, J.; Karagkounis, G.; Reizes, O.; Lathia, J.D.; Kalady, M.F.; Noy, N. RBP4-STRA6 Pathway Drives Cancer Stem Cell Maintenance and Mediates High-Fat Diet-Induced Colon Carcinogenesis. Stem Cell Rep. 2017, 9, 438–450. [Google Scholar] [CrossRef] [PubMed] [Green Version]
  68. Widmer, C.; Gebauer, J.M.; Brunstein, E.; Rosenbaum, S.; Zaucke, F.; Drogemuller, C.; Leeb, T.; Baumann, U. Molecular basis for the action of the collagen-specific chaperone Hsp47/SERPINH1 and its structure-specific client recognition. Proc. Natl. Acad. Sci. USA 2012, 109, 13243–13247. [Google Scholar] [CrossRef] [PubMed] [Green Version]
  69. Levi-Galibov, O.; Lavon, H.; Wassermann-Dozorets, R.; Pevsner-Fischer, M.; Mayer, S.; Wershof, E.; Stein, Y.; Brown, L.E.; Zhang, W.; Friedman, G.; et al. Heat Shock Factor 1-dependent extracellular matrix remodeling mediates the transition from chronic intestinal inflammation to colon cancer. Nat. Commun. 2020, 11, 6245. [Google Scholar] [CrossRef] [PubMed]
  70. Spenle, C.; Lefebvre, O.; Lacroute, J.; Mechine-Neuville, A.; Barreau, F.; Blottiere, H.M.; Duclos, B.; Arnold, C.; Hussenet, T.; Hemmerle, J.; et al. The laminin response in inflammatory bowel disease: Protection or malignancy? PLoS ONE 2014, 9, e111336. [Google Scholar] [CrossRef] [Green Version]
  71. Consortium, U.I.G.; Barrett, J.C.; Lee, J.C.; Lees, C.W.; Prescott, N.J.; Anderson, C.A.; Phillips, A.; Wesley, E.; Parnell, K.; Zhang, H.; et al. Genome-wide association study of ulcerative colitis identifies three new susceptibility loci, including the HNF4A region. Nat. Genet. 2009, 41, 1330–1334. [Google Scholar] [CrossRef] [PubMed]
  72. Thompson, A.I.; Lees, C.W. Genetics of ulcerative colitis. Inflamm. Bowel Dis. 2011, 17, 831–848. [Google Scholar] [CrossRef] [PubMed]
  73. Lin, Q.; Lim, H.S.; Lin, H.L.; Tan, H.T.; Lim, T.K.; Cheong, W.K.; Cheah, P.Y.; Tang, C.L.; Chow, P.K.; Chung, M.C. Analysis of colorectal cancer glyco-secretome identifies laminin beta-1 (LAMB1) as a potential serological biomarker for colorectal cancer. Proteomics 2015, 15, 3905–3920. [Google Scholar] [CrossRef] [PubMed]
  74. Chevillard, G.; Blank, V. NFE2L3 (NRF3): The Cinderella of the Cap‘n’Collar transcription factors. Cell. Mol. Life Sci. 2011, 68, 3337–3348. [Google Scholar] [CrossRef] [PubMed]
  75. Zhang, B.; Sun, T. Transcription Factors That Regulate the Pathogenesis of Ulcerative Colitis. BioMed Res. Int. 2020, 2020, 7402657. [Google Scholar] [CrossRef] [PubMed]
  76. Kandoth, C.; McLellan, M.D.; Vandin, F.; Ye, K.; Niu, B.; Lu, C.; Xie, M.; Zhang, Q.; McMichael, J.F.; Wyczalkowski, M.A.; et al. Mutational landscape and significance across 12 major cancer types. Nature 2013, 502, 333–339. [Google Scholar] [CrossRef] [PubMed] [Green Version]
  77. Chowdhury, A.; Katoh, H.; Hatanaka, A.; Iwanari, H.; Nakamura, N.; Hamakubo, T.; Natsume, T.; Waku, T.; Kobayashi, A. Multiple regulatory mechanisms of the biological function of NRF3 (NFE2L3) control cancer cell proliferation. Sci. Rep. 2017, 7, 12494. [Google Scholar] [CrossRef] [PubMed]
  78. Bruneau, n.; Richard, S.; Silvy, F.; Verine, A.; Lombardo, D. Lectin-like Ox-LDL receptor is expressed in human INT-407 intestinal cells: Involvement in the transcytosis of pancreatic bile salt-dependent lipase. Mol. Biol. Cell 2003, 14, 2861–2875. [Google Scholar] [CrossRef] [PubMed] [Green Version]
  79. Ruiz-Roso, M.B.; Gil-Zamorano, J.; Lopez de Las Hazas, M.C.; Tome-Carneiro, J.; Crespo, M.C.; Latasa, M.J.; Briand, O.; Sanchez-Lopez, D.; Ortiz, A.I.; Visioli, F.; et al. Intestinal Lipid Metabolism Genes Regulated by miRNAs. Front. Genet. 2020, 11, 707. [Google Scholar] [CrossRef] [PubMed]
  80. Yang, G.; Xiong, G.; Feng, M.; Zhao, F.; Qiu, J.; Liu, Y.; Cao, Z.; Wang, H.; Yang, J.; You, L.; et al. OLR1 Promotes Pancreatic Cancer Metastasis via Increased c-Myc Expression and Transcription of HMGA2. Mol. Cancer Res. 2020, 18, 685–697. [Google Scholar] [CrossRef] [Green Version]
  81. Hirsch, H.A.; Iliopoulos, D.; Joshi, A.; Zhang, Y.; Jaeger, S.A.; Bulyk, M.; Tsichlis, P.N.; Shirley Liu, X.; Struhl, K. A transcriptional signature and common gene networks link cancer with lipid metabolism and diverse human diseases. Cancer Cell 2010, 17, 348–361. [Google Scholar] [CrossRef] [PubMed] [Green Version]
  82. Murdocca, M.; Capuano, R.; Pucci, S.; Cicconi, R.; Polidoro, C.; Catini, A.; Martinelli, E.; Paolesse, R.; Orlandi, A.; Mango, R.; et al. Targeting LOX-1 Inhibits Colorectal Cancer Metastasis in an Animal Model. Front. Oncol. 2019, 9, 927. [Google Scholar] [CrossRef] [PubMed]
  83. Rand, T.A.; Sutou, K.; Tanabe, K.; Jeong, D.; Nomura, M.; Kitaoka, F.; Tomoda, E.; Narita, M.; Nakamura, M.; Nakamura, M.; et al. MYC Releases Early Reprogrammed Human Cells from Proliferation Pause via Retinoblastoma Protein Inhibition. Cell Rep. 2018, 23, 361–375. [Google Scholar] [CrossRef] [PubMed] [Green Version]
  84. Zarouchlioti, C.; Parfitt, D.A.; Li, W.; Gittings, L.M.; Cheetham, M.E. DNAJ Proteins in neurodegeneration: Essential and protective factors. Philos. Trans. R. Soc. B Biol. Sci. 2018, 373. [Google Scholar] [CrossRef] [PubMed] [Green Version]
  85. Daemen, S.; Schilling, J.D. The Interplay Between Tissue Niche and Macrophage Cellular Metabolism in Obesity. Front. Immunol. 2019, 10, 3133. [Google Scholar] [CrossRef] [PubMed]
  86. Liang, C.P.; Han, S.; Senokuchi, T.; Tall, A.R. The macrophage at the crossroads of insulin resistance and atherosclerosis. Circ. Res. 2007, 100, 1546–1555. [Google Scholar] [CrossRef] [PubMed]
  87. Lin, L.; Hron, J.D.; Peng, S.L. Regulation of NF-kappaB, Th activation, and autoinflammation by the forkhead transcription factor Foxo3a. Immunity 2004, 21, 203–213. [Google Scholar] [CrossRef] [PubMed] [Green Version]
  88. Zhang, X.; Goncalves, R.; Mosser, D.M. The isolation and characterization of murine macrophages. Curr. Protoc. Immunol. 2008, Chapter 14, Unit 14 11. [Google Scholar] [CrossRef]
  89. Li, T.; Fu, J.; Zeng, Z.; Cohen, D.; Li, J.; Chen, Q.; Li, B.; Liu, X.S. TIMER2.0 for analysis of tumor-infiltrating immune cells. Nucleic Acids Res. 2020, 48, W509–W514. [Google Scholar] [CrossRef] [PubMed]
  90. The Cancer Genome Atlas Research Network. Integrated genomic characterization of papillary thyroid carcinoma. Cell 2014, 159, 676–690. [Google Scholar] [CrossRef] [Green Version]
Figure 1. High-fat-diet obesity in mice results in an increased presence of colonic macrophages along with loss of FOXO3. (A) Transcriptomes from colon of high-fat-diet (HFD) obese mice showed augmented macrophage presence relative to control mice (regular diet, RD) colon (CIBERSORT, n = 3 per group, ** p < 0.01). (B) Colons of mice fed with HFD showed increased phosphorylation of FOXO3 compared to colons of control mice (RD). Actin was used as a loading control. Graph represents pFOXO3 densitometric quantification (n = 3 per group, **** p < 0.0001). (C) Differentially expressed genes (DEGs) from FOXO3-deficient macrophages relative to control (n = 3 for each group, FC > |1.5|, FDR < 0.05). (D) Top diseases and pathways affected by FOXO3-deficient macrophages relative to control (p < 0.05, IPA). (E,F) Top canonical pathways and upstream regulators affected by FOXO3-deficient macrophages, which are altered in HFD obese mouse colon (SRP093363) (n = 3 per group, p < 0.05, IPA).
Metabolites 12 00250 g001
Figure 2. FOXO3 deficiency in macrophages links to mouse colonic inflammation and dysplasia. (A,B) Top canonical pathways and upstream regulators affected by FOXO3-deficient macrophages which are altered in mouse inflamed colonic tissue (n = 3, GSE31106, p < 0.05, IPA). (C,D) Top canonical pathways and upstream regulators affected by FOXO3-deficient macrophages which are altered in mouse dysplastic colonic tissue (n = 3, GSE31106, p < 0.05, IPA).
Metabolites 12 00250 g002
Figure 3. Transcriptome of FOXO3-deficient macrophages is significantly prevalent in IBD and human colon cancer. (A,B) Similar pathways and upstream regulators associated with DEGs representing FOXO3 deficient macrophages and IBD (n = 23, GSE4183, p < 0.05, IPA). (C,D) Similar pathways and upstream regulators associated with DEGs representing FOXO3-deficient macrophages and human colon cancer relative to normal colon (n = 29, GSE4183, GSE141174, p < 0.05, IPA).
Metabolites 12 00250 g003
Figure 4. MAC-FOXO382 signature in IBD and colon cancer. (A,B) Principal component analysis (PCA) of inflamed IBD and matched non-inflamed control transcriptomes with the MAC-FOXO382 signature was performed to estimate variation between samples. Two-axis values of the PCA showed the MAC-FOXO382 significantly differentiated inflamed IBD from matched non-inflamed control tissue. DEGs representing MAC-FOXO382 signature on y-axis and IBD samples on x-axis (n = 23, GSE4183, p = 5.2 × 10⁻⁸). Hierarchical clustering, as shown by representative heatmap, revealed two distinct clusters of IBD samples separated by MAC-FOXO382, differentiating between inflamed IBD and matched non-inflamed control transcriptomes. DEGs representing MAC-FOXO382 signature on x-axis and human IBD samples on y-axis (n = 23, GSE4183). (C,D) Principal component analysis (PCA) of human colon cancer and matched normal (control) colonic tissue transcriptomes with the MAC-FOXO382 signature was performed to estimate variation between samples. Two-axis values of the PCA showed MAC-FOXO382 significantly differentiated human colon cancer from matched normal (control tissue) (n = 498, TCGA, p = 1.9 × 10⁻¹¹). Hierarchical clustering, as shown by representative heatmap, revealed two distinct clusters of human colon cancer samples separated by MAC-FOXO382 differentiating between human colon cancer and matched normal control transcriptomes (n = 498, TCGA). (E) Increased MAC-FOXO382 signature presence in colon cancer patients is associated with poor survival rates (p = 0.0148), increased risk of cancer recurrence (p = 0.0499), and distant metastasis (p = 0.003) (Kaplan–Meier survival analysis).
Metabolites 12 00250 g004
Figure 5. FOXO3-mediated differentially expressed genes in macrophages with established roles in IBD and colon cancer. (A) A heatmap of the top DEGs specific to FOXO3-deficient peritoneal macrophages relative to control (>|1.5|-fold change, FDR < 0.05). (B) Validation of select FOXO3 dependent IL-1B, CXCR2, S100A8, S100A9 and TREM1 transcripts in macrophages (qPCR, n = 3, * p < 0.05). (C,D) Altered IL-1B, CXCR2, S100A8, S100A9 and TREM1 levels in IBD and human colon cancer patient transcriptomes (n = 23, GSE4183; n = 498, TCGA, * p < 0.05, *** p < 0.001).
Metabolites 12 00250 g005
Figure 6. FOXO3-mediated differentially expressed genes in macrophages with unexplored roles in IBD and colon cancer. (A) Validation of select FOXO3-dependent STRA6, SERPINH1, LAMB1, OLR1, NFE2L3, DNAJC28 and VSIG10 transcripts in macrophages (qPCR, n = 3, * p < 0.05, ** p < 0.01). (B,C) Altered STRA6, SERPINH1, LAMB1, OLR1, NFE2L3, DNAJC28 and VSIG10 levels in human IBD and colon cancer patient transcriptomes (n = 23, GSE4183; n = 498, TCGA, * p < 0.05, ** p < 0.01, *** p < 0.001).
Metabolites 12 00250 g006
Table 1. Differentially expressed genes of MAC-FOXO382 in FOXO3-deficient mouse macrophages relative to control (n = 3, FC ≥|1.5|, p < 0.001).
GeneGene NameFCp-Value
1Stfa1Stefin-A 1225.64.8 × 108
2Entpd3Ectonucleoside Triphosphate Diphosphohydrolase 3113.63.0 × 109
3Amer2APC Membrane Recruitment Protein 267.77.6 × 1010
4S100a9S100 Calcium Binding Protein A966.71.1 × 104
5Mrgpra2bMAS Related GPR Family Member X235.32.4 × 104
6Asprv1Aspartic Peptidase Retroviral-like 133.97.5 × 1018
7Sycp2Synaptonemal Complex Protein 230.21.6 × 1013
8Chil1Chitinase 3-like 129.51.4 × 106
9Olfm4Olfactomedin 424.36.2 × 108
10Cxcr2C-X-C Motif Chemokine Receptor 221.58.4 × 1035
11Catspere2Catsper Channel Auxiliary Subunit Epsilon18.69.7 × 105
12Il1f9Interleukin 1 Family, Member 913.65.9 × 1013
13Amd2Adenosylmethionine Decarboxylase 1 Pseudogene 211.82.6 × 1034
14Alas25′-Aminolevulinate Synthase 210.11.9 × 105
15S100a8S100 Calcium-binding Protein A89.94.9 × 107
16Steap4Six-Transmembrane Epithelial Antigen Of Prostate 48.02.1 × 1012
17Il1r2Interleukin 1 Receptor Type 27.96.6 × 108
18Hba-a2Hemoglobin Subunit Alpha 27.73.1 × 106
19Slc38a4Solute Carrier Family 38 Member 47.73.9 × 108
20Stra6Stimulated By Retinoic Acid 67.23.7 × 105
21Col24a1Collagen Type XXIV Alpha 1 Chain6.79.3 × 106
22Hba-a1Hemoglobin Subunit Alpha 15.91.7 × 107
23Trem1Triggering Receptor Expressed On Myeloid Cells 15.71.2 × 1015
24Lin28aLin-28 Homolog A5.61.5 × 10−4
25Il1bInterleukin 1 Beta5.41.5 × 109
26AmbpAlpha-1-Microglobulin/Bikunin Precursor5.12.3 × 104
27Ifitm1Interferon-induced Transmembrane Protein 15.15.8 × 105
28Nfe2l3Nuclear Factor, Erythroid 2-like 34.91.9 × 105
29KirrelKin Of Irregular Chiasm-like Protein 14.99.2 × 105
30Lamb1Laminin Subunit Beta 14.36.0 × 107
31Serpinh1Serpin Peptidase Inhibitor, Clade H, Member 1,4.01.7 × 106
32Adamts1ADAM Metallopeptidase With Thrombospondin Type 1 Motif 13.91.8 × 104
33Pkhd1l1Polycystic Kidney and Hepatic Disease 1-like 13.81.8 × 104
34Fads2Fatty Acid Desaturase 23.76.2 × 106
35Col1a1Collagen Type I Alpha 1 Chain3.62.5 × 104
36DmknDermokine3.64.0 × 105
37Rbp1Retinol-binding Protein 13.57.2 × 105
38Tcaf1TRPM8 Channel Associated Factor 13.49.0 × 108
39Hpgd15-Hydroxyprostaglandin Dehydrogenase3.42.1 × 107
40septin3Neuronal-specific Septin-33.46.2 × 105
41Nr4a3Nuclear Receptor Subfamily 4 Group A Member 33.35.8 × 107
42Ccl2C-C Motif Chemokine Ligand 23.33.1 × 105
43Ltbp2Latent Transforming Growth Factor Beta-binding Protein 23.31.6 × 104
44Dclk1Doublecortin-like Kinase 13.23.6 × 106
45Map1bMicrotubule Associated Protein 1B3.22.2 × 104
46Wt1Wilms Tumor 13.24.1 × 105
47Col1a2Collagen Type I Alpha 2 Chain3.11.9 × 104
48PtprfProtein Tyrosine Phosphatase Receptor Type F3.02.2 × 104
49Krt19Keratin 192.91.0 × 104
50Arhgef17Rho-specific Guanine-Nucleotide Exchange Factor2.81.5 × 104
51Il1r1Interleukin 1 Receptor Type 12.76.3 × 105
52Treml4Triggering Receptor Expressed On Myeloid Cells-like 42.71.9 × 104
53VcanVersican2.51.3 × 105
54Klrb1bKiller Cell Lectin-like Receptor B12.42.9 × 105
55Olr1Oxidized Low Density Lipoprotein Receptor 12.12.8 × 104
56Pram1PML-RARA Regulated Adaptor Molecule 12.12.2 × 105
57Ccnb1Cyclin B12.11.9 × 104
58NplN-Acetylneuraminate Pyruvate Lyase2.06.2 × 105
59Cdk1Cyclin-dependent Kinase 11.91.5 × 104
60Tbc1d16TBC1 Domain Family Member 161.87.4 × 105
61Dab2DAB Adaptor Protein 21.83.1 × 107
62Nfil3Nuclear Factor, Interleukin 3 Regulated1.82.9 × 105
63Tbc1d4TBC1 Domain Family Member 41.71.2 × 104
64Samsn1SAM Domain, SH3 Domain And Nuclear Localization Signals 11.52.6 × 105
65Kcnk13Potassium Two Pore Domain Channel Subfamily K Member 131.51.4 × 104
66Fmo5Flavin Containing Dimethylaniline Monoxygenase 5−1.61.2 × 104
67Ip6k1Inositol Hexakisphosphate Kinase 1−1.68.4 × 105
68Wdr45WD Repeat Domain 45−1.72.2 × 105
69Serinc5Serine Incorporator 5−1.73.2 × 105
70Mrgprx2MAS-Related GPR Family Member X2−1.93.7 × 101
71Maml2Mastermind-like Transcriptional Coactivator 2−1.97.2 × 105
72Vsig10V-Set And Immunoglobulin Domain-containing 10−2.24.5 × 105
73Dnajc28DnaJ Heat Shock Protein Family (Hsp40) Member C28−2.27.9 × 107
74Rab6bRAB6B, Member RAS Oncogene Family−2.52.5 × 105
75Ypel3Yippee Like 3−2.94.2 × 1019
76Armc2Armadillo Repeat-containing 2−3.12.8 × 106
77Cdkn2aCyclin-dependent Kinase Inhibitor 2A−5.58.4 × 106
78Slc15a2Solute Carrier Family 15 Member 2−6.61.0 × 104
79Clec2gC-Type Lectin Domain Family 2 Member D−8.92.1 × 1020
80Camk2bCalcium/Calmodulin-dependent Protein Kinase II Beta−9.43.2 × 1011
81Slc25a27Solute Carrier Family 25 Member 27−9.44.3 × 106
82Foxo3aForkhead Box O3−22.08.1 × 1043
Publisher’s Note: MDPI stays neutral with regard to jurisdictional claims in published maps and institutional affiliations.

