Article

Rational Engineering of Non-Ubiquinone Containing Corynebacterium glutamicum for Enhanced Coenzyme Q10 Production

1
Genetics of Prokaryotes, Faculty of Biology and CeBiTec, Bielefeld University, 33615 Bielefeld, Germany
2
University Grenoble Alpes, CNRS, UMR5525, VetAgro Sup, Grenoble INP, TIMC, 38000 Grenoble, France
*
Authors to whom correspondence should be addressed.
Metabolites 2022, 12(5), 428; https://doi.org/10.3390/metabo12050428
Submission received: 27 April 2022 / Revised: 7 May 2022 / Accepted: 9 May 2022 / Published: 11 May 2022
(This article belongs to the Special Issue Microbial Metabolic Engineering)

Abstract

:
Coenzyme Q10 (CoQ10) is a lipid-soluble compound with important physiological functions and is sought after in the food and cosmetic industries owing to its antioxidant properties. In our previous proof of concept, we engineered for CoQ10 biosynthesis the industrially relevant Corynebacterium glutamicum, which does not naturally synthesize any CoQ. Here, liquid chromatography–mass spectrometry (LC–MS) analysis identified two metabolic bottlenecks in the CoQ10 production, i.e., low conversion of the intermediate 10-prenylphenol (10P-Ph) to CoQ10 and the accumulation of isoprenologs with prenyl chain lengths of not only 10, but also 8 to 11 isopentenyl units. To overcome these limitations, the strain was engineered for expression of the Ubi complex accessory factors UbiJ and UbiK from Escherichia coli to increase flux towards CoQ10, and by replacement of the native polyprenyl diphosphate synthase IspB with a decaprenyl diphosphate synthase (DdsA) to select for prenyl chains with 10 isopentenyl units. The best strain UBI6-Rs showed a seven-fold increased CoQ10 content and eight-fold increased CoQ10 titer compared to the initial strain UBI4-Pd, while the abundance of CoQ8, CoQ9, and CoQ11 was significantly reduced. This study demonstrates the application of the recent insight into CoQ biosynthesis to improve metabolic engineering of a heterologous CoQ10 production strain.

1. Introduction

Coenzyme Q (CoQ), also referred to as ubiquinone, is a prenylated quinone compound that plays an essential role in the respiratory chain of eukaryotes and many prokaryotes. CoQ possesses certain chain lengths in different organisms defined by the number of isopentenyl units, e.g., CoQ6 in Saccharomyces cerevisiae, CoQ8 in Escherichia coli, and CoQ10 in humans. Next to its function in respiratory chains, CoQ serves as a lipid-soluble antioxidant that protects cellular membranes and lipoproteins from oxidative damage [1], as an activator of mitochondrial uncoupling proteins [2], and as a cofactor of several important enzymes such as mitochondrial dehydrogenases involved in different metabolic pathways [3]. Genetic CoQ10 deficiencies may cause various severe disorders, of which symptoms can sometimes be mitigated by CoQ10 supplementation [4,5,6]. Dietary supplementation has also shown beneficial effects in patients with cardiovascular and neurodegenerative diseases [7,8]. Especially in the food supplement [9] and cosmetic industries [10], CoQ10 has gained a large interest. Due to its challenging, low stereoselectivity yielding and expensive chemical synthesis, advanced semi-synthetic approaches have been developed [11]. However, microbial production offers a cheap and sustainable alternative owing to advances in the understanding of CoQ biosynthesis, metabolic engineering, biotechnological processes, and potent CoQ10 synthesizing bacteria, e.g., Agrobacterium tumefaciens and Rhodobacter sphaeroides [12,13,14].
CoQ consists of a polysubstituted aromatic ring and a polyprenyl side chain. In bacteria, the aromatic precursor 4-hydroxybenzoate (4-HBA) is synthesized by cleavage of shikimate pathway-derived chorismate, while polyprenyl diphosphate originates from the methylerythritol phosphate (MEP) pathway. The number of isopentenyl diphosphate units added to farnesyl diphosphate by the polyprenyl diphosphate synthase defines the chain length of CoQ. The condensation of the polyprenyl side chain to 4-HBA is followed by multiple modifications of the aromatic ring in the late CoQ pathway to yield the final CoQ molecule (Figure 1F) [15]. Several metabolic engineering strategies have been applied to increase CoQ10 production in R. sphaeroides, including the upregulation of rate-limiting enzymes from the MEP and late CoQ pathways [16], increasing the NADH/NAD+ ratio and oxygen uptake [12], and decreasing the competing carotenoid synthesis [17]. The natural CoQ8 producer E. coli was engineered by the deletion of octaprenyl diphosphate synthase, encoded by ispB, and expression of a heterologous decaprenyl diphosphate synthase from Paracoccus denitrificans, encoded by ddsA, to produce a CoQ10 content of around 0.43 mg g−1 cell dry weight (CDW) under optimized cultivation conditions [18].
Recently, we metabolically engineered Corynebacterium glutamicum, a Gram-positive bacterium that solely possesses dihydromenaquinone (MK(H2)) and menaquinone (MK) [19], for the biosynthesis of CoQ [20]. This was achieved by deletion of the competing carotenoid pathway, establishment of 4-HBA and decaprenyl diphosphate (DPP) biosynthesis, and the heterologous expression of the E. coli CoQ pathway, encoded by ubiADXIBGHEF. This was the first instance of the transfer of CoQ biosynthesis to an organism that does not synthesize CoQ naturally, and it was especially important because C. glutamicum is a microbial host with high biotechnological relevance. Indeed, C. glutamicum is being used for the million-ton scale production of l-lysine and l-glutamate [21] and has been metabolically engineered to produce a variety of amino acids and amino acid-derived compounds such as l-2-hydroxyglutarate [22], l-DOPA [23], N-methylphenylalanine [24], and N-methylanthranilate [25]. Aromatic compounds such as protocatechuate [26] and 4-HBA [27,28] have been produced very efficiently, and C. glutamicum has also been employed for the production of isoprenoids such as patchoulol [29], astaxanthin [30], and α-carotene [31], which makes C. glutamicum a suitable host organism for the production of isoprenoid quinones such as CoQ10. In our recent study, however, limitations were observed in the CoQ10 synthesizing strain UBI413 as several unidentified supposable intermediates and side products, as well as the main product CoQ10, were formed. It was conceivable that UBI413 synthesized CoQ8 and CoQ9 due to endogenous polyprenyl diphosphate synthase activity, putatively encoded by ispB [32]. Moreover, 1,4-dihydroxy-2-naphthoate octaprenyltransferase MenA might accept DPP, resulting in the formation of MK10(H2) and MK10 in addition to native MK9(H2), MK8(H2), and MK9 [19].
In this study, we analyzed and identified the intermediates and side products in UBI413 and developed a strategy to reduce by-product formation and overcome bottlenecks in order to increase the flux towards CoQ10. Two alternative DPP synthases were compared against the DPP synthase from P. denitrificans that has been used previously, and the endogenous polyprenyl diphosphate synthase IspB was replaced with a DPP synthase to reduce the accumulation of 8-, 9- and 11-isoprenologs. The genes ubiJ and ubiK, encoding accessory factors for CoQ biosynthesis [33], were expressed to channel the flux by UbiI-G-H-E-F. In a combined approach, the CoQ10 content of the final strain was 7-fold increased, while the accumulation of intermediates and by-products was considerably reduced. Additionally, CoQ10 was produced using a hydrolysate from a wheat side stream as an alternative feedstock to demonstrate a sustainable production process.

2. Results

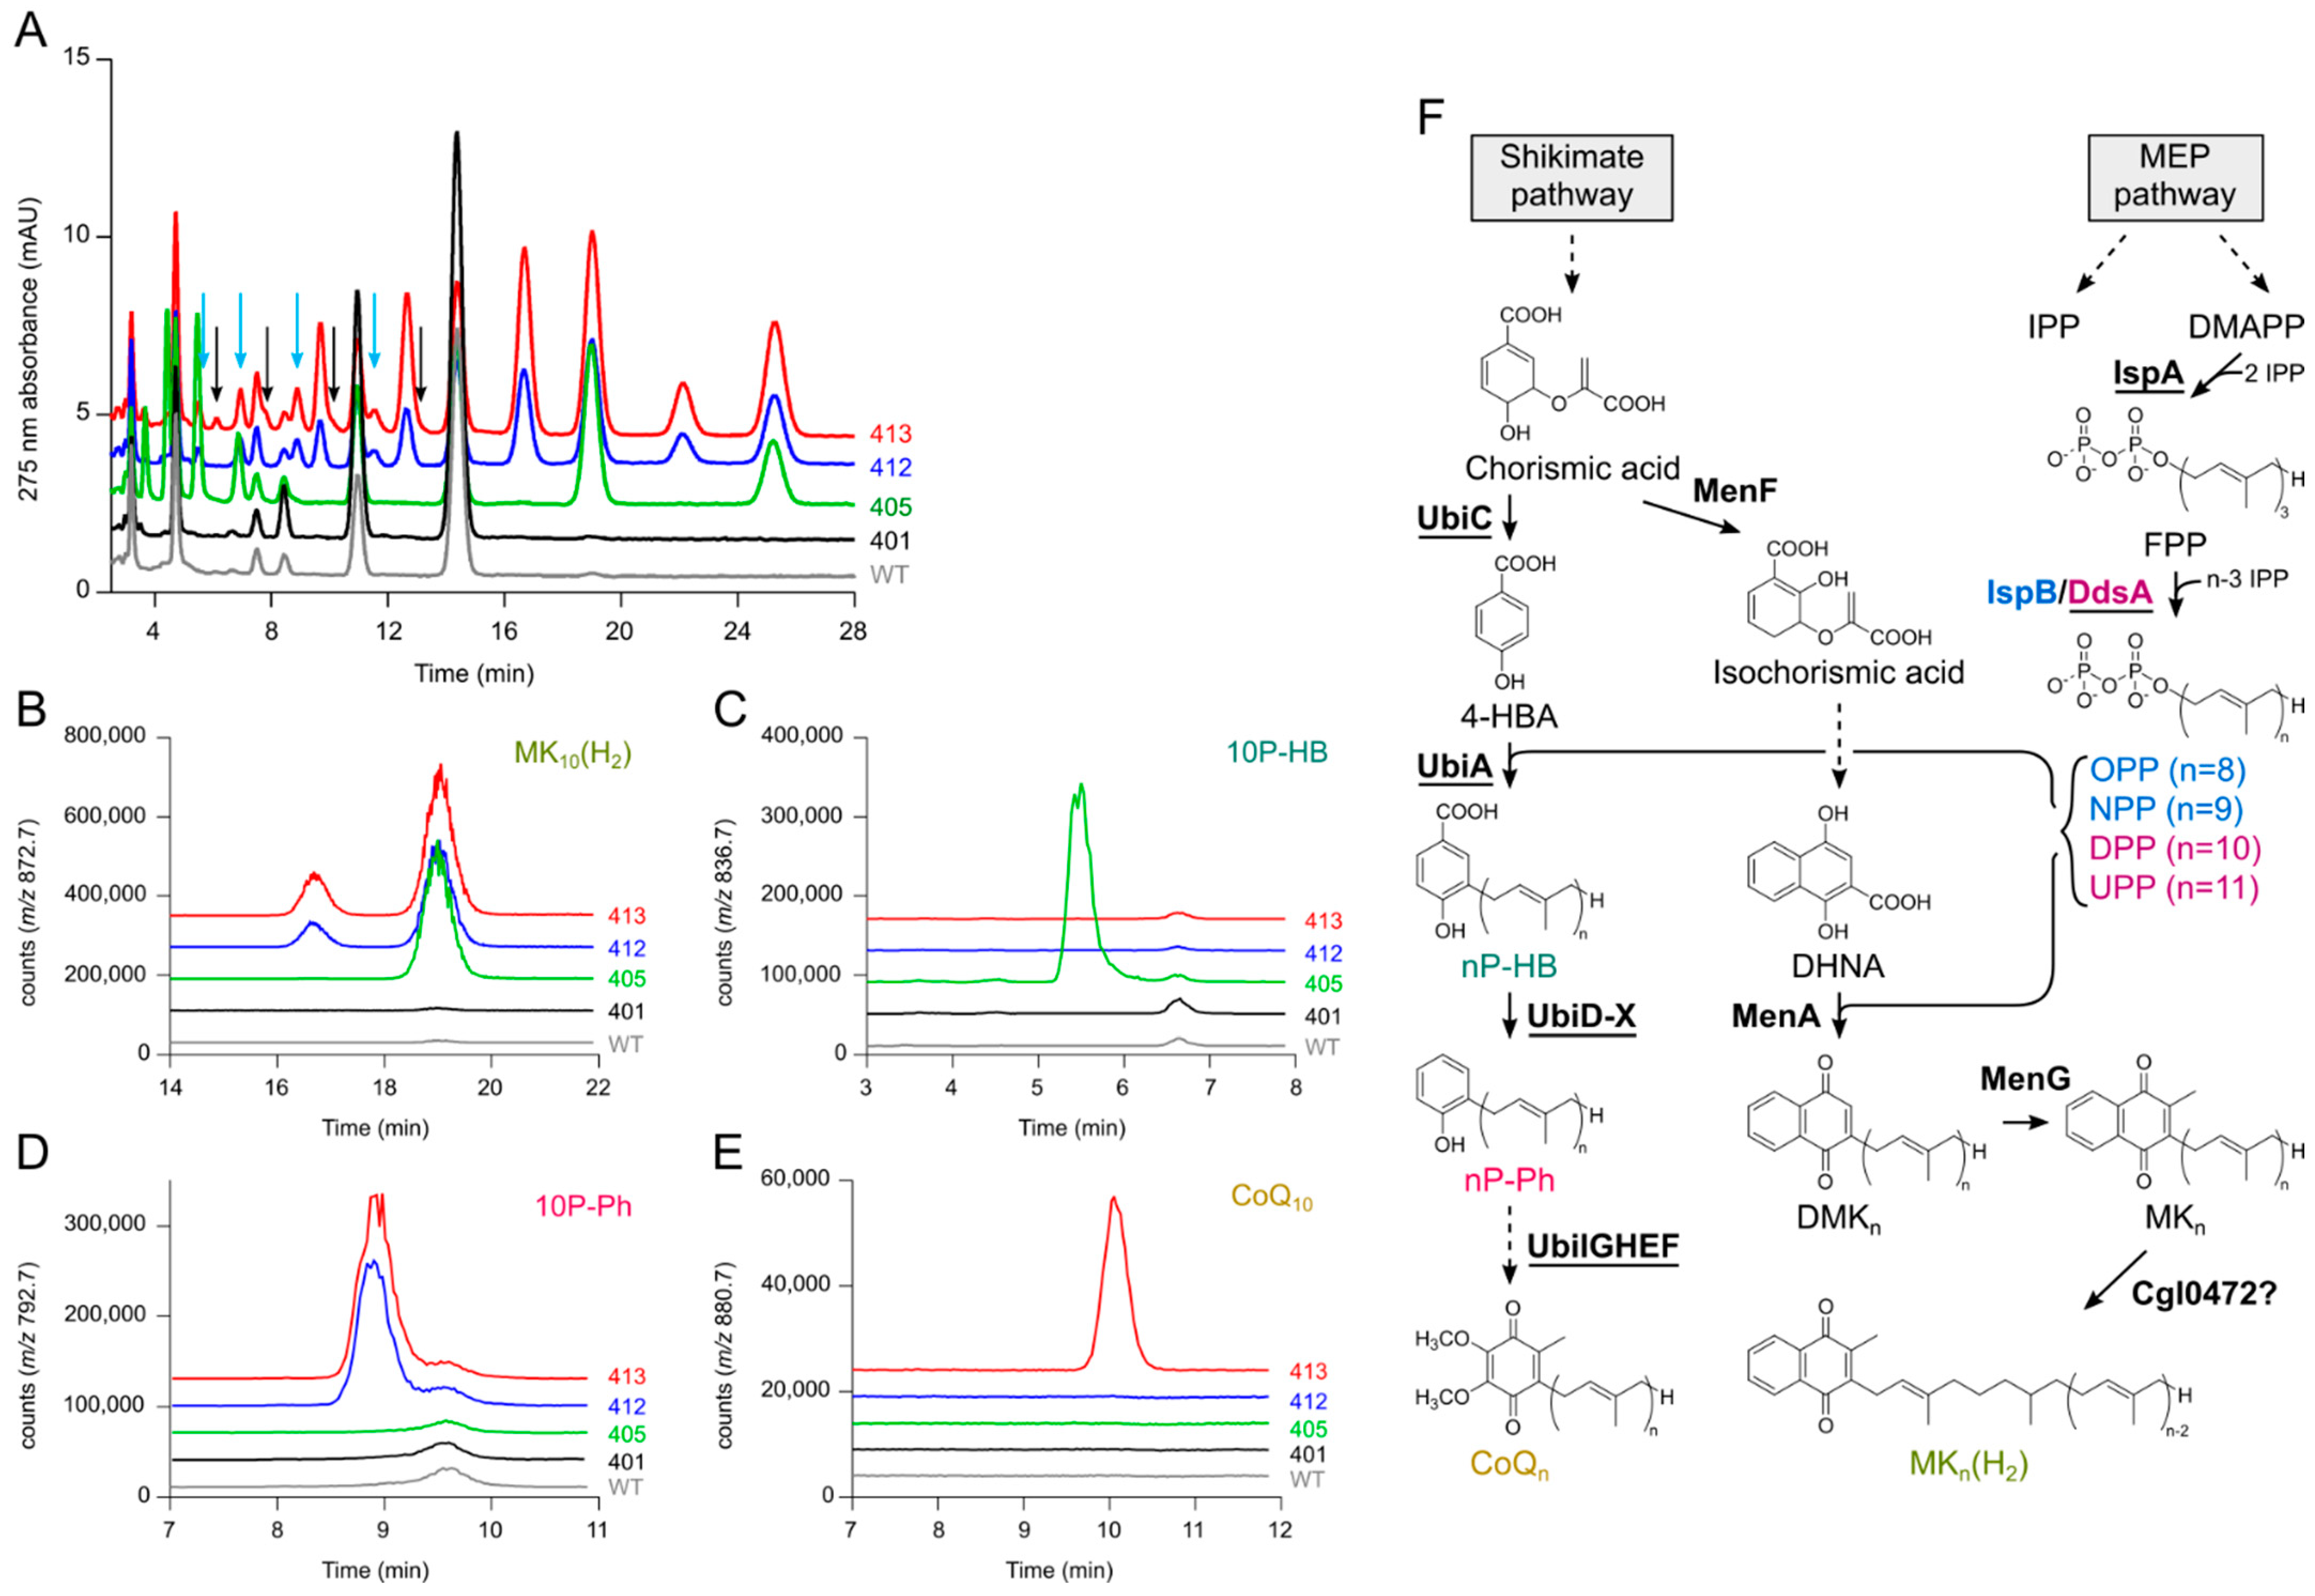
2.1. Identification of Accumulating Compounds in the Parent Strains

The chromatograms of the lipid extracts from strains UBI401, UBI405, UBI412, and UBI413 in our previous publication showed multiple peaks that remained unidentified [20] (Figure 1A). Using LC–MS, we tried to identify these compounds.
First, we suspected that the two main peaks observed in wild type (WT) and UBI401 corresponded to MK8(H2) and MK9(H2), which had previously been described in corynebacteria. The mass spectra of the compounds eluting at 11 and 14.4 min in WT cells showed ions corresponding to H+ and NH4+ adducts of MK8(H2) (m/z = 719.6 and 736.6, Figure S1A) and MK9(H2) (m/z = 787.6 and 804.6, Figure S1B). The UV spectra (not shown) were also characteristic of naphthoquinone species. Single ion monitoring (SIM) of the NH4+ adducts showed that MK8(H2) and MK9(H2) were indeed present in the lipid extracts of all strains, albeit in various amounts (Figure S1C,D).
Strain UBI405 expresses the decaprenyl synthase gene ddsA from P. denitrificans and the ubiA gene from E. coli, which encodes the polyprenyl transferase that prenylates 4-HBA. In comparison to UBI401, UBI405 showed several new peaks, two of them eluting late at 19 and 25.3 min and four others eluting early between 3.5 and 7 min (Figure 1A). The compounds eluting at 19 and 25.3 min displayed UV spectra characteristic of naphthoquinone species (not shown) and their mass spectra showed ions corresponding to H+ and NH4+ adducts of MK10(H2) (m/z = 855.7 and 872.7, Figure S2A) and MK11(H2) (m/z = 923.8 and 940.8, Figure S2B). SIM of the NH4+ adducts showed that MK10(H2) (Figure 1B) and MK11(H2) (Figure S2C) were absent in WT and strain UBI401 but present in the extracts of strains UBI405, UBI412, and UBI413, in agreement with the presence of ddsA in those later strains. These results show that expressing ddsA in C. glutamicum allows the synthesis of unnatural decaprenyl dihydromenaquinone as expected, but they also demonstrate poor specificity of DdsA from P. denitrificans since we also observed undecaprenyl dihydromenaquinone, MK11(H2) (Figure S2B,C). Together, our data show that strains UBI405, UBI412, and UBI413 synthesize four isoprenologs of MK(H2), ranging from MK8(H2) to MK11(H2) (Figures S1 and S2), with MK10(H2) and MK11(H2) being the most abundant in strains UBI412 and UBI413 (Figure S2D). Interestingly, the abundance of MK8(H2) and MK9(H2) increased in strain UBI401 compared to WT (Figure S2D), validating the engineering aimed at increasing FPP supply and flux in the shikimate pathway.
The compounds accumulated in strain UBI405 and eluting at 3.7, 4.5, 5.5, and 7 min showed ions compatible with NH4+ adducts of octaprenyl-4HBA (8P-HB, m/z = 700.5), nonaprenyl-4HBA (9P-HB, m/z = 768.6), decaprenyl-4HBA (10P-HB, m/z = 836.7), and undecaprenyl-4HBA (11P-HB m/z = 904.8) (Figure S3A–D). SIM revealed that these four compounds were detectable only in strain UBI405 (Figure 1C and Figure S3E–G), with isoprenologs 9 and 10 being the most abundant.
Strains UBI412 and UBI413 showed several new peaks compared to the other strains (Figure 1A) and LC–MS analysis identified two series of compounds: polyprenylphenols (nP-Ph) eluting between 5 and 12 min and menaquinones 8–11 (MK8–11) eluting between 9.5 and 23 min (Figures S4 and S5). We detected NH4+ adducts of polyprenylphenol composed of 9, 10, and 11 isoprene units at 7, 8.9, and 11.5 min, respectively (Figure S4A–C). The corresponding SIM showed the presence of these molecules only in strains UBI412 and UBI413 (Figure 1C and Figure S4D,E), consistent with the expression of UbiD and UbiX, allowing for decarboxylation of nP-HB from strain UBI405 into nP-Ph. We could not obtain an unambiguous detection of octaprenylphenol (8P-Ph, m/z = 656.5) because a co-eluting compound at 5.5 min exhibited a prominent signal at m/z = 654.6 (data not shown).
The compounds eluting at 9.7, 12.7, 16.5, and 22.2 min in strains UBI412 and UBI413 corresponded to fully unsaturated menaquinones 8–11 with mass spectra displaying characteristic H+ and NH4+ adducts (Figure S5).
Finally, strain UBI413 that expresses all the enzymes of the CoQ pathway was shown to produce CoQ10 (in agreement with our previous results [20], Figure 1E) and also CoQ8, CoQ9, and CoQ11 (Figure S6). It is worth noting that the peaks corresponding to CoQ8-11 were barely detectable in the 275 nm absorbance chromatogram (black arrows on Figure 1A), whereas those corresponding to nP-Ph were more prominent (blue arrows on Figure 1A). Since the molar absorption coefficient of 8P-Ph is about five-fold lower than that of CoQ8 [34], 8-11P-Ph are certainly more abundant than the corresponding CoQ8–11 in strain UBI413, denoting that the late steps of the CoQ pathway do not function optimally in strain UBI413.
In conclusion, we have now assigned all the peaks displayed in the 275 nm chromatograms of the lipid extracts of the strains previously published. These results suggested to us several options to increase CoQ10 biosynthesis in C. glutamicum, namely, (i) favor the accumulation of decaprenyl compounds over those with chains composed of 8, 9, or 11 prenyl units (ia—deletion of endogenous ispB, ib—screen for ddsA with higher specificity) and (ii) increase the overall efficiency of the CoQ pathway by expression of “accessory proteins”.

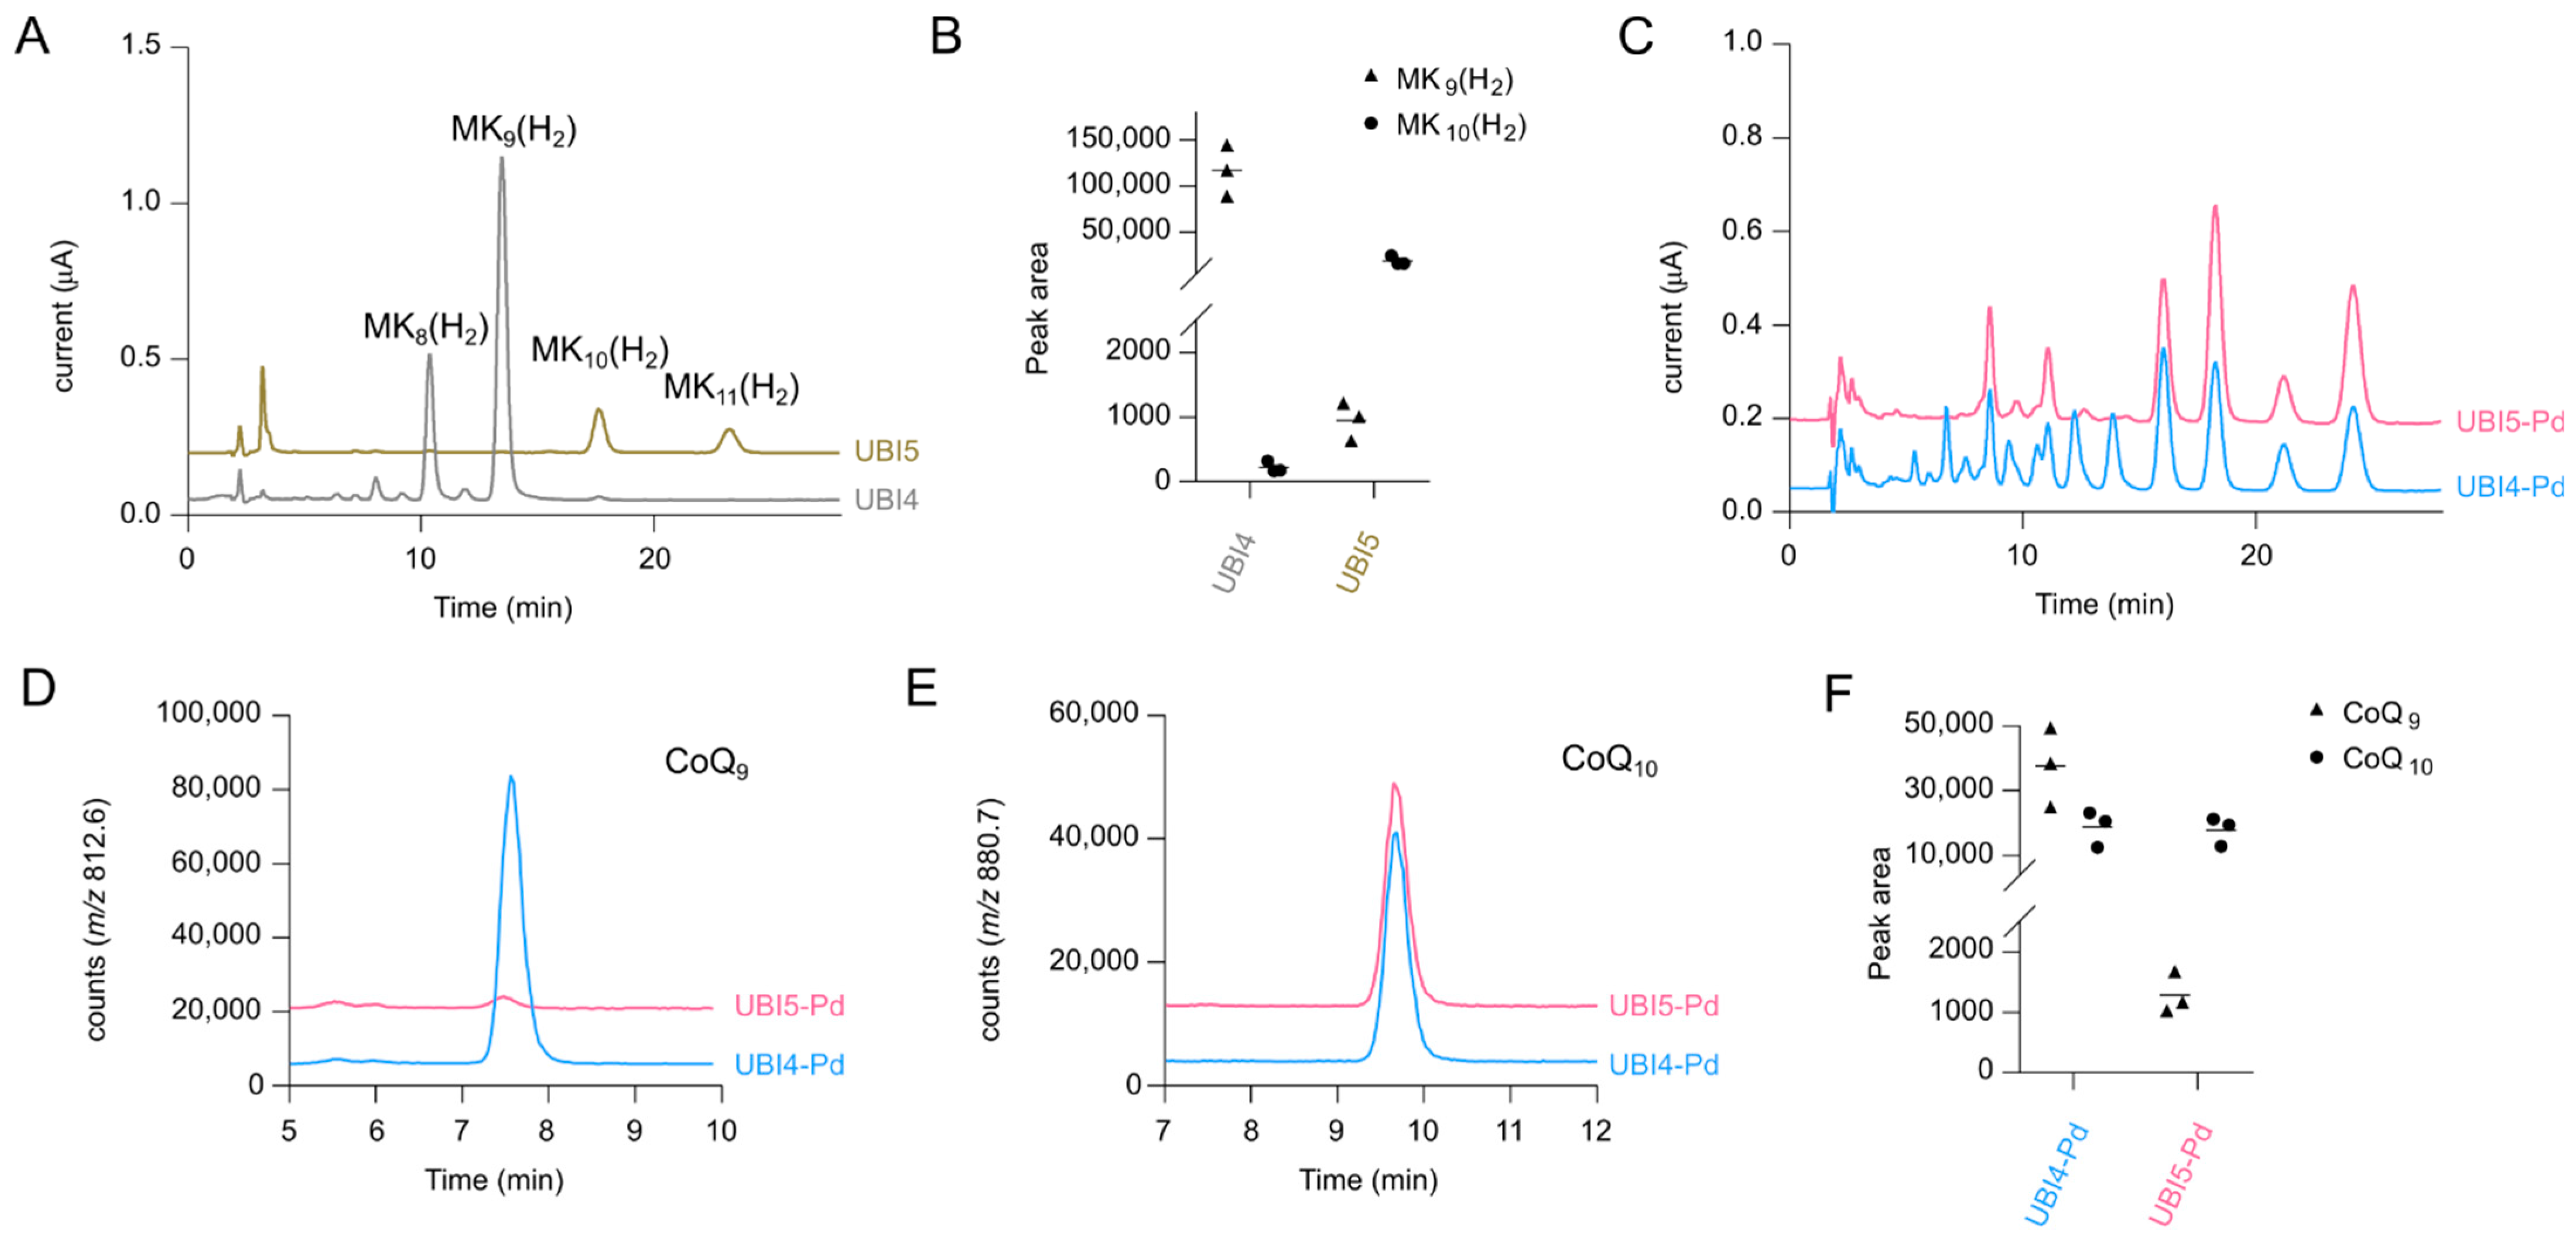
2.2. Deletion of ispB Diminishes Formation of 8- and 9-Isoprenologs

Due to native polyprenyl diphosphate synthase activity in C. glutamicum, presumably encoded by ispB [32], isoprenologs with a chain length of eight and nine prenyl units appeared in all quinone extracts in addition to the desired 10-isoprenologs (Figure 1F). When deletion of ispB was previously attempted in C. glutamicum, it remained unsuccessful as it is likely essential for menaquinone biosynthesis [32]. Here, we performed deletion of ispB with simultaneous replacement by ddsA from P. denitrificans in the strain UBI4, which was successful, yielding the viable strain UBI5. This strain and its isogenic parent strain were grown by microcultivation and examined for quinone content.
As the ECD chromatograms of UBI4 and UBI5 quinone extracts revealed, the latter strain synthesized no MK8(H2) and MK9(H2) at all and instead, to a much lesser extent, MK10(H2) and MK11(H2) were detected (Figure 2A,B), which serves as an indirect proof that IspB catalyzes octa- and nonaprenyl diphosphate formation in C. glutamicum. The MK11(H2) accumulation was a result of DdsA from P. denitrificans being unspecific regarding polyprenyl diphosphate synthesis activity, as observed previously in strain UBI413 (Figure S2C). Since menaquinone has vital functions in the cell, the influence of these drastic changes on growth behavior was monitored. Surprisingly, no significant difference in growth between both strains was observed in glucose minimal medium as the growth curves almost resembled the growth curve of the WT (Figure S7). Hence, in the next step, both strains were transformed with the plasmids necessary for CoQ10 production, pRG_Duet2-ddsAPd-ubiA, pEC-XT99A-ubiDIBX, and pEKEx3-ubiGHEF, resulting in the strains UBI4-Pd (=UBI413) and UBI5-Pd, followed by cultivation in shake flasks and quinone extract analysis.
As can be seen from the ECD chromatograms from extracts of UBI4-Pd and UBI5-Pd, fewer peaks appeared for UBI5-Pd (Figure 2C). SIM chromatograms of NH4+ adducts display that the missing peaks comprised, i.a., CoQ9 (m/z = 812.6, Figure 2D), CoQ8 (m/z = 744.5, Figure S8A), and MK9(H2) (m/z = 804.6, Figure S8C) as expected. However, levels of CoQ10 (m/z = 880.7, Figure 2E,F), CoQ11 (m/z = 948.8, Figure S8B), and MK10(H2) (m/z = 872.7, Figure S8D) remained unchanged between the strains. Overall, the replacement of ispB with ddsA abolished the synthesis of unwanted 8- and 9-isoprenologs without any impact on cells’ growth, but it did not increase CoQ10 production.

2.3. Screening of Different Decaprenyl Diphosphate Synthases

The expression of ddsA from P. denitrificans led to the formation of undesired 11-isoprenologs; thus, two other ddsA genes from A. tumefaciens and R. sphaeroides were screened for their by-product formation as these bacteria are among the best and most relevant CoQ10 production hosts [35,36]. The three genes were expressed in separate strains from the plasmids pRG_Duet2-ddsAPd-ubiA, pRG_Duet2-ddsAAt-ubiA, and pRG_Duet2-ddsARs-ubiA, together with those coding for the late CoQ pathway proteins, resulting in the strains UBI4-Pd, UBI4-At, and UBI4-Rs. The strains were cultivated in shake flasks and analyzed for their quinone content.
To estimate the differences in the formation of isoprenologs with different side chain lengths, ratios of peak areas from mass spectrometry analysis were calculated for several compounds (Table 1). The CoQ10/CoQ11 ratio was close to 1 in UBI4-Pd, revealing that DdsA from P. denitrificans is rather unspecific regarding polyprenyl diphosphate synthesis activity. On the other hand, extracts of UBI4-At contained almost no CoQ11 at all, resulting in a ratio of 145.4 ± 12.4. UBI4-Rs had a comparatively lower CoQ10/CoQ11 ratio of 7.6 ± 0.05, but a higher CoQ10/CoQ9 ratio than the other strains, which indicates that DdsA from R. sphaeroides synthesizes less nonaprenyl diphosphate as a side product than the other DdsA enzymes. This also reflected in the ratio of the intermediate prenylphenols 10P-Ph/9P-Ph (Table 1). The production of CoQ10 was not significantly improved, which might be due to a metabolic bottleneck downstream of the DdsA reaction. The results demonstrate that although all three DdsAs perform the same reaction, they differ in their precision to elongate FPP by a fixed number of seven IPP units. By this metric, DdsA enzymes of A. tumefaciens and R. sphaeroides are superior to that of P. denitrificans.

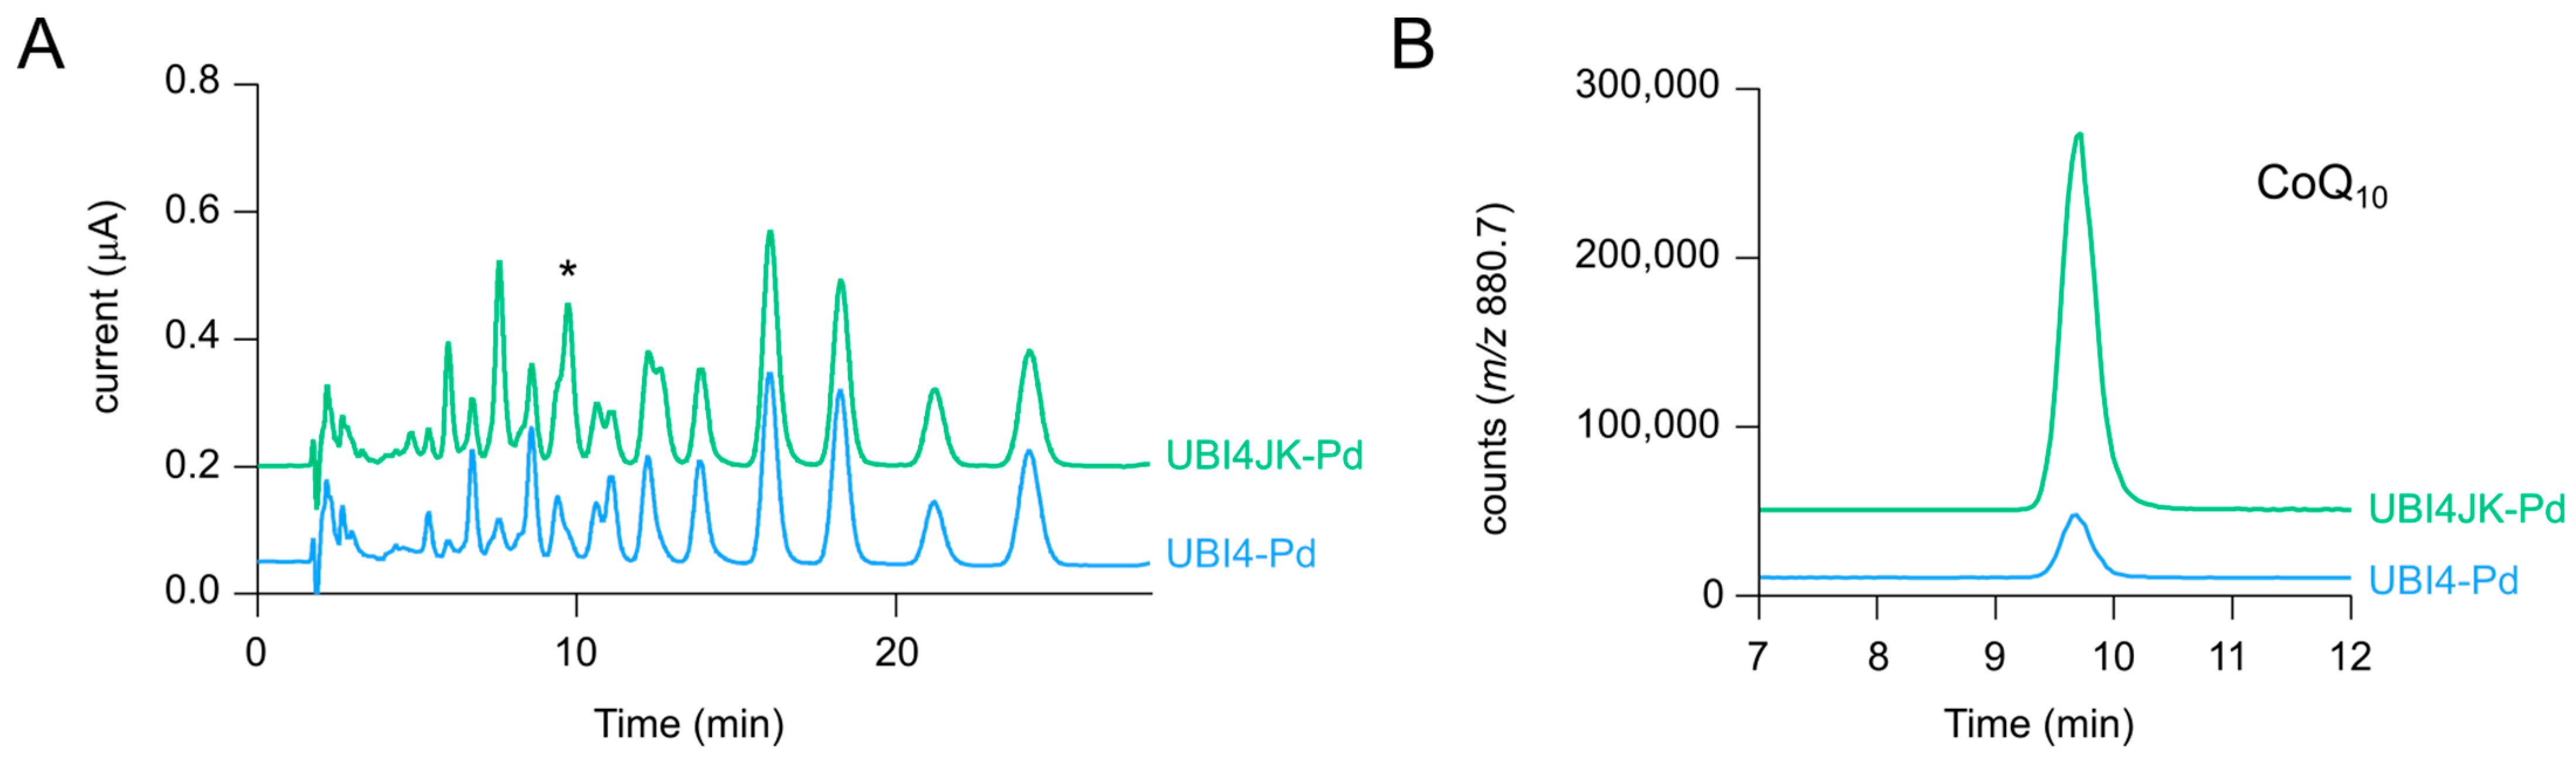
2.4. Expression of ubiJK Alleviates a Major Bottleneck

As recently shown, the E. coli enzymes UbiI-G-H-E-F, that catalyze the steps from prenylphenol to CoQ, form a soluble multiprotein complex with the accessory factors UbiJ and UbiK [33,37]. To find out if this complex might form in a heterologous environment, C. glutamicum in this case, and improve the flux in the late CoQ pathway, the genes ubiJ and ubiK from E. coli were integrated into the genome of UBI4 under control of the strong promoter of actA [38], yielding strain UBI4JK. Equipped with the necessary plasmids for CoQ10 biosynthesis (pRG_Duet2-ddsAPd-ubiA, pEC-XT99A-ubiDIBX, and pEKEx3-ubiGHEF), quinones of the strains UBI4-Pd and UBI4JK-Pd were extracted after shake flask cultivation and subjected to LC–MS analysis as described above.
Regarding growth of the strains UBI4 and UBI4JK without plasmids, no comparative experiment was performed; hence, the direct influence of ubiJK expression on growth was not evaluated. For strains UBI4-Pd and UBI4JK-Pd, however, no significant difference in growth rate or final biomass formation was observed (data not shown). The CoQ10/10P-Ph ratio, although not reflecting the stoichiometry of the two molecules, can serve as an indicator for the flux efficiency between the early pathway intermediate 10P-Ph and the final product CoQ10 (Table 2). While in UBI4-Pd the ratio was 0.3 ± 0.1, indicating a rather low flux, expression of ubiJK in UBI4JK-Pd increased the ratio in favor of CoQ10 production (1.5 ± 0.2). Consequently, the biomass yield, titer, and volumetric productivity increased around four-fold (Table 2). The improved CoQ10 production was also well visible in the ECD chromatograms where the peak corresponding to CoQ10 increased in the extract of UBI4JK-Pd (Figure 3A). The SIM chromatograms for the NH4+ adduct of CoQ10 underline the difference more clearly (Figure 3B). The increased flux in the late CoQ pathway also reflected in increased CoQ8 and CoQ9 levels (Figure S9A,B), while MK9(H2) and MK10(H2) levels remained almost unchanged (Figure S9C,D). In line with results showing that E. coli ubiJ and ubiK mutants contain no or a reduced amount of CoQ8 [33,39], our data demonstrate that the expression of ubiJK from E. coli is also important for efficient CoQ production in a heterologous host such as C. glutamicum.

2.5. Combinatorial Approach for Maximized CoQ10 Production

To study the combined effect of ispB replacement and ubiJK expression, the ΔispB::Ptuf-ddsA replacement was performed in UBI4JK, resulting in the strain UBI6. It was transformed with the plasmids pRG_Duet2-ddsAPd-ubiA, pEC-XT99A-ubiDIBX, and pEKEx3-ubiGHEF, resulting in strain UBI6-Pd, followed by shake flask cultivation and LC–MS analysis of extracts. Compared to UBI4JK-Pd, the additional ΔispB::Ptuf-ddsA replacement had no significant effect on CoQ10 content, titer or volumetric productivity (Table 2). However, as observed for UBI5-Pd, CoQ8, CoQ9, and MK9(H2) amounts decreased severely (data not shown), which reflected in a CoQ10/CoQ9 ratio of 38.6 ± 1.9, even higher than for UBI5-Pd (14.4 ± 5.5). The deletion of endogenous ispB and the expression of ubiJK significantly improved the CoQ10 production and reduced the accumulation of side products in UBI6-Pd when compared to the initial strain UBI4-Pd.
We have shown that DdsA from A. tumefaciens and R. sphaeroides are more specific than DdsA from P. denitrificans towards the formation of 10P-HB compared to 9P-HB and 11P-HB (Table 1). In a final combinatorial approach, strains UBI6-At and UBI6-Rs were constructed for additive benefits and compared to UBI6-Pd. As observed previously, the strains with ddsA from A. tumefaciens and R. sphaeroides had an improved CoQ10/CoQ11 ratio of around 3.5 (Table 3). However, the ratio was not as high as for the strains UBI4-At and UBI4-Rs (Table 1), likely because of the chromosomal expression of the additional ddsA from P. denitrificans inserted in the ΔispB locus. Regarding the CoQ10/CoQ9 ratio, UBI6-Pd and UBI6-Rs surprisingly shared a high ratio of around 40 compared to only 5.1 ± 0.4 for UBI6-At (Table 3). This indicates that the chromosomal expression of ddsA from P. denitrificans had less influence on CoQ9 production than on CoQ11 production. CoQ10 content, titer, and volumetric productivity were all twice as high in UBI6-Rs as for the other strains with values of 126.9 ± 10.7 µg g−1 CDW, 1.21 ± 0.12 mg L−1, and 16.8 ± 1.7 µg L−1 h−1, respectively. The CoQ10/10P-Ph ratio of UBI6-Rs was 60% higher than for the other two strains. The relative peak areas for 10P-Ph (Figure S10) were in a similar range for all of them despite the higher CoQ10 content of UBI6-Rs, indicating a pull effect for the intermediate 10P-Ph. This would be favorable if the flux from 10P-Ph to CoQ10 was further optimized in future strain engineering. To visualize the difference caused by the combinatorial approach, the ECD chromatograms and SIM chromatograms for the NH4+ adduct of CoQ10 are displayed in Figure 4. Compared to the initial strain UBI4-Pd, UBI6-Rs extracts contain much fewer and/or lower peaks, while the peak for CoQ10 has become the most prominent one. Nevertheless, the ECD chromatograms also show that MK10 and MK10(H2), eluting at 16.5 and 19 min, accumulated to considerable amounts as well. While the CoQ10 productivity reached here is still not competitive with productivity in native hosts such as R. sphaeroides [36], we provided a rational metabolic engineering approach in a non-native host, resulting in significantly higher CoQ10 production and lower by-product formation.

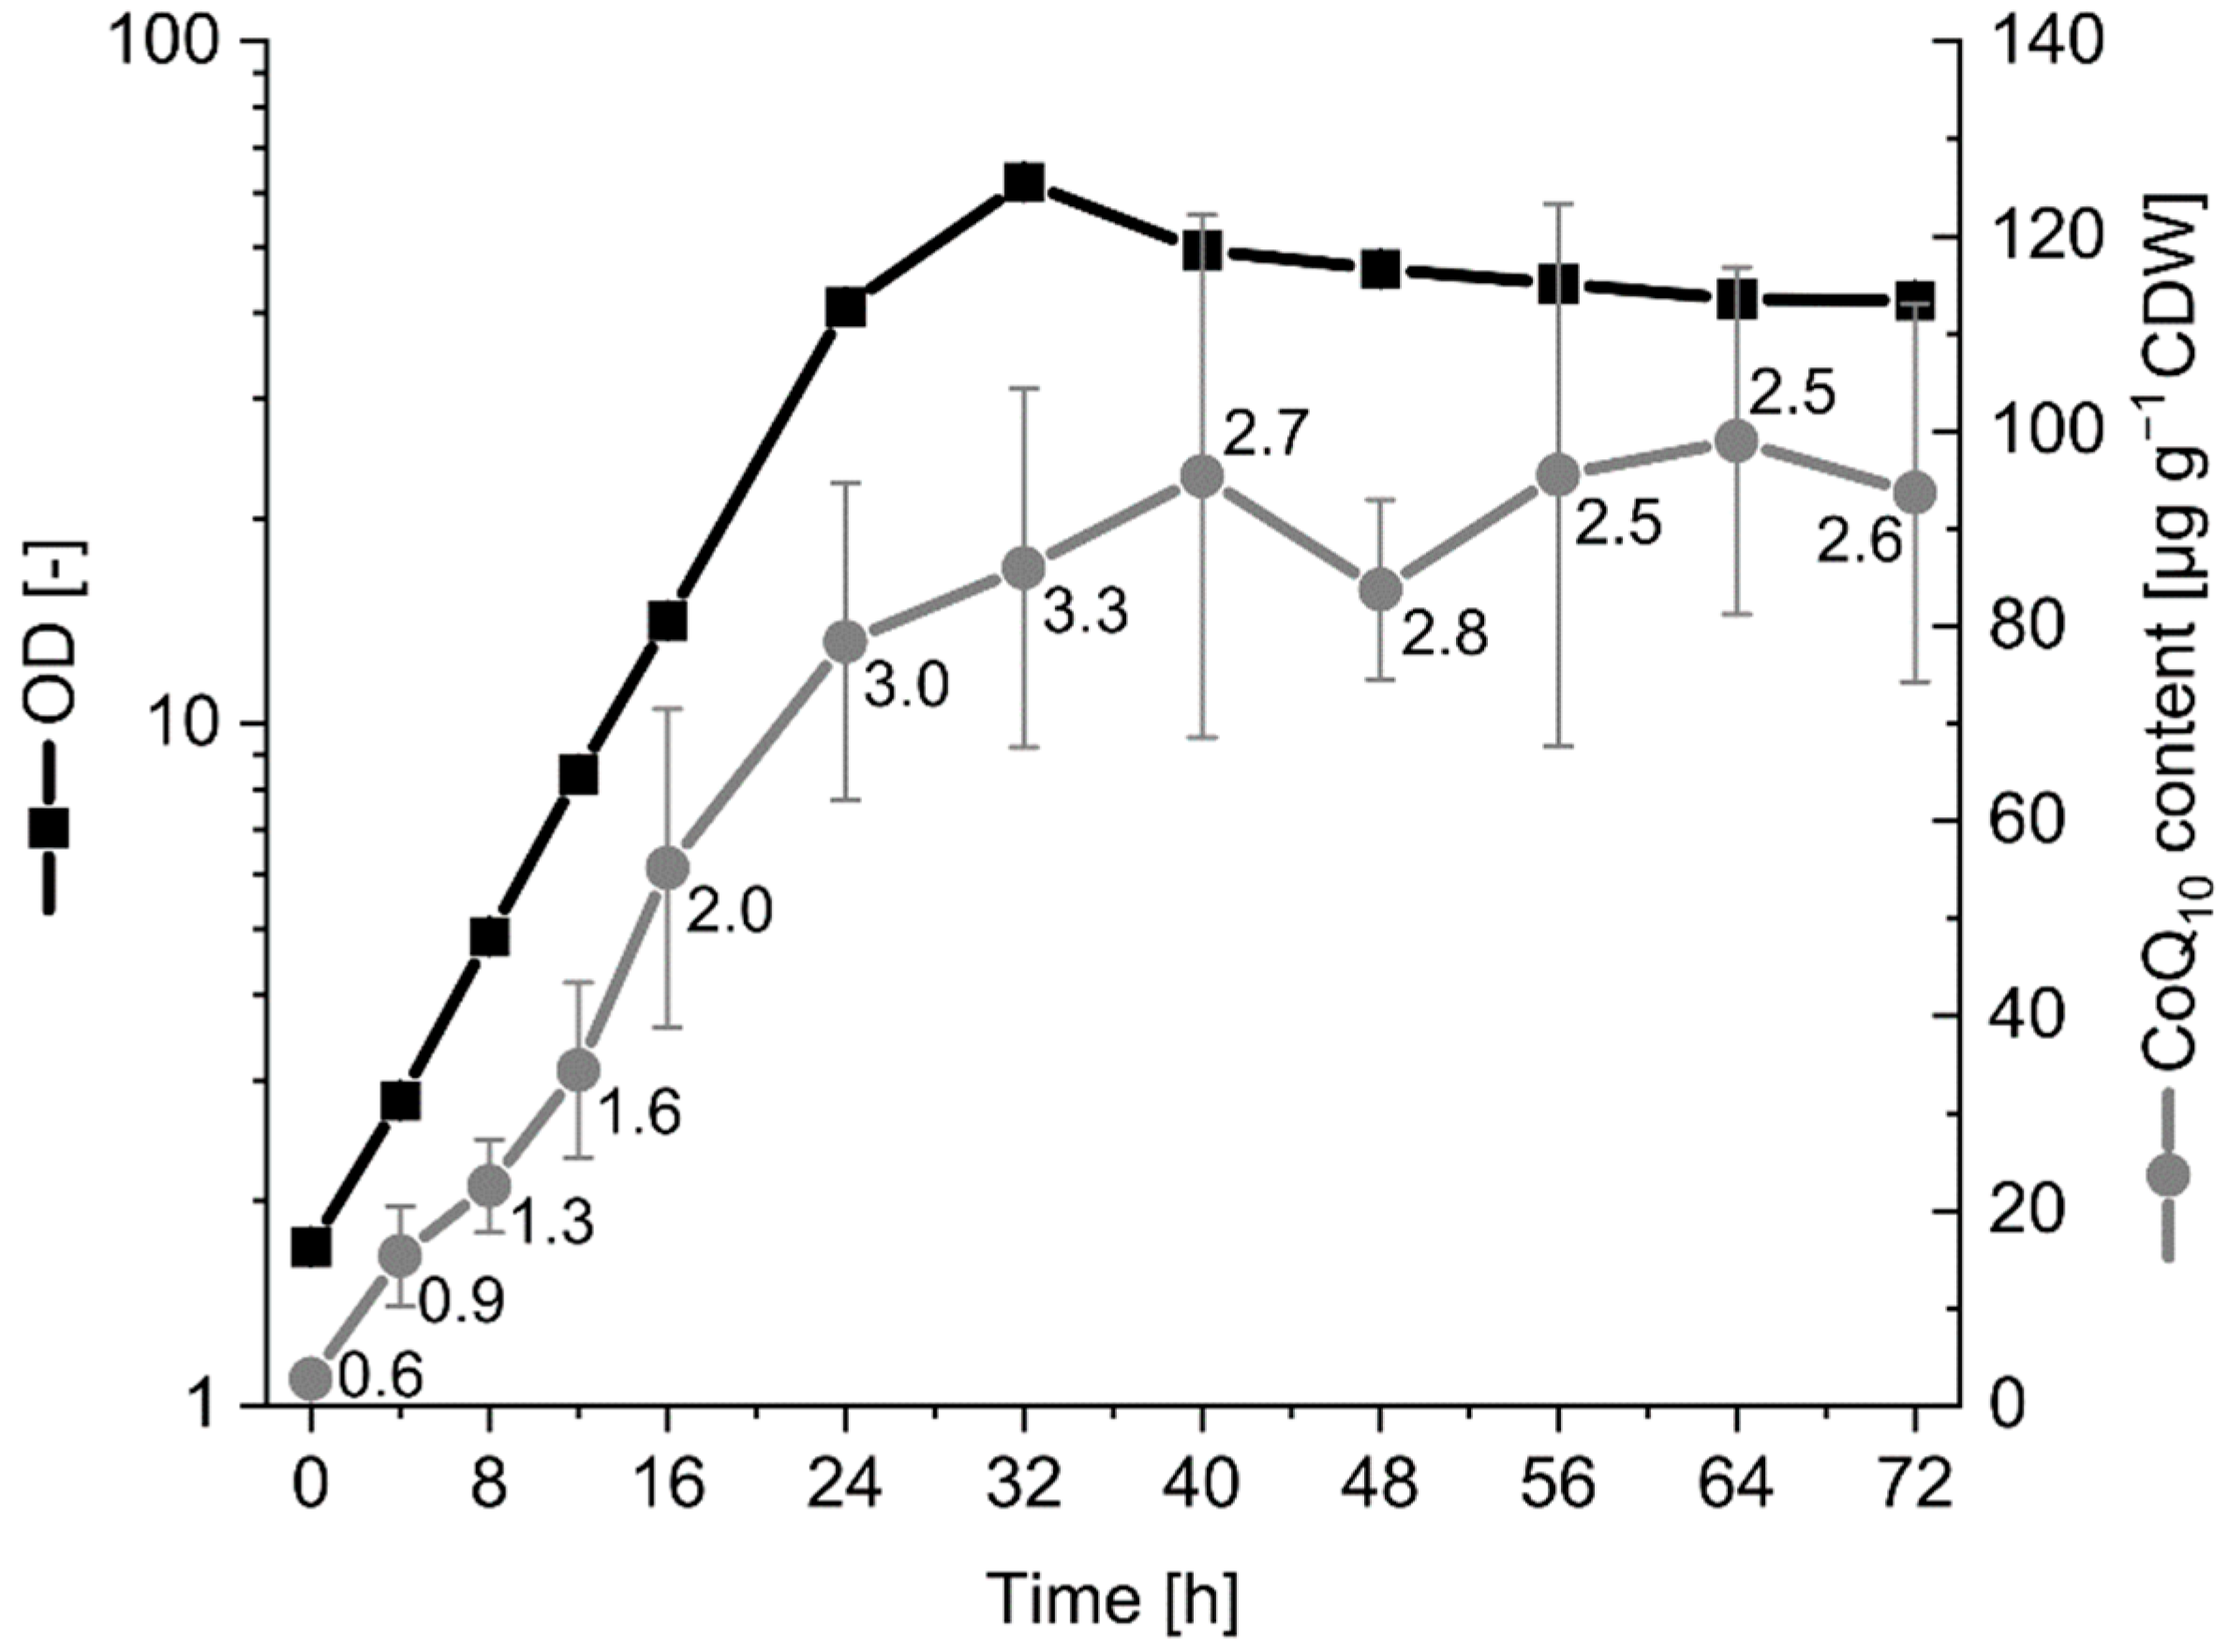
2.6. Influence of Growth Phase and Medium on CoQ10 Production

The best strain, UBI6-Rs, was cultivated for a time-resolved analysis of CoQ10 production (Figure 5). The cells grew with a specific growth rate of 0.13 h−1 in the first 24 h and the biomass reached its peak at 32 h with an optical density at 600 nm (OD600) of 62 (15.5 g L−1 CDW). The kinetics of growth and CoQ10 production largely overlapped with the CoQ10 content reaching 95 µg g−1 CDW after 40 h and remaining around that level until the end of cultivation. Notably, the CoQ10/CoQ11 ratio was rather low at the beginning with 0.6 but increased steadily during exponential growth to a maximum of 3.3 at 32 h (Figure 5). The strain UBI6-Rs carries the ddsA gene from P. denitrificans that is expressed constitutively in the ispB locus, and the ddsA gene from R. sphaeroides, expressed from the vector pRG_Duet2 upon induction by isopropyl-β-d-1-thiogalactopyranoside (IPTG) at the beginning of the cultivation. As shown before, expression of ddsA from R. sphaeroides promotes higher CoQ10 production with lower accumulation of CoQ11 than ddsA from P. denitrificans, which explains the low CoQ10/CoQ11 ratio at the beginning and its increase over time.
After CoQ10 production was successfully improved, the strain UBI6-Rs was cultivated with a hydrolysate of the alternative feedstock wheat side stream concentrate (WSCH) [40]. In a sustainable circular economy, side streams of industrial production processes can provide excellent alternative feedstocks for microbial production containing macro- and micronutrients [41]. Here, WSCH was supplemented with the nitrogen source ammonium sulfate and the buffer 3-(N-morpholino) propanesulfonic acid (MOPS) for cultivation of UBI6-Rs in a microcultivation system, CGXII minimal medium was used for comparison. LC–MS analysis confirmed that the CoQ10 concentration in WSCH medium before cultivation was below the detection limit of 1 nM. In the microcultivation system used for this comparison, the CoQ10 content, titer, and volumetric productivity in CGXII minimal medium were lower than in shake flasks (Table 3). The CoQ10 content obtained in microcultivation with WSCH medium was about 40% of that in microcultivation with CGXII medium (Table 3). As microcultivation with WSCH medium supported growth to a higher biomass concentration, the titer and volumetric productivity were about 55% of the values obtained in microcultivation with CGXII medium (Table 3). Moreover, by-product and intermediate formation in WSCH were mostly lower compared to CGXII medium as indicated by the CoQ10/CoQ11 and CoQ10/10P-Ph ratios (Table 3).
To conclude, although C. glutamicum is not a natural producer of any ubiquinone, we were able to identify metabolic bottlenecks in the initial metabolically engineered producer UBI4-Pd and to optimize the strain for seven-fold increased CoQ10 content and eight-fold increased CoQ10 titer with considerably lower by-product formation.

3. Discussion

The biosynthesis of CoQ is complex and has not been fully elucidated after 60 years of research, making its transfer to an organism without CoQ biosynthesis challenging. Previously, we set the foundation for heterologous CoQ10 production in C. glutamicum by expression of genes, fulfilling the minimum requirements for CoQ biosynthesis [20]. In this study, our goal was to identify metabolic bottlenecks by LC–MS analysis and to alleviate them by genetic engineering. The strategy comprised increasing flux by expression of accessory factor genes ubiJ and ubiK, deleting the native polyprenyl diphosphate synthase IspB, and expressing the best decaprenyl diphosphate synthase to concentrate isoprenologs production towards CoQ10.
In E. coli, UbiJ and UbiK induce the formation of a Ubi complex with UbiI-G-H-E-F that catalyzes the reactions of the late CoQ pathway [37]. Here, expression of ubiJK increased CoQ10 production four-fold. It is likely that, although not proven biochemically, this may have led to the formation of a Ubi complex in the heterologous host C. glutamicum. While CoQ10 production was substantially improved, 10P-Ph was still abundant in the strain UBI6-Rs, indicating that flux through the putative Ubi complex did not reach its full potential. One reason might be that the E. coli Ubi proteins we expressed in C. glutamicum are not well suited to modifying CoQ intermediates with a decaprenyl side chain because they naturally operate on compounds with an octaprenyl chain. Therefore, expressing Ubi proteins from a bacterium that naturally produces CoQ10 could improve the flux between 10P-Ph and CoQ10. Another reason might lie in the subunit stoichiometry of the Ubi complex. It has been shown in E. coli that synthesis rates of proteins that belong to a multiprotein complex are proportional to the subunit stoichiometry of their corresponding complexes [42] in order to save cellular resources and to avoid protein aggregation and misfolding [43]. Not only do the synthesis rates of the Ubi complex-associated proteins UbiK-J-I-G-H-E-F differ from each other [42], which is indicative of heterogeneous stoichiometry, but also UbiK and UbiJ were found to associate in a heterotrimeric UbiK2–UbiJ1 complex [33] and several Ubi proteins interacted with themselves [37]. This is in contrast to our cloning strategy in which ubi genes were expressed in artificial polycistronic operons and lacked any regulation, leading to disproportional protein abundances in relation to the Ubi complex stoichiometry. Expression fine-tuning would be a way to change expression levels of the single components of the Ubi complex, e.g., by the use of a promoter library [44], adjustment of transcriptional initiation rates using artificial ribosome binding sites [45], introduction of multiple gene copies into the genome [31,46], or changing the order of genes in the polycistronic operons [47]. In the natural CoQ10 producer R. sphaeroides, metabolic bottlenecks were identified to be UbiE, UbiH, and UbiG. Three different bottleneck elimination strategies were tested, among which fusion of UbiE and UbiG and localization of the fused protein onto the membrane via pufX linker gave the best results with a titer of 108.5 mg L−1 after 96 h of cultivation, a CoQ10 content of 8.9 mg g−1 CDW, and a volumetric productivity of 1.13 mg L−1 h−1 [16]. However, it is questionable if this strategy would be effective in our case due to differences in the molecular mechanism of CoQ biosynthesis between E. coli and R. sphaeroides enzymes. A multienzyme complex has not been confirmed for R. sphaeroides CoQ biosynthesis, and proteins homologous to E. coli UbiI, UbiG, UbiH, UbiE, and UbiF exist in R. sphaeroides, but none to the accessory factors UbiJ and UbiK according to Protein BLAST analysis. It should be mentioned that overexpression of ubiJ and ubiK in E. coli led to decreased CoQ8 content and four-fold and two-fold increases in 8P-Ph and 2-decaprenyl-3-methyl-6-methoxy-1,4-benzoquinol levels, respectively, presumably as a consequence of sequestration of these CoQ8 intermediates [37]. Thus, expression strength of ubiJ and ubiK seems to influence the flux from 10P-Ph to CoQ10 quite dramatically and should be adjusted accordingly.
Moreover, an increase in MK10 and MK10(H2) amounts was observed with expression of ddsA from R. sphaeroides in both background strains UBI4 and UBI6. We propose that Cgl0472 is a menaquinone oxidoreductase that reduces a double bond in the chain of MK, resulting in MK(H2) (Figure 1F), because it shares 51% sequence identity with menaquinone oxidoreductase MenJ from Mycobacterium tuberculosis [48]. The accumulation of fully unsaturated menaquinones might be caused by the inhibition of Cgl0472; however, this requires further investigation. Irrespective of the fact that the growth of C. glutamicum was not influenced by the different chain length of menaquinone, MK10 and MK10(H2) are competing by-products to CoQ10 and should be limited in favor of increased CoQ10 production. In E. coli, the competitive MK biosynthesis was blocked by the deletion of 1,4-dihydroxy-2-naphthoate (DHNA) octaprenyltransferase gene menA, ensuring that octaprenyl diphosphate would only be used to prenylate the CoQ intermediate 4-HBA, which led to increased CoQ8 content by 81% [49] and squalene content by 18% [50]. In C. glutamicum, however, MK is the only natural isoprenoid quinone and therefore vital. The downregulation of menA in C. glutamicum might allow flux into MK biosynthesis to be lowered without impacting growth. Analogously, in R. sphaeroides, the competitive carotenoid biosynthesis was downregulated, resulting in 28% increased CoQ10 production, since the complete disruption of carotenogenesis impaired both growth and CoQ10 production [17]. Nevertheless, it could be challenging to determine the right balance to lower the flux into MK biosynthesis as much as possible while maintaining growth and, thus, CoQ10 productivity. Alternatively, specific MenA inhibitors can be used to reduce MenA activity. Several drugs, among them an allylaminomethanone class of compounds, have been identified to inhibit MenA of Mycobacterium tuberculosis, acting as demethylmenaquinone (DMK) mimics [51,52]. The benefit of this approach is that different inhibitors can be tested and the optimal dose can be found comparatively fast, rendering the need for menA expression fine-tuning superfluous, if the inhibitor is not costly and can be used at a larger scale as well. Furthermore, quorum sensing provides another alternative to plain downregulation of menA. Being able to maintain regular expression of menA in the early growth phase and reducing it with increasing cell density would prevent growth deficits caused by menaquinone deficiency and reduce menaquinone accumulation. Liu et al. adapted the ComQXPA-PsrfA quorum sensing system of Bacillus subtilis to C. glutamicum such that PsrfA-controlled transcription of an hfq-sRNA complementary to a target gene was activated with high cell density, leading to silencing of the target gene by its complementary sRNA. In addition, a library of synthetic PsrfA promoters was established to modulate the expression of the hfq-sRNA [53], allowing for optimized control over menA expression.
In order to improve precursor supply for CoQ10 production, overexpression of the MEP pathway genes dxs and idi is a common way to increase flux towards IPP and DMAPP and has been shown to increase patchoulol production in an engineered C. glutamicum strain [29]. Other strategies aim at the supply and distribution of the molecules of the MEP pathway entry point, glyceraldehyde 3-phosphate and pyruvate [54], e.g., by the modification of central carbon metabolism [55], CRISPRi-mediated repression [56], and increase in the NAD(P)H pool [57]. A different kind of approach is membrane engineering that involves the expression of proteins with membrane-bending properties and the overall increase in membrane synthesis to expand the membrane surface area and storage capacity for CoQ10. In E. coli, the monoglucosyldiacylglycerol synthase Almgs was overexpressed to induce the formation of membrane stacks or tubules and intracellular membrane vesicles, and the genes plsB and plsC were overexpressed to increase glycerophospholipid biosynthesis, which synergistically increased β-carotene production 2.9-fold [58]. However, media composition and cultivation conditions are potent factors as well and should be considered to improve productivity. For CoQ10 production, strategies such as controlling a low sucrose concentration during fed-batch fermentation of A. tumefaciens [59] or the cultivation of R. sphaeroides under phosphate limitation [60] proved to be very effective. In this study, the standard minimal medium CGXII for C. glutamicum [19] was used. Since it was designed for the production of amino acids, it contains a high concentration of nitrogen that should be tuned down in case of production of the nitrogen-free CoQ10. The reduction of nitrogen to 10% and of glucose to 50% increased the production of N-methylphenylalanine by C. glutamicum and reduced by-product formation [24]. As there are numerous CGXII components, and macro and trace elements, statistical methods such as response surface methodology help to find optimized conditions by using the proper design of experiments as was demonstrated for glutamate production in C. glutamicum [61]. Media optimization can also be employed to generate high cell densities in cultures, which is especially interesting for cell-bound products such as CoQ10. In a recent study, lignocellulose-derived acetate was utilized as a sole carbon source and as acid pH titrant, while urea was fed as a nitrogen source. By dynamical adaptation of the C/N feeding ratio, a maximal cell dry weight of 80.2 g L−1 was achieved [62].
With respect to alternative feedstocks that are not competitive with food or feed, C. glutamicum has been employed and engineered for many different substrates. Here, we demonstrated the successful production of CoQ10 from a wheat side stream-based hydrolysate that has been utilized previously for the production of 5-aminovalerate [40] and l-2-hydroxyglutarate [22]. As well as the wheat side stream, access to numerous monomeric and polymeric carbon sources has been established, e.g., xylose, arabinose, mannose, starch, lignocellulose, N-acetylglucosamine, and alginate, which can be derived from hydrolysates of sustainable second generation feedstocks such as spent sulfite liquor, Miscanthus biomass, brown seaweed, corn straw, rice straw, and shrimp waste [63,64,65,66].
Taken together, we demonstrated how CoQ10 production can be established in the non-ubiquinone containing organism C. glutamicum and optimized substantially by applying current knowledge about CoQ biosynthesis to establish its efficient production. Although the achieved CoQ10 content is not yet competitive with natural producers such as R. sphaeroides, our strain holds the potential for further improvements with regards to metabolic engineering, media and cultivation conditions, and cell density. Its well-established genetic tools, systems metabolic engineering, and insights into sustainable production processes make C. glutamicum an attractive organism for the production of high value-added compounds such as CoQ10.

4. Materials and Methods

4.1. Bacterial Strains and Growth Conditions

All bacterial strains used in this study are listed in Table 4. E. coli DH5α [67] was used for plasmid construction, E. coli S17-1 [68] was used for transfer of suicide vectors by trans-conjugation prior to chromosomal gene replacements, C. glutamicum UBI4 [20] was used for strain construction. Pre-cultures of E. coli and C. glutamicum were inoculated from fresh LB or BHI agar plates and cultivated in lysogeny broth (LB) and brain heart infusion (BHI) medium at 37 °C and 30 °C in non-baffled and baffled shake flasks on a rotary shaker at 180 rpm and 120 rpm, respectively. When appropriate, kanamycin (25 µg mL−1), spectinomycin (100 µg mL−1), and tetracycline (5 µg mL−1) were added to the media and plates. For production experiments, C. glutamicum cells from pre-cultures were washed with TN buffer pH 6.3 (10 mM Tris-HCl, 150 mM NaCl) and inoculated to an OD600 of 1 in 50 mL CGXII minimal medium [19] in 500 mL shake flasks. When specified, cultivations were performed in a BioLector microcultivation system (m2p-labs, Baesweiler, Germany) in 3.2 mL FlowerPlates at 1100 rpm and 30 °C and with filling volumes of 1 mL. The minimal medium was supplemented with 40 g L−1 glucose as sole carbon source, 1 mM IPTG to induce gene expression of ddsA from pRG_Duet2 [69] and all genes from pEC-XT99A [70] and pEKEx3 [71], 0.25 µg mL−1 anhydrotetracycline (ATc) to induce gene expression of ubiA from pRG_Duet2, and respective antibiotics. For cultivation in WSCH medium, 80% (v/v) hydrolysate (from 190 g L−1 WSC, [40]) was supplemented with inducers and antibiotics as described above, 20 g L−1 ammonium sulfate and 42 g L−1 MOPS to a final glucose concentration of 33.2 g L−1. OD600 was measured using a V-1200 spectrophotometer (VWR, Radnor, PA, United States). After 72 h, cells were harvested and stored at −20 °C.

4.2. Molecular Genetic Techniques and Strain Construction

Standard molecular genetic techniques were performed as described [72]. Competent E. coli cells were prepared with the RbCl method and transformed by heat shock [72]. Competent C. glutamicum cells were prepared in NCM medium, with the exception of dl-threonine, according to an optimized transformation protocol [73]. Cells were transformed using electroporation at 2.5 kV, 200 Ω, and 25 µF. PCR amplification was performed with Phusion High-Fidelity DNA polymerase according to the manufacturer (New England Biolabs, Hitchin, UK). All plasmids are listed in Table 5 and were constructed via Gibson Assembly [74], using DNA fragments created with the primers specified in Table 6.
The ddsA genes were amplified from genomic DNA from A. tumefaciens C58 and R. sphaeroides ATH 2.4.1 (DSM 158); pRG_Duet2 was restricted with BamHI for insertion of ddsA and with NheI for insertion of ubiA as described [20]. The pK19mobsacB plasmids were constructed in two steps by amplification of the flanking regions of actA and ispB from genomic DNA of C. glutamicum ATCC 13,032 and restriction of pK19mobsacB with BamHI. In the second step, the plasmids pK19mobsacBactA and pK19mobsacBispB were restricted in the newly generated restriction sites BamHI and BcuI, respectively, between the flanking regions. The genes ubiJ and ubiK were amplified from genomic DNA from E. coli K-12 MG1655; Ptuf-ddsAPd was amplified from pSH1-ddsAPd, which was constructed before by restriction of pSH1 [76] with BamHI and amplification of ddsA from genomic DNA of P. denitrificans. Correct sequences were confirmed by sequencing of inserts. Gene replacements were performed by using the suicide vector pK19mobsacB and two-step homologous recombination as described [77]. Transfer of the vectors by trans-conjugation using S17-1 as donor strain and selection of the mutants was conducted as described [19]. Successful replacements were verified by PCR and sequencing with the primers specified in Table 6.

4.3. Quinone Extraction and Analysis

Pellets of C. glutamicum cells (10–25 mg) were suspended in cold PBS buffer in Eppendorf tubes. Cells were centrifuged at 13,000 rpm for 2 min at 4 °C, the supernatant was eliminated, and the wet weight of the pellet was determined. Glass beads (100 μL), 50 μL of 0.15 M KCl, and a volume of 2 mM MK7 solution (used as an internal standard, Sigma-Aldrich) proportional to the wet weight (2 μL/mg) were added to cell pellet. Quinone extraction was performed by adding 0.6 mL of methanol, vortexing for 10 min, then adding 0.4 mL of petroleum ether (boiling range 40–60 °C) and vortexing for 3 min. The phases were separated by centrifugation at 1 min, 5000 rpm. The upper petroleum ether layer was transferred to a fresh tube. Petroleum ether (0.4 mL) was added to the glass beads and methanol-containing tube, and the extraction was repeated. The petroleum ether layers were combined and dried under nitrogen. The dried samples were stored at −20 °C and were resuspended in 100 μL ethanol. Aliquots corresponding to 2 mg of cells’ wet weight were analyzed by reversed-phase HPLC with a C18 column (Betabasic-18, 5 mm, 4.6 × 150 mm; Thermo Scientific) at a flow rate of 1 mL/min with a mobile phase composed of 25% isopropyl alcohol, 20% ethanol, 45% methanol, and 10% of a mix of 90% isopropyl alcohol/10% ammonium acetate (1 M)/0.1% formic acid. Hydroquinones present in samples were oxidized with a precolumn 5020 guard cell set in oxidizing mode (E, +650 mV). Quinones were monitored by in-line UV detection (247 and 275 nm), by electrochemical detection (ECD) with an ESA Coulochem III electrochemical detector equipped with a 5011A analytical cell (E1, −650 mV; E2, +650 mV), and by mass spectrometry (MS) with an MSQ Plus spectrometer. The flow was divided after the diode array detector with an adjustable split valve (Analytical Scientific Instruments) to allow simultaneous EC (60% of the flow) and MS (40% of the flow) detections. The MSQ Plus was used in positive mode (probe temperature 400 °C, cone voltage 80 V). MS spectra were recorded between m/z 550 and 1000 with a scan time of 0.3 s, and single ion monitoring (NH4+ adducts, scan time 0.2 s) detected the following compounds: 8P-Ph, m/z 656.1–657.1, 3–6 min; MK7, m/z 666.0–667.0, 5–9 min; 8P-HB, m/z 700.0–701.0, 2.5–6 min; 9P-Ph, m/z 724.1–725.1, 5–9 min; MK8, m/z 734.0–735.0, 7–12 min; MK8(H2), m/z 736.0–737.0, 8–13 min; CoQ8, m/z 744.0–745.0, 3–8 min; 9P-HB, m/z 768.1–769.1, 2.5–6 min; 10P-Ph, m/z 792.2–793.2, 7–11 min; MK9, m/z 802.1–803.1, 10–14 min; MK9(H2), m/z 804.1–805.1, 11–16 min; CoQ9, m/z 812.1–813.1, 5–10 min; 10P-HB, m/z 836.2–837.2, 3–8 min; 11P-Ph, m/z 860.3–861.3, 9–13 min; MK10, m/z 870.2–871.2, 13–20 min; MK10(H2), m/z 872.2–873.2, 14–21 min; CoQ10, m/z 880.2–881.2, 7–12 min; 11P-HB, m/z 904.3–905.3, 5–9 min; MK11, m/z 938.3–939.3, 17–23 min; MK11(H2), m/z 940.3–941.3, 20–27 min; CoQ11, m/z 948.3–949.3, 11–15 min. Calculation of CoQ10 content was based on 1 g cell wet weight being equivalent to 0.25 g cell dry weight (CDW) [78].

Supplementary Materials

The following supporting information can be downloaded at: https://www.mdpi.com/article/10.3390/metabo12050428/s1, Figure S1: Mass spectra and SIM chromatograms for MK8(H2) and MK9(H2) in strains WT, UBI401, UBI405, UBI412, and UBI413; Figure S2: Mass spectra and SIM chromatograms for MK10(H2) and MK11(H2) in strains WT, UBI401, UBI405, UBI412, and UBI413; Figure S3: Mass spectra and SIM chromatograms for 8-11P-HB in strains WT, UBI401, UBI405, UBI412, and UBI413; Figure S4: Mass spectra and SIM chromatograms for 9-11P-Ph in strains WT, UBI401, UBI405, UBI412, and UBI413; Figure S5: Mass spectra and SIM chromatograms for MK8–11 in strains WT, UBI401, UBI405, UBI412, and UBI413; Figure S6: Mass spectra and SIM chromatograms for CoQ8–11 in strains WT, UBI401, UBI405, UBI412, and UBI413; Figure S7: Growth of C. glutamicum WT and the strains UBI4 and UBI5 in CGXII minimal medium with 40 g L−1 glucose in the BioLector microcultivation system; Figure S8: Overlay of SIM chromatograms from extracts of strains UBI4-Pd and UBI5-Pd for CoQ8, CoQ11, MK10(H2), and MK10(H2). Figure S9: Overlay of SIM chromatograms from extracts of strains UBI4-Pd and UBI4JK-Pd for CoQ8, CoQ9, MK9(H2), and MK10(H2). Figure S10: Overlay of SIM chromatograms from extracts of strains UBI6-Pd, UBI6-At, and UBI6-Rs for 10P-Ph.

Author Contributions

A.B., V.F.W. and F.P. designed the experiments. V.F.W. and F.P. acquired funding. V.F.W. and F.P. coordinated the study. A.B. constructed the strains. A.B., L.P., M.H.C. and F.P. performed the experiments. A.B. and F.P. analyzed the data. A.B. drafted the manuscript. A.B., V.F.W. and F.P. finalized the manuscript. All authors have read and agreed to the published version of the manuscript.

Funding

A.B. and V.F.W. acknowledge funding by the state of North Rhine Westphalia (NRW) and the “European Regional Development Fund (EFRE)”, Project “Cluster Industrial Biotechnology (CLIB) Kompetenzzentrum Biotechnologie (CKB)” 34.EFRE0300095/1703FI04. L.P., M.H.C., and F.P. acknowledge financial support by ANR (project O2-taboo, ANR-19-CE44-0014), the Université Grenoble Alpes (UGA), and the Centre National de la Recherche Scientifique (CNRS). Support for the article processing charge by the Deutsche Forschungsgemeinschaft and the Open Access Publication Fund of Bielefeld University is acknowledged. The funding bodies had no role in the design of the study or the collection, analysis, or interpretation of data or in writing the manuscript.

Institutional Review Board Statement

Not applicable.

Informed Consent Statement

Not applicable.

Data Availability Statement

The data presented in this study are available in article and supplementary material.

Acknowledgments

A.B. and V.F.W. thank Jin-Ho Lee, Kyungsung University, Busan, South Korea, for cooperation during the initiation phase of the CoQ10 project.

Conflicts of Interest

The authors declare no conflict of interest. The funders had no role in the design of the study, in the collection, analyses, or interpretation of data, in the writing of the manuscript, or in the decision to publish the results.

References

  1. James, A.M.; Smith, R.A.J.; Murphy, M.P. Antioxidant and Prooxidant Properties of Mitochondrial Coenzyme Q. Arch. Biochem. Biophys. 2004, 423, 47–56. [Google Scholar] [CrossRef] [PubMed]
  2. Echtay, K.S.; Winkler, E.; Klingenberg, M. Coenzyme Q Is an Obligatory Cofactor for Uncoupling Protein Function. Nature 2000, 408, 609–613. [Google Scholar] [CrossRef] [PubMed]
  3. Baschiera, E.; Sorrentino, U.; Calderan, C.; Desbats, M.A.; Salviati, L. The Multiple Roles of Coenzyme Q in Cellular Homeostasis and Their Relevance for the Pathogenesis of Coenzyme Q Deficiency. Free. Radic. Biol. Med. 2021, 166, 277–286. [Google Scholar] [CrossRef] [PubMed]
  4. Hernández-Camacho, J.D.; García-Corzo, L.; Fernández-Ayala, D.J.M.; Navas, P.; López-Lluch, G. Coenzyme Q at the Hinge of Health and Metabolic Diseases. Antioxidants 2021, 10, 1785. [Google Scholar] [CrossRef]
  5. Salviati, L.; Trevisson, E.; Doimo, M.; Navas, P. Primary Coenzyme Q10 Deficiency. In GeneReviews®; Adam, M.P., Ardinger, H.H., Pagon, R.A., Wallace, S.E., Bean, L.J., Gripp, K.W., Mirzaa, G.M., Amemiya, A., Eds.; University of Washington: Seattle, WA, USA, 2017. [Google Scholar]
  6. Hargreaves, I.; Heaton, R.A.; Mantle, D. Disorders of Human Coenzyme Q10 Metabolism: An Overview. Int. J. Mol. Sci. 2020, 21, 6695. [Google Scholar] [CrossRef] [PubMed]
  7. Yubero-Serrano, E.M.; Gonzalez-Guardia, L.; Rangel-Zuñiga, O.; Delgado-Lista, J.; Gutierrez-Mariscal, F.M.; Perez-Martinez, P.; Delgado-Casado, N.; Cruz-Teno, C.; Tinahones, F.J.; Villalba, J.M.; et al. Mediterranean Diet Supplemented With Coenzyme Q10 Modifies the Expression of Proinflammatory and Endoplasmic Reticulum Stress–Related Genes in Elderly Men and Women. J. Gerontol. Ser. A 2012, 67A, 3–10. [Google Scholar] [CrossRef] [PubMed] [Green Version]
  8. Di Lorenzo, A.; Iannuzzo, G.; Parlato, A.; Cuomo, G.; Testa, C.; Coppola, M.; D’Ambrosio, G.; Oliviero, D.A.; Sarullo, S.; Vitale, G.; et al. Clinical Evidence for Q10 Coenzyme Supplementation in Heart Failure: From Energetics to Functional Improvement. J. Clin. Med. 2020, 9, 1266. [Google Scholar] [CrossRef]
  9. Arenas-Jal, M.; Suñé-Negre, J.M.; García-Montoya, E. Coenzyme Q10 Supplementation: Efficacy, Safety, and Formulation Challenges. Compr. Rev. Food Sci. Food Saf. 2020, 19, 574–594. [Google Scholar] [CrossRef] [Green Version]
  10. Žmitek, K.; Pogačnik, T.; Mervic, L.; Žmitek, J.; Pravst, I. The Effect of Dietary Intake of Coenzyme Q10 on Skin Parameters and Condition: Results of a Randomised, Placebo-Controlled, Double-Blind Study: The Effect of Dietary Intake of Coenzyme Q10 on Skin Parameters and Condition. BioFactors 2017, 43, 132–140. [Google Scholar] [CrossRef] [Green Version]
  11. Luo, M.; Yang, X.; Hu, J.; Ruan, X.; Mu, F.; Fu, Y. The Synthesis of Coenzyme Q10. Curr. Org. Chem. 2017, 21, 489–502. [Google Scholar] [CrossRef]
  12. Zhu, Y.; Ye, L.; Chen, Z.; Hu, W.; Shi, Y.; Chen, J.; Wang, C.; Li, Y.; Li, W.; Yu, H. Synergic Regulation of Redox Potential and Oxygen Uptake to Enhance Production of Coenzyme Q10 in Rhodobacter sphaeroides. Enzym. Microb. Technol. 2017, 101, 36–43. [Google Scholar] [CrossRef] [PubMed]
  13. Kim, T.-S.; Yoo, J.-H.; Kim, S.-Y.; Pan, C.-H.; Kalia, V.C.; Kang, Y.C.; Lee, J.-K. Screening and Characterization of an Agrobacterium tumefaciens Mutant Strain Producing High Level of Coenzyme Q10. Process Biochem. 2015, 50, 33–39. [Google Scholar] [CrossRef]
  14. Zou, R.-S.; Li, S.; Zhang, L.-L.; Zhang, C.; Han, Y.-J.; Gao, G.; Sun, X.; Gong, X. Mutagenesis of Rhodobacter sphaeroides Using Atmospheric and Room Temperature Plasma Treatment for Efficient Production of Coenzyme Q10. J. Biosci. Bioeng. 2019, 127, 698–702. [Google Scholar] [CrossRef] [PubMed]
  15. Abby, S.S.; Kazemzadeh, K.; Vragniau, C.; Pelosi, L.; Pierrel, F. Advances in Bacterial Pathways for the Biosynthesis of Ubiquinone. Biochim. Biophys. Acta Bioenerg. 2020, 1861, 148259. [Google Scholar] [CrossRef]
  16. Lu, W.; Ye, L.; Lv, X.; Xie, W.; Gu, J.; Chen, Z.; Zhu, Y.; Li, A.; Yu, H. Identification and Elimination of Metabolic Bottlenecks in the Quinone Modification Pathway for Enhanced Coenzyme Q10 Production in Rhodobacter sphaeroides. Metab. Eng. 2015, 29, 208–216. [Google Scholar] [CrossRef]
  17. Zhu, Y.; Lu, W.; Ye, L.; Chen, Z.; Hu, W.; Wang, C.; Chen, J.; Yu, H. Enhanced Synthesis of Coenzyme Q10 by Reducing the Competitive Production of Carotenoids in Rhodobacter sphaeroides. Biochem. Eng. J. 2017, 125, 50–55. [Google Scholar] [CrossRef]
  18. Martínez, I.; Méndez, C.; Berríos, J.; Altamirano, C.; Díaz-Barrera, A. Batch Production of Coenzyme Q10 by Recombinant Escherichia coli Containing the Decaprenyl Diphosphate Synthase Gene from Sphingomonas baekryungensis. J. Ind. Microbiol. Biotechnol. 2015, 42, 1283–1289. [Google Scholar] [CrossRef]
  19. Eggeling, L.; Bott, M. Handbook of Corynebacterium glutamicum; CRC Press: Boca Raton, FL, USA, 2005; ISBN 978-1-4200-3969-6. [Google Scholar]
  20. Burgardt, A.; Moustafa, A.; Persicke, M.; Sproß, J.; Patschkowski, T.; Risse, J.M.; Peters-Wendisch, P.; Lee, J.-H.; Wendisch, V.F. Coenzyme Q10 Biosynthesis Established in the Non-Ubiquinone Containing Corynebacterium glutamicum by Metabolic Engineering. Front. Bioeng. Biotechnol. 2021, 9, 650961. [Google Scholar] [CrossRef]
  21. Wendisch, V.F. Metabolic Engineering Advances and Prospects for Amino Acid Production. Metab. Eng. 2020, 58, 17–34. [Google Scholar] [CrossRef]
  22. Prell, C.; Burgardt, A.; Meyer, F.; Wendisch, V.F. Fermentative Production of L-2-Hydroxyglutarate by Engineered Corynebacterium glutamicum via Pathway Extension of L-Lysine Biosynthesis. Front. Bioeng. Biotechnol. 2021, 8, 630476. [Google Scholar] [CrossRef]
  23. Kurpejović, E.; Wendisch, V.F.; Sariyar Akbulut, B. Tyrosinase-Based Production of L-DOPA by Corynebacterium glutamicum. Appl. Microbiol. Biotechnol. 2021, 105, 9103–9111. [Google Scholar] [CrossRef] [PubMed]
  24. Kerbs, A.; Mindt, M.; Schwardmann, L.; Wendisch, V.F. Sustainable Production of N-Methylphenylalanine by Reductive Methylamination of Phenylpyruvate Using Engineered Corynebacterium glutamicum. Microorganisms 2021, 9, 824. [Google Scholar] [CrossRef] [PubMed]
  25. Walter, T.; Al Medani, N.; Burgardt, A.; Cankar, K.; Ferrer, L.; Kerbs, A.; Lee, J.-H.; Mindt, M.; Risse, J.M.; Wendisch, V.F. Fermentative N-Methylanthranilate Production by Engineered Corynebacterium glutamicum. Microorganisms 2020, 8, 866. [Google Scholar] [CrossRef]
  26. Kogure, T.; Suda, M.; Hiraga, K.; Inui, M. Protocatechuate Overproduction by Corynebacterium glutamicum via Simultaneous Engineering of Native and Heterologous Biosynthetic Pathways. Metab. Eng. 2021, 65, 232–242. [Google Scholar] [CrossRef] [PubMed]
  27. Kitade, Y.; Hashimoto, R.; Suda, M.; Hiraga, K.; Inui, M. Production of 4-Hydroxybenzoic Acid by an Aerobic Growth-Arrested Bioprocess Using Metabolically Engineered Corynebacterium glutamicum. Appl. Environ. Microbiol. 2018, 84, e02587-17. [Google Scholar] [CrossRef] [Green Version]
  28. Purwanto, H.S.; Kang, M.; Ferrer, L.; Han, S.; Lee, J.-Y.; Kim, H.; Lee, J. Rational Engineering of the Shikimate and Related Pathways in Corynebacterium glutamicum for 4-Hydroxybenzoate Production. J. Biotechnol. 2018, 282, 92–100. [Google Scholar] [CrossRef]
  29. Henke, N.A.; Wichmann, J.; Baier, T.; Frohwitter, J.; Lauersen, K.J.; Risse, J.M.; Peters-Wendisch, P.; Kruse, O.; Wendisch, V.F. Patchoulol Production with Metabolically Engineered Corynebacterium glutamicum. Genes 2018, 9, 219. [Google Scholar] [CrossRef] [Green Version]
  30. Henke, N.A.; Wendisch, V.F. Improved Astaxanthin Production with Corynebacterium glutamicum by Application of a Membrane Fusion Protein. Mar. Drugs 2019, 17, 621. [Google Scholar] [CrossRef] [Green Version]
  31. Li, C.; Swofford, C.A.; Rückert, C.; Chatzivasileiou, A.O.; Ou, R.W.; Opdensteinen, P.; Luttermann, T.; Zhou, K.; Stephanopoulos, G.; Jones Prather, K.L.; et al. Heterologous Production of α-Carotene in Corynebacterium glutamicum Using a Multi-Copy Chromosomal Integration Method. Bioresour. Technol. 2021, 341, 125782. [Google Scholar] [CrossRef]
  32. Heider, S.A.E.; Peters-Wendisch, P.; Beekwilder, J.; Wendisch, V.F. IdsA Is the Major Geranylgeranyl Pyrophosphate Synthase Involved in Carotenogenesis in Corynebacterium glutamicum. FEBS J. 2014, 281, 4906–4920. [Google Scholar] [CrossRef]
  33. Loiseau, L.; Fyfe, C.; Aussel, L.; Hajj Chehade, M.; Hernández, S.B.; Faivre, B.; Hamdane, D.; Mellot-Draznieks, C.; Rascalou, B.; Pelosi, L.; et al. The UbiK Protein Is an Accessory Factor Necessary for Bacterial Ubiquinone (UQ) Biosynthesis and Forms a Complex with the UQ Biogenesis Factor UbiJ. J. Biol. Chem. 2017, 292, 11937–11950. [Google Scholar] [CrossRef] [PubMed] [Green Version]
  34. Alexander, K.; Young, I.G. Alternative Hydroxylases for the Aerobic and Anaerobic Biosynthesis of Ubiquinone in Escherichia coli. Biochemistry 1978, 17, 4750–4755. [Google Scholar] [CrossRef] [PubMed]
  35. Jeya, M.; Moon, H.-J.; Lee, J.-L.; Kim, I.-W.; Lee, J.-K. Current State of Coenzyme Q10 Production and Its Applications. Appl. Microbiol. Biotechnol. 2010, 85, 1653–1663. [Google Scholar] [CrossRef] [PubMed]
  36. He, S.; Lu, H.; Zhang, G.; Ren, Z. Production of Coenzyme Q10 by Purple Non-Sulfur Bacteria: Current Development and Future Prospect. J. Clean. Prod. 2021, 307, 127326. [Google Scholar] [CrossRef]
  37. Hajj Chehade, M.; Pelosi, L.; Fyfe, C.D.; Loiseau, L.; Rascalou, B.; Brugière, S.; Kazemzadeh, K.; Vo, C.D.T.; Ciccone, L.; Aussel, L.; et al. A Soluble Metabolon Synthesizes the Isoprenoid Lipid Ubiquinone. Cell Chem. Biol. 2019, 26, 482–492.e7. [Google Scholar] [CrossRef]
  38. Veit, A.; Rittmann, D.; Georgi, T.; Youn, J.-W.; Eikmanns, B.J.; Wendisch, V.F. Pathway Identification Combining Metabolic Flux and Functional Genomics Analyses: Acetate and Propionate Activation by Corynebacterium glutamicum. J. Biotechnol. 2009, 140, 75–83. [Google Scholar] [CrossRef]
  39. Aussel, L.; Loiseau, L.; Chehade, M.H.; Pocachard, B.; Fontecave, M.; Pierrel, F.; Barras, F. UbiJ, a New Gene Required for Aerobic Growth and Proliferation in Macrophage, Is Involved in Coenzyme Q Biosynthesis in Escherichia coli and Salmonella enterica Serovar Typhimurium. J. Bacteriol. 2014, 196, 70–79. [Google Scholar] [CrossRef] [Green Version]
  40. Burgardt, A.; Prell, C.; Wendisch, V.F. Utilization of a Wheat Sidestream for 5-Aminovalerate Production in Corynebacterium glutamicum. Front. Bioeng. Biotechnol. 2021, 9, 732271. [Google Scholar] [CrossRef]
  41. Ioannidou, S.M.; Pateraki, C.; Ladakis, D.; Papapostolou, H.; Tsakona, M.; Vlysidis, A.; Kookos, I.K.; Koutinas, A. Sustainable Production of Bio-Based Chemicals and Polymers via Integrated Biomass Refining and Bioprocessing in a Circular Bioeconomy Context. Bioresour. Technol. 2020, 307, 123093. [Google Scholar] [CrossRef]
  42. Li, G.-W.; Burkhardt, D.; Gross, C.; Weissman, J.S. Quantifying Absolute Protein Synthesis Rates Reveals Principles Underlying Allocation of Cellular Resources. Cell 2014, 157, 624–635. [Google Scholar] [CrossRef] [Green Version]
  43. Tyedmers, J.; Mogk, A.; Bukau, B. Cellular Strategies for Controlling Protein Aggregation. Nat. Rev. Mol. Cell Biol. 2010, 11, 777–788. [Google Scholar] [CrossRef]
  44. Yim, S.S.; An, S.J.; Kang, M.; Lee, J.; Jeong, K.J. Isolation of Fully Synthetic Promoters for High-Level Gene Expression in Corynebacterium glutamicum. Biotechnol. Bioeng. 2013, 110, 2959–2969. [Google Scholar] [CrossRef] [PubMed]
  45. Kugler, P.; Fröhlich, D.; Wendisch, V.F. Development of a Biosensor for Crotonobetaine-CoA Ligase Screening Based on the Elucidation of Escherichia coli Carnitine Metabolism. ACS Synth. Biol. 2020, 9, 2460–2471. [Google Scholar] [CrossRef] [PubMed]
  46. Pérez-García, F.; Jorge, J.M.P.; Dreyszas, A.; Risse, J.M.; Wendisch, V.F. Efficient Production of the Dicarboxylic Acid Glutarate by Corynebacterium glutamicum via a Novel Synthetic Pathway. Front. Microbiol. 2018, 9, 2589. [Google Scholar] [CrossRef] [PubMed]
  47. Lim, H.N.; Lee, Y.; Hussein, R. Fundamental Relationship between Operon Organization and Gene Expression. Proc. Natl. Acad. Sci. USA 2011, 108, 10626–10631. [Google Scholar] [CrossRef] [PubMed] [Green Version]
  48. Upadhyay, A.; Fontes, F.L.; Gonzalez-Juarrero, M.; McNeil, M.R.; Crans, D.C.; Jackson, M.; Crick, D.C. Partial Saturation of Menaquinone in Mycobacterium tuberculosis: Function and Essentiality of a Novel Reductase, MenJ. ACS Cent. Sci. 2015, 1, 292–302. [Google Scholar] [CrossRef]
  49. Xu, W.; Yang, S.; Zhao, J.; Su, T.; Zhao, L.; Liu, J. Improving Coenzyme Q8 Production in Escherichia coli Employing Multiple Strategies. J. Ind. Microbiol. Biotechnol. 2014, 41, 1297–1303. [Google Scholar] [CrossRef]
  50. Xu, W.; Yao, J.; Liu, L.; Ma, X.; Li, W.; Sun, X.; Wang, Y. Improving Squalene Production by Enhancing the NADPH/NADP+ Ratio, Modifying the Isoprenoid-Feeding Module and Blocking the Menaquinone Pathway in Escherichia coli. Biotechnol. Biofuels 2019, 12, 68. [Google Scholar] [CrossRef]
  51. Iqbal, I.K.; Bajeli, S.; Akela, A.K.; Kumar, A. Bioenergetics of Mycobacterium: An Emerging Landscape for Drug Discovery. Pathogens 2018, 7, 24. [Google Scholar] [CrossRef] [Green Version]
  52. Kurosu, M.; Narayanasamy, P.; Biswas, K.; Dhiman, R.; Crick, D.C. Discovery of 1,4-Didydroxy-2-Naphthoate Prenyltransferase Inhibitors. J. Med. Chem. 2007, 50, 3973–3975. [Google Scholar] [CrossRef] [Green Version]
  53. Liu, H.; Shi, F.; Tan, S.; Yu, X.; Lai, W.; Li, Y. Engineering a Bifunctional ComQXPA-PsrfA Quorum-Sensing Circuit for Dynamic Control of Gene Expression in Corynebacterium glutamicum. ACS Synth. Biol. 2021, 10, 1761–1774. [Google Scholar] [CrossRef] [PubMed]
  54. Pierrel, F.; Burgardt, A.; Lee, J.-H.; Pelosi, L.; Wendisch, V.F. Recent Advances in the Metabolic Pathways and Microbial Production of Coenzyme Q. World J. Microbiol. Biotechnol. 2022, 38, 58. [Google Scholar] [CrossRef] [PubMed]
  55. Liu, H.; Sun, Y.; Ramos, K.R.M.; Nisola, G.M.; Valdehuesa, K.N.G.; Lee, W.; Park, S.J.; Chung, W.-J. Combination of Entner-Doudoroff Pathway with MEP Increases Isoprene Production in Engineered Escherichia coli. PLoS ONE 2013, 8, e83290. [Google Scholar] [CrossRef] [PubMed]
  56. Göttl, V.L.; Schmitt, I.; Braun, K.; Peters-Wendisch, P.; Wendisch, V.F.; Henke, N.A. CRISPRi-Library-Guided Target Identification for Engineering Carotenoid Production by Corynebacterium glutamicum. Microorganisms 2021, 9, 670. [Google Scholar] [CrossRef]
  57. Zhou, J.; Yang, L.; Wang, C.; Choi, E.-S.; Kim, S.-W. Enhanced Performance of the Methylerythritol Phosphate Pathway by Manipulation of Redox Reactions Relevant to IspC, IspG, and IspH. J. Biotechnol. 2017, 248, 1–8. [Google Scholar] [CrossRef]
  58. Wu, T.; Ye, L.; Zhao, D.; Li, S.; Li, Q.; Zhang, B.; Bi, C.; Zhang, X. Membrane Engineering—A Novel Strategy to Enhance the Production and Accumulation of β-Carotene in Escherichia coli. Metab. Eng. 2017, 43, 85–91. [Google Scholar] [CrossRef]
  59. Ha, S.; Kim, S.; Seo, J.; Moon, H.; Lee, K.-M.; Lee, J. Controlling the Sucrose Concentration Increases Coenzyme Q10 Production in Fed-Batch Culture of Agrobacterium tumefaciens. Appl. Microbiol. Biotechnol. 2007, 76, 109–116. [Google Scholar] [CrossRef]
  60. Zhang, L.; Liu, L.; Wang, K.-F.; Xu, L.; Zhou, L.; Wang, W.; Li, C.; Xu, Z.; Shi, T.; Chen, H.; et al. Phosphate Limitation Increases Coenzyme Q10 Production in Industrial Rhodobacter sphaeroides HY01. Synth. Syst. Biotechnol. 2019, 4, 212–219. [Google Scholar] [CrossRef]
  61. Alharbi, N.S.; Kadaikunnan, S.; Khaled, J.M.; Almanaa, T.N.; Innasimuthu, G.M.; Rajoo, B.; Alanzi, K.F.; Rajaram, S.K. Optimization of Glutamic Acid Production by Corynebacterium glutamicum Using Response Surface Methodology. J. King Saud Univ.-Sci. 2020, 32, 1403–1408. [Google Scholar] [CrossRef]
  62. Kiefer, D.; Merkel, M.; Lilge, L.; Hausmann, R.; Henkel, M. High Cell Density Cultivation of Corynebacterium glutamicum on Bio-Based Lignocellulosic Acetate Using pH-Coupled Online Feeding Control. Bioresour. Technol. 2021, 340, 125666. [Google Scholar] [CrossRef]
  63. Wendisch, V.F.; Nampoothiri, K.M.; Lee, J.-H. Metabolic Engineering for Valorization of Agri- and Aqua-Culture Sidestreams for Production of Nitrogenous Compounds by Corynebacterium glutamicum. Front. Microbiol. 2022, 13, 19. [Google Scholar] [CrossRef] [PubMed]
  64. Baritugo, K.-A.G.; Kim, H.T.; David, Y.C.; Choi, J.H.; Choi, J.; Kim, T.W.; Park, C.; Hong, S.H.; Na, J.-G.; Jeong, K.J.; et al. Recent Advances in Metabolic Engineering of Corynebacterium glutamicum as a Potential Platform Microorganism for Biorefinery. Biofuels Bioprod. Biorefining 2018, 12, 899–925. [Google Scholar] [CrossRef]
  65. Zhang, B.; Jiang, Y.; Li, Z.; Wang, F.; Wu, X.-Y. Recent Progress on Chemical Production From Non-Food Renewable Feedstocks Using Corynebacterium glutamicum. Front. Bioeng. Biotechnol. 2020, 8, 606047. [Google Scholar] [CrossRef] [PubMed]
  66. Pérez-García, F.; Klein, V.J.; Brito, L.F.; Brautaset, T. From Brown Seaweed to a Sustainable Microbial Feedstock for the Production of Riboflavin. Front. Bioeng. Biotechnol. 2022, 10, 863690. [Google Scholar] [CrossRef] [PubMed]
  67. Hanahan, D. Studies on Transformation of Escherichia coli with Plasmids. J. Mol. Biol. 1983, 166, 557–580. [Google Scholar] [CrossRef]
  68. Simon, R.; Priefer, U.; Pühler, A. A Broad Host Range Mobilization System for In Vivo Genetic Engineering: Transposon Mutagenesis in Gram Negative Bacteria. Bio/Technology 1983, 1, 784–791. [Google Scholar] [CrossRef]
  69. Gauttam, R.; Desiderato, C.; Jung, L.; Shah, A.; Eikmanns, B.J. A Step Forward: Compatible and Dual-Inducible Expression Vectors for Gene Co-Expression in Corynebacterium glutamicum. Plasmid 2019, 101, 20–27. [Google Scholar] [CrossRef]
  70. Kirchner, O.; Tauch, A. Tools for Genetic Engineering in the Amino Acid-Producing Bacterium Corynebacterium glutamicum. J. Biotechnol. 2003, 104, 287–299. [Google Scholar] [CrossRef]
  71. Stansen, C.; Uy, D.; Delaunay, S.; Eggeling, L.; Goergen, J.-L.; Wendisch, V.F. Characterization of a Corynebacterium glutamicum Lactate Utilization Operon Induced during Temperature-Triggered Glutamate Production. Appl. Environ. Microbiol. 2005, 71, 5920–5928. [Google Scholar] [CrossRef] [Green Version]
  72. Green, M.R.; Sambrook, J. Molecular Cloning: A Laboratory Manual, 4th ed.; Cold Spring Harbor Laboratory Press: Cold Spring Harbor, NY, USA, 2012; ISBN 978-1-936113-41-5. [Google Scholar]
  73. Ruan, Y.; Zhu, L.; Li, Q. Improving the Electro-Transformation Efficiency of Corynebacterium glutamicum by Weakening Its Cell Wall and Increasing the Cytoplasmic Membrane Fluidity. Biotechnol. Lett. 2015, 37, 2445–2452. [Google Scholar] [CrossRef]
  74. Gibson, D.G.; Young, L.; Chuang, R.Y.; Venter, J.C.; Hutchison, C.A.; Smith, H.O. Enzymatic Assembly of DNA Molecules up to Several Hundred Kilobases. Nat. Methods 2009, 6, 343–345. [Google Scholar] [CrossRef] [PubMed]
  75. Schäfer, A.; Tauch, A.; Jäger, W.; Kalinowski, J.; Thierbach, G.; Pühler, A. Small Mobilizable Multi-Purpose Cloning Vectors Derived from the Escherichia coli Plasmids PK18 and PK19: Selection of Defined Deletions in the Chromosome of Corynebacterium glutamicum. Gene 1994, 145, 69–73. [Google Scholar] [CrossRef]
  76. Henke, N.A.; Heider, S.A.E.; Peters-Wendisch, P.; Wendisch, V.F. Production of the Marine Carotenoid Astaxanthin by Metabolically Engineered Corynebacterium glutamicum. Mar. Drugs 2016, 14, 124. [Google Scholar] [CrossRef] [PubMed]
  77. Heider, S.A.E.; Peters-Wendisch, P.; Netzer, R.; Stafnes, M.; Brautaset, T.; Wendisch, V.F. Production and Glucosylation of C50 and C40 Carotenoids by Metabolically Engineered Corynebacterium glutamicum. Appl. Microbiol. Biotechnol. 2014, 98, 1223–1235. [Google Scholar] [CrossRef]
  78. Kabus, A.; Niebisch, A.; Bott, M. Role of Cytochrome bd Oxidase from Corynebacterium glutamicum in Growth and Lysine Production. Appl. Environ. Microbiol. 2007, 73, 861–868. [Google Scholar] [CrossRef] [Green Version]
Figure 1. LC–MS analysis of quinone extracts of C. glutamicum strains WT, UBI401, UBI405, UBI412, and UBI413 to identify metabolic bottlenecks in CoQ10 production. (A) Overlay of UV chromatograms with black arrows pointing at CoQ8-11 peaks and blue arrows pointing at 8P-Ph–11P-Ph peaks to indicate the low flux from nP-Ph to CoQn; (BE) SIM overlays of NH4+ adduct of MK10(H2) (m/z = 872.7, B); NH4+ adduct of 10P-HB (m/z = 836.7, C); NH4+ adduct of 10P-Ph (m/z = 792.7, D); NH4+ adduct of CoQ10 (m/z = 880.7, E); (F) Metabolic pathway of CoQn and MKn(H2) biosynthesis. Enzymes are in bold, heterologous enzymes are underlined. As IspB mainly synthesizes NPP and OPP and DdsA mainly synthesizes DPP and UPP, the enzymes and corresponding direct products were marked with matching colors. The question mark indicates that the reaction attributed to Cgl0472 is not experimentally proven. MEP, methylerythritol phosphate; IPP, isopentenyl diphosphate; DMAPP, dimethylallyl diphosphate; FPP, farnesyl diphosphate; OPP, octaprenyl diphosphate; NPP, nonaprenyl diphosphate; DPP, decaprenyl diphosphate; UPP, undecaprenyl diphosphate; 4-HBA, 4-hydroxybenzoic acid; nP-HB, 3-n-prenyl-4-hydroxybenzoic acid; nP-Ph, 2-n-prenylphenol; CoQn, coenzyme Qn/ubiquinone-n; DHNA, 1,4-dihydroxy-2-naphthoic acid; DMKn, demethylmenaquinone-n; MKn, menaquinone-n; MKn(H2), dihydromenaquinone-n; IspA, farnesyl diphosphate synthase; IspB, polyprenyl diphosphate synthase; DdsA, decaprenyl diphosphate synthase; UbiC, chorismate-pyruvate lyase; UbiA, 4-hydroxybenzoate octaprenyltransferase; UbiD-X, 3-octaprenyl-4-hydroxybenzoate decarboxylase and flavin prenyltransferase; UbiI-G-H-E-F, 2-octaprenylphenol hydroxylase, 2-octaprenyl-6-hydroxyphenol/2-octaprenyl-3-methyl-5-hydroxy-6-methoxy-1,4-benzoquinol methyltransferase, 2-octaprenyl-6-methoxyphenol hydroxylase, ubiquinone/menaquinone biosynthesis methyltransferase, 2-octaprenyl-3-methyl-6-methoxy-1,4-benzoquinol hydroxylase; MenF, isochorismate synthase; MenA, 1,4-dihydroxy-2-naphthoate octaprenyltransferase; MenG, demethylmenaquinone methyltransferase; Cgl0472, putative menaquinone oxidoreductase.
Metabolites 12 00428 g001
Figure 2. (A) Overlay of electrochemical detection (ECD) chromatograms from extracts of strains UBI4 and UBI5. The peaks corresponding to MK8-11(H2) are marked. (B) Quantification of MK9(H2) and MK10(H2) (MS peak area) in three independent samples of UBI4 and UBI5 cells. (C) Overlay of ECD chromatograms from extracts of strains UBI4-Pd and UBI5-Pd. (D,E) Overlay of SIM chromatograms for CoQ9 (NH4+ adduct m/z = 812.6, D), CoQ10 (NH4+ adduct m/z = 880.7, E). Chromatograms are representative of three independent samples. (F) Quantification of CoQ9 and CoQ10 (MS peak area) in three independent samples of UBI4-Pd and UBI5-Pd cells.
Metabolites 12 00428 g002
Figure 3. (A) Overlay of ECD chromatograms from extracts of strains UBI4-Pd and UBI4JK-Pd. * indicates the peak corresponding to CoQ10. (B) Overlay of SIM chromatograms for CoQ10 (NH4+ adduct m/z = 880.7). Chromatograms are representative of three independent samples.
Metabolites 12 00428 g003
Figure 4. (A) Overlay of ECD chromatograms from extracts of strains UBI4-Pd and UBI6-Rs. * indicates the peak corresponding to CoQ10. (B) Overlay of SIM chromatograms for CoQ10 (NH4+ adduct m/z = 880.7). Chromatograms are representative of three independent samples.
Metabolites 12 00428 g004
Figure 5. Growth and CoQ10 content of UBI6-Rs from shake flask cultivation. The cultivation was performed independently from the cultivation represented in Table 3. The numbers next to the grey data points indicate the CoQ10/CoQ11 ratios of relative peak areas from mass spectrometry analysis. Values and error bars represent means and standard deviations of 3 independent cultivations.
Metabolites 12 00428 g005
Table 1. Ratios of relative peak areas from mass spectrometry analysis and CoQ10 biomass yields, titers, and volumetric productivities for the strains UBI4-Pd, UBI4-At, and UBI4-Rs.
Strain10P-Ph/
9P-Ph
CoQ10/
CoQ9
CoQ10/
CoQ11
Yx (µg g−1 CDW)Titer
(mg L−1)
Vol. Productivity
(µg L−1 h−1)
UBI4-Pd1.1 ± 0.10.5 ± 0.01.2 ± 0.118.2 ± 5.40.15 ± 0.052.1 ± 0.6
UBI4-At1.2 ± 0.30.6 ± 0.2145.4 ± 12.4 ***21.3 ± 4.60.14 ± 0.042.0 ± 0.6
UBI4-Rs1.6 ± 0.2 **0.9 ± 0.1 **7.6 ± 0.0 ***24.9 ± 5.90.18 ± 0.042.5 ± 0.6
Statistical significance of values compared with values of UBI4-Pd is based on a two-sided unpaired Student’s t-test (**: p ≤ 0.01; ***: p ≤ 0.001).
Table 2. Ratios of relative peak areas from mass spectrometry analysis and CoQ10 biomass yields, titers, and volumetric productivities for the strains UBI4-Pd, UBI4JK-Pd, UBI5-Pd, and UBI6-Pd.
StrainCoQ10/
10P-Ph
CoQ10/
CoQ9
Yx (µg g−1 CDW)Titer
(mg L−1)
Vol. Productivity
(µg L−1 h−1)
UBI4-Pd0.3 ± 0.10.5 ± 0.018.2 ± 5.40.15 ± 0.052.1 ± 0.6
UBI4JK-Pd1.5 ± 0.2 ***0.7 ± 0.1 *78.0 ± 12.0 **0.64 ± 0.08 ***9.0 ± 1.1 ***
UBI5-Pd0.2 ± 0.114.4 ± 5.5 *17.3 ± 4.40.15 ± 0.042.1 ± 0.6
UBI6-Pd1.2 ± 0.2 **38.6 ± 1.9 ***69.6 ± 9.4 **0.58 ± 0.06 ***8.0 ± 0.9 ***
Statistical significance of values compared with values of UBI4-Pd is based on a two-sided unpaired Student’s t-test (*: p ≤ 0.05; **: p ≤ 0.01; ***: p ≤ 0.001).
Table 3. Ratios of relative peak areas from mass spectrometry analysis and CoQ10 biomass yields, titers, and volumetric productivities for the strains UBI6-Pd, UBI6-At, and UBI6-Rs. In addition, UBI6-Rs was cultivated in a BioLector microcultivation system in CGXII medium (same as before) and WSCH medium.
Strain/
medium
CoQ10/
10P-Ph
CoQ10/
CoQ9
CoQ10/
CoQ11
Yx (µg g−1 CDW)Titer
(mg L−1)
Vol. Productivity
(µg L−1 h−1)
UBI6-Pd1.2 ± 0.238.6 ± 1.91.5 ± 0.069.6 ± 9.40.58 ± 0.068.0 ± 0.9
UBI6-At1.2 ± 0.25.1 ± 0.4 **3.5 ± 0.5 **64.3 ± 4.60.61 ± 0.048.4 ± 0.6
UBI6-Rs1.9 ± 0.541.6 ± 3.43.4 ± 0.2 ***126.9 ± 10.7 **1.21 ± 0.12 **16.8 ± 1.7 **
Microcultivation of UBI6-Rs in CGXII medium and WSCH medium
CGXII1.0 ± 0.255.4 ± 7.24.2 ± 0.192.2 ± 17.20.89 ± 0.1512.3 ± 2.1
WSCH1.5 ± 0.231.4 ± 1.18.8 ± 0.637.7 ± 7.40.49 ± 0.086.8 ± 1.2
Statistical significance of values compared with values of UBI6-Pd is based on a two-sided unpaired Student’s t-test (**: p ≤ 0.01; ***: p ≤ 0.001).
Table 4. Bacterial strains used in this study.
StrainsDescriptionSource
Corynebacterium glutamicum
WTC. glutamicum wild-type strain ATCC 13032ATCC
UBI4WT with following modifications: ΔcrtOP (cg0717-cg0723), ΔidsA (cg2384), ΔcrtB2I’I2 (cg2668-cg2672), LP4::Ptuf-ispA (ispA from E. coli), ΔpobA (cg1226), ΔpcaHG::Psod-ubiCFBR (cg2631-cg2630, ubiCL31A from E. coli), Δvdh::PilvC-aroGFBR (cg2953, aroGD146N from E. coli), ΔqsuABCD::Ptuf-qsuC (cg0501-cg0504); named UBI400 in [20][20]
UBI401UBI4 carrying pRG_Duet2, pEC-XT99A, and pEKEx3 This work
UBI405UBI4 carrying pRG_Duet2-ddsAPd-ubiA, pEC-XT99A, and pEKEx3This work
UBI412UBI4 carrying pRG_Duet2-ddsAPd-ubiA, pEC-XT99A-ubiDIBX, and pEKEx3This work
UBI4-PdUBI4 carrying pRG_Duet2-ddsAPd-ubiA, pEC-XT99A-ubiDIBX, and pEKEx3-ubiGHEF; named UBI413 in [20][20]
UBI4-AtUBI4 carrying pRG_Duet2-ddsAAt-ubiA, pEC-XT99A-ubiDIBX, and pEKEx3-ubiGHEFThis work
UBI4-RsUBI4 carrying pRG_Duet2-ddsARs-ubiA, pEC-XT99A-ubiDIBX, and pEKEx3-ubiGHEFThis work
UBI5ΔispB::Ptuf-ddsAPd mutant of UBI4This work
UBI5-PdUBI5 carrying pRG_Duet2-ddsAPd-ubiA, pEC-XT99A-ubiDIBX, and pEKEx3-ubiGHEFThis work
UBI4JKΔactA::ubiJK mutant of UBI4This work
UBI4JK-PdUBI4JK carrying pRG_Duet2-ddsAPd-ubiA, pEC-XT99A-ubiDIBX, and pEKEx3-ubiGHEFThis work
UBI6ΔispB::Ptuf-ddsAPd mutant of UBI4JKThis work
UBI6-PdUBI6 carrying pRG_Duet2-ddsAPd-ubiA, pEC-XT99A-ubiDIBX, and pEKEx3-ubiGHEFThis work
UBI6-AtUBI6 carrying pRG_Duet2-ddsAAt-ubiA, pEC-XT99A-ubiDIBX, and pEKEx3-ubiGHEFThis work
UBI6-RsUBI6 carrying pRG_Duet2-ddsARs-ubiA, pEC-XT99A-ubiDIBX, and pEKEx3-ubiGHEFThis work
Escherichia coli
DH5αF-thi-1 endA1 hsdr17(r-, m-) supE44 1lacU16980lacZ1M15) recA1 gyrA96[67]
S17-1recA pro hsdR RP4-2-Tc::Mu-Km::Tn7[68]
Table 5. Plasmids used in this study.
PlasmidsDescriptionSource
pRG_Duet2KanR, Ptac, lacIq, PtetR/tetA, tetR, pBL1 oriVCg, dual-inducible C. glutamicum/E. coli expression shuttle vector[69]
pRG_Duet2-ddsAPd-ubiAKanR, pRG_Duet2 overexpressing ddsA from P. denitrificans (induced by IPTG) and ubiA from E. coli (induced by ATc)[20]
pRG_Duet2-ddsAAt-ubiAKanR, pRG_Duet2 overexpressing ddsA from A. tumefaciens (induced by IPTG) and ubiA from E. coli (induced by ATc)This work
pRG_Duet2-ddsARs-ubiAKanR, pRG_Duet2 overexpressing ddsA from R. sphaeroides (induced by IPTG) and ubiA from E. coli (induced by ATc)This work
pEC-XT99ATetR, Ptrc, lacIq, pGA1 oriVCg, C. glutamicum/E. coli expression shuttle vector[70]
pEC-XT99A-ubiDIBXTetR, pEC-XT99A overexpressing ubiD, ubiI, ubiB, and ubiX from E. coli[20]
pEKEx3SpecR, Ptac, lacIq, pBL1 oriVCg, C. glutamicum/E. coli expression shuttle vector[71]
pEKEx3-ubiGHEFSpecR, pEKEx3 overexpressing ubiG, ubiH, ubiE, and ubiF from E. coli[20]
pK19mobsacBKanR, pK19 oriVEc, sacB, lacZα, E. coli/C. glutamicum shuttle vector for construction of insertion and deletion mutants in C. glutamicum[75]
pK19mobsacBactA:ubiJKpK19mobsacB with a construct for deletion of actA (cg2840) and insertion of ubiJ and ubiK from E. coli under control of the native actA promoterThis work
pK19mobsacBispB:Ptuf-ddsAPdpK19mobsacB with a construct for deletion of ispB (cg0559) and insertion of ddsA from P. denitrificans under control of C. glutamicum promoter PtufThis work
Table 6. Primers used in this study.
PrimersSequence (5′ to 3′)
ddsA_At-fwCCTGCAGGTCGACTCTAGAGGAAAGGAGGCCCTTCAGATGGGCGTCGTCATACCGCTTG
ddsA_At-rvGAGCTCGGTACCCGGGGATCTTAGTTGAGACGCTCGATGCAG
ddsA_Rs-fwCCTGCAGGTCGACTCTAGAGGAAAGGAGGCCCTTCAGATGGGATTGGACGAGGTTTC
ddsA_Rs-rvGAGCTCGGTACCCGGGGATCTTAGGCGATGCGTTCGAC
actA-US-fwGCATGCCTGCAGGTCGACTCTAGAGTCCCGTGCGTTGCATTTCCTG
actA-US-rvCGGTTTCTAAACCAAGAAAAAACGGATCCCAGGTAATCGGACTTTTTCAAATTTTTCCC
actA-DS-fwATTTGAAAAAGTCCGATTACCTGGGATCCGTTTTTTCTTGGTTTAGAAACCG
actA-DS-rvAATTCGAGCTCGGTACCCGGGGATCAGCCAATCGTCGTAAAGCG
ubiJ-fwAATTTGAAAAAGTCCGATTACCTGGCTCCCCCTTAGTAGAAAAGGAGGTTTTTCTATGCCTTTTAAACCTTTAGTGACG
ubiJ-rvCTCAATTTTTTTCGGGTCAATCATCTGAAGGGCCTCCTTTCTCATTTAGCCTCCAGTTTTTCC
ubiK-fwGGAAAAACTGGAGGCTAAATGAGAAAGGAGGCCCTTCAGATGATTGACCCGAAAAAAATTGAG
ubiK-rvTTTCTAAACCAAGAAAAAACGGATCTTACAGCGTTGGGGGGAGAG
actA-conf-fwTTTCATCCGGCGCGAAGGTG
actA-conf-rvGCTTCTGCGCAAAGCAAGCC
pSH1-ddsA-fwCCTGCAGGTCGACTCTAGAGGAAAGGAGGCCCTTCAGATGGGCATGAACGAAAACGT
pSH1-ddsA-rvGAGCTCGGTACCCGGGGATCTTAGGACAGGCGCGAGACGA
ispB-US-fwCCTGCAGGTCGACTCTAGAGTCATGAGATTTTGCCAAGCGG
ispB-US-rvGGTTAAGTGGTGGATTACGGGGACTAGTTCATCGCTACCTTTGGTGATCG
ispB-DS-fwCGATCACCAAAGGTAGCGATGAACTAGTCCCCGTAATCCACCACTTAACC
ispB-DS-rvGAGCTCGGTACCCGGGGATCTATGAGAAGTCAGCACACGC
Ptuf-ddsA-fwCTCGATCACCAAAGGTAGCGATGAATGGCCGTTACCCTGCGAATG
Ptuf-ddsA-rvTTAAGTGGTGGATTACGGGGACTAGTTAGGACAGGCGCGAGACGAC
ispB-conf-fwATCACATGCTTCGCCTTGAC
ispB-conf-rvTTTCTCGAAGGCAACACCTC
Ribosomal binding sites are in bold, binding regions of Gibson primers are underlined.
Publisher’s Note: MDPI stays neutral with regard to jurisdictional claims in published maps and institutional affiliations.

